environment and energy a global perspective
TRANSCRIPT

Environment and Energy A global perspective
Environment and Energy Statistics Workshop for the Arab Region
Amman, Jordan 8-12 September 2013
Environment and Energy Statistics Branch, United Nations Statistics Division
Contents
1. Environment and statistics – main trends, policy context and statistical challenges
2. Energy and statistics – main trends, policy context and statistical challenges
3. The energy-environment inter-linkages
Environment – main trends at the global level
a) Forest lossb) Biodiversity c) Land degradation and desertificationd) Water availability and usee) Water and Sanitation coveragef) Pollution (ambient air)g) Ozone Depleting Substancesh) CO2 and Climate Changei) Extreme Events and Disasters
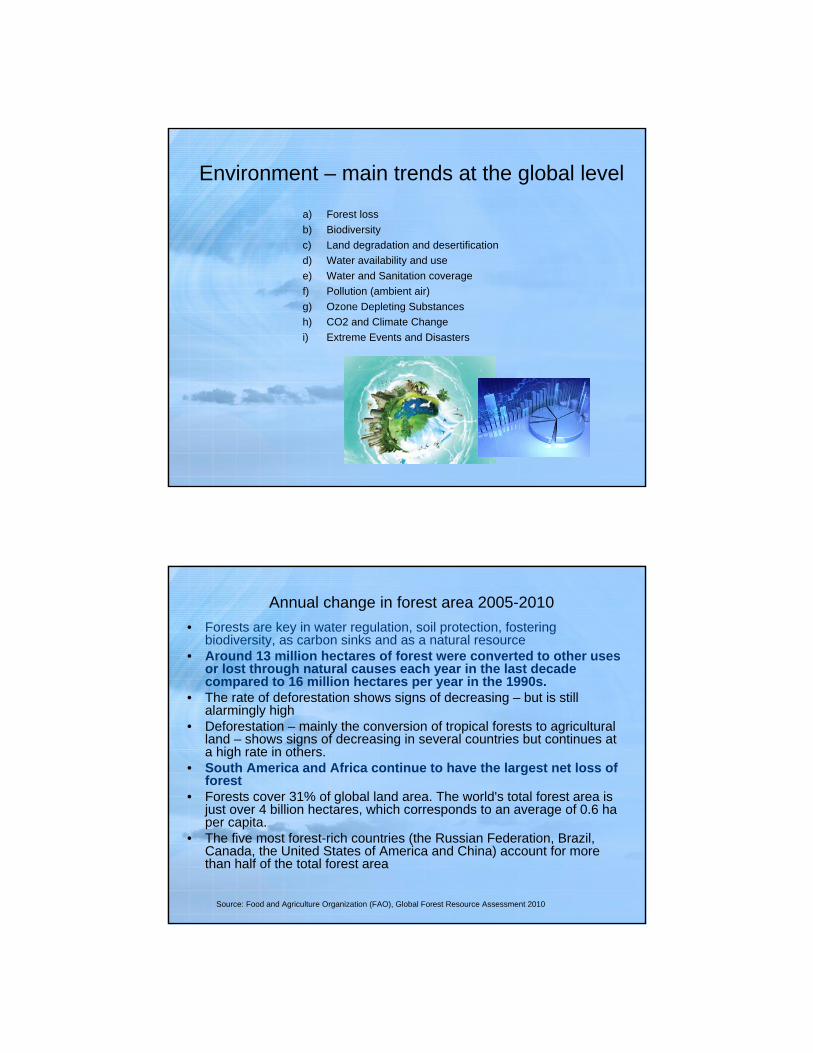
Annual change in forest area 2005-2010
Source: Food and Agriculture Organization (FAO), Global Forest Resource Assessment 2010
• Forests are key in water regulation, soil protection, fostering biodiversity, as carbon sinks and as a natural resource
• Around 13 million hectares of forest were converted to other uses or lost through natural causes each year in the last decade compared to 16 million hectares per year in the 1990s.
• The rate of deforestation shows signs of decreasing – but is still alarmingly high
• Deforestation – mainly the conversion of tropical forests to agricultural land – shows signs of decreasing in several countries but continues ata high rate in others.
• South America and Africa continue to have the largest net loss of forest
• Forests cover 31% of global land area. The world's total forest area is just over 4 billion hectares, which corresponds to an average of 0.6 ha per capita.
• The five most forest-rich countries (the Russian Federation, Brazil, Canada, the United States of America and China) account for morethan half of the total forest area

Annual change in forest area by region, 1990-2010
Source: FRA FAO Global Forest Resources Assessment 2010
Primary forests account for 36% of forest area – but have decreased by more than 40 million hectares since 2000
Source: FRA FAO Global Forest Resources Assessment 2010
Environment statistics are multi-disciplinary, cross-cutting, and involve numerous stakeholders, actors and producers It covers a wide range of information and are interdisciplinary in nature. Their sources are dispersed over a variety of data producers, and similarly numerous methods are applied in their compilation.
Source UN: MDG Report 2012
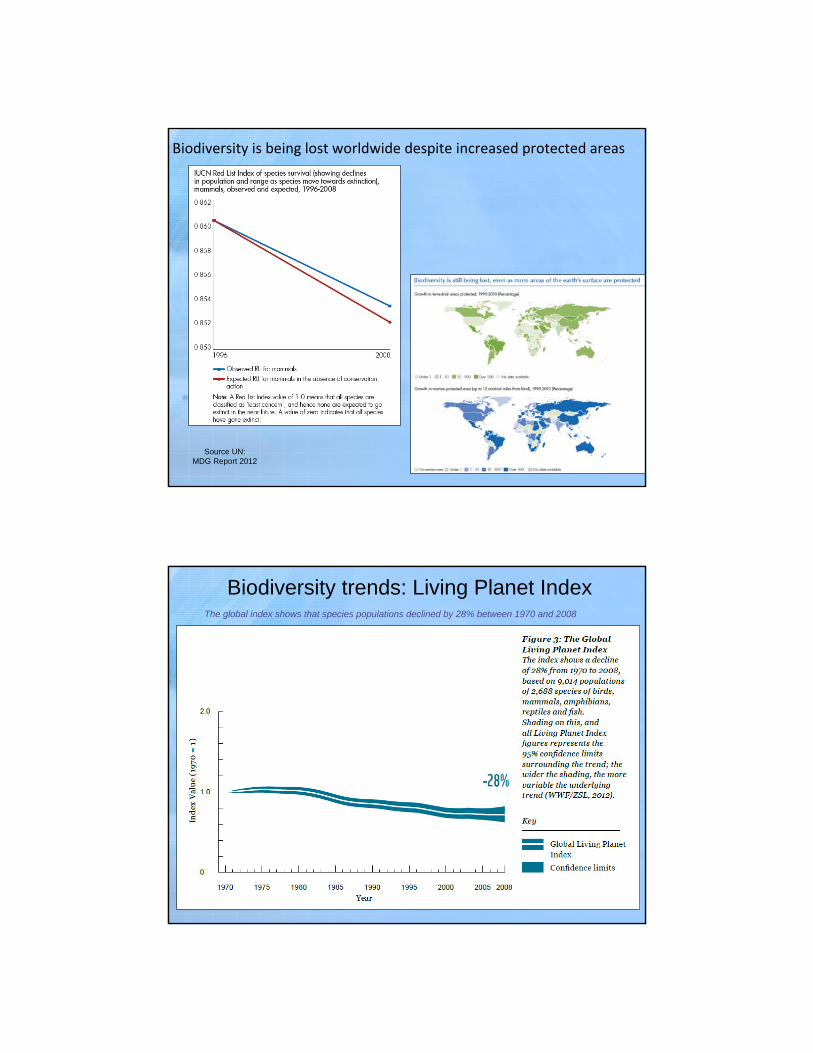
Biodiversity is being lost worldwide despite increased protected areas
Biodiversity trends: Living Planet IndexThe global index shows that species populations declined by 28% between 1970 and 2008
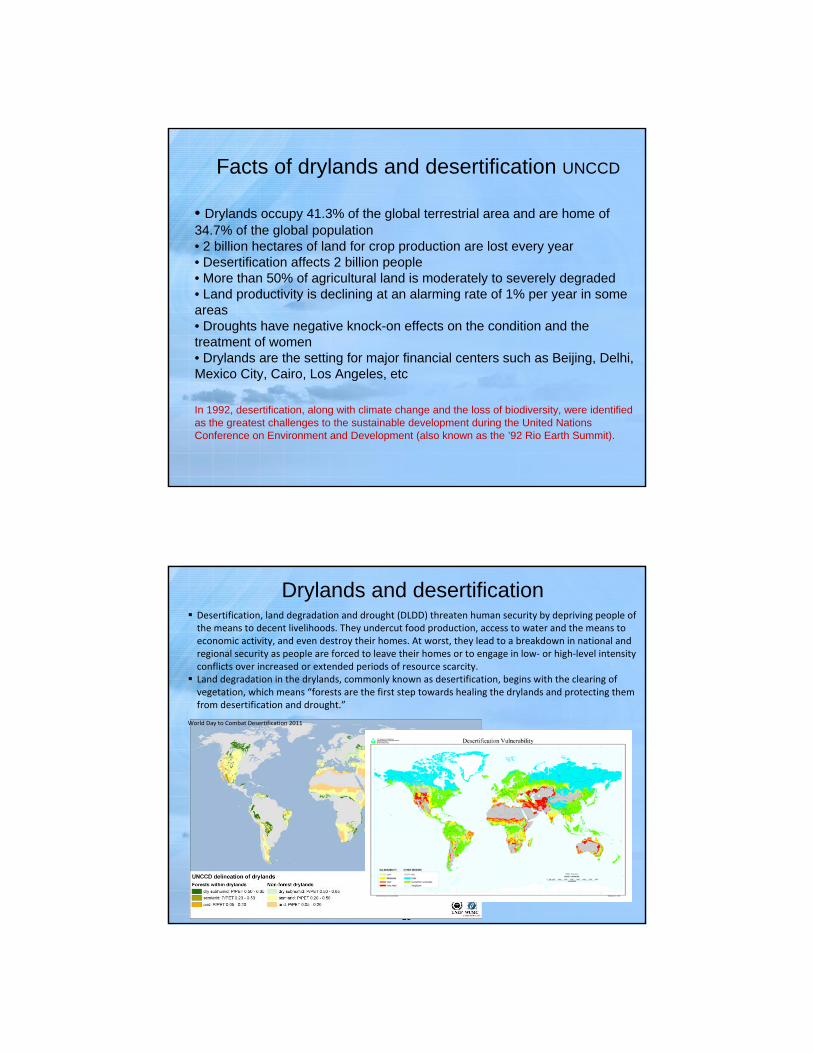
Facts of drylands and desertification UNCCD
• Drylands occupy 41.3% of the global terrestrial area and are home of 34.7% of the global population• 2 billion hectares of land for crop production are lost every year• Desertification affects 2 billion people• More than 50% of agricultural land is moderately to severely degraded• Land productivity is declining at an alarming rate of 1% per year in some areas• Droughts have negative knock-on effects on the condition and the treatment of women• Drylands are the setting for major financial centers such as Beijing, Delhi, Mexico City, Cairo, Los Angeles, etc
In 1992, desertification, along with climate change and the loss of biodiversity, were identified as the greatest challenges to the sustainable development during the United Nations Conference on Environment and Development (also known as the ’92 Rio Earth Summit).
Drylands and desertification
10
Desertification, land degradation and drought (DLDD) threaten human security by depriving people of the means to decent livelihoods. They undercut food production, access to water and the means to economic activity, and even destroy their homes. At worst, they lead to a breakdown in national and regional security as people are forced to leave their homes or to engage in low‐ or high‐level intensity conflicts over increased or extended periods of resource scarcity. Land degradation in the drylands, commonly known as desertification, begins with the clearing ofvegetation, which means “forests are the first step towards healing the drylands and protecting them from desertification and drought.”
World Day to Combat Desertification 2011
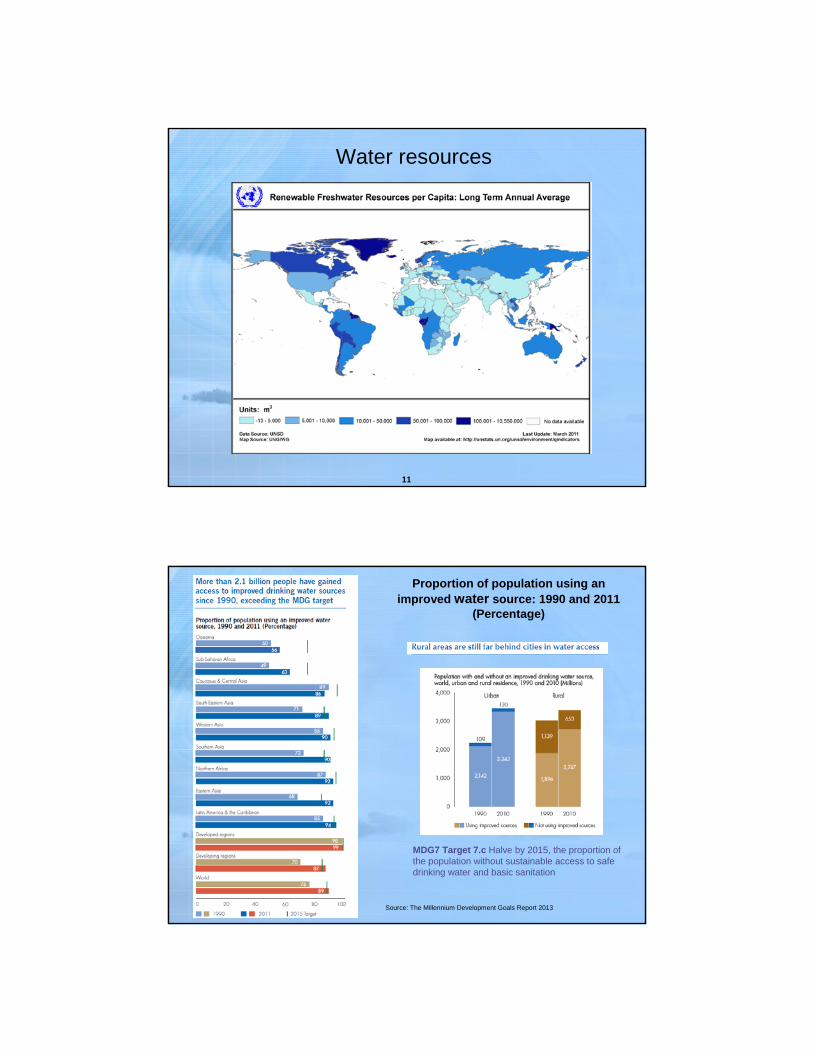
Water resources
11
Proportion of population using an improved water source: 1990 and 2011
(Percentage)
MDG7 Target 7.c Halve by 2015, the proportion of the population without sustainable access to safedrinking water and basic sanitation
Source: The Millennium Development Goals Report 2013

Population with access to drinking water, urban and rural areas, 1990, 2000 and 2011 (Millions)
Source: The Millennium Development Goals Report 2013
SanitationMDG Report 2011 and 2012
MDG7 Target 7.c Halve by 2015, the proportion of the population without sustainable access to safedrinking water and basic sanitation

15
Slurce: UNEPGlobal Environment Outlook: environment for development (GEO-4)
Ambient air pollution
Note: relevant WHO annual mean guideline for PM10 is 20 μg/m3.
Source: UNEP Keeping Track 2012

Climate Change provoked by CO2 and otherGHGs
• carbon dioxide (CO2) drivers: increasing emissions andconcentrations
• Increased global temperature
• Evidence of climate change
17
Global Concentrations of CO2 Levels
Comparison of atmospheric samples contained in ice cores and more recent direct measurements, provides evidence that atmospheric CO2 has increased since the Industrial Revolution. Source: http://climate.nasa.gov/evidence/, based on NOAA
400 ppm
Safe limit = 350 ppm

• Between 2008 and 2009, global emissions of CO2 declined by 0.4%. • Between 2009 and 2010, CO2 emissions increased by 5% and are now 46% above their 1990 level. • Overall global emissions growth over 2 decades:
• Between 1990 to 2000 rising 10% • Between 2000 to 2010 rising 33%
• The rise in emissions has been spurred largely by fast-paced growth in developing regions. Between 2009 and 2010:
• Developing world- CO2 emissions increased by 7%, versus• Developed regions- CO2 emissions increased 3%
• Average per capita emissions in developed regions are significantly higher than in developing regions (about 11 metric tons of CO2 per person per year in developed, compared to about 3 metric tons in developing)
Source: The Millennium Development Goals Report 2013
Emissions of carbon dioxide (CO2)1990, 2009 and 2010* (Billions of metric tons)
Climate change evidencethat show significant, human caused warming of the planet:
• Ocean air temperatures• Sea ice extent• Northern hemisphere snow cover• Ocean heat content• Inland lake temperature• Sea level rise• Glacier volume• Tropospheric air temperature• specific humidity• temperature over land• stratospheric air temperature sea surface temperature.
.: all of these indicators point to the same direction: CC
Source: NASA Global Climate Change Indicators. Vital signs of the planet(http://climate.nasa.gov/key_indicators)

Global Surface Temperature
0.56º C (2012)
• This graph illustrates the change in global surface temperature relative to 1951-1980 average temperatures.
• Global surface temperatures in 2012 were the ninth warmest on record. (Source: NASA/GISS)
• The gray error bars represent the uncertainty on measurements. • This research is broadly consistent with similar constructions prepared by the
Climatic Research Unit and the National Atmospheric and Oceanic Administration.
Evidence and impacts of Climate Change• Global CC already had observable effects on environment: Glaciers have shrunk, ice on
rivers and lakes is breaking up earlier, plant and animal ranges have shifted and trees are flowering sooner.
• Effects of CC scientists predicted in the past are now occurring: loss of sea ice, accelerated sea level rise and longer, more intense heat waves.
• "Taken as a whole, the range of published evidence indicates that the net damage costs of climate change are likely to be significant and to increase over time“ (Intergovernmental Panel on Climate Change)
• Potential future effects of global CC include more frequent wildfires, longer periods of drought in some regions and increase in number, duration and intensity of tropical storms
Some of the regional impacts of global change forecast by the IPCC:• North America: Decreasing snowpack in the western mountains; 5-20 percent increase in yields of rain-fed agriculture in
some regions; increased frequency, intensity and duration of heat waves in cities that currently experience them.• Latin America: Gradual replacement of tropical forest by savannah in eastern Amazonia; risk of significant biodiversity
loss through species extinction in many tropical areas; significant changes in water availability for human consumption, agriculture and energy generation.
• Europe: Increased risk of inland flash floods; more frequent coastal flooding and increased erosion from storms and sea level rise; glacial retreat in mountainous areas; reduced snow cover and winter tourism; extensive species losses; reductions of crop productivity in southern Europe.
• Africa: By 2020, between 75 and 250 million people are projected to be exposed to increased water stress; yields from rain-fed agriculture could be reduced by up to 50 percent in some regions by 2020; agricultural production, including access to food, may be severely compromised.
• Asia: Freshwater availability projected to decrease in Central, South, East and Southeast Asia by the 2050s; coastal areas will be at risk due to increased flooding; death rate from disease associated with floods and droughts expected to rise in some regions.
More: http://climate.nasa.gov/effects 22
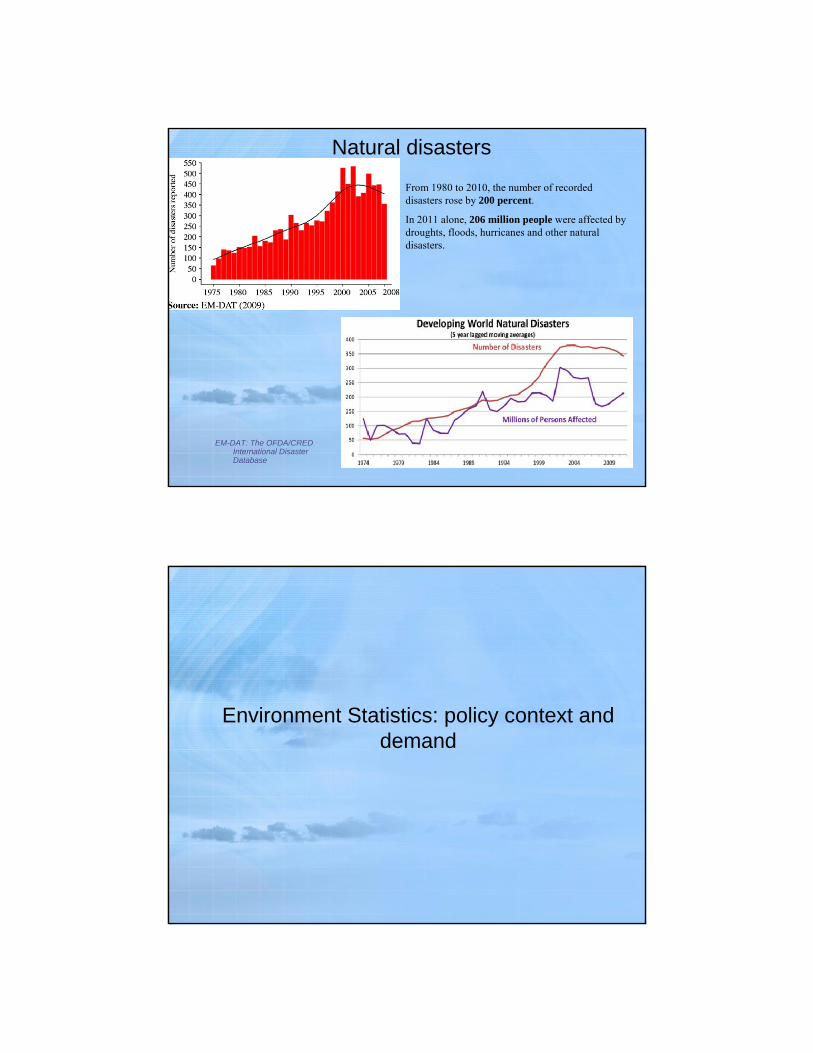
Natural disasters
EM-DAT: The OFDA/CRED International Disaster Database
From 1980 to 2010, the number of recorded disasters rose by 200 percent.
In 2011 alone, 206 million people were affected by droughts, floods, hurricanes and other natural disasters.
Environment Statistics: policy context and demand

Global agenda: environment, development and SD
Summits • 1987 Stockholm United Nations Conference on the Human
Environment. Declaration an Action Plan (109 recommendations)• 1992 Rio, Global Summit Environment and Development Agenda 21• 1987 Brundtland Comission: Our Common Future and SD concept• 1994 Barbados World Conference of SD in SIDS• 2000 Millennium Summit Declaration and MDGs monitoring framework to 2015• 2002 Rio+10 World Summit on Sustainable Development, Johannesburg Declaration
and Plan of Implementation, further MEAs• 2012 Rio+20 Global Summit on SD: The Future We Want
[Post 2015 : Sustainable Development Goals within post 2015 dev. Agenda]
Multilateral Environmental Agreements (examples):• Convention Biological Diversity (CBD)• United Nations Convention to Combat Desertification (UNCCD)• Montreal Protocol : ODS phase out• Kyoto protocol ‐ linked to the United Nations Framework Convention on
Climate Change (UNFCCC) which sets binding CO2 emission reduction targets
25
Please see Handout 5: Multilateral Environmental Agreements (MEAs)
UNEP Keeping Track 2012
26

Importance of environment statistics for policy making
• Demand for environment statistics is increasing with the continued environmental challenges faced by modern society.
• Recognition that human wellbeing depends on the environment has led to an increasing emphasis on environmental and sustainability concerns on which decisions and actions need to be taken.
• Environment statistics portray key information about the state of the environment and its most relevant changes through space and time.
• ES strengthen assessments through quantitative techniques, making analyses more robust, timely and progressively harmonized.
• Environment statistics are necessary for producing environmentalassessments, state of the environment reports, environmental compendia, environmental indicators, indicators of sustainable development, as well as to facilitate environmental-economic accounting.
• Regular production of environment statistics of the highest possible quality to support evidence-based policymaking by enabling the identification of environmental policy issues and allowing their objective quantification is paramount everywhere.
27
Production of environment statistics: State of the art • Environment statistics are multi-disciplinary, cross-cutting, and involve numerous
stakeholders, actors and producers It covers a wide range of information and are interdisciplinary in nature. Their sources are dispersed over a variety of data producers, and similarly numerous methods are applied in their compilation.
• Development of environment statistics has advanced greatly over the past decades, although this development has been very heterogeneous. Particularly in developing countries, environment statistics is generally the weakest statistical domain within sustainable development, compromising the capacity of many countries and regions to assess progress in the environmental pillar
• Of the three pillars of sustainable development, monitoring and measurement of progress towards environmental sustainability is the weakest.
• Capacity to inform about environmental sustainability is severely curtailed by the insufficient production of environment statistics.
• Does not mean that there is a lack of environmental data and information. These appear to be increasing in volume.
• There is inadequate/insufficient production of regular, official environment statistics that form part of integrated, coherent national programmes. Data originating in multiple sources must also be processed within national statistical systems into meaningful statistics and indicators that support national and international demand.
• Any measure of sustainable development requires a strong foundation in environment statistics, which is at the core of its monitoring progress.

Insufficiency of production: contributing factors • General insufficiency of reliable environment statistics production worldwide is
associated with important contributing determinants: i. Insufficient engagement and resources; ii. Lack of visibility and technical capacities; iii. Institutional weakness and insufficient coordination.
• Therefore, statistical and institutional capacities for engaging in the systematic production of environment statistics need to be strengthened, particularly in developing countries. Many countries still require substantial technical assistance and institutional capacity building to effectively develop their environmental statistics programmes/units. Environment statistics production can benefit from the FDES 2013 to guide their development, coordination and organization at all levels.
• Demand for robust environment statistics will keep growing. The need is more acute given the worsening of environmental issues such as climate change, biodiversity loss, ecosystem health, natural disaster frequency and intensity, population growth, and food and water shortages
• The post-2015 development agenda is proposed to be strengthened with new Sustainable Development Goals which can be expected to include indicators which will increasingly rely on certain environment statistics. As demand for indicators increases with the post-2015 development agenda, the need for sustained investment in the production of environment statistics becomes even more critical at all levels.
SDGs and the demand for environment statistics
• One of the principal outcomes of Rio+20 was the call to develop a set of universally applicable sustainable development goals (SDGs) that carefully balance the environmental, social and economic dimensions of sustainable development.
• Based on the understanding that environment and socio-economic development are so intricately linked that development cannot be sustainable without considering its environmental dimensions. It is now accepted that poverty eradication and a lasting prosperity cannot be achieved if ecosystem services and natural capital are degraded or lost. Countries underlined this at Rio+20 by noting that socio-economic development and environmental sustainability come together in the inclusive “Green Economy”, naming it “one of the important tools available for achieving sustainable development”.
Recent studies list a set of criteria to be used for the selection of SDGs:1) Show strong linkage with development goals2) Promote decoupling of socio-economic development from escalating resource use and
environmental degradation3) Cover critical issues of environmental sustainability such as important irreversible changes
in the global environment4) Take into account current and global environmental goals and targets5) Are scientifically credible and verifiable6) Progress towards the goals must be trackable - all goals should be backed by specific and
measurable targets and indicators.7) the last criteria will put high quality environment statistics and their integration with socio-
economic statistics in increasingly high demand.
Need for comparable, accurate and timely statistics
• Nature of ES poses specific challenges for its production• Capacity building and institutional development equally
necessary• Use of internationally recommended methodological
guidance and tools is necessary: FDES 2013 and the Basic and Core Set of Environment Statistics
• Importance of existing and internationally agreed definitions and classifications. Forthcomming work in metadata production and classifications in a continued manner.
31
importance of energy importance of energy statistics for policy makingexample global policy initiativesstatistical needs
2. Energy and statistics, global trends
32

Energy
Energy is present in many aspects of human development due its wide array of services it provides
Light for households,hospitals, etc.
Motive power for transport
Mechanical power for industries
Power for Water pumping, cooking, etc.
Total Primary Energy Production by fuel (Petajoule)
34
Solids
Liquids
GasElectricity
0
50100
150200
250
300350
400450
500
1990
1991
1992
1993
1994
1995
1996
1997
1998
1999
2000
2001
2002
2003
2004
2005
2006
2007
2008
2009
2010
2010 UNSD Energy Statistics database

Fuel share of total primary energy production
Gas23%
Solids30%
Liquids42%
Electricity5%
Electricity5%
Liquids36%
Solids32%Gas
27%
35
1990 2010
2010 UNSD Energy Statistics database
Total Primary Energy Production by region (Petajoule)
36
0
50
100
150
200
250
300
350
400
450
500
1990 1991 1992 1993 1994 1995 1996 1997 1998 1999 2000 2001 2002 2003 2004 2005 2006 2007 2008 2009 2010
Africa Asia America, North America, South Europe Oceania
2010 UNSD Energy Statistics database

Regional shares of total primary energy production
Asia46%
America, South
5%
America, North19%Europe
19%
Oceania3%
Africa8%
Asia29%
America, South
4%
America, North25%
Europe33%
Oceania2%
Africa7%
1990 2010
2010 UNSD Energy Statistics database
Primary energy production,by region and by type of fuel, 2010 (million Toe)
0
500
1000
1500
2000
2500
Asia America, North Europe Africa America, South Oceania
Solids Liquids Gas Electricity
2010 UNSD Energy Statistics database

Importance of energy statistics for policy making
• Energy security -> accurate and timely data on stocks, trade, supply
• CO2 emission -> detail data on combustible fuel
• Share of renewables -> data on the production of energy from renewable sources (hydro, wind, solar, biomass, etc.)
• Depletion of energy resources -> data on the deposit and extraction levels
• Energy intensity -> data on energy use per unit of GDP/output
• Energy efficiency -> energy use by purpose
• Electrification -> No. of households without electricity
• Access to modern cooking solutions -> No. of households relying primarily on non-solid fuels for cooking
39
Examples of initiatives at global level
• Sustainable energy for ALL - Initiative launched by the UN Secretary-General to promote sustainable energy for all by 2030. Three objectives were agreed upon:1) Ensure universal access to modern energy services 2) Doubling the share of renewable energy in the global energy mix 3) Doubling the global rate of improvement in energy efficiency
• Kyoto protocol - international agreement linked to the United Nations Framework Convention on Climate Change (UNFCCC) which sets binding emission reduction targets
• Sustainable development goals – during Rio+20 Conference countries agreed to launch a process to develop a set of Sustainable Development Goals (SDGs), which will build upon the Millennium Development Goals and converge with the post 2015 development agenda
40
• UN Development account project on “Measuring green growth” – to develop methodology, select indicators, and assist countries in producing data.Overall target to identify achievable indicator sets with initial focus on energy:
energy usestructure of energy supply/useenergy efficiency
• European Union – Target: to reach a 20% share of energy from renewable sources by 2020 and a 10% share of renewable energy specifically in the transport sector
…..Need for comparable, accurate and timely statistics!
Main challenges in energy statistics:• Use of harmonized definitions/standard classifications• Transparency in the measurement units (conversion
factors, etc.)• Importance of a legal framework and cooperation/
coordination among relevant agencies within countries• Effective data collection methods
42

• UNSD in cooperation with the Oslo Group on Energy Statistics and InterEnerStat has worked toward the development of internationally agreed recommendations for energy statistics covering• Definitions• Classifications• Data collection and compilation methods• Energy balances
International Recommendation for Energy Statistics
• UNSD is working on a practical guidance document for energy statistics
• Technical cooperation • Cooperation and coordination with other international
organizations
……better data, better decision making
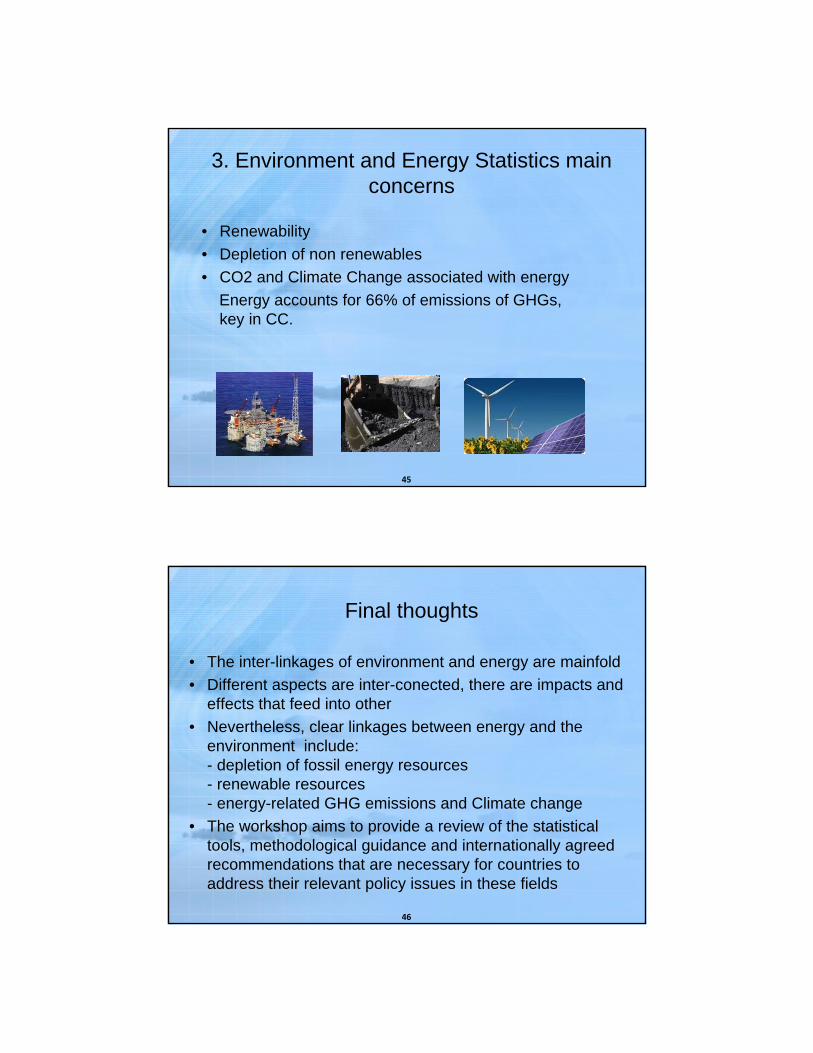
3. Environment and Energy Statistics main concerns
• Renewability• Depletion of non renewables• CO2 and Climate Change associated with energy
Energy accounts for 66% of emissions of GHGs,key in CC.
45
Final thoughts
• The inter-linkages of environment and energy are mainfold• Different aspects are inter-conected, there are impacts and
effects that feed into other• Nevertheless, clear linkages between energy and the
environment include: - depletion of fossil energy resources- renewable resources - energy-related GHG emissions and Climate change
• The workshop aims to provide a review of the statistical tools, methodological guidance and internationally agreed recommendations that are necessary for countries to address their relevant policy issues in these fields
46
All the documents and presentations are available at
http://unstats.un.org/unsd/energy/meetings/Jordan2013.htm
Thank you!