environment public authority february - 2019
TRANSCRIPT

2nd National Communication
State of Kuwait
To the UNFCCC
Toward Sustainable Strategy
Environment Public Authority
February - 2019

Foreword
i
On behalf of Kuwait’s government, it is my pleasure to submit Kuwait’s Second National
Communication to the Secretariat of the United Nations Framework Convention on Climate Change
(UNFCCC). This communication was prepared according to the guidelines approved by the parties
and the methodologies of the Intergovernmental Panel on Climate Change (IPCC).
Kuwait already experiences high temperatures of up to 48 degrees Celsius in the summer, with a
reading of 54 degrees Celsius in July 2016 north of Kuwait City. Notably, this was the highest
temperature for the Eastern hemisphere and Asia in recorded history. With climate projections
showing even higher future temperatures and a decrease in already low annual rainfall, the negative
impacts of climate change on the country have come into sharp focus, especially regarding food
security, water resources, public health, marine ecosystems, and coastal zones.
Kuwait’s Second National Communication presents the results of a series of studies that reveal how
changes in local temperature and rainfall patterns, as well as rising seas, are expected to adversely
affect vital sectors of the country. Also included is an inventory of greenhouse gases from key
sectors together, with an analysis of the emission reduction potential of a set of voluntary mitigation
efforts through 2035.
In its keenness to address climate change, Kuwait Environment Public Authority established the
Environmental Protection Law in 2014 and completed its bylaws in 2018. This represents an
important pivot point for Kuwait as there is now legislative and regulatory authority for monitoring
and documenting greenhouse emissions. Both the public and private sectors are being engaged to
ensure that future greenhouse emission inventories are complete, consistent, and accurate.
Sheikh Abdullah Ahmad Al Hamoud Al-Sabah
Chairman of the Board & Director General of Kuwait,
Environment Public Authority
Kuwait City
Kuwait

iii
Guidance and Oversight
▪ Shaikh Abdullah Ahmad Al-Hamoud Al-Sabah, Director General (Kuwait Environment Public
Authority (KEPA))
▪ Dr. Mohammad Al-Ahmad, Deputy Director General, Project Manager, KEPA
▪ Ayman Bojbarah, Deputy Project Manager, KEPA
▪ Dr. Abdul-Majeid Haddad, Techncial advisor (United Nations Environment Programme
(UNEP)
▪ Eng.Shareef Alkhayat, General Coordinator, KEPA
▪ Basel Al-Shallal, Legal Manager, (KEPA)
▪ Abeer Aman, Financial Manager, (KEPA)
National Circumstances and other information:
▪ Dr. Layla Al-Musawi, Team Leader and contributor (Kuwait Foundation for the Advancement of
Science (KFAS))
▪ Dr. Abbas Al-Mejren, National Cicumstances (Kuwait University (KU))
▪ Eng.Shareef Alkhayat, Capacity-building and institutional framework (KEPA)
▪ Dr. Yahya Al-Hadban, Technology needs assessment (Kuwait Institute for Scientific Research
(KISR))
▪ Eng. Hanan Malallah, Capacity-building and institutional framework (KEPA)
▪ Eng.Sara Al-Kandari, National Cicumstances (KEPA)
▪ Fatemah Dh. Yousef, National Cicumstances (Central Statistical Bureau (CSB))
▪ Saja Hussain, Technology needs assessment (KEPA)
▪ Dalal Al-Ajmi, Research and Finance (KEPA)
GHG Inventory and Mitigation:
▪ Dr. Osamah Alsayegh, Team Leader (KISR)
▪ Mohammad Yagan, Technical advisor (Energy and Environment Consultant – Jourdan)
▪ Eng.Hanan Malallah, Report Coordination (KEPA)
Electricity:
▪ Eng.Sanaa Alghareeb (Ministry of Electricity and Water (MEW))
▪ Eng.Nasser Alshareef (MEW)
▪ Dr.Husain Husain (KEPA)
▪ Amani Aladwani (Graduate Student, Arabian Gulf University)
Oil & gas:
▪ Asmaa Alqallaf, Kuwait Petroleum Corporation (KPC)
▪ Eng.Muhammad Shehab, (Graduate Student, KU)
▪ Eng.Sarah Alkandari, (KEPA)
▪ Eng.Mishari Abuqrais, Kuwait Petroleum Corporation (KPC)
Transport:
▪ Dalal Alajmi (KEPA)
▪ Dr.Ahmad Alsultan (Directorate General of Civil Aviation (DGCA))

iv
▪ Fadhel Sadeq (Ministry of Communications (MOC))
▪ Mohammad Alkandari (Ministry of Interior (MOI))
Waste:
▪ Eng. Hanan Malallah, (KEPA)
▪ Eng. Suha Karam, (KEPA)
▪ Eng. Abdullah Almutairi, Kuwait Municipality (KM)
Industrial processes & other product use:
▪ Eng. Yaqoub Almatouq, (KEPA)
▪ Yousef Aleedan, (KEPA)
▪ Eng. Fatimah Alqudaihi, Public Authority for Industry (PAI)
Agriculture:
▪ Mohammad Jamal (Public Authority for Agriculture and Fish Resources (PAAF))
▪ Saja Hussain (KEPA)
Monitoring, reporting and verification:
▪ Eng. Shareef Alkhayat (KEPA)
▪ Eng. Samirah Alkandari (KEPA)
▪ Eng. Fatima Hasan (KEPA)
Vulnerability and Adaptation:
▪ Dr. Meshari Al-Harbi, Team Leader (Kuwait University (KU))
▪ Dr. Sabah Al Jenaid, Techncial advisor (Arabian Gulf University (AGU))
▪ Dalal F. Al-Ajmi, Assistant Project Coordinator and chapter coordination (KEPA)
Water Resources:
▪ Dr. Meshari Al-Harbi (Kuwait University (KU))
▪ Hamed Abbas (SCPD)
▪ Najlaa AlHoulan (MEW)
▪ Futha AlAbdulrazzaq (SCPD)
Health:
▪ Dr. Ahmad Alshatti (Kuwait Medical Association (KMA)
▪ Dr. Lujain AlQodmani (KMA)
▪ Dr. Mohammad AlSeaidan (KMA)
Sea level rise:
▪ Dr. Mohammad M. AlSahli (KU)
▪ Ali Redha (KEPA)
▪ Noura Altheyabi (KU)

v
Climate modeling:
▪ Essa Ramadan Mohammad (Freelance meteorology consultant)
▪ Dr. Hassan Aldashti (Department of Meteorology, Civil Aviation (DMCA)
▪ Dr. Ali Aldosari (KISR)
▪ Maraheb AlNassar (KEPA)
Marine Ecosystem and fisheries:
▪ Dr. Shaker Alhazeem (KISR)
▪ Jenan Bahzad (PAAET)
▪ Dr. Mahdi Gholoum (PAAET)
Administrative Support
▪ Osama Hasan, Secretary (KEPA)
▪ Faisal Al-Noumas, Photographer (KEPA)

vi
Acknowledgments This document was the result of a fruitful partnership and cooperation between the Kuwait
Environment Public authority (KEPA) and the Regional Office for West Asia of the United Nations
Environment Programme (UNEP), which oversaw the preparation of the Second National
Communication project and provided training and technical support to national experts. In addition,
the Global Environment Facility (GEF) provided financial support during all stages of the preparation
of the document. In the end, I would like to thank all those who participated in the preparation of this
work - all ministries, governmental agencies, non-governmental organizations, and the private sector
for their support and assistance to the various Working Groups during the preparation of this
document. It is hoped that this document can become a useful reference for policymaker, researchers,
and all those interested in climate change and its negative impacts on the State of Kuwait.

vii
List of Acronyms °C degrees Centigrade
BCM billion cubic meters
CH4 methane
CIS Coastal Information System
CIVA TF Climate Impacts, Vulnerability and Adaptation Task Force
CNG Compressed natural gas
CO carbon monoxide
CO2 carbon dioxide
eMISK environmental monitoring information system of Kuwait
GCC Gulf Cooperation Council
GCM General Circulation Model
GDEM Global Digital Elevation Model
GDP gross domestic product
Gg Gigagrams (i.e., one billion grams)
GHG Greenhouse gas
GIS Geographic information systems
GW gigawatt (billion watts)
GWh gigawatt-hour (billion watt-hours)
GWI Global Water Intelligence
HFC hydrofluorocarbons
INC Initial National Communication
IPCC Intergovernmental Panel on Climate Change
KEPA Kuwait Environment Public Authority
KEPS Kuwait Environment Protection Society
KFAS Kuwait Foundation for the Advancement of Sciences
Kg kilogram
KISR Kuwait Institute for Scientific Research
Km kilometers
Km2 square kilometers

viii
KMA Kuwait Medical Association
KPC Kuwait Petroleum Corporation
KU Kuwait University
kWh thousand watt-hours
l/cap/day liters per capita per day
LPG liquid petroleum gas
m meters
MEW Ministry of Electricity and Water
MHTL Mean high tide level
Mm3 million cubic meters
MRV Measurement, Reporting and Verification
MSW Municipal solid waste
N2O nitrous oxide
NC National Communications
NCD Non-communicable disease
NDC Nationally Determined Contribution
NGCC natural gas combined cycle (power station)
NGO Non-governmental organization
NHA National Housing Authority
NMVOC non-methane volatile organic compounds
NOx nitrogen oxides
NTF National circumstances & other information Task Force
O3 ground-level ozone
PAAET Public Authority for Applied Education and Training
PAAF Public Authority for Agriculture and Fisheries
PACI Public Authority for Civil Information
PFC perfluorocarbons
PM10 particulate matter less than 10 microns in diameter
PSC Project Steering Committee
PV photovoltaic (solar)
QSAS Qatar Sustainability Assessment System

ix
SEI-US Stockholm Environment Institute – US Center
SLR Sea level rise
SNC Second National Communication
SO2 sulfur dioxide
TWW Treated wastewater
UAE United Arab Emirates
UNEP United Nations Environment Programme
UNFCCC United Nations Framework Convention on Climate Change
USGS United States Geologic Survey
WEAP Water Evaluation and Planning model

x
Executive Summary The State of Kuwait is located at the northeastern corner of the Arabian Peninsula and has borders
It covers a total land area of nearly 18 thousand square km and is roughly 170 km across from East
to West and 200 km across from North to South. Kuwait shares a 495 km border with Saudi Arabia
to the south and 195 km with Iraq to the north and west.
National Circumstances
Kuwait has a hyper-arid desert climate that is highly variable with recurrent extremes.
Maximum daily temperatures can reach 45°C during the summer during which there is no rainfall.
Much of Kuwait is characterized by loose, mobile surface sediments that have very low levels of
nutrients and organic matter. While rich in terrestrial and marine biodiversity, these systems are
fragile and highly vulnerable to climate change. Kuwait is also one of the world’s most water-
stressed countries, with the lowest per capita renewable internal freshwater availability of any
country, requiring extensive seawater desalination to meet water demand. The population is
overwhelmingly urban and has grown rapidly since the discovery of oil in the late 1930s, with over
98% of the population currently lives in urban areas which are mostly located along the coast. A
modern country with an extensive, modern and well-maintained network of road infrastructure,
Kuwait also has a modern healthcare system and a healthy populace; recent trends show a
decrease in the incidence of communicable diseases and an increase in life expectancy. Kuwait
is one of the world’s leading oil producers, possessing the world’s fifth largest crude oil reserves
and has one of the the wealthiest economies in the Arabian Gulf region. Throughout its modern
history, Kuwait has heavily relied on food imports since only a negligible fraction of food demand can
be met by local agriculture.
Greenhouse gas inventory
Kuwait compiled an update to its inventory of greenhouse gas emissions for the year 2000 (see
Table ES-1). Total and net GHG emissions in 2000 were 48,712 Gg CO2-equivalent, which includes
46,533 Gg from energy; 873 Gg from industrial processes and product use; 102 Gg from agriculture,
forestry, and other land use, and 1,205 Gg from waste. Emissions from perfluorocarbons (PFCs),
hydrofluorocarbons (HFCs) and sulfur hexafluoride (SF6) in Kuwait are negligible as the products
containing these gases are not produced in the country.
GHG Sources & Sinks CO2-equiv CO2 CH4 N2O
1 Energy 46,533 46,192 7.5 0.6
2 Industrial processes and product use 873 873 0.0 0.0
3 Agriculture, forestry and other land use 102 -9.2 5.0 0.0
4 Waste 1,205 0 54.1 0.2
Total National Emissions 48,712 47,065 66.6 0.8
Net National Emissions 48,712 47,056 66.6 0.8
xi
Vulnerability and adaptation
All land areas of Kuwait will become warmer in the future, with the greatest change projected to occur
during the winter months. Across the entire country, annual average temperatures show the
greatest rise under RCP8.5, between 4.3° to 4.5°C by the 2071-2100 period, compared to the
historical average. Kuwait will also become drier in the future, with average annual rainfall in the
western part of the country showing the greatest decrease under RCP8.5, roughly between 15%
and 18% lower than the historical average. The Arabian Gulf water will also experience change.
Historical monthly sea surface temperatures in the Arabian Gulf have steadily increased at a rate of 0.6
(±0.3)°C per decade, a trend three times greater than the concurrent global average.
Many sectors are vulnerable to these climatic changes, with potentially grave environmental and
social effects, compounded by the country’s adaptation challenges. A summary of key findings of
the vulnerability assessments summarized in the bullets below.
▪ Coastal zones: Rising sea levels pose threats of wetland flooding, aquifer and agricultural soil
contamination, destructive erosion and lost habitat for fish, birds, and plants. Sea level rise also
poses a threat to the built environment in the form of Arabian Gulf waters reaching further
inland, particularly under high tide conditions and especially when combined with storm surge
associated with extreme storm events. Boubyan Island would be highly impacted under by sea
level rise, with roughly half the island inundated in the highest sea level rise scenario. Only the
relatively higher land in the interior of the island would be visible by the end of this century.
Coastal areas along Kuwait Bay are also projected to be adversely impacts by rising seas,
especially the western coast near Doha Port and densely populated neighborhoods around
Kuwait City.
▪ Water resources: Population growth, urbanization, industrial growth, agricultural
development are key drivers underlying Kuwait’s high per capita water consumption. Coupled
with a hyper-arid environment, low annual rainfall, no permanent lakes or rivers, and limited fresh
groundwater resources, sustainable water resource management is a key national priority. A
number of potential adaptation policies were analyzed (i.e., water tariffs, improved water
efficiency, leak reduction, and improved irrigation efficiency) with each showing significant water
savings and associated carbon dioxide emissions.
▪ Marine ecosystems: Kuwait’s marine waters and coastal areas includes highly productive habitats,
including intertidal mudflats, seagrass, algal beds, mangroves, and coral reefs. These habitats
support important commercial fisheries, marine biodiversity as well as endangered species
such as the green turtle. Recent trends show a loss of coral reef coverage as Gulf water
temperatures have increased, together with massive fish kills.
▪ Public health: With climate change, increased heat stress from higher temperatures and
increased cardiovascular and respiratory diseases associated with more frequent dust storms,
represent looming health threats to the population. These additional risks could exacerbate
current major health problems such as ischemic heart disease, stroke, road injury and lower
respiratory infections, whilst potentially undermining Kuwait’s social protection systems.
Greenhouse gas mitigation
Kuwait is committed to efforts that harmonize economic growth with a low-carbon, climate- resilient
development. Domestically, it has already undertaken several strategic projects to reduce its carbon
footprint by promoting clean energy initiatives, introducing new low-carbon technologies, and
developing long-term partnerships to exploit sustainable energy opportunities. Progress
toward such actions is already underway, and when fully implemented by 2035 will result in total
annual emission reductions of about 5,600 Gg, with cumulative emission reductions of nearly
60,000 Gg of CO2e.

xii
Constraints, Gaps and Needs
Inadequate capacity (technical, financial and institutional) remains one of Kuwait’s significant
challenges as it confronts climate change. Enhancing capacity will depend on overcoming serious
institutional, financial and technical constraints and gaps that currently interfere with affective action.
With adequate support, Kuwait can build climate change resilience and explore the viability of
low-emission development trajectories.

xiii
1. NATIONAL CIRCUMSTANCES ............................................................................................................................. 1
1.1. GEOGRAPHY....................................................................................................................................................................................... 1
1.2. CLIMATE .................................................................................................................................................................................. 2
1.3. LAND AND VEGETATION ......................................................................................................................................................... 4
1.4. DESERTIFICATION ........................................................................................................................................................................................... 5
1.5. BIODIVERSITY ..................................................................................................................................................................................... 6
1.6. WATER RESOURCES ...................................................................................................................................................................................... 9
1.7. DEMOGRAPHY .................................................................................................................................................................................. 11
1.8. URBAN DEVELOPMENT ................................................................................................................................................................... 12
1.9. PUBLIC HEALTH ............................................................................................................................................................................... 13
1.10. GOVERNMENT STRUCTURE ............................................................................................................................................................ 13
1.11. ECONOMY ............................................................................................................................................................................. 14
1.12. OIL & GAS ................................................................................................................................................................... 16
1.13. INDUSTRY ............................................................................................................................................................................. 17
1.14. AGRICULTURE, LIVESTOCK, FISHERIES, AND GREEN AREAS ............................................................................................................... 18
1.15. FOOD SECURITY .............................................................................................................................................................................. 21
1.16. ENERGY ............................................................................................................................................................................................ 21
1.17. WASTE .................................................................................................................................................................................. 23
1.18. TRANSPORT ...................................................................................................................................................................................... 24
1.19. Response Measure……………………………………………………………………………………...27
1.20. IMPLEMENTATION ARRANGEMENTS .............................................................................................................................................. 29
1.21. LIST OF REFERENCES ................................................................................................................................................................................ 30
List of Tables Table 1–1: Livestock population characteristics, 2013-2014 (Source: Kuwait Central Statistical
Bureau, Annual Agricultural Statistics) .................................................................................... 19 Table 1–2: Breakdown of agricultural subsidies, 2015-2016 (Source: Public Authority for
Agricultural Affairs and Fish Resources) .................................................................................. 19 Table 1–3: Municipal solid waste generation, 2016 (Source: KM) ................................................................. 23 Table 1–4: Domestic wastewater treatment plant characteristics (Source: KPW) .......................................... 24 Table 1–5: Incinerators of Kuwaiti Ministry of Health (Source: MOH) ........................................................... 24

xiv
List of Figures Figure 1-1: Satellite image of the State of Kuwait (Source: e-Misk, KEPA) 1 Figure 1-2: Top: Daily minimum and maximum temperatures in each month, averaged over 1962-
2016; Middle: Total rainfall in each month, averaged over 1962-2016; Bottom: Highest and lowest average annual temperature recorded over the period 1998-2016 (Source: Kuwait Civil Aviation - Metrological Department) 2
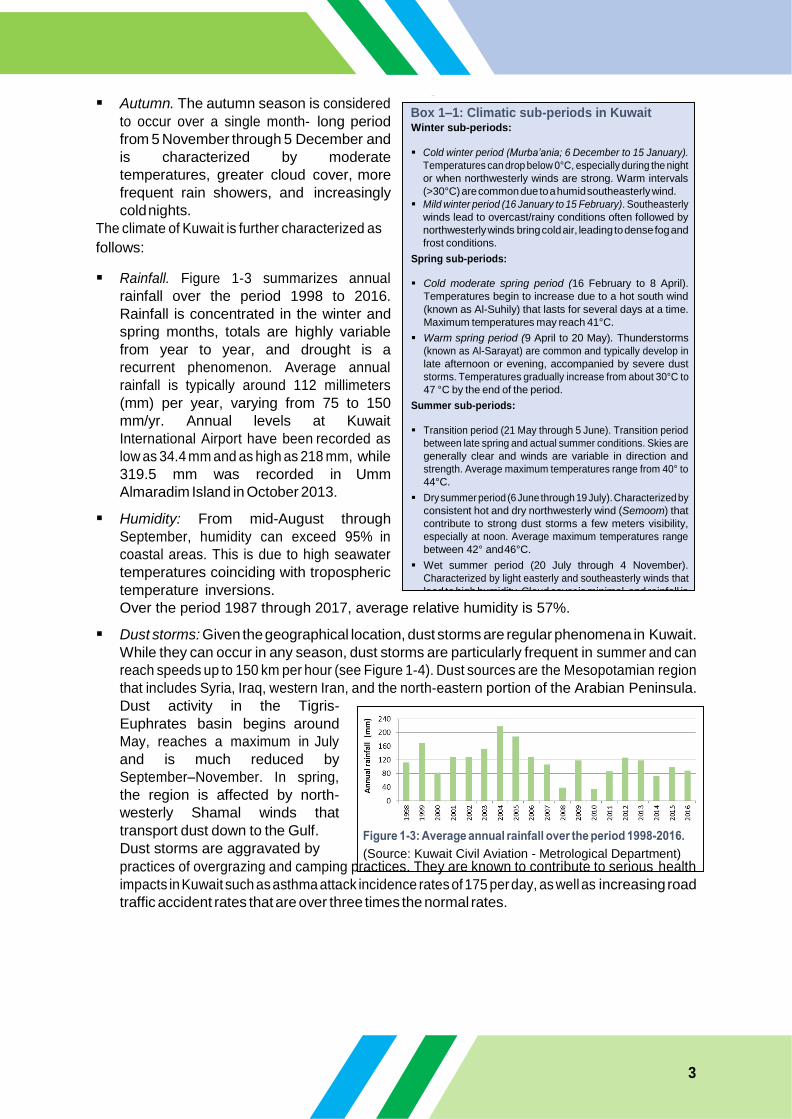
Figure 1-3: Average annual rainfall over the period 1998-2016 (Source: Kuwait Civil Aviation - Metrological Department) 3
Figure 1-4: Recent severe dust storms over Kuwait City. Left: Storm on 17 June 2018 (photo: Sarah Al-Sayegh); Right: Storm on 18 February 2018 (photo: Kuwait Times, 19 February 2018) 4
Figure 1-5: Soils, aquifers and groundwater-irrigated agricultural areas of Kuwait (Source: PAAF, KISR) 4
Figure 1-6: Ecosystems of Kuwait (Source: Samira AS Omar, Raafat Misak ;2007, KISR)) 5 Figure 1-7: Preliminary land degradation map of Kuwait (Source: Al-Dousari et al., 2000) 5 Figure 1-8: Examples of biodiversity in Kuwait; Top left:lizard ; Topright: Al-shriab (shore crab); Bottom
right: Arabian red fox (Vulpes vulpes arabica); Bottom left: ( Black-winged stilt (Credits: Faisal Al-Nomas; KEPA) 6
Figure 1-9: Protected Areas of Kuwait (Source: EPA eMISK – Kuwait) 9 Figure 1-10: Az Zour North independent power station and desalination plant, installed in 2015
(Source: Engie) 10 Figure 1-11: Population composition (Source: Public Authority for Civil Information (PACI),
population data, paci.gov.kw) 11 Figure 1-12: Population pyramid, 2016 (Sources: PACI, population data, paci.gov.kw) 11 Figure 1-13: GIS map of land use in State of Kuwait (Source: e-Misk, KPA) 12 Figure 1-14: Educational profile, (Source: Alghais and pullar,2016) 12 Figure 1-15:Conceptual rendition of Silk City to be built at Subyia (Source:Tamdeen Group) ..................................................................................................................................................13 Figure 1-16: Premature mortality from Noncommunicable diseases, 2016 (Source: WHO
Noncommunicable Diseases Kuwait Profile) 13 Figure 1-17: Kuwait National Assembly building (Source: KNA official website) 14 Figure 1-18: Left: Shares of oil and gas sector and non-oil sectors of total real GDP, 2006 – 2015;
Right: Trends in the contribution to total real GDP from oil and non-oil sectors, 2006 – 2015 (Source: A. Al-Mejren-2018) 15
Figure 1-19: Left: Nominal GDP per capita versus real GDP per capita, 2006 –2015; Right: GDP per capita at purchasing power parity, 2006 – 2015 (Source: A. Al-Mejren-2018) 16
Figure 1-20: Sectoral contribution to Kuwait’s real GDP, 2015 (Source: Central Statistical Bureau, Kuwait) 16
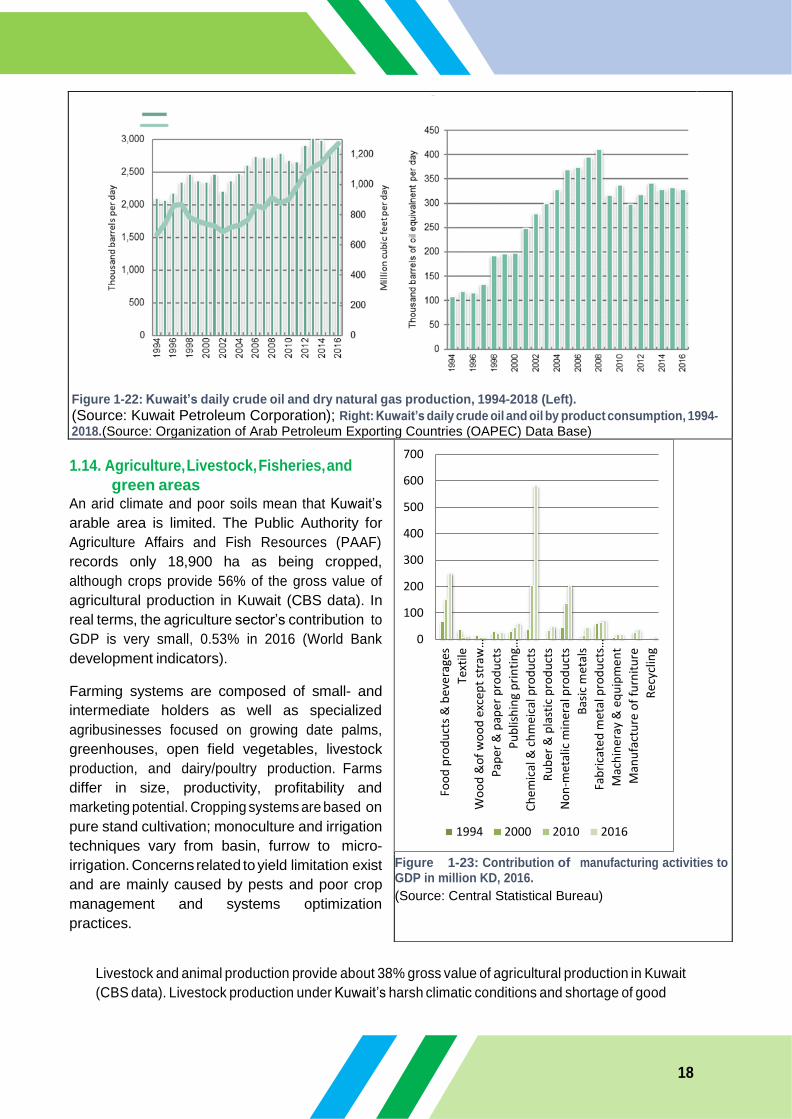
Figure 1-21: Kuwait’s oil fields (Source: e-Misk, KPA) 17 Figure 1-22: Left: Kuwait’s daily crude oil and dry natural gas production, 1994-2018 (Source: Kuwait
Petroleum Corporation); Right: Kuwait’s daily crude oil and oil byproduct consumption, 1994-2018 (Source: Organization of Arab Petroleum Exporting Countries (OAPEC) Data Base) 18
Figure 1-23: Contribution of manufacturing activities to GDP, 2016 (Source: Central Statistical Bureau) 18
Figure 1-24: Values of Kuwait food production indices (Source: PAAF) 19 Figure 1-25: Agriculture areas in Kuwait (Source: e-Misk) 20 Figure 1-26: Hydroponics farming in Kuwait (Source: Kuwait News Agency website) 21 Figure 1-27: Total installed electric capacity, 1994-2016 (Source: Ministry of Electricity and Water,
Statistical Year Book 2017: Electrical Energy) 22 Figure 1-28: Weighted averages of all waste composition, (Source: KM,Fichtner;2013) 23 Figure 1-29: Kuwait industrial areas (Source: e-Misk) 24 Figure 1-30: Vehicle stock profile, 2016 (Source: CSB, the annual statistical abstract
2015/2016) 25 Figure 1-31: Sheikh Jaber Al-Ahmad cross-sea bridge (Source: e-Misk) 25 Figure 1-32: Kuwait international airport new terminal (Source: Ministry of Public Works
website) 26 Figure 1-33: Shuwaikh seaport (Source: Kuwait Ports Authority website) 26

xv
Figure 1-34: Organizations structure for the development of the SNC 27 Figure 1-35 Gross domestic product by economic activity (b) for the years 2012-2013 (Million
KD)……………………………………………..………………………………………..28
List of Boxes Box 1–1: Climatic sub-periods in Kuwait........................................................................................................... 3

1
(Source: e- Misk, KEPA)
1. National Circumstances This chapter provides a description of Kuwait’s national circumstances, together with an overview of
the national socioeconomic, climatic, and environmental context in which climate change challenges
are being addressed.
1.1. Geography The State of Kuwait is located at the northeastern corner of the Arabian Peninsula (see Figure 1-1)
and has borders Saudi Arabia to the south and Iraq to the north and west. Kuwait lies between
latitudes 28°30’and 30°5’ North and longitudes 46°33’ and 48°30’ East, covering a total land area of
17,818 km2 that includes nine uninhabited islands. Kuwait is roughly 170 km across from East to
West and 200 km across from North to South. Kuwait shares a 495 km border with Saudi Arabia to
the south and 195 km with Iraq to the north and west. The capital of Kuwait is Kuwait City. The
country is divided to 6 administrative
governorates; and the governorates are
further subdivided into administrative
areas. The country’s topography is
predominantly flat sandy desert, and is
characterized by two distinct areas, as
follows:
▪ Northern zone. This area includes
Kuwait Bay and five islands:
Boubyan, Warba, Maskan,
Failaka, and Ouha. Kuwait Bay is a
shallow but very important
coastal and marine habitat with
high productivity and diversity. Its
coastal zone accounts for nearly
half of the country’s
shoreline. The two largest islands (Boubyan, 863 km2 and Warba, 212 km2) remain in an
undisturbed condition and are home to migratory birds and rich marine biodiversity.
Boubyan is the second largest island in the Arabian Gulf and is home to pristine marine and
terrestrial ecosystems of regional and international importance. The northern half of island is a
designated marine protected area named Mubarak Al Kabeer Marine Reserve (MKMMR) -
recently designated as a RAMSAR Convention Site.1
▪ Southern zone. The area extends from Ras Al-Ardh to the border with Saudi Arabia. Its coastal
stretches include sandy and mixed shores, as well as the coral reef islands of Kubbar, Qaruh
and Um Al-Maradim. Many intertidal marshes, known as sabkhas, are also found in this zone; the
largest being Al-Khiran Sabkha that was transformed into a large waterfront city. The southern
region of this zone is a monotonous plain covered by sand. Al-Ahmadi hill, 125-m high, is the
sole exception to the flat terrain, while the Wadi Al- Batin and Ash-Shaqq are the only major
valleys, portions of which lie within the western
1 In 2015 Kuwait became the 169th Contracting Party of the Ramsar Convention on Wetlands; and on 17 May
2017 announced the designation of Mubarak Al-Kabeer Marine Reserve.

2
and southern reaches of the country,
respectively. Rocks ranging in age from
early Miocene (less than 24 million
years) to recent are exposed within the
boundaries of Kuwait.
1.2. Climate Kuwait has a hyper-arid desert climate that is
highly variable with recurrent extremes.
Maximum daily temperatures can reach 45°C
during the summer during which there is no
rainfall (see Figure 1-2).
The climate is marked by four distinct
seasons, with long, hot and dry summers and
short winters, as briefly described in the
bullets below.
▪ Winter. The winter season occurs over a 2-
month period between 6 December and 15
February. These months are cooler,
often with a cold northwesterly wind. The
lowest temperature recorded was −4°C
recorded at Kuwait International Airport in
January 1964. Low temperatures,
clouds, rain and a cold northwesterly
wind called (Shamal) characterize this
season. Two distinct climatic periods
within the winter season are evident, as
described in Box 1-1.
▪ Spring. The spring season is a 3-month
period from 16 February to 20 May and is
characterized by moderate
temperatures, rain, cloudy conditions and
hot southerly winds. The climate during the
spring is divided into two distinct climatic
periods, as briefly described in the bullets
below. Two distinct climatic periods within
the spring season are evident, as described
in Box 1-1.
▪ Summer. The summer season occurs over a roughly 5-month period from 21 May to 4
November and is characterized by a significant increase in both humidity and temperature.
Summer is typically hot, dry and humid, with daily maximum temperatures ranging from range
from 43°C to 48°C, with the highest-ever recorded temperature of
54.0 °C at Mitribah in northwest of Kuwait on July 21, 2016 (Kuwait Civil Aviation
Metrological Department). This was the record high ever reliably recorded on the planet in last 76
years, as documented by the World Meteorological Organization (WMO). The prior highest
temperature was (52.9°C) also recorded at Mitribah. The climate during the summer is divided
into three distinct periods, as described in Box 1-1.
Figure 1-2: Top: Daily minimum and maximum
temperatures in each month, averaged over
1962- 2016; Middle: Total rainfall in each month,
averaged over 1962-2016; Bottom: Highest and
lowest average annual temperature recorded over
the period 1998- 2016.
(Source: Kuwait Civil Aviation - Metrological Department)
3
(Source: Kuwait Civil Aviation - Metrological Department)
▪ Autumn. The autumn season is considered
to occur over a single month- long period
from 5 November through 5 December and
is characterized by moderate
temperatures, greater cloud cover, more
frequent rain showers, and increasingly
cold nights.
The climate of Kuwait is further characterized as
follows:
▪ Rainfall. Figure 1-3 summarizes annual
rainfall over the period 1998 to 2016.
Rainfall is concentrated in the winter and
spring months, totals are highly variable
from year to year, and drought is a
recurrent phenomenon. Average annual
rainfall is typically around 112 millimeters
(mm) per year, varying from 75 to 150
mm/yr. Annual levels at Kuwait
International Airport have been recorded as
low as 34.4 mm and as high as 218 mm, while
319.5 mm was recorded in Umm
Almaradim Island in October 2013.
▪ Humidity: From mid-August through
September, humidity can exceed 95% in
coastal areas. This is due to high seawater
temperatures coinciding with tropospheric
temperature inversions.
Over the period 1987 through 2017, average relative humidity is 57%.
▪ Dust storms: Given the geographical location, dust storms are regular phenomena in Kuwait.
While they can occur in any season, dust storms are particularly frequent in summer and can
reach speeds up to 150 km per hour (see Figure 1-4). Dust sources are the Mesopotamian region
that includes Syria, Iraq, western Iran, and the north-eastern portion of the Arabian Peninsula.
Dust activity in the Tigris-
Euphrates basin begins around
May, reaches a maximum in July
and is much reduced by
September–November. In spring,
the region is affected by north-
westerly Shamal winds that
transport dust down to the Gulf.
Dust storms are aggravated by
practices of overgrazing and camping practices. They are known to contribute to serious health
impacts in Kuwait such as asthma attack incidence rates of 175 per day, as well as increasing road
traffic accident rates that are over three times the normal rates.
Box 1–1: Climatic sub-periods in Kuwait Winter sub-periods:
▪ Cold winter period (Murba’ania; 6 December to 15 January).
Temperatures can drop below 0°C, especially during the night
or when northwesterly winds are strong. Warm intervals
(>30°C) are common due to a humid southeasterly wind.
▪ Mild winter period (16 January to 15 February). Southeasterly
winds lead to overcast/rainy conditions often followed by
northwesterly winds bring cold air, leading to dense fog and
frost conditions.
Spring sub-periods: ▪ Cold moderate spring period (16 February to 8 April).
Temperatures begin to increase due to a hot south wind
(known as Al-Suhily) that lasts for several days at a time.
Maximum temperatures may reach 41°C.
▪ Warm spring period (9 April to 20 May). Thunderstorms
(known as Al-Sarayat) are common and typically develop in
late afternoon or evening, accompanied by severe dust
storms. Temperatures gradually increase from about 30°C to
47 °C by the end of the period.
Summer sub-periods: ▪ Transition period (21 May through 5 June). Transition period
between late spring and actual summer conditions. Skies are
generally clear and winds are variable in direction and
strength. Average maximum temperatures range from 40° to
44°C.
▪ Dry summer period (6 June through 19 July). Characterized by
consistent hot and dry northwesterly wind (Semoom) that
contribute to strong dust storms a few meters visibility,
especially at noon. Average maximum temperatures range
between 42° and 46°C.
▪ Wet summer period (20 July through 4 November).
Characterized by light easterly and southeasterly winds that
lead to high humidity. Cloud cover is minimal, and rainfall is

4
: Recent severe dust storms over Kuwait City.
Left: Storm on 17 June 2018. (Photo: Sarah Al-Sayegh); Right: Storm on 18 February 2018 (Photo: Kuwait Times, 19 February 2018)
1-5: and
agricultural areas of Kuwait.
(Source: PAAF, KISR)
1.3. Land and vegetation Much of Kuwait is characterized by loose, mobile surface sediments. Soils are divided into ten
groups, all of which have very low levels of nutrients and organic matter (see Figure 1-5). Soil
moisture content is also very low because of high evaporation rates but also due to widespread hard
pans (locally known as gutch) that
reduce water permeability. Less than
1% of Kuwait’s land area is considered
arable.
The vegetation of Kuwait is broadly
classified as an open scrub of the
Saharo - Arabian floristic region, which
is contiguous with that of the Northern
Plains of eastern Saudi Arabia (Royal
Botanical Gardens-Kew, 2010). Kuwait
occupies part of the large, low-lying
desert plain covering most of Eastern
Arabia and is mostly characterized by
desert and coastal plains (see Figure 1-
6). Coastal areas comprise important
marine habitats, many with high productivity and diversity, including salt marshes and tidal
mudflats.

5
1.4. Desertification Several studies have assessed
desertification in parts of Kuwait
(Shahid et al., 1999; Al-Dousari et al.,
2000; Omar et al., 2001; Misak et al.,
2002; Al-Awadhi et al., 2005). Seven
processes or indicators of land
degradation have been recognized,
with a general agreement that these
processes affect about 70% of Kuwait’s
land area. They are deterioration of
vegetation cover; soil crusting and
sealing; soil erosion by wind; soil
erosion by water; soil compaction; soil
contamination by oil; and soil
salinization. These indicators are
mapped in Figure 1-7.
Deterioration of vegetation cover and a
decline in the alpha diversity of plant
species is one the most obvious
indicators of desertification in Kuwait’s
desert ecosystem. Overgrazing is
considered the prime driver of this
vegetation degradation on rangelands,
a conclusion supported by several
studies that document much greater
vegetation cover in areas fenced off
and unavailable to livestock (Omar,
1991; Zaman, 1997; Shahid et al.,
1999). This form of desertification is
particularly severe around watering
points where it is exacerbated by soil
trampling and compaction due to the
congregation of animals (Al-Awadhi et
al., 2005). Other important localized
causes of vegetation deterioration are spring camping, the uprooting of woody shrubs to use as fuel and military maneuvers. One survey indicates that at least 65% of Kuwaiti soils are affected by some degree of compaction, inhibiting the infiltration capacity of soils by 40–100% and increasing their bulk density by up to 50% (Misak et al., 2001).
Wind erosion occurs naturally on many of Kuwait’s desert surfaces: those consisting of active sand
sheets and sand dune fields. Elsewhere, some vegetated sand sheets have also been mobilized
where their stabilizing cover of vegetation has suffered from degradation and trampling. These
mobile sediments represent a serious hazard to human activities. The annual costs of clearing sand
encroachment from oil installations in Kuwait is more than US$1 million. The annual expenditure
needed to remove sand from Ali As-Salem airbase is similar (Ramadan & Al-Dousari, 2013). Local
sources of fine particulates contribute to the numerous dust storms that affect Kuwait, although the
country is also affected by desert dust transported from neighboring countries and further afield.
(Source: Al-Dousari et al., 2000)
Figure 1-6: Ecosystems of Kuwait.
(Source: Samira AS Omar, Raafat Misak ;2007, KISR)

6
Associated impacts include hazards to aircraft and maritime traffic, effects on oil operations and
green energy production, and serious human health problems due to the low air quality.
1.5. Biodiversity Kuwait is committed to its international obligations regarding the conservation of its native
biodiversity. On 5 June 2017, Kuwait ratified the Nagoya Protocol, which is a supplementary
agreement to the Convention on Biological Diversity, that sets forth obligations on Access to Genetic
Resources and the Fair and Equitable Sharing of Benefits Arising from their Utilization. With this
ratification Kuwait became the 100th Party to such Protocol. On the same date, Kuwait also ratified
the Cartagena Protocol on Biosafety to the Convention on Biological Diversity and became the 171st
party.
The World Wide Fund for Nature (WWF) classifies Kuwait’s terrestrial ecosystem as a desert and
xerophytic (Greek xero dry, phuton plant) scrub. This classification is based on the high variability in
intra-annual annual rain fall (see earlier Figure 1-2), and the high evaporation rate exceeding
rainfall.
About 375 plant species have been recorded in Kuwait of which about two thirds (256 species) are
annuals. Low shrubs and herbaceous perennials form the main constituents of the perennial
vegetation with only a few large shrubs, and a single tree species present (Halwagy & Halwagy 1974,
Halwagy et al. 1982, Mandaville 1990, Omar et al. 2001, Ghazanfar 2006).
Kuwait has a colorful terrestrial and
marine biodiversity (see Figure 1-8).
This diversity is fragile and vulnerable to
the impacts of climate change;
desertification and other threat
resulting from anthropogenic activities,
including habitat destruction,
overgrazing, pollution, and illegal
hunting and overfishing. The last
inventory of wild animal species in
Kuwait documented the presence of
more than 300 birds, 20 mammals and
40 reptile species.
In Kuwait, 648 species of insects have
been recorded, belonging to 414 genera
and 22 orders. The largest order is that
of beetles Coleoptera with 230 known species, then butterflies and moths Lepidoptera with 76
recorded species, followed by bees, wasps and ants Hymenoptera with 71 species, then flies Diptera
with 69 species, and finally the locusts Orthoptera with 34 known species (Al-Houty,1989).
The native flora of Kuwait consists of 374 plants: dwarf perennial bushes, annual grasses, and herbs.
This includes 256 annuals, 83 herbaceous perennials, 34 under shrubs and 1 tree. The native plants
have designed their own mechanisms to survive in the country’s extreme environmental conditions.
The perennials in particular have to face the harsh climate more than the annuals, which propagate
only after the seasonal rainfall (Shamal Azzour: https://www.aznoula.com). Important plant
communities in this floristic region in Kuwait are briefly described in the bullets below (Halwagy &
Halwagy, 1974; Halwagy et al., 1982; Mandaville, 1990; Omar et al., 2001; Ghazanfar, 2006).
Top left: Lizard; Top right: Al-Sheriab (shore Crab);
Bottom right: Arabian red fox (Vulpes arabica); Bottom
left: Black-winged Stilt (Credits: Faisal Al-Nomas; KEPA)

7
▪ Haloxylon salicornicum community. Wxtends from Iraq in the northeast down to the northern
edge of the Rub’ al Khali in Saudi Arabia. Found predominantly on sandy and sandy-gravelly
soils, this is the largest community in northeast Arabia and is composed of the dominant shrub
Haloxylon salicornicum. In Kuwait, it is present in the north and north- eastern parts. Associates
are Astragalus spinosus and Chrozophora spp.
▪ Rhanterium epapposum community. Extends from eastern Saudi Arabia and south to the United
Arab Emirates. It is present on deep and shallow sand. The dominant species is Rhanterium
epapposum with associates Convolvulus oxyphyllus and Moltkiopsis cilata. Other species such
as Gynandriris, Anthemis, Cornulaca form associates in specific soil and topography. Rhanterium
epapposum is very palatable to livestock, and overgrazing has greatly affected its occurrence.
It is not common in Kuwait, presently found only in protected area.
▪ Stipagrostis plumosa community. Found mostly in the west and south west of Kuwait with the
dominant grass, Stipagrostis plumosa is a result of degradation and disturbance. Under
proper management this community develops into the Rhanterium epapposum community, or
on saline soils, into the Haloxylon salicornicum community. In the south- west Centropodia
forsskalii, a perennial grass, is dominant with Stipagrostis plumosa as the chief associate
(recognized as a separate community by Omar et al. 2001).
▪ Cyperus conglomeratus community. Found throughout the Arabian Peninsula, being a
community on sand, both on mobile and stable dunes and sand sheets, forming
hummocks. In Kuwait found in the southern part the country. An excellent sand binder, and not
readily eaten by livestock, it can thrive with moisture from dew. Associates are usually annual
species (Astragalus annularis, Brassica tournefortii, Plantago albicans).
▪ Halophytic communities. Three halophytic communities – Zygophyllum, Panicetum and
Halophyletum from coast inland are composed primarily of halophytic shrubs. Salicornia
europaea grows on low, frequently inundated mud banks or along creeks, sometimes
associated with Aeluropus lagopoides and Bienertia cycloptera, or with Juncus rigidus on the
fringes of creeks. A Halocnemum strobilaceum community occupies the lower marshes
along the shoreline with the seaward edge inundated very frequently by tides. A Seidlitzia
rosmarinus community occurs further inland, followed by Nitraria retusa above the high tide mark
dominating the middle marshes, and finally the Tetraena qatarensis (syn. Zygophyllum
qatarense) community occurs on elevated, coarse sandy sites on the landward edge of the marsh.
The salt marshes are fringed by nonhalophytic communities such as the Cyperus conglomeratus
community, the Rhanterium epapposum-Convolvulus oxyphyllus-Stipagrostis plumose community
and the Haloxylon salicornicum community, the latter covering most of the territory of Kuwait.
Kuwait has a rich profile of invertebrates and vertebrate’s fauna. The intertidal zone is colonized by
many species of Ocypode crabs, of which leptochryseus kuwaitnese endemic. The blue-spotted
Mudskipper Boleophthalmus boddarti is also another inhabitant of the intertidal zone. The most
common is the black scorpion Androctonus crassicayda. While the most common spiders are the
wolf spiders Pardosa sp., the crab spiders Thomisus sp, the sun spiders Galeodes sp., the velvet mites
Dinothrombium sp, and Tarantula sp (KEPA, Fifth National Report, 2014).
One of the most common insects in Kuwait is the ground beetle (Tenebrionidae). The most famous
species is probably Trachyderma hispida. This black beetle is omnipresent in houses and in the
desert. Active during day time, this beetle burrow the larvae and pupae beneath soil cover.

8
The reptile fauna of Kuwait is depauparate with no endemic species, although 40 species have been
recorded. The common reptiles of Kuwait include the dhub Uramastyx microlepis, the Agma lizard
and the wirral Varanus griseus. There are several species of snakes in Kuwait such as the sand boa
Eryx jayakari, the Arabian boa Malpolon moilensis and the sand the sand viper Cerastes cerastes.
Twenty-eight mammalian species live in Kuwait. Sadly, four large mammals have been exterminated;
the dorcas gazelle, the mountain gazelle (Idmi), the Arabian sand gazelle and the Asiatic cheetah
(fahd). Other large carnivores such as the wolf, caracal and jackal are now extremely rare. Habitat
destruction and extensive and unregulated hunting are driving endangered mammalian species,
such the fennec fox, the red fox, the honey badger, the Indian grey mongoose and the wild cat, to
extinction.
Due to ecological and anthropogenic activities, most large mammals that were native to Kuwait
were wiped out or disappeared. (Kuwait Times, 11 March 2017). Over the past decades, the desert
of Kuwait has witnessed a dramatic decline in its biodiversity, as many species have disappeared,
such as Arabian oryx Oryx leucoryx, Arabian wolf Canis lupus arabs, striped hyena Hyaena hyaena,
the golden jackal Canis aureus, mellivora capensis, dorcas gazelle Gazella dorcas, sand gazelle
Gazella subgutturosa, fox Ruppell Vulpes rueppellii, and others. (https://www.aznoula.com) In
addition, several species of birds such as houbara bustard Chlamydotis undulate, and lanner falcon
Falco biarmicus feldeggi were also wiped out. Concerning reptiles, there are over 40 species of
reptiles and amphibians recorded in the dry areas of Kuwait.
However, no specific studies found about their current status, but as with the other native fauna,
their distribution is minimized and restricted to remote areas with minimum human interference. In
general, the fate of desert reptiles is not expected to be better than the fate of extinct birds and
other species. The loss and fragmentation of habitat, the human impact and overcrowding are the
main causes of extinction. Fragmentation of habitats continues to threaten wildlife in Kuwait.
Genetic clustering, species isolation, and the intensification of genetic mutations that may lead to
population breakdown in isolated groups are some of the threats that habitat fragmentation poses.
(https://www.aznoula.com).
The Kuwaiti government strives to preserve the national biodiversity through several policies and
procedures. Environmental police are enforcing the implementation of the environment protection
law on violators hunting or polluting the environment or fishing in restricted areas. Article 100 of
Kuwait’s environmental Act, which became effective since 2014, bans hunting, collecting or
destruction of nests in the areas where wild species live. The article states that native fauna,
including all mammals, birds and reptiles, cannot be killed, collected, hunted, have their nests
destroyed, or be harmed by any activity.
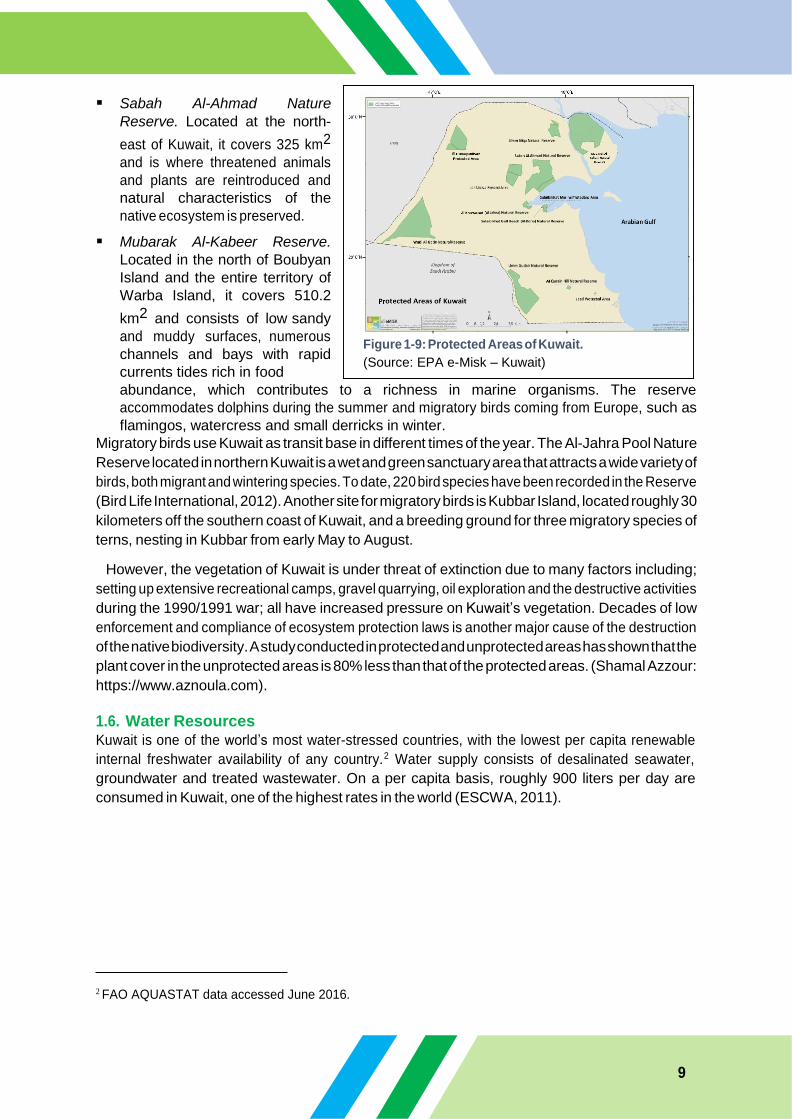
Kuwait has also allocated 11.65% of its terrestrial and coastline as nature reserve and protected
parks. At the present there are twelve reserve areas across the country (see Figure 1-9). The largest
and most significant reserves are as follows:
9
▪ Sabah Al-Ahmad Nature
Reserve. Located at the north-
east of Kuwait, it covers 325 km2
and is where threatened animals
and plants are reintroduced and
natural characteristics of the
native ecosystem is preserved.
▪ Mubarak Al-Kabeer Reserve.
Located in the north of Boubyan
Island and the entire territory of
Warba Island, it covers 510.2
km2 and consists of low sandy
and muddy surfaces, numerous
channels and bays with rapid
currents tides rich in food
abundance, which contributes to a richness in marine organisms. The reserve
accommodates dolphins during the summer and migratory birds coming from Europe, such as
flamingos, watercress and small derricks in winter.
Migratory birds use Kuwait as transit base in different times of the year. The Al-Jahra Pool Nature
Reserve located in northern Kuwait is a wet and green sanctuary area that attracts a wide variety of
birds, both migrant and wintering species. To date, 220 bird species have been recorded in the Reserve
(Bird Life International, 2012). Another site for migratory birds is Kubbar Island, located roughly 30
kilometers off the southern coast of Kuwait, and a breeding ground for three migratory species of
terns, nesting in Kubbar from early May to August.
However, the vegetation of Kuwait is under threat of extinction due to many factors including;
setting up extensive recreational camps, gravel quarrying, oil exploration and the destructive activities
during the 1990/1991 war; all have increased pressure on Kuwait’s vegetation. Decades of low
enforcement and compliance of ecosystem protection laws is another major cause of the destruction
of the native biodiversity. A study conducted in protected and unprotected areas has shown that the
plant cover in the unprotected areas is 80% less than that of the protected areas. (Shamal Azzour:
https://www.aznoula.com).
1.6. Water Resources Kuwait is one of the world’s most water-stressed countries, with the lowest per capita renewable
internal freshwater availability of any country.2 Water supply consists of desalinated seawater,
groundwater and treated wastewater. On a per capita basis, roughly 900 liters per day are
consumed in Kuwait, one of the highest rates in the world (ESCWA, 2011).
2 FAO AQUASTAT data accessed June 2016.
Figure 1-9: Protected Areas of Kuwait.
(Source: EPA e-Misk – Kuwait)

10
Desalinated water is produced in six multi-stage
flash distillation plants and one reverse osmosis
plant. These are large facilities located near the
coast and co-produce electricity (see Figure 1-10).
Desalination plants provide more than 90% of
Kuwait’s potable water needs.
Much of the available groundwater is brackish
(total dissolved solids (TDS) ranging from 1,000 to
7,000 mg/l) and saline (TDS ranging between
7,000 to 20,000 mg/l) PAAF, 2006) Fresh
groundwater (TDS less than 1,000 mg/l) is very limited and available in two freshwater lenses,
Raudhatain and Umm Al Eish, of the transboundary Dammam aquifer. These freshwater lenses are
formed due to a combination of unique conditions that include high intensity rainfall of short
duration, and a geomorphology and lithology that enable rapid infiltration to the underlying
groundwater. From historical pumping and water quality variation data acquired between 1963 and
1977, the sustainable extraction rate for Raudhatain and Umm Al Eish, which would avoid the uplift
of deeper saline water, is estimated to be 3,500 and 5,500 m3/day, respectively (Kwarteng et al,,
2000). Fresh groundwater is considered a strategic reserve for drinking purposes only.
Brackish groundwater is used for agricultural and domestic purposes and as drinking water for
cattle. This water is produced from the Al-Shigaya, Al-Qadeer, Sulaibiyah, Wafra and Abdally fields.
The production capacity of these fields is about 545,000 m3/day. In general, groundwater quality
and quantity are deteriorating due to the continuous pumping of water. In Wafra in the south, 50%
of the wells pumped water had a salinity level higher than 7,500 ppm in 1989, reaching 75% and 85%
in the years 1997 and 2002, respectively. In Abdally in the north, these figures were estimated at 55,
75 and 90%, respectively. For Wafra, reported monitored wells over a similar time period and results
showed that salinity is increasing from 5-14,000 ppm to 8-14,000 ppm in wells (Akber, 2009).
A significant percentage of wastewater is being discarded and flows back into the Gulf sea water.
Over 90% of the population is connected to a central sewerage system. This offers an important
potential for treated wastewater (TWW) reuse that can contribute to alleviating high irrigation water
demand for landscaping and agriculture. Planning is underway to distribute water from the
Sulaibiyah treatment plant as follows: 40% to the south for the Wafra agricultural area, 40% to the
north to the Abdally agricultural area, with 20% to remain in the Sulaibiyah area agricultural area.
There are GCC guidelines allowing use of quaternary TWW for growing vegetables, fruits and other
crops in times of crises.
Kuwait has recently implemented a vigorous campaign that aims to reclaim and reuse all treated
wastewater. A recent paper by Al-Anzi, Abusam and Shahalam (2010) presents the current status of
wastewater treatment, reclamation and reuse in Kuwait, and discusses the impact of wastewater
reuse on the amounts of pollutants discharged into the sea. “Analysis of the historical records of the
waste water treatment plants has indicated that the reuse of reclaimed wastewater in Kuwait has
greatly reduced the amounts of pollutants discharged into the sea, from about 65% of treated
wastewater in year 2000 to less than 30% in year 2010. However, the amounts of treated
wastewater discharged into the sea were predicted to start increasing again by the year 2020,
especially if the future plans of the Ministry of Public Works (MPW) are not implemented by that
time.”
(Source: engie.com)

11
A study undertaken by Alhumoud and Madzikanda, in 2010 also shows that “the overwhelming
majority of the respondents (77.91%) objected to using reclaimed water for drinking and only
16.83% said they might consider drinking it. The majority of respondents (75.28%, 66.80% and
55.60%) did not object to using the reclaimed water for agricultural irrigation, car washing and
house washing. In addition, data showed that most of the respondents, even the ones that
possessed enough knowledge about the subject, strongly opposed using reclaimed wastewater for
human use (showering/bathing: 60.03%, clothes washing: 52.40% and cooking: 78%), regardless of
its quality and cost". Reasons and objections for not using treated wastewater were: health (69%),
psychological (54%), religion beliefs (29%), mistrust of the workmanship at the plant (25%), fear of
mechanical breakdown (19%), while seven% reject it for other reasons. People with high educational
attainment showed a greater willingness, compared with other groups, to use treated wastewater
for different purposes. This may be because they are more familiar with the different potential uses.
Nearly 58% of the sample thought that fresh water supply would be a problem in the future. About
32% believed to some extent that it would be a problem and ten% said it would not be a problem. In
the future there may be more acceptance of the use of tertiary or quaternary treated water in
Kuwait.
1.7. Demography Kuwait has an overwhelmingly urban population that has grown rapidly since the discovery of oil in
the late 1930s, with over 98% of the
population lives in urban areas.
Between 1994 and 2016 the total
population increased from 1.6 million
to 4.8 million, at an average annual
rate of 4.0% (see Figure 1-11). Over
this time, the Kuwaiti population as a
share of the overall population has
declined from nearly 37.2% to nearly
30.4%. In contrast, the expatriate
population has grown more rapidly
over the same period - about 5% per
year on average - while their ratio of
total population rose from nearly
62.8% to 69.6% (PACI, 2018).
Kuwait’s population is, like those of its
Gulf neighbors, heavily skewed due to
relative to age and gender (see Figure
1-12). By the end of 2017, most of
total population (about 78%) was
between 16 and 64 years of age and
males roughly comprised 63%. This is
in large part due to the presence of a
large number of expatriate workers in
the country in that age bracket (about
86%) that are mostly male (nearly
69%).
4.5 Non Kuwaitis Kuwaitis
4.0
3.5
3.0
2.5
2.0
1.5
1.0
0.5
0.0
(Source: Public Authority for Civil Information, paci.gov.kw)
(Source: Public Authority for Civil Information, paci.gov.kw)
Mill
ion p
eo
ple
1994
1996
1998
2000
2002
2004
2006
2008
2010
2012
2014
2016

12
In contrast, Kuwaitis under the age of 20 accounted for the majority, about 45.2 percent, of the
national population in 2016. On the other hand, the gender distribution in the case of Kuwaiti
national population is modestly biased towards females (51%).
Regarding educational levels, illiteracy rate among population during the 10 years was confined to
about 3 percent, while those who just read and write were 27 percent, holders of school certificates
ranging from primary to secondary represented 45.4% of the population (see Figure 1-13).
1.8. Urban Development Since the first half of the twentieth
century, Kuwait City has transformed
itself from a small walled city to a
metropolitan area experiencing rapid
and unprecedented population growth
with only a relatively small increase in
the extent of its urban area. Most of
the highly urbanized areas are located
along the coast (see Figure 1-14). This
has led to a number of lifestyle,
economic and environmental
challenges (Alghais and Pullar, 2016).
Future urban developments are
planned for beyond the the periphery of existing urban
centers. Two of the most prominent are briefly described in
the bullets below.
▪ Kuwait’s Islands Project. The initial phase of an
ambitious project to transfer five of the Kuwaiti
uninhabited islands (Boubyan, Failaka, Warba,
Miskan and Ouha) into economically feasible areas was
presented to His Highness the Amir who backed the
initiative as part of the Kuwait future strategy and a
corner stone of the vision to transform Kuwait into a
regional and global trade and financial hub, while also
boosting development of all other
sectors of the economy. The project aims to support the country’s development through various
projects on these islands, which will turn them into free trade zones that link the East to the West.
The Supreme Council of Planning is studying the benefits of adopting other international models
to create a comprehensive and multi-purpose free trade zone in these islands to enhance
Kuwait’s regional and international competitiveness and attract foreign investment.
Realization of the project will require new legislation, exceptional resolutions, and other
governmental measures.
▪ Madinat Al-Hareer (Silk City). Madinat Al Hareer project (see Figure 1-15) was initially
proposed by the Tamdeen Group, a private corporation before its approval by the
government where it becomes part of the Kuwait future strategy. The project site is Al- Subiya
in northern Kuwait and would cover about 250 km2. The project is planned to be built in phases
and be completed within 25 years at an estimated cost of US$ 132 billion.
(Source: e- Misk, KPA)
(Source: Alghais and Pullar, 2016

13
The city will be connected to
Kuwait City via the Jaber
Causeway. It will accommodate at
its center a one-kilometer high
skyscraper tower (Burj Mubarak)
that will be surrounded by mixed-
use tall building. The proposed
capability of the city housing is
expected to reach 700,000
people. One of its four villages
are the Ecological Village which
will includes national parks and
reservations for wild animals and
rare planets as well as nature
reserves for migrating birds from
central Asia and Africa. The village
will include a center for
environmental studies and vast green spaces, as well as be surrounded by a green belt of gardens
and vast green spaces. The Chinese government has shown interest in collaborating on the
project along with others in the five Kuwaiti islands as part of the Chinese ‘One Belt, One
Road’ initiative promoting economic prosperity of Eurasia countries.
1.9. Public Health Due to a modern healthcare system, there has been a decrease in the incidence of communicable
diseases and an increase in life expectancy over the recent past. Today, the burden of disease has
shifted towards non-communicable diseases and injuries (see Figure 1-16). Trends are showing
steady increases in the incidence of coronary heart disease, cancer and accidents and injuries
(mainly road traffic accidents). In addition, the incidence of diabetes and obesity is on the rise.
Various NGOs have begun to focus attention on these conditions.
In recent decades, the number of motorized vehicles has grown significantly lead to increased air
pollutant emissions (PM10, CO, NOx, O3, SO2 and VOCs) and poor urban air quality (Al Bassam; and
Khan, 2004). Many studies have shown strong associations between particulate matter (PM) levels
and a variety of adverse health outcomes, with PM levels are high enough in Kuwait to impose
substantial health risks (Ward Brown et al., 2008).
1.10. Government structure The State of Kuwait is a constitutional, hereditary emirate
ruled by princes (Emirs) drawn from the Al-Sabah family.
The Constitution of Kuwait, endorsed by the Constituent
Council on 11 November 1962, has elements of a
presidential and a parliamentary system of government. The
country is administrated relative to six (6) governorates:Al-
Kuwait (capital), Al-Jahra (largest), Al-Ahmadi (several major
oil refineries), plus governorates located close to the capital:
Al-Farwaniyah, Hawalli, and Mubarak Al-Kabeer.
His Highness Sheikh Sabah Al-Ahmad Al-Jabir Al-Sabah is the
Emir of Kuwait, head of state, and Commander-in-Chief of
Kuwait's armed forces. The Emir, a member of al-Sabah dynasty that has been ruling since
(Source: Tamdeen Group)
Source: WHO Noncommunicable
Diseases Kuwait Profile)

14
approximately 1752, exercises his executive authority through the Prime Minister and the Council of
Ministers. The Emir is constitutionally empowered to appoint the Prime Minister.
Legislative power is vested in the Emir and the parliament which convenes in the National Assembly
building (see Figure 1-17). Parliament consists of fifty members, who are chosen in direct elections
that are held every four years. In
accordance with the country's
constitution, the fifteen cabinet
ministers are also members of
parliament. Kuwait's parliament is not
only the oldest legislative assembly
among in Gulf Cooperation Council
(GCC) states but possesses the greatest
political authority of any in the GCC.
Since 2005, all Kuwaiti citizens, both
male and female at least 21 years of
age, are eligible to vote.
The Emir is empowered by the
Constitution to dissolve the parliament
and call for new elections, or in cases of
national emergency can dismiss the
parliament outright and/or suspend
certain articles of the Constitution and
assume supreme authority over the country. Either the Emir or the parliament can propose
amendments to the constitution; a two-thirds majority of the members of the Assembly is required
to adopt a change.
The nomination of a successor to the Emir is the prerogative of the ruling Al-Sabah family, and is
subject to parliamentary approval under the Constitution. If the nominee does not win a majority of
votes of the Assembly, the parliament must vote on and approve another candidate for the post.
The Constitution allows for the establishment of political parties. At the current time, a law has not
yet been enacted to regulate them. As a result, no political parties are operational in Kuwait in a
formal sense. Nevertheless, several members of parliament identify themselves and function as de
facto political parties on the basis of religious sect/belief, social class or tribe.
Kuwait has an independent judiciary system. Civil laws are based on a combination of British
common law, French civil law, and Islamic religious law, the latter having a considerable role in
personal and family matters. In each of the country’s six governorates there is a summary court.
There is also a court of appeals; a Cassation Court, which is the highest level of judicial appeal; and a
Constitutional Court.
1.11. Economy Kuwait’s economy is fairly small, comparatively rich, semi-open and highly dependent on oil exports.
Petroleum accounts for the majority of gross domestic product (GDP), export revenues and
government income. Crude oil & natural gas sector dominates the economy. On average, it
represents nearly 50% of the country’s real GDP.
(Source: KNA official website)

15
Other sectors are not actually fully independent of the oil and gas sector as they are heavily
dependent on oil and gas revenues. Social services, for example, are entirely funded by public oil
revenues. The largest manufacturing industries are oil-based and most other activities are heavily
subsidized with oil income. Figure 1-18 (left) shows the percentage contribution of oil and non-oil
sectors to real GDP (at constant prices of 2010) between 2006 and 2015. Figure 1-18 (right) shows the
growth trend of these two sources of real GDP during the same period. Because of such a reliance
on oil income, Kuwait’s economy continues to be highly vulnerable to changes in global oil
demand, as well as international oil market price volatility.
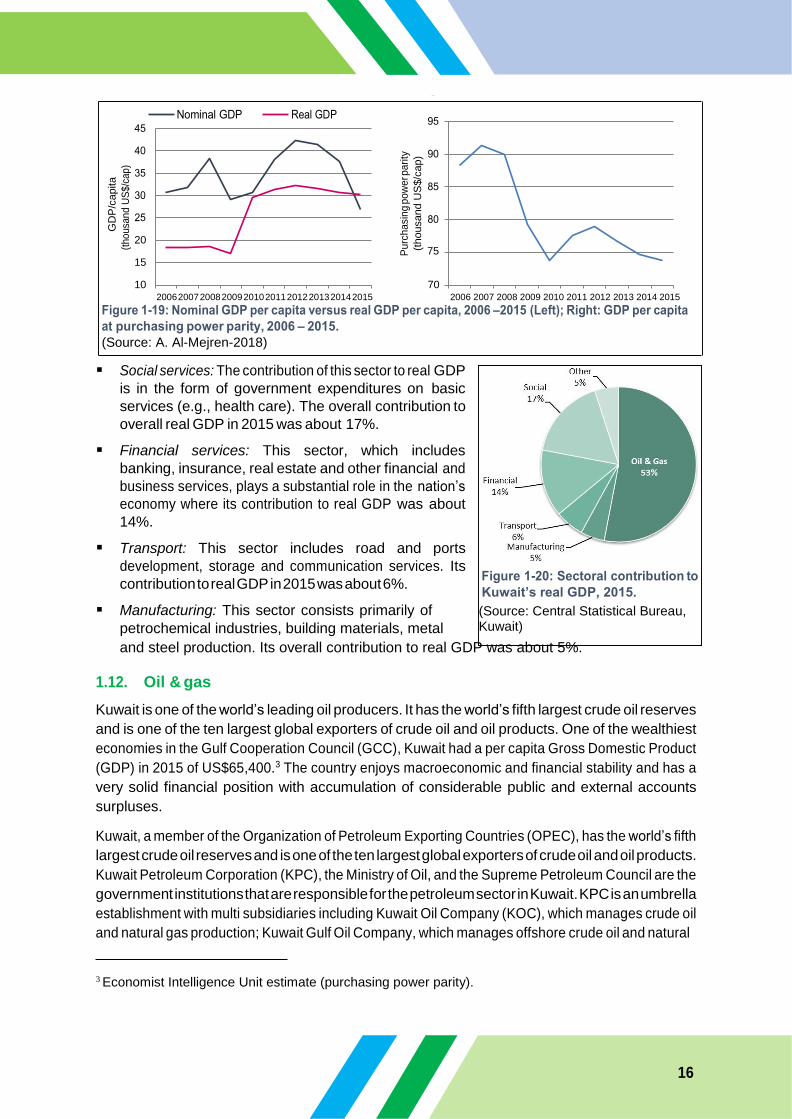
Over the period 2006–2015, nominal GDP per capita has shown a decline of 12.6% from nearly 30.7
thousand U.S. dollars in 2006 to nearly 26.7 thousand U.S. dollars in 2015. However, during the same
period of time, real GDP per capita has shown a strong growth of 63.6% from 18.6 thousand U.S.
dollars in 2006 to 30.2 thousand U.S. dollars in 2015 (see Figure 1-19, left). Over the same period of
time, the GDP per capita using the purchasing power parity (PPP) basis has averaged 80.4 thousand
U.S. dollars, which is one of the world highest levels. However, PPP-GDP per capita has
declined by 6.4 percent. Figure 1-19 (right) shows the decline in GDP per capita at PPP basis over
the period 2006 – 2015.
In addition to the oil and gas sector, there are four other activities with large GDP shares. They
include social services, financial services, transport and manufacturing. Together, these sectors
account for about 90% of the non-oil sector’s contribution to real GDP and 42% of the entire real
GDP, with the remaining 5% of non-oil GDP accounted for by agriculture, utility, construction, and
trade sectors. An overview of the major sectors is provided in the bullets below. Figure 1-20
presents their relative contribution to GDP in 2015.
in the contribution to total real GDP from oil and non-oil sectors, 2006 – 2015. (Source A. Al-Mejren-2018)
2006 2007 2008 2009 2010 2011 2012 2013 2014 2015 2006 2007 2008 2009 2010 2011 2012 2013 2014 2015
100%
90%
80%
70%
60%
50%
40%
30%
20%
10%
0%
Oil & Gas GDP Non-Oil GDP
16
▪ Social services: The contribution of this sector to real GDP
is in the form of government expenditures on basic
services (e.g., health care). The overall contribution to
overall real GDP in 2015 was about 17%.
▪ Financial services: This sector, which includes
banking, insurance, real estate and other financial and
business services, plays a substantial role in the nation’s
economy where its contribution to real GDP was about
14%.
▪ Transport: This sector includes road and ports
development, storage and communication services. Its
contribution to real GDP in 2015 was about 6%.
▪ Manufacturing: This sector consists primarily of
petrochemical industries, building materials, metal
and steel production. Its overall contribution to real GDP was about 5%.
1.12. Oil & gas
Kuwait is one of the world’s leading oil producers. It has the world’s fifth largest crude oil reserves
and is one of the ten largest global exporters of crude oil and oil products. One of the wealthiest
economies in the Gulf Cooperation Council (GCC), Kuwait had a per capita Gross Domestic Product
(GDP) in 2015 of US$65,400.3 The country enjoys macroeconomic and financial stability and has a
very solid financial position with accumulation of considerable public and external accounts
surpluses.
Kuwait, a member of the Organization of Petroleum Exporting Countries (OPEC), has the world’s fifth
largest crude oil reserves and is one of the ten largest global exporters of crude oil and oil products.
Kuwait Petroleum Corporation (KPC), the Ministry of Oil, and the Supreme Petroleum Council are the
government institutions that are responsible for the petroleum sector in Kuwait. KPC is an umbrella
establishment with multi subsidiaries including Kuwait Oil Company (KOC), which manages crude oil
and natural gas production; Kuwait Gulf Oil Company, which manages offshore crude oil and natural
3 Economist Intelligence Unit estimate (purchasing power parity).
20 75
15
10 70 2006 2007 2008 2009 2010 2011 2012 2013 2014 2015 2006 2007 2008 2009 2010 2011 2012 2013 2014 2015
(Source: A. Al-Mejren-2018)
Kuwait’s real GDP, 2015.
(Source: Central Statistical Bureau, Kuwait)
GD
P/c
apita
(tho
usa
nd U
S$
/cap
)
Pu
rch
asin
g p
ow
er p
ari
ty
(thousand U
S$/c
ap)

17
(Source: e-Misk, KPA)
gas operations in the Partitioned Neutral Zone between Kuwait and Saudi Arabia, the Petrochemical
Industries, and Kuwait National Petroleum Company (KNPC), which operates the country’s three oil
refineries.
The Ministry of Oil estimates the country's proven oil reserves at 101.5 billion barrels, just over 7%
of the world total. Additional reserves of about five billion barrels is held in the Partitioned Zone
with Saudi Arabia. Much of Kuwait’s
reserves and production are
concentrated in a few mature oil fields
that were discovered in the early to
middle decades of the past century.
Figure 1-21 shows the distribution
of Kuwait’s oil fields.
Gross crude oil production in Kuwait
reached about 2.883 million barrels per
day in 2016 while natural gas
production exceeded 1,200 million
cubic feet per day in that year (see
Figure 1-22, left). In January 2018, KPC
officials disclosed plans for the
company to spend over $500 billion to
boost its crude production capacity to
4.75 million barrels per day by 2040. Nearly $114 billion of this amount was allocated over the next
five years. Kuwait's current crude oil production capacity is about 3.15 million barrels per day (bpd).
During 2016, KOC production capacity in South and East Kuwait reached nearly 1.706 million bpd,
with actual production of 1.686 million bpd. The company also managed to achieve at the North
Kuwait operations area a crude production capacity of about 709,000 bpd, and an actual crude
production of 705,000 bpd. On the other hand, the West Kuwait fields, crude production capacity
reached approximately 534,000 bpd, and actual production of 492,000 bpd.
About one-sixth of Kuwait oil and gas production is consumed in the domestic market. According to
estimates by KNPC, which produces and markets the refined products, half of the domestic
consumption goes to power plants and seawater desalination units, while the rest is consumed mainly
by the oil industry itself, followed by the transport sector. Only a small proportion is consumed by
households. Figure 1-22 (right) shows the Kuwait’s daily consumption of crude oil and oil Products in
thousands of equivalent barrels of crude 1994 – 2016. The decline in oil consumption since 2009 was due,
among other factors, to the shift toward the use of more natural gas in power stations and
petrochemical industries. Finally, due to low natural gas production relative to consumption
requirements, Kuwait has been a net importer of natural gas since 2009. In 2016, Kuwait’s total imports
of natural gas reached about 152.3 billion cubic feet, nearly 417 million cubic feet per day. (KNPC
data).
1.13. Industry
In 2016, the industrial sector’s contribution to GDP was 7.2% (current prices) and 5.7% (constant
prices). Since 1994, nearly all manufacturing industries demonstrated some improvement in term
of their contribution to the GDP (see Figure 1-23). Chemicals and chemical products exhibit an
almost two-fold increase in the GDP through the years 2000-2016.
This alone gives chemical industries a special significance. Although growing, recycling has the lowest
GDP contribution compared to other manufacturing activities.
18
Livestock and animal production provide about 38% gross value of agricultural production in Kuwait
(CBS data). Livestock production under Kuwait’s harsh climatic conditions and shortage of good
Figure 1-22: Kuwait’s daily crude oil and dry natural gas production, 1994-2018 (Left).
(Source: Kuwait Petroleum Corporation); Right: Kuwait’s daily crude oil and oil by product consumption, 1994-2018. (Source: Organization of Arab Petroleum Exporting Countries (OAPEC) Data Base)
1.14. Agriculture, Livestock, Fisheries, and
green areas An arid climate and poor soils mean that Kuwait’s
arable area is limited. The Public Authority for
Agriculture Affairs and Fish Resources (PAAF)
records only 18,900 ha as being cropped,
although crops provide 56% of the gross value of
agricultural production in Kuwait (CBS data). In
real terms, the agriculture sector’s contribution to
GDP is very small, 0.53% in 2016 (World Bank
development indicators).
Farming systems are composed of small- and
intermediate holders as well as specialized
agribusinesses focused on growing date palms,
greenhouses, open field vegetables, livestock
production, and dairy/poultry production. Farms
differ in size, productivity, profitability and
marketing potential. Cropping systems are based on
pure stand cultivation; monoculture and irrigation
techniques vary from basin, furrow to micro-
irrigation. Concerns related to yield limitation exist
and are mainly caused by pests and poor crop
management and systems optimization
practices.
Figure 1-23: Contribution of manufacturing activities to GDP in million KD, 2016.
(Source: Central Statistical Bureau)
0
100
200
300
400
500
600
700Fo
od
pro
du
cts
& b
eve
rage
s
Text
ile
Wo
od
&o
f w
oo
d e
xcep
t st
raw
…
Pap
er &
pap
er
pro
du
cts
Pu
blis
hin
g p
rin
tin
g…
Ch
em
ical
& c
hm
eica
l pro
du
cts
Ru
ber
& p
last
ic p
rod
uct
s
No
n-m
etal
ic m
iner
al p
rod
uct
s
Bas
ic m
etal
s
Fab
rica
ted
met
al p
rod
uct
s…
Mac
hin
era
y &
eq
uip
me
nt
Man
ufa
ctu
re o
f fu
rnit
ure
Re
cycl
ing
1994 2000 2010 2016

19
quality fresh water at reasonable cost makes
fodder production and livestock production in
Kuwait difficult. All local livestock production is
subsidized, particularly the dairy industry, and
depends heavily on most animal feed being
imported, which means higher costs of
production, requiring subsidies for most local
livestock products to compete price-wise with
imported products. Grazing is widespread, with
sheep, goats and camels the main livestock
involved (see Table 1-1).
The Public Authority for Agricultural Affairs and Fish Resources (PAAF), was established in 1983 to
manage all type of activities in the agriculture sector and to formulate policies for developing plant,
animal, and fishery resources, including land allocation. In order to support local agricultural
production PAAF heavily subsidizes selected agricultural activities. Table 1-2 summarizes the various
agricultural subsidies provided by the government during the fiscal year of 2015/2016. A portion of
the subsidies is directed towards the
expansion of protected agriculture
production in greenhouses,
encouraging water saving irrigation
technology, and the utilizing treated
wastewater in irrigation.
Over the years, Kuwait’s food
production has been growing
substantially. Figure 1-24 reflects the
growth of the value of such production
for three years (1990, 2000 & 2014)
using the index number of each type of food
production (excluding cereals because of the sharp
increase in its 2014’s value). Kuwait’s crops, which
are mostly grown in greenhouses in Wafra, Abdally,
Jahraa and Sulaibiya, include tomatoes, cucumber,
pepper, okra, green beans, marrow, eggplant,
strawberry, onion, mallow, coriander, peppermint,
melon, parsley, cabbage, lettuce, snake cucumber,
dill, cauliflower, purslane, watermelon and red
radish. Roots and tubers include Potatoes, Radishes
and Root Beets; while vegetables are varied including
onions, and green leafy vegetables. Total value of
crops products has increased threefold from
2006/2007 to 2016/2017.
The country’s key policy objective in agriculture is to
provide for some of the local needs. To enhance the
locally available food, 500 plots of land (see Figure 1-
25), each with 50,000 square meters, were allocated
by PAAF in Al-Abdali, the northeastern town, to support meat and poultry production in particular.
(Source: PAAF)
Table 1–1: Livestock population characteristics,
2013-2014 (Source: Kuwait Central
Statistical
Bureau, Annual Agricultural Statistics)
Livestock type
Total head
(2013-
2014)
Percent change
over 2009-2010
levels
Sheep 628,041 + 41%
Goats 153,391 + 1%
Camels 9,192 + 11%
Table 1–2: Breakdown of agricultural subsidies, 2015-2016
(Source: Public Authority for Agricultural Affairs and Fish
Resources)
Subsidy
Value of Subsidy
(million US$)
Subsidy
share (%)
Subsidy for plant productions 8.2 27%
Subsidy for fodders 15.7 51%
Subsidy for fisheries 0.5 2%
Subsidy for milk and cows 3.9 12%
Subsidy for palm trees 1.8 6%
Other Subsidies 0.5 2%
Total 30.6 100%

20
A sub-project of 200 integrated farms
was also launched aiming to increase
plants, crop production and to
support other agricultural activities
such as sheep farming, fish farming,
poultry and other activities. However,
50 larger plots, each with 170,000
square meters for raising cattle and
milk production are being removed
as the current location obstructs a
proposed railway route.
Since the 1990s overfishing and
environment degradation caused 50%
decline in the total local fisheries
product (Al-Husaini et al., 2015). Fish
products are actually the most
important renewable food resource (fin-fishes and shrimps) with an annual production about 4,500
tonnes, representing only 16% of total demand. Most of the commercial important species are
zobaidy (Pampus argenteus), harmoor (Epinephelus coioides), suboor (Tenualosa ilisha) and newaiby
(Otolithes ruber). Total imported fish products including both fresh and frozen reached 23,285
tonnes in 2012.
Aquaculture practices have been growing in response to the emergence of protected coastal and
marine areas. The reduced access to fishing has been partly offset by fish farming projects. These
projects provide fish and shrimp to local market throughout the year at reasonable prices. Among
these projects is a 10 km2 pilot project of floating fish culture in the Al-Khiran area, with an expected
productivity of nearly 2,000 to 3,000 tonnes of fish annually. The proposed Boubyan Island project
has an expected yield of 3,000 tonnes of fish, 3000 tonnes of shrimp, and 60 tons of marine algae.
Other proposed projects include the cultivation of wild fish in Al-Sulaibia, Al-Wafra and Al-Sabia,
utilizing treated wastewater for fish farming. The proposed 8 km2 Al-Sabia shrimp farm project will
include 300 breeding ponds and two water pumping stations with an expected production capacity
of 2,000 tonnes of shrimp annually. In addition, there is a shrimp reproduction plant with an annual
capacity of six million shrimp larvae.
Aquaculture is relatively new and potential source of fish production in Kuwait. It is currently being
expanded to supplement local depleted landings from capture fisheries. Two types of aquaculture
systems are practiced in Kuwait: (i) culture of Nile tilapia (Oreochromis niloticus) in concrete tanks
using brackish water in agricultural farms, and (ii) culture of marine species such as gilthead bream
(Sparus auratus), European sea bass (Dicentrarchus labrux) and sobaity sea bream (Sparidentex
hasta) in cages located in the Kuwait Bay. Two key events – the mass fish kills in 2001 in the Kuwait
Bay and the Iraq war in 2003 – crippled production. Most of the cages were destroyed as nobody
was allowed to go near the cages due to security reasons during the war.
As for green areas, PAAF is active in establishing parks and gardens as well as projects of planting
trees and greenery on the sides of roads and in public squares. In this regard, there are 134 public
parks, and 635 projects of side road planting extended to nearly 1,700 km long. The landscaping
areas cover about 1.2 million square meters. The projects are divided into 12 sites with an area of 34
thousand acres, in addition to a number of parks such as Al-Salmiya Bolivar, Al-Wafra and Al-Abdali.
(Source: e-Misk)

21
(Source: Kuwait News Agency website)
1.15. Food Security Throughout its modern history, Kuwait has heavily relied on food imports since only a negligible
fraction of food demand can be met by local agriculture. Kuwait produces roughly 1% of its crops
from its arable land, using traditional agriculture practices (Analysis of Hydroponic Agriculture in
Kuwait - Market trend, Growth and Opportunities (2015-2020), December 2017, Mordor
intelligence). Almost all of its fruits and vegetable produce come from hydroponic or horticulture
practices (see Figure 1-26).
Kuwait has always faced a unique set of food security challenges due to its climate, limited arable
land and water scarcity. Full food self-sufficiency, meaning the country producing all its food
requirements, is understood to be an
impractical and unachievable goal with
an expectation of continued reliance
international food trade markets. The
Council of Ministers established a
Ministerial Committee to supervise the
development of a Food Security
Investment Strategy for Kuwait. The
overwhelming conclusion of the
evaluation was that Kuwait currently
enjoys a high level of food security.
Food is readily available and accessible
to all residents and Kuwait ranks
internationally as one of the most food
secure countries thanks to its economic circumstances and government policy.
Kuwait is resource rich, has a large international wealth reserve, easy access to the global food
markets, a generous government food subsidy program and significant strategic reserves of basic
food commodities. Nevertheless, opportunities have been identified for improving efficiency
through the use of incentives and reforms, including the reforms to the system of subsidies,
reduction in food waste and encouraging greater efficiency through competition within the supply
chain.
1.16. Energy
Regarding natural gas, Kuwait had an estimated 1.8 trillion cubic meters of proven natural gas
reserves as of 2015. Kuwait’s reserves are not considered significant relative to global reserves and
this has spurred an extensive drive in natural gas exploration. The utilization of the giant Jurassic
non-associated gas reserves, which was discovered in the northern area of the country had been
delayed by parliamentary opposition since 2006. However, in September 2016, Kuwait awarded
contracts to international companies to enable the start-up of production of gas from these reserves
by 2018. Yet, the $3.6 billion second phase plan of the project is on hold after tenders were
unexpectedly cancelled in late 2017.
Total daily average production of associated and non-associated natural gas increased during 2016 to
1,737 million standard cubic feet per day (MMSCFD) against a target of 1,530 MMSCFD, i.e. higher by
about 14%. In addition, average production of dry (non-associated) gas reached 1272 million
cubic feet per day, i.e. nearly 464.4 billion cubic feet in 2016. In addition, average gas exported to

22
(Source: Ministry of Electricity and Water, Statistical Year
Book 2017: Electrical Energy)
the LPG unit in KNPC amounted to 1625 million standard cubic feet per day (MMSCFD), exceeding the
target of 1465 MMSCFD. On the other hand, KOC has succeeded in reducing gas flaring to 1%, and
strive to achieve less than 1% in line with its strategy. However, despite its efforts, repeated closure
of KNPC Acid Gas Removal Plant had pushed KOC’s gas flaring rate to 1.31%, higher than the
tolerance level of 1.15%.
Regarding electricity, given Kuwait’s harsh climate, high population growth rate, and rapid socio -
economic growth, demand for electricity is steadily increasing to keep pace, particularly during the hot
summer periods. For Kuwait, coping with such multidimensional growth in electricity demand has
proved to be a major challenge with repeated power outages experienced in 7 residential areas during
the hottest month of July 2016 when temperatures exceeded 50°C.
Total installed electric capacity in 2016 was about 18,850 megawatts (MW). Small (18-42 MW) and
medium (100-200 MW) gas turbines account for about 40% of total installed capacity and are usually
used in emergencies or during the time of peak load. Due to the high operational costs and low
thermal efficiency of gas turbines, they are usually kept as standby with a high level of availability.
The remaining electric capacity consists of steam turbines ranging in size from 120 to 300 MW and
combined cycle units (185-280 MW). Natural gas, heavy fuel oil, crude oil and gas oil, are all used as
primary fuels for electric generation depending on boiler design, with priority given to natural gas
relative to its availability. Figure 1-27 presents the development of total power installed capacity in
MW between 1994 and 2016.
Over the period from 2000 to 2015, electricity generation has been increasing by 5.1% on average
per year. (Ali and Alsabbagh, 2018). The Ministry of Electricity and Water (MEW) is solely responsible
for generation, transmission and distribution of power and water in Kuwait. Although the country
has been slow to reform such avital sector, progress is taking place as the government looks to
attract foreign investors. Three major
Public-Private Partnership projects are
expected to be launched soon: the 2.7
GW Al-Zour North Second and third
Project, the three phases of 5.4 GW Al-
Khiran Project and the 3.6 GW Al-
Nwaiseeb Project. Within the vision of
New Kuwait, Kuwait started a three-
phase process, with the goal of
generating a total of 3,070 MW of
renewable energy (15% of the country
total annual consumption) by 2030. The
first phase is comprised of 70 MW
energy park built on a 100-square-
kilometre area in Al-Shigaya, a desert
zone about 100 km west of Kuwait City.
The second and third phases are
projected each to produce 1,500 MW individually. The country determination to increase
investments in the renewable sources of energy, mainly solar and wind has intensified after its
decision to abandon its plan to construct a nuclear plant.
Kuwait ranks fifth in the world in terms of per capita electricity consumption. Between 1971 and
2014, Kuwait’s per capita electricity consumption has been growing by an average annual rate of
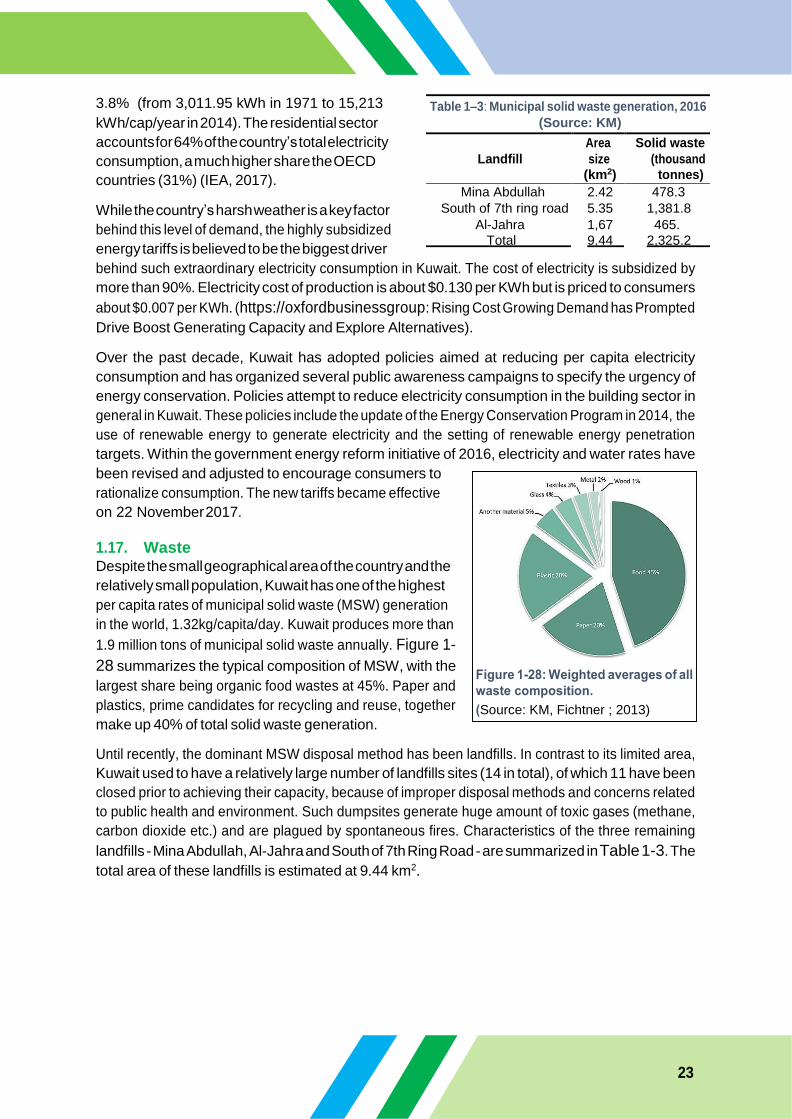
23
Source: KM, Fichtner ; 2013)
3.8% (from 3,011.95 kWh in 1971 to 15,213
kWh/cap/year in 2014). The residential sector
accounts for 64% of the country’s total electricity
consumption, a much higher share the OECD
countries (31%) (IEA, 2017).
While the country’s harsh weather is a key factor
behind this level of demand, the highly subsidized
energy tariffs is believed to be the biggest driver
behind such extraordinary electricity consumption in Kuwait. The cost of electricity is subsidized by
more than 90%. Electricity cost of production is about $0.130 per KWh but is priced to consumers
about $0.007 per KWh. (https://oxfordbusinessgroup: Rising Cost Growing Demand has Prompted
Drive Boost Generating Capacity and Explore Alternatives).
Over the past decade, Kuwait has adopted policies aimed at reducing per capita electricity
consumption and has organized several public awareness campaigns to specify the urgency of
energy conservation. Policies attempt to reduce electricity consumption in the building sector in
general in Kuwait. These policies include the update of the Energy Conservation Program in 2014, the
use of renewable energy to generate electricity and the setting of renewable energy penetration
targets. Within the government energy reform initiative of 2016, electricity and water rates have
been revised and adjusted to encourage consumers to
rationalize consumption. The new tariffs became effective
on 22 November 2017.
1.17. Waste Despite the small geographical area of the country and the
relatively small population, Kuwait has one of the highest
per capita rates of municipal solid waste (MSW) generation
in the world, 1.32kg/capita/day. Kuwait produces more than
1.9 million tons of municipal solid waste annually. Figure 1-
28 summarizes the typical composition of MSW, with the
largest share being organic food wastes at 45%. Paper and
plastics, prime candidates for recycling and reuse, together
make up 40% of total solid waste generation.
Until recently, the dominant MSW disposal method has been landfills. In contrast to its limited area,
Kuwait used to have a relatively large number of landfills sites (14 in total), of which 11 have been
closed prior to achieving their capacity, because of improper disposal methods and concerns related
to public health and environment. Such dumpsites generate huge amount of toxic gases (methane,
carbon dioxide etc.) and are plagued by spontaneous fires. Characteristics of the three remaining
landfills - Mina Abdullah, Al-Jahra and South of 7th Ring Road - are summarized in Table 1-3. The
total area of these landfills is estimated at 9.44 km2.
Table 1–3: Municipal solid waste generation, 2016
(Source: KM)
Landfill
Area
size
(km2)
Solid waste
(thousand
tonnes)
Mina Abdullah 2.42 478.3
South of 7th ring road 5.35 1,381.8
Al-Jahra 1,67 465.
Total 9.44 2,325.2

24
The management of domestic wastewater is the responsibility of the Ministry of Public Works. In
1965, the first sewer system was established in Kuwait, and the first domestic wastewater treatment
plant was commissioned in the 1970, with a capacity of 100,000 m3/day. By 1994, there were 3
established domestic wastewater treatment plants; and to meet the further increase in the rate of
water consumption per person (275 liter/day) more domestic wastewater treatment plants were
built, which make the number reach on total of 7 treatment plants. Table 1-4 lists the domestic
wastewater treatment plants, along with the treatment type, design values and daily inflow.
There are 7 industrial areas, as presented in Figure 1-29, where the majority of industrial units are
located. In the past, most
of these industrial areas
were not connected to the
sewer system, resulting in
the industrial wastewater
effluents discharged
directly to the
environment without
treatment.
In 2010, an industrial
wastewater treatment
plant was established in Al-Wafra area
with a capacity of 8,500 cubic meters
per day, with the possibility of
increasing the capacity to
about 15 thousand cubic meters per
day. With the passing of Environment
Law No. 42 in 2014, as amended by
Law No. 99 in 2015; Article 35
committed all government agencies
and the private sector to treat
industrial wastewaters produced by
their facilities. Accordingly, the Central
Station was designated to receive the
industrial treated wastewater from the
different sectors.
The Ministry of Health is responsible
for the disposal of medical wastes, the treatment of
such wastes through sterilization by autoclave and
final backfilling in the Kuwait Municipality landfill
sites. Most medical wastes are sent to incinerators.
Currently, the Ministry of Health manages three
incinerators as listed in the Table 1-5.
1.18. Transport Kuwait has an extensive, modern and well-maintained network of road infrastructure. In addition,
Kuwait’s most recent Midrange Development Plan includes several ambitious projects that expand and
upgrade the country’s major highways and other means of transport. In fact, the development of
transport infrastructure in general is an essential part of the “New Kuwait” vision. Various transport
key projects are in progress including the expansion of airport facilities, a railway, a metro,
Table 1–4: Domestic wastewater treatment plant characteristics (Source:MPW)
Treatment plant Treatment type Design inflow
(thousand m3/day)
Sulibiyah (Al-Ardeiah) Reverse Osmosis 425 Kabd (Al-Jahra) Tertiary treatment 180
Al-Reqah Tertiary treatment 180 Um-Alhaiman Tertiary treatment 27
Wafrah (not working) Tertiary treatment 4,500 Subah Al-Ahmad Marine city Tertiary treatment 5,000
Khiran City (not functional yet) Tertiary treatment 1,500
Table 1–5: Incinerators of Kuwaiti Ministry of
Health (Source: MOH)
Incinerator
name Online year
Capacity (kg/hour)
Shuaiba-1 2002 500
Kabd-1 2009 500 Shuaiba-2 2014 500
(Source: e-Misk)

25
(Source: e-Misk)
bridges and seaports. In light of the ongoing
technological advancement in the telecommunications
industry which has become a basic part of all
contemporary infrastructure, Kuwait also recognizes
that the term "infrastructure" goes beyond the
traditional concept of land, sea and air transportation.
To achieve a "sophisticated modern transport and
communication infrastructure", the government is
striving to realize five targets: (1) increasing the
capacity of Kuwait’s International Airport; (2)
addressing the domestic traffic problem; (3) developing
new economic and urban center at the Northern part of
the country, (4) maximizing the capacity of ports to
support the transition of Kuwait to a financial and
commercial hub; and (5) modernizing the technologies
of the telecommunications sector and keeping abreast
of the continuous advancement in this field.
Kuwait has an extensive, modern and well-maintained network of road infrastructure. By 2016, the
total length of paved roads exceeded 7,100 km. Yet, despite such great expansion in road capacity,
the pace of increase in the number of vehicles in Kuwait outperforms such expansion. In the same
year, the number of vehicles number had
exceeded 2 million, of which 80% were
private. The rest consists of public and
private trucks, buses and taxis. (Figure
1-30) presents the distribution of
vehicles by type in Kuwait in 2016.
The second pillar of the Mid-Range Plan
which deals with the domestic traffic
problem includes the development of
new roads and ports that link the
Northern part of Kuwait with neighboring
countries, limiting traffic congestion and
involving the private sector in the
construction of the needed
infrastructure. This program includes the
37-km long Sheikh Jaber Al-Ahmad Sea-
Bridge terminals (Figure 1-31), which seeks to increase the efficiency of the transport network,
reduce the traffic congestion and shorten the distance between Kuwait City and Sabiya at the
Northern part of Kuwait Bay. The Bridge which entered its pre-final completion phase includes the
construction of two artificial islands containing buildings for traffic and emergency services, the
authority which monitors the maintains the bridge, a fuel station and a marina, as well as a main
navigation bridge with a height of 23 meters and an opening of 120 meters for the passage of ships.
In addition, the 570 km long railway network project, which aims to increase trade volume and to
facilitate the movement of passengers among GCC countries, will have a positive impact on the
domestic traffic by reducing the need for road transport and reducing pollution resulting from the
(Source: CSB, the annual statistical abstract 2015/2016)

26
(Source: Ministry of Public Works website)
(Source: Kuwait Ports Authority website)
use of vehicles and trucks. The project also aims to encourage the private sector to participate in the
construction and development of the national projects and to benefit from its practical experience,
which has a positive impact on the local economy, especially through the transfer of technology and
knowledge, thus enhancing the efficiency of employees and raising the level of services provided as
well as creating more career
opportunities.
The Metro Transport Systems Project
(Metro Kuwait) aims to link local suburbs
and commercial centers, with a view of
reducing the use of private means of
transport and thus reducing traffic
congestion, number of car accidents,
passenger casualties, and air pollution
resulting from car exhausts; and creating
more than 1,500 job opportunities.
Air Transport. The development of air
transport system includes the increase of
the capacity of the country’s international
airport to 25 million passengers through the construction of new passengers’ facilities using the
highest world specifications, adding new terminals (Figure 1-32), increasing the efficiency and the
capacity of the runway to enable it to receive modern aircraft and the Airbus A380, adapting the
world latest technologies of air navigation and the latest international standards, and adding a new
air control tower serving the third runway and the middle corridor.
Maritime Transport. There are further plans to develop the maritime transport system to maximize
the capacity of the ports to enable it to support the transformation of Kuwait into a regional
financial and commercial hub. At the top of the maritime transport program is the project of
Mubarak Al-Kabeer Port, which seeks to increase trade exchange activities, boost the volume of
regional trade, increase the volume of investments, increase economic resources, raise economic
growth rates, develop the services provided by sea ports, increase their absorptive capacity and
contribute to the reconstruction and development of the new northern urban area. Mubarak Al-
Kabeer port will have a capacity of 24 berths, an ability of receiving outsized ships and a capability to
handle nearly eight million containers. The
project will help in the creation of an
industrial zone and providing thousands of
new job opportunities.
The development of Shuwaikh seaport
(see Figure 1-33) is an essential part of the
program. It aims to increase the efficiency
of the navigation channel in the port to
accommodate larger number of up-to-
date container vessels with deeper
depths, in addition to the enhancement of
safety factor.

27
1.19. Response Measure In the implementation of the commitments of the United Nations Framework Convention on Climate
Change (UNFCCC), the signed international parties have agreed to consider the specific needs
and concerns of developing countries arising from the impact of the execution of response
measures taken by these international parties in combating the climate change.
Therefore, the committed parties, when addressing climate change concerns, shall strive to
minimize adverse economic, social and environmental impacts on other parties, especially
developing countries and parties with exclusionary conditions, and to ensure that their development
programs are not affected by such response measures. This special treatment has been reaffirmed
to the concerned developing countries in the Paris convention (UNFCC, 2015). In effect, Kuwait is
among the designated group of developing countries to be protected from the adverse impact of
these measures.
Indeed, Kuwait is facing a wide range of climate change consequences including desertification,
rising sea level, overheat and loss of biodiversity. Kuwait is also vulnerable to the various response
measures to be taken by the UNFCC committed parties advanced countries.
Carbon Taxes
The Kuwait economy relies heavily on its oil exports, which virtually represent the only source of
government income, and contribute more than half of the country’s GDP. Since the relationship
between climate change and greenhouse gas emissions was reaffirmed in the 1980s, crude oil and
its derivatives, as key sources of emissions became under tough pressures from environmental
concerned policies and procedures in many advanced countries. The idea of carbon taxes have
been embraced by these countries. Such taxes would eventually reduce oil consumption and
encourage the use of clean renewable resources, a trend that would ultimately reduce the income
of oil-exporting countries, including Kuwait.
New Sources of Energy
Additionally, the world has witnessed a shift in the nature and pattern of its dependence on oil
products since the unprecedented rise in oil prices in the first half of the 1970s, where it becomes
less dependent on oil in power generation which has shifted toward the use of alternative fuel such
as nuclear, natural gas and renewable sources. With this shift, most of the world oil consumption
goes now to the transport sector. However, this sector is also threatened by the shift from the use
of oil-based fuels to other substitutes, especially with the recent development of hybrid and electric
cars. Many advanced countries support the spread of such alternative means of transport which
would eventually leads to lower demand on oil.
Investment in Clean Fuels
In response to tightening environmental standards on oil products by advanced countries, Kuwait
has been quick to invest in the production of environmentally friendly oil products through the
largest project in Kuwait’s history - the Clean Fuel Project (15.5 billion U.S. dollar) which includes
the modernization of Mina Al-Ahmadi and Mina Abdullah refineries. Kuwait also retired its Shuaiba
refinery and decided to replace it with Al-Zour refinery, which is specialized in producing fuel that
is compatible with emerging environmental standards in developed countries.
Investment in Other Clean Products
Kuwait has also committed itself to upgrade its petrochemical products by updating the
specifications of these products in order to ensure that they meet the newly required specifications
in advanced markets. Likewise, the Ministry of Commerce and Industry has committed the local

28
manufacturing sectors to comply with the new international standards in the production of their
products.
Energy Production and Consumption
In order to reduce harmful emissions caused by the fuel mix in electricity production in Kuwait, the
Ministry of Electricity and Water has shifted most of its power generation plants from the use of oil
to natural gas. Kuwait has also launched several programs to use renewable energy sources,
especially solar energy. Through intensive media campaigns, Kuwait is encouraging consumers to
rationalize consumption of electricity, water and fuel. Besides, since 2016, the country has moved
towards changing the energy pricing structure.
Investment in Indoor Activities
Climate change forces countries with harsh weather, such as Kuwait, to invest heavily in sheltered
buildings for indoor activities. Examples of such buildings include covered sport arenas,
gymnasium halls, schools, public facilities and markets. In addition to the high construction costs,
these buildings also require high operating costs, efficient air-conditioning systems and greater
consumption of electricity and fuel.
Work Disruption and Delay
Rising temperatures, in the relatively long summer period of Kuwait, that approach or exceed 50
degrees Celsius in many days of July and August, lead to a halt of outdoor activities and works.
Such disruption of work increases the cost of production and delays the completion of projects.
New Development Projects
In compliance with world effort towards lower greenhouse gas emissions, Kuwait has been
adhering to environmental friendly standards in its various new development projects, such as
Sheikh Jaber Causeway project, the new urbanization projects, the new power plants project, etc.
In addition to such impact of response measures on Kuwait’s oil and energy sector, the economy
of Kuwait might be affected by response measures on area like: Consumer goods subject to eco-
labelling and standards; Energy-intensive trade-exposed goods (such as aluminum, iron and steel,
cement, chemicals, and pulp and paper); Air-freighted goods; Tourism; Marine-transported goods;
and Agriculture.
Kuwait also might be influenced by decision
and measures taken several relevant
international organizations as: The World
Trade Organization (WTO); International
originations for standardizations (ISO);
International Civil Aviation Organization
(ICAO); International Maritime Organization
(IMO); and the General Agreement on Tariffs
and Trade (GATT).
Diversification of Economy
Kuwait has a relatively open economy dominated by the oil industry and government sector. It is
one of wealthiest economy in the GCC with per capita GDP of around US$85,659.55 (IMF, 2012).
The country enjoys macroeconomic and financial stability and has very solid financial position
Figure-35 Gross domestic product by economic
activity (b) for the years 2012-2013 (Million KD).
Source: Central Statistical Bureau, National Accounts Statistics of 2016.
Oil Revenues29,969.67
Non-Oil Revenues5,038.81

29
with accumulation of considerable public and external accounts surpluses.
The latest published National Accounts Statistics of 2011 indicated that oil and gas sectors were
still the dominant natural resource form shaping the economic activities in Kuwait, composing
57% of the general output, where as fisheries, agriculture and livestock collectively compromised
only 1%.
1.20. Implementation arrangements The preparation of the Second National Communication (SNC) was participatory in nature and has in
its core objective the establishment of foundational national capacities to prepare subsequent NCs
and other reporting obligations such as the BUR. The national team was selected primarily from
relevant ministries and institutions and with the senior management of the Climate Change section
from KEPA for coordinating the team, some of those expects were members of the negotiating team
whose familiar of climate change and the convention obligations.
The Kuwait Environment Public Authority (KEPA) is the focal point of the United Nation Framework
Convention of Climate Change UNFCCC. The Climate Change Section is a unit of Air Quality
Monitoring Department and is the implementing entity of the UNFCCC in the State of Kuwait. The
two major responsibilities of the
Climate Change Section are as follows:
▪ Leading the negotiating team,
which includes the all the state
agencies and other stakeholders
concerned with climate change;
and
▪ Managing the reporting system
such as Nationally Determined
Contributions (NDC’s), National
Communications (NC’s) &
Biennial Update Reports (BUR’s).
The knowledge developed during the
preparing Kuwait's Initial National
Communication (INC) was utilized to
build up the organizational and technical structure of the SNC & biennial updated reports (BUR). The
capacity was built up by engaging and training key stakeholders, namely KEPA technical staff, public
sector staff, and civil society stakeholders. Key organizations participating in the development of the
SNC are indicated throughout the Acknowledgements section.
A Project Steering Committee (PSC) oversaw the overall coordination and implementation of the
SNC, while the National Climate Change & Ozone Committee provided overall policy and cross-
sectoral guidance. The KEPA executed project activities at the national level and appointed a
National Project Coordination (NPC) who worked under the supervision of a National Project
Director (NPD). A small project management support team was established at KEPA to facilitate
implementation and reporting. Three Task Forces (TF) were established as follows:
▪ National circumstances & other information Task Force (NTF). This task force developed SNC
contents regarding national circumstances, technology needs assessments, research and
systematic observation, and capacity building and institutional framework sector.

30
▪ National GHG Inventory (SNC & BUR) & mitigation Task Force (GTF). This task force
developed SNC contents regarding emissions associated with all sectors of the Kuwaiti
economy (i.e., oil and gas, energy, transport, waste sector, industry, and agriculture sector.
This task force also addressed domestic measurement, reporting and verification (MRV).
▪ Climate Impacts, Vulnerability and Adaptation Task Force (CIVA TF). This task force
developed SNC contents regarding vulnerability of sectors and systems in Kuwait, namely, water
resources, public health, coastal zones, and marine ecosystems. This task force also focused on
climate, dust storms, and Arabian Gulf waters.
Memberships of the various TFs from government institutions and stakeholders were established
based on the technical dictates and expertise requirements of the scopes of work. Each Task Force
Head submitted a report to the NPC, which was followed up by a technical review process, with
subsequent revisions as needed. Figure 1-34 illustrates the organizational structure of the project.
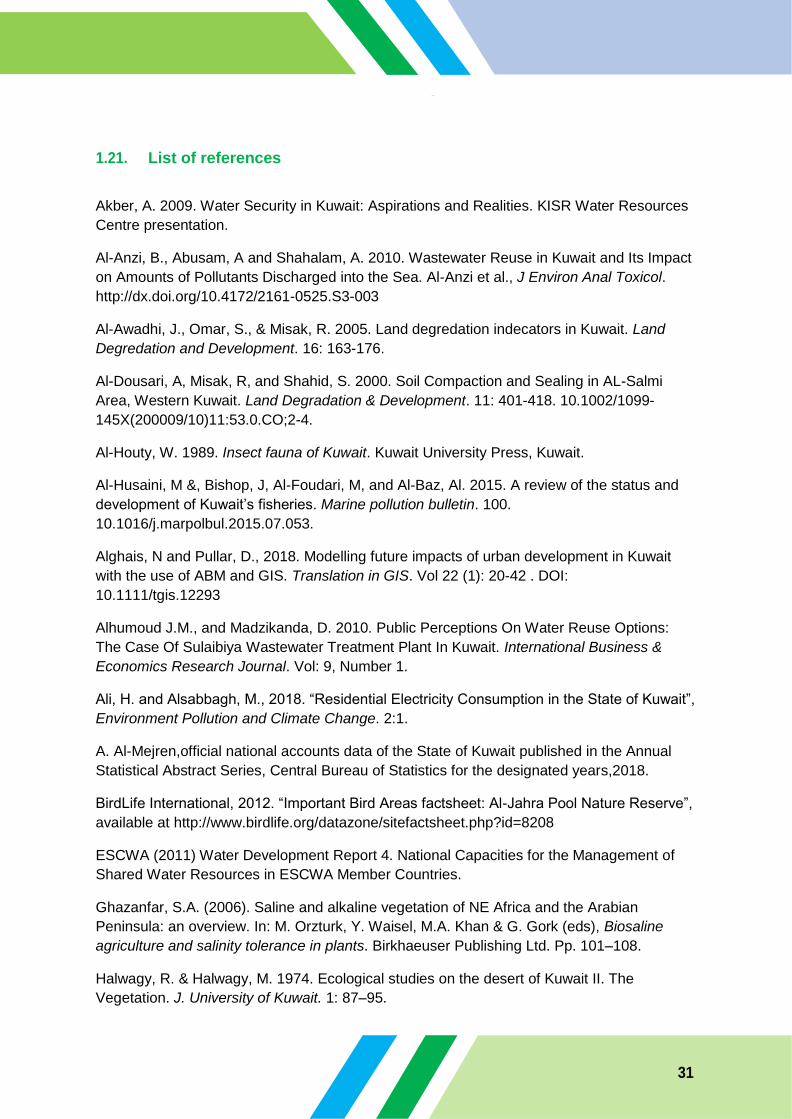
31
1.21. List of references
Akber, A. 2009. Water Security in Kuwait: Aspirations and Realities. KISR Water Resources
Centre presentation.
Al-Anzi, B., Abusam, A and Shahalam, A. 2010. Wastewater Reuse in Kuwait and Its Impact
on Amounts of Pollutants Discharged into the Sea. Al-Anzi et al., J Environ Anal Toxicol.
http://dx.doi.org/10.4172/2161-0525.S3-003
Al-Awadhi, J., Omar, S., & Misak, R. 2005. Land degredation indecators in Kuwait. Land
Degredation and Development. 16: 163-176.
Al-Dousari, A, Misak, R, and Shahid, S. 2000. Soil Compaction and Sealing in AL-Salmi
Area, Western Kuwait. Land Degradation & Development. 11: 401-418. 10.1002/1099-
145X(200009/10)11:53.0.CO;2-4.
Al-Houty, W. 1989. Insect fauna of Kuwait. Kuwait University Press, Kuwait.
Al-Husaini, M &, Bishop, J, Al-Foudari, M, and Al-Baz, Al. 2015. A review of the status and
development of Kuwait’s fisheries. Marine pollution bulletin. 100.
10.1016/j.marpolbul.2015.07.053.
Alghais, N and Pullar, D., 2018. Modelling future impacts of urban development in Kuwait
with the use of ABM and GIS. Translation in GIS. Vol 22 (1): 20-42 . DOI:
10.1111/tgis.12293
Alhumoud J.M., and Madzikanda, D. 2010. Public Perceptions On Water Reuse Options:
The Case Of Sulaibiya Wastewater Treatment Plant In Kuwait. International Business &
Economics Research Journal. Vol: 9, Number 1.
Ali, H. and Alsabbagh, M., 2018. “Residential Electricity Consumption in the State of Kuwait”,
Environment Pollution and Climate Change. 2:1.
A. Al-Mejren,official national accounts data of the State of Kuwait published in the Annual
Statistical Abstract Series, Central Bureau of Statistics for the designated years,2018.
BirdLife International, 2012. “Important Bird Areas factsheet: Al-Jahra Pool Nature Reserve”,
available at http://www.birdlife.org/datazone/sitefactsheet.php?id=8208
ESCWA (2011) Water Development Report 4. National Capacities for the Management of
Shared Water Resources in ESCWA Member Countries.
Ghazanfar, S.A. (2006). Saline and alkaline vegetation of NE Africa and the Arabian
Peninsula: an overview. In: M. Orzturk, Y. Waisel, M.A. Khan & G. Gork (eds), Biosaline
agriculture and salinity tolerance in plants. Birkhaeuser Publishing Ltd. Pp. 101–108.
Halwagy, R. & Halwagy, M. 1974. Ecological studies on the desert of Kuwait II. The
Vegetation. J. University of Kuwait. 1: 87–95.

32
Halwagy, R., Moustafa, A.F. & Kamal, S.M. 1982. On the ecology of the desert vegetation in
Kuwait. J. Arid. Environ. 5: 95–107.
KEPA. 2014. Fifth National Report, Convention on Biodiversity (CBD). Kuwait Environmental
Protection Authority, Kuwait.
Kwarteng, A, Viswanathan, N, Al-Senafy, M, and Rashid, T. 2000. Formation of fresh
ground-water lenses in northern Kuwait. J. of Arid Environments. 46: 137-155.
10.1006/jare.2000.0666.
Mandaville, J.P. 1990. Flora of Eastern Saudi Arabia. Kegan Paul International London and
New York jointly with the National Commission for Wildlife Conservation and Development,
Riyadh, 1990. ISBN 07103‐0371‐8
Misak, R, Al-Awadhi, J, Omar, S,and Shahid, S. 2002. Soil Degradation in Kabd Area,
Southwestern Kuwait City. Land Degradation & Development. 13: 403 - 415.
10.1002/ldr.522.
Omar, S., Misak, R., King, P., Shahid, S.A., Abo-Rizq, H., Grealish, G & Roy, W. 2001.
Mapping the vegetation of Kuwait through reconnaissance soil survey. (2005). J. Arid.
Environments. 48: 341–355.
OMAR, S.A. 1991. Dynamics of range plants following 10 years of protection in arid
rangelands of Kuwait. J of Arid Environments. 21:99–111.
Public Authority For Civil Information (PACI), 2018. Population data available at
www.paci.gov.kw/en
Ramadan, A, and Al-Dousari, A. 2013. Optimization of A KISR-Developed Sand Control
System Using Wind Tunnel Simulations. Progress Report 1. KISR, Kuwait.
Royal Botanical Gardens-Kew, 2010. KNFP/PAAF Restoration Planning for Damaged Lands
in Kuwait – Initial Report. Kuwait National Focal Point. Kuwait.
Shahid SA, Omar SA, Al Ghawas S. 1999. Indicators of desertification in Kuwait and their
possible management. Desertification Control Bulletin. 34: 261–266.
Ward Brown, K, Bouhamra, W, Lamoureux, D, Evans, J.S., and Koutrakis, P. 2008.
Characterization of Particulate Matter for Three Sites in Kuwait, J of the Air & Waste
Management Association,. 58:8, 994-1003, DOI: 10.3155/1047-3289.58.8.994
Zaman S (1997) Effects of rainfall and grazing on vegetation yield and cover of two arid
rangelands in Kuwait. Environmental Conservation, 1997 - cambridge.org.

33
2. GREENHOUSE GAS INVENTORY ................................................................................ 31
2.1. METHODOLOGY ................................................................................................... 31
2.2. TOTAL GHG EMISSIONS ...................................................................................... 31
2.3. GHG EMISSION TRENDS ..................................................................................... 32
2.4. ENERGY ................................................................................................................ 32
2.5. INDUSTRIAL PROCESSES AND PRODUCT USE ............................................... 33
2.6. AGRICULTURE, FORESTRY, AND OTHER LAND USE ............................................. 33
2.7. WASTE .................................................................................................................. 33
2.8. EMISSIONS BY GREENHOUSE GAS TYPE............................................................... 34
2.9. UNCERTAINTY ASSESSMENT .................................................................................. 34
2.10. QUALITY CONTROL ............................................................................................. 35
2.11. KEY CATEGORY ANALYSIS ...................................................................................... 35
2.12. CHALLENGES AND RECOMMENDATIONS ........................................................ 36
2.13. LIST OF REFERENCES ...................................................................................................... 36
List of Tables TABLE 2- 1: TABLE 2-1 PRESENTS TOTAL GHG EMISSIONS AND SINKS FOR THE YEAR 2000. 31 TABLE 2- 2: BREAKDOWN IN ENERGY SECTOR GHG EMISSIONS FOR THE YEAR 2000. 32 TABLE 2- 3: GHG EMISSIONS ASSOCIATED WITH INDUSTRIAL PROCESSES AND PRODUCT USE IN 2000.
33 TABLE 2- 4: GHG EMISSIONS ASSOCIATED WITH AGRICULTURE, FORESTRY, AND OTHER LAND USE IN
2000. 33 TABLE 2- 5: GHG EMISSIONS ASSOCIATED WITH WASTE MANAGEMENT ACTIVITY IN 2000. 34 TABLE 2- 6: KEY CATEGORY ANALYSIS RESULTS. 35
List of Figures FIGURE 2- 1: TOTAL GHG EMISSION TREND, 1994 - 2000, AND PROJECTION THROUGH 2016.
ERROR! BOOKMARK NOT DEFINED.
FIGURE 2- 2: BREAKDOWN IN TOTAL GHG EMISSION TREND, 1994 - 2000, AND PROJECTION THROUGH 2016. 32
FIGURE 2- 3: BREAKDOWN OF GHG EMISSIONS ASSOCIATED WITH ENERGY ACTIVITIES, 2000.
33
FIGURE 2- 4: FIGURE 2-4: BREAKDOWN IN GHG EMISSIONS, 2000 (GG). 35

31
2. Greenhouse Gas Inventory This chapter presents estimates of national anthropogenic greenhouse gas emissions and sinks for
the year 2000. The inventory includes four categories: energy; industrial processes and product use
(IPPU); agriculture, forestry and other land use (AFOLU); and waste. The results presented below
are based on an inventory assessment prepared by Al-Sayegh et al., (2018).
2.1. Methodology The methodology used to develop the inventory is based on the 2006 IPCC Guidelines for National
Greenhouse Gas Inventories and the IPCC Good Practice Guidance and Uncertainty Management in
National Greenhouse Gas Inventories (Good Practice Guidance) prepared by the Intergovernmental
Panel on Climate Change (IPCC).
Reference and sectoral approaches were implemented to estimate GHG emissions in each emission
category. Emissions up to the year 2016 were estimated using the inventory results for the year
2000 using IPCC’s Inventory Software (Version 2.54). The Tier-1 approach of the IPCC guidelines was
utilized in the calculations for all reporting categories.
In the subsections that follow, GHG emissions are reported both in absolute units of carbon dioxide,
methane and nitrogen oxide emissions, as well as in units of CO2-equivalent by applying 100-year
GWPs of 1 for CO2, 21 for CH4, and 310 for nitrogen oxide, as recommended by the IPCC in its Second
Assessment Report. Unless, as noted, default emission factors from the IPCC guidelines have been
used.
2.2. Total GHG Emissions
Table 2-1 presents total GHG emissions and sinks for the year 2000. Total and net GHG emissions in
2000 were 48,683 Gg CO2-equivalent, which includes 46,535 Gg from energy; 873 Gg from industrial
processes and product use; 102 Gg from agriculture, forestry and other land use and 1,170 Gg from
waste. CO2 sequestration in 2000 amounted to 9.2 Gg. Emissions from perfluorocarbons (PFCs),
hydrofluorocarbons (HFCs) and sulfur hexafluoride (SF6) in Kuwait are negligible as the products
containing these gases are not produced in the country.
Table 2- 1: Table 2-1 presents total GHG emissions and sinks for the year 2000.
GHG Sources & Sinks CO2-equiv CO2 CH4 N2O
1 Energy 46,535 46,192 7.5 0.6
2 Industrial processes and product use 873 873 0.0 0.0
2 Agriculture, forestry and other land use 102 -9.2 5.0 0.0
4 Waste 1170 0 54.1 0.11
Total National Emissions 48,683 47,065 66.6 0.71
Net National Emissions 48,683 47,056 66.6 0.71
Energy-related activities accounted for the dominant portion of GHG emissions in Kuwait in 2000.
Approximately 95.6% of all GHG emissions are associated with the combustion of fossil fuels for
electricity production and transport, as well as the release of fugitive emissions from oil and gas
operations. Emissions from waste management accounted for 2.4% of all GHG emissions, followed by
IPPU and AFOLU categories which accounted for about 1.8% and 0.2% of total emissions,
respectively.
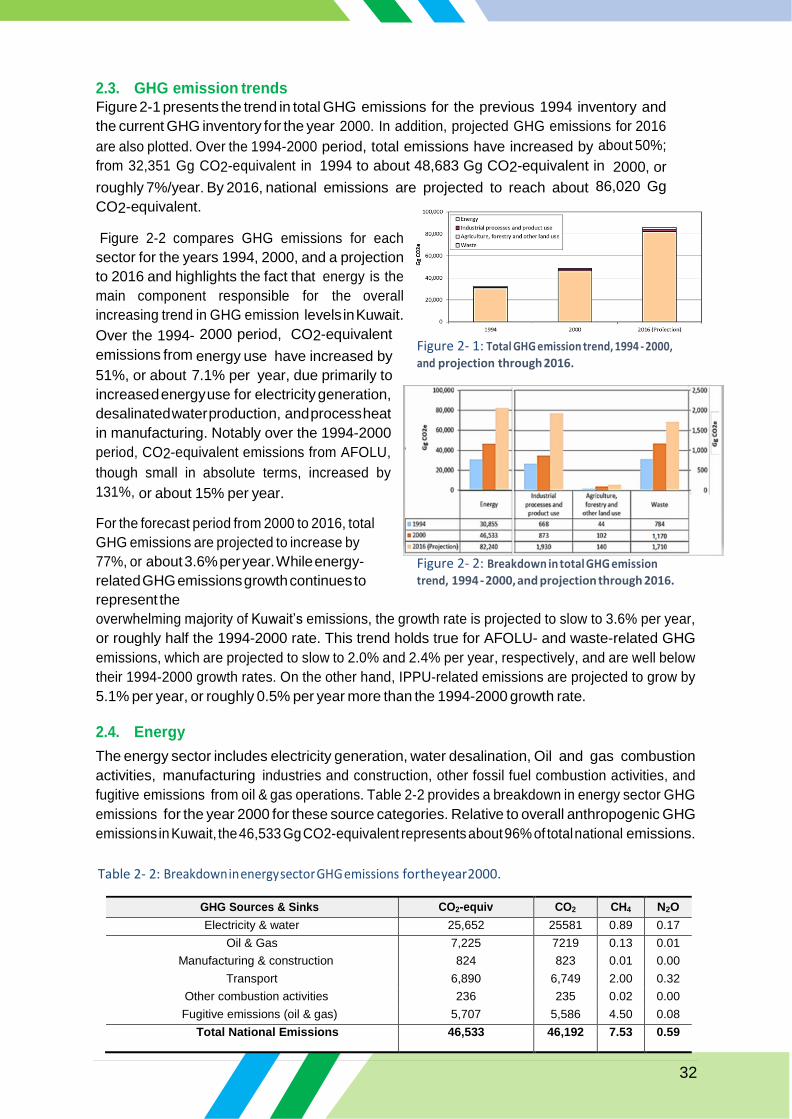
32
2.3. GHG emission trends Figure 2-1 presents the trend in total GHG emissions for the previous 1994 inventory and
the current GHG inventory for the year 2000. In addition, projected GHG emissions for 2016
are also plotted. Over the 1994-2000 period, total emissions have increased by about 50%;
from 32,351 Gg CO2-equivalent in 1994 to about 48,683 Gg CO2-equivalent in 2000, or
roughly 7%/year. By 2016, national emissions are projected to reach about 86,020 Gg
CO2-equivalent.
Figure 2-2 compares GHG emissions for each
sector for the years 1994, 2000, and a projection
to 2016 and highlights the fact that energy is the
main component responsible for the overall
increasing trend in GHG emission levels in Kuwait.
Over the 1994- 2000 period, CO2-equivalent
emissions from energy use have increased by
51%, or about 7.1% per year, due primarily to
increased energy use for electricity generation,
desalinated water production, and process heat
in manufacturing. Notably over the 1994-2000
period, CO2-equivalent emissions from AFOLU,
though small in absolute terms, increased by
131%, or about 15% per year.
For the forecast period from 2000 to 2016, total
GHG emissions are projected to increase by
77%, or about 3.6% per year. While energy-
related GHG emissions growth continues to
represent the
overwhelming majority of Kuwait’s emissions, the growth rate is projected to slow to 3.6% per year,
or roughly half the 1994-2000 rate. This trend holds true for AFOLU- and waste-related GHG
emissions, which are projected to slow to 2.0% and 2.4% per year, respectively, and are well below
their 1994-2000 growth rates. On the other hand, IPPU-related emissions are projected to grow by
5.1% per year, or roughly 0.5% per year more than the 1994-2000 growth rate.
2.4. Energy
The energy sector includes electricity generation, water desalination, Oil and gas combustion
activities, manufacturing industries and construction, other fossil fuel combustion activities, and
fugitive emissions from oil & gas operations. Table 2-2 provides a breakdown in energy sector GHG
emissions for the year 2000 for these source categories. Relative to overall anthropogenic GHG
emissions in Kuwait, the 46,533 Gg CO2-equivalent represents about 96% of total national emissions.
Table 2- 2: Breakdown in energy sector GHG emissions for the year 2000.
GHG Sources & Sinks CO2-equiv CO2 CH4 N2O
Electricity & water 25,652 25581 0.89 0.17
Oil & Gas 7,225 7219 0.13 0.01
Manufacturing & construction 824 823 0.01 0.00
Transport 6,890 6,749 2.00 0.32
Other combustion activities 236 235 0.02 0.00
Fugitive emissions (oil & gas) 5,707 5,586 4.50 0.08
Total National Emissions 46,533 46,192 7.53 0.59
Figure 2- 2: Breakdown in total GHG emission
trend, 1994 - 2000, and projection through 2016.
Figure 2- 1: Total GHG emission trend, 1994 - 2000,
and projection through 2016.

33
Figure 2-3 illustrates the breakdown in energy-related GHG emissions in 2000 by activity. Emissions
from electricity and desalinated water production are primarily associated with the combustion
of natural gas and oil products showed the highest share of GHG emissions, about 71%. Transport
activities are based overwhelmingly on the use of gasoline and diesel oil and accounted for about
15% of total emissions from energy-consuming activities. Fugitive emissions of methane, a gas that
has a high global warming potential, accounted for about 12% of
all GHG emissions in the energy industries sector Other
combustion activities and
manufacturing/construction accounted for the
remaining 3%.
2.5. Industrial Processes and Product Use
Table 2-3 summarizes GHG emissions associated with
industrial processes and product use in 2000.
Industrial processes are the third largest emitter of
anthropogenic GHG emissions in Kuwait, accounting
for 873 Gg of CO2– equivalent, or about 2.2% of
national CO2–equivalent emissions in 2000.
Figure 2- 3: Breakdown of GHG emissions
associated with energy activities, 2000.
The mineral and chemical industries represent the sole
source of emissions from industrial processes and
product use. For the mineral industry, GHG emissions are associated with cement, lime and glass
production and account for about 75% of total sectoral GHG emissions. For the chemical industry,
emissions are solely associated with ammonia production.
Table 2- 3: GHG emissions associated with industrial processes and product use in 2000.
GHG Sources & Sinks CO2-equiv CO2 CH4 N2O
Mineral industry 653 653 0.00 0.00
Chemical industry 220 220 0.00 0.00
Total National Emissions 873 873 0.00 0.00
2.6. Agriculture, forestry, and other land use
Table 2-4 summarizes GHG emissions associated with agriculture, forestry, and other land use in
2000. Agricultural practices are the smallest source of anthropogenic GHG emissions in Kuwait,
accounting for net national emissions on only 102 Gg of CO2–equivalent, or about 0.2% of net
national CO2–equivalent emissions in 2000. Most of the emissions from AFOLU activities are
associated with methane production from livestock. Kuwait’s extensive managed green areas acted
as a CO2 that resulted in a sequestration of 11 Gg CO2-equivalent.
Table 2- 4: GHG emissions associated with agriculture, forestry, and other land use in 2000.
GHG Sources & Sinks CO2-equiv CO2 CH4 N2O
Livestock 107 0 5.0 0.01
Land -11 -11 0.0 0.00
Aggregate & non-CO2 sources on land 5 2 0.0 0.01
Total National Emissions 112 2 5.0 0.02
Total Net Emissions 102 -9 5.0 0.02

34
2.7. Waste
Table 2-5 summarizes GHG emissions associated with waste management activity in 2000. Relative
to overall anthropogenic GHG emissions, the 1,205 Gg CO2-equivalent represented about 2.5% of
total national emissions. Waste-related GHG emissions are associated with solid waste disposal, and
wastewater treatment and discharge.
Table 2- 5: GHG emissions associated with waste management activity in 2000.
GHG Sources & Sinks CO2-equiv CO2 CH4 N2O
Solid waste disposal 1,171 0 54.1 0.11
Wastewater treatment & discharge 34 0 0.0 0.11
Total National Emissions 1,205 0 54.1 0.22
2.8. Emissions by Greenhouse Gas Type
The following bullets provide an overview of GHG emission totals by all GHG types for the year 2000.
▪ CO2: Net CO2 emissions were estimated to be 47,056 Gg, or 96.6% of Kuwait’s total
greenhouse emissions in the year 2000. Figure 2-4a summarizes the contribution
associated with CO2 emissions at both the sector and activity levels.
▪ CH4: Methane had the second largest share of greenhouse gas emissions. Total CH4
emissions were estimated to be about 66.6 Gg, or about 2.9% of Kuwait’s total greenhouse
emissions on a CO2-equivalent basis. Figure 2-4b summarizes the contribution associated with
CH4 emissions at both the sector and activity levels.
▪ N2O: Nitrous oxide emissions were very small compared to other GHGs. Total N2O
emissions were estimated to be only about 0.8 Gg, or about 0.5% of Kuwait’s total
greenhouse emissions on a CO2-equivalent basis. Figure 2-4c summarizes the contribution
associated with N2O emissions at both the sector and activity levels.
2.9. Uncertainty assessment
Emissions/removals estimates are based on three key factors: methodology, modeling, and input
data and assumptions, While each of these three contribute to uncertainty levels, they were kept to
low levels as possible. There is minimal uncertainty associated with methodology as appropriate
QA/QC procedures and the IPCC Software was used as the main tool in the inventory. On the other
hand, there is uncertainty associated with input data and assumptions (i.e., emission factors and
activity data). Default emission factors provided in the 2006 IPCC Guideline were adopted, thus
reflecting the uncertainty embedded in these estimates.
For Kuwait, CO2 represents about 97% of GHG emissions and are associated with the categories
listed previously in table 2-2. Hence, the overwhelming majority of any uncertainty in the inventory
will be associated with these categories. Using the results from Table 7a – Uncertainties generated as
part of the IPCC Software Report, all of the combined uncertainty levels are below 10%. This
suggests a high level of confidence in the inventory results.

35
2.10. Quality Control QC/QA Program was implemented in this
inventory according to IPCC good practice
guidance. Specifically, the 12 QC activities
called for in Table 8.1 of the guidance
document were followed without exception
where applicable.
2.11. Key Category Analysis The analysis was performed using Approach 1
recommended in 2006 IPCC Guidelines for
National Greenhouse Gas Inventories Vol.4
Ch.4. Key categories were identified using a
pre-determined cumulative emissions
threshold and were those that, when summed
together in descending order of magnitude,
add up to 95% of the total level. Given Kuwait's
circumstances as major oil producing and
exporting country which leads to uniformity of
emissions in Kuwait over the years (energy
sector was always the leading sector in
economy and therefore in GHG emissions), the
analysis was limited to level assessment
excluding trend assessment. Analysis was
also limited to CO2 since the latter represents
97% of total GHG emissions. Table 2-6
summarizes the results of key category
analysis.
Figure 2- 4: Figure 2-4: Breakdown in GHG emissions, 2000 (Gg).
Table 2- 6: Key category analysis results.
IPCC Category
GHG
Emissions
in 2000
(Gg)
Level
assessment
(%)
Cumulative Total of
level assessment (%)
Electricity & Water
CO2 -
equiv
25,652 53 -
Oil & Gas 7,225 15 68
Transport 6,890 14 82
Fugitives from Oil & Gas 5707 12 94
Waste 1170 2.4 96.4
Total National Emissions 46644 1 96.4
Methane emissions

36
2.12. Challenges and Recommendations
The primary challenge to the development of the current GHG inventory is data-related, namely
availability, accuracy, and consistency. These challenges are rooted in administrative and
institutional barriers that impede the application of locally available technical capacity to collect,
manage, and analyze pertinent data. Addressing these challenges should address the following:
▪ Establish and enforce a national statistical data system, which logs operational and
production data and information, in governmental and private organizations.
▪ Establish strategic collaboration agreements between KEPA and public organizations to ensure
a sustainable supply of related data.
▪ Given the above two points, a national emissions inventory system is to be developed with key
sectors in the country.
▪ Hold periodic workshops for public organizations for training and educating critical
authorities with the IPCC emissions inventory system.
▪ Call for and support the conduction of a national project to determine local emission factors
related to the indigenous resources.
▪ Establish a GHG inventory committee with high-level representation from key
ministries/institutions, having clear oversight and coordination authority.
▪ Develop an integrated database of relevant information including annual statistical
abstracts and annual reports from specific entities.

37
2.13. List of references
Kuwait Environment Public Authority, Kuwait, 2018.
IPCC, 2000. “Good Practice Guidance and Uncertainty Management in National Greenhouse
Gas Inventories”.
IPCC, 2006. “Guidelines for National Greenhouse Gas Inventories”.

38
3. VULNERABILITY AND ADAPTATION .................................................................................... 38
3.1. REGIONAL ATMOSPHERIC CHANGE ........................................................................................ 40
3.1.1. Background ................................................................................................................... 40 3.1.2. Approach ....................................................................................................................... 40
3.1.3. Results ........................................................................................................................... 40 3.1.4. Climate policy implications ............................................................................................ 42
3.2. ARABIAN GULF CHANGE ......................................................................................................... 42
3.2.1. Background ................................................................................................................... 42
3.2.2. Approach ....................................................................................................................... 43 3.2.3. Results ........................................................................................................................... 43
3.2.4. Climate policy implications ............................................................................................ 44
3.3. COASTAL ZONES ............................................................................................................................ 44
3.3.1. Background ................................................................................................................... 44 3.3.2. Approach ....................................................................................................................... 46
3.3.3. Results ........................................................................................................................... 46
3.3.4. Climate policy implications ............................................................................................ 48 3.4. WATER RESOURCES ....................................................................................................................... 49
3.4.1. Background ................................................................................................................... 49 3.4.2. Approach ....................................................................................................................... 51
3.4.3. Results ........................................................................................................................... 53 3.4.4. Climate policy implications ............................................................................................ 54
3.5. MARINE ECOSYSTEMS ............................................................................................................ 54
3.5.1. Background ................................................................................................................... 54 3.5.2. Approach ....................................................................................................................... 56 3.5.3. Results ........................................................................................................................... 56 3.5.4. Climate policy implications ............................................................................................ 57
3.6. PUBLIC HEALTH ...................................................................................................................... 57
3.6.1. Background ................................................................................................................... 57 3.6.2. Current coping strategies .............................................................................................. 58
3.6.3. Climate policy implications ............................................................................................ 59 3.7. LIST OF REFERENCES..................................................................................................................................... 60

39 | P a g e
List of Tables Table 3–1: List of GCMs/RCMs in the CORDEX-MENA initiative whose outputs were used to establish
Kuwait’s future climate 41
Table 3–2: Parameter characterizations for coastal areas together with vulnerability rankings 47
Table 3–3: Inundation results, by coastal vulnerability index bin 47
Table 3–4: Policies considered in the analysis 52
Table 3–5: Summary of Costs and benefits associated with the implementation of the policies
Table 3–7: Actions implemented to mitigate health impacts of climate change 59
List of Figures Figure 3-1: Spatial domain for the CORDEX-MENA region 40
Figure 3-2: Annual average projected change in temperature under RCP4.5 (left) and RCP8.5 (right) for
the 2071-2100 period (Sources: Coordinated Regional Climate Downscaling
Experiment (CORDEX) -MENA; International Center for Biosaline Agriculture (ICBA) 41
Figure 3-3: Annual average projected change in rainfall under RCP4.5 (left) and RCP8.5 (right) for the
2071-2100 period (Sources: CORDEX-MENA; ICBA) 42
Figure 3-4: Key locations for which physical properties of Arabian Gulf water are reported (Source:
adapted from Mahmoud and Jose, 2017) 43
Figure 3-5: Left: Average monthly sea surface temperature at Kubbar and Qaru Islands, 2010- 2017
(Source: Kuwait Meteorological Department); Right: Average annual sea surface
temperature in Kuwait Bay, 1985-2002 (Source: Al-Rashidi, et al., 2009) 43
Figure 3-6: Average monthly sea surface salinity at Mudrayah Island, 2014-2016 (Source: Al- Rashidi,
et al., 2009) 44
Figure 3-7: Average monthly sea surface salinity at Mudrayah Island, 2014-2016 (Source: Al- Rashidi,
et al., 2009) 44
Figure 3-8: Kuwait’s main zones along shoreline 45
Figure 3-9: Main elements of the coastal zone vulnerability assessment 45
Figure 3-10: Inundated areas for Boubyan Island (left) and the southern area of Kuwait Bay (right) 48
Figure 3-11: Inundated areas for Shuaibah Port and Al-Khairan recreational area 48
Figure 3-12: Water use profile in Kuwait (Source: MEW) 50
Figure 3-13: Kuwait groundwater use, 2006-2016 (Source: Central Statistical Bureau
(CSB,2018)................................................................................................................................... 50
FFigure 3-14: Kuwait desalinated water production and consumption, 2005-2016 (Source: MEW,
2015) ............................................................................................................................... 51
Figure 3-15: Kuwait wastewater generation, 2001-2014 (Source: Analysis on Reclamation and Reuse of
Wastewater in Kuwait, Aleisa and Shayji,KU;2017) .................................................................. 51
Figure 3-16: Main elements of the water resource vulnerability assessment ................................................... 51
Figure 3-17: Kuwait’s water supply/demand system, as modeled in WEAP (Source: AlHarbi, et
al., 2018) 52
Figure 3-18: Examples of bleached coral species from Kuwait’s coral reefs (Source: Alhazeem,
et al., 2018) 55
Figure 3-19: Change in coral reef area over time in Kubbar, Umm Al Maradim, and Qaruh (Source:
Alhazeem, et al., 2018) ........................................................................................................... 56

40
3. Vulnerability and Adaptation
3.1. Regional atmospheric change This chapter presents an overview of key sectors that are highly vulnerable to climate change in
Kuwait, namely water resources, coastal zones, and agriculture. Coupled with the assessment of
vulnerability in each of these sectors are a set of recommended adaptation strategies for which
international support will be critical.
3.1.1. Background Outputs of regional climate experiments undertaken as part of the COordinated Regional Climate
Downscaling EXperiment (CORDEX) were used as the basis for projecting Kuwait’s future climate.
The aim of the CORDEX initiative is to better understand relevant regional and local climate
phenomena, their variability and future changes, through downscaling of coarse resolution General
Circulation Models (GCMs) that were part of the Coupled Model Intercomparison Project - Phase 5
(CMIP5), as well as to evaluate and improve regional climate models and dynamical downscaling
techniques. CORDEX is a global initiative where scientists from 14 distinct regions of the world work
together to downscale climate data to high resolution spatial scales that better capture local
topographical features and meteorological characteristics.
3.1.2. Approach One of the regions in this framework is the CORDEX-MENA
domain which includes the whole Arabian Peninsula as well as
North Africa and southern Europe (see Figure 3-1). Outputs
from the CORDEX-MENA domain were obtained to develop an
understanding of Kuwait’s future climate, with a focus on the
change in annual average temperature and rainfall the period
2071-2100 relative to the historical climate.
Information was available for an ensemble of GCMs that were
downscaled using a set of Regional Climate Models (RCMs)
from which average values were computed. Two
Representative Concentration Pathways (RCPs), RCP4.5 and
RCP8.5 were considered for projections up through the year
2100. The spatial resolution of the RCMs was about 50 km. A
total of 11 GCM-RCM combinations were considered. Table 3-1
provides a list of the GCMs and RCMs whose outputs were used in establishing Kuwait’s future
climate.
3.1.3. Results The change is average annual temperature for Kuwait over the period 2071-2100 is shown in Figure
3-2 for RCP4.5 (left) and RCP8.5 (right). Temperature increases are projected to be evenly
distributed across the inner portions of Kuwait, on the order of about 2.5° to 2.7°C higher than the
historical average under RCP4.5 and on the order of about 4.3° to 4.5°C higher than the historical
average under RCP8.5. Future increases are slightly smaller over coastal areas, ranging from roughly
1.7° to 1.9°C higher than the historical average under RCP4.5 and on the order of about 3.5° to 3.7°C
higher under RCP8.5.

41
Table 3–1: List of GCMs/RCMs in the CORDEX-MENA initiative whose outputs were used to establish Kuwait’s
future climate
RCM name (acronym)
GCM name (acronym)
Aire Limitée
Adaptation
dynamique
Développement
InterNational
(ALADIN)
Consortium
for Small
Scale
Modeling -
Climate
Limited-area
Modelling-
Community
(CCLM4-21)
Rossby Centre
regional
Atmospheric
model (RCA4)
Regional
Climate
Model
(RegCM4-4)
REgional
MOdel
(REMO2009)
Weather
Research
Forecasting
model
(WRF351)
Weather
Research
Forecasting
model
(WRF36)
Community Earth System Model, Version 1.0 ✓ ✓
(CESM1)
Centro Euro-Mediterraneo sui Cambiamenti
Climatici Climate Model (CMCC-CM)
Centre National de Recherches ✓ ✓
Météorologiques (CNRM-CM5)
National Oceanic and Atmospheric
Administration Geophysical Fluid Dynamics ✓ ✓
Laboratory model (GFDL-ESM2M)
Coupled earth system model being used by
the Met Office Hadley Centre for the CMIP5 ✓
Centennial simulation (HadGEM2-ES)
Max Planck Institute for Meteorology Earth
System Model, LR-r1 configuration (MPI- ✓
ESM-LR-r1)
Max Planck Institute for Meteorology Earth
System Model, LR configuration (MPI-ESM- ✓ ✓
LR)
Average future rainfall change for Kuwait over the period 2071-2100 is shown in Figure 3-3 for
RCP4.5 (left) and RCP8.5 (right). Under RCP4.5, rainfall decreases are projected to be evenly
distributed over the northern portions of Kuwait, on the order of about 3% to 6% lower than the
historical average, while the southern portions of the country are projected to experience even
steeper reductions, roughly between 15% and 18% lower than the historical average. Under RCP8.5,
rainfall decreases are projected to be evenly distributed over the eastern portions of Kuwait, on the
order of about 6% to 9% lower than the historical average, while the western portions of the country
✓

42
are projected to experience even steeper reductions, roughly between 15% and 18% lower than the
historical average.
3.1.4. Climate policy implications The above findings point to several promising areas of future activity. Specifically, the following
research areas are considered high priorities that could be pursued within the CORDEX-MENA
initiative or independently within Kuwait.
▪ Narrowing the spatial domain. The current CORDEX-MENA spatial domain is quite
extensive. A new domain focused solely on the Arabian Peninsula, pursued in coordination
with relevant organizations in the region, would be preferable;
▪ Projecting tropical storm frequency. Given the potential for changes in the frequency,
intensity, and pathway of tropical storms originating in the Indian Ocean, additional model runs
should seek to capture impacts of sea surface temperatures on cyclones.
▪ Sandstorm/dust modeling. Given the importance of dust, it would be valuable to explore how a
changing climate might impact dust formation, transport and deposition in the region.
3.2. Arabian Gulf change Observed changes in the physical and chemical properties of Arabian Gulf waters adjacent to Kuwait
were reviewed and synthesized in order to develop a baseline understanding of recent changes in
the Gulf due to increasing GHG concentrations (Alhazeem, et al., 2018).
3.2.1. Background The Arabian Gulf is surrounded by a hyper-arid environment characterized by high air and sea
temperatures, high evaporation rates, and low annual rainfall (Alhazeem, 2007; Riegl and Purkis,
2012). Aside from the Shatt Al-Arab waterway in Iraq and some small Iranian rivers, there is no
freshwater inflow to the Gulf. This contributes to naturally high salinity levels which are further
exacerbated by highly saline brine discharges associated with many seawater desalination plants in
the region.

2002 (Source: Al-Rashidi, et al., 2009)
3.2.2. Approach Trends in seawater temperature, salinity, and pH were
examined based on local marine station data as well as
publicly available satellite data. Available local marine data
covering the period since 2011 were obtained from the
Meteorological Department within the Directorate General of
Civil Aviation, which oversees marine data gathering at eight
marine stations in Arabian Gulf waters. Satellite data from
1985 are from NOAA’s Advanced Very High Resolution
Radiometric (AVHRR) satellite. Locations of Kuwait Bay,
Kubbar Island, Qaru Island, and Umm Mudayrah Island for
which seawater trends are reported are shown in Figure 3-4.
Brief descriptions of these areas are provided in the bullets
below.
▪ Kuwait Bay. This is a sheltered and a highly productive
marine ecosystem where water temperature and
salinity are higher than in open waters (Al-Yamani et al.,
2004). Water depth is shallow, around 5 meters.
The Bay is high in turbidity and has a very has slow counter-clockwise current due to the nature
of semi-closed system (Al-Rashidi et al., 2009; Al-Mutairi et al., 2014).
▪ Open waters of northern Arabian Gulf. The marine environment surrounding Kubbar Island,
Qaro Island, Umm Mudrayah Island and other northern Gulf areas displays very strong seasonal
oscillations, characterized by a strong stratification of temperature and salinity during summer
and a fairly mixed vertical profile during winter months (Thoppil & Hogan, 2010). This area is
characterized by intense evaporation rates and complex circulation processes.
3.2.3. Results Historical monthly sea surface temperatures (SST) in the Arabian Gulf show a wide range. Average
SSTs are highest in August and lowest in January, as illustrated in Figure 3-5 (left) for Kubar and Qaru
islands for the period 2010 through 2017. Annually, the average SST for these locations is about
26.3°C. While similar seasonal trends prevail for Kuwait Bay, there has been a statistically significant
increase in SST over the period 1985-2002 (see Figure 3-5, right), as derived from satellite data. SST
has steadily increased at a rate of 0.6 (±0.3)°C/decade, a trend three times greater than the
Figure 3-4: Key locations for which
physical properties of Arabian Gulf
water are reported (Source: adapted
from Mahmoud and Jose, 2017)

44
concurrent global average (Al-Rashidi, et al., 2009). It is
estimated that about half of this increase can be attributed
to factors that are global in nature, rather than regional or
local.
Historical monthly sea surface salinity (SSS) in Arabian Gulf
waters around Kuwait show little variation throughout the
year. Average SSS levels are illustrated in Figure 3-6 for
Umm Mudrayah Island for the period 2014 through 2016,
based on marine station data. Average recorded salinity
levels are about 40 parts per thousand (ppt) for each
month. This is roughly the midpoint of average salinity
levels for Kuwait’s Arabian Gulf waters which range from
about 38.6 to 42.4 ppt (Alhazeem, et al., 2018).
The Arabian Gulf is a major aquatic sink in the region for sequestering atmospheric CO2. This has led
to acidification of the marine environment, with average pH levels over the 2006-2016 period
ranging from 8.3 to 8.5. There are notable interannual pH trends for various marine locations around
the southern end of Kuwait Bay, as illustrated in Figure
3-7.
3.2.4. Climate policy implications The above findings point to several challenges inherent
to of climate change policymaking in Kuwait. While
historical trends in sea surface temperature, sea
surface salinity, and pH have been established, the
actual response of these physical and chemical
parameters to future increases in atmospheric CO2
concentrations remains poorly understood at this time.
The next step is to undertake regional ocean modeling
of the northern Arabian Gulf system to better
understand how these waters will be affected under
future climate change.
3.3. Coastal zones Rising sea levels pose threats of wetland flooding, aquifer and agricultural soil contamination,
destructive erosion and lost habitat for fish, birds, and plants. Sea level rise also poses a threat to the
built environment in the form of Arabian Gulf waters reaching further inland, particularly under high
tide conditions and especially when combined with storm surge associated with extreme storm
events. This section summaries the results of a study to assess the risks to urban livelihoods and
infrastructure from sea level rise along the entire coastline (Al-Sahli, et al., 2018).
3.3.1. Background Kuwait’s coastal zone consists of two distinct regions (see Figure 3-8). The northern region extends
from the Kuwait-Iraq border to the northern coast of Kuwait Bay. This area is largely devoid of
infrastructure, although some large projects have recently started, such as Mubarak Al-Kabeer Port
on Boubyan Island (Al-Gabandi, 2011; Baby, 2014). The southern region extends from the western
and southern coast of Kuwait Bay to the Kuwait-Saudi Arabia border. This area is highly urbanized

45
and is where most of Kuwait’s economic
activity and infrastructure are concentrated,
mostly within 20 km of the coastline.
The total length of the Kuwait coastline is
about 500 km including the islands (Baby,
2014). The southern coastal area of Kuwait
Bay hosts Kuwait City, the capital, and the
main commercial port, Shuwaikh Port. The
southern coast includes residential,
commercial and recreational areas, power
plants, and desalination stations (Al Bakri and
Kittaneh, 1998). Artificial sandy beaches,
accounting for about 5% of the shoreline,
have been developed in recreational areas.
Other key features of Kuwait’s coastal zones
are summarized in the bullets below.
▪ Geomorphology: Kuwait’s coastal
zones overlie an isostatically stable region (Förster et al. 2009; Lokier et al.2015; Stevens et al.
2014). Shorelines can be grouped into six classes based on morphosedimentary patterns: Soft
mud tidal flats, sandy-rocky tidal flats, coral reefs,
artificial sandy beaches, and oolitic limestone beaches. The soft mud
tidal flats are found around Boubyan Island, Ras Al-Subiya tidal channel,
Kuwait Bay, and the Al-Khairan area. Sand beaches extend on the south
coast from Ras Al Ardh to Ras Az-Zor, while oolitic limestone beaches
are found south of Ras Az-Zor (Abou‐Seida and Al‐Sarawi, 1990).
Sandy-rocky tidal flats are found on the southwestern coast of Kuwait
Bay, the southern coast of Boubyan Island, and the Ras Al-Subiya
headland.
▪ Biodiversity: Kuwait’s coastal zones are rich in biodiversity. Subkhas (i.e.,
coastal salt marshes) along the northern coast are productive
ecosystems supporting numerous plant species and other organisms
(El-Ghareeb et al., 2006). Coral reefs in southern offshore islands of
Kuwait are unique environments that support various trophic levels.
Various migrating bird species are found on the islands during winter
and summer seasons, supported by rich foraging areas within the
intertidal zones, while other bird species inhabit the islands for
breeding (Al-Yamani et al. 2004). Many marine organisms ranging
from autotrophic species, such as flagellates and diatoms, to higher
trophic level species, such as mollusks and demersal fishes in habit the
intertidal ecosystem.
▪ Tides and waves: Kuwait’s Tides are generally mixed semi-diurnal
with a mean range of approximately 3 meters. The tidal range alomg the
north coast varies from 3.5 to 4.0 meters, whereas the average tidal
range along the south coast is about 1.8 m. The tidal range height
significantly depends on wind direction and coast orientation
Figure 3-9: Main
elements of the coastal
zone vulnerability
assessment
Coastal areas with
concentration of
infrastructure and
economic activity
Data collection
satellite imagery)
characterization)
Data analysis
vulnerability index)
Mapping
by coastal vulnerability index
results)

46
(Batista, et al. 2004; Paul & Ismail, 2012; Quinn et al. 2012). The dominant northwesterly winds
contribute in decreasing tidal heights while secondary southeasterly winds rise the tidal height
(Al-Hasem, 2002). Waves and longshore currents have generally limited influence on north
coast and relatively strong influence on south coast (Abou‐Seida & Al‐ Sarawi, 1990).
▪ Intertidal zones: The intertidal zone along Kuwait coast exhibits two distinct geographic patterns.
The intertidal zone in the north extends gently seaward from 200 to 1,500 m and is
characterized by low-energy waves, whereas the intertidal zone in the south is steep and
narrow, less than 500 m wide, characterizing by moderate to high-energy waves (El-Ghareeb et al.
2006; Khalaf 1988).
3.3.2. Approach The main objective of the coastal zone study was to characterize the vulnerability of Kuwait’s entire
shoreline to sea level rise (SLR). Extensive data collection and processing activities were undertaken
from local and publicly available international sources. GIS techniques were employed to calculate a
coastal vulnerability index (CVI) and establish the horizontal extent of seawater inundation into
vulnerable areas. The major elements of the study are illustrated in Figure 3-9. A brief overview of
the methodology applied is provided in the bullets below.
▪ Coastal vulnerability index (CVI): A CVI was calculated for all segments of the Kuwait
shoreline, including the islands, using widely used methods (Gornitz, et al., 1991;
McLaughlin and Cooper, 2010; Palmer et al., 2011; and Mohamad, et al., 2014). Four physical
parameters (i.e., elevation, coastal slope, geomorphology, distance to 20-meter isobath) and two
socio-economic parameters (i.e., population, and land-use/land-cover) were incorporated into the
CVI calculations. The six parameters were ranked on a scale of one to four: the value of one
represents the lowest vulnerability; and the value of four is very high vulnerability and
manipulated in GIS using map algebra analysis. All layers were given the same weight. (see
Table 3-2).
▪ Inundation extent: Four sea level rise scenarios were considered above mean high tide:
0.5 meters, 1.0 meters, 1.5 meters, and 2.0 meters by the end of this century. Northern
shorelines were delineated using georeferenced topographic maps; shorelines not covered
by the topographic maps, such as the south eastern part of Boubyan Island and southern areas
of Kuwait, were delineated using satellite imagery. As LiDAR elevation data was unavailable,
the USGS’ Global Digital Elevation Model was calibrated to Kuwaiti conditions and used to create
an elevation layer of coastal areas. The extent of inundated area under each scenario was
estimated using GIS spatial analysis tools following the method used by Bhadra et al. (2011).
Areas with elevations below the projected SLR and connected with seawater were considered
to be inundated.
3.3.3. Results Total inundated coastal area under the four scenarios are summarized in Table 3-3 relative to the
CVI scores. Under the lowest SLR scenario, a total of 185 km2 of land is projected to become
inundated, absent any coastal protection measures. This inundated land area increases to 454 km2 in
the highest SLR scenario. Notably, very little of the very highly vulnerable land, as reckoned by the
CVI score, is inundated under any scenario; ranging from less than 1 km2 in the lowest SLR scenario
to only 1.8 km2 in the highest SLR scenario. In fact, coastal areas that are classified as having only

47
moderate vulnerability show the highest share of inundated land, ranging from 78% in the Mean
high tide + 1.0 meters scenario to 81% in the lowest SLR scenario.
Figure 3-10 shows that spatial distribution of inundated areas for Boubyan Island (left) and the
southern area of Kuwait Bay (right) under each of the seal level rise scenarios. Boubyan Island would
be highly impacted under all sea level rise scenarios. Roughly half of the island would be inundated
in the highest SLR scenario. Only the relatively higher land in the interior of the island would be
visible by the end of this century. Coastal areas along Kuwait Bay are also projected to be adversely
impacts by rising seas, especially the western coast near Doha Port and densely populated
neighborhoods around Kuwait City where there are many areas for which CVI scores showed high or
very high vulnerability. Notably, while much of this coastal area currently has hard coastal protection
structures such as seawalls and bulkheads to protect roads, buildings and other infrastructure, such
installations were based on pre-SLR design criteria and would likely need to be replaced or
retrofitted to offer the same level of protection service.
Table 3–3: Inundation results, by coastal vulnerability index bin
Extent of inundation (km2) and share of land inundated (%), mapped onto coastal vulnerability bins:
Parameters 1 (low)
1.00 ≤ CVI ≤
2 (moderate)
1.50 < CVI ≤
3 (high)
2.50 ≤ CVI ≤
4 (very high)
3.50 ≤ CVI ≤ Total
Mean high tide
+ 0.5 meters
0.2
(0.1%)
150
(81%)
34
(18%)
0.9
(0.5%)
185
(100%)
Mean high tide
+ 1.0 meters
0.04
(0.02%)
180
(78%)
47
(21%)
1.3
(0.6%)
229
(100%)
Mean high tide
+ 1.5 meters
0.04
(0.01%)
298
(78%)
83
(22%)
1.5
(0.4%)
382
(100%)
Mean high tide
+ 2.0 meters
0.04
(0.01%)
359
(79%)
93
(21%)
1.8
(0.4%)
454
(100%)
Table 3–2: Parameter characterizations for coastal areas together with vulnerability rankings
Type
Parameters Vulnerability Rank
1 (low) 2 (moderate) 3 (high) 4 (very high)
Ph
ys
ica
l
Elevation (m) ≤ 0.5 ≤ 0.5 ≤ 0.5 ≤ 0.5
Coastal Slope (%) > 3 1.5 – 3 0.5 – 1.5 ≤ 0.5
Geomorphology
Rocky Coast
Sand and rocks
Sand
Mudflats,
clay/rocks,
or sand
Distance to 20m > 4km 2 – 4km 1 – 2km < 1km
So
cio
-eco
no
mic
Population ≤ 1,116 1,117 – 3,789 3,790 – 8,836 8,837 – 23,200
Land-use
Mudflats, vacant
areas, bare soil,
environmental
reserves, green
areas
Other types of
land use
Recreational
Areas, and
sport
complexes/
fields
Urban and
industrial
Areas
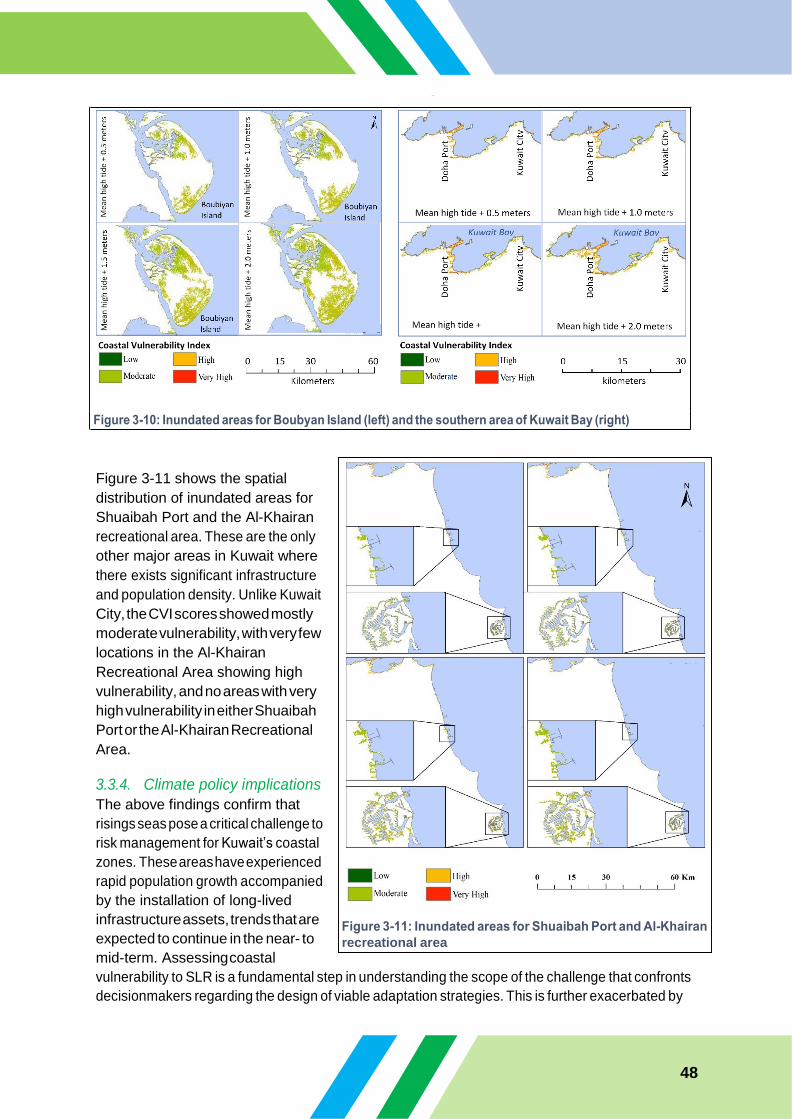
48
Figure 3-11 shows the spatial
distribution of inundated areas for
Shuaibah Port and the Al-Khairan
recreational area. These are the only
other major areas in Kuwait where
there exists significant infrastructure
and population density. Unlike Kuwait
City, the CVI scores showed mostly
moderate vulnerability, with very few
locations in the Al-Khairan
Recreational Area showing high
vulnerability, and no areas with very
high vulnerability in either Shuaibah
Port or the Al-Khairan Recreational
Area.
3.3.4. Climate policy implications
The above findings confirm that
risings seas pose a critical challenge to
risk management for Kuwait’s coastal
zones. These areas have experienced
rapid population growth accompanied
by the installation of long-lived
infrastructure assets, trends that are
expected to continue in the near- to
mid-term. Assessing coastal
vulnerability to SLR is a fundamental step in understanding the scope of the challenge that confronts
decisionmakers regarding the design of viable adaptation strategies. This is further exacerbated by
recreational area

49
the fact that the current version of GCMs do not represent the air-land-water-ice system well,
making actual projections of sea level rise can integrate factors such as accelerating deglaciation
impossible. Nevertheless, two recommendations have emerged from the study that are premised on
the precautionary principle. These are briefly discussed in the bullets below are considered strategic
next steps in the face of uncertainty.
▪ Avoid new infrastructure installation in areas classified as highly to very highly vulnerable. New
major development projects, such as power plants, desalination stations, and main ports, should
not be established on such vulnerable coasts. Such installations are costly and long-lived and
would likely face enormous upgrade costs if sea level rise was not fully considered in design
specifications. Raising the awareness among decision makers to incorporate SLR scenarios into
development plans is very important, especially now that construction has begun on Murabak
Al-Kabeer Port on Boubyan island.
▪ Strengthen the protection of coastal biodiversity. SLR is expected to adversely impact coastal
ecosystems, likely leading to a loss of some of Kuwait’s rich coastal biodiversity. Protecting
these environments through legislative action that restricts development activities is critical
important for mitigating SLR consequences and promoting ecosystem resiliency to SLR.
Extensive anthropogenic activities along the coast could significantly threat the coastal wildlife
and consequently increase the vulnerability of the coasts of Kuwait to SLR. Recently
established recreational sites along Kuwait coast, for instance, did not only destroy coastal
habitats but also significantly changed the coastline of Kuwait. The continued expansion of
recreational sites along Kuwait’s coasts without due consideration of it environmental
consequences would likely sharply diminish the tolerance of the coastal wildlife of Kuwait to
rising seas.
Going forward, enhancing coastal information systems is an important priority for Kuwait. Data
collection and information development are prerequisites for effective coastal adaptation. The more
relevant, accurate, and up-to-date the data and information available to coastal planners, the more
targeted and effective adaptation strategies can be. Enhanced information systems should include
data and information on coastal characteristics and dynamics and patterns of human behavior, as
well as improving stakeholder understanding of climate change impacts. It is also essential that there
be a general awareness among the public, coastal managers and decision makers of these
consequences and of the possible need to take appropriate action.
3.4. Water resources Population growth, urbanization, industrial growth, agricultural development are key drivers
underlying Kuwait’s high per capita water consumption. Coupled with a hyper-arid environment, low
annual rainfall, no permanent lakes or rivers, and limited fresh groundwater resources, sustainable
water resource management is a key national priority. This section provides an overview of a study
to quantify the costs and benefits of specific strategies to promote sustainable water management
strategies in Kuwait (AlHarbi, et al., 2018).
3.4.1. Background Kuwait depends on three water resources; desalinated water, brackish groundwater, renewable
groundwater, and treated wastewater. Figure 3-12 shows the relative shares of current water

50
consumption associated with these sources. The bullets below details regarding water supply and
demand trends.
▪ Brackish and fresh groundwater. Groundwater is extracted from the Umm er Radhuma-
Dammam aquifer, a transboundary groundwater system underlying all of Kuwait. The
lithology of the aquifer consists of 200 – 300 meters of soft, porous, chalky limestone and
hardy crystalline dolomitic limestone with unmelodic and green shale at the base. Most
of the groundwater is brackish with total dissolved solids (TDS) ranging from 3,000–10,000
mg/liter (MEW; Al-Rashed, 2010).
Renewable fresh groundwater, with TDS
ranging from 600 to 1,000 mg/liter, is
only available in low quantities through
deep subsurface lenses at Al-Rawdatain
and Umm Al-Aish in the Northern part of
Kuwait and represents typically less than
5% of annual consumption. Brackish
groundwater is used for oil
depressurization by the Kuwait Oil
Company as well as irrigation for green
areas and private farms in Al-Wafra and
Al-Abdalli. Over the period 2006-2016,
brackish groundwater use has been
increasing by about 8.7% per year, with
current consumption levels of about
1,238 liters per person per day (see
Figure 3-13).
▪ Desalinated water. Desalinated water
produced from Arabian Gulf seawater has been an important source since 1950. Kuwait
relies on six desalination plants using multi-stage flash (MSF) technology (i.e., Shuaiba
North, Shuaiba South, Doha East, Doha West, Al-Zour South, Sabiya) that account for 92%
of total capacity and one plant using reverse osmosis (RO) technology (i.e., Shuwaikh).
Additional RO capacity totaling 0.5
MM3 per day are planned to come
onine in the near future (MEW, 2015).
Over the period 2005-2015, desalinated
water production increased by about
3.6% per year, with current
consumption levels of about 417 liters
per capita per day (l/cap/day) (see
Figure 3-14). As a water security
measure, there are currently 84 water
storage tower tanks with total capacity
of 0.25 MM3 of desalinated water.
(Source: MEW)

51
▪ Treated wastewater. Treated
Wastewater (TWW) has become a
substantial and strategic water resource
in Kuwait due to the high cost of
desalination. The Ministry of Public
Works (MPW) manages wastewater
collection from all parts of Kuwait City
and its suburbs through 4,700 km of
gravity sewers, 17 major pumping
stations, 57 secondary pumping stations,
and 1,600 km of pressure mains (Al-Essa,
2000). Six wastewater treatment
facilities are located in the Kuwait City
vicinity. Five of these plants use rapid
sand filtration and chlorination
treatment (i.e., Riqqa, Um Alhaiman,
Kabd, Al-wafra, Kheran) and one uses
using RO and ultra-filtration
technology (i.e., Sulaibiya). These
facilities process about nearly 90% of
all wastewater generated, with the
balance discharged into the Arabian
Gulf. Over the period 2001-2014,
wastewater generation has increased
by about 3.7% per year (see Figure 3-
15). Between 50% and 60% of TWW is
typically reused for irrigation of highway landscapes,
households’ greening, public parks, and artificial wetlands,
with the rest discharged into the Arabian Gulf (MPW, 2010).
3.4.2. Approach Climate change is not projected to adversely impact Kuwait’s
brackish/fossil groundwater and desalinated water supplies which
together account for about 90% of total supply. Nevertheless, there
are likely to be indirect impacts of a changing climate water on water
resource management. Therefore, the main objective of the water
resource vulnerability assessment was to explore the direct costs and
benefits of strategies that promote sustainable water resource
management, as well as the co-benefits resulting in lower CO2
emissions. Extensive data collection and analysis activities were
undertaken from local sources. The Water Evaluation and Planning
(WEAP) model was used to evaluate water supply and demand in
Kuwait under two economic growth scenarios over the 2006-2035
period. The major elements of the study are illustrated in Figure 3-16.
A brief overview of the methodology applied is provided in the bullets
below.
Figure 3-16: Main
assessment

52
▪ Scenario construction. Three scenarios were developed. The Baseline Scenario assumes an
average annual population growth rate of 3.2% for the entire planning period. Historical
average per capita water consumption was assumed to apply throughout the planning period
(i.e., 419 l/cap/day). For the industrial and agricultural sectors, an average annual water uses
growth rate of 1.0% was
assumed. The Normal Growth Scenario
assumes a higher per capita water
consumption of 427 l/cap/day, with the
population growth rate and the
industrial/agricultural water use growth rate
remaining the same as in the baseline
scenario. The High Growth Scenario assumes an
even higher per capita water consumption of 430
l/cap/day, with the population growth rate and
the industrial/agricultural water use growth rate
remaining the same as in the baseline
scenario.
▪ WEAP Model development. Water
supply/demand was modeled within WEAP by
representing its key elements in a spatial
schematic (see Figure 3-17). WEAP is a water supply/demand accounting model capable of
quantifying the impacts of water policies on supply, demand, and implementation costs. The
three main input elements represented within WEAP were water supply, water demand, and water
transmission. Water supply elements include groundwater aquifers both fresh and brackish,
rainfall, desalination plants and wastewater plants. Water demand sectors correspond to the
domestic, agricultural and industrial sectors. Water transmission include links between supply
sources and demand sectors, between rainfall and groundwater, and between demand sectors
and either treatment or the sea. The water model was calibrated to match historical trends in
Kuwait.
Table 3–4: Policies considered in the analysis
Policy name Description
Water tariffs
Block-tariffs would replace the current flat rate of $0.59 per m3 by $0.6/m3
for the first 36 m3; $0.88/m3 for the next 18 m3; and $1.1/m3 above 55 m3.
Water demand elasticity in the residential sector from the application of
these block rates was assumed to be approximately 7%, after Bushehri (2007).
Improved water
efficiency
Installation of efficient water devices in households and businesses (e.g.,
low-flow showerheads, faucet aerators). This would lead to water use
reductions of 20 - 40% after Aboaba and Alhaji (2001) and Al-Rumikhani (2001).
Leak reduction Reduction of leaks from the pipe network system would result in 10% to 15% water saving.
Improved irrigation
efficiency
Increasing irrigation efficiency of agriculture field from its current value of
about 25% to 70% by 2035 through more efficient irrigation scheduling.
Improving Irrigation efficiency would reduce agggregate water
consumption by 30%.
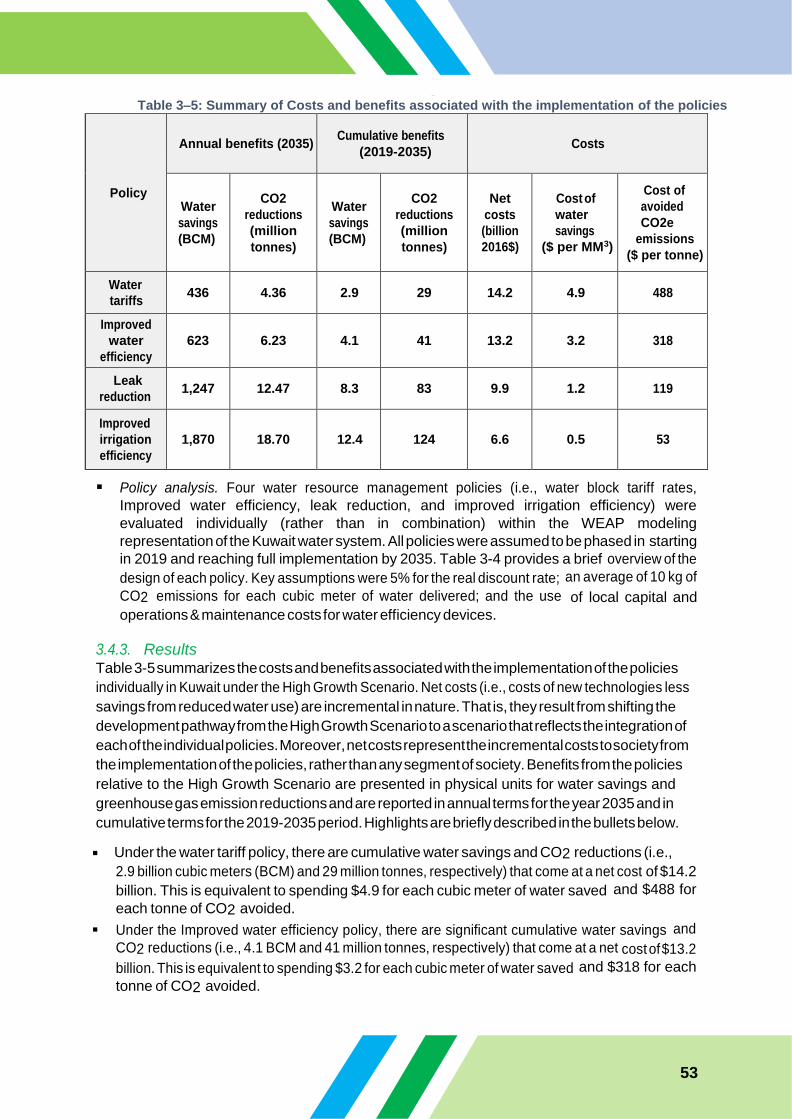
53
Table 3–5: Summary of Costs and benefits associated with the implementation of the policies
Policy
Annual benefits (2035)
Cumulative benefits
(2019-2035)
Costs
Water
savings
(BCM)
CO2
reductions
(million
tonnes)
Water
savings
(BCM)
CO2
reductions
(million
tonnes)
Net
costs
(billion
2016$)
Cost of
water
savings
($ per MM3)
Cost of
avoided
CO2e
emissions
($ per tonne)
Water
tariffs
436
4.36
2.9
29
14.2
4.9
488
Improved
water
efficiency
623
6.23
4.1
41
13.2
3.2
318
Leak
reduction
1,247
12.47
8.3
83
9.9
1.2
119
Improved
irrigation
efficiency
1,870
18.70
12.4
124
6.6
0.5
53
▪ Policy analysis. Four water resource management policies (i.e., water block tariff rates,
Improved water efficiency, leak reduction, and improved irrigation efficiency) were
evaluated individually (rather than in combination) within the WEAP modeling
representation of the Kuwait water system. All policies were assumed to be phased in starting
in 2019 and reaching full implementation by 2035. Table 3-4 provides a brief overview of the
design of each policy. Key assumptions were 5% for the real discount rate; an average of 10 kg of
CO2 emissions for each cubic meter of water delivered; and the use of local capital and
operations & maintenance costs for water efficiency devices.
3.4.3. Results Table 3-5 summarizes the costs and benefits associated with the implementation of the policies
individually in Kuwait under the High Growth Scenario. Net costs (i.e., costs of new technologies less
savings from reduced water use) are incremental in nature. That is, they result from shifting the
development pathway from the High Growth Scenario to a scenario that reflects the integration of
each of the individual policies. Moreover, net costs represent the incremental costs to society from
the implementation of the policies, rather than any segment of society. Benefits from the policies
relative to the High Growth Scenario are presented in physical units for water savings and
greenhouse gas emission reductions and are reported in annual terms for the year 2035 and in
cumulative terms for the 2019-2035 period. Highlights are briefly described in the bullets below.
▪ Under the water tariff policy, there are cumulative water savings and CO2 reductions (i.e.,
2.9 billion cubic meters (BCM) and 29 million tonnes, respectively) that come at a net cost of $14.2
billion. This is equivalent to spending $4.9 for each cubic meter of water saved and $488 for
each tonne of CO2 avoided.
▪ Under the Improved water efficiency policy, there are significant cumulative water savings and
CO2 reductions (i.e., 4.1 BCM and 41 million tonnes, respectively) that come at a net cost of $13.2
billion. This is equivalent to spending $3.2 for each cubic meter of water saved and $318 for each
tonne of CO2 avoided.

54
▪ Under the leak reduction policy, there are high cumulative water savings and CO2 reductions
(i.e., 8.3 BCM and 83 million tonnes, respectively) that come at a net cost of
$9.9 billion. This is equivalent to spending $1.2 for each cubic meter of water saved and
$119 for each tonne of CO2 avoided.
▪ Under the improved irrigation efficiency policy, there are the highest cumulative water savings
and CO2 reductions of all the policies (i.e., 12.4 BCM and 124 million tonnes, respectively) that
come at a comparatively low net cost of $6.6 billion. This is equivalent to spending $0.5 for each
cubic meter of water saved and $53 for each tonne of CO2 avoided.
3.4.4. Climate policy implications The above findings confirm that there are viable policies that could be implemented in Kuwait to
reduce long-term water demand associated with high population and economic growth. These
policies are particularly relevant given Kuwait’s acutely limited natural limited water resources and
high costs of desalinated water. Several efforts are recommended in support of these measures as
briefly described in the bullets below.
▪ Education and training: These activities involve the introduction of climate change issues at
different levels of the educational system, which can assist to build capacity among
stakeholders to support adaptation in the future and can help to develop appropriate
research activities and a greater awareness among citizens.
▪ Awareness campaigns: increase decision makers’ and public awareness about impacts of climate
change on water resources and the environment. This more effective if pertinent stakeholder or
environmental NGOs are involved in the development and the role out of the strategy.
Awareness campaigns can be performed via different forms include television, internet,
and newspapers.
▪ Strengthening/changes in the fiscal sector: Public policies may inspire and backing
adaptation of individuals and the private sector, mostly through the establishment of fiscal
incentives or subsidies.
▪ Science, research and development (R&D) and technological innovations: R&D and
innovation are necessary to allow responses to climate change in general, and to permit definite
reactions to climate change vulnerability, including economic valuation of adaptations,
technological adaptations (salt-resistant crop varieties), and surveys of new foundations of
groundwater and better resource management.
3.5. Marine ecosystems Kuwait’s marine waters and coastal areas includes highly productive habitats, including intertidal
mudflats, seagrass, algal beds, mangroves, and coral reefs. These habitats support important
commercial fisheries, marine biodiversity as well as endangered species such as the green turtle.
This section summarizes the results of an assessment of potential climate change impacts on a
subset of these vulnerable ecosystems, namely coral reef ecosystems and commercial fisheries
(Alhazeem, et al., 2018).
3.5.1. Background Coral reef ecosystems play an important role in maintaining marine biodiversity and a genetic library
for future generations (Moberg and Folke, 1999). In Kuwait, they function as an essential spawning
ground, nursery, and breeding and feeding ground for many kinds of marine species such as
commercial fish, marine turtles, worms, molluscs, crustaceans and sponges. Healthy coral reefs

55
depend on a delicate balance between sea surface temperature, salinity and water column clarity,
which affects the amount of sunlight reaching coral. Other factors affecting coral growth are
hydrodynamic in nature (e.g. currents, waves and storm frequency) and biologic such as larval
sources, species diversity and disease occurrence (Done, 2011).
Kuwait has three well-developed offshore coral reef islands: Kubbar, Qaro, and Umm Al-Maradem
(see earlier Figure 3-4). Coral cover diversity in Kuwait has reported low coral diversity with 24
Scleractinian species in 17 genera (Downing 1985). Some local coral species such as Acropora and
Stylophora species are particularly sensitive to environmental stressors (e.g., increased sea surface
temperature) have experienced bleaching events in recent years (see Figure 3-18). Coral
communities around these islands already exist in extreme environmental conditions that are near
tolerance limits for survival and reef development (Downing, 1985). With climate change, maximum
sea surface temperatures are projected to rise in northern Arabian Gulf waters and likely adversely
affecting the delicate balance among these factors.
Kuwait’s commercial fisheries are subject to Decree Law Number 46 of 1980 (Concerning the
protection of fish wealth) and have been regulated by the Public Authority for Agriculture Affairs and
Fish Resources (PAAFR) since 1983. They are the second most important natural resource in Kuwait
after oil and gas. In addition to being a renewable source of income, they contribute to Kuwait’s
food security and cultural heritage,
while also providing recreational
opportunities.
With its shallow intertidal waters,
Kuwait Bay is a highly productive fish
nursery habitat and supports a
thriving fishing industry, with a
range of species typically harvested
(Wright, 1988, 1989). Of the over
345 fish and shrimp species found in
Kuwait’s waters (Al-Baz et al., 2013),
there are 2 commercially important
shrimp species - green tiger prawn
(penaeus semisulcatus) and jinga
shrimp (Metapenaeus affinis) - and
21 commercially important fish
species (see Table 3-8). These 23
species typically account for about
41% of total annual catch. Despite
their historical importance, fisheries
in Kuwait and the surrounding
and Favites pentagona
Table 3–6: Major commercial fish species in Kuwait.
(Source: Al-Hussaini, et al., 2015)
Family Species Common name
Carangidae Parastromateus niger Black pomfret
Cynoglossidae Cynoglossus arel Largescale tongue sole
Haemulidae Plectorhinchus pictus Trout sweetlips
Pomadasys kaakan Javelin grunter
Hemipteridae Nemipterus peronii Notched threadfin
Lethrinidae Lethrinus nebulosus Spangled emperor
Lutjanidae Lutjanus malabaricus Malabar blood snapper
Mugilidae Liza klunzingeri Klunzinger’s mullet
Mugil cephalus Flathead mullet
Paralichthyidae Pseudorhombus arsius Largetooth flounder
Platycephalidae Platycephalus indicus Bartail flathead
Polynemidae Eleutheronemaa Fourfinger threadfin
Sciaenidae Otolithes ruber Tigertooth croaker
Protonibea diacantha Spotted croaker
Scombridae Scomberomorus Kingfish
Scomberomorus guttatus Indo-Pacific king
Serranidae Epinephelus coioides Orange-spotted
Sparidae Acanthopagrus latus Yellowfin seabream
Argyrops spinifer King soldier bream
Stromateidae Tenualosa ilisha Hilsa shad
Pampus argenteus Silver pomfret
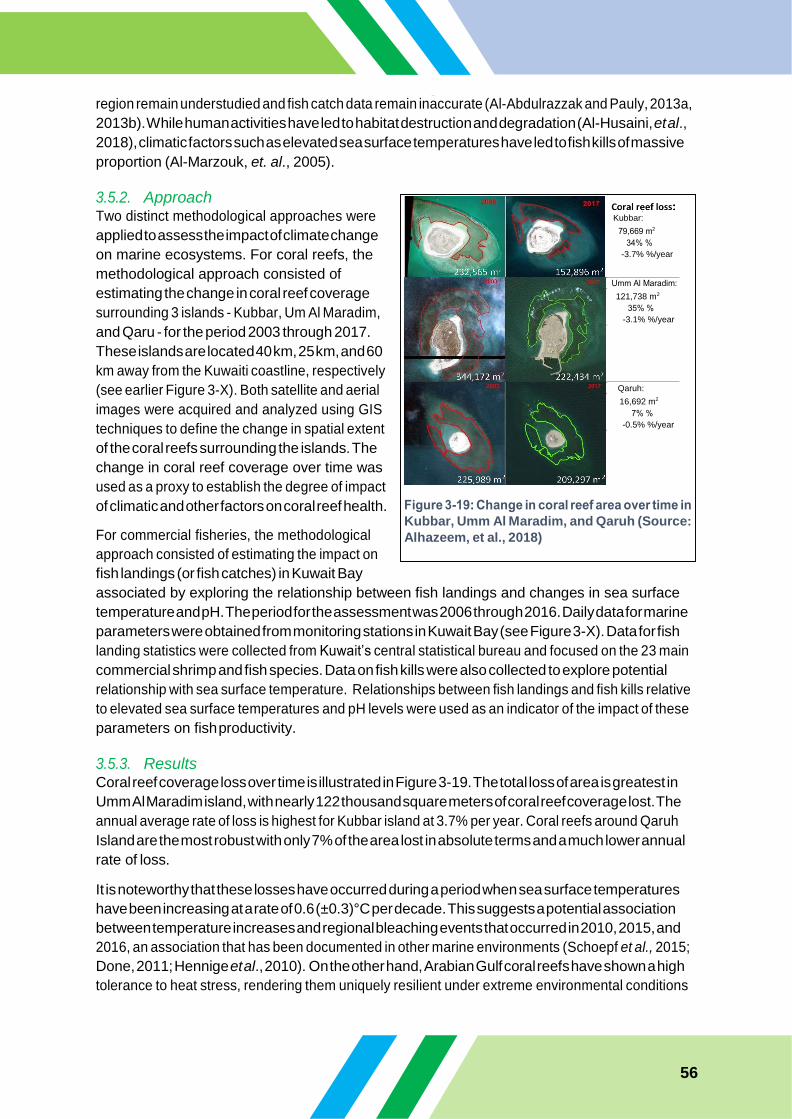
56
region remain understudied and fish catch data remain inaccurate (Al-Abdulrazzak and Pauly, 2013a,
2013b). While human activities have led to habitat destruction and degradation (Al-Husaini, et al.,
2018), climatic factors such as elevated sea surface temperatures have led to fish kills of massive
proportion (Al-Marzouk, et. al., 2005).
3.5.2. Approach Two distinct methodological approaches were
applied to assess the impact of climate change
on marine ecosystems. For coral reefs, the
methodological approach consisted of
estimating the change in coral reef coverage
surrounding 3 islands - Kubbar, Um Al Maradim,
and Qaru - for the period 2003 through 2017.
These islands are located 40 km, 25 km, and 60
km away from the Kuwaiti coastline, respectively
(see earlier Figure 3-X). Both satellite and aerial
images were acquired and analyzed using GIS
techniques to define the change in spatial extent
of the coral reefs surrounding the islands. The
change in coral reef coverage over time was
used as a proxy to establish the degree of impact
of climatic and other factors on coral reef health.
For commercial fisheries, the methodological
approach consisted of estimating the impact on
fish landings (or fish catches) in Kuwait Bay
associated by exploring the relationship between fish landings and changes in sea surface
temperature and pH. The period for the assessment was 2006 through 2016. Daily data for marine
parameters were obtained from monitoring stations in Kuwait Bay (see Figure 3-X). Data for fish
landing statistics were collected from Kuwait’s central statistical bureau and focused on the 23 main
commercial shrimp and fish species. Data on fish kills were also collected to explore potential
relationship with sea surface temperature. Relationships between fish landings and fish kills relative
to elevated sea surface temperatures and pH levels were used as an indicator of the impact of these
parameters on fish productivity.
3.5.3. Results Coral reef coverage loss over time is illustrated in Figure 3-19. The total loss of area is greatest in
Umm Al Maradim island, with nearly 122 thousand square meters of coral reef coverage lost. The
annual average rate of loss is highest for Kubbar island at 3.7% per year. Coral reefs around Qaruh
Island are the most robust with only 7% of the area lost in absolute terms and a much lower annual
rate of loss.
It is noteworthy that these losses have occurred during a period when sea surface temperatures
have been increasing at a rate of 0.6 (±0.3)°C per decade. This suggests a potential association
between temperature increases and regional bleaching events that occurred in 2010, 2015, and
2016, an association that has been documented in other marine environments (Schoepf et al., 2015;
Done, 2011; Hennige et al., 2010). On the other hand, Arabian Gulf coral reefs have shown a high
tolerance to heat stress, rendering them uniquely resilient under extreme environmental conditions
Kubbar:
-3.7% %/year
121,738 m2
-3.1% %/year
Qaruh:
16,692 m2
-0.5% %/year
Kubbar, Umm Al Maradim, and Qaruh (Source:
Alhazeem, et al., 2018)

57
(Riegl and Purkis, 2012b; Coles and Riegl, 2013; Hume et al., 2013; Benzoni et al., 2006; and
Alhazeem, 2007).
In addition, there has been several events of fish kills. The most severe cases were reported in 1999
when up to 30 tonnes of Liza macrolepis deaths occurred in Kuwait Bay from September to October.
More than 80,000 fish of other species were killed in October (Heil, et. al.; 2001). Another massive
fish kill occurred in Kuwait Bay during August and September of 2001, with over 2,500 tonnes of Liza
klunzingeri, followed by several smaller scale fish kills. Notably, unusually high levels of algae were
observed coupled with high temperatures (up to 35°C) and calm conditions (Gilbert, et al., 2002).
Numerous other fish kill incidents have occurred in Kuwait Bay, although at smaller scales. Such
experiences are consistent with documentation of warming water temperatures leading to increases
in the frequency and severity of fish kills associated with plankton blooms (e.g., Sheppard et al.,
2010).
3.5.4. Climate policy implications Kuwait’s marine ecosystems may be vulnerable to climate change impacts. Multiple human
stressors, such as habitat destruction and overfishing, are likely to exacerbate this vulnerability.
Effective management of activities in the Arabian Gulf under climate change will help increase the
resilience of marine ecosystems and the adaptive capacity of policy-making systems, for example by
reducing other human perturbations, to ensure the sustainable flow of ecosystem services into the
future. Effective implementation of ecosystem-based management that considers a much wider
range of environmental and human stressors is fundamental to increasing the adaptive capacity of
marine social-ecological systems to climate change. This includes strengthening the implementation
and enforcement of current regulations and agreements to protect marine resources in the Arabian
Gulf.
3.6. Public health Climatic conditions can profoundly affect human health in Kuwait. Prevailing conditions of very high
temperatures and frequent dust storms impose major health risks that can lead to premature
mortality and health care facility visits, particularly among the elderly and very young. This section
summarizes key health risks associated with climate change; reviews actions already taken to
address climate/health linkages; and outlines a strategic approach to strengthen Kuwait’s capacity to address climate change risks to public health (Alshatti, et al., 2018).
3.6.1. Background With climate change, increased heat stress from higher temperatures and increased cardiovascular
and respiratory diseases associated with more frequent dust storms, represent looming health
threats to the population. These additional risks could exacerbate current major health problems
such as ischemic heart disease, stroke, road injury and lower respiratory infections, whilst potentially
undermining Kuwait’s social protection systems.
Average and maximum temperatures in Kuwait under a changed climate are projected to rise
considerably. Numerous studies confirm that extreme heat leads to increased heat stress which
adversely affects health, increasing the risk of morbidity and premature mortality through heat
stroke, heat exhaustion and the exacerbation of chronic diseases (Basu, 2009; Xu, 2012; Turner et
al., 2013; Basu, 2013; Xiang, 2014). The most severe heat-related illness is stroke and occurs when a
person’s temperature exceeds a critical threshold and is accompanied by a weak pulse, nausea, and
fainting. Moreover, increased heat stress is associated with psychological distress, anxiety and
mental health disorders (Wang et al. 2014; Tawatsupa et al. 2010). These potential health outcomes

58
also apply to Kuwait’s population, with outdoor workers (e.g., construction, green space
maintenance), the elderly, and very young likely to be exposed to the greatest risks.
Dust storms already have large depositional
rates, particularly across the northern Arabian
Peninsula region. The highest annual
depositional rates over Kuwait exceed 500
tonnes per square kilometer and are found in the
western part of the country (see Figure 3-X),
while annual dust deposition in the Arabian Gulf
averages over 10 thousand tonnes for each cubic
kilometer of seawater (Al-Dousari, et al., 2017).
Severe dust storms result from strong winds that
can exceed 45 km/hour, leading to high
concentrations of coarse particulates (PM10,
particles greater than 10 microns in diameter)
that can lead to cardiovascular impacts (stroke,
heart attack) and respiratory ailments (asthma
attacks). Notably, the frequency of dust storms in the region has increased drastically in the last
decade (Sissakiam, et al., 2013) and could potentially increase further under climate change. Some
epidemiological studies in Kuwait show a strong association between dust storms and increased
asthma and respiratory hospital admissions (Qasem et al., 2008; Thalib and Al-Taiar, 2012; Alshatti,
et al., 2018), with other studies in Iran (Ebrahimi, et al., 2014) and Turkey (Al, et al., 2018) offering
corroborating evidence, with yet other studies unable to affirm a direct relationship between dust
storms and increased asthmatic attacks (Sabah, et al., 2014). In any event, since there is already a
high prevalence of asthma in Kuwait - 15% of adults and 18% of children are affected (Khadadah,
2012) – any aggravating factor such as increased dust storm frequency represents a critical health
security issue.
3.6.2. Current coping strategies In response to clear indications of a changing climate in Kuwait, several measures have already been
put into place in recent years to cope with health impacts. These governmental actions have been
taken as a proactive step to protect public health and maintain work productivity (see Table 3-7).
2011 (UNEP, et al., 2016)

59
Table 3–7: Actions implemented to mitigate health impacts of climate change
Coping strategy Actions
Adjust the
official working
hours
▪ The Ministry of Social Affairs and Labor of Kuwait issued a national law in 2005 forbidding any
outdoor work from 11:00AM to 16:00PM from June to August as these are the times when the day
temperature reaches its maximum level
Awareness
campaigns on
how to respond
to dust and
thunder storms
▪ The Ministry of health of Kuwait launched several awareness campaigns through social media
channels and health care centers advising individuals on how to react to dust events. It provided
infographics and general advices that are applicable, easily comprehendible.
▪ Annual awareness campaigns on how to deal with the summer in Kuwait: The Ministry also
launches annual media campaigns advising individuals on how to deal with Kuwait’s hot summer
days and how to avoid heat stress and its effects.
National health
alerts for dust
storms
▪ Whenever a dust event in expected, a national disaster alert is released through media channels to
alert individuals about the event and what measures to be taken. All emergency rooms in Kuwait
are notified to be well-prepared to expected increase in emergency visits due to such dust events.
However, this system needs to enforce further to be activated during every event in collaboration
with other public agencies. People in Kuwait themselves have adopted responsive measures to
climate change impacts and effects. During the hot summer days, people tend to avoid walking in
the streets at noon unless it’s needed. Many cover their heads or even use an umbrella to decrease
the effect of heat during the day.
3.6.3. Climate policy implications While the country may not be able to influence climate change directly, an adaptation plan is
needed to reduce such detrimental health impacts in Kuwait. These include:
▪ Inclusion health outcomes into Kuwait’s national climate change adaptation plans and
programs,
▪ Specific adaptation plans targeting vulnerable groups is needed to create and implement
prevention measures toward climate health impacts such as heat-related conditions,
▪ It was noted that there is a lack of research and scientific studies toward local climate health
impacts in Kuwait. Future studies are greatly needed to assess further public health impacts at
local levels in relation to heat waves, extreme temperatures, ambient air pollution, humidity,
droughts and sea level rise,
▪ Enhance data collection system through electronic filing systems at health care centers to correctly
measures the climate health impacts,
▪ Equip health care workers with the right skills and knowledge on how to identify, assess and treat
such health effects such as heat stress and heat exhaustion. This needs to be coupled with
sufficient resources in terms of medical equipment and human resources given the estimated
increase in number of admissions and emergency presentations,
▪ Since climate change is a cross-sectoral issue involving several areas including
environment, health, agriculture, and more, a multi-sectoral and multidisciplinary
collaboration is essential to the development of a national health adaptation strategy,
▪ Due to the health effects of dust events and extreme temperature as highlighted in the report, a
review of national working conditions should be made to adjust to the current and future climate
change impacts. Additionally, a nation-wide early warning system must be developed further in
case of extreme weather events such as heat waves or sand and dust storms

60
3.7. List of references
Abdulrazzak, D. and Pauly, D. 2013b. Managing fisheries from space:
Google Earth improves estimates of distant fish catches. ICES J Mar Sci.
71 (3): 450–454.
Abou-Seida, M. M., and Al-Sarawi, M. A., 1990. Utilization and management of
coastal areas in Kuwait. Coastal Management. 18(4): 385-401.
Al, B., Bogan, M., Zengin, S., Sabak, M., Kul, S., Oktay, M., Bayram, H.,
and Vuruskan, E. 2018. Effects of Dust Storms and Climatological
Factors on Mortality and Morbidity of Cardiovascular Diseases Admitted to
ED. Emergency Medicine International. Vol: 2018, Article ID 3758506.
Al Bakri, D., and Kittaneh, W. 1998. Physicochemical Characteristics and
Pollution Indicators in the Intertidal Zone of Kuwait: Implications for Benthic
Ecology. Environmental Management. 22(3): 415-424. doi:
10.1007/s002679900116.
Al-Abdulrazzak, D. and Pauly, D. 2013a. From dhows to trawlers: A recent
history of fisheries in the Gulf countries, 1950 to 2010. Fisheries Centre
Research Reports 21. University of British Columbia, Pp.: 61.
Al-Baz, Ali & Al-Husaini, Mohsen & Al-Foudari, Hussain. 2013. Fisheries
Status and Research Developments in Kuwait.
Al-Dousari, A., Doronzo, D., and Ahmed, M. 2017. Types, Indications and Impact
Evaluation of Sand and Dust Storms Trajectories in the Arabian Gulf”.
Sustainability. 9: 1526; doi:10.3390/su9091526.
Al-Essa, W. 2000. Wastewater management in Kuwait. In: Al-Sulaimi, J. and
Asano, T. (Eds.). Proceedings of the Workshop on Wastewater Reclamation
and Reuse. Arab School for Science and Technology. Kuwait Foundation for the
Advancement of Science, Kuwait.
Al-Gabandi, A. 2011. Boubyan Port: The Eastern Gate of Kuwait. Beatona. Pp.:
16- 25.
AlHarbi, M., Abbas, H., AlHoulan, N., and AlAbdulrazzaq, F. 2018. Summary
Report: Climate Change and Water Resources in State of Kuwait.
Vulnerability and Adaptation Group Vulnerability & Adaptation Team,
August.
Al-Hasem, A. M., 2002. Coastal morphodynamics of an open-ended tidal
channel in an arid and mesotidal environment: Al-Subiya Tidal Channel, Kuwait.
Ph.D thesis, The University of Queensland.
Alhazeem, S. 2007. An ecological study of the coral reefs of Kuwait islands.
School of Ocean Sciences. University of Wales, Bangor, UK.
Alhazeem, S., Gholoum, M., and Bahzad, J., 2018. Summary Report: Climate
Change and Marine Ecosystem in State of Kuwait. Vulnerability and
Adaptation Group Vulnerability & Adaptation Team, August.

61
Al-Husaini, M & M Bishop, J & M Al-Foudari, H & Al-Baz, Ali. 2015. A
review of the status and development of Kuwait’s fisheries. Marine
Pollution Bulletin. 100. 10.1016/j.marpolbul.2015.07.053.
Al-Marzouk, A., Duremdez, K., Sameer, Y., Al-Gharabally, H. and Munday, B.
2005. Fish kill of mullet Liza klunzingeri in Kuwait Bay: The role of
Streptococcus agalactiae and the influence of temperature. In: . P. Walker, R.
Lester, and M. G. Bondad- Reantaso, (Eds). Diseases in Asian Aquaculture.
Pp.: 143-153. Manila.
Al-Mutairi, Nawaf & abahussain, Amsa & El Battay, Ali. 2014.
Environmental Assessment of Water Quality in Kuwait Bay. International
Journal of Environmental Science and Development. 5.
10.7763/IJESD.2014.V5.539.
Al-Rashed, M, Al-Senafy, M. N, Viswanathan, M. N, and Al-Sumait, A. 2010.
Groundwater Utilization in Kuwait: Some Problems and Solutions. International
Journal of Water Resources Development. 14(1): 91-105.
Al-Rashidi, T., El-Gamily, H., Amos, C., and Rakha, K. 2009. Sea surface
temperature trends in Kuwait Bay, Arabian Gulf. Natural Hazards. Vol. 50:
73-82.
Alsahli, M., Hassan, A., and Altheyabi, N., 2018. Summary Report: Climate
Change and Coastal Zones in State of Kuwait. Vulnerability and Adaptation
Group Vulnerability & Adaptation Team, August.
Alshatti, A., AlQodmani, L., and AlSeaidan, M. 2018. Summary Report:
Climate Change and Health Outcomes in State of Kuwait. Vulnerability and
Adaptation Group Vulnerability & Adaptation Team, August.
Al-Yamani, F. Y., Bishop, J., and Ramadhan, E. 2004. Oceanographic atlas of
Kuwait's waters. Kuwait Institute for Scientific Research.
Al-Yamani, Y, Bishop, J, Ramadhan, E, Al-Husaini, M & Al-Ghadban, A. 2004.
Oceanographic Atlas of Kuwait’s Water”, Environmental Public Authority-
Kuwait and Kuwait Institute for Scientific Research, Kuwait. Pp.: 203.
Baby, S., 2014. Assessing morphological landscape carrying capacity for coastal
areas in Kuwait. Indian Journal of Geo-Marine Sciences. 43(8): 1- 16.
Basu, R., 2009. High ambient temperature and mortality: a review of
epidemiologic studies from 2001 to 2008. Environ Health. 8 (1): 40.
Basu, Rupa & Pearson, Dharshani & Malig, Brian & Broadwin, Rachel &
Green, Rochelle. 2012. The Effect of High Ambient Temperature on
Emergency Room Visits. Epidemiology. 23: 813-820. 10.2307/41739678.
Batista, P. P., Clemesha, B. R., Tokumoto, A. S., and Lima, L. M. 2004. Structure
of the mean winds and tides in the meteor region over Cachoeira Paulista,
Brazil (22.7°S,45°W) and its comparison with models. Journal of Atmospheric
and Solar-Terrestrial Physics. 66: (6–9), 623-636. doi:

62
http://dx.doi.org/10.1016/j.jastp.2004.01.014.
Benzoni, F., Pichon, M,. Alhazeem, S., and Galli, P., 2006. The Coral Reefs of the
Northern Arabian Gulf: Stability over time in extreme environmental
conditions? Proceedings of the 10th International Coral Reef Symposium.
Bhadra, A., Choudhury, S., and Kar, D. 2011. Flood Hazard Mapping in Dikrong
Basin of Arunachal Pradesh (India). World Academy of Science, Engineering
and Technology. 60: 1614 - 1619.
Coles, S., and Jokiel, P. 1992. Effects of salinity on coral reefs. In: Pollution in
Tropical Aquatic Systems. Connell, D & Hawker, D (eds), CRC Press,
Cleveland, USA. Pp.: 2-25.
Done, T. 2011. Corals: Environmental Controls on Growth. In: Hopley, D (ed),
Encyclopedia of Modern Coral Reefs. Springer Netherlands. Pp.: 281-293.
Downing N., 1985. Coral reef communities in an extreme environment: The
Northwestern Arabian Gulf. 5th International Coral Reef Congress, Tahiti,
Pp.: 343-348.
Ebrahimi, S., Ebrahimzadeh, L., Eslami, A., and Bidarpoor, F. 2014.
Effects of dust storm events on emergency admissions for cardiovascular
and respiratory diseases in Sanandaj, Iran. Journal of Environmental Health
Science & Engineering. 12:110.
El-Ghareeb, R., El-Sheikh, M. A. E., & Testi, A. 2006. Diversity of plant
communities in coastal salt marshes habitat in Kuwait. Rendiconti Lincei. 17(3):
311-331. doi: 10.1007/BF02904769.
Förster, H., Förster, A., Oberhänsli, R., and Stromeyer, D., 2009. The steady-
state thermal structure of the Arabian Shield prior to the Read Sea rifting.
Paper presented at the EGU General Assembly Conference Abstracts.
Glibert, P & H Landsberg, Jan & Evans, Joyce & A Al-Sarawi,
Mohammad & Faraj, Muna & A Al-Jarallah, Mohammad & Haywood,
Allison & Ibrahem, Shahnaz & Klesius, Phil & Powell, Christine &
Shoemaker, Craig. 2002. A fish kill of massive proportion in Kuwait Bay,
Arabian Gulf, 2001: The roles of bacterial disease, harmful algae, and
eutrophication. Harmful Algae. 1: 215-231. 10.1016/S1568-
9883(02)00013-6.
Gornitz, V., White, T., and Cushman, R. 1991. Vulnerability of the U.S. to
future sea-level rise. Coastal Zone. In: Proceedings of Seventh Symposium on
Coastal and Ocean Management. 91: 2354-68. ASCE.
Hennige, S., Smith, D., Walsh, S., McGinley, M., Warner, M., and Suggett, D.
2010. Acclimation and adaptation of scleractinian coral communities along
environmental gradients within an Indonesian reef system. Journal of
Experimental Marine Biology and Ecology. Vol. 391 (1-2): 143-152.
Hume, Benjamin & D'Angelo, C & Burt, John & Baker, Andrew & Riegl,

63
Bernhard & Wiedenmann, J. 2013. Corals from the Persian/Arabian Gulf
as models for thermotolerant reef-builders: Prevalence of clade C3
Symbiodinium, host fluorescence and ex situ temperature tolerance.
Marine Pollution Bulletin. 72. 10.1016/j.marpolbul.2012.11.032.
Khadadah, M. 2012. The cost of asthma in Kuwait. Med Princ Pract.
22:87–91.
Khalaf, F., 1988. Quaternary calcareous hard rocks and the associated
sediments in the intertidal and offshore zones of Kuwait”. Marine Geology.
80(1): 1-27.
Lokier, S. W., Bateman, M. D., Larkin, N. R., Rye, P., and Stewart, J. R. 2015. Late
Quaternary sea- level changes of the Persian Gulf. Quaternary Research.
doi: http://dx.doi.org/10.1016/j.yqres.2015.04.007.
McLaughlin, S., & Cooper, J. A. G. 2010. A multi-scale coastal vulnerability
index: A tool for coastal managers? Environmental Hazards. 9(3): 233-248.
doi: 10.3763/ehaz.2010.0052
Ministry of Electricity and Water (MEW). 2010. Statistical Year Book.
Ministry of Energy, Kuwait.
Ministry of Public Works (MPW). 2010. Statistical Year Book”, Sanitary
Engineering Sector, Kuwait. Moberg, F., and Folke, C., 1999. Ecological goods
and services of coral reef ecosystems. Ecological Economics. Vol. 29 (2):
215-233.
Mohamad, M. F., Lee, L. H., and Samion, M. K. H. 2014. Coastal Vulnerability
Assessment towards Sustainable Management of Peninsular Malaysia
Coastline. International Journal of Environmental Science and
Development. 5(6): 533.
Palmer, B., Van der Elst, R., Mackay, F., Mather, A., Smith, A., Bundy, S., and
Parak, O. 2011. Preliminary coastal vulnerability assessment for KwaZulu-
Natal, South Africa. J Coastal Res. 64(S1): 1390-1395.
Paul, G. C., and Ismail, A. I. M. 2012. Tide–surge interaction model including air
bubble effects for the coast of Bangladesh. Journal of the Franklin Institute
349 (8): 2530-2546. doi: http://dx.doi.org/10.1016/j.jfranklin.2012.08.003.
Qasem, J., Nasrallah, H., Al-Khalaf, B., Al-Sharifi, F., Al-Sherafyee, A.,
Almathkouri, S., and Al-Saraf, H. 2008. Meteorological factors,
aeroallergens and asthma-related visits in Kuwait: a 12-month
retrospective study. Ann Saudi Med. 28 (6), November-December.
Quinn, N., Atkinson, P. M., and Wells, N. C. 2012. Modelling of tide and surge
elevations in the Solent and surrounding waters: The importance of tide–surge
interactions. Estuarine, Coastal and Shelf Science. 112 (0): 162-172. doi:
http://dx.doi.org/10.1016/j.ecss.2012.07.011.
Ramadan, E., Aldousiri, A., Al Dashti, H., Alnassar, M. 2018. Climate of

64
Kuwait (Future Projections). Vulnerability and Adaptation Group Climate
Modeling Team, August.
Riegl BM, Purkis SJ (Eds). 2012. Coral Reefs of the Gulf: Adaptation to Climatic
Extremes. Springer, 389pp, ISBN 978-94-007-3007-6.
Riegl, B., and Purkis, S., 2012b. Environmental Constraints for Reef Building in
the Gulf. Springer Netherlands, Dordrecht.
Sabbah, I., Arifhodzic, N., Al-Ahmad, M., Al-Enizi, A., Al-Haddad, A., and Al-Ajmi,
N. 2014. Influence of Air Quality Conditions on Asthmatic Patient Visits in
Kuwait. J Allergy Ther. 5:6, DOI: 10.4172/2155-6121.1000197
Schoepf, V., Stat, M., Falter, J., and McCulloch, M. 2015. “Limits to the thermal
tolerance of corals adapted to a highly fluctuating, naturally extreme
temperature environment. Scientific Reports. 5: 17639.
Sheppard, Charles & Al-Husiani, Mohsen & Al-Jamali, F & Al-Yamani, Faiza
& Baldwin, Rob & Bishop, James & Benzoni, Francesca & Dutrieux, E &
Dulvy, Nicholas & Rao V. Durvasula, Subba & A. Jones, David & Loughland,
Ronald & Medio, David & Manickam, Nithyanandan & Pilling, Graham &
Polikarpov, Igor & Price, A & Purkis, Sam & Riegl, Bernhard & Zainal,
Khadija. 2010. The Persian/Arabian Gulf: a young sea in decline. Marine
Pollution Bulletin. 60: 13-38. 10.1016/j.marpolbul.2009.10.017.
Sissakiam, V., Al-Ansari, N., and Knutsson, S. 2013. Sand and dust storm events
in Iraq. Natural Science. Vol.5 (10): 1084-1094.
Stevens, T., Jestico, M. J., Evans, G., and Kirkham, A. 2014. Eustatic control of
late Quaternary sea- level change in the Arabian/Persian Gulf. Quaternary
Research. 82(1): 175-184. doi:
http://dx.doi.org/10.1016/j.yqres.2014.03.002.
Tawatsupa, B., Lim, L., Kjellstrom,T., Seubsman, S., Sleigh, A., et al., 2010.
“The association between overall health, psychological distress, and
occupational heat stress among a large national cohort of 40,913 Thai
workers. Global Health Action. 3, PMC2871739.
Thalib, L. and Al-Taiar, A. 2012. Dust storms and the risk of asthma admissions
to hospital in Kuwait. Science of The Total Environment. 433:347-51.
Thoppil, P. G., & Hogan, P. J. 2010a. A Modeling Study of Circulation
and Eddies in the Persian Gulf. Journal of Physical Oceanography. 40(9):
2122–2134. doi:10.1175/2010JPO4227.1
Turner L., Connell D., and Tong S. 2013. The effect of heat waves on ambulance
attendances in Brisbane, Australia. Prehosp Disaster Med. 28(5): 482–487.
Wang, X., Lavigne, E., Ouellette-Kuntz, H., and Chen, B., 2014. Acute
impacts of extreme temperature exposure on emergency room admissions
related to mental and behavior disorders in Toronto, Canada. J Affect
Disord.155: 154-61.

65
Wright, J.M., 1988. Recruitment patterns and trophic relationships of fish in
Sulaibikhat Bay, Kuwait. J Fish Biol. 33: 671– 687.
Wright, J.M., 1989. Diel variation and seasonal consistency in the fish
assemblage of the non- estuarine Sulaibikhat Bay, Kuwait. Marine Biology.
102: 135–142.
Xiang, J., Bi, P., Pisaniello, D., and Hansen, A. 2014. Health Impacts of
Workplace Heat Exposure: An Epidemiological Review. Ind Health. 52(2),
PMC4202759.

66
4. GREENHOUSE GAS MITIGATION ..................................................................................................................... 66
4.1. GOAL, SCOPE, METHODOLOGY, AND DATA SOURCES ................................................................................................................ 66
4.2. BASELINE SCENARIO ....................................................................................................................................................................... 67
4.3. GHG MITIGATION SCENARIO ............................................................................................................................................. 68
4.4. FUTURE GHG MITIGATION OPPORTUNITIES ............................................................................................................................... 69
4.5. LIST OF REFERENCES .................................................................................................................................................................................. 70
List of Figures Figure 4-1: Share of oil & gas and electricity water production emissions, 1994-2016 ................................... 66
Figure 4-2: Projected CO2e emissions in the Baseline Scenario; Right: Historical trends and projections
for CO2e emissions per capita and per constant US$ of GDP ....................................................... 68
Figure 4-3: Projected CO2e emission reductions in the GHG Mitigation Scenario; Right: Projected CO2e
emissions in the Baseline and GHG Mitigation Scenarios ............................................................. 69
List of Boxes Box 4–1: Regression model used to project Baseline Scenario emissions through 2035 ................................... 67

67
water production emissions, 1994-2016
4. Greenhouse gas mitigation Kuwait is committed to efforts that harmonize economic growth with a low-carbon, climate-resilient
development. Domestically, it has already undertaken several strategic projects to reduce its carbon
footprint. Internationally, it has expressed through its Nationally Intended Contribution a
commitment to explore future GHG emission reduction policies and measures in the energy sector
(State of Kuwait, 2015).
Such actions will reflect practical ways to promote clean energy initiatives, introduce new low-
carbon technologies, and develop long-term partnerships to exploit sustainable energy
opportunities. Progress toward such actions is already underway, and when fully implemented, will
eventually lead to substantive greenhouse gas mitigation in an increasingly carbon-constrained
world.
The rest of this section is based on an analysis of potential GHG reductions in the energy sector by
Alsayegh et al., (2018). The energy sector was selected at it represents the largest share of GHG
emissions in Kuwait. The section concludes with a proposed set of strategic mitigation actions for
achieving deeper GHG reductions in the future.
4.1. Goal, scope, methodology, and data sources
The goal of the GHG mitigation assessment was to establish annual and cumulative GHG emission
reductions due to the implementation of several promising GHG mitigation options. The scope of the
assessment focused on fugitive emissions from oil & gas operations and combustion-related
emissions associated with electricity and desalinated water production. Together, these activities
accounted for between 76% and 81% of emissions
over the 1994-2016 period (see Figure 4-1).
While there are other GHG reduction opportunities
in the next largest-emitting sector, transportation,
which accounted for roughly 18% of emissions in
2016, a tactical decision during initial mitigation
planning was made to limit the scope of the
assessment solely to the way that electricity is
produced and efficiency improvement in upstream
oil & gas operations.
Two emission scenarios were considered; a Baseline
Scenario which assumed the continuation of
historical trends in energy supply and demand and a Mitigation Scenario which assumes the
implementation of measures to reduce fugitive emissions, enhance supply side efficiency in
electricity production and introduce renewable energy. Due to resource and time constraints, the
assessment was limited to GHG reductions only (i.e., costs were not considered). The Baseline
scenario incorporated activities that have taken place to date to reduce emissions. A 19-year
planning horizon was considered, from 2016 through 2035.
A linear regression model was developed to project Baseline Scenario emissions to 2035. Population
and GDP data over the 1994-2016 were used to establish trends between these variables and
national CO2e emissions. The model was developed using simple regression and analysis of variance
(ANOVA) techniques. Box 4-1 provides details of the final form of the model. Most of the data

68
required to undertake the assessment was acquired
from governmental sources. Average annual growth
rates of 2.65%, 1.8%, and 2.0% were used for
population, GDP, and inflation, respectively. Physical
properties of fuels (e.g., GHG emission factors, energy
densities) are based on IPCC default factors used in the
development of the GHG inventory
4.2. Baseline scenario
The Baseline Scenario incorporates emission
reductions associated with several recent projects that
have been implemented as part of the Clean
Development Mechanism (CDM) to stimulate
sustainable development and emission reduction
targets under the Kyoto protocol. A brief overview of
these projects is provided in the bullets below.
▪ Flare gas recovery at the Mina Al Ahmadi Refinery. This project aims to recover gases that
are currently flared at one of the refineries operated by the Kuwait National Petroleum
Company. The project involves the installation of a Flare Gas Recovery Unit (FGRU) to
recover gases for subsequent commercial uses. Annual GHG emission reductions are
about 54.4 Gg.
▪ Flare gas recovery at the Mina Abdullah Refinery: This project aims to recover gases that are
currently flared at another of the refineries operated by the Kuwait National Petroleum
Company. The project involves the installation of an FGRU to first cool and then compress the
recovered gases. After the cooling and compression steps, the gases are treated in an amine
absorber to remove hydrogen sulfide and then reused for thermal heat generation. Annual
GHG emission reductions are about 89.5 Gg.
▪ Solar photovoltaics. This project introduces a 10 MW solar photovoltaic farm in western Kuwait
partially meet electricity demand at 29 oil wells and related infrastructure in the region. The
major electrical load at oil wells consists of electric submersible pumps which would otherwise be
met by the central grid. Annual GHG emission reductions are about
13.7 Gg.
▪ Improved electric distribution efficiency. This project introduces capacitor bank
technologies at various 11/0.433 KV substations to improve the power factor in the electric
distribution system. Capacitor banks were implemented in 632 transformers around Kuwait
City and showed substantial improvement in the average power factor, leading to a reduction in
distribution losses. Annual GHG emission reductions are about
112.7 Gg.
Baseline scenario trajectories of GHG emissions, CO2e emissions per capita and CO2e emissions per
$ of GDP are illustrated in Figure 4-X. The left side of the figure shows that GHG emissions are
projected to grow from about 86,000 Gg in 2016 to over 142,00 Gg by 2035, an average annual
increase of about 2.67% per year. The right side of the figure shows historical and projected trends
for CO2e emissions as a function of population and GDP. Notably, per capita emissions showed sharp
increases over the 1994-2002 period and declining per capita emissions over the 2002-2016 period,
suggesting that efficiency and co to conservation measures have been effective in counteracting
steady population growth. Additionally, while CO2e emissions as a function of GDP show inter-year
Box 4–1: Regression model used to project
Baseline Scenario emissions through 2035
The final form of the econometric model for year t
is as described below. All regressions statistics
confirm that the model adequately produces
actual GHG emissions over the 1994-2016 period
(e.g., R2 over 0.96).
CO2et = 6.3E+03 + 0.018178*(P)t + 3.17E-08*(GDP)t
Where:
CO2et = national GHG emissions in year t
P = national population in year t
GDP = Gross domestic product in nominal US
dollars in year t

69
volatility, there is a noticeable downward trend – from 3.6 in 1994 to about 1.0 in 2016 - suggesting
that the economy is becoming more efficient from a carbon footprint perspective.
4.3. GHG Mitigation scenario
The GHG Mitigation Scenario incorporates emission reductions associated with several projects that
have been proposed as expansions to the distribution efficiency and solar photovoltaic projects
described above. A brief overview of these projects is provided in the bullets below.
▪ Expansion of improved electric distribution efficiency. This project expands the introduction
of capacitor bank technologies at additional outdoor and indoor 11/0.433 KV substations to
improve the power factor in the electric distribution system. Online years are 2019 and 2020 for
outdoor and indoor substations, respectively. Annual GHG emission reductions are about 219.8
Gg for outdoor substations and 351.8 Gg for indoor substations, or total annual reductions
of 571.6 Gg.
▪ Expansion of renewable-based electricity production. The Shagaya Renewable Energy Master
Plan represents a 3-phase national vision to meet 15% of electricity requirements by renewable
energy by 2030. The Plan incorporates solar thermal, solar photovoltaic and wind technologies.
Phase I of the Plan introduces 50 MW of concentrated solar power, 10 MW of solar photovoltaics
and 10 MW of wind in 2018. Phase II introduces an additional 1,500 MW of solar photovoltaics
by 2022. Phase III of the Plan introduces an additional 200 MW of concentrated solar power,
1,200 MW of solar photovoltaics and 100 MW of wind by 2030. By its completion, the Plan will
have introduced a total renewable energy capacity of 3,070 MW. Annual GHG emission
reductions are about 5,000 Gg, equivalent to a displacement of 12.5 million barrels of oil
equivalent.
The results of the GHG Mitigation scenario are illustrated in Figure 4-X. The left side of the figure
shows projected CO2e emission reductions by measure. The right side of the figure shows the
resulting annual GHG emissions in the Baseline and GHG Mitigation scenarios. By 2030, total annual
emission reductions are about 5,600 Gg, representing a reduction of about 4% of Baseline scenario
emissions in that year. Cumulatively, nearly 60,000 Gg of CO2e is avoided over the entire planning
period by the measures.

69
4.4. Future GHG mitigation opportunities
Going forward, there are several priority strategies that are being considered for achieving
additional reductions, as outline in the bullets below.
▪ Power supply. Supply side combustion efficiency can be increased by shifting from current
technologies to combined cycle gas turbines and maximizing the use of reverse osmosis
over multi-stage flash technology in seawater desalination. Moreover, emissions can be
further decreased by fuel switching (i.e., replacing liquid fuels in existing thermal power
plants with natural gas) and
▪ Transport. There are several promising mitigation options for transport sector that are strategic
for Kuwait. These include fuel efficiency improvements for vehicles, alternative clean fuel,
transportation infrastructure improvement, as well as tariff and subsidy redistribution.
▪ Industry. The industrial sector in Kuwait covers chemicals, manufacturing fertilizers, cement
industry, metallic products and food processing. Waste heat recovery from industrial
processes is an important GHG reduction measure. Furthermore, adoption of more advanced
plants, technologies, and processes are effective mitigation options leading to reduced
electricity demand.
▪ Waste. Mitigation options in waste sector are based on the objectives of the National
Development Plan in improving the efficiency of waste management by developing a safe waste
management system for Solid, liquid and hazardous waste (Ensures the reduction of pollution
levels resulting from traditional waste handling). Encourage the rehabilitation of landfill and gas
utilization. Utilization of biogas from waste-water treatment. And, encourage waste recycling
(Through providing all scientific consultations and provide incentives for investors to carry out
recycling activities).
Going forward, Kuwait plans to build up its mitigation assessment capacities especially those related
to human resources. Additionally, in order to improve the quality of future mitigation assessments,
there is an urgent need to develop a national database for monitoring and reporting information
related to GHG emissions and mitigation projects.

70
4.5. List of references
Kuwait Environment Public Authority, Kuwait, 2018.
State of Kuwait, 2015. Intended Nationally Determined Contributions. November. Kuwait.

5. CONSTRAINTS, GAPS AND NEEDS ................................................................................................. 72
.5.1 CONSTRAINTS ................................................................................................................................... 72
5.2. GAPS ................................................................................................................................................... 72
5.3. NEEDS ................................................................................................................................................. 72

72
5. Constraints, Gaps and Needs Inadequate capacity (technical, financial and institutional) remains one of Kuwait’s significant
challenges as it confronts climate change. Enhancing capacity will depend on overcoming serious
institutional, financial and technical constraints and gaps that currently interfere with affective
action. With adequate support, Kuwait can build climate change resilience and explore the viability
of low-emission development trajectories. The subsections below outline the key constraints, gaps,
and needs to facilitate compliance with UNFCCC obligations and aspirational adaptation goals.
5.1. Constraints
Several technical, institutional, legislative, and financial constraints across various levels have been
identified hindering implementation of climate change adaptation and mitigation activities in
Kuwait. The following bullets are examples of such constraints:
▪ Lack of accurate data bases, and inadequate information and data collection, analysis and
dissemination;
▪ Weak cooperation arrangements between agencies for providing GHG inventory data,
resulting in difficulties in timely data collection; and
▪ Lack of familiarity with current methods and tools for undertaking a quantification of climate
change impacts in vulnerable sectors.
5.2. Gaps The following outlines the key capacity gaps relative to understanding climate change impacts in
Kuwait, as well as policies and measures associated with GHG mitigation:
▪ Lack of access to long-term climate information and associated uncertainties for use in
conducting vulnerability and adaptation assessments;
▪ Inadequate institutional and technical capacity to plan and implement climate change
adaptation measures; and
▪ Limited funding for climate change related research focused on Kuwait and surrounding region.
5.3. Needs Several capacity development needs were identified during the process of preparing the SNC. The
following are among the key needs:
▪ Build public, and policy-maker awareness on climate change;
▪ Strengthen institutional and technical capacities through information and knowledge
management;
▪ Enhance coordination among stakeholders at different levels, especially as it pertains to
database development for future GHG inventories;
▪ Better integrate climate change considerations into national and sectoral development
planning and policy dialogues; and
▪ Promote Involvement of local media in building awareness regarding climate change
impacts and risks.

73
6. OTHER INFORMATION ...................................................................................................................... 74
6.1. SURVEY ...................................................................................................................................................................... 74
6.2. CAPACITY BUILDING RECOMMENDATIONS ............................................................................................................ 74
6.3. PLANNED ACTIVITIES TO REDUCE KUWAIT’S CARBON FOOTPRINT .................................................................... 76
6.3.1. Al-Shigaya renewable energy power park ....................................................................... 76
6.3.2. Solar PV initiatives ........................................................................................................... 76
6.3.3. Petrol and water pricing reforms ...................................................................................... 77
6.4. EDUCATION, TRAINING AND PUBLIC AWARENESS .............................................................................................. 78
6.5. RESEARCH INITIATIVES ............................................................................................................................................ 80
List of Figures Figure 6-1: Al-Shigaya PV technology installation with Kuwaiti officials visiting the site (Phase I) 76
Figure 6-2: Left: Solar PV carpark; Right: Solar PV rooftop system in residential area 77
List of Tables Table 6–1: Responses to capacity building questionnaire ...................................................................... 75
List of Boxes Box 6–1: Example of KFAS research activities on climate change .......................................................... 81

74
6. Other information Inadequate capacity (technical, financial and institutional) remains a critical challenge in addressing
climate change in Kuwait. Hence, the core objective in the preparation of the SNC was to establish a
foundation for carrying out the kinds of assessments that can enhance understanding of the climate
change challenge, inform future policy dialogues, and support the process of preparing subsequent
national communications and biennial update reports.
The preparation of the SNC was highly participatory in nature. A national team was recruited mostly
from relevant ministries and institutions, with senior management at KEPA’s Climate Change section
responsible for overall coordination and quality control. Carrying out the various assessments and
analyses benefitted from inputs from experts from Kuwait University and international
organizations. Staff from the West Asia regional office of the United Nations Environment Program
(UNEP) provided backstopping guidance and technical support.
Preparing this SNC has been instrumental in establishing a new approach for addressing the
challenge of climate change in Kuwait. There is now a network in place facilitating access to data; a
system in place to account for and manage emissions data; and a framework in place to improve and
upgrade information related to crosscutting components in support of climate policy. Not only have
new protocols been established for improved documentation and archiving, but concreate action
has begun promoting climate change education, training, public awareness, and capacity building.
6.1. Survey A survey was undertaken near the end of the SNC process to identify key issues and
recommendations to inform the design of future capacity strengthening initiatives. Participation was
high among all the members of the national team. Of the eight questions in the survey, two in
particular were instrumental in understanding key challenges and formed the basis for subsequent
recommendations for capacity building. The key questions are shown in the bullets below relative to
the preparation of the national circumstances, inventory and vulnerability & adaptation chapters.
Table 6-1 summarizes the responses.
▪ Difficulty. What was the level of technical difficulty/ease experienced in completing each
section of the SNC?
▪ Constraints/gaps. What were the key constraints and gaps faced in preparing each section
of the SNC?
6.2. Capacity building recommendations The survey also provided an opportunity to indicate specific areas where capacity building activities
should be targeted. Indeed, strengthening future capacity of stakeholders to promote and support
GHG inventory development, climate change vulnerability assessment, identification of adaptation
strategies, GHG mitigation analysis, and technology needs assessment is a consensus conclusion
from the SNC process.
Key recommendations regarding the development of national GHG inventories are summarized in
the bullets below.

75
Table 6–1: Responses to capacity building questionnaire
National circumstances GHG inventory/mitigation Vulnerability & adaptation
• Collecting & analyzing data
• Difficulties in providing data
• Lack of guidance
• Some essential data that was missing
• Difficulty convincing some
administrations to provide the required
data
• Gaps in data and years
• Accuracy& lack of data
• Assessment of data quality & analyzing,
estimating data
• Aon-cooperative authorities
• Difference in fiscal & calendar year
• Briefing the report
• Choosing method that best represents
local situation
• Missing data from the source due to
non-recording for early years • Software requires overly detailed data
• Lack of industrial classification according
to energy use
• Data inconsistency from different
sources leading to inappropriate
decisions and high uncertainty
• Inventory software (v2.54 )
unmanageable sometimes
• Difficulty in collecting data
• Lack of following up
• Delays in providing the necessary
technology to complete the work
• Inaction between members of one team
• Climate data (for a long period) for
Kuwait and surrounding region
• Models and the gaps of the data in the
whole region
• Data collection of physical and fisheries
• Format of the report
• Some Experts have no time to meet with
other members of the group
▪ Establish a national system to collect and manage activity and emission data required for updates
to the inventory;
▪ Establish an ongoing GHG inventory committee with high-level representation from key
ministries/institutions, having clear oversight and coordination authority; and
▪ Develop an integrated database of relevant information including annual statistical
abstracts and annual reports from specific entities.
Key recommendations regarding the analysis of national GHG mitigation opportunities are
summarized in the bullets below.
▪ Obtain training in methods and tools to analyze in detail the costs, benefits, and co- benefits
of GHG mitigation policies and measures, starting with those included in Kuwait’s nationally
determined contributions;
▪ Build a cost and performance database regarding energy supply and energy demand
management technologies and practices; and
▪ Develop a centralized database for monitoring and reporting information related to GHG
emissions and mitigation projects.
Key recommendations regarding the assessment of vulnerability of key sectors and systems,
together with the formulation of adaptation strategies are summarized in the bullets below.
▪ Obtain training in modeling approaches to assess the impacts of a) rising seas on coastal zones,
b) water efficiency/conservation policies on water demand, c) changing salinity/temperature
on commercial fisheries, and d) emissions co-benefits of renewable energy investments on
public health;
▪ Obtain training on how to establish a national framework that links the results of
vulnerability assessments to ongoing policy dialogues regarding adaptation options and
strategies; and
▪ Conduct seminars and training workshops to build awareness among managers and
decision makers of the consequences of climate change and the need to incorporate
adaptation considerations in utility, urban, and resource planning.
Co
ns
tra
ints
/ga
ps
Dif
fic
ult
y

76
6.3. Technology Needs Assessment
This chapter provides an overview of a technology needs assessment for climate change.
Both mitigation and adaptation technologies were considered. The technologies considered
encompass “hard” technologies, such as equipment and infrastructure, as well as “soft”
technologies, such as management practices and institutional arrangements.
According to the regulations of the UNFCCC, parties are supposed to submit an assessment
of their countries technological needs. In 2012, the State of Kuwait submitted the Initial
National Communications under the UNFCCC, which included initial technological needs
assessment. In 2018, Kuwait developed the second Technology Needs Assessment (TNA)
report, which is part of the Second National Communications (SNC) Report.
6.3.1 Methodology
UNDP’s Technology Needs Assessment (TNA) methodology was used to develop an
understanding of the range of technology options that could be harnessed to address the
challenge of climate change in Kuwait (UNDP, 2010). The TNA methodology essentially
involved the development of a set of multi-criteria evaluation matrices for potential
technologies to either reduce future GHG emissions or reduce Kuwait’s vulnerability to the
impacts of climate change.
Enhancing technology development, transfer, deployment and dissemination is a key pillar
of the international response to climate change. As a result, and to support the
implementation of the UNFCCC Paris Agreement, Parties to the UNFCCC initiated the
elaboration of the technology framework to further promote and facilitate enhanced action on
technology development and transfer. The work on technology needs assessment (TNA) will
play a key role in the implementation of climate technologies.
With reference to the aforementioned, the UNFCCC executed the Technology Needs
Assessment (TNA) project. The Technology Needs Assessment (TNA) project assists
developing country Parties to the UNFCCC determine their technology priorities for the
mitigation of greenhouse gas emissions and adaptation to climate change. TNA is a set of
country-driven activities leading to the identification, prioritization and diffusion of
environmentally sound technologies for mitigation and adaptation to climate change.
In early 2017, Kuwait Environment Public Authority (KEPA) signed an agreement with the
Regional Office for West Asia of the United Nations Environment Program (UNEP) to
supervise the preparation of technical tasks implementation of the SNC project and the first
periodic report of the State of Kuwait on the UNFCCC. To achieve main objective of this
project, KEPA executed the SNC project in cooperation with several governmental
organizations involving oil, power, industry, transportation, agriculture, waste, and research
and education fields. All the efforts that has been taken by KEPA were to serve all the SNC
aspects; in addition, a sure a successful completion of the report.
This report introduces an updated assessment of Kuwait’s technological needs by referring
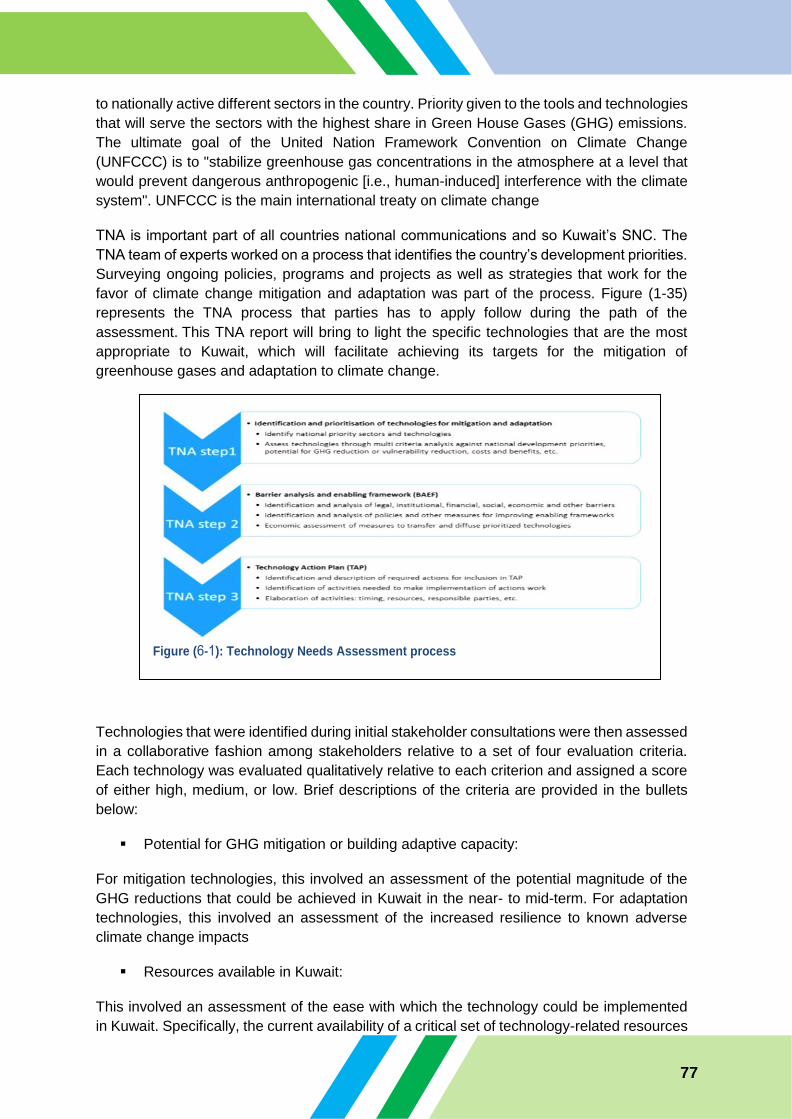
77
to nationally active different sectors in the country. Priority given to the tools and technologies
that will serve the sectors with the highest share in Green House Gases (GHG) emissions.
The ultimate goal of the United Nation Framework Convention on Climate Change
(UNFCCC) is to "stabilize greenhouse gas concentrations in the atmosphere at a level that
would prevent dangerous anthropogenic [i.e., human-induced] interference with the climate
system". UNFCCC is the main international treaty on climate change
TNA is important part of all countries national communications and so Kuwait’s SNC. The
TNA team of experts worked on a process that identifies the country’s development priorities.
Surveying ongoing policies, programs and projects as well as strategies that work for the
favor of climate change mitigation and adaptation was part of the process. Figure (1-35)
represents the TNA process that parties has to apply follow during the path of the
assessment. This TNA report will bring to light the specific technologies that are the most
appropriate to Kuwait, which will facilitate achieving its targets for the mitigation of
greenhouse gases and adaptation to climate change.
Technologies that were identified during initial stakeholder consultations were then assessed
in a collaborative fashion among stakeholders relative to a set of four evaluation criteria.
Each technology was evaluated qualitatively relative to each criterion and assigned a score
of either high, medium, or low. Brief descriptions of the criteria are provided in the bullets
below:
▪ Potential for GHG mitigation or building adaptive capacity:
For mitigation technologies, this involved an assessment of the potential magnitude of the
GHG reductions that could be achieved in Kuwait in the near- to mid-term. For adaptation
technologies, this involved an assessment of the increased resilience to known adverse
climate change impacts
▪ Resources available in Kuwait:
This involved an assessment of the ease with which the technology could be implemented
in Kuwait. Specifically, the current availability of a critical set of technology-related resources
Figure (6-1): Technology Needs Assessment process

78
- financial, institutional, and infrastructural - were considered
▪ Cost-benefit ratio:
This involved an assessment of the performance of the technology in terms of its costs (i.e.,
capital investment, operation and maintenance costs) relative to the potential benefits (i.e.,
emission reductions, reduced impacts) achieved
▪ Contribution to Kuwait development priorities:
This involved an evaluation of the extent to which the technology was consistent with national
development objectives and constraints.
6.3.2 Mitigation technology assessment
Due to the prominence of energy production and consumption in Kuwait’s GHG emission
profile, the focus of the TNA was exclusively on the energy sector. Specifically, technologies
for electricity generation, as well as technologies that can reduce residential building energy
consumption were targeted. An overview of the results of the assessment is provided in the
subsections below.
Kuwait like all the GCC countries rely heavily on fossil fuel to meet its increasing demand for
electricity. One can see that more than 65% of GHG emissions are associated with the power
generation, water desalination sector, and manufacturing industries, which exclusively
depends on fossil fuel (Figure (6-3). The relative high consumption of electricity and water is
the result of :
▪ Harsh hot environment
▪ Lack of natural potable water and
▪ Weak energy efficiency measures.
Figure (6-3): Average percentage CO2e emission by sectors
from year 1994 to 2016.
79
The main contributors to the emission are both, the energy with a share of 66%, and
transportation sector with a share of 15%. The energy is composed of the following sectors:
▪ Electricity
▪ Water and
▪ Manufacturing that involve fossil fuel combustion activities
Advanced fossil technologies for electricity generation
Achieving a sustainable and more competitive energy system is one of the most critical
challenges for Kuwait’s future. Advanced fossil technologies for electricity generation refer
to options that have either higher operating efficiencies or lead to sharply lower GHG
emissions when compared to current technologies in use in Kuwait. Some of these
technologies are already in limited use in Kuwait. Examples include high efficiency natural
gas combined cycle units and district cooling. Others have yet to be introduced and represent
potentially significant contributors for achieving future GHG emission reductions. A brief
overview of these priority technologies is provided in the bullets below. Table 5-1 summarizes
the results of the evaluation of these technologies.
▪ Carbon capture and storage (CCS):
This technology prevents up to 90% of CO2emissions associated with power generation
from being released into the atmosphere. CCS separates CO2 emissions from the process
and transports compressed CO2 to secure geological storage locations, such as Kuwait’s
abandoned oil fields and deep saline formations. Several methods are becoming
commercially available: post-combustion, pre-combustion, and oxy-fuel combustion, each
offering different strengths and weaknesses, depending on the nature of the investment.
Carbon capture and storage (CCS) technologies, which could enable the use of fossil fuels
while reducing the emissions of CO2 into the atmosphere, have yet to achieve significant
cost reductions to be widely deployed.
▪ Natural gas combined cycle (NGCC):
This technology is able to operate more efficiently by harnessing the large amount of heat
emitted by a primary gas turbine for generating steam in a second turbine. Whereas a well-
maintained conventional steam plant typically achieves combustion efficiency between 30%
and 33%, advanced NGCC units can achieve combustion efficiencies equal to about 45%.
▪ District cooling:
This technology uses the thermal energy from electricity generation, which would
otherwise be wasted, to drive absorption chillers for air conditioning. In Kuwait’s urban
landscape, district cooling can be developed in new neighborhoods, providing a more
efficient central cooling plant, rather than inefficient air conditioning units that contribute to
stress on the electricity transmission and distribution infrastructure.

80
▪ Fuel switching:
This refers to switching from high-emitting liquid fuels such as residual oil or diesel to
natural gas. Fuel switching from oil to gas can reduce CO2 emissions by 10-30% an input
basis. This technology is suitable for Kuwait because a large portion of the world’s gas
reserves is located in nearby countries in the Arabian Gulf region, despite the fact that
Kuwait’s own natural gas reserves are minimal.
▪ Low-sulfur oil refining:
This technology refers to the production of low-sulfur fuels at Kuwaiti refineries. Two
initiatives for implementing such technology are already underway in Kuwait, the Clean Fuels
Project (CFP) and New Refinery Project (NRP). The use of low-sulfur fuels results in lower
SO2 emissions, which are an indirect greenhouse gas that is included in the national GHG
inventory.
To establish a successful mitigation strategy, Kuwait must promote gas in the energy mix
for diversification and decarbonization. The following steps must be considered:
a) Support Kuwait Petroleum Corporation’s (KPC’s) target to achieve 2.5 Bcf/d of non-
associated gas production capacity by 2030
b) Expedite implementation of the Al-Zour LNG import and storage facility
c) Expedite MEW’s efforts to maximise gas-fired power generation
d) strategically explore the potential for regional cross-border pipeline gas imports.
Renewable technologies for electricity generation
Exploring the second primary option, Kuwait initiated serious efforts to harness renewable
energy much before a worldwide awareness of global warming. Solar power generation and
application of solar energy for desalination and air-conditioning were the major areas of
research from mid-seventies till mid-eighties. Renewable technologies for electricity
generation refer to options that rely on non-emitting energy resources such as solar and
wind. Several renewable technologies represent potential opportunities for ready integration
in the energy system of Kuwait. A brief overview of these priority technologies is provided in
the bullets below. Table 5-2 summarizes the results of the evaluation of these technologies.

81
- thermal: This technology encompasses a range of small- and large-scale, A 100 KW
solar thermal power station using the parabolic dish collector was commissioned in
late 70.
- Building-integrated PV systems (BIPV): This technology involves the small-scale use
of photovoltaic panels within parts of a building’s envelope such as its roof or facades,
solar cooling systems of small and medium cooling capacity using flat plate collectors
and vapor absorption chillers were installed in a solar house, kindergarten and the
ministry of defense building.
- Centralized solar photovoltaic (PV): This technology involves the large-scale use of
photovoltaic panels that use the sun’s rays to induce a difference in charge, or
voltage, across two materials and thereby produce an electric current. Mirrors may
Technology Mitigatio
n Potential
Resources
Available in
Kuwait
Cost Benefit
Contribution to
development priorities
Currently Implemente
d (or in process)
Carbon Capture and Storage
High High Medium High No
Combined Cycle Gas Turbines
Medium Low Medium Medium Yes
District Cooling Medium Medium High High Yes
Natural Gas fuel switching
Low Low Low Medium Yes
Reduced Sulfur Oil Refineries
Low High Medium High Yes
Table 0-2: Mitigation technology evaluation valuation results for advanced fossil technologies for electricity
generation
Technology Mitigation
Potential
Resourc
es
Availabl
e
in
Kuwait
Cost
Benefit
Contribution
to
development
priorities
Currently
Implemente
d (or in
process)
Centralized Solar PV High High High High Yes
Building-integrated PV High High High High No
Solar Thermal Energy Medium High High High Yes
Solar Ponds High Medium Mediu
m High Yes
Wind Energy High Low Low High No
Table 6-1: Mitigation technology evaluation valuation results for renewable technologies for electricity
generation

82
be used to concentrate sunlight onto a solar cell and tracking —both single and
double axis —devices may be installed to maximize a direct line as the sun moves
across the horizon. Since Kuwait’s daily electricity peaks are coincident with the solar
energy profile, centralized solar power is potentially highly viable, therefor, several
installations of photovoltaic (PV) solar systems were installed including the one of
nearly 40 kW in a school. Other minor size PV units were installed for remote
applications.
- options that harness solar thermal energy for domestic water heating.
- Solar ponds: This technology uses temperature gradients within pools of salt water
to collect thermal energy. The salinity gradient causes a density gradient that traps
warmer water near the bottom layer. This technology was first considered in Kuwait
in the later 1980s.
- Wind energy: This technology harnesses the wind kinetic energy into electrical power.
The primary requirement for feasibility of this technology is available wind resources.
A site is considered economically feasible with wind velocities of 5.6 m/s at an altitude
of 10 meters—also known as class 3 wind speeds. Initial studies show that annual
average wind speed in Kuwait is only 5.5 m/s—just below the class 3 wind speed limit
for economic feasibility (Al-Nassar 2005).
Shagaya Renewable Eenegy Power Park
Shagaya project Kuwait’s first step toward energy diversification. The renewable energy
power plant comes with a national objective, that is to diversify sources of power to supply a
considerable part of the local demand. The RE park represents the Kuwaiti Government’s
long-term ambitions of securing a significant renewable energy capability by the year 2030
in order to contend with rising domestic energy demands and keep additional crude oil
resources for export.
This government-funded facility is currently under the supervision of KISR who are dedicated
to exhaustively testing solar thermal, photovoltaic and wind energy technologies in order to
determine their feasibility for further deployments across Kuwait. Three Phases of the 3.070
GW Shagaya RE Master Plan:
- Phase I: 70 MW of RE capacity (50 MW CSP, 10 MW PV and 10 MW Wind); totally
the responsibility of KISR. Figure (6-4)
- Phase II: 1500 MW, extension of the plant to a total of 1,570 MW installed RE
capacity; the added 1500 MW plant is going to be totally PV technologies. Phase II
will be totally under the supervision of the Kuwait Petroleum Corporation (KPC) and
fund will be provided from the Kuwait National Petroleum Company (KNPC).
- Phase III: 1500MW, extension of the plant to a total of 3,070 MW installed RE
capacity. The added 1500 MW will be composed of 1200 MW Solar PV, 200 MW
Solar thermal and 100 MW wind energy. Phase III will be the responsibility of the
Ministry of Electricity and Water (MEW).

83
Technologies to reduce electricity consumption in buildings (Residential, public, and commercial buildings)
Technologies to reduce electricity consumption in buildings refer to a range of options that
improve building performance from an energy perspective. Building performance is
dependent on several factors including envelope design and materials; heating, cooling,
ventilation and lighting systems; occupancy density, site topography, and behavior of the
building’s inhabitants.
Residential sector is the major consumer of electricity accounting for more than half of the
total electricity exported by the power plants. Interestingly, nearly 15% of the generated
electricity used in the power plants for operation of various motors and for maintaining the
indoor environment. In Kuwait, Air-conditioning (A/C) is the single largest consumer of
electricity as it accounts for nearly 70% of the annual peak load demand and over 45% of
yearly fresh electricity consumption. Lighting, the second most important consumer of
electricity accounts for 15% of peak power and 20% of annual energy consumption Both, air-
conditioning and lighting are heavily used in all type of buildings, residential, public and
commercial, in addition to industrial facilities.
Figure (6-5) shows the percentage of electricity consumption for the major consumers of
electricity.
Figure (6-4) :Shagaya (phase I) 10 MW wind turbines, total of 5
wind turbines each of 2 MW.
Figure (6-5): Composition of electricity consumption (%)
12%
11%
49%
8%
11%
7%
P & D AuxiliariesTransmission & DistributionResidentialStreet Lighting & InfrastructureCommercialAgriculture

84
Reduction in the total primary energy demand, either in its direct consumption as in
transport sector or improving conversion efficiency to secondary energy such as in the
electricity sector is obviously the primary option to be targeted in the case of Kuwait.
Accordingly, due to relevance and benefit to the national economy, energy conservation has
been the essential goal, Several energy efficiency and conservation measures are already
being implemented in Kuwait to minimize electricity consumption from the different sectors.
These measures range from regulatory, technology, economic and information measures
Other measures represent new and potentially viable opportunities for improving residential,
public and commercial sectors performance in Kuwait.
These measures fall under two main categories:
I. Demand side management measures
II. Supply side management measures.
Implementing energy efficiency measures in buildings sector to support a national mitigation
policy:
• Update building regulations/codes to reduce AC permissible power, enhance
fenestration systems, and install PV building integrated systems
• Retrofit buildings
• Implement district cooling
• Implement standardized labelling program for appliances and equipment
• Promote energy service companies.
Examples for measures from the former category include electrical load management and
use of renewable energy sources to produce electricity. Examples for this category include:
• Setting energy efficiency performance standards
• Electricity tariff reforms
• Energy labelling
• Smart metering, and
• Public awareness leading to behavioral change
A brief overview of the priority technologies is provided in the bullets below. Table 6-3
summarizes the results of the evaluation of these technologies.
• Advanced controls: This technology involves the installation of advanced control
systems to reduce solar heat gain in buildings. These systems operate by sensing
direct sunlight through building windows. When the daylight intensity reaches some
pre-set threshold, day lighting controls are triggered that automatically dim lights or
close window shades. When combined with occupancy sensors that automatically

85
manage cooling needs, the efficiency and functionality of living spaces can be
enhanced, resulting in significant electricity savings. High performance buildings are
often characterized by advanced control systems such as these.
• Building rating systems: This technology involves the development of a system that
can provide a meaningful metric for measuring the energy performance of residential
buildings. Such a system can provide an objective signal to commercial architects,
designers, and builders regarding what constitutes a “high performing” building from
an energy perspective. Two examples from the Gulf region, the Pearl Rating System
in the Abu Dhabi emirate’s Estidama (sustainability in Arabic) program and the
residential component of Qatar’s Sustainability Assessment System (QSAS) may be
helpful in informing the development of a rating system for Kuwait.
• Building codes: From a policy perspective, standards and codes are often used as a
means of regulating and promoting energy-efficient building design and construction.
These codes generally regulate wall and roof insulation, window glazing, ventilation,
cooling efficiencies, cooling refrigerants and lighting. In Kuwait, the Energy
Conservation Code of Practice (R-6), developed in 1983, sets minimum requirements
for efficient energy use in new and retrofitted residential buildings. Efforts are
underway since 2009 to update the code to energy conservation codes developed by
the American Society of Heating, Refrigerating and Air Conditioning Engineers
(ASHRAE 90.2).
• Incentives for renewable: Incentives may be used to shift behavioral trends among
consumers, driven by the prospects of cost savings. Incentives for renewable energy
would encourage investment in the use of solar energy for distributed household-
scale energy production and domestic hot water heating. Such incentives are
currently not in place in Kuwait.
• Reduced subsidies: Tariffs may also be used to affect consumer behavior. For
example, retail electricity prices that reflect the total costs of electricity (i.e.,
Technology Mitigation Potential
Resources
Available in
Kuwait
Cost Benefit
Contribution to
development priorities
Currently Implemente
d (or in process)
Advanced Controls High Medium High High Yes
Building Rating System Medium Medium High High No
Building Codes High Medium Medium High Yes
Incentives for Renewable
Medium High Medium Medium No
Reduced Subsidies Medium High High High No
Awareness Campaigns Medium Medium High Medium Yes
Table 0-3: Mitigation technology evaluation results for residential building performance

86
production, transmission, distribution, and non-price factors) would encourage more
electricity conservation. In Kuwait, residents are charged the lowest electricity rate
in the world, at US$ 0.007per kWh, which is only 5% of the actual cost of electivity in
Kuwait. Notably, this price has not changed since 1962 (Krane 2012).
• Awareness campaigns: Since people tend to take energy for granted, many are
unaware of opportunities to reduce energy use. Some may claim to favor energy
efficiency but are unclear regarding the changes involved in behavior. In Kuwait, the
Tarsheed awareness campaign was implemented following the electricity crisis of
2006. The campaign, with a budget of nearly US$ 36 million Kuwaiti Dinars, uses
billboards, newspapers, television, airport public announcements to urge consumers
to shift power demand away from afternoon peak periods. As a specific example, the
campaign encourages residents to do laundry during the evening hours when lower
air conditioning requirements prevail.
6.3.3 Adaptation technology assessment
Three sectors that are considered highly vulnerable to climate change impacts were the
focus of the adaptation technology assessment, coastal zones, water resources, and public
health. An overview of the results of the assessment is provided in the subsections below.
Coastal zones
The majority of Kuwait’s population resides and works in close proximity to the coastline,
rendering the population and infrastructure susceptible to the impacts associated with climate
change-induced sea level rise. With the buildup of chalet vacation homes along the coast
and other infrastructure investments, the protection of coastal zones is increasing as a
national priority.
Technologies for Kuwait’s coastal zones refer to a range of options that can to reduce the
vulnerability of people and infrastructure from the adverse impacts of rising seas. Some
measures are already being implemented in Kuwait to address coastal erosion. Other
measures represent new and potentially effective responses to future inundation and erosion
threats. below summarize the results of the evaluation of these technologies.
A brief overview of these priority technologies is provided in the bullets below:
• Coastal information systems: This refers to information management regarding key
features of the coastal zone, such as high-resolution land elevations and sea levels
based on tide gauge data. In Kuwait, a Coastal Information System (CIS) has been
developed based on hydrodynamic models to predict wave height and period from
wind data for Kuwait’s territorial waters. This information translates into water level
and current statistics as well. These forecasts are accessible on the internet through
a graphical user interface at http://www.hceatkuwait.net/ (Al-Salem 2008).
• Tidal barriers: This technology involves the construction of “hard” coastal protection
structures. These include seawalls, levees, floodbanks, stopbanks, and

87
embankments. Each function essentially as a barrier against the sea level at the
maximum high tide level.
• Setbacks: This refers to establishing a rigorous definition of what constitutes
“buildable land”, i.e., land that is located a safe distance inland from coastal
inundation zones. Construction within the zones at risk from future sea level rise
would not be permitted. These setbacks can be established relative to either elevation
or lateral distance from the coast.
• Prediction/prevention Center: This refers to the establishment of a Center in Kuwait
to develop the systems, protocols, and models to address the impacts of climate
change on coastal zones. The focus of such as Center would be to systematically
develop the technical capacity to predict the assorted impacts of sea level rise on the
coastal and marine environments, as well as to develop management plans to cope
with coastal threats and disasters.
• Awareness campaigns: This refers to the development of programs to increase the
understanding of coastal developers, builders, and the public at large regarding the
emerging threats from sea level rise.
Technology Adaptatio
n Potential
Resources
Available in
Kuwait
Cost Benefit
Contribution to
development priorities
Currently Implemented
(or in process)
Coastal Information System
Medium Medium Medium Medium Yes
Tidal Barriers Medium Medium Medium Medium Yes
Setbacks High High High Medium No
Prediction/ Prevention Center
High Medium High Medium Yes
Awareness Campaigns Medium Medium High Medium Yes
Table6-4: Adaptation technology evaluation results for coastal zones

88
Water resources
The challenge to effectively manage Kuwait’s already scarce water resources will likely
intensify under climate change. Kuwait’s dry, hyper-arid climate places great stress on the
scarce freshwater resources available, while desalinated water is both costly and a source
of greenhouse gas emissions.
Technologies to manage Kuwait’s water resources refer to a range of options that can
either increase water supply or increase the efficiency with which water is consumed. Some
measures are already being implemented in Kuwait to address water supply and demand.
Other measures represent new and innovative responses to water balance constraints. A
brief overview of these priority technologies is provided in the bullets below. Table 6-5
summarizes the results of the evaluation of these technologies.
• Water resources program: This refers to information management regarding key
features of the coastal zone, such as high-resolution land elevations and sea levels
based on tide gauge data. In Kuwait, a Coastal Information System (CIS) has been
developed based on hydrodynamic models to predict wave height and period from
wind data for Kuwait’s territorial waters. This information translates into water level
and current statistics as well.
• Water pricing: This refers to water pricing strategies that can affect consumer
behavior. For example, water prices that reflect total costs of extraction/production
would encourage more water conservation. In Kuwait, one study predicted a 33%
reduction in water from a water pricing strategy that included a free daily allowance
of 150 liters per capita, followed by a constant rate of $1 per additional thousand liters
of water .
Technology Adaptatio
n Potential
Resources
Available in
Kuwait
Cost Benefit
Contribution to
development priorities
Currently Implemented
(or in process)
Water Resources Program High High Medium High Yes
Water Pricing High High High High No
Reverse Osmosis
Desalination High Low High Medium No
Multi-Stage Flash
Desalination High High Medium Medium Yes
Building Retrofits Medium Medium Medium High Yes
Irrigation Water Use
Efficiency High High Medium High Yes
Table 0-5: Adaptation technology evaluation results for water resources

89
• Reverse osmosis desalination: This technology involves using semi-permeable
membranes and pressure to separate water from salt. Compared to other types of
desalination technology, reverse osmosis has sharply reduced energy requirements.
While the use of solar photovoltaic panels could further reduce fossil fuel needs,
some supplementary fuels or thermal storage systems would be necessary to
account for the intermittent nature of solar power .
• Multi-stage flash desalination: This technology is the most commonly used in the
Arabian Gulf region for desalination. It involves the use of countercurrent heat
exchangers to flash evaporate water into steam and collects the resulting
condensation.
• Building retrofits: This refers to the installation of water-efficient devices in residential
buildings. This is particularly important for Kuwait as the residential sector generates
the greatest demand for freshwater. Examples of retrofits include new plumbing
fixtures, new or tightened seals, water-efficient appliances such as dishwashers and
washing machines, and upgrades to HVAC systems. Devices can be installed to
measure water consumption and make the consumer more aware of their
consumption.
• Irrigation water use efficiency: This refers to several types of technology to reduce
water demand such as bio-diverse plantings, hydrozoning, and smart-irrigation
controls. Bio-diverse plantings refer to the selection of particular plants for irrigation
that account for Kuwait’s harsh climate and biodiversity conditions. Hydrozoning
refers to the process of segregating plants based on their water needs to prevent
unnecessary or excessive irrigation. Smart irrigation control refers to systems that
can sense weather conditions and irrigate plants to maximize efficient water use.
• Awareness campaigns: This refers to the development of programs to increase the
understanding of the public at large regarding the emerging threats from climate
change on Kuwait’s precious water resources.
Public health
Climate change is expected to exacerbate public health primarily through the impacts on
air quality. Under the increased temperatures associated with climate change, it is possible
that dust storm frequency and intensity could increase, as well as concentrations of ozone
emissions of volatile organic compounds and nitrogen oxides in the presence of sunlight and
increasing temperatures.
Technologies to build resilience against climate change impacts on public health in Kuwait
refer to a range of options that can monitor or reduce environmental loadings that lead to
indoor/outdoor air pollution that can contribute to respiratory diseases. Some measures are
already being implemented in Kuwait to monitor air pollution. Other measures represent new
and innovative responses to public health threats. A brief overview of these priority
technologies is provided in the bullets below. Table 0-5 summarizes the results of the
evaluation of these technologies.

90
• Air quality monitoring: This technology refers to the development of an enhanced air
quality information and monitoring infrastructure to cope with the additional threats to
public health from climate change. Currently in Kuwait, the Kuwait Institute for
Scientific Research an air monitoring station which can measure NOx, CO, CO2,
H2S, SO2, O3, CH4 and non-methane hydrocarbon concentrations at various sites
.The government operates and maintains an additional 15 air quality stations to
monitor concentrations of SO2, NO2, CO, ground-level ozone (O3), and particulate
matter less than 10 microns in diameter (PM10) and one mobile laboratory .
• Vegetation: This refers to the role that drought-resistant vegetation can play in
controlling and reducing dust fallout from dust storms and land degradation. In
Kuwait, one study showed that vegetation decreases dust fallout by at least two-thirds
in densely vegetated areas. Terrestrial vegetation options include Nitrariaretusa, a
large plant particularly appropriate for areas like Kadhma and Al-Mutla northwest of
Kuwait City. Other options include the expansion of conservation land to include
major sources of dust, muddy playas, and muddy tidal flats; green belts in the open
desert to reduce high wind speeds; and cultivating marshes with salt-tolerant
vegetation, like mangroves, to reduce amounts of airborne salt in the winter.
• Awareness campaigns: This refers to the development of programs to increase the
understanding of the public regarding measures that can reduce dust levels, such as
environmentally friendly camping practices.
6.3.4 Barriers to technology transfer
The priority technologies discussed above for mitigation and adaptation face a number of
barriers for widespread adoption in Kuwait. Two particular barriers to technology
transfer/adoption – existing technology policymaking/regulatory environments and location-
specific constraints - have been identified during the TNA process as requiring urgent
attention. An overview of these key barriers is provided in the bullets below.
• Policymaking and regulatory environment: In Kuwait, policymaking and regulatory
practices can often slow down necessary action for GHG mitigation. For example,
policymaking related to electricity rate subsidies does not adequately account the
extent to which these subsidies can thwart other important national development
priorities. High electricity subsidies result in a situation where demand-side energy-
efficient technologies, typically among the most cost effective of all GHG mitigation
options, are too costly when compared to very low retail electricity prices.
• Location-specific conditions: Kuwait’s hyper-arid desert climate presents a major
barrier to many hard technologies that could be used for climate change adaptation.
Both temperature, which can exceed 50°C in summer, and frequent dust storms,
common between March and August, can have serious adverse effects on some of
the technologies discussed in previous sections. Effective technology transfer
requires maintenance and hygiene requirements that result from dust and sand
accumulation. Additionally, the sudden cloudbursts that are common from October to
April bring excessive amounts of rain capable of damaging key infrastructure.

91
6.3.5 Conclusions and recommendations
The recent oil prices drop (since late 2104), environmental concerns and geopolitical
stresses have led to accumulation of negative implications on country’s socio-economic
sectors. Therefore, the need for an updated sustainable energy strategy that can deal with
the domestic and international challenges has become an urgent requirement.
Given the critical challenges faced by Kuwait’s energy system, there is a need to draw up a
national energy strategy that establishes the main goals to be pursued in the next few years
and the fundamental decisions to be taken towards these goals and define the priorities of
policy action. A sustainable national energy strategy needs to cover four dimensions:
• Energy security: Recognizing the fact that current energy policies (business-as-
usual) are not sustainable in the medium to long term;
• Economic security: Recognizing the impact of rising domestic energy consumption
and oil market uncertainty on the Kuwaiti economy;
• Environmental security: Recognizing the environmental benefits relating to air quality
improvements and mitigating local pollution impacts, as well as employment and
diversification opportunities that a shift to sustainable energy can provide; and,
• Engagement and collaboration with stakeholders (government and private sector):
partnerships between them, can be extremely beneficial in promoting and informing
policies that can facilitate the transfer of technology for mitigation and adaptation in
Kuwait and implementing a successful strategy.
It is of great importance to overcome the barriers identified above in order to develop an
enabling framework in Kuwait for technology transfer and local technological innovation. The
several key recommendations emerged from the TNA process to promote an enabling
environment, as briefly summarized in the bullets below:
• Implement energy efficiency measures in buildings sector: (a) update building
regulations/codes to reduce AC permissible power, enhance fenestration systems,
and install PV building integrated systems; (b) retrofit buildings; (c) implement district
Technology Adaptatio
n Potential
Resources
Available in
Kuwait
Cost Benefit
Contribution to
development priorities
Currently Implemente
d (or in process)
Air Quality Monitoring Medium Medium Medium Medium Yes
Vegetation High High Medium High No
Awareness Campaigns Medium Medium High Medium Yes
Table 6-6: Adaptation technology evaluation results for water resources

92
cooling; (d) implement standardized labelling program for appliances and equipment;
and (e) promote energy service companies.
• Implement transportation efficiency measures: (a) expedite the implementation of fuel
efficiency standards for passenger vehicles; and (b) expedite the construction of a
modern, efficient, mass public transportation system.
• Implement energy pricing reforms as one of the tools to alter consumer behavior: (a)
gradually replace universal subsidies with targeted compensation schemes to eligible
consumers; (b) incorporate measures to protect energy-intensive firms in the
economy from the effects of price increases; and (c) launch a sustained long-term
public awareness campaign ahead of energy price reforms.
• Accelerate transmission and distribution initiatives through tariffs and supply industry
restructuring, for instance, by the introduction of smart metering, distribution retrofits
for power factor correction, and distributed generation.
• Involve the private sector in power generation: (a) develop a clear legislative and
contractual framework for the protection of investors’ rights; (b) ensure
creditworthiness of state institutions contracting with the private sector through
government guarantees; (c) empower the designated regulator to enforce decisions
under a clear regulatory framework with minimal intervention from higher levels of
government; and (d) provide a level playing field for private investors vis-à-vis state
companies to support the development of the private sector in energy.
• Reform and strengthen policies and measures: Policies and measures must be
altered to accelerate the adoption of technology transfer. Furthermore, monitoring,
reporting and verification procedures should be set in place in order to properly
enforce policies that support GHG mitigation and adaptation to climate change,
furthermore, Expedite measures to improve the efficiency of electricity and water
production
• Foster the emergence of technology “champions”: This will involve the establishment
of a national research center to support climate change adaptation and mitigation
activities. Such investments lead to the emergence of technology champions and
key players at all levels. The center would be responsible for identifying processes
and measures to be changed, identifying information and training requirements, and
building partnerships across stakeholder communities within Kuwait and among
potential international partners.
• Develop market-based technology support systems: This involves encouraging the
development of new markets for technology, and the accompanying
financial/technology support services. Priority actions include familiarizing decision-
makers of new opportunities, creating new mandates and investment incentives that
promote market push-pull dynamics, and raising awareness through information
campaigns.
• Strengthen technical capacity and education: Skills training and education on all
levels are important for the transfer of technologies for adaptation and mitigation.

93
Universities and vocational institutions in Kuwait have already begun educating
students about climate change mitigation and adaptation challenges. Successful
technology transfer will require the alignment of mitigation/adaptation needs with
training for new technologies that can meet future mitigation and adaptation goals.
94
6.4. Education, Training and Public Awareness There have been substantial efforts to provide environmental education and targeted educational
activities. Several initiatives and projects have been implemented to promote environmental
education in schools, universities and as part of continuing professional development to increase
awareness of climate change threats. Some of the major institutions and activities are summarized in
the bullets below.
▪ Kuwait University (KU): At both undergraduate and graduate level KU offers many courses
and degrees through its various faculties. The various undergraduate programs equips
students with basic environmental knowledge and advanced applications of environmental
technologies in conservation of natural resources along with the use of contemporary
information systems in environmental decision-making. The graduate programs offer
master’s degrees in environmental science and other disciplines.
▪ Public Authority for Applied Education and Training (PAAET): This is the other major
academic institution in Kuwait, in terms of number of disciplines and of enrolled students.
PAAET offers bachelor’s degree in two environment-related field: Industrial Hygiene and
Applied Environmental Sciences. In June 2016, PAAET signed a memorandum of
understanding with the Environment Public Authority to enhance coordination, unify efforts
and support scientific and technical cooperation to preserve the environment and to ensure
its sustainability. The MOU will encourage research by faculty members in the
environmental fields and assist in educating students about the urgency to preserve the
environment.
▪ Global Learning and Observations to Benefit the Environment. On the informal basis,
KFAS, in collaboration with Ministry of Education has launched the international Global
Learning and Observations to Benefit the Environment (GLOBE) Program. The informal
education program provides students and the public worldwide with the opportunity to
participate in data collection and the scientific process and contribute meaningfully to an
understanding of the Earth system, global environment in general, and climate change in
particular. GLOBE provides grade level-appropriate, interdisciplinary activities and
investigations about the atmosphere, biosphere, hydrosphere, and soil/pedosphere, which
have been developed by the scientific community and validated by teachers. GLOBE
connects students, teachers, scientists, and citizens from different parts of the world to
conduct real, hands-on science about their local environment and to put this in a global
perspective.
▪ Kuwait Society for Environmental Protection (KEPS): This is a well-established civil society
organization that has been active in environment safeguards and increasing environmental
awareness in Kuwait since 1974. The Society issues a monthly bulletin, which includes
studies written by leading scholars who have influenced decisions in environmental
planning and management. On 28 March 2017, the Society signed a memorandum of
understanding with the Public Authority for the Environment to raise awareness regarding
the impacts of climate change on the State of Kuwait in various fields including health,
water resources and coasts and ways of adapting them. KEPS has made notable efforts
in linking education and awareness of climate change through the inclusion of educational,
public schools and university institutions in its programs and activities such as its Green
Schools program (see Box 6-1).
▪ Marine Environment Campaigns: National teams and organizations concerned with the
marine activities have carried out several campaigns and activities concerning the various
aspects of marine environment, either jointly or separately, and more recently they have
been focusing on the impacts of climate change on coral bleaching. Such campaigns have

95
been launched by the Environment Public Authority, Senyar diving team at the Volunteer
Tasks Center, the Kuwaiti Dive Team of the Scientific Club, the diving team of the Kuwait
Oil Company, the Coast Guard, the Marine Surveillance, the Public Authority for
Agriculture and Fisheries Resources, the General Directorate of Marine Fire and Rescue,
Kuwait Maritime Club, along with research-based institutions like Kuwait Institute for
Scientific Research and Kuwait University.
▪ Snyar Diving Team: Snyar is a volunteer diving team working on reconstruction the
country’s marine environment by monitoring beaches and coasts, preventing damage to
the environment, and increasing awareness of marine life. Since its inception, Snyar has
accomplished several achievements in the field of environmental protection in general and
the marine environment in particular.
▪ The Kuwaiti Dive Team: The Kuwait Dive Team was formed of young volunteer divers in
1991, right after the Iraq war. The main goal was to preserve the marine environment.
They started with cleaning up the coastline of military wastes, and gradually assumed the
responsibility of lifting objects, rescue and rehabilitation, and restoration of Kuwait’s marine
environment. With government support and fund from private sector, the team tasks were
expanded to include rescuing marine creatures; restoring coral reefs; creating habitats for
sea creatures, as well as removing waste and discarded fishing nets. They also provide
diverse trainings and environmental awareness campaigns.
6.5. Research initiatives The Paris Climate Agreement offers new challenges and opportunities for policy-related climate
research. It also presents the task of widening the knowledge base on climate change and its
consequences. In addition, there is a need for providing data to support evidence-based decisions
regarding the direction for implementing the global sustainable development goals, including those
relating to climate change mitigation and adaptation.
Key research areas include atmospheric sciences, soil moisture, hydrologic cycle, the marine
environment, ecosystems and biodiversity, and climate impacts. General expenditures on research
in Kuwait is typically very low, with only US$ 30 million spent over the 2011-2016 period. Key
institutions involved in these research activities are briefly described in the bullets below.
• Kuwait Foundation for the Advancement of Sciences (KFAS): This is a privately funded
non- profit organization headed by H.H. the Emir of Kuwait, has a mission to “Stimulate and
catalyze the advancement of Science, Technology and Innovation for the benefit of society,
research and enterprise in Kuwait”. KFAS has been active in supporting scientific research,
building capacity, and funding technology application pilots. In 2017, it convened an
international conference on climate impacts on coastal zones and the marine environment,
oriented around a translation of a book by John Englander on sea level rise (see Box 6-1).
KFAS leverages capabilities of national R&D organizations and professionals, focusing on
fields of national priorities such as energy and environment sustainability in Kuwait. KFAS
also funded the development of the Kuwait Emission Inventory System (KEIS) of criteria
air pollutants (CAPs).

96
• Kuwait Institute for Scientific Research (KISR): This institution was established in 1967 by the
Arabian Oil Company and became an independent public institution in 1981. Over the decades,
KISR has amassed extensive knowledge in environmental research, surveys and
management, including coastal management and atmospheric pollution; and urban
infrastructure development. KISR also has a reputable capacity building programs aimed at
developing skills and expertise of its manpower base (research,
• support and administrative), as well as providing similar opportunities to wider sectors in other
governmental agencies and to the general public.
• Kuwait Meteorological Department: Hosted within the Directorate General of Civil Aviation, the
Meteorological Department conducts research on atmospheric sciences. It represents the key
institution for observing and monitoring atmospheric change. It operates extensive national
observation networks, which include conventional meteorological and climatological
observation stations as well as a network of Doppler weather radars.
In 2017, KFAS organized the
Data, and Policies” to present
that the world’s oceans – and
the Arabian Gulf in particular -
are already being affected by
climate change. Topics
addressed included sea level
temperature rise, and oxygen
depletion, and their impacts on
the marine and built
environment.

97
6.6. List of references
Alsulaili, A. 2009. An Integrated Solid Waste Management System in Kuwait, 5th
International Conference on Environmental Science and Technology IPCBEE vol.69.
IACSIT Press, Singapore DOI: 10.7763/IPCBEE. 2014. V69. 12
Admission and Registration Department, KU Colleges Directory, 2018/2019, Kuwait
University, http://kuweb.ku.edu.kw/ku/AboutUniversity/KUAdmission/index.htm https://portal.ku.edu.kw/manuals/admission/en/colleges_manual.pdf http://kuwebcont.ku.edu.kw/cs/groups/ku/documents/ku_content/kuw055940.pdf http://kuweb.ku.edu.kw/ku/AboutUniversity/Colleges/KuwaitUniversityColleges/index.htm
Ali, H. and Alsabbagh M. 2018. Residential Electricity Consumption in the State of Kuwait. Environ Pollut Climate Change. 2: 153. 10.4172/2573- 458X.1000153.
Al-Dousari, A. 2006. Dust Fallout Monitoring and Analysis in Al-ahra City and Surroundings. KISR Scientific Report: 256-7.
Al-Marafie, A. M. R., R. K. Suri and Maheshwari, G. P. 1989. Energy and power management in air-conditioned buildings in Kuwait. Energy the International Journal 14 (9): 557-562.
Al-Nakib D. and Maheshwari, G.P. 1997. Cost-benefit analysis for energy-efficient lighting. Kuwait Institute for Scientific Research, Report No. KISR5004, Kuwait.
Al-Salem, Rakha, K., K., Al-Banna, K. and Al-Rasheed, A. 2008. Interactive Coastal Information System for Kuwait’s Territorial Waters Phase II: A Website for Online Hydrodynamic Predictions. KISR Scientific Report (2008): 266-68.
Analysis of Hydroponic Agriculture in Kuwait - Market trend, Growth and Opportunities (2015-2020), December 2017. Mordorintelligence.
Annual Energy Outlook. EIA, eia.gov, June 2012.
Annual Statistical Abstract (Issues 2002 – 2016). Central Statistical Bureau, https://www.csb.gov.kw/Pages/Statistics
BioEnergy Consult is engaged in the development of Biomass Energy, Waste-to-Energy, Biogas, Solid Waste Management and Industrial Waste Management projects worldwide, https://www.bioenergyconsult.com
BirdLife International, 2012, http://www.birdlife.org
Birol F, Key World Energy Statistics, IEA publication, 2017, https://www.iea.org/publications/freepublications/publication/KeyWorld2017.pdf
Buckley, R. (Ed.). 1997. Turning plan into action. Understanding global issues (UGI). Published by understanding global issues limited, the Runnings, Cheltenaham GL51 9PQ, England. Pp-14.
College of Graduate Studies, Kuwait University, http://kuweb.ku.edu.kw/COGS/index.htm,http://kuweb.ku.edu.kw/COGS/AcademicAffai
rs/Preparationandpublicationdepartment/Graduateguide/index.htm
Convention on Biological Diversity, https://www.cbd.int/doc/press/2017
Darwish, M. A. 2011. Prospect of Using Alternative Energy for Power and Desalted Water Productions in Kuwait." Desalination and Water Treatment 36 (1-3): 219-38. ISI Web of Knowledge.

98
Environment Public Authority, https://epa.org.kw
http://elbawabah.com, a source of information on current topics and issues.
Introduction to the United Nations Framework Convention on Climate Change (UNFCCC), Archived from the original on 8 January 2014. https://web.archive.org/web/20131129020749/http://unfccc.int/files/essential_background/background_publications_htmlpdf/application/pdf/conveng.pdf
Haselip, J., Narkevičiūtė, R., and Rogat, J. 2015. A step-by-step guide for countries conducting a Technology Needs Assessment.
Krane, J. 2015. An Energy Model in Trouble: The GCC's Electricity Quandary, Presented at American University of Kuwait, Kuwait. March, 2012.
Kuwait Environment Protection Society, https://www.keps.org.kw/
Kuwait Institute for Scientific Research, http://www.kisr.edu.kw/ar/
Kuwait Institute for Scientific Research, Energy & Buildings Research Center. http://www.kisr.edu.kw/en/facilities/energy-building/?research=1
Kuwait Municipality, https://www.baladia.gov.kw
Kuwait National Petroleum Company (KNPC) data, https://www.knpc.com/en/
Kuwait Petroleum Corporation, https://www.kpc.com.kw/
Kuwait Ports Authority official website, http://www.kpa.gov.kw/shuwaikh-port.html
Kuwait Times, 11 March 2017, http://news.kuwaittimes.net
Kuwait Times, 19 February 2018, http://news.kuwaittimes.net
Maheshwari, G.P; D. Al- Nakib; R.K. Suri; Y. Al-Hadban; J. Rasquina ; A. Ali Mulla; M. Sebzali and A. Al-Farhan. 1997. Energy Audit in Kuwait Port Authority. Technical report. Kuwait Institute for Scientific Research, KISR 5107, Kuwait.
Maheshwari, G.P.; K.J. Hussain; R.Alasseri. 2001. Development and implementation of energy efficient operation and maintenance strategies for air-conditioning systems. Interim report. KISR No. 6213. Kuwait.
Maheshwari, G.P., M. Abdulhadi, M. Al-Ramadhan, and D. Al-Nakib. 1993. Efficiency of electricity and water sector in Kuwait. Kuwait Institute for Scientific Research, KISR 4314, Kuwait.
Maheshwari, G.P., Y. Al-Fouzan, S. Al-Ateeqi, J. Rasquinha, A.Al-Farhan. 1994. Energy monitoring in industry: National Industries Company, Cement Products Plant. KISR 4194. Kuwait Kuwait Institute for Scientific Research, Kuwait.
Milutinovic, M., Eltahir, E. 2006. Water Demand Management in Kuwait. Thesis, Dept. of Civil and Environmental Engineering, Massachusetts Institute of Technology.
Organization of Arab Petroleum Exporting Countries (OAPEC) Data Base, http://www.oapecorg.org/Home
Ministry of Public Works official website, http://www.mpw.gov.kw
Organization of Petroleum Exporting Countries (OPEC), Annual Statistical Bulletin, (2016/2017), https://www.opec.org/opec_web/en/.
Public Authority for Applied Education and Training, http://www.paaet.edu.kw
Public Authority for Civil Information (PACI), https://paci.gov.kw, 2018

99
Ramsar Convention, https://whc.unesco.org/en/tentativelists/6257.
Rising Cost Growing Demand has Prompted Drive Boost Generating Capacity and Explore Alternatives, https://oxfordbusinessgroup
Shmal AlZour Projects, https://www.aznoula.com
Site for collection of world maps, http://mapsof.net/
Statista – The portal for statistics, www.statista.com
Statistical Year Book (2016) Ministry of electricity and water Kuwait.
Tamdeen Group, http://www.tamdeen.com/projectsmadinatalhareer.shtml
The future of Kuwait’s Energy System: Mitigating Threats & Seizing Opportunities. White Paper on A Sustainable National Energy Strategy. A Technical Report, April 2017.
The Kuwait Foundation for the Advancement of Sciences, http://www.kfas.org/
The Ministry of Electricity and Water, Statistical Year Book 2017: Electrical Energy, https://www.mew.gov.kw/
The Ministry of Electricity and Water, Statistical Year Book 2017: Water, https://www.mew.gov.kw/
UNDP (2010). Handbook for conducting Technology Needs Assessment for Climate Change. United Nations Development Programme, New York
UNFCCC, 1992, United nations framework convention on climate change. FCCC/INFORMAL/84
UNFCCC, 1998, Kyoto protocol to United Nations framework convention on climate change
UNFCCC, 2014, Areas of convergence related to areas of cooperation on the issue of the impact of the implementation of response measures. Technical paper, FCCC/TP/2014/12
UNFCCC, 2015, Paris agreement, Decision 1/CP.21, FCCC/CP/2015/10/add.1
UNFCCC, 2016, The concept of economic diversification in the context of response measures Technical paper by the secretariat. Technical paper, FCCC/TP/2016/3
UNFCCC (2017), Enhancing Implementation of Technology Needs Assessments Guidance for Preparing a Technology Action Plan. Technology Executive Committee, UNEP DTU Partnership.
UNFCCC (2010). Handbook for Conducting Technology Needs. Assessment for Climate Change. November 2010.
World Energy Outlook, 2017, International Energy Agency, https://www.iea.org/weo2017/
(GCC Power Market Report, 2017, www.middleeastelectricit.com )

100

101

102