environmental and social impact assessment central java
TRANSCRIPT

SUMMARY OF
Environmental and Social Impact Assessment
Central Java CFPP Project
Prepared for
Bhimasena Power Indonesia
Prepared by
POWER Engineers
Oradell, NJ 07649
May 2016

Central Java CFPP Project
February 2018 Summary of Environmental and Social Impact Assessment Page II of V
Table of Contents
1. INTRODUCTION.............................................................................................................................................. 1 1.1 Objective and Scope of the ESIA ...................................................................................................................... 1 1.2 ESIA Methodology ............................................................................................................................................. 1
1.2.1 ESIA Overview ..................................................................................................................................... 1 1.2.2 Identification of Impacts from the Project ............................................................................................. 1 1.2.3 Document Review ................................................................................................................................ 1 1.2.4 Benefits of the Project .......................................................................................................................... 2
1.3 Project Execution and Scheduling ..................................................................................................................... 2 2. REGULATORY FRAMEWORK SUMMARY ......................................................................................... 3
2.1 Overview ........................................................................................................................................................... 3 2.2 National AMDAL Standards .............................................................................................................................. 3 2.3 International Standards Applied for the ESIA .................................................................................................... 3
2.3.1 EP III ..................................................................................................................................................... 3 2.3.2 IFC Performance Standards (2012) ..................................................................................................... 3 2.3.3 Environmental, Health and Safety (EHS) Guidelines ........................................................................... 4 2.3.4 Japan Bank for International Cooperation Guidelines .......................................................................... 4 2.3.5 International Conventions and Treaties ................................................................................................ 4
3. PROJECT DESCRIPTION ............................................................................................................................. 6 3.1 Power Plant Overview ....................................................................................................................................... 6 3.2 Facility Location ................................................................................................................................................. 6 3.3 Project Configuration ......................................................................................................................................... 6
4. ASSESSMENT METHODOLOGY .............................................................................................................. 8 5. EXISTING ENVIRONMENTAL AND SOCIAL CONDITIONS ........................................................ 9
5.1 Study Area ......................................................................................................................................................... 9 5.2 Data Sources ..................................................................................................................................................... 9 5.3 Proximity to Potential Hazards .......................................................................................................................... 9 5.4 Topography ....................................................................................................................................................... 9 5.5 Climate ............................................................................................................................................................ 10 5.6 Air .................................................................................................................................................................... 10 5.7 Water Quality ................................................................................................................................................... 12
5.7.1 Hydro-Oceanography ......................................................................................................................... 12 5.7.2 River Water Quality ............................................................................................................................ 14 5.7.3 Seawater Quality ................................................................................................................................ 15 5.7.4 Groundwater Quality........................................................................................................................... 17
5.8 Noise ............................................................................................................................................................... 18 5.9 Geology and Soil Quality ................................................................................................................................. 19
5.9.1 Geology .............................................................................................................................................. 19 5.9.2 Soil Quality ......................................................................................................................................... 20
5.10 Flora and Fauna .............................................................................................................................................. 21 5.10.1 Overview of Terrestrial and Coastal Flora ........................................................................................ 21 5.10.2 Agricultural Land Use ....................................................................................................................... 22 5.10.3 River Estuary Ecosystem ................................................................................................................. 23

Central Java CFPP Project
February 2018 Summary of Environmental and Social Impact Assessment Page III of V
5.10.4 Coral Reef Ecosystem ...................................................................................................................... 25 5.10.5 Overview of Terrestrial Fauna .......................................................................................................... 29 5.10.6 Marine Biota ..................................................................................................................................... 33
5.11 Socio-Economic Environmental ...................................................................................................................... 36 5.11.1 Location and Land Use..................................................................................................................... 36 5.11.2 Demography ..................................................................................................................................... 36 5.11.3 Economic Profile............................................................................................................................... 37 5.11.4 Project Affected Land ....................................................................................................................... 38 5.11.5 Project Affected Buildings................................................................................................................. 40 5.11.6 Composition of Affected Households ............................................................................................... 40
5.12 Cultural Sites ................................................................................................................................................... 42 6. ANTICIPATED ENVIRONMENTAL AND SOCIAL IMPACTS AND MITIGATION
MEASURES ...................................................................................................................................................... 43 6.1 Air Emissions Mitigation .................................................................................................................................. 43
6.1.1 Name of Pollutants ............................................................................................................................. 43 6.1.2 Emission Sources during Construction Stage .................................................................................... 43 6.1.3 Construction Mitigation Efforts............................................................................................................ 44 6.1.4 Emission Sources during Operational Stage ...................................................................................... 44 6.1.5 Operating Emissions Mitigation Efforts............................................................................................... 44
6.2 Water Discharge .............................................................................................................................................. 46 6.2.1 Construction Stage ............................................................................................................................. 46 6.2.2 Operational Stage............................................................................................................................... 47
6.3 Noise Emissions .............................................................................................................................................. 48 6.4 Solid Waste ..................................................................................................................................................... 49 6.5 Terrestrial Flora and Fauna Impacts ............................................................................................................... 50
6.5.1 Mitigation Measures ........................................................................................................................... 50 6.5.2 Marine Biota Impacts .......................................................................................................................... 51
6.6 Protected Species and IUCN Red List Species .............................................................................................. 54 6.7 Labor and Influx Management ......................................................................................................................... 55
7. LAND ACQUISITION, PUBLIC CONSULTATION AND DISCLOSURE .................................... 56 7.1 500 kV Switching Station ................................................................................................................................. 56 7.2 Transmission Line ........................................................................................................................................... 56 7.3 Efforts Made for Minimizing Displacement ...................................................................................................... 56 7.4 Landscape and Visual Impacts ....................................................................................................................... 57
8. PUBLIC CONSULTATION AND DISCLOSURE ................................................................................. 60 8.1 Objectives ........................................................................................................................................................ 60 8.2 The Process .................................................................................................................................................... 60 8.3 Information, Awareness and Consultation ....................................................................................................... 60
8.3.1 Stakeholder Identification and Group Consultation ............................................................................ 60 8.3.2 Official Website................................................................................................................................... 61 8.3.3 Grievance Mechanism ........................................................................................................................ 61 8.3.4 Contact Details for the Public ............................................................................................................. 61
9. CLIMATE IMPACT ASSESSMENT – GREENHOUSE GASES ...................................................... 62 10. ENVIRONMENTAL MANAGEMENT AND MONITORING PLAN .............................................. 63

Central Java CFPP Project
February 2018 Summary of Environmental and Social Impact Assessment Page IV of V
11. ANALYSIS OF ALTERNATIVES .............................................................................................................. 64 11.1 Site Alternatives .............................................................................................................................................. 64 11.2 Technology Options ........................................................................................................................................ 64 11.3 The No Project Option ..................................................................................................................................... 64
Central Java CFPP Project
February 2018 Summary of Environmental and Social Impact Assessment Page V of V
ABBREVIATIONS ANDAL Analisis Dampak Lingkungan (Environmental Impact Analysis) AMDAL Analisis Mengenai Dampak Lingkungan (A thorough Environmental Impact Assessment) BPI PT Bhimasena Power Indonesia CFPP Coal Fired Power Plant Contractor Contractor from Construction Contract & Supplier from Supply Contract EHS Environmental, Health and Safety EMaP Environmental Management Plan EMoP Environmental Monitoring Plan EP Equator Principles EPC Engineering, Procurement, and Construction ESIA Environmental and Social Impact Assessment FGD Flue Gas Desulfurization Ha Hectare IFC International Finance Corporation IPP Independent Power Project JBIC Japan Bank for International Cooperation PAP Project Affected People PLN PT Perusahaan Listrik Negara (Persero) (The Indonesian State Electric Utility Company) PS Performance Standard ROW Right of Way Switching Station / Substation These terms are used interchangeably throughout the document because a switching station will be
put in now and a substation is anticipated to be put in in the future. The same land will contain both.
UNDIP Universitas Diponegoro (University of Diponegoro) UNIKAL Universitas Pekalongan (University of Pekalongan)

Central Java CFPP Project
February 2018 Summary of Environmental and Social Impact Assessment Page 1 of 65
1. INTRODUCTION This document is a Summary of the Environmental and Social Impact Assessment (ESIA) Report prepared for the proposed Central Java 2 x 1,000MW Coal Fired Power Plant (CFPP). The project is being developed in response to the ever increasing demand for electricity, which has reached a point of urgency in Indonesia.
Central Java CFPP will be built through a Public Private Partner scheme between PLN and Bhimasena Power Indonesia (BPI). The project plays a notable role to facilitate such an ambitious infrastructure development goal and will fulfill a portion of the electricity needs. The Project site is located approximately 80 km west of Semarang. The Project site is accessible via the northern coastal highway. The CFPP will provide Indonesia with 2×1,000 MW of electricity from the burning of coal.
1.1 Objective and Scope of the ESIA BPI recognizes the importance of incorporating environmental and social protections and mitigations to avoid issues as early as possible for the project planning and design stages. This allows for any adverse risks and impacts to be acknowledged, understood, and addressed in a way that is sustainable and environmentally responsible.
The objective of the ESIA was to carry out an assessment to determine any potential environmental and social impacts of the project activities and implement proper control measures and management plans to mitigate the risks and impacts on the environment.
1.2 ESIA Methodology
1.2.1 ESIA Overview The ESIA study was prepared over about 180 days and conducted from around February to August 2013 and has been revised through mid-2016. The AMDAL was generated alongside the ESIA in order to gain the earliest possible approval from Lenders for the Project. The ESIA is an extension of the AMDAL with focus on demonstrating compliance with the Equator Principles, IFC Performance Standards, IFC EHS guidelines, and JBIC guidelines. The AMDAL was approved by the Indonesian government.
1.2.2 Identification of Impacts from the Project There will be various social and environmental risks and impacts assessed during the life of the Project. BPI must entertain each impact as a potential issue and determine whether these impacts will be considered significant, insignificant, or permanent. The ESIA has identified these impacts; discusses the justifications for the risks and impacts; and sets out mitigation measures for the severity of the risks and impacts.
1.2.3 Document Review Socio-economic studies were performed by local consultants, and additional requirements were added in order to comply with the livelihood and resettlement requirements from both the EP III and the IFC PS 2012. The 2010 Census Report and relevant socio-economic studies for the area were used to obtain information on the socio-economic profile of the area.

Central Java CFPP Project
February 2018 Summary of Environmental and Social Impact Assessment Page 2 of 65
1.2.4 Benefits of the Project The Central Java CFPP Project will be beneficial for the public, the government, and the developer.
1.3 Project Execution and Scheduling Limited Notice to Proceed (LNTP) for the project occurred on November 14, 2011. Preliminary site preparatory work has been started before Full Notice to Proceed (FNTP). FNTP is now expected to occur in the first half of 2016.
The duration from FNTP to commercial operation of Unit 1 is scheduled to be 48 months. The duration from FNTP to commercial operation of Unit 2 is scheduled to be 54 months.

Central Java CFPP Project
February 2018 Summary of Environmental and Social Impact Assessment Page 3 of 65
2. REGULATORY FRAMEWORK SUMMARY
2.1 Overview The assessment of potential risks and impacts will be carried out by developing both qualitative and quantitative assessment processes.
2.2 National AMDAL Standards The laws and decrees issued under Law No. 32 of 2009 concerning Environment Protection and Management and Government Regulation No. 27 of 2012 obligate each activity predicted to trigger substantial impacts on the environment to make an AMDAL.
The tasks related to the impact analysis for the AMDAL should include:
• Collection of comprehensive quantitative baseline data on ambient concentrations of parameters and averaging time consistent with relevant Indonesian air quality standards within the defined air shed encompassing the Project area;
• Evaluation of the baseline air quality (degraded/non-degraded); • Evaluation of baseline water quality; • When there is a reasonable assumption that in the long term the power plant will be
expanded or other pollution sources will increase significantly, the analysis should take into account the impact of the proposed plant design both immediately and after any formally planned expansion in capacity or in other sources of pollution.
2.3 International Standards Applied for the ESIA The Project will be financed by various groups. Lenders for this project are signatories to the Equator Principals (EP). Therefore, the guidelines for assessment of whether or not the Project meets Lender requirements will be assessed against the IFC Performance Standards and IFC EHS Guidelines. The EP compliance summary will include additional International environmental and social standards from the IFC Performance Standards.
2.3.1 EP III EP encourages private lenders to consider the environmental and social impacts and risks prior to funding a large-scale project. The requirements in the EP guide companies with industry specific standards of environmental compliance, both nationally and internationally and include a focus on social issues through enhanced consultation, disclosure, and grievance mechanism requirements.
The EP applies to all new project financings globally with a total project capital cost of US$10 million or more. The IFC Performance Standards should be followed in order to comply with the EP.
2.3.2 IFC Performance Standards (2012) The IFC strives for positive developmental outcomes in the activities it supports in developing countries. The Performance Standards are a set of comprehensive social and environmental criteria to achieve positive developmental outcomes. The IFC Performance Standards for 2012

Central Java CFPP Project
February 2018 Summary of Environmental and Social Impact Assessment Page 4 of 65
requirements should be applied to projects that are determined to have moderate to high levels of environmental and/or social risks.
The following subsections identify and describe the Performance Standards with which the Project is compliant.
1. Performance Standard 1: Assessment and Management of Environmental and Social Risks and Impacts
2. Performance Standard 2: Labor and Working Conditions 3. Performance Standard 3: Resource Efficiency and Pollution Prevention 4. Performance Standard 4: Community Health, Safety and Security 5. Performance Standard 5: Land Acquisition and Involuntary Resettlement 6. Performance Standard 6: Biodiversity Conservation and Sustainable Management of
Living Natural Resources 7. Performance Standard 7: Indigenous People 8. Performance Standard 8: Cultural Heritage
2.3.3 Environmental, Health and Safety (EHS) Guidelines The General EHS guidelines are a set of the required steps to take when compiling important data. The IFC uses the EHS Guidelines as a technical source of information during project appraisal activities. In the Guidance Notes for Performance Standard 3, Good International Industry Practice (GIIP) is defined as the practice of professional skills, diligence, and insight that are expected from experienced professionals hired to engage in the same type of work under similar situations both globally and regionally. The use of GIIP should produce a project that employs the most appropriate technologies in project-specific circumstances. The EHS Guidelines provide general and industry-specific examples of GIIP.
The most recent EHS guidelines were applied to the Central Java CFPP. They are as follows:
• IFC General Environmental, Health and Safety (EHS) Guidelines (2007)
• IFC Guidelines on Thermal Power (2008)
• IFC Guidelines on Electric Power Transmission and Distribution (2007)
• IFC Guidelines on Ports, Harbors and Terminals (2007)
2.3.4 Japan Bank for International Cooperation Guidelines Japan Bank for International Cooperation (JBIC) established a set of environmental and social guidelines in April 2002, entitled “JBIC Guidelines for Confirmation of Environmental and Social Considerations”. These guidelines were revised and put into effect on October 1, 2009. The JBIC Guidelines have been generated to encourage project proponents to implement appropriate environmental and social procedures.
2.3.5 International Conventions and Treaties Indonesia has been party to numerous international conventions, treaties and best practice guidelines addressing social and environmental protection, labor rights and general

Central Java CFPP Project
February 2018 Summary of Environmental and Social Impact Assessment Page 5 of 65
environmental and cultural conservation. Relevant conventions and agreements which BPI have recognized as appropriate for the Central Java CFPP are summarized below:
• International Convention for the Control Management of Ships’ Ballast Water and Sediments Convention by the International Maritime Organization, 2004;
• Guidelines for the Control and Management of Ships’ Ballast Water to Minimize the Transfer of Harmful Aquatic Organisms and Pathogens by the International Maritime Organization, 1997;
• International Code of Conduct on the Distribution of Pesticides by the Food and Agricultural Organization, 2002;
• Convention Concerning the Protection of the World Cultural and Natural Heritage by The General Conference of UNESCO, 1972; and
• Declaration on Fundamental Principles and Rights at work by the International Labor Organization, 1998 (Referenced in Indonesia Act No. 13/2004: Concerning Manpower).

Central Java CFPP Project
February 2018 Summary of Environmental and Social Impact Assessment Page 6 of 65
3. PROJECT DESCRIPTION
3.1 Power Plant Overview The proposed Central Java CFPP will be a 2 x 1,000 MW ultra-supercritical coal fired power plant in Central Java, Indonesia. The plant will mainly consist of two power block units, circulating water intake and discharge structures, a jetty, a switching station, transmission lines, and access roads. The facility layout is shown below in
Figure 3-1.
Figure 3-1: Central Java Facility Location
3.2 Facility Location The CFPP Project site is located along the northern coast of Central Java that borders the Java Sea. It is approximately 80 km to the west of Semarang and 6 km from Pekalongan.
3.3 Project Configuration The Central Java CFPP will consist of two (2) ultra-supercritical coal fired units, each of which is designed to deliver 1,000MW gross electric generation. The ultra-supercritical boiler technology is significantly more efficient than older coal burning technologies. In combination

Central Java CFPP Project
February 2018 Summary of Environmental and Social Impact Assessment Page 7 of 65
with Low NOx burners, and back end emissions controls technologies including flue gas desulfurization (FGD) and Fabric Filters system, these coal fired units will provide critical electric needs with significant reducing in emissions as compared to alternate coal fired technologies.
The subbituminous coal supplied primarily from East and South Kalimantan will be transported by barges and/or special coal transporters to the Project site. Two coal conveyors will be installed to transport coal from the coal jetty to the storage yard and to the Plant’s coal silos. Coal will be conveyed from the storage yard and stored in silos prior to being fed into the boilers.
The boiler is started up and shut down using No. 2 fuel oil until coal combustion is stabilized. Coal is introduced to the boiler. The boiler generates steam which is provided to the steam turbine. The steam turbine and various ancillary equipment will be enclosed in a turbine building. Exhaust from the steam turbine will be condensed in a surface condenser with cooling water from the seawater intake pipelines. To prevent any destruction to the marine ecosystem, cooling water is pumped through a structure designed to draw water horizontally at a low velocity.
To control plant emissions the Plant design includes modern emissions control equipment including a FGD and Fabric Filters system.

Central Java CFPP Project
February 2018 Summary of Environmental and Social Impact Assessment Page 8 of 65
4. ASSESSMENT METHODOLOGY The main objectives of examining the present environment are to:
1. Defining an environmental and social baseline using accepted methods with quality assurance measures.
2. Identifying and quantifying existing (unacceptable) conditions that may need to be addressed by others, in terms of cause and remediation.
3. Providing engineering and social solutions that address the impacts from the proposed power plant on the existing site conditions.
The collection of baseline data focuses on information relevant to the proposed power plant project and its likely effects on the environmental and social condition.
The existing environmental and social baseline data was analyzed through infield and laboratory testing. The identification of baseline data and potential risks and impacts were carried out by on-site observations, consultations with local experts and stakeholders, literature review, and experience from similar projects. Environmental impact modeling was carried out for air, water, and noise impacts from Project construction and operation. Baseline data is collected based on the guidelines provided by a wide range of regulations, standards, and requirements of the EP, IFC Performance Standards, JBIC Guidelines, and Indonesian National Standards. A technical approach to data collection and analysis is presented. Limitations have also been indicated in the following sections of the report.
This ESIA includes all methodologies for the baseline sampling conducted for the Project. These methodologies include:
• Air Quality • Noise • Groundwater and Surface Water • Solid Waste Disposal • Hydrology and Hydro Oceanography • Topographical Survey • Soil Investigation • Flora and Fauna • Social and Socio-economic Impacts • Climate Impact Assessment

Central Java CFPP Project
February 2018 Summary of Environmental and Social Impact Assessment Page 9 of 65
5. EXISTING ENVIRONMENTAL AND SOCIAL CONDITIONS
5.1 Study Area The Proposed CFPP will cover an approximate land area of 226 ha with an additional 76 ha for transmission lines (including Right of Way (ROW)) and access roads. The Pemalang Switching Station, which will be built by the Project and turned over to PLN for operation, will occupy 19 ha. The type of land and its existing use varies. This section discusses the current condition of the Project site.
5.2 Data Sources Some of the information and data presented in this section is based on primary surveys and environmental quality monitoring (ambient air quality, noise levels, etc.) carried out by Wiratman’s consulting firm with additional monitoring conducted by Air Laboratories from Semarang during March 2013. Additional sampling was also performed in June 2013. The purpose of the additional sampling is to assess baseline conditions during the dry season (March sampling occurred during the rainy season), as well as to vary the sampling schedule to assess anthropogenic influences on baseline data (e.g. sampling on a Sunday versus a weekday). Secondary information has been collected by Wiratman’s consulting firm, Air Laboratories, and UNDIP’s Pusat Pelayanan Perencanaan Pembangunan Parisipatif (P5) team from various governmental departments and agencies as well as other study reports available related to the subject area. In addition, a socio-economic household survey was undertaken in the Batang Regency by Wiratman’s consulting firm with additional social studies conducted by UNDIP’s P5 team and UNIKAL team (Coastal Study).
5.3 Proximity to Potential Hazards The Project site is relatively free of potential hazards other than the hazards associated with natural phenomenon such as wind, rain, earthquakes, and rising sea levels. However, the area of the selected site is not known to have had disastrous environmental hazards.
Potential flooding at the Project site from rising sea levels will be avoided by raising the Project site elevation. Flooding from the existing irrigation channel at the south will be avoided by construction of a storm water drainage channel along the south boundary. According to tsunami analysis report, maximum water level rise is estimated to be only 5 cm. Therefore, there is no risk of flooding from tsunami.
All structures will be designed and constructed to resist the maximum wind and earthquake effects in accordance with the applicable codes and standards.
5.4 Topography The Project site is located on the opposite side of the hill of Ujungnegoro beach recreational area. The proposed site is hilly on the western side and flat on the eastern side. The hilly area to the west of the Project site is part of Ujungnegoro village with the top of the hill at about 30 meters above sea level. The flat area at the eastern side of the Project site is located in the Karanggeneng and Ponowareng villages with an elevation 1 to 2 meters above sea level.

Central Java CFPP Project
February 2018 Summary of Environmental and Social Impact Assessment Page 10 of 65
5.5 Climate Climate data for the Project site are obtained from the Meteorology and Geophysics Agency/Department (BMKG) of Semarang. Semarang is located approximately 80 km to the east of the Project site and is considered representative of climatological conditions at the Project site since features that influence local meteorology, such as terrain, urban/rural characteristics, and proximity to large bodies of water, are the same or very similar. Climate data is shown in Table 5-1.
Table 5-1: Site Climate Data
Climate:
Rainfall Average Annual Rainfall: 2,336mm Minimum Monthly Rainfall: 41mm (July) Maximum Monthly Rainfall: 403mm (February)
Relative Humidity Lowest Average Monthly Humidity: 66.5% (September) Highest Average Monthly Humidity: 84.0% (February)
Air Temperature Lowest Average Monthly Air Temperature: 28.5°C (October) Highest Average Monthly Air Temperature: 26.7°C (February)
Atmospheric Pressure Lowest Average Monthly Atmospheric Pressure: 1,008.6 mb (March) Highest Average Monthly Atmospheric Pressure: 1,010.9 mb (September)
Solar Radiation Lowest Average Monthly Solar Radiation: 48% (December) Highest Average Monthly Solar Radiation: 91% (September)
Wind Speed Lowest Average Monthly Wind Speed: 2.8 knots (November) Highest Average Monthly Wind Speed: 3.9 knots (February)
Wind Direction Wind direction from the North during April, September, and November. Wind typically blows from the Southern quadrants for the remaining months.
5.6 Air The ambient air results were evaluated by comparing them to relevant national air quality standards.
The assessment process in any development project addresses compliance with the relevant host country laws, regulations, and permits that pertain to the social and environmental matters. For air quality standards, the national and regional standards are established from the following:
• Government Decree of the Republic of Indonesia No. 41 (1999) • Central Java Governor Decree no. 8 (2001) - Ambient Air Quality Standards in Central
Java Province • Minister of Living Environment No. 50 of 1996 Odor Standards
Standards are established for annual averages and short-term ambient air quality concentrations. Annual (long-term) standards are specified to avoid adverse cumulative impacts on human health and/or the environment during long-term exposure. Short-term standards of 1-hour, 8-hour, and 24-hour average concentrations are to avoid acute adverse impacts on human health caused by short term exposure to high ambient levels of a pollutant.

Central Java CFPP Project
February 2018 Summary of Environmental and Social Impact Assessment Page 11 of 65
Evaluation of Monthly baseline air quality was not possible because the technology available for passive sampling does not provide for long term sampling.
The assessment of ambient air quality impacts from Project activities were done through a combination of field testing and modeling techniques as well as accounting for seasonal variability. Additional air sampling was conducted in June 2013 to capture potential seasonal variations in ambient air concentrations. The March 2013 sampling provided a record of ambient air quality during the rainy season, whereas the June 2013 sampling represents the dry season.
Local air quality is influenced by the pattern of air pollution emission sources located in the Project area and its vicinity as well as dominant sources farther away from the Project site. The following existing emissions sources contribute to the air quality in the project area:
Local Sources: Primary and secondary roads traverse the site border, as does a primary rail line. Local infrastructure improvements could be causing an increase in ambient concentrations of dust. As was previously noted, local sources of NO2, CO, SO2, TSP from traffic, household activities (cooking), agricultural activities, and natural sources may also be contributing to the local, baseline pollution concentrations.
Distant Sources: Three coal-fired power plants are located 110 to 130 kilometers from the proposed CFPP location: Cilacap, Tanjung Jati, and Cirebon. Wind rose data for Semarang indicates a predominating wind from the east-southeast direction and a secondary maximum from the west-northwest and northwest directions. The power plants are located west, east-northeast and southwest from the proposed CFPP location. Since these power plants are located where predominating winds will not carry emissions to the local monitoring sites, it is unlikely that measured, local concentrations of NO2, CO, SO2 and TSP are being influenced from these plants
Baseline Results: The results of ambient air quality monitoring produced during a 22.75 hour continuous measurement period were available for this analysis. The applicable Indonesian standards were compared to the results for each parameter including TSP, NO2, SO2, CO, HC, Pb. Grab samples were used to analyze ambient concentrations of H2S, O3, and NH3. The conclusions from the results are as follows:
• All measurements were below the applicable standards for nitrogen dioxide (NO2). • The measured sulfur dioxide (SO2) concentrations were <25 ug/Nm3 for every
sampling location during the 22.75-hour sampling period; below the minimal detection limit of the method used for the sampling. The results were significantly below both the Central Java 24-hour averaging standard of 365 ug/Nm3 and the WHO 24-hour averaging standard of 125 ug/Nm3.
• All measurements of ozone (Ox) based on the 22.75 hour concentrations were found to be lower than the applicable standards.
• Measured ambient CO concentrations range between 743 ug/m3 and 1,309 ug/m3. The highest concentration meets the air quality standards (Central Java Governor Decree No. 8 of 2001 and Government Regulation. 41, 1999, for a 24-hour averaging period, the CO parameter of 10,000 ug/m3, the concentration of CO values).
• Ammonia concentrations were showed the 24-hour average ammonia concentration in all locations to be below 1.5 ppm.; below the minimum detection limits of the measurement technology.

Central Java CFPP Project
February 2018 Summary of Environmental and Social Impact Assessment Page 12 of 65
• All measured Hydrogen Sulfide (H2S) concentrations were below the 0.02 ppm H2S air quality standard of Central Java Governor Decree No. 8 of 2001.
• The Total Suspended Particulate (TSP) matter is predominantly from vehicular traffic and ground transportation, which suspends road dust that is then carried by the wind. Farming activities, such as rice paddy harvesting, are also a source of particulate matter. When compared to the ambient air quality TSP standard of 230 ug/m3, the maximum measured ambient air TSP concentration of 116.5 ug/nm3 was still approximately half the local standard.
• The concentration of lead (Pb) results indicates a value below 0.030 ug/Nm3 at all monitoring location; the minimum detection level. The air quality standards of Central Java Governor Decree No. 8 of 2001 and Government Regulation. 41, 1999 for Pb parameter is equal to 2 ug/m3. Sampling results indicate levels well below the standard.
• The main source of Hydrocarbons (HC) is the firing of fossil fuels, including gasoline, oil, and natural gas. Vehicular traffic is the main source of hydrocarbons in ambient air. Locally, residential use of fossil fuel for cooking is a likely secondary source of HC emissions. The sampled concentration of HC ranged between 450.5 to 1,099 ug/m3. This value is well above the recommended standards of 160 ug/m3 that is set by the Central Java Governor Decree No. 8 of 2001 and Government Regulation.
• For all analyzed substances, no specific correlation of the measures values to local structural conditions could be identified.
• With the exception of hydrocarbons, applicable standards were met for ambient air quality.
5.7 Water Quality Water quality (seawater, river water and groundwater) is examined from primary and secondary data that is collected in accordance with applicable standards.
The assessment of groundwater impacts from project activities were done through a combination of field testing, and surface water modeling techniques. Water sampling was conducted in both the rainy and dry season to show seasonal variations. The assessment of dry and rainy season influences do not include groundwater sampling as seasonal influences are minimal due to the depth of the substrate. Water quality and various impacts were baselined for the tidal impacts, as well as seawater, river water, and groundwater quality evaluations.
5.7.1 Hydro-Oceanography The coastal hydro oceanography was collected via secondary data, and information was collected from various references and library sources relating to oceanographic conditions of water around the CFPP site; this data is categorized as secondary data. Marine information is derived from blind interview with the locals; a method which provides more local information than available from the published journals or books.
• Flow and wave measurement locations were chosen in the area where proposed dumping of dredge spoils is to occur. Current and wave data retrieval was conducted between March 10 and 13, 2013. The water elevation in the study area was observed for 15 days between March 9 and 23, 2013. Tidal observations were observed for 15 days between March 9 and 23, 2013.

Central Java CFPP Project
February 2018 Summary of Environmental and Social Impact Assessment Page 13 of 65
• Observations of tidal water levels are used to determine tidal constants which are then used:
o to obtain information of the water surface elevation at the location (both tidally influenced or not influenced);
o to get data to be analyzed for the use in the mathematical models; o to determine the msl reference for example, lwl, hwl, etc.; and o to allow for correction of tidal sea depth measurements.
Existing hydrology: Hydrological data is derived from site observations and is related to the pattern and quality of river water and the size of the rainwater catchment area. Hydrological data is derived from secondary data. Hydrological aspects include the study of river currents as well as the identification of physical characteristics of the upstream/downstream bodies of water. Hydrological data, is obtained from onsite observations. Data relating to rivers and the size of the rain water catchment area is generated from secondary data obtained from few relevant institutions such as the Irrigation Department of Public Works Service Office. Hydrological characteristics of the site are observed from field studies. Two upstream and downstream points in close proximity to the proposed site were selected. The original, baseline condition of water body and any predicted changes that will occur as a result of the CFPP will be assessed and compared with water quality standards that are regulated under Government Regulation No. 82 of 2001. The Project was unable to conduct a full year of baseline river water quality sampling. The only available data for comparison involved single grab samples that were taken at each location on a single day. Seasonal variability was considered with sampling conducted in March and June 2013 to illustrate the baseline river water quality in both the rainy and dry season.
Power Plant Area Characteristics 5.7.1.1The wave categorizations along the Batang coastal area are summarized as follows:
o December to February: waves head to the northwest (65.6%) with a 0.2 to 0.6 meter height and a dominant wave period of 3 to 5 seconds (45.9%).
o March to May: waves head to the northeast (42.9%) with a 0.6 to 1.0 meter height and a dominant wave period of 7 to 9 seconds (46.8%).
o June to August: waves head to the east (39.8%) with a 0.6 to 1.0 meter (40.9%) height and a dominant wave period of 7 to 9 seconds (46.9%).
o September to November: waves head to the east (22.7%) and the northeast (20%) with a 0.6 to 1.0 meter (32%) height and a dominant wave period of 7 to 9 seconds (30.7%).
o The annual wave characteristics are 0.6 to 1.0 meter (34.6%) in dominant height, has a 39.8% frequency, and has 7 to 9 seconds of dominant wave periods with 35.9% frequency.
• Current Velocities: Based on the secondary data results for the coastal area, current flow velocities vary with an average speed ranging from 0.1 cm/s to 33.0 cm/s along the entire water column.
• The minimum flow velocity ranges from 0.1 cm/s to 2.3 cm/s; • The maximum flow velocity ranges from 17.5 cm/s to 33.0 cm/s; and

Central Java CFPP Project
February 2018 Summary of Environmental and Social Impact Assessment Page 14 of 65
• The lowest flow velocity occurs at a depth of one cell and the largest flow velocity at a depth of nine cells.
• Tidal Observations: Tidal currents are horizontal movements of water masses produced by vertical movements in sea level caused by the gravitational pull from the moon. The high-low tidal range at the Marine Conservation Areas varies from 50-145 cm.
Dumping Area Characteristics 5.7.1.2Wave Direction: The direction of wave generation is typically from the northwest, the north, and the northeast. In general, the velocity of the waves that occurs at the observation site is greatly influenced by monsoon movements and the water depth.
Flow Speed: Flow conditions show the relationship between the flow speed and tidal patterns. Dominant flow speeds for cell 1 to cell 10 ranges from 5 cm/s to 10 cm/s with a distribution between with an average speed of 6.4 cm/s.
Tidal Observations: The results from the analyses of the tidal data in the dumping area (from March 9-23, 2013) is shown in Figure 5-1 below:
Figure 5-1: Tidal Results
5.7.2 River Water Quality Several baseline data parameters for river water do not meet the quality standards including, TSS, BOD, COD, Zn, Nitrite, Fecal Coliform and Total Coliform. The rivers studied are generally used by people as a place to dispose of domestic waste. The results are summarized as follows:
• Total Dissolved Solids (TDS): ranged from 82 to 274 mg/L and meets the quality standard at all points.
• Total Suspended Solids (TSS): ranged from 20 to 95 mg/L and TSS at sampling point AS-1 exceeds the quality standard.

Central Java CFPP Project
February 2018 Summary of Environmental and Social Impact Assessment Page 15 of 65
• pH: ranged from 6.80 to 7.90 with all points meeting the quality standard. • Biological Oxygen Demand (BOD): ranged from 2.150 to 4.646 mg/L with the highest
BOD at sampling location AS-1. BOD at AS-1 and AS-2 did not meet the quality standard.
• Dissolved Oxygen (DO): ranged from 6.53 to 7.54 mg/L and meets the quality standard at all points.
• Other Parameters: Total phosphates, cyanide, fluoride, chlorine and phenol meet the quality standards at all sampling points.
• Chloride: ranged from 3.394 to 14.38 mg/L. All analyzed samples meet the quality standard.
• Nitrite: ranged from 0.002 to 0.062 mg/L. Nitrite at sampling point AS-2 did not meet the quality standard.
• Oils and Fats: ranged from <50 to 300 ug/L. All points meet the quality standards. • Detergent: ranged from below 10 to 47 ug/L in march and met the quality standard.
However, values in June were higher with a range of 139 to 349 and were above the quality standard.
• Metal Parameter: As, Co, B, Se, Cr VI, Cu, Pb, Mn were below the measurable amount (there is no water quality classification for Mn).
• Zn ranged from below the measureable amount of < 0.010 to 0.159 mg/L. All analyzed metal levels meet the quality standards.
• Fecal coliform: ranged from 0 to 35,000 Jml/100 ml with the highest fecal coliform at sampling location AS-4. Total coliform ranged from 2,700 to 54,000 Jml/100 ml with total coliform-highest at the AS-4. Fecal coliform at AS-2 and AS-4 did not meet the quality standard. Total coliform for sampling locations AS-2, AS-3, AS-4, and AS-5 did not meet the quality standard. This is likely the result of human wastes being disposed in the river.
5.7.3 Seawater Quality The baseline study involved the collection of pollutants expected to be generated from the proposed power plant project.
Baseline Seawater Quality for Power Plant Area 5.7.3.1The sampling period was carried out from March 18 to 22, 2013, representing the rainy season with additional sampling carried out in June 2013 and representing the dry season. There were fourteen (14) location points capturing the proposed locations of the inlet, outlet and jetty. Seawater samples were taken around the proposed power plant water intake, outtake, jetty, the Kretek coral, the Maeso coral, and the Boyo River and Estuary in Sambong River and compared with the seawater standard quality regulated under the Decree of State Minister of Environmental Affairs No. 51 of 2004. The following summarizes the baseline seawater quality parameters that were sampled and measured:
Brightness: Brightness at 10 of the 14 sampling locations did not meet the quality standards. Brightness at 4 of the locations met quality standards. The quality standard for brightness is less than 3 m.

Central Java CFPP Project
February 2018 Summary of Environmental and Social Impact Assessment Page 16 of 65
Turbidity: Most measurements ranged from approximately 1.65 to 4.76 NTU. AL-4 and AL-11 did not meet the turbidity limit in June 2013. All other points meet the quality standard of less than 5 NTU. Temperature: measurements ranged from 30.8 to 33.1°C, higher than other readings the Project has obtained for seawater temperature at the depth of the Plant’s water intake system. We believe the readings reported here were taken at locations that have shallow or stagnant waters. TSS: measurements ranged from about 8 to 18 mg/L with the highest TSS average between the two months occurring at location AL-4. TSS at all points meets the quality standard (20 mg/L). pH: measurements ranged from about 8.1 to 8.3, which meet the quality standard (7 to 8.5). Salinity: measurements ranged from 31.1 to 32.2% in March, higher than the water measurements were relatively lower in June 27.7 to 29,8%. The salinity of the water meets the quality standard. DO: measurements ranged from 6.07 to 7.54 mg/L with the lowest DO located at AL-6, west of the power plant outfall. DO at all points meet the quality standard of greater than 5 mg/L. BOD: measurements ranged from 1.190 to 2.381 mg/L in March with the highest BOD located at sample location AL-2, lower than the BOD levels in June with measurements ranging from 1.190 to 5.760 mg/L.BOD at all points meet the quality standard of less than 20 mg/L with the results indicating mostly clean water (<1mg/L) to slightly polluted waters (>2 mg/L) at AL-2 and AL-5. Hydrogen Sulfide (H2S): measurements ranged from <.002 to 0.5 mg/L with the highest sulfide contained at location AL-2. H2S does not meet the quality standard of 0.01 mg/L at all points. The high levels are likely the result of decomposing animal waste entering the river which discharges near the sampling point. Other parameters: measurements of ammonia, phosphate, nitrate and cyanide at all points met environmental quality standards.
Baseline Seawater Quality for Dumping Area 5.7.3.2Water quality measurements consist of pH, salinity, DO, and temperature in (2) points in the Bapang Coral area, eighteen (18) points in the dumping area, and ten (10) points in the surrounding area from the dumping site. The collection of water and bacteria data is important for the analysis of the chemical content of water (e.g. the Nitrates and Nitrites). The collection of seabed conditions by visual observation was performed to find out the actual condition of the dumping area, outer dumping area, and Bapang Coral reef. The divers observed the seabed by using video surveillance and photo documentation at 150 observation points with a varying depth of 33-45 meters.
The pH is in accordance with the standard and do not show any high acidity or low acidity in all sampling locations.
The Dumping Area location and the Beyond Dumping Area location have similar brightness levels ranging from 8.50 to 18.68 meters with similar depths of 34 to 40 meters. The Bapang Coral area has a depth of 43 to 45 meters and a brightness range of 9.85 to 13 meters. Brightness is in compliance with the quality standards for the life of the coral (>5m), but this condition indicates that the penetration of sunlight has been significantly reduced from a substrate in the form of sludge that is caused by the sea floor being in an exacerbated condition.

Central Java CFPP Project
February 2018 Summary of Environmental and Social Impact Assessment Page 17 of 65
5.7.4 Groundwater Quality
Groundwater Quality at Power Plant Site 5.7.4.1Groundwater sampling was taken from wells surrounding the site and analyzed for various water quality parameters. Groundwater is used by residents surrounding the site for various activities including those related to agriculture. Groundwater is collected during the design phase to observe any anthropogenic substances such as oil and grease already existing in the wells prior to the operation of the power plant project.
According to Indonesian Regulation, the groundwater is classified as quality class No. 416/1990. Most of the physical and chemical quality of the well water is still good except pH at AT-2 and AT-3 which shows more acidity. Exceedances of triggered values imply further investigations and a case-by-case study. The results are summarized below:
• The groundwater samples taken were clear, tasteless, and odorless. There is also an extremely high level of total coliform at AT-3 and AT-4. Otherwise the results indicate normal conditions. The groundwater is generally used for daily residential needs such as drinking water, water for cooking and washing.
• Turbidity was well within the Indonesian standard. • TDS ranged from approximately 74 to 332 mg/L. TDS on all points meet the standard of
1,500 mg/L. • Temperature ranged from around 28 to 29°C with the air temperature around the sites
from 28.6 to 31.9°C. The water temperature meets the quality standard. • pH ranged from 5.2 to 6.9 pH. The points AT-2 (5.2) and AT-3 (5.2) were more acidic
which means they do not meet the quality standard ranged of 6.5 to 9. • CaCO3 ranged from 64.76 to 79.00 with the highest hardness at AT-4 and meets the
quality standard. • Chlorine ranged from 6.589 to 53.11 mg/L with the highest chloride at AT-4 and meets
the quality standard. • Nitrate ranged from 0.879 to 7.530 mg/L with the highest nitrate at AT-4 and meets the
quality standard. • Nitrite ranged from 0.002 to 0.03 mg/L and meets the quality standard. • Cyanide was less than 0.002 mg/L at all points and meets the quality standard. • Anion surfactants/detergents MBAs: were less than 0.010 mg/L at all points. • KMnO4 ranged from 1.877 to 2.563 mg/L with the highest organic matter at AT-4. • Metal parameters measured were Hg <0.001; AS <0.003; Fe <0.010; Cd <0.005; Cr VI
<0.001; Se <0.002; Pb <0.030; Zn <0.010 to 0.016, and Mn <0.010 to 0.102 mg/l. Each parameter at all sampling points meets the quality standards for their respective metals.
• Total coliform ranged from 0 to 18,000 Jml/100 ml with the highest total coliform found at AT-4. Total coliform at AT-3 and AT-4 do not meet the quality standard. This is likely the result of domestic wastes being disposed near the well. Existing levels of total coliform were found to exceed the maximum levels allowed by the relevant Indonesian standard. An assessment is being conducted to attempt to identify the likely source(s) of this contamination.

Central Java CFPP Project
February 2018 Summary of Environmental and Social Impact Assessment Page 18 of 65
Groundwater Quality at the Ash Disposal Area 5.7.4.2Groundwater samples were taken from five locations from May 17th to May 29th, 2015.
There are 33 parameters that were analyzed during the ground water baseline study for the landfill permit. During a site verification meeting with KLH in Feb 2016, KLH informed BPI that the landfill permit application for the Project shall comply with new Landfill regulation. According to the new draft regulation that is going to be released by the Ministry of Environment and Forestry, parameters containing the highest levels from the groundwater baseline study need to be used to conduct periodic monitoring during the operation stage. This condition is included within the final approval of the permit by KLH and will be upheld.
5.8 Noise Baseline noise was measured at 12 different locations. The ambient noise levels in the area are currently affected by transportation vehicles such as cars and trains. Accordingly, as part of the baseline studies, the ambient noise levels at the Project site were measured.
The measured daytime noise levels range from 42.44 dB(A) to 77.10 dB(A). The nighttime noise levels range from 44.34 dB(A) to 65.69 dB(A). Detailed results are indicated Table 5-2 below and are compared to both Decree of Minister of Environmental Affairs No. 48 of 1996 and EHS Guideline Standards.
Table 5-2: IFC Noise Standards compared to Baseline Results
Receptors Noise Regulation General EHS Guidelines
Daytime* (07:00-22:00)
Nighttime (22:00-07:00)
Residential; Institutional; Educational; Religious 55 45
Commercial; Industrial 70 70
Location Daytime (6:00-22:00) Nighttime (22:00-6:00)
B1: Ujungnegoro 51.19 56.57
B2: Ujungnegoro 50.95 53.53
B3: Near Karanggeneng Railroad Tracks 70.29 62.39
B4: Near Ponowareng Railroad Tracks 77.10 65.69
U1: Grave Site in Ujungnegoro 42.44 52.53
U2: Residential Area in Ujungnegoro 54.98 47.13
U3: Kemplang Cemetery area 59.06 57.25
U4: Soccer Field by Kenconorejo and Wonorejo 52.54 46.16
U5: Sambojo City Hall 53.17 53.09
U6: Residential Area in Simbangjati 49.56 49.54
U7: Soccer Field Near Kenconorejo 62.67 61.17

Central Java CFPP Project
February 2018 Summary of Environmental and Social Impact Assessment Page 19 of 65
U8: Ponowareng City Hall 55.86 44.34
[*Daytime EHS regulation is the same as the National Standard (no difference in time) (KEP-48/MENLH/11/1996)]
As indicated in above, the results of noise monitoring at the twelve (12) noise measurement locations show four (4) locations with noise levels (Lsm) above the national quality standard. The locations include near the railroad tracks (70.29 and 77.10 dB(A)), the Kemplang Cemetery (59.06 dB(A)), and the Soccer Field in Kenconorejo Village (62.67 dB(A)). High noise levels at these sites are from activities associated with transportation. The noise source in Ponowareng (B4) comes from passing trains. By the Cemetery (U1) and Kenconorejo (U7), the measurement location is next to the main village road which has a high level of noise from a passing motor vehicles. Details regarding additional exceedances are below:
• B1: The night time exceedances are due to the presence of the Atlas Beetle (Chalcosoma atlas). This insect is nocturnal and only appears during sampling segment 6 (L6)) from 12:00 am until 3:00 am with a noise emission of 59.70 dB(A), thus causing the average noise to be 56.57 dB(A).
• B3 and B4: The noise exceedances are due to the trains passing through. • U3: The daytime exceedances are caused by traffic as the road near the cemetery is a
public road and is used constantly during the day. For the nighttime exceedances, the results are influenced by nightly celebrations, such as Karaoke, that carries on from 6:00 pm until 12:00 am in front of the cemetery area.
• U7: This field is located near a public access road and both the daytime and nighttime noise exceedances are caused by passing cars, trucks, and motor bikes.
• U8: The village hall is a public service area that maintains a high concentration of activity during the day, thus causing daytime exceedances.
The general EHS standards are more stringent than the National Indonesian Standards. The ambient noise sampling results above meet the EHS daytime noise standards of 55 dB(A) and all the relevant Indonesian standards. However, the EHS standard for night time noise of 45 dB(A) limit is exceeded.
5.9 Geology and Soil Quality
5.9.1 Geology The geological structure in the area consists of fold and ungrowing fault. This condition is supported by the tectonic order of the Java Island region with a subduction zone at the south.
The Project site area is located in the coastal-alluvial plain which is usually occupied by disintegrated fluvial and marine deposits. However, locally in the northwestern part of the Karanggeneng site, there is a solitary hill formed by volcanoclastic deposits such as volcanic breccias and tuff.
The lithology of the region can be divided in the rock units described below in order of old to young:
a. Sandstone from Tertiary Product Units

Central Java CFPP Project
February 2018 Summary of Environmental and Social Impact Assessment Page 20 of 65
The outcrop of tuffaceous sandstone has a brownish red/reddish grey color. This unit belongs to the Tapak Formation from the Tertiary Product Unit (Pliocene) and is identified as the oldest sedimentary product in the area.
b. Welded Breccia from Tertiary Product Units This breccia is a brownish yellow color consisting of andesitic/basaltic fragments. The fragments are grey to red in color consisting of iron oxide cement matrix. This unit belongs to the Tapak Formation from the Tertiary Product Unit (Pliocene).
c. Tuffaceous Sandstone from Tertiary Product Units The outcrop of tuffaceous sandstone is white to brownish in color and contains quartz and plagioclase. This unit belongs to the Tapak Formation from the Tertiary Product Unit (Pliocene) and is distributed on the southern part of the region.
d. Agglomerate from Quaternary Product Units Agglomerate is pebble to boulder grained with a dark color. The fragments indicated andesitic/basaltic grains. This unit belongs to the Ligung Formation from the Quaternary Product Units (Pleistocene). This unit is able to transmit water in the field due to its high porosity and fracture system.
e. Volcanic Breccia from Quaternary Product Units Volcanic breccia is brownish in color with a fine grained fragment which indicates andesitic/basaltic and pebble to boulder grained matrix. It is locally covered by alluvium/soil. This unit belongs to the Ligung Formation from the Quaternary Product Units (Pleistocene).
f. Sandy Soil from Old Alluvial Deposits This soil is fine to coarse grained, dark brown in color, consists of andesitic/basaltic rock fragments, and locally shows discontinuous iron bedding.
g. Modern Soil from Coastal-Alluvial Deposits This soil is coarse grained, brownish/reddish brown in color, and consists of andesitic/basaltic rock fragments.
5.9.2 Soil Quality Subsurface soil investigation of the Project site area was performed by PT Geomarindex in December 2010. A total of 33 borings were drilled onshore and 23 borings were drilled offshore. Onshore boring areas included the power block area, coal yard area and other areas. Offshore borings included the jetty, intake pipe and discharge pipe areas. Additional 5 onshore and 3 offshore borings were drilled in April 2013. Onshore borings were in solid waste disposal area and turbine building area. Offshore borings were in jetty area and intake area.
The soil investigation indicates that upper layers consist of softer material and pile foundations will be required for major structures and equipment sensitive to settlements. Minor structures could be supported on shallow foundations.

Central Java CFPP Project
February 2018 Summary of Environmental and Social Impact Assessment Page 21 of 65
5.10 Flora and Fauna The total of flora and fauna recorded during the primary data collection process were 64 flora species and 149 fauna species. Among all the flora species detected, there were 33 trees, 30 pillars, 29 stakes, and 28 seedlings recorded. The total fauna comprised of 70 bird species, 5 mammal species, 18 reptile species, and 56 invertebrates species.
Overall, the majority of the land, according to Performance Standards 6, would be classified as modified-land. The animals that settled there are a result of human-induced impacts on the land and, therefore, would not be considered native species. The evaluation also considered any local land use, river estuary ecosystem, coral reef ecosystems, terrestrial fauna, and marine biota.
5.10.1 Overview of Terrestrial and Coastal Flora The vegetation around the Project site is highly heterogeneous. The communities that dominate the area include paddy fields, mixed orchards, parklands, and coastal estuaries. The terrestrial biota survey focused on a field survey at the proposed site and identified the vegetation in and around the Project site. Secondary data was also used during the process and collected from numerous references. The local area is relatively fragmented and modified by human activity, thus reducing the number of species that exist on the Project site. Broadly speaking, three types of vegetation communities exist within the field study area:

Central Java CFPP Project
February 2018 Summary of Environmental and Social Impact Assessment Page 22 of 65
Figure 5-2: Terrestrial and Coastal Flora
• Agriculturally Farmed Land: technical/non-technical paddy fields, Jasmine orchards, mixed orchards and fisheries;
• Parklands; and • Coastal: the Marine Conservation Area, river estuaries, coral and mangrove ecosystems.
5.10.2 Agricultural Land Use Most of the land surrounding the planned power plant is used for agricultural purposes. Most of the land use in the regions of Ujungnegoro, Karanggeneng, and Ponowareng are intended for dry fields/orchards, parklands, and paddy fields. The coverage area of plantation of those three villages is 37.94%, 10.71%, and 36.64% respectively. The rest of the lands are parklands and paddy fields. The technical irrigated paddy fields are located in Karanggeneng and Ponowareng, covering areas of 54.65% and 42.40% of total village area, respectively. Rainfields occupy about 26.25% of the area of Ujungnegoro.

Central Java CFPP Project
February 2018 Summary of Environmental and Social Impact Assessment Page 23 of 65
A baseline study was conducted to collect data and assess the flora within the Project area. An Importance Value Index was documented for the leading species. Importance Value is a measure of how dominant a species is in a given area. It is a standard tool used to inventory an area. 64 different types of vegetation was observed and documented to exist as a Tree, Pole, Sapling or Seedling.
The trees found with the Top Importance Value Index (IVI) included: the coconut tree (Cocos nucifera) with an IVI of 66.12%, Cocoa (Theobroma cacao) with an IVI of 54.26%, Silk tree (Albizia falcataria) with an IVI of 49.64%, Jack fruit (Atrocarpus integra) with an IVI 18.49%, West Indies Mahogany (Swietania mahogani) with an IVI of 13.30%, Rambutan (Nephelium lappaceum) with an IVI of 11.24%, Kapok Tree (Ceiba pentandra) with an IVI of 9.24%, Durian tree (Durio zibethinus) with an IVI of 7.87%, Weeping fig (Ficus benjamina) with an IVI of 6.92%, and the Banana tree (Musa x paradisiaca) with an IVI of 6.31%. The cocoa and silk tree species had a high density, frequency, and dominance, and they were constantly found in every observational location except in coastal and rice field areas.
The pole habitat contains 10 species with large IVI. Those poles are the cocoa species (Theobroma cacao), Silk trees (Albizia falcataria), Banana trees (Musa x paradisiaca), West Indies Mahoganys (Swietania mahogani), Jack fruit trees (Atrocarpusintegra), Rambutan trees (Nephelium lappaceum), Bamboo trees (Bambusa sp.), White leadtrees (Leuchaena glauca), Sugar-apple trees (Anona squamosa), and Flamboyant trees (Delonix regia). The Durian pole (Durio zibethinus) was found in numerous locations and is one of the most popular pole species planted. However, it cannot be planted regularly like the silk, coconut, or cocoa pole. The Durian species is a very useful source of food and income. This species was frequently found in plantation areas or in the yard in both tree habitats (IVI = 7.869) and pole habitats (IVI = 1.9).
The top seedling species found with large IVI include the Blady grass species (Imperata cylindrica), Costus megalobrachtea, Achasma megalocheilus, Banana tree (Musa paradisiaca), Cocoa (Theobroma cacao), Arabian jasmine (Jasminum sambac), Ipomea pes-caprae, Cyperus kyllingia (Kyllinga monocephala), Papaya (Carica papaya) as well as 18 other species.
5.10.3 River Estuary Ecosystem The river estuary ecosystem constitutes an ecotone area, which is an area that transitions from a fresh water ecosystem to a seawater/brackish water ecosystem. This ecosystem is a combination of various natural systems that interact with one another inside or within the surrounding ecosystems and connect through the mélange of fresh water and seawater. This transitional area has diverse terrestrial and oceanic properties because this ecosystem constitutes a crucial meeting point of fresh water and seawater estuaries. The vegetation that normally thrives in this environment consists of mangroves and brackish swamps. Terrestrial Biota sampling locations are shown in Figure 5-3.

Central Java CFPP Project
February 2018 Summary of Environmental and Social Impact Assessment Page 24 of 65
Figure 5-3: River Estuary Ecosystem
The mangroves that were identified are categorized into major, minor, and associative groups. Three species of major mangrove were identified in Batang particularly in the Regional Marine Conservation Area. Two species of minor mangroves and ten associated mangroves were also found. Based on the baseline observations conducted, the condition of the mangrove vegetation along the Project site shoreline of the study location resides predominantly in the western coast of the shore line.
• The kind of mangrove roots (Rhizophora) have as much as 6 individual poles with an IVI of 3.63% and diversity (H') of 0:07; and
• Saplings have as much as 1 individual level with an IVI of 1.92% and diversity (H') of 0.02.
Additional types of coastal vegetation (mangrove associates) that were found are:
• Bastard poon tree (Sterculia foetida) with IVI 1.77% and diversity index (H') 0.01%; • Cornbeefwood (Barringtonia) from pole stage IVI 2.57% with diversity index (H’) 0.04; • Beach sheoak (Casuarina equisetifolia) pole stage IVI 2.94% and H’ 0.05; and were
found in the sapling stage with an IVI of 1.93% with H’ 0.02; • Tropical almond (Terminalia catappa) in the tree stage with an IVI of 3.37% and H’
0,07; from pole stage IVI 2.24% with H’ 0.03; and from sapling stage IVI 4.63% with H’0.06;
• Ipomea (Ipomoea pes-caprae) with an IVI of 6.95 % and diversity (H’) 6.95.
Mangroves were found in 3 areas as indicated in Figure 5-4.
Central Java CFPP Project
February 2018 Summary of Environmental and Social Impact Assessment Page 25 of 65
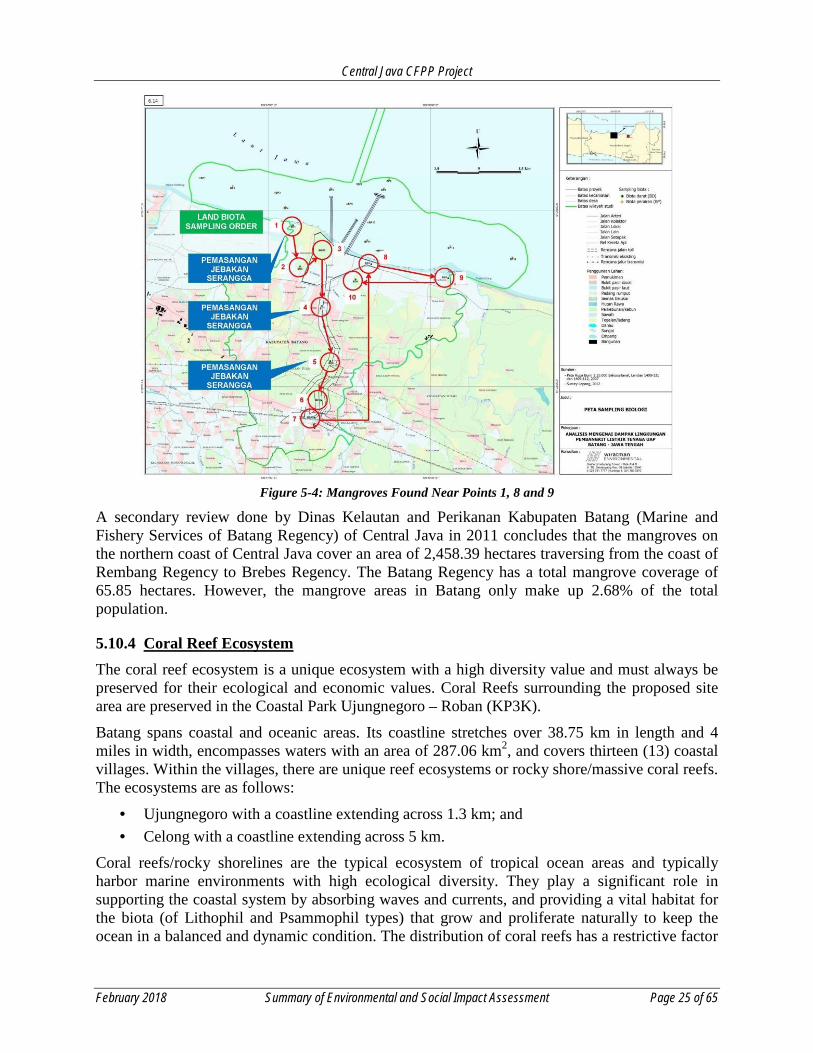
Figure 5-4: Mangroves Found Near Points 1, 8 and 9
A secondary review done by Dinas Kelautan and Perikanan Kabupaten Batang (Marine and Fishery Services of Batang Regency) of Central Java in 2011 concludes that the mangroves on the northern coast of Central Java cover an area of 2,458.39 hectares traversing from the coast of Rembang Regency to Brebes Regency. The Batang Regency has a total mangrove coverage of 65.85 hectares. However, the mangrove areas in Batang only make up 2.68% of the total population.
5.10.4 Coral Reef Ecosystem The coral reef ecosystem is a unique ecosystem with a high diversity value and must always be preserved for their ecological and economic values. Coral Reefs surrounding the proposed site area are preserved in the Coastal Park Ujungnegoro – Roban (KP3K).
Batang spans coastal and oceanic areas. Its coastline stretches over 38.75 km in length and 4 miles in width, encompasses waters with an area of 287.06 km2, and covers thirteen (13) coastal villages. Within the villages, there are unique reef ecosystems or rocky shore/massive coral reefs. The ecosystems are as follows:
• Ujungnegoro with a coastline extending across 1.3 km; and • Celong with a coastline extending across 5 km.
Coral reefs/rocky shorelines are the typical ecosystem of tropical ocean areas and typically harbor marine environments with high ecological diversity. They play a significant role in supporting the coastal system by absorbing waves and currents, and providing a vital habitat for the biota (of Lithophil and Psammophil types) that grow and proliferate naturally to keep the ocean in a balanced and dynamic condition. The distribution of coral reefs has a restrictive factor
Central Java CFPP Project
February 2018 Summary of Environmental and Social Impact Assessment Page 26 of 65
where virtually all coral reefs thrive in waters having boundaries of a 20°C surface isotherm. Hermatypic coral can survive for some time at temperatures slightly below 20°C, but no coral reefs will flourish at a mean annual temperature that is lower than 18°C. The most optimum growth of coral takes place in waters with an average annual temperature between 23°C and 25°C. Coral reefs, however, can tolerate temperatures from 36°C to 40°C. The depth is also significant because they cannot develop in waters at depths that are greater than 50 to 70 meter. Most of them develop at the depth of 25 meters or less. Different types of coral reefs are generally grouped into three (3) categories; atoll, barrier reefs, and fringing reefs.
The coral reef ecosystem is important to evaluate because several areas surrounding the site are under legal protection from the Indonesian government. The identification of the coral and its condition is an important aspect to analyze when establishing relevant mechanisms for external review of the Project’s risks and impacts identification process and proposed mitigation measures.
Coral reefs at the Project site are found in a number of spots with dead and weakening conditions. The locals are quite familiar with the different coral reefs in the area. Their names in order from west to east along the KP3K coast: Maeso, Pancer Darat Coral, Pancer Coral, Angrik Coral, Wuluhan Coral, Jojogan Coral, Guo Coral, Kepuh Coral, Kembar Coral, Ipik Coral, and Kretek Coral. The Karang Bapang coral reef also exists at the dredging dump site.
Only one of the existing Coral Communities is thriving although it has low diversity: the Kretek Coral. The coverage of hard corals is 6%. The only type discovered through a transect is Porites Lobata, hard coral with massive and sub-massive forms of growth. Beyond transect, a little amount from the Faviidae family, namely Favites species, is also found in a form of growth. The largest composition is Rock, which is dead coral (the origin is unidentifiable) that has been covered by algae. It is referred to as Dead Coral with Algae (DCA). Other dominant substrate is sand. The only abundantly found forming substance of coral reef is Sponge, a filter feeder organism that can survive, and often found in, waters having high rates of sedimentation.
The environmental quality of Ujungnegoro’s coastal areas has been impaired from sedimentation and abrasion. Despite the less considerable environment for coral reefs to thrive, there is an existing reef known as the Kretek coral reef that occupies the area. The Kretek coral reef is a heterogeneous marine biota with a low percentage of living coral, below 5%, but the existing reefs are not categorized as endangered. Also, no fish were recognized as endangered or protected.
Considering its current habitat condition, it is difficult to maintain the status of area of Kretek Coral as a “core zone”. It is suggested in the review of Ujungnegoro-Roban Sea Conservation area which was endorsed by Marine and Fishery Agency of Batang Regency to downgrade its status from Core Zone (fully protected) to Limited-Use Zone for Protection and Development of Biota Population (ZLP2B). ZLP2B should be focused on enhancing and promoting the restocking and stock enhancement or Fisheries Refuges. The major threat of sedimentation and fish net/fishing tools should be addressed by artificial coral reefs as protection.
Aside from the live Kretek coral reef ecosystem, there are also a lot of dead and weakening corals found in the Coastal Park of Ujungnegoro - Roban (KP3K) of Ujungnegoro. The most famous one is Maeso Coral Reef. The Maeso Coral ecosystem resides close to the mainland shoreline (of Sambong River and Sono River) causing the reef to be exposed to the threat of
Central Java CFPP Project
February 2018 Summary of Environmental and Social Impact Assessment Page 27 of 65
serious sedimentation. However, with its close position to mainland, it eases the ability to monitor the reef’s condition.
Coral Reef Ecosystem Near Dumping Area 5.10.4.1The CFPP construction phase will require extensive dredging and excavation at the Project site location. To mitigate the disposal of excess materials extracted from dredging, the Project proposed a dumping location approximately 16 km offshore. The bottom substrate conditions of the observation points at the Dumping Area, Outer Dumping Area and Bapang Coral ecosystem are entirely covered with mud. Mud on the bottom substrate rarely includes a living biota and is commonly barren. This condition is very different with the bottom substrate of a coral reef ecosystem that has various marine organisms and fish. Thus, the baseline studies did not find live coral reef ecosystem at the observation location of the dumping area. Several aspects could cause the absence of coral reefs including:
1. Mud on the bottom substrate: Coral reefs live in areas with a solid bottom substrate and on grounds that are not easily shifted. Bottom substrate at the Dumping Area and Outer Dumping Area contains mud that is easily stirred if exposed to currents or from fishing gears such as beach seine and trawl. Planula would not survive on the bottom substrate. Moreover, mud on the bottom substrate is easily stirred and could clog feeding structures for corals (Nybakken, 1992).
2. Depth and sunlight penetration: Coral reefs can only live at certain depths, mainly in a 25 meter depth or less. The depth is related to sunlight penetration capabilities and the ability to reach the coral reef. Zooxanthela, single cell algae, needs sunlight to be symbiotic with coral reefs in order to carry out photosynthesis. Not enough sunlight can lower the rate of photosynthesis along with the coral reefs ability to produce calcium carbonate. Thus, the ability for coral reefs to form and grow will be reduced exponentially as the sunlight penetrates less. The Dumping Area and Outer Dumping Area observation points have sunlight penetration levels of 8.5 to 18.68 meters for waters that are 34 to 40 meters deep. These conditions are not conducive for coral growth.
3. Salinity: Coral reefs typically live at the normal range of salinity of 32% to 35% (Nybakken, 1992), but coral reefs can also live at high levels of salinity of 42% (e.g. in the Persian Gulf). Several observation points at the Dumping Area and Outer Dumping Area have level of salinity below normal.
On the surface of the sea floor, big and small holes are found and represent the organisms that are conducive to the muddy reef. Most of the organisms living in the area show their adaptation process by digging into the soft substrate or fill a permanent channel in the substrate (Nybakken, 1992). Organisms that live in the holes are polychaeta, bivalvia and penaeus merguiensis.

Central Java CFPP Project
February 2018 Summary of Environmental and Social Impact Assessment Page 28 of 65
Figure 5-5: Holes Found in the Seabed
The dumping area, the outside dumping area, and the area around Karang Bapang have the following characteristics:
• The sea floor’s substrate is muddy with big and small holes above floor’s substrates. • No coral reefs or protected marine biota were found. • Marine biotas found on the surface of the sea floor’s substrates are Goby Fish
(Ctenogobiops aurocingulus), Star Fish (Asteria sp), Tube Anemone (Cerianthus Sp), Sand dollar (Laganum Sp), Sea pen (Pennatula Sp), and Pig Hair (Diadema setosum).
• Marine biotas living under the floor’s substrates are worms (polychaeta) and shells (bivalve).
• Small fish (Stolephorus Sp) and cob fish (Euthynnus spp.) are rare but were found one time.
• At the three locations, traditional fishermen were seen using fishing gear including arads and cantrangs.
The results of the survey for the area surrounding the Bapang coral reef system are summarized below.
• Q1 point: is a point around Bapang Coral Reef with a depth of 34 m. The ocean floor here receives very little sunlight. Substrates at the ocean floor are easily mixed mud. Neither coral reefs nor marine life were found at the ocean floor.
• Q2 point: The pH at Q2 has a pH of 8.38 and is in accordance with the Decree of the Minister of the Environment No 51/2004 annex 3 on standard of seawater for marine biota. That means that there is minimal influence from other chemical factors that affects the seawater’s pH (thus, becoming too acid or too basic). A coral reef can tolerate temperatures in the range of 36°C to 40°C; as such, it is still possible for coral reefs to grow here. However, there is no coral found at this location. This is due to the substrate’s muddy condition and the deep depth reaching 45 meters. No fish were seen and no fishermen’s activity was seen around this point.
• Q3 point: is the point around the Bapang Coral Reef. The average salinity was 3.32%; average dissolved oxygen (DO) was 0.74 mg/l; average temperature was 29.47°C; the average conductivity was 50.43. The seawater brightness level was measured vertically using a secchi disk and has a brightness level of 8.95 meters. The depth at Q3 reaches 43 meters. This sample indicated that no coral reef was found due to the limited amount of

Central Java CFPP Project
February 2018 Summary of Environmental and Social Impact Assessment Page 29 of 65
penetrating sunlight and the muddy substrate conditions. There were 6 fishermen’s boats operating near this point at a distance of less than 800 m east of Q3. An additional boat was also seen at a distance of 400 m north of Q3.
• Q4 point: conditions are similar to Q3 point. The ocean floor’s condition was relatively muddy. No coral reefs were found and fish were observed during the sampling period.
5.10.5 Overview of Terrestrial Fauna The region has been settled on for centuries and has become a farming community with agricultural industries that include chicken farming, raising livestock, and fishing.
The results of the baseline studies indicate that there are “protected species” (according to Indonesian Regulation No. 7, 1999) as well as species that are identified under the IUCN Red list under the “near threatened” and “least concern” categories in the area. The IUCN Red list is referenced under Performance Standard 6: Biodiversity Conservation and Sustainable Management of Living Natural Resources. The Central Java site is considered a modified habitat.
Birds 5.10.5.1The Central Java region is home to thousands of birds with 70 different species recorded during the faunal study period. There were two (2) types of birds that are identified as “near threatened” under the IUCN Red list, and fourteen (14) “protected species” identified on a list under Indonesian National law PP No. 7 of 1999.
The values of the bird diversity index, indicated in the collected data revealed that H' is 2.595 and Σ is 0.611. This means that the diversity of the bird species is and its similarity is stable. Although the number of birds encountered is relatively diverse, the dominating population of one species in particular, the Cave Swiftlet, is affecting analysis results. The domination of one species could happen when there are limited resources, or when a species has a rapid reproduction rate. The Cave Swiftlet (Collocalia linchi) species recorded a total of 595 birds during the study period. Encounters with this bird occurred at every observation location with a predominant number found in locations TB 3 and 4. The Olive-backed Sunbird (Nectarina Juncidis) and Javan Munia (Lonchura leucogastroides) were also the most common types of birds that could be seen in the secondary crop fields and wild bushes.
Figure 5-6: Olive-backed Sunbird, Javan Plover, and Collared Kingfisher

Central Java CFPP Project
February 2018 Summary of Environmental and Social Impact Assessment Page 30 of 65
Of the 70 bird species that were found, 14 bird species are protected under the Government Regulation Number 7 Year 1999 and 2 bird species were identified on the IUCN Red list under the “near threatened” category.
Details on the two types of birds identified as “Near Threatened” are as follows:
1. Oriental Darter (Anhinga melanogaster): This bird prefers mangroves, lakes, swamps, and river estuaries. Its dispersion pattern is endemic, spanning across Southeast Asia. The mating season is between December to March and in some areas from March to June, which is the wet season and the beginning of the dry season.
2. Javan Plover (Charadruis javanicus): This bird typically lives on the shoreline within a small group. They prefer open coastal regions, sandy beaches, and swampy estuaries. The bird has been identified in various regions in Indonesia (i.e. Sumatra, Sumbawa, Flores, Sulawesi, Bali and Kangean) and is, therefore, endemic to Java Island. The nesting periods vary depending on the microclimate and food availability. However, they predominantly nest during January-October in West Java and April-May in Central and East Java.
The fourteen (14) “protected species” identified on a list under Indonesian National law PP 7, 1999 are as follows:
1. Oriental Darter, Anhinga melanogaster; 2. Black Eagle, Ictinaetus malayensis; 3. Javan Kingfisher, Halcyon cyanoventris; 4. Collared Kingfisher, Todirhamphus chloris; 5. Cerulean Kingfisher, Alcedo coerulescens; 6. Blue-eared Kingfisher, Alcedo meninting; 7. Little Egret, Egretta garzetta; 8. Pacific Reef Heron, Egretta sacra; 9. Cattle Egret, Bubulcus ibis; 10. Intermediate Egret, Egretta intermedia; 11. Pied Fantail, Rhipidura javanica; 12. Curlew, Numenius sp; 13. Olive-backed Sunbird, Nectarinia jugularis; and 14. Brown-throated Sunbird, Anthreptes malacensis.
Additionally, the mangroves along the shore line provide an important habitat for various birds such as the little ringed plover (Charadrius dubius), common sandpiper (Tringa hypoleucos), Javan pond heron (Ardeola speciosa), and striated heron (Butorides striatus) because they rely on the coastal ecosystem for food. The other four species, namely the golden-bellied gerygone (Gerygone sulphurea), yellow-bellied prinia (Prinia flaviventris), pied fantail (Rhipidura javanica) and the spotted dove (Streptopelia chinensis) were also found in the bushes and mangroves searching for insects and fruits for food.

Central Java CFPP Project
February 2018 Summary of Environmental and Social Impact Assessment Page 31 of 65
Mammals 5.10.5.2The surveyors did not observe many mammals surrounding the proposed site due to the agricultural modification to the land and the heavy residential presence. The habitat lacks a suitable location for local mammals both large and small. There were 5 species of mammals spotted during the assessment process.
All five species were listed in the IUCN Red list under the “Least Concern” category. These species were most likely not native to the land and mostly inhabit the land because they thrive off of the agriculturally farmed land. The five species are the the Banded Linsang (5), the Small Asian Mongoose (1), Ricefield Rat (6), Plantation Squirrel (4) and Three-striped Ground Squirrel (1). Of the five species, the banded linsang and the three-striped ground squirrel are also listed as protected fauna under Indonesian National Law.
The rice-field rat species are smaller than brown rats (Rattus norvegicus). Based on additional information collected from interviews, the rice-field rats are frequently found when the rice (Oryza sativa) starts to yellow, causing these rice-field rats to become pests to the farmers. There were fewer encounters with the rice-field rats because the rice-field was not turning yellow during the survey process.
The Banded Linsang species is yellowish white with brownish-black spots, slender with a conical head, and its stripes extend along its upper neck. Its body is 350 to 411 mm in length with a tail that is 295 to 363 mm long and typically weighs 598 to 798 grams. Direct encounter with Banded Linsangs occurred at locations which are close to coast and plantation areas but far from the residential areas.
The Plantain squirrel species is a small diurnal (active in daylight), arboreal mammal. There were direct encounters with 2 Plantain squirrelsThey were found in a coconut plantation. Based on information collected from interviews, plantain squirrels are hunted for food which could be the reason for the limited numbers of the Plantain squirrels in the study area.
The Mongoose has a body that is covered with a brown pelag and similar in size to a cat’s body. The Mongoose were found in TB 1 and TB 4 (those that were found in TB 4 were dead). The mongoose typically eats crabs, snakes, birds, and chickens. This diet makes Mongoose a pest to chicken farmers and residential chicken owners.
The three-striped ground squirrel species was observed. A direct encounter with this mammal was made in TB 9. The small number of three-striped ground squirrel may be due to hunting activities. According to the local people, this squirrel meat is very desirable to consume.
Based on Shannon-Wiener diversity index, the mammal population of the area can be quantified with a H’ value of 1.401 and an index of evenness (E) value of 0.871. The diversity of the species of mammals in the study areas is categorized as low diversity and high evenness. The threat of hunting and the consideration of these mammals as pests are the main factors in maintaining the diversity of the mammals in the study areas. Mammals found in the study areas are those that can survive in a shrinking habitat. Activities engaged by the villagers in the study areas include farming, fishing, gardening, and hunting. Based on information from the local people, mammals like the banded linsang, the plantain squirrel, and field rats are hunted and consumed.

Central Java CFPP Project
February 2018 Summary of Environmental and Social Impact Assessment Page 32 of 65
Amphibians and Reptiles 5.10.5.3The herpetofauna is a group of cold-blooded animals such as toads, frogs, lizards, and snake species. There are 18 species that consists of 8 different families. The species that are most numerous and frequently found are the East Indian Brown Mabuya (Eutropis multifasciata) with IVI 48.08%, and the Asian Grass Lizard with IVI 22.33% (Takydromus sexlineatus).
The reptiles found during the field study included 10 reptile species which includes 4 species of snakes, 2 species of dragon lizards, and 2 species of geckos. The most commonly found reptile was the Tokay gecko (Gekko gecko). None of the reptiles surveyed were considered to be threatened or protected.
Figure 5-7: Painted Bronzeback, Flying Dragon, and Black-spectacled Toad
Five species of frog have been noted during the field survey; the most common species that was spotted was the Asian Brackish Frog.
Three species of toad were also identified during the field survey process. The most common species of toads found were the Black-Spectacled Toad (Duttaphrynus melanostictus) and the Double Crested Toad (Ingerophrynus biporcatus). No threatened amphibians are present in the area.
Reptiles can also be found in the coastal areas, particularly those that use the mangroves as their habitat. These include the Javan spitting cobra (Naja sputatrix), little file snake (Acrochordus granulatus), and Malaysian kraits (Bungarus candidus) from among the reptile groups.
Amphibians were found to populate areas BD 5 through BD 10 which are more inland and around the future transmission lines. The most popular locations for the reptiles to be found were at BD5 through BD9.
Eighty-nine percent (89%) of the encountered species are included in the red list as “Least Concern”, which means that the existence of the species is not threatened based on the International Union for Conservation Nature (IUCN). Threats to the existence of the species among others include hunting and habitat damage. In the concession areas, not all of the riparian forest areas are used for conservation. The existence of the areas is very crucial for the cold-blooded animal conservation like herpetofauna (Primack dkk., 1998).
The value of the diversity index (H') for herpetofauna is 2.342 (moderate), and the Evenness index (E) is 0.810. Thus, although the species are not too homogeneous, there are still dominant species as well as species that are rarely found. For example, the Many-lined Sun Skink was found in almost every observation location and are very abundant in TB 6 (27 sightings), while the red-necked keelback (Rhabdophis subminiatus) and the Javan spitting cobra (Naja sputatrix) were only found once each in TB 1 and TB 8, respectively. The existence of frog or toad species

Central Java CFPP Project
February 2018 Summary of Environmental and Social Impact Assessment Page 33 of 65
is connected with the existence of snakes in the food chain of an ecosystem. If one link in the food chain is broken, the population of another species may become either uncontrollable or completely extinct.
5.10.6 Marine Biota The marine biota is important to evaluate because several areas surrounding the Project site are under legal protection from the Indonesian government. The identification of the coral and its condition is an important aspect to analyze when establishing relevant mechanisms for the external review of the Project’s risks and impacts identification process and the proposed mitigation strategy. The study results indicate that no marine biota species or fish are categorized as endangered, endemic, nor governed under relevant laws. A summary of the Marine Biota Study was extracted from Appendix B (Coastal) and Appendix C (Dumping) of the ESIA and described within the following sections.
Kretek and Maeso Coral Reef 5.10.6.1According to Minister of Marine and Fisheries Regulation No. 29/2012 “Coastal Park of Ujungnegoro-Roban”, the quality of resources in KP3K have been impaired. It can be clearly seen from the diversity and saprobes indices of plankton and benthos; which indicate if an ecosystem has been disrupted due to sedimentation and/or pollution. The nekton data also suggest a low number of fish.
The species of coral fish that live in the Kretek coral reefs originate from three (3) families, namely; Pomacentridae, Labridae, and Siganidae which accounts for relative abundances of 78.78%, 3.02%, and 18.18% respectively. Coral fish found with a high economic value include the Baronang fish of the Siganus javus species.
The mollusks living in the Coastal Park of Ujungnegoro - Roban (KP3K) of Ujungnegoro coast have a considerably high diversity compared to those found in its surroundings and the area has the potential for mollusks cultivation.
The condition of the Kretek Coral has deteriorated significantly based on the following conditions: (1) its percentage of living coral is less than 5%, (2) its conservation value index is low (E category), and (3) no found biota was categorized as endangered nor governed within law.
Despite the deteriorated condition of the Kretek Coral, it still plays an important role as a habitat for marine biota (such as Sea Cucumber, Gastropods, Sea whip, various types of coral fish, Sponge, Soft Coral, and algae). Considering its current habitat condition however, it is difficult to maintain the status of the Kretek Coral area as a “core zone” (fully protected). The Marine and Fisheries Agency of the Batang Regencysuggested to downgrade its status from core zone into limited-use zone for Protection and Development of Biota Population (ZLP2B).
ZLP2B should be focused on enhancing and promoting the restocking and stock enhancement for fishery refuges. The major threat of sedimentation and fish net/fishing tools should be addressed by Artificial Coral Reefs as protection. The making, planting, and maintenance of coral reef costs a lot. A consortium comprised of private parties and government officials should be established to bear the cost (Note: With the current status of the Kretek Coral, making no effort to protect it will cause the ecosystem to naturally go extinct, be buried by the sediments, or suffer from the net/fishing tools).

Central Java CFPP Project
February 2018 Summary of Environmental and Social Impact Assessment Page 34 of 65
Plankton Community 5.10.6.2Plankton is a microscopic organism living within the water column. Plankton is the primary producer of organic compounds from inorganic compounds. The condition of the water column is considered more fertile when there is a high plankton population with a high diversity of species. However, an abundance of only one plankton species will give a negative impact as it can harm the fishing activities and affect human health.
The number and composition of plankton in an aquatic environment can be used to determine if there is a lower contamination level in a body of water. Additionally, plankton are also a crucial indicator to determine the productivity level of a water column.
The quality of the water column, from a biological aspect, can be assessed by observing the phytoplankton. The phytoplankton community occupying the marine ecosystem consists of various species, each with different population levels. There are three principle elements to the community structure:
1) the number of species; 2) the population of each species; and 3) the total number of individual phytoplankton in the community.
The relationship among these three components can be described mathematically to quantify the diversity index (H'). The observation results on the diversity index (H'), number of species, and plankton dominance index were collected for 14 different stations. The number of species in each station ranges from 7 to 9 and is on average 7.7. The diversity index ranges from 1.705 to 1.904 and averages to 1.755. The plankton dominance index ranges from 0.173 to 0.299 and averages to 0.214.
The plankton’s environmental quality can be used to conclude that the ocean’s water condition, found by the average range values in the diversity index and the dominance index, is in good condition. The average diversity index value of (H') 1.755 falls within the desired range of 1.5 < H’ < 2. The average dominance index value of (d) 0.214 falls within the desired range of 0.20 < d < 0.26.
Benthos Community 5.10.6.3Benthos is an organism that inhabits the seabed and has become a crucial indicator for water productivity levels because they are in contact with water quality and/or pollutant loads for considerably long periods of time. The parameters used to interpret the pollution levels of oceanic waters are diversity and saprobic indexes. The Saprobic index is the coefficient used to assess the pollution levels of a water body with reference to benthos communities. The results are as follows:
• The study locations at the Maeso Coral (KM-1, KM-1, KM-3, KM-4, and KM-5) are categorized as somewhere in between less stable and quite stable with a diversity index (H’) ranging from 2.12 to 2.47 and a saprobic level of mesosaprobic type (IS) ranging from 0.65 to 1.00 with mild/medium pollution levels.
• The study locations of the Kretek Coral (KK-1, KK-2, KK-3, KK-4, and KK-5) are categorized as somewhere in between less stable and quite stable albeit the threat of sedimentation. The H’ value ranges from 2.19 to 2.47. The saprobic level (IS) ranges

Central Java CFPP Project
February 2018 Summary of Environmental and Social Impact Assessment Page 35 of 65
from 0.79 to 1.00 (reflecting waters of mild pollution) and is categorized as mesosaprobic. The results show that the waters around Maeso and Kretek Corals suffer from pressure stemming from high sedimentation from the nearby rivers (Sambong River, Sono River, and Roban River).
• The proposed locations for the CFPP circulating water inlet (I-1, I-2, I-3, I-4, and I-5) are categorized as somewhere in between less stable and quite stable. Its diversity index (H’) ranges from 1.37 to 2.37, and a saprobidity of mesosaprobic type (IS = 0.73 to 1.00).
• The proposed circulating water outlet locations (O-1 to O-15) are categorized as somewhere in between a less stable and quite stable ecosystem. Its diversity index ranges from 0.79 to 2.29, and the saprobidity level is at a low category with the IS ranging from 0.63 to 1.
• The proposed locations of Jetty of CFPP have are categorized as somewhere in between a less stable and quite stable ecosystem. Its diversity index (H’) ranges from 0.70 to 1.75, while its saprobidity is categorized as low to medium (mesosaprobic) ranging from 0.68 – 1.82.
Based on the range of values on the benthos scale, the ocean water quality in forested areas ranges from poor to quite good. The diversity index and dominance index have the following quantitative value:
• The average diversity index value (H') = 1.108 (1.0 < H’ < 1.5 ) • The average dominance index value (d) = 0.302 (0.25 < d < 0.31)
Saltwater Fish 5.10.6.4The fishing in the Ujungnegoro waters span from Sigandu to Roban. The fishing data was collected from local fisherman using a Trammel-net from April 20 to 23, 2012. The fish caught included; Banana Prawn (Penaeus merguiensis), Tank Goby (Glossogobius giuris), Slender-barred Ponyfish (Leiognathus insidator), Fishbase (Pseudosciaena aneus), Yellowstrip Scad (Caranx sexfasciatus), and Beltfish (Trichiurus lepturus). The fish are not categorized as endangered, endemic, or lawfully protected.
Saltwater Fish at Dumping Location 5.10.6.5Based on photo and video surveillance, the living marine biota found on the bottom substrate include the Goby fish (Ctenogobiops aurocingulus), Starfish (Asteria), Tube Anemone (Cerianthus), Sand dollar (Lagamum), Sea pen (Penantula) and Sea urchin (Diadema setosum). There were only several instances recorded where a type of anchovy (Stolephorus) was found.
The conditions at the dumping area, outside the dumping area, and around the Bapang coral reef in general are summarized below:
• The sea floor’s substrates are muddy with big and small holes above the floor’s substrates. • Divers did not find any coral reefs or marine biota protected at these locations. • Marine biota found on the surface of the sea floor’s substrates were Goby Fish
(Ctenogobiops aurocingulus), Star Fish (Asteria), Tube Anemone (Cerianthus), Sand dollar (Laganum), Sea pen (Pennatula) and Pig Hair (Diadema setosum), while biota living under the floor’s substrates were worm (polychaeta) and shell (bivalve).

Central Java CFPP Project
February 2018 Summary of Environmental and Social Impact Assessment Page 36 of 65
• Observation showed that small fish (Stolephorus) were rarely found, and a cob fish (Euthynnus) was found once.
• At the three locations, traditional fishermen were seen using fishing gear like Arad and Cantrang.
5.11 Socio-Economic Environmental The proposed construction site of Central Java CFPP in the Batang District is in two sub-districts, namely Kandeman and Tulis. At the end of 2010, the populations of Kandeman and Tulis were 46,389 and 35,084, respectively.
A total of nine villages are directly affected by the Project. These are: Karanggeneng, Ujungnegoro, Ponowareng, Kenconorejo, Wonokerso, Simbangjati, Beji, Tulis and Wringingintung. The power plant site, which is located in the Karanggeneng, Ujungnegoro and Ponowareng villages, will require substantial land acquisition. The substation, located in the Simbangjati village, and the transmission line and access road, routed in most of the nine villages, will not require any substantial land acquisition. Land required for the transmission line ROW can still be used for agricultural purposes. A tenth village, Kedungsegog, is also somewhat affected. It is away from the Project site and there is no need to acquire any land or buildings or displace any people in this village. However, the livelihood of fishermen in this village will be affected by the construction of coal unloading jetty and intake and discharge systems.
5.11.1 Location and Land Use Most of the land surrounding the Project site is agricultural land.
5.11.2 Demography
Population densities in the subdistrict of Kandeman and subdistrict of Tulis were 11.11 inhabitants per hectare and 8.04 inhabitants per hectare, respectively.
Sub-district Kandeman consists of 13 villages. Ujungnegoro and Karanggeneng villages, where the proposed site of power plant is located, have higher population densities when compared with that of Kandeman. The densities of these two villages are 12.33 inhabitants per hectare and 11.83 inhabitants per hectare, respectively. Sub-district Tulis consists of 17 villages. Ponowareng village, where the proposed power plant, transmission line and access road are partially located, has a population density of 10.39 inhabitants per hectare. Beji village, where the proposed switching station is located, is densely populated with population density of 45.58 inhabitants per hectare.
Population densities of the villages in both sub-districts are shown in following Table 5-3. Table 5-3: Population Densities in Sub-districts Kandeman and Tulis
No. Village Area (ha) Inhabitants Density (Inhabitants/ha)
Sub-district Kandeman 1 Lawangaji 171 1,304 7.63 2 Karanganom 144 1,630 11.32 3 Botolambat 276 3,281 11.88

Central Java CFPP Project
February 2018 Summary of Environmental and Social Impact Assessment Page 37 of 65
No. Village Area (ha) Inhabitants Density (Inhabitants/ha)
4 Cempereng 115 1,688 14.65 5 Tragung 267 1,941 7.26 6 Tegalsari 488 7,457 15.29 7 Kandeman 282 3,345 11.87 8 Juragan 328 3,702 11.28 9 Bakalan 272 2,471 9.10 10 Wonokerso 325 3,538 10.90 11 Karanggeneng 228 2,700 11.83 12 Ujungnegoro 579 7,137 12.33 13 Depok 701 6,195 8.84 Total for Kandeman 4,176 46,389 11.11 Sub-district Tulis 1 Tulis 144 4,555 31.63 2 Wringingintung 342 2,776 8.13 3 Posong 362 771 2.13 4 Sembojo 219 1,288 5.89 5 Beji 96 4,357 45.58 6 Kaliboyo 142 1,620 11.43 7 Simbangdesa 47 2,108 45.33 8 Simbangjati 97 1,329 13.77 9 Ponowareng 231 2,402 10.39 10 Kenconorejo 627 2,492 3.97 11 Kedungsegog 372 2,252 6.06 12 Manggis 333 1,115 3.35 13 Jolosekti 586 1,141 1.95 14 Siberuk 144 922 6.42 15 Kebumen 259 1,806 6.98 16 Cluwuk 103 917 8.94 17 Jrakahpayung 263 3,233 12.31 Total for Tulis 4,363 35,084 8.04
Source: Statistics of Sub-districts Kandeman and Tulis, 2011.
5.11.3 Economic Profile In general, people in Kandeman sub-district engage in four sectors, namely food-producing agriculture (22%), manufacturing (17% as factory labors), trading (15%), and plantation (14%).
Ujungnegoro and Karanggeneng villages have respectively 24% and 38% of their people working as farmers. The main natural resource bearing economic advantage is fisheries. 32% of the inhabitants of Ujungnegoro are fishermen. People in these villages also engage in the plantation sector with about 16% in each village.
Agriculture is the backbone of the economy in Tulis sub-district. At the end of 2010, 32% of its inhabitants relied on it for their livelihood. Trading is the other main sector (19%). Agriculture products dominate the trading here. The manufacturing sector also attracts 11% of its people. 10% of its inhabitants choose to engage in public services.

Central Java CFPP Project
February 2018 Summary of Environmental and Social Impact Assessment Page 38 of 65
All villages traversed by transmission line and access road are mainly agricultural whose people rely on food-producing plants for their livelihood, in particular Wringingintung (35%), Ponowareng (46%), and Kenconorejo (41%). About 18% of inhabitants in the Tulis village, 12% in Beji and 20% in Simbangjati work in agriculture sector.
Most of the inhabitants of Tulis village prefer to be employed as industrial laborers (20%) and in the trading sector (18%). In Beji and Simbangjati, 30% and 25% of inhabitants prefer to work in the trading sector, respectively.
5.11.4 Project Affected Land The total Project Affected Land including the Power Plant, 500kV Switching Station, Transmission Line and Access Road is 3,219,183 square meters. Of the total land area affected by the Project, actual land area used for the Project will be smaller. The Project Site includes a large area which is flat and an area along the western boundary of the site which is a “hilly area” with a steep grade. The hilly area can be seen in Figure 5-8 below. the area within the red lines are at a higher elevation (approximately 30 meters) above the rest of the site.
Figure 5-8: Project Site showing “Hilly Area”
In the power plant area, part of the hilly area will not be used and will be left as is. Land area under the ROW of transmission line is not disturbed directly by the Project, except for construction of transmission towers, and it can still be used by the landowner for agricultural purposes. Therefore, according to the Decree of the Minister of Mines and Energy, most of the land in ROW does not need to be acquired by the Project. Only the land required for construction of the foundations for the transmission towers need to be acquired. Also, the land area covered by the coastal access road need not be acquired by the Project since this road was developed by the Batang Regency for community development.

Central Java CFPP Project
February 2018 Summary of Environmental and Social Impact Assessment Page 39 of 65
Land affected by the project consists of private land owned by the Project Affected People (PAP) and land not owned but currently cultivated by the PAP through various agreements with the other land owners. The other land owners include individuals, village/community, and Government.
Table 5-4: Ownership of Project Affected Land Plots (Area in square meters)
Sub-District Village Unit Paddy Field Orchard Unused Land Other Total
Power Plant
Kandeman Karanggeneng Plots 550 130 12 4 554
Area 641,466 293,213 18,000 93,485 1,046,165
Ujungnegoro Plots 137 - 202 4 343 Area 284,998 - 700,984 16,753 1,002,734
Tulis Ponowareng Plots 69 19 1 3 92
Area 149,600 27,553 2,749 16,511 196,412
Kenconorejo Plots 4 - 2 - 6 Area 7,190 - 1,002 - 8,192
Power Plant Subtotal Plots 618 149 217 11 995 Area 1,083,254 320,766 722,734, 126,748 2,253,502
500 kV Switching Station
Tulis Simbangjati Plots - 1 - - 1 Area - 188,000 - - 188,000
Transmission Line
Kandeman Karanggeneng Plots 66 - - - 66
Area 69,083 - - - 69,083
Wonokerso Plots 2 3 - 30 35 Area 52 13,079 - 22,991 36,122
Tulis
Ponowareng Plots 11 - - 15 26 Area 7,254 - - 11,690 18,944
Kenconorejo Plots 13 2 - 23 38 Area 15,354 5,301 - 23,815 44,470
Simbangjati Plots - 1 - 1 2 Area - 70,300 - 132,000 202,500
Beji Plots 81 - - 164 245 Area 134,361 - - 168,154 302,515
Tulis Plots 50 13 - 68 131 Area 58,170 4,686 - 17,198 80,054
Transmission Line Subtotal Plots 223 19 - 301 543 Area 284,274 93,366 - 376,049 753,689
Access Road
Kandeman
Karanggeneng Plots 1 - - - 1 Area 1,091 - - - 1,091
Ujungnegoro Plots 3 - - 7 10 Area 149 - - 461 609
Juragan Plots - - - 2 2 Area - - - 163 163
Bakaklan Plots - - - 8 8 Area - - - 326 326
Tulis Ponowareng Plots 9 - - - 9 Area 18,202 - - - 18,202

Central Java CFPP Project
February 2018 Summary of Environmental and Social Impact Assessment Page 40 of 65
Sub-District Village Unit Paddy Field Orchard Unused Land Other Total
Kenconorejo Plots 2 - - - 2
Area 3,601 - - - 3,601
Access Road Subtotal Plots 15 - - 17 32 Area 23,043 - - 949 23,992
Total for the Project Plots 856 169 217 329 1,571 Area 1,390,571 602,132 722,734 503,746 3,219,183
5.11.5 Project Affected Buildings No structures will be acquired or demolished as a result of the Project. Buildings that are affected by construction of the Project are mostly in the areas crossed by the transmission line and access road in the villages of Ponowareng, Beji and Tulis. These buildings are mainly affected by noise and dust during construction. However, there is no need to acquire and demolish these buildings. For the ROW of the transmission line, in order to have the clearance between the lowest transmission line conductors and buildings to be maintained at a minimum of 9.0m, the height of buildings will become restricted by construction of the transmission line. No further construction can be carried out on buildings under the transmission line clearance. Such buildings are categorized as project affected buildings and will be compensated by BPI. None of the existing buildings in the ROW will be damaged nor will their size be reduced because of the Project.
5.11.6 Composition of Affected Households
Age 5.11.6.1Based on the data collected from the representative sample of households including landowners and tenant farmers (300 households surveyed), the age composition of the household head is as follows: About 73% of the household heads are less than 55 years old. This range of age is considered as productive age, which could be qualified for Project related jobs for supporting their families. Therefore, all efforts will need to be made to avoid loss of livelihoods by generating jobs associated with the Project.
Marital Status 5.11.6.2Based on the data collected from the representative sample of households, the proportion of males to females is about 48% and 52% respectively. About 84% of the household heads are married and there are 2% widowers and 14% widows. Special attention needs to be provided to household heads who are widows since they are potentially vulnerable people.
Residency Duration 5.11.6.3Sociologically, the length of stay in a certain location affects the emotional bond with the community. Longer stays in a certain location makes it more difficult to move to another area.
Based on the data collected from household heads, it shows that majority of the PAPs have been living in the area for more than 20 years. It should be noted that the Project affected households do not reside on the land to be acquired. There are no residents on the land affected by the power

Central Java CFPP Project
February 2018 Summary of Environmental and Social Impact Assessment Page 41 of 65
plant and substation. The few residents in the close vicinity the land affected by the transmission line and access road will be mainly affected by noise and dust during the construction activities.
During the operation of the power plant, there is some concern about the effects of magnetic field on the residents in the close vicinity of the high voltage transmission line route. BPI will follow the governing Indonesian safety standards and regulations applicable for installation of the transmission lines.
Occupation 5.11.6.4Based on the data collected, 69.2% of household heads are engaged in agriculture, followed by 11.1% in trade and 16.8% in services. About 2.9% are unemployed. Most of them are farmers with their own land; sharecroppers working on land owned by others or farm workers.
Income 5.11.6.5In September 2011, Government of Indonesia has set the poverty line at per capita earning of about Rp 250,000 per month. Income levels for poverty threshold set by World Bank are higher. Details of income levels are shown below which indicate that a small percentage of PAPs are below the poverty line and will need more attention and assistance.
Monthly Income (Rp):
• < 250,000 3.5% • 251,000 to 500,000 7.3% • 501,000 to 750,000 13.3% • 751,000 to 1,000,000 18.5% • 1,001,000 to 1,250,000 7.3% • 1,251,000 to 1,500,000 10.5% • >1,501,000 39.6%
Education 5.11.6.6The education level of household heads indicates that most of them have attended and/or completed elementary school. The small percentage of PAPs who did not attend any school and are considered illiterate will have difficulty in understanding the documents relating to compensation for their assets. These PAPs will need help and assistance.
Education Level
• No School 13.2% • Elementary School Incomplete 30.0% • Elementary School Graduated 28.4% • Junior High School Incomplete 3.0% • Junior High School Graduated 10.8% • Senior High School Incomplete 0.7% • Senior High School Graduated 10.5% • College University Incomplete 0.0%

Central Java CFPP Project
February 2018 Summary of Environmental and Social Impact Assessment Page 42 of 65
• College University Graduated 3.4%
Indigenous People 5.11.6.7Assessment has been carried out and no indigenous people have been found living in the area. The people in Batang are mostly Javanese who speak both Javanese and Indonesian.
Vulnerable People 5.11.6.8Based on the criteria developed by the World Bank and International Finance Corporation (IFC), and considering local government concerns, there were vulnerable people identified within the villages. They are classified as below:
• Elderly people more than 70 years old • Female head of household • Disabled people • People below poverty level
5.12 Cultural Sites The cultural locations local to the new plant were evaluated and found not to be impacted by the project. These sites are listed below:
• Sojomerto Inscription • Syekh Maulana Maghribi Tomb • Ujungnegoro Beach and Resort Area
Central Java CFPP Project
February 2018 Summary of Environmental and Social Impact Assessment Page 43 of 65
6. ANTICIPATED ENVIRONMENTAL AND SOCIAL IMPACTS AND MITIGATION MEASURES
This section of the ESIA identifies and evaluates the “critical items” potentially having significant environmental and social impacts during the developmental and operational stages of the Project.
The following analysis is derived from on-site observations, field analysis, consultation with local experts, and literature review. In addition, environmental impact modeling was carried out for the relevant effects for the Project:
• Atmospheric dispersion modeling of stack emissions; • Noise dispersion modeling; • Thermal dispersion modeling of circulating water discharge; and • Sedimentation Analysis.
The Project has an overall positive impact by providing a competitive, cost effective, and reliable mode of electrical power generation to meet the increasing demand for power and bridging the gap between the supply and demand of power. This will be accomplished while ensuring compliance with air and water quality standards, and noise limits through engineering design and point of emission controls.
6.1 Air Emissions Mitigation
6.1.1 Name of Pollutants The primary air emissions from the combustion of fossil fuels include nitrogen dioxides (NO2), sulfur dioxide (SO2), particulate matter (PM), carbon monoxide (CO), and greenhouse gases (e.g. carbon dioxide (CO2)). The air emissions released during the construction and operation phases are quantified from baseline and secondary data. The collection of air sampling data at or near the Project site will illustrate the ambient conditions. This data will be used, in part, to allow for the modeling and determination of total impacts once the plant is operational (i.e. baseline concentrations to which modeled impacts from the Project will be added). Total impact levels were then compared to local and international standards and thresholds. The classifications for the waste streams from air emissions are listed below:
• Stationary point source emissions; • Area and fugitive source emissions; and • Mobile source emissions.
6.1.2 Emission Sources during Construction Stage Major sources of air emissions during the construction phase will predominantly come from construction equipment and vehicles. Pollutants released include SO2, NO2, CO, VOC, and PM from diesel engines used in construction machinery and delivery vehicles. CO and VOC emissions result from the incomplete combustion of fossil fuel. A common source of CO is from mobile sources (e.g. cars, trucks, motorbikes, etc.). The gas is tasteless and odorless, and may be harmful to human health at high concentrations. PM can result from the ash content in the fuel, as well as particulates (soot, sulfates, etc.) formed during combustion.

Central Java CFPP Project
February 2018 Summary of Environmental and Social Impact Assessment Page 44 of 65
During construction activities, dust will be generated on-site. Dust emitting activities potentially include:
• Delivery and on-site transport of construction material and equipment using vehicles and trucks over dirt roads;
• Earthmoving operations on the Project site (filling, excavation and removal of surface materials); and
• Wind erosion / dust suspension from land excavation and stockpiling.
The fumes generated from various construction activities and the air pollutants released during the construction phase from mobile sources used for transportation of workers and materials may impact local communities.
Air quality impacts during the construction phase will be limited to the nearby environment and will be limited to a 1 to 2 year duration (based on the nature of the Project construction activities).
6.1.3 Construction Mitigation Efforts The dust will be lower due to the following improvements of the roads.
• Material transport and stockpiling of material shall be mainly carried by boat avoiding the roads for heavy traffic and pollutants;
• Generation of dust emissions will be mitigated during construction with water sprays during dry weather conditions;
• Improvements on roads will be made. Roads will be paved or repaved and expanded to avoid excess dust and daily traffic congestion;
• Access to site shall be from the west access road and from the coastal access road and they will meet at one access point (construction access road);
• Vehicles engines shall be in a good state of maintenance; • Periodic checks of earth-moving equipment to ensure they are operating in good working
order; • Periodic housekeeping of working areas to prevent dust accumulation; and • On-site vehicle speeds on unhardened roads and surfaces will be limited.
6.1.4 Emission Sources during Operational Stage During the operation phase, pollutants associated with the combustion of solid fossil fuel in the boilers will be emitted. An additional, but much smaller, source of emissions will be NO2 and ammonia from a small ammonia stripping system. While other emission non-point sources (e.g. mobile sources and fugitive dust from material handling) will be less significant when compared to stationary point sources, especially the boilers.
6.1.5 Operating Emissions Mitigation Efforts
Air Dispersion Modeling of Operational Impacts 6.1.5.1In addition to complying with stack emission standards, the Project will need to demonstrate that ambient air quality impacts in the vicinity of the plant are acceptable. Such impacts are not only

Central Java CFPP Project
February 2018 Summary of Environmental and Social Impact Assessment Page 45 of 65
a function of the concentrations of pollutants at the stack exit point, but also a function of dispersion characteristics and local meteorology. Dispersion characteristics include stack height, plume exit velocity and temperature (which provide buoyancy and momentum lift to the plume). Meteorology will transport the plume (depending on wind direction) and provide dilution (depending on wind speed and atmospheric stability). These additional considerations will often dictate stack emission concentrations less than local (Indonesian) and International (World Bank) standards if there are issues with ambient air quality impacts.
Air Dispersion Modeling for the Coal-Fired Boilers 6.1.5.2Quantitative techniques are used to assess the impacts of air emissions during the operation phase, for which Gaussian dispersion, regulatory approved computer simulation models are used.
The Air Modeling was performed using the following key inputs:
1. Stack emission characteristics, including stack height, stack diameter, plume exit velocity and temperature, and pollutant emission rates are entered for base and part-load operations. Other key input parameters include stack building profiles (height, length and width) to determine if the plume will escape building-induced “downwash”, where the plume can be caught in the downwind turbulent wake and prematurely impacted to the ground (thus increasing impacts as dilution with distance did not have a chance to occur).
2. Meteorological input including a (typical) 5-year record of surface and upper-air meteorological data from a recording station considered representative of the Project site (i.e. location along a coastal boundary with higher, mountainous terrain to the south).
3. Terrain input including the development of a receptor grid extending from the plant boundaries, out to and beyond, the area of predicted maximum impacts.
With these inputs, the model takes the emissions from the stack (using the stack characteristics noted in item #1 above, transports and dilutes the plume based on the meteorological parameters noted in item #2 above and impacts the plume onto the terrain features noted in item #3 above. The ambient air quality is then simulated at various locations and impacts are then compared to local relevant standards.
The IFC General EHS Guidelines advise that ‘relevant standards’ with respect to ambient air quality are national legislated standards or, in their absence, the current World Health Organization (WHO) Air Quality Guidelines or other internationally recognized sources. Where a host country’s legislated standards are less stringent than either the WHO or other internationally recognized sources, the IFC acknowledges that it is acceptable to use the national legislated standards as the principal standards that the Project is assessed against.
The Assessment process, in any case, addresses compliance with the relevant host country laws, regulations and permits that pertain to the social and environmental matters.
• Government Decree of the Republic of Indonesia No. 41 (1999) and • Central Java Governor Decree No. 8 (2001) - Ambient Air Quality Standards in Central
Java Province. • Regulation Of State Minister Of Environmental Affair No. 21 year 2008 Regarding
Immobile-Sourced Emission Standard Of Quality For Thermal Electric Power Generator Businesses and/or Activities.

Central Java CFPP Project
February 2018 Summary of Environmental and Social Impact Assessment Page 46 of 65
Although Decree no.41 (1999) sets national ambient air quality standards, it also allows more stringent standards to be set at a provincial level, as per Decree no.8 (2001) which is applicable to Central Java.
In summary, the ADMS modelling determined the necessary stack height determined that the Project could proceed as contracted.
6.2 Water Discharge There will be impacts on surface and groundwater quality during the construction and operational stages. Water quality during the construction stage may be affected by sedimentation due to dredging and dumping as well as wastewater run-off from construction site activities (clearing, grubbing, grading, trenching, foundation excavation and soil stockpiling). Water quality during the operational phase may be affected by the effluents from the proposed power plant such as thermal discharge and wastewater effluents.
6.2.1 Construction Stage Construction of the power plant facility will require extensive dredging within the sea to build the jetty, inlet pipe and outlet pipe; these activities are predicted to have an impact on water quality. The construction will not affect the surface water quality surrounding the power plant site, but will inherently affect the surrounding aquatic biota. The below table describes the impacts and the mitigation measures that will be employed.
Table 6-1: Water, Potential Construction Impacts and Mitigation Measures
Construction Stage
Impacts
Description of Impact Mitigation Measures
Land Preparation on Coastal Estuaries
The construction may cause turbidity in the water, especially during rainy season due to site runoff. These impacts are considered temporary
Water quality monitoring (manual sampling) will be conducted through the duration of the construction period to observe the water quality and mitigate any exceedances, according to relevant Indonesian standards. Water will be routed to a seawater discharge line and shall meet the limits prior to discharge.
Run-off Water The construction of the CFPP will create impermeable surface areas on large parts of the Project site. Run-off flows into the surrounding area of the Project site will increase.
Minimize water run-off by increasing capture and retention. time. Storm water from fuel oil tank dikes and transformer areas shall be treated in an oil separator, transferred to the plant retention basin and then directed to the Wastewater Treatment Plant for treatment and discharge. (Uncontaminated storm water from outside the power plant will be collected in storm water discharge channel located on the south side of the plant and discharged to the sea.)
Dredging and Dumping Impacts on Seawater
Dredging activities for the proposed site intake pipe, outlet pipe, and the jetty are expected to cause turbidity in the seawater.
The mitigation measures will be in accordance with the State Minister of the Environment Decree No. 51 of 2004 regarding Seawater Quality Standards. This will set the limits that construction activities have on the aquatic biota in the area.

Central Java CFPP Project
February 2018 Summary of Environmental and Social Impact Assessment Page 47 of 65
Construction Stage
Impacts
Description of Impact Mitigation Measures
Additional mitigation measures include:
• Use of dredging equipment compatible with the specific water and seabed conditions.
• The specific dredging method will be decided based on the dredged materials.
6.2.2 Operational Stage The cooling system for this proposed power plant will involve a once-through cooling system that requires large quantities of seawater which is then discharged back into the ocean.
Wastewater effluent streams in a thermal power plant include solid waste disposal area runoff, coal storage yard runoff, floor and yard drains, laboratory wastes, etc. Wastewater treatment systems will be used to mitigate any significant wastewater emitted from the plant.
The below table describes the impacts and the mitigation measures that will be employed. Table 6-2: Water, Potential Operation Impacts and Mitigation Measures
Operation Stage
Impact
Description of Impact Mitigation Measures
Wastewater Wastewater effluent streams will include solid waste disposal area runoff, coal storage yard runoff, floor and yard drains, laboratory wastes, etc.
Wastewater will be treated in three wastewater treatment plants; one plant will be used for process wastewater, the second for runoff water from the solid waste disposal area, and the third for runoff water from the coal storage yard before discharge. Manual sampling shall be used to demonstrate compliance with limits. In addition, pH, COD (inferred via ORP analyzer), and Turbidity will be continuously monitored. .
Thermal Discharge from Plant Operation
The heated seawater is discharged back to the ocean. The plant will be designed for use of intake seawater with a maximum temperature of 32°C. Indonesian regulations prohibit dicharge water that is greater than 40°C.
A 3-dimensional thermal dispersion analysis model, CORMIX, was used to assess thermal impacts and re-circulation potential. As a result of this modeling, the discharge pipe has been designed with a diffuser system to optimize mixing with resultant minimal increases to seawater temperature. Based on modeling results, this separation is sufficient to avoid recirculation.
Coal Storage and Solid waste storage on Groundwater Quality
Coal storage yard may have an effect on the groundwater quality because the leachate may impact the water.
Potentially contaminated rainwater runoff from the coal storage yard and solid waste disposal areas will be collected in lined ponds near each area, treated and then re-used for dust suppression as much as possible.

Central Java CFPP Project
February 2018 Summary of Environmental and Social Impact Assessment Page 48 of 65
Operation Stage
Impact
Description of Impact Mitigation Measures
Ash Leachate Ash leachate, if not contained can cause pollution of soil and groundwater.
The solid waste disposal pit will be equipped with a leachate collection. Groundwater monitoring wells will detect leakage in the event of a breach of the liner systems.
6.3 Noise Emissions The Project will have a number of noise sources which will potentially have adverse impacts on the workplace and ambient noise level. The following measures will be taken to mitigate the noise emission.
Table 6-3: Noise, Potential Impacts and Mitigation Measures
Impact Description of Impact Mitigation Measures
Noise Emissions
(During Construction)
The major noise sources during the construction phase are vehicular traffic and construction equipment.
To minimize the impacts on the nearby communities, construction schedules have been optimized and vehicular traffic will be routed away from the most densely populated areas.
The jetty will be used to transport most of the heavy equipment. This will leave noise from vehicles used to transport equipment along local roads at a minimum.
Noise Emissions
(During Operation)
During operation, the project will generate noise emissions primarily due to the operation of equipment.
Modeling was done to accommodate changes to the plant layout and surrounding areas, revisions to plant equipment/components, and updates to individual equipment noise data. Noise insulating panels were added to the coal crusher house from the original design to reduce operational noise emissions. The Plant’s noise emission contributions at sampling points U1 and U2 to be 52.3 dB(A) and 45.4 dB(A), respectively. Both of these limits meet the Indonesian noise limit and the IFC daytime limit. Nighttime noise from the plant is within the baseline + 3dB (A) requirements specified in IFC guidelines.
To mitigate the effect of noise levels in the Plant, workers shall not be exposed to more than 8 hours to Exceptional Equipment that generates noise and will be provided with appropriate Personal Protective Equipment.

Central Java CFPP Project
February 2018 Summary of Environmental and Social Impact Assessment Page 49 of 65
Figure 6-1: Noise Modeling Results
6.4 Solid Waste The solid waste generated by the CFPP is typically ash that is disposed in a solid waste disposal area. The storage site lies on the southwest section of the Central Java site. The following measures will be taken to mitigate the impact.
Table 6-4: Solid Waste, Potential Impacts and Mitigation Measures
Impact Description of Impact Mitigation Measures
Solid Waste The CFPP produces solid waste in the form of coal ash.
The soid waste disposal area will use a liner in accordance with regulatory requirements. The ash is leveled and compacted.
Air Quality Handling of ash will cause air quality degradation. This may occur during the fly ash and bottom ash transportation to the solid waste disposal area.
The ash will be wetted prior to transport to avoid the dispersion of ash into the ambient air while in transportation to the solid waste disposal area.

Central Java CFPP Project
February 2018 Summary of Environmental and Social Impact Assessment Page 50 of 65
Impact Description of Impact Mitigation Measures
Public Perception
on Ash Disposal
The solid waste generated by the CFPP is typically ash that is disposed in the solid waste disposal area.
Local cement companies have submitted written expression of interest in receiving the ash. Proper disclosure regarding this reusability of the ash would explain to the public that the ash produced by the plant will be used to help future developments in Indonesia.
6.5 Terrestrial Flora and Fauna Impacts Terrestrial flora and fauna will be predominantly affected by the construction phase of the Project. International best practice (IFC Performance Standard 6) requires that the biodiversity issues are recognized and mitigated to ensure that there are no net losses of any flora and fauna species.
Temporary effects associated with site formation works like dust and noise are not considered to be significant due to the fact that no breeding or nesting species were determined to be nesting near the Project site. Therefore, the effects are limited to the loss of moving or feeding areas. No endemic species were found on the Project study area.
After the construction period, the areas on site which are not covered by power plant structures shall be enhanced to provide suitable habitats for protected and “Near Threatened” species.
The Project site and its surroundings are already used for agricultural purposes and are considered modified habitats. The proposed power plant project is not anticipated to cause long term adverse impacts to terrestrial flora and fauna.
6.5.1 Mitigation Measures
Land Clearing and Construction Phase 6.5.1.1When clearing the Project site for land preparation, the following measures have been followed to protect the environment:
a. Being sensitive in clearing habitats during nesting and mating seasons.. b. Efficiently minimize the size of the Project site and preserve the green area. c. Selecting the use of machinery during vegetation clearing activities. d. Consulting the community about the harvest before clearing any vegetation. e. Following conservation procedures from Regulation No. 5 of 1990 as well as
Government Regulation No. 7 of 2009.
During the construction phase, the Project will consider the following:
1. For construction at the power plant site: a. Locating all facilities, equipment, and materials of the power block in a single site to
minimize the “footprint” of the Plant. b. Assessing the terms of treatment and disposal options for drill cuttings and muds.
Reusing cuttings and muds elsewhere (i.e. for mangrove restoration sites). 2. Transmission line ROW development:

Central Java CFPP Project
February 2018 Summary of Environmental and Social Impact Assessment Page 51 of 65
a. Minimizing the width of ROW corridors during construction and operation, and planning for closure of ROW to the greatest extent possible after completion.
b. Allowing trees and shrubs to re-establish through minimized cutting and clearing. Selective removal of trees and shrubs will be practiced.
c. Clearing activities will be sensitive to wildlife migration periods. 3. Additional mitigation measures for offshore activities;
a. Conducting assessments of potential impacts of dredge spoils placement: evaluating alternatives like using the dredge spoils for mangrove restoration in regions of Java that have had erosion problems.
b. Consulting with local communities and organizations about viable options. c. Conducting a marine biota sampling on the Project site with the biota being evaluated.
Operational Phase 6.5.1.2During operation, the Project will consider the following:
1. Enhancement of the surrounding habitats that will not be restored. 2. Restoration of the construction laydown area to its pre-project state once construction is
finished.
Secondary impacts were also a consideration during the evaluation of flora and fauna including the introduction of non-native species. The following measures will be followed:
• Prohibiting the workforce from introducing pets, livestock, and other animals to the area. • Cleaning vehicles and machinery that have been used outside of the project site prior to
the commencement of work because they may carry exotic seeds and animals. • Developing a quarantine system, when necessary, that inspects and cleans all incoming
supplies prior to their use.
Conservation Awareness Program for Workers 6.5.1.3To protect the habitat of animals and biodiversity around the CFPP project during the construction and operation phases, the workers will be provided instructions related to the treatment of animals around the project area.
6.5.2 Marine Biota Impacts The Project site is located near an important coastal conservation area. The coral reefs in the coastal conservation areas near the Project are protected under the Indonesian government under the Regulation of Bupati (Regent) Batang No. 18 of 2012. The identification of coral reefs and its condition is an important aspect to analyze when establishing relevant mechanisms for external review of the project’s risks and impacts identification process and the proposed mitigation strategy.
The study results indicate that no marine biota species or fish are categorized as endangered, endemic, nor governed under the relevant laws. However, this section focuses on addressing the impacts and mitigation measures on the protected habitats (specifically the Marine Conservation Area) that resides near the power plant.

Central Java CFPP Project
February 2018 Summary of Environmental and Social Impact Assessment Page 52 of 65
The Marine Conservation Area 6.5.2.1The marine conservation area is an important aspect to consider when evaluating the coastal estuaries surrounding the Project site. The Project emphasizes the importance of preserving and avoiding the protected areas under the Marine Conservation Regulation. The Project has been designed to avoid the conservation area under Decree of Minister of Maritime Affairs and Fisheries Number Kep.29/MEN/2012 concerning the determination of the Conservation Areas of Coastal and Inlets in Ujungnegoro-Roban in Central Java Province.
Construction Phase 6.5.2.2The impacts associated with the construction phase will impact the surrounding marine biota. Temporary impacts associated with site formation works like turbidity and sedimentation are considered to be significant. These impacts may cause permanent harm to the existing ecosystems unless properly mitigated. The risks, impacts, and mitigation measures are described below:
Table 6-5: Marine Biota, Potential Construction Impacts and Mitigation Measures
Construction Stage Impacts
Description of Impact Mitigation Measures
Disturbance to Oceanic Biota
Derivative impacts on seawater quality degradation.
Water quality will be monitored regularly during the construction process. The water quality will be in accordance with process wastewater treatment standards from relevant wastewater standards and monitored.
Disturbances from Dredging
Dredging the jetty, the intake pipe, and the discharge pipe may cause higher turbidity and disruptions to the biota including plankton, benthos, and fish (none recognized as endangered or protected)
Impacts associated with sedimentation due to dredging and dumping have been analyzed and have been determined that with proper mitigation measures, significant damage to the coral will be avoided. The dredging and dumping process will be localized so that suspended particles will not cause sedimentation, which will disturb aquatic biota. Dredging methods will be decided based on the dredged materials. The Jetty will be designed to avoid major sedimentation on the coral reefs and associated marine life. Sedimentation modeling was done in order to assess any related risks and impacts associated with dredging.
Disturbances from Dumping
Disruption to the marine biota is derived from reduced marine water quality as a result of dumping 1,526,000 m3 of dredged materials into the dumping region that is approximately 16 km from the shore. The fish found surrounding the protected reefs were not recognized as endangered or protected.
The materials being dredged will be sampled and tested prior to dumping to avoid distribution of toxic or hazardous materials into the sea. The dumping process has been modeled to indicate whether any adverse impacts will affect the coral that is located 15 km away. The modeling results indicate that the Bapang Coral Reef will not be affected by the dumping of these materials. A marine biota study was done at the dumping location to assess the current marine biota in and around the proposed dumping site. It was decided to locate the dumping area 16 km off shore in order to avoid affecting any legally protected habitats (e.g. coral reefs, coastal estuaries, etc.). The coral reef studied is located 15 km away from the proposed dumping site and was determined to be far enough to avoid adverse impacts.

Central Java CFPP Project
February 2018 Summary of Environmental and Social Impact Assessment Page 53 of 65
Construction Stage Impacts
Description of Impact Mitigation Measures
Fisherman Activity and Marine Safety
Fishermen activity will be affected from the dredging and dumping because dredging activities from the intake pipe, outlet pipe, and jetty are expected to have an impact on fishing activities and production. Similar effects can be expected at the sedimentation dump site.
The following measures will be taken. Enhance public awareness of dredging plans among the local fishermen and the other sea users. Placing work warning buoys, which are red-white-red balls for daylight and red-white-red lamps at night. The definitions and meanings of these will also be publicized among sea users. The dredging works will be minimized during high fishing season (January-March). The dredging plan and the possibility of turbidity spreading will be publicized so that fishermen properly informed when making their catching plans.
Operational Phase 6.5.2.3During the operational phase, thermal impacts and wastewater run-off will be the predominant impacts on the marine biota. The risks, impacts, and mitigation measures are described below:
Table 6-6: Marine Biota, Potential Construction Impacts and Mitigation Measures
Operational Phase Impacts
Description of Impact Mitigation Measures
Disturbance to Oceanic Biota
Disturbances to the oceanic biota reflect derivative impacts on seawater quality degradation through thermal discharges and wastewater effluents.
The impacts associated with the water quality will be monitored regularly during the operation process. Any major pollutant issues found will be mitigated diligently. Offshore fishing and marine product (corals) collection will be monitored by Controlling workforce activities (e.g. fishing, coral collection, interaction with local populations); Reporting any unplanned interactions with other resource users or marine life to the authorities; Prohibit the workforce from fishing, coral collection, and hunting sensitive species.

Central Java CFPP Project
February 2018 Summary of Environmental and Social Impact Assessment Page 54 of 65
Operational Phase Impacts
Description of Impact Mitigation Measures
Thermal Impacts on the Coral Reef Ecosystem
Temperatures affecting the coral ecosystem cannot exceed a 2°C temperature change according to the Decree No. 51/2004 for Marine Water Quality Standards. This could potentially lead to significant impacts.
The ecosystem of Maeso Coral exposes the following weaknesses: it is close to mainland and estuaries (of Sambong River and Sono River) so that the threat of sediment is more serious. However, its proximity to the mainland eases the monitoring.
A priority for the project is to avoid disturbing the Coral Reefs wherever economically and physically feasible. These associated thermal impacts have been modeled and have been determined, that with proper mitigation measures, the coral will be avoided.
The following mitigation measures for Maeso Coral, a “Core Zone”, will be met. Sedimentation runoff from Sambong River and Sono River will be assessed by measuring the water according to Quality Standards stipulated under Decree of Minister of the Environment No. 51 of 2004 to confirm that the project is not worsening sedimentation effects. Fisheries will be controlled. Education will be provided to the local fisherman regarding the conservation areas and these areas will be monitored in order to prohibit fishing within the conservation area. The coral is currently weakening. A focus will be on enhancing and promoting the restocking and stock enhancement or fisheries refuges. The major threat of sedimentation and fish net/fishing tools should be addressed by artificial coral reefs as protection. As the making, planting, and maintenance of coral reefs represents a significant cost, a consortium comprised of private parties and the government should be notified to bear the cost.
Hazardous Materials from Jetty Use
Disturbance in the oceanic biota from seawater quality degradation are due to jetty activities like loading and unloading of coal materials and ship transportation. This is considered a potential significant impact.
Activities associated with unloading coal are mitigated with the following measures:
• Housekeeping crews will maintain the jetty deck clear of coal debris.
• Measures will be applied to prevent coal from the unloader’s bucket from falling between the jetty and the barge.
• Unloading operations will be suspended at times of high winds.
• Additional measures discussed above regarding water emissions will apply here.
6.6 Protected Species and IUCN Red List Species The Central Java region is home to thousands of birds with 70 recorded species during the faunal study. There were two (2) types of birds that are identified as “near threatened” under the IUCN Red list and fourteen (14) “protected species” identified on a list under Indonesian National law PP No. 7, 1999. The IUCN Red List is referenced under Performance Standard 6: Biodiversity Conservation and Sustainable Management of Living Natural Resources. Central Java site is considered a modified habitat.
In the region there were no recognized threatened or critically endangered bird species. The mangroves along the shore line however, provide a habitat for various wild animals, such as the little ringed plover (Charadrius dubius), common sandpiper (Tringa hypoleucos), Javan pond

Central Java CFPP Project
February 2018 Summary of Environmental and Social Impact Assessment Page 55 of 65
heron (Ardeola speciosa), and striated heron (Butorides striatus) that use the muddy coastal area to find food. The other four species, namely the golden-bellied gerygone (Gerygone sulphurea), yellow-bellied prinia (Prinia flaviventris), pied fantail (Rhipidura javanica) and spotted dove (Streptopelia chinensis) were identified searching the bushes and mangroves for insects and fruits for their food.
The five mammals that were found on the site are also listed under the IUCN Red List as “least concern”. However, the banded linsang and the three-striped ground squirrel are also listed under Indonesian National Law PP No. 7, 1999 as protected fauna.
Since two “near threatened” species were identified under the IUCN Red list and several species of birds and mammals were identified under Indonesian Law, local experts were asked to evaluate and assess the area. Based on the recommendation from these experts, the area is not considered severe because no endangered species were found on the site and the site has already been heavily modified by agricultural activities. As such, the Project is not altering the area’s original natural purpose. The habitats required by the “near threatened” species can be found in the surrounding coastal area and the conservation area located adjacent to the Project.
6.7 Labor and Influx Management During the peak time of construction of the project, it is estimated that about 10,400 personnel will be recruited. This will include 5,900 skilled workers, 2,700 unskilled workers and 1,400 site management and support personnel. This number will be reduced substantially after construction of the project is completed. Most of the construction workers will be hired by the Contractor and BPI may not have control over them. It will also be difficult to avoid influx of job seekers and migrants however, An Influx Management Plan will be implemented to minimize the impacts of influx of people and BPI will strive to keep it under control and would try to minimize the negative impacts of this influx by facilitating preference for the job and business opportunities to the local community.
Central Java CFPP Project
February 2018 Summary of Environmental and Social Impact Assessment Page 56 of 65
7. LAND ACQUISITION, PUBLIC CONSULTATION AND DISCLOSURE
Land acquisition is required for all components of the project except for the existing sections of the access roads. Easement agreements are required for the ROW of the transmission line. Power Plant
Approximately 226 hectares (ha) of land is required for the power plant and its associated facilities. The approximate areas required for various subcomponents are as follows:
• Power Block 10.2 ha • Balance of Plant 28.2 ha • Switchyard 1.2 ha • Jetty and Coal Storage 16.8 ha • Solid Waste Disposal 40.4 ha • Supporting Facilities 2.3 ha • Storm Water Discharge 22.8 ha
The balance of the area is used/reserved for cut and fill of the hill for site preparation, laydown area for the current project; future development of a third unit; and storage and laydown of equipment for the future construction project.
7.1 500 kV Switching Station The switching station will require about 19 hectares of land.
7.2 Transmission Line The 500 kV high voltage transmission line from the project site to the switching station is about 4 km in length. It is a double circuit line and includes 8 transmission towers outside the plant site boundary and 3 towers inside the plant site. PLN’s existing 500 kV line is located about 1 km from the switching station. Transmission lines in this area will require 14 transmission towers. The total area covered by the transmission lines will be about 76 ha.
Since the land covered by the transmission lines will be mainly required for the ROW, no land acquisition will be necessary, except for construction of tower foundations. Only buildings, structures, and tall trees inside the ROW may have to be removed. This land could still be used for agricultural purposes by the landowner.
Required Land for Transmission Line will be as follows. • Transmission Tower: 20 ha (Land acquisition necessary) • ROW: 56 ha • Total: 76 ha
7.3 Efforts Made for Minimizing Displacement Minimizing the land acquisition and disturbance to the existing features has been a primary objective of project design. Socially sensitive areas have been avoided by routing around existing

Central Java CFPP Project
February 2018 Summary of Environmental and Social Impact Assessment Page 57 of 65
settlements. Minimization of impacts within the limitation of technical requirements and cost effectiveness is emphasized during the design stages.
The power plant site does not include or encroach upon any existing settlements. A major part of the hilly area on the west side, adjacent to the Project site of the sacred tomb of Syekh Maulana Maghribi and Aswatama Cave and Gangsiran Surotomo Cave, has been left as is except for the minor area on the east side of the hill.
The location of the new substation is away from the settlements. The Project site area selected for the substation consists of fields, cocoa plantations, forests, etc. The transmission lines from the power plant site to the substation are routed around the settlements in its path. Only a small amount of the PAP land is permanently used for the transmission line towers. Land acquisition will be required for the construction of the tower foundations. The existing east access road has been selected as the access road to the substation and transmission line area. The land acquired for this road will be used for widening the road to use during the construction of the substation and transmission line.
The Coastal Road and west access road will be used for land transportation to access the Power Station during the construction period. The Coastal Road is located near Depok and Ujungnegoro. The west access road is located off of the north coastal highway near Bakalan and has access to the project site. The two roads meet at an intersection for the construction access road. This road will be the single access point to the power block site. The access point road will be 7 m wide and 500m long.
The Batang Regency conducted a separate study from this Project to identify and mitigate the associated risks and impacts. Some sections of the existing west and east access road to the project site are narrow. Minor land acquisition is required for widening it in these areas will have negligible impact on the adjoining settlements. This road will not be used extensively since the Coastal Road will be the main road for transport of equipment, construction materials and workers during construction.
7.4 Landscape and Visual Impacts The landscape around the power plant project is hilly on the west side and flat on the east and south side. The hill on the west side is adjacent to the sacred tomb and is about 30 meters high. Ujungnegoro beach and resort area is located at the bottom of the hill (hilly area) along the coast just west of the Syekh Maulana Maghribi tomb site (sacred tomb). The pilgrims and tourists generally visit both the tomb and the beach resort area. The religious tomb site and the Ujungnegoro beach and resort area are accessible from the national highway via a northbound existing road and this road will also be used as an access road to the Project site which will cause some additional traffic on this road during construction and operation phases of the Project.
BPI will also be sensitive to the needs of the visitors to the beach and will cooperate with the beach and resort area administrators and villagers to alleviate traffic problems during the holidays.

Central Java CFPP Project
February 2018 Summary of Environmental and Social Impact Assessment Page 58 of 65
Figure 7-1: The Proposed Site showing Power Plant Site, Hilly Area, Sacred Tomb and Resort Area (from East to
West)
The view from the resort is shown in Figure 7-2 below. However, this figure is a worst case and will likely be covered by surrounding trees limiting the visual impacts to the stack and the top of the building.
Figure 7-2: The View Anticipated from the Resort to the West of the Proposed Site

Central Java CFPP Project
February 2018 Summary of Environmental and Social Impact Assessment Page 59 of 65
The following shows the landscaping plan for the project site.
Figure 7-3: Landscaping Plan

Central Java CFPP Project
February 2018 Summary of Environmental and Social Impact Assessment Page 60 of 65
8. PUBLIC CONSULTATION AND DISCLOSURE
8.1 Objectives The objective of the public consultation is to spread awareness regarding the project. The aim of consultation is to ensure that stakeholder interests are identified during the ESIA study and that the stakeholder views are taken into consideration at the project planning stage.
8.2 The Process The project’s Corporate Social Responsibility team has conducted intensive awareness campaigns among Project-Affected People (PAPs) to provide information about planned project activities, possible impacts, and compensation and relocation options. Awareness and consultation has been conducted through open discussions, focus group discussions, dialogue or other ways appropriate to local conditions.
8.3 Information, Awareness and Consultation Public hearings were organized at each of the ten affected villages. The general consensus on construction of the power plant is that most of the villages are in favor of it. BPI will conduct more hearings in these villages to provide additional information and to clarify any misunderstandings. Public hearing meetings were also organized for the sub districts of Kandeman and Tulis, which were also attended by the community in the villages not directly affected by the project.
8.3.1 Stakeholder Identification and Group Consultation The stakeholders usually play an important role to succeed such program, and therefore, they will also be informed and encouraged to express their concerns. The project will conduct this activity with assistance of their consultants and contractors. The stakeholders involved in consultation other than the PAPs are:
• Agricultural Agency; • Forestry Agency; • District and Sub District Officers; • Village Officers; • Local Informal Leaders; • Local Woman Groups; and • Local Non-Government Organizations.
Consultation with the PAPs and other stakeholders include:
• Obtaining information on the price of land as desired by the PAPs; • Negotiating with the PAPs to determine the amount of compensation; • Discussing the timing and mechanism of compensation payment; • Guiding and giving economic development assistance to PAPs; • Providing livelihood restoration assistance to economically displaced PAPs in terms of
cash, credit facilities, training, employment opportunities, etc.; and

Central Java CFPP Project
February 2018 Summary of Environmental and Social Impact Assessment Page 61 of 65
• Providing transitional support, as required, based on a reasonable estimate of time required to restore their income earning capacity, production levels, and standard of living.
8.3.2 Official Website BPI established its official website address, www.bhimasenapower.co.id. This website has two languages, Bahasa and English, to accommodate local and international stakeholders.
Figure 8-1: Homepage of BPI official website
8.3.3 Grievance Mechanism A grievance is an actual or perceived issue that might give grounds for a complaint. There are two main ways to collect the grievances: complaint boxes and verbal grievance forms. Written grievance can be submitted to complaint boxes, which have been installed in strategic locations (such as village halls). Verbal complaints can be collected by BPI staff interactions with the community.
8.3.4 Contact Details for the Public At a company level, the responsibility for coordinating the external communication for management and implementation of the stakeholder engagement process rests with General Manager of External Relation, reporting directly to management.
General Manager of External Relation Phone: 0285-4411377 Fax: 0285-4416250, 0285-392144 Email: [email protected]

Central Java CFPP Project
February 2018 Summary of Environmental and Social Impact Assessment Page 62 of 65
9. CLIMATE IMPACT ASSESSMENT – GREENHOUSE GASES A greenhouse gas (GHG) is a gas that contributes to the greenhouse effect (global warming / climate change) by absorbing infrared radiation. The effects of climate change are global. CO2, along with other GHGs, is emitted worldwide from a vast number of sources including power plants, vehicles, and livestock.
To assess the climate impact from CO2, CH4, and N2O emissions from the Project, a calculation method derived from EPA, as specified in 40 CFR Subpart 98 for coal combustion power generation, is estimated below. The following calculation methods will be used together with estimated annual coal consumption and coal composition to estimate the total GHG emissions (N2O and CH4 emissions are expressed as equivalent CO2 or CO2e). The total equivalent CO2 from the project is made of Greenhouse gas emissions from the stack and greenhouse gas emissions from coal transportation. The total equivalent CO2 from the Power plant stack is estimated to be 12,676,000 Metric Tonnes per year from the Power Plant Stack and 205,700 from Coal Transportation.
Contributions from the Central Java Project will be minimalized due to the use of an “Ultra Supercritical Plant” (USC) steam cycle to minimize fuel consumption. Ultra-Supercritical steam cycle technologies perform with better thermal efficiency, which allows them to burn about 7% less fuel than a Sub-Critical Plant. As a result, the GHG emission rate will be lower by approximately 900,000 tonnes/year due to the lower fuel consumption of the USC cycle. Other air emissions are reduced as well due to the lower fuel combustion.

Central Java CFPP Project
February 2018 Summary of Environmental and Social Impact Assessment Page 63 of 65
10. ENVIRONMENTAL MANAGEMENT AND MONITORING PLAN There will be detailed Environmental and Social Management and Monitoring Plans provided separately from this ESIA and it will be part of the Environmental and Social Management System (ESMS). The ESMS will encompass all project-specific management plans, monitoring plans, procedures, etc. used to manage and mitigate the risks and impacts identified by the ESIA process. It will be provided separately because it will be developed, modified and updated throughout all phases of the Project in order to provide up to date management procedures and to adapt to any unidentified impacts, risks and organizational changes the project faces along the way.
Principally, the Environmental and Social Monitoring Plan is viewed as:
• A guideline and basis for environmental and social monitoring carried out by the Central Java CFPP project.
• A guideline for the Central Java CFPP project to implement monitoring plans in the Project vicinity during construction and operation.
• A source of information for the AMDAL committee and as a guideline in observation and guidance for the purpose of environmental and social sustainability in the area.
• A source of information for the local community to gain an understanding of the project activities from the Central Java CFPP project.
BPI prepared an HSE Policy which will be in accordance with all applicable environment, health, and safety laws and regulations and based on Indonesian Law Number 32 of 2009: the Protection and Management of the Environment, International Finance Corporation (a World Bank Group) Performance Standards 2012 and Good International Industry Practice and other relevant regulations concerning environmental management. The environmental policy will also consider community development in the area surrounding the project development activities. BPI is aware that the management of both the environmental and social communities must be sustainably integrated in all phases of the project.

Central Java CFPP Project
February 2018 Summary of Environmental and Social Impact Assessment Page 64 of 65
11. ANALYSIS OF ALTERNATIVES Indonesia is a country abundant in coal and in dire need for new electric power generation. The ever growing industrialization of the country has caused the generation capacity growth to lag behind the electricity demand growth, thus leading to power shortages and a low electrification ratio. The need for electric power generation is what prompted PLN to issue a Request for Proposals to Build, Own, Operate and Transfer to PLN a coal-fired power plant. The Central Java project was bid to PLN by BPI in response to this RFP. In this section, we address alternatives that might have been used to create the needed generation by looking at two aspects: where the project is sited and what technology it uses.
11.1 Site Alternatives Alternative sites were considered and thoroughly evaluated through three phases by BPI for the Central Java CFPP project. A total of 11 sites were considered by BPI. The Karanggeneng site was finally selected for the Central Java CFPP project.
11.2 Technology Options Although the use of wind, solar, or other renewable energies may be preferred from an environmental point of view, these technologies are incapable of alleviating the electricity shortage issues that Indonesia is facing due to their intermittent production and would require much larger land area requirements. Coal-fired generation is not the dirty technology it once used to be either.
Advances in plant efficiency and flue gas cleaning technologies have transformed coal-fired power plants into a cleaner technology. The ultra-supercritical steam conditions that this Plant is designed for provide much higher efficiencies than a subcritical coal-fired plant. Higher efficiencies mean lower coal consumption rates which in turn lowers emissions. New and improving technologies like fabric filters and flue gas desulfurization will also be implemented to allow the plant to lower emissions to levels much better than the applicable environmental standards and guidelines.
The construction of a coal-fired power plant in Indonesia also supports Indonesia’s mining industry. Indonesia is among the largest coal producers in the world today. All the coal that will be used at the Project site will come from national mines. Thus, the plant will not only provide electricity to a market in demand, but it will also support Indonesia’s coal mining and transportation industries.
The Project has designed a Plant with technologies including ultra-supercritical steam conditions and flue gas cleaning systems which will allow for safe, clean, and reliable power generation that is most suitable for Indonesia’s electricity demands.
11.3 The No Project Option A “no project option” is not a viable or an acceptable alternative to the proposed Central Java CFPP. The no action alternative would result in an increasing electricity supply deficit while the demand continues to increase. A lack of a reliable and secure electricity generation source would raise significant social, environmental and economic implications namely: the future of economic development and investment will diminish due to the lack of energy resources to meet

Central Java CFPP Project
February 2018 Summary of Environmental and Social Impact Assessment Page 65 of 65
industrial demands; socio-economic development would be restricted through a lack of electricity supply and shortages in supply for domestic users, the community and other public services and facilities.
The government of Indonesia continues to develop a diverse energy system. As described above PLN identified the need for this power plant. It will fulfill part of Java’s base load electric power requirements which is necessary to provide a solid infrastructure for further social advancement and economic development. The use of coal as a source of energy is appropriate for Indonesia.