environmental and social reporting after incidents web viewenvironmental and social reporting after...
TRANSCRIPT

Environmental and Social Reporting After IncidentsThe effect of the Deepwater Horizon oil spill
Andrew Maarschalkerweerd01-03-2012
Student nr: 315863amSupervisor: Dr. K.E.H. MaasErasmus University RotterdamErasmus School of EconomicsMaster Thesis Accounting, Auditing and Control

Acknowledgements
This Master thesis is the conclusion of the Master degree Accounting, Auditing and Control at Erasmus University Rotterdam. By means of this acknowledgements page I would like to thank those who assisted me either personally or academically.
I would like to thank both supervisors that assisted me in the writing process: From the Erasmus School of Economics, Dr. Karen Maas; From PwC, Maarten Hoornweg RA. Both supervisors gave me good feedback and ideas that I could use in my master thesis. I also would like to thank PwC Rotterdam for offering me a place to write my thesis and a chance to get an insight into what they do.
I also would like to thank Dr. C.D. Knoops, who supervised me in the first part of the writing process during the Seminar Advanced Financial Accounting. I also would like to thank my fellow students for giving feedback on my paper during this seminar.
I would like to thank my family and friends for supporting me during my studies.
A special thanks to Professor Colbert, one of my lecturers during my exchange at Trinity College Dublin, who inspired me to continue my studies in the field of accountancy.
Rotterdam, 01-03-2012Andrew Maarschalkerweerd
1
Executive Summary
In the last couple of decades there has been a large increase in the voluntary disclosure of environmental information by companies. In this thesis I specifically look at these disclosures surrounding incidents and how companies change their disclosures. The main question that is posed in this thesis is “What are the reasons for voluntary disclosure and how do companies respond to certain incidents?”. This main question is then split up into sub-questions and these are discussed in several chapters.
Firstly the theoretical fundament of this thesis is set out. Several frameworks used for voluntary disclosure are discussed. These help companies to disclose information in a structured manner. This helps several stakeholders by making the information more comparable. Also theories are discussed that can explain voluntary disclosures by companies, of which legitimacy theory and media agenda setting theory are the most important for the study conducted later.
Legitimacy theory predicts that companies, when they are threatened to breach their ‘social contract’ with society, will disclose more information. Patten (1992) takes this theory even further and tests whether companies in the same industry as a threatened company, will increase their disclosures. This is specifically done for companies in the oil sector after the Exxon Valdez oil spill relating to their environmental disclosures. He finds that companies, although unrelated in a business sense with Exxon, increase their disclosures. Also companies that are larger (measured in log revenues) show a larger increase in their scores than smaller companies. Companies that are partly responsible for the slow clean-up response also showed a larger increase in their scores.Media agenda setting theory predicts that media convey the concerns of the public but also influence the public opinion on certain topics, especially if they are far away from the public. Therefore managers are also influenced by topics that are discussed in the media.
I replicate Patten’s study by examining the disclosures of companies in the oil sector after the BP oil spill in the Gulf of Mexico, to see whether the relation still holds. I quantify the disclosures by means of an environmental disclosure index model as developed in Aerts and Cormier (2009) for the years 2009 and 2010 (before and after the incident). Firstly, I test the hypothesis that the disclosures significantly increase and secondly, whether there is a difference when companies are larger and whether there is a difference for US companies opposed to non-US companies.I find that companies still disclose significantly more after an incident, even if they are not responsible for the incident (the only relation being that they operate in the same environmental sensitive industry). When this information is split-up into economic (reactive, related to litigation) disclosures and social (soft claims) I find that both are significant.I cannot find any evidence that larger companies also show a larger increase in the scores of both years, as Patten found in his study. This might be explained by how companies deal with environmental disclosures today compared with the end of the 1980’s or beginning of the 1990’s.I cannot find any evidence that US companies increase their disclosure to a larger extent than non-US companies. A reason for this could be that all companies are large listed companies in the US and that their historic location has become irrelevant.
2
3

Table of Contents
Acknowledgements.................................................................................................................................1Executive Summary................................................................................................................................2Table of Contents....................................................................................................................................31. Introduction........................................................................................................................................5
1.1 Topic introduction..........................................................................................................................51.2 Topic and research question...........................................................................................................51.3 Structure..........................................................................................................................................6
2. Theories and methods behind this research.....................................................................................82.1 Introduction....................................................................................................................................82.2 Social and environmental disclosures.............................................................................................82.3 The Global Reporting Initiative....................................................................................................11
2.3.1 Reporting principles for defining content..............................................................................122.3.2 Reporting principles for defining quality..............................................................................122.3.3 Reporting guidance for boundary setting..............................................................................122.3.4 Standard disclosure................................................................................................................132.3.5 Oil & gas sector supplement..................................................................................................142.3.6 The future..............................................................................................................................14
2.4 Other standards.............................................................................................................................14
2.4.1 AccountAbility framework....................................................................................................142.4.2 ISO 14001..............................................................................................................................152.4.3 ISO 26000..............................................................................................................................15
2.5 Theories........................................................................................................................................15
2.5.1 Political economy theories.....................................................................................................152.5.2 Media agenda setting theory..................................................................................................172.5.3 Voluntary disclosure theory...................................................................................................17
2.6 Models..........................................................................................................................................18
2.6.1 Measuring the quality of voluntary disclosures.....................................................................182.6.2 Limitations.............................................................................................................................18
2.7 Research in relation to the theories...............................................................................................192.8 Conclusion....................................................................................................................................19
3. Literature review..............................................................................................................................213.1 Introduction..................................................................................................................................213.2 General literature..........................................................................................................................21
3.2.1 Capital market reactions........................................................................................................213.2.2 Characteristics of firms and countries...................................................................................223.2.3 Mandatory reporting..............................................................................................................233.2.4 Different disclosures..............................................................................................................23
3.3 Specific incidents..........................................................................................................................243.4 Environmental disclosure index models.......................................................................................27
3.4.1 Financial disclosures..............................................................................................................273.4.2 Environmental disclosures.....................................................................................................273.4.3 Additional factors: litigation and monetary and non-monetary information.........................30
4

3.4.4 Model for this study...............................................................................................................30
3.5 Conclusion....................................................................................................................................31
4. The BP oil spill..................................................................................................................................324.1 Introduction..................................................................................................................................324.2 An overview.................................................................................................................................324.3 Responsibility...............................................................................................................................344.4 Conclusion....................................................................................................................................34
5. Hypotheses development and research design...............................................................................365.1 Introduction..................................................................................................................................365.2 Hypotheses....................................................................................................................................365.3 Research and sample.....................................................................................................................375.4 Methodology.................................................................................................................................385.5 Conclusion....................................................................................................................................38
6. Results and analysis..........................................................................................................................396.1 Descriptive results........................................................................................................................396.2 Statistical results...........................................................................................................................43
7. Conclusion.........................................................................................................................................497.1 Summary and findings..................................................................................................................497.2 Limitations and suggestions for future research...........................................................................517.3 Generalisability.............................................................................................................................52
8. Bibliography......................................................................................................................................53Appendix 1.............................................................................................................................................56Appendix 2.............................................................................................................................................60Appendix 3.............................................................................................................................................61Appendix 4.............................................................................................................................................62Appendix 5.............................................................................................................................................63
5

1. Introduction
1.1 Topic introductionCompanies have been present for a very long time. A main facet is reporting on the company performance. Companies engage in this reporting to inform parties that have provided them the resources or chance to come to a certain performance. The focus of this reporting process used to be relatively limited: Most of the attention of the reporting process was on showing how well the company performed financially, while other (non-financial) factors were often omitted, although these factors are often very important to those affected. In the last decades a change has occurred in this reporting process. A change that has affected how companies and other entities report their performance to the people affected (also known as stakeholders). More and more, the focus of the reporting process has shifted away from only financial reporting to a broader form of reporting. This form of reporting would generally include how the company interacts with society as whole and other stakeholders instead of only internal stakeholders such as employees, lenders and shareholders. Issues such as the environment and the usage of labour in developing countries are topics that increasingly can be found in disclosures of companies.
The main article of reference within this thesis will be Patten (1992). Patten discusses the change in disclosures after an incident in the oil sector. It was found that companies increased their disclosures significantly after the Exxon Valdez oil spill. This did not only hold for Exxon, but for companies throughout the industry.Approximately twenty years later we will try to assess whether this relation still holds in a world where additional disclosure is becoming common. This will be done by replicating Patten’s study but with an updated model and a new incident: The BP oil spill in the Gulf of Mexico in 2010.
1.2 Topic and research questionThis thesis will look into the disclosures by companies and their place with respect to a broader set of stakeholders. Several theories that can explain why companies voluntarily disclose information are discussed. Companies are more and more making additional disclosures, although scholars still dispute why a company would do so. Next to that, I will investigate the current literature on how companies deal with their disclosures around incidents that might affect them. This thesis will be structured into several chapters and in these chapters, each (sub)-question will be answered. The main question is: What are the reasons for voluntary disclosure and how do companies respond to certain incidents?The sub questions to be answered in the separate sections are:
- What are the theories behind voluntary disclosure?- What does the literature say on voluntary disclosure and more specific in response to
incidents?- What went wrong at the time of the BP oil spill?- How is this research on environmental disclosure at the time of the BP oil spill
conducted?- Are there any changes in the environmental disclosures of oil companies since the BP oil
spill?
6
This thesis gives a clear insight to anyone who wants to investigate voluntary disclosure practice. Next to that, the field of accountancy can see it as an addition to the increasing literature on voluntary disclosure around incidents. In general voluntary disclosure has increased; therefore it might be relevant to see whether incidents still influence a company’s reporting behaviour.
1.3 StructureThe structure of this thesis is as follows: in the second chapter, theories and methods of assessing the voluntary disclosure process will be discussed.First a general assessment will be made of voluntary social and environmental disclosure. When did it start? This is further explained by means of a four step framework.Also the Global Reporting Initiative will be discussed. The GRI is one of the first real frameworks that gives guidance to entities on how to report on their non-financial performance. In this section the guidelines of the framework will be discussed. Next to the GRI, other frameworks are also reviewed
The first theories that will be discussed are: legitimacy theory, stakeholder theory and institutional theory: Every theory explains a different way in which companies respond to the stakeholders around them. These three theories are embedded into the so called ‘Political economy theory’ (Gray, Owen and Adams, 1996) that states that politics, economics and society cannot be seen separate from each other but have to be seen as overlapping concepts that will influence each other when one of the three factors is changed. Therefore they should not be seen as competing but as complementary explanations. Next to these theories (that all relate to the Political economy theory), the media agenda setting theory will also be discussed briefly. This theory credits the media for bringing up many issues that are subsequently taken over by companies as important issues.
In the last part the attention shifts to how one can examine environmental disclosures. This subject is still at this moment open to debate since most of the social and environmental disclosures are all qualitative instead of quantitative. This brings an extra difficulty to the research of the subject, as some text cannot be compared with others. Over the last thirty to forty years, academics came up with measures to solve this problem and by that, have made voluntary disclosures more comparable to each other: Some methods just count the number of pages or sentences in which a company discloses their policies, while others are more sophisticated.
In the third chapter of this thesis, the current literature in the field of voluntary disclosures is discussed. Why do companies disclose voluntarily? Do they benefit from this and are there contradicting explanations for this behaviour?
The first part provides a general overview of the literature that relates to voluntary disclosures, environmental reporting and CSR (Corporate Social Responsibility) reporting. This is done by means of several sub-chapters.
Next to the general literature in the field of voluntary disclosure, an overview is presented of a more specific field. The literature on voluntary disclosure around the occurrence of incidents is looked at. One of the first scholars to study this field was Patten (1992). He examined the effect that the Exxon Valdez oil disaster had on the voluntary disclosure that the oil sector provided. He did not take Exxon into account but still he found a significant increase in the disclosure of companies in the oil sector after the incident happened. An explanation is sought for why this happens and why companies have
7

to do this. Even companies that are unrelated in a business sense to Exxon, were found to increase their disclosure. This was a major finding as a narrow economic view predicts that every company is responsible for its own mistakes and that others will not have to alter their behaviour.It is found that many previous studies used models that were derived from one of the first environmental disclosure index models from Wiseman (1982).
In the fourth chapter an overview is presented on the Deepwater Horizon oil spill in the Gulf of Mexico. Next to this, a separate paragraph looks at who could be held responsible for the oil spill.
In the fifth section of this thesis the research that will be conducted is introduced. The hypotheses are presented on the change in voluntary disclosure after incidents. The research design and methods will be presented.
In the sixth chapter the results and analysis are presented. Firstly, the descriptive statistics from the sample are given and discussed. After this, the results and outcomes of this study are presented and discussed.
In the seventh chapter this thesis is concluded. This is done by giving an overview of the chapters, the outcomes of the study and listing the limitations of the study. Some suggestions for future research will be given and the contribution of this study will be discussed.
8

2. Theories and methods behind this research
2.1 IntroductionIn this section of this thesis, the underlying theories of social and environmental described. Over the last decades some theories have been defined, and they have in common that they try to explain why companies provide voluntary disclosures on these topics.
In the second paragraph, social and environmental reporting is reviewed. The history of the process will be discussed and then this is examined by the why-who-for what-how framework set out by Deegan and Unerman (2006, pp.309-365). In the third paragraph the Global Reporting Initiative will be discussed. This is a way of reporting for companies: Not only on financial aspects, but also on environmental and social aspects.In the fourth paragraph a brief overview is given of other frameworks used in environmental reporting. In the fifth section, the theories that relate to voluntary disclosures are discussed. The theories described are: legitimacy theory, stakeholder theory, institutional theory and media agenda setting theory. The methods that are used when studying disclosures will also be discussed. Several options exist, varying from subjective to semi-objective.
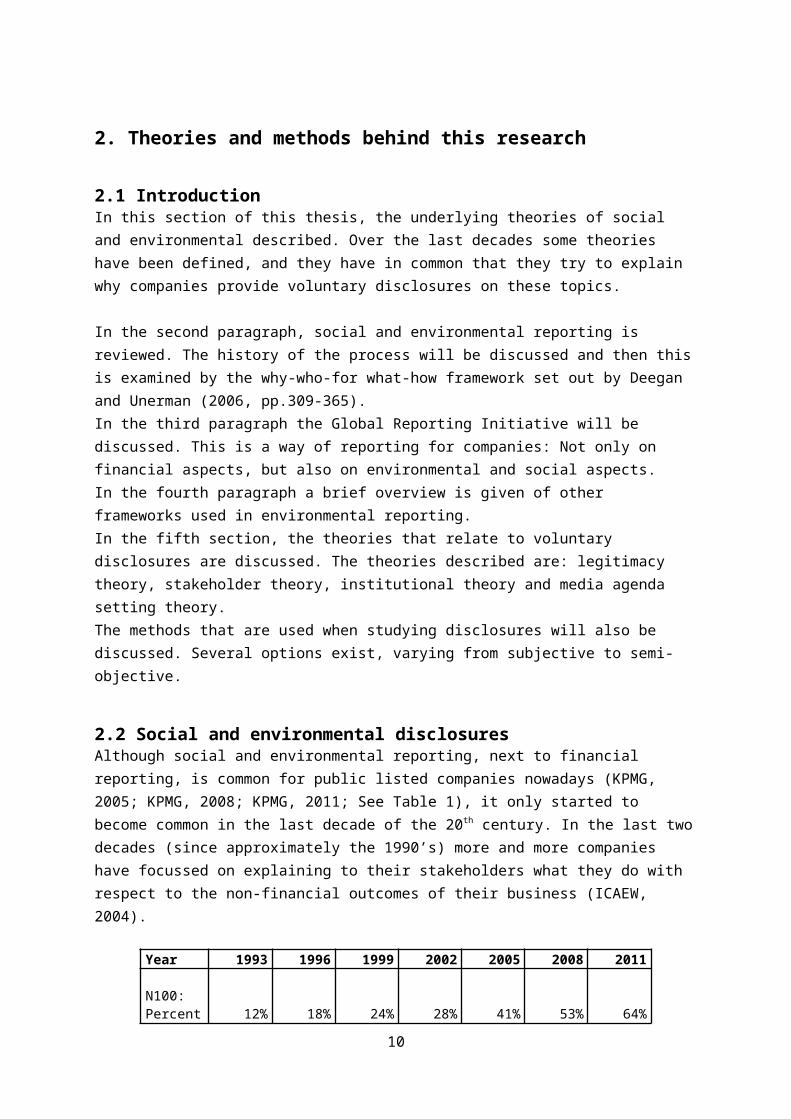
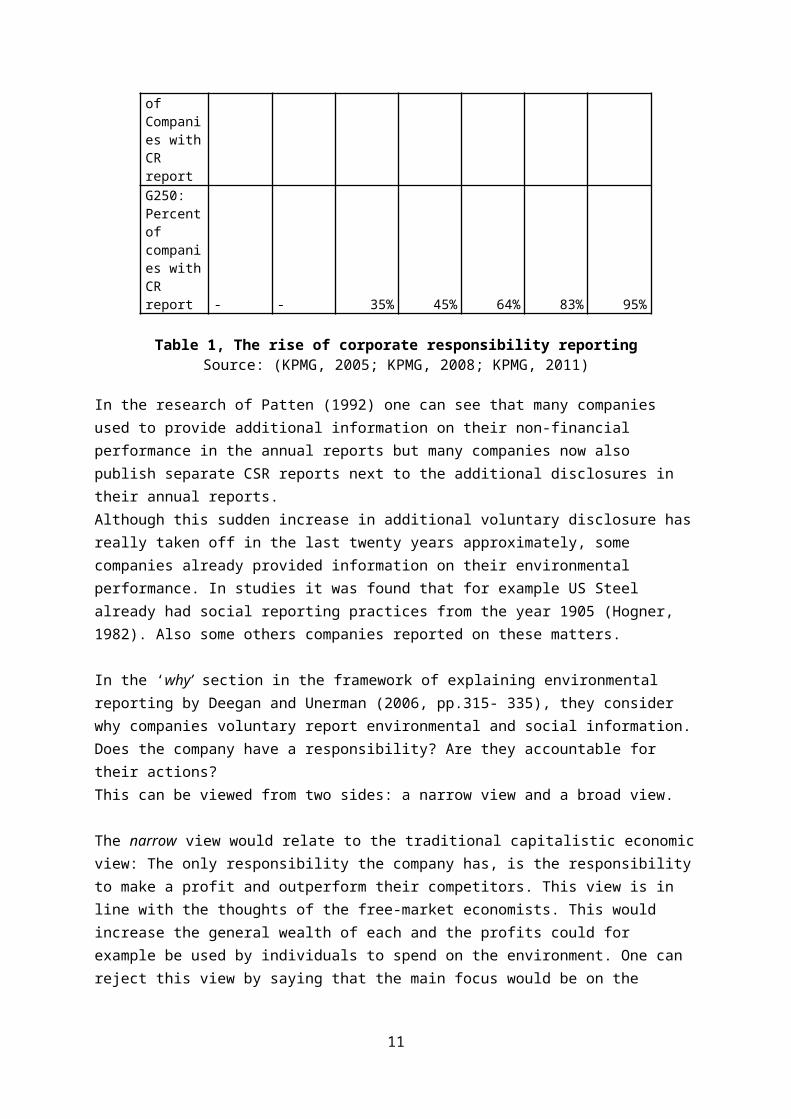
2.2 Social and environmental disclosuresAlthough social and environmental reporting, next to financial reporting, is common for public listed companies nowadays (KPMG, 2005; KPMG, 2008; KPMG, 2011; See Table 1), it only started to become common in the last decade of the 20th century. In the last two decades (since approximately the 1990’s) more and more companies have focussed on explaining to their stakeholders what they do with respect to the non-financial outcomes of their business (ICAEW, 2004).
Year 1993 1996 1999 2002 2005 2008 2011
N100: Percent of Companies with CR report 12% 18% 24% 28% 41% 53% 64%
G250: Percent of companies with CR report - - 35% 45% 64% 83% 95%
Table 1, The rise of corporate responsibility reportingSource: (KPMG, 2005; KPMG, 2008; KPMG, 2011)
In the research of Patten (1992) one can see that many companies used to provide additional information on their non-financial performance in the annual reports but many companies now also publish separate CSR reports next to the additional disclosures in their annual reports. Although this sudden increase in additional voluntary disclosure has really taken off in the last twenty years approximately, some companies already provided information on their environmental
9
performance. In studies it was found that for example US Steel already had social reporting practices from the year 1905 (Hogner, 1982). Also some others companies reported on these matters.
In the ‘why’ section in the framework of explaining environmental reporting by Deegan and Unerman (2006, pp.315- 335), they consider why companies voluntary report environmental and social information. Does the company have a responsibility? Are they accountable for their actions?This can be viewed from two sides: a narrow view and a broad view.
The narrow view would relate to the traditional capitalistic economic view: The only responsibility the company has, is the responsibility to make a profit and outperform their competitors. This view is in line with the thoughts of the free-market economists. This would increase the general wealth of each and the profits could for example be used by individuals to spend on the environment. One can reject this view by saying that the main focus would be on the owners of the company instead of the society and stakeholders as a whole.The second view is the broad view. This view does not focus on the financial side only but also considers social and environmental issues. If these are systematically ignored, it might result in the company being excluded in some parts of society. This might increase the costs of capital for the companies and subsequently result in lower return on investment. Companies that endorse the broad view report and communicate on the three factors (environmental, social and financial disclosures) by for example employing techniques such as ‘triple bottom line’ and the ‘global reporting initiative’. These will be examined later.
In the ‘who’ section of the framework by Deegan and Unerman (2006, pp.335-340), the company questions itself as to who it has to report their additional information.This section is to a great degree related to the ‘Stakeholder theory’ and the two different sides of this theory. Should the managers only provide information to the owners or the providers of capital (debt-providers and shareholders) as considered in the managerial view or should it be a more all-inclusive disclosure process as considered in the ethical view? This can differ from company to company, as different entities have different direct stakeholders. A large oil company will for example have to report more to the general public on their environmental policies than a small trading company. In Figure 1, one can see how many stakeholders a company might have. This does not stop at the providers of capital and direct business relations.
Figure 1, Stakeholders and the organisationSource: Deegan and Unerman (2006, p.369)
10
Many companies will actually identify their main stakeholders. Owen, Shaw and Cooper (2005), tried to find out which stakeholder is in general considered to be the most important. In Figure 2 the results of the study can be seen (Owen, Shaw and Cooper 2005, p.39). One can see that there is still a difference in the importance of stakeholders. The study was conducted by issuing a survey to 40 managers in the United Kingdom. They had to rate the stakeholders based on a ‘Likert-scale’ from 1 (not very important) to 5 (very important).
Figure 2, Importance of stakeholders as Seen by managers in the UKSource: Owen, Shaw and Cooper (2005, p.39)
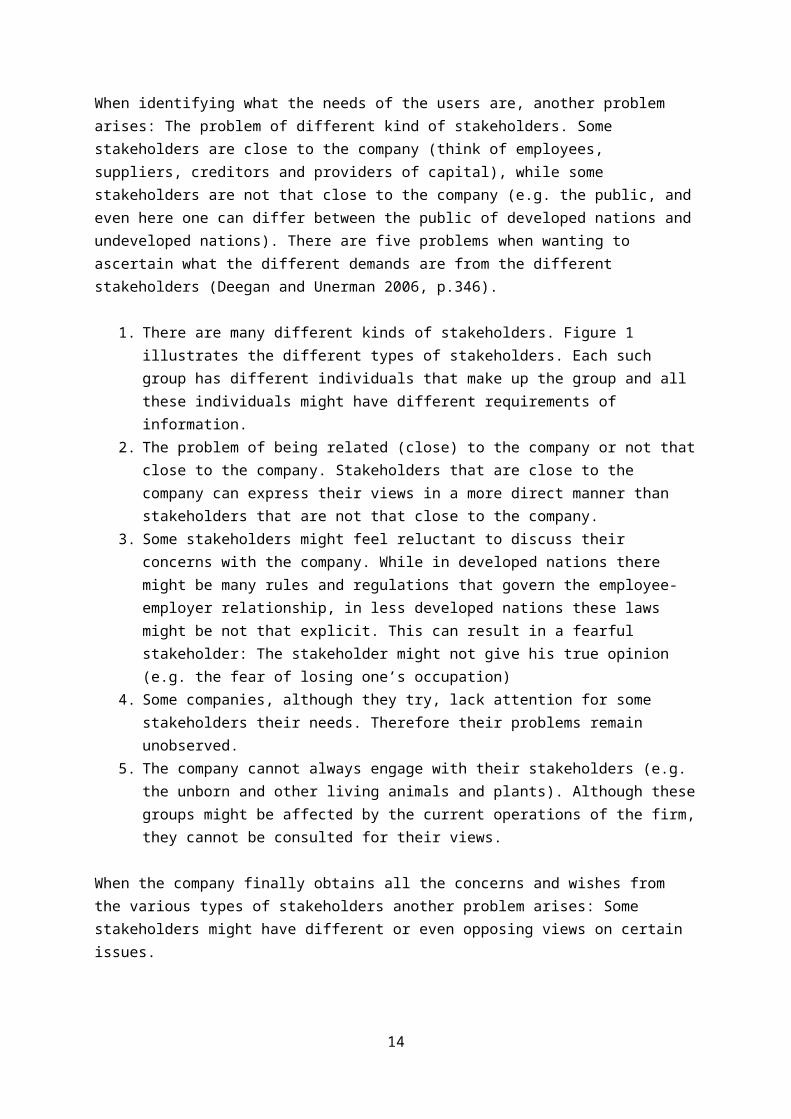
In the ’for what’ stage, Deegan and Unerman (2006, pp.340-352), the company has now acknowledged that there is a demand for the social and environmental disclosures. In this stage it is then necessary to find out what this demand consists of: For what kind of information is there this demand? When identifying what the needs of the users are, another problem arises: The problem of different kind of stakeholders. Some stakeholders are close to the company (think of employees, suppliers, creditors and providers of capital), while some stakeholders are not that close to the company (e.g. the public, and even here one can differ between the public of developed nations and undeveloped nations). There are five problems when wanting to ascertain what the different demands are from the different stakeholders (Deegan and Unerman 2006, p.346).
1. There are many different kinds of stakeholders. Figure 1 illustrates the different types of stakeholders. Each such group has different individuals that make up the group and all these individuals might have different requirements of information.
2. The problem of being related (close) to the company or not that close to the company. Stakeholders that are close to the company can express their views in a more direct manner than stakeholders that are not that close to the company.
3. Some stakeholders might feel reluctant to discuss their concerns with the company. While in developed nations there might be many rules and regulations that govern the employee-employer relationship, in less developed nations these laws might be not that explicit. This can result in a fearful stakeholder: The stakeholder might not give his true opinion (e.g. the fear of losing one’s occupation)
4. Some companies, although they try, lack attention for some stakeholders their needs. Therefore their problems remain unobserved.
5. The company cannot always engage with their stakeholders (e.g. the unborn and other living animals and plants). Although these groups might be affected by the current operations of the firm, they cannot be consulted for their views.
11

When the company finally obtains all the concerns and wishes from the various types of stakeholders another problem arises: Some stakeholders might have different or even opposing views on certain issues.
In the ‘how’ sections of the framework two main methods are discussed: the ‘Triple Bottom Line’ (TBL) and the ‘Global Reporting Initiative’ (GRI). These came into place as there were no rules and regulations in the area of social and environmental reporting. The two try to make the reporting initiatives undertaken by the companies more comparable. By making the disclosures more comparable, transparency increases and a better assessment can be made of the efforts made by the different companies.
The TBL has tried to shift predominantly financial (bottom line) focus to a more inclusive focus. The triple referring to: financial, environmental and social. The downside of this method is that it seems to indicate that it is a numerical measurement. This is not the case: One can maximize the financial factor, but the two other factors cannot be measured as a single number. This is then very difficult to capture the efforts put into the environmental and social factors. Compared to the GRI, this is not a method that can be put into practice by means of a framework.
Next to the TBL method a company can also use the GRI method. This method is specifically developed to increase the comparability of social and environmental reporting. In total the GRI method has 79 indicators. In the next paragraph an elaboration is given.
2.3 The Global Reporting InitiativeThe GRI is the first real framework that entities can use if they wish to report on their sustainability practices. As the organisation behind the GRI wants to include as many organisations as possible they specifically highlight that the framework is based on fundament of consensus-seeking and including as many stakeholders as possible.The whole project started in 1997/1998, where the idea of creating a disclosure framework was first conceived. After this the first real GRI framework was released in 2000 (G1). Subsequently the second version of the framework was released in 2002 (G2) and the current version was released in 2006 (G3). The organisation constantly changes their framework and does not simply continue using one framework without taking the changing environment into account.
The GRI consists of three main parts that cannot always be used together. The parts are: the guidelines, the protocols and the sector supplements. The guidelines are the main part of the GRI. Within the guidelines there is a difference between the definitions (this can be seen as a framework) and the standardized disclosures as propagated by the GRI (these can be seen as the indicators). Even before these two parts are explained, the GRI is discussed and the GRI reporting framework is defined as being “intended to serve as a generally accepted framework for reporting on an organization’s economic, environmental and social performance”. It then goes on by stating that “it is designed for use by organizations of any size, sector or location” (Global Reporting Initiative, 2006). This emphasizes that every entity can use sustainability reporting and due to that, stakeholders can compare companies to each other. Next to this purpose, two other main purposes are stated in the overview: benchmarking and demonstrating.
12

The guidelines start by defining what the report its content, quality and boundaries should be. This is done by means of certain principles, which will be discussed here. This way of building up the framework is comparable to the way the conceptual framework builds up to IFRS.
2.3.1 Reporting principles for defining contentThe upcoming principles define what should be included in the content of a report (Global Reporting Initiative 2006, pp.7-13).
1. Materiality. Just as materiality in other accounting frameworks, it means that only items should be reported to the stakeholders that report on significant effects and that would change the opinion of users when these items are not reported.
2. Stakeholder inclusiveness. The company acknowledges that it does not have just one type of stakeholders and by doing this makes their reports multi-purpose. They do this by identifying their stakeholders and how they fulfil the information needs of them.
3. Sustainability context. The company should make clear that each report does not only succeed the previous report with new individual numbers. The reporting process should be a continuing effort exerted by the company to improve the environment and social issues in a more broad sense.
4. Completeness. The report should reflect every aspect of the company’s significant environmental, social and economical outcomes.
2.3.2 Reporting principles for defining qualityThe upcoming principles, when used, will ensure quality of the report given out by the company (Global Reporting Initiative 2006, pp.13-17).
1. Balance. All parts of the company’s performance should be reflected. Indifferent of whether this is good or bad news. Otherwise the report will function as a sort of advertisement.
2. Comparability. The same principle as the principle that is used in the conceptual framework as presented by the IASB: Users of these reports should be able to compare information with previous periods and other companies.
3. Accuracy. Information provided, indifferent to whether it is qualitative or quantitative information should be accurate. Qualitative information should be clear, detailed and balanced. Quantitative information should be correctly measured and presented.
4. Timeliness. Information provided should be on a regular scale and by this it informs users of the information.
5. Clarity. Information should be clear to users that study the report diligently.6. Reliability. Information that is provided by the company should be reliable. This will ensure
that users can trust the information that they use.
2.3.3 Reporting guidance for boundary settingNext to defining and stipulating by means of principles what should be included in environmental and social reports, the guidelines also explain what should not be included. This is the so called boundary of the report. The guidelines (Global Reporting Initiative, 2006, p.17) stipulate: “The Sustainability Report Boundary should include the entities over which the reporting organization exercises control or significant influence both in and through its relationships with various entities upstream (e.g. supply chain) and downstream (e.g. distribution and customers)”. In this definition an important part relies on the terms ‘control’ and ‘significant influence’. The definition of control: “the power to govern the financial and operating policies of an enterprise so as to obtain benefits from its activities” (Global Reporting Initiative, 2006, p.17) and significant
13
influence: “the power to participate in the financial and operating policy decisions of the entity but not the power to control those policies” (Global Reporting Initiative, 2006, p.17).This can be seen in Figure 3 (Global Reporting Initiative, 2006, p.18).
Figure 3, Boundary of sustainability reportingSource: (Global Reporting Initiative, 2006, p.18)
2.3.4 Standard disclosureNext to the theoretical principles that underlie the GRI, there is also a chapter in the guidelines that elaborates on the more practical side of using environmental and social reports.In part two of the guidelines information is given on strategy and profile, management approach and performance indicators. In the first section, strategy and profile, an overall profile of the company is presented to the user. This enables the user to get an impression of the company. It will give the reader an overview of the company from above, so that together with the indicators, a full picture of the company is conveyed.The management approach is more related to the specific indicators. It gives the user information on how the management interacts with the business that is related to the specific indicators. Therefore this part is given before a company discusses the indicators.The last section of the standard disclosure is the indicators: the practical points companies will have to report on when they use the global reporting initiative. There are two main types of indicators: core indicators and additional indicators. The core indicators are mandatory to use when adopting GRI reporting, while additional indicators can be used by some companies but are often not material for all companies. When core indicators do not align with the underlying principles given by the guidelines, these are also not applicable for the company.
14

Subsequently, the reporting indicators are split up in several categories: economic, environmental and social. Social is then again split up into four categories: Labour, human rights, society and product responsibility.
2.3.5 Oil & gas sector supplementNext to the ‘normal’ GRI, the GRI organisation has been increasingly focussing on sectors. They bring this into practice by developing and issuing sector supplements. These sector supplements try to act upon issues that apply for that specific sector. This, as sectors such as oil & gas and mining and metals affect their environment to a larger extent than a simple trading industry.
Currently the sector supplement for the oil & gas industry is under construction. Issues that are taken into account in the sector supplement are: emissions, water, bio fuels, health impact assessment, safety processes and renewable energy. Next to these factors many others are accounted for.
The final version of the document is expected to be published at the end of 2011. The project is developed by an international working group. The working group consists of both companies (e.g. BP and Shell) and other organisations in the oil sector1.
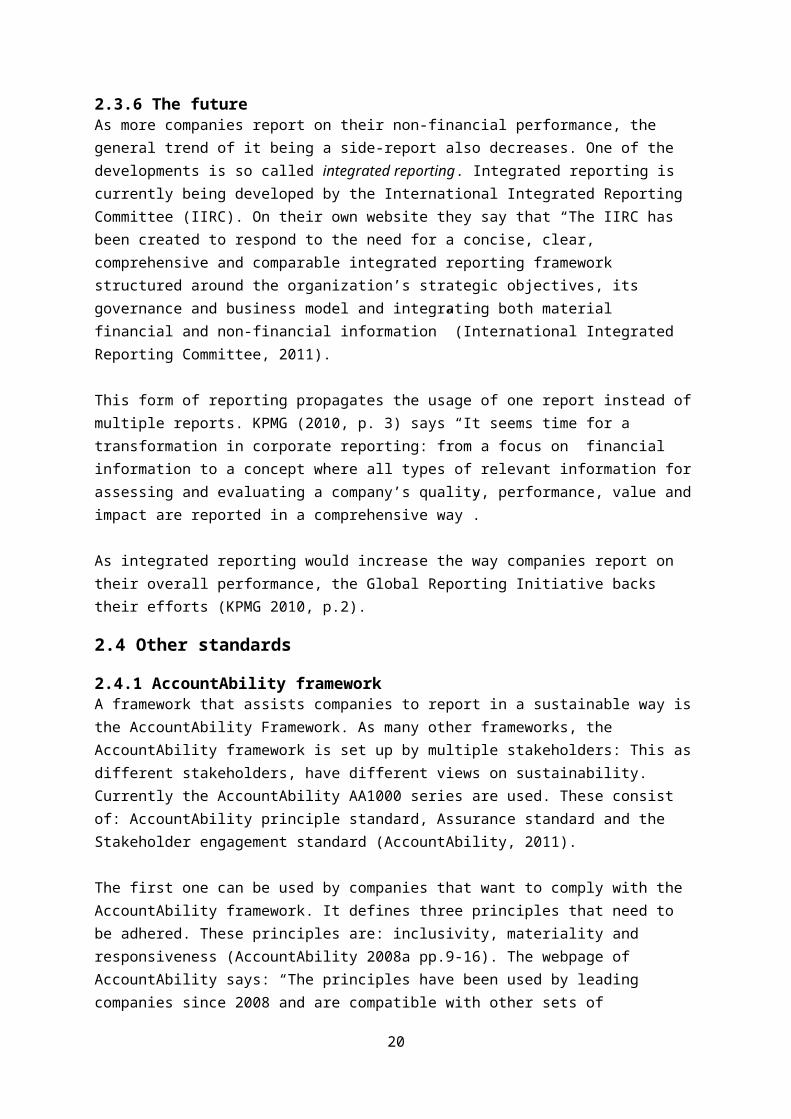
2.3.6 The futureAs more companies report on their non-financial performance, the general trend of it being a side-report also decreases. One of the developments is so called integrated reporting. Integrated reporting is currently being developed by the International Integrated Reporting Committee (IIRC). On their own website they say that “The IIRC has been created to respond to the need for a concise, clear, comprehensive and comparable integrated reporting framework structured around the organization’s strategic objectives, its governance and business model and integrating both material financial and non-financial information” (International Integrated Reporting Committee, 2011).
This form of reporting propagates the usage of one report instead of multiple reports. KPMG (2010, p. 3) says “It seems time for a transformation in corporate reporting: from a focus on financial information to a concept where all types of relevant information for assessing and evaluating a company’s quality, performance, value and impact are reported in a comprehensive way”.
As integrated reporting would increase the way companies report on their overall performance, the Global Reporting Initiative backs their efforts (KPMG 2010, p.2).
2.4 Other standards
2.4.1 AccountAbility frameworkA framework that assists companies to report in a sustainable way is the AccountAbility Framework. As many other frameworks, the AccountAbility framework is set up by multiple stakeholders: This as different stakeholders, have different views on sustainability. Currently the AccountAbility AA1000 series are used. These consist of: AccountAbility principle standard, Assurance standard and the Stakeholder engagement standard (AccountAbility, 2011).
The first one can be used by companies that want to comply with the AccountAbility framework. It defines three principles that need to be adhered. These principles are: inclusivity, materiality and responsiveness (AccountAbility 2008a pp.9-16). The webpage of AccountAbility says: “The
1 The list of companies and organizations that are a member of the international Working Group can be found at: http://www.globalreporting.org/ReportingFramework/SectorSupplements/OilAndGas/ [Accessed: 29 June 2011]
15

principles have been used by leading companies since 2008 and are compatible with other sets of principles in the marketplace, such as the UN Global Compact, GRI and ISO 26000” (AccountAbility, 2011).
The Assurance standard was created for a different group of stakeholders. This standard was made for assurance providers, such as auditing firms. With the standard they can see whether companies adhere to the AccountAbility Framework (AccountAbility, 2008b).
The last standard was created for again another group of stakeholders. This time the rest of the stakeholders in the process were taken into account. This as this makes the organisation perform better and it gives a contribution to the licence to operate (AccountAbility, 2008c). The standard goes on describing how to increase the quality of stakeholder engagement.
2.4.2 ISO 14001The International Organization for Standardization (ISO) has their own standard on environmental management within organisations. This standard is ISO 14001. It can be compared to the GRI as it both has requirements (ISO 14001) and guidelines (ISO 14004) published as separate standards.
One of the main features of ISO 14001 is that it does not specify any level of performance that a company has to reach. Instead, it is a “framework for a holistic, strategic approach to the organization's environmental policy, plans and actions” (ISO, 2011a). A reason for this flexibility is that it is difficult to generate one standard for many different companies, this as companies differ in many aspects.
Other standards within ISO 14001 elaborate on specific items such as: 14031 that gives guidance to companies on how to evaluate their environmental performance, 14063 that gives guidance on how to communicate the environmental performance and 14064 on how to account for greenhouse gas.
2.4.3 ISO 26000Next to ISO standard 14001, the ISO also published a specific standard on social responsibility as a management system that can be used by companies. This standard is not a certification standard such as 14001, but can be used voluntarily by companies that wish to do so. As with many frameworks, it is made to be used by many different stakeholders: both private as public companies.
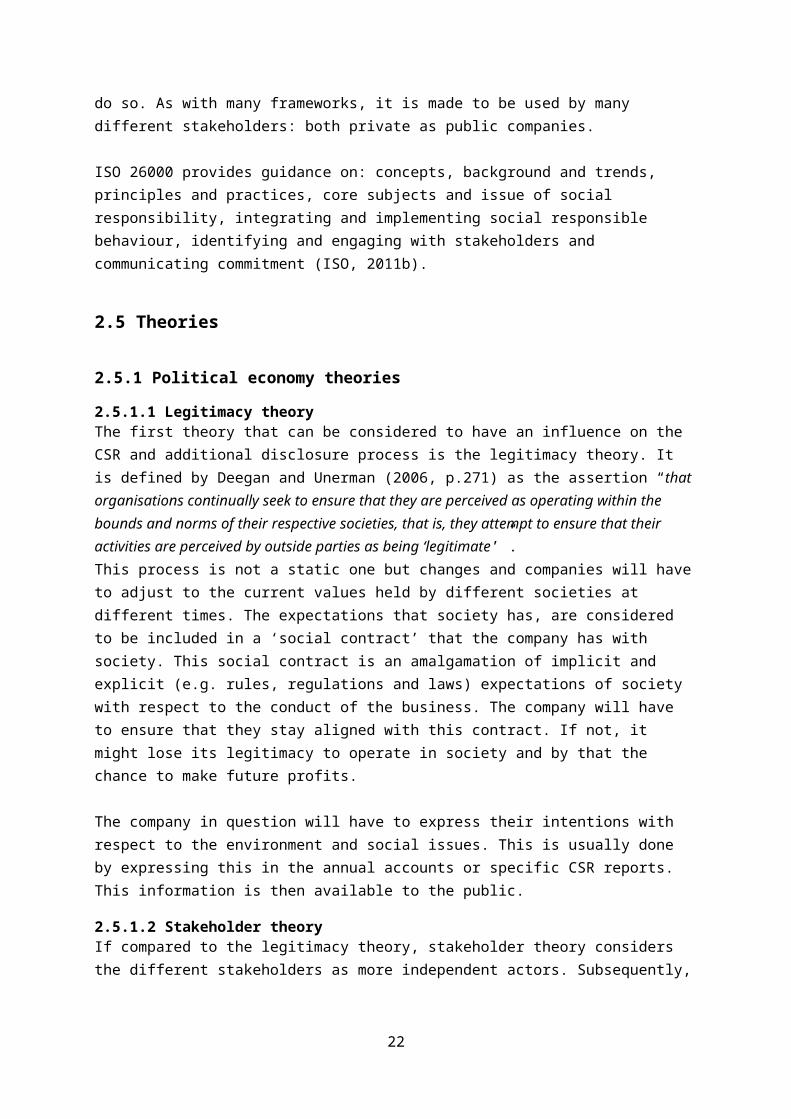
ISO 26000 provides guidance on: concepts, background and trends, principles and practices, core subjects and issue of social responsibility, integrating and implementing social responsible behaviour, identifying and engaging with stakeholders and communicating commitment (ISO, 2011b).
2.5 Theories
2.5.1 Political economy theories
2.5.1.1 Legitimacy theoryThe first theory that can be considered to have an influence on the CSR and additional disclosure process is the legitimacy theory. It is defined by Deegan and Unerman (2006, p.271) as the assertion “that organisations continually seek to ensure that they are perceived as operating within the bounds and norms of their respective societies, that is, they attempt to ensure that their activities are perceived by outside parties as being ‘legitimate’”.
16

This process is not a static one but changes and companies will have to adjust to the current values held by different societies at different times. The expectations that society has, are considered to be included in a ‘social contract’ that the company has with society. This social contract is an amalgamation of implicit and explicit (e.g. rules, regulations and laws) expectations of society with respect to the conduct of the business. The company will have to ensure that they stay aligned with this contract. If not, it might lose its legitimacy to operate in society and by that the chance to make future profits.
The company in question will have to express their intentions with respect to the environment and social issues. This is usually done by expressing this in the annual accounts or specific CSR reports. This information is then available to the public.
2.5.1.2 Stakeholder theoryIf compared to the legitimacy theory, stakeholder theory considers the different stakeholders as more independent actors. Subsequently, with each of these actors, the company will have a separate ‘social contract’.Within stakeholder theory, there are two branches: Each type considering a different relation between the company and the stakeholders. The first branch is the ethical/moral (normative) type of stakeholder theory. The second branch is the managerial (positive) version of stakeholder theory. Of course there are different relations between the different types of stakeholders and the company. Shareholders will have more interaction with the board (shareholder meetings) of the company than the general public or environmental groups.
The ethical/moral (normative) view of the stakeholder theory is defined by Deegan and Unerman (2006, p.286) as “all stakeholders have the right to be treated fairly by an organization, and that issues of stakeholder power are not directly relevant”. This view relates to the stakeholders having some fundamental rights in their lives and these cannot be compromised by entities that are seeking profit.
The managerial (positive view of stakeholder theory actually differs from the normative view in the power relation. This view is defined by Gray, Owen and Adams (1996, p.45) as: “The stakeholders are identified by the organisation of concern, by reference to the extent to which the organisation believes the interplay with each groups needs to be managed in order to further the interests of the organisation”, where, when the power of the stakeholder increases, also the level of attention of the company to the needs of these stakeholder increases. Usually the providers of capital are considered as vital to the company, while secondary stakeholders are considered to be less important (see Figure 2).
2.5.1.3 Institutional theoryInstitutional theory is the third theory and overlaps (as all three do) the other two theories. Just as the other theories, it tries to explain the way companies report their social and environmental disclosures. Dillard, Rigsby and Goodman (2004, p.507) define it as: “concerns the development of the taken for granted assumptions beliefs and values underlying organizational characteristics... [with the accounting based studies] suggesting the importance of social culture and environment on the practice of accounting; the use of accounting practices as rationalizations in order to maintain appearances of legitimacy”.In other words companies will try to adjust their way of reporting to what is expected of them to remain a profitable company and remain legitimate.
17

Also in this theory there are some sub branches: One can distinguish between isomorphism and decoupling. Isomorphism can be seen as the change that the adaption of the institutional practice brings along (here: social and environmental reporting). This again can be divided into three sub categories as done by DiMaggio and Powell (1983):
1. Coercive isomorphism. Organisations are influenced and will change their policies with respect to their non-financial performance due to the influence of stakeholders. When the stakeholders want to see changes, the company will align themselves, as they are dependent on these stakeholders.
2. Mimetic isomorphism. As the word ‘mimetic’ suggests, a company will try to mime other companies (in their industry) with respect to the social and environment disclosures.
3. Normative isomorphism. As the word ‘normative’ suggests, this category is influence by norms and how one should act. Managers can be influenced by their personal background but also by groups and organisations they belong to. This creates a social force that influences managers and the disclosure of the company they work for.
Next to isomorphism there is a second branch of institutional theory: decoupling. This is the actual usage of social and environmental reporting, while the company does not align with these stated processes.
2.5.2 Media agenda setting theoryAs predicted by legitimacy theory, companies will have to be legitimate to operate. This legitimacy is often derived from the current views from stakeholders. In turn, one can ask how the companies – managers – can derive these expectations. Concerns are often communicated by the media. By means of this same media, managers will inform themselves and try to react to certain issues that might cause a threat to the legitimacy of the company.
One can then ask how the opinions of the public are formed. Ader (1995, p.300) found that there is a link between the level of media reporting and the public opinion. In this sense, the media sets the agenda of what is seen as important. Ader (1995) finds that the effect of the media agenda setting theory is higher when the event that is reported is relatively unknown to the media consumer, and therefore needs the media to get information on the topic.
Capriotti (2009) says that a company needs the media as part of being corporate visible. The more a company is seen in the media, the more prominent the company becomes. Companies then can be associated by consumers economically and socially (Capriotti 2009, p.228). The economic role relates to the role the company has as a producer and the creation of profits. The social role relates to “respect of human rights, care for the environment, and make an economic and social contribution to the community” (Capriotti 2009, p.228).
2.5.3 Voluntary disclosure theoryClarkson et al. (2008) contrast the previous theories with the voluntary disclosure theory. This economic-based theory predicts that companies that have good environmental performances tend to disclose more environmental information than companies that do not. This theory lies in line with the Principal-Agent theory. Better performing companies disclose more information to signal they are performing better. The information asymmetry between the company and the stakeholders decreases. This additional disclosure is something only good performing companies can do. Companies that have worse performances cannot just copy this behaviour, so they
18

report less or even nothing. Due to this investors can distinguish between good environmental performers and bad ones.
2.6 Models
2.6.1 Measuring the quality of voluntary disclosuresAn important issue is measuring the social and environmental disclosures made by companies. The main objective of analyzing disclosures is identifying the quality of the information provided. This can be done is several ways as identified by Beattie et al. (2004). Here one can distinguish between the so named ‘subjective ratings’ and the ‘semi-objective’ ratings. The semi-objective rating again consists of two subcategories: ‘disclosure index studies’ and ‘textual analyses’.Subjective ratings look at several ratings that are given to companies based on their voluntary disclosure. These ratings are often provided by users of financial statements (e.g. financial analysts that would normally analyse the statements on a daily basis). Although they are acquainted with the statements, this is still quite subjective, as two individuals could rank the same disclosure completely differently.In the past there was a well-known American subjective rating that was assigned to companies on a yearly basis. This was given out by the Association of Investment Management and Research (AIMR), however they stopped with this rating system in 1997. Next to this better-known rating, there are many other assessments published.
Another method of rating the quality of disclosures is the disclosure index studies within the semi-objective ratings. This model looks at the quantity of disclosures that are given within disclosures provided by the company and this is seen as the indicator of the quality of disclosure.These models are usually based on some specified questions and subsequently a score is given when the text complies with certain conditions. These conditions together and the points assigned form the total score. Several models can be made, based on different facts:
1. Binary (0 or 1, present or non-present) or an ordinal measure (e.g. 0 for not disclosed, 1 for qualitative disclosure and 2 for quantitative disclosure). This was used by Botosan (1997).
2. Weighted or unweighted model. More weight can be given to certain terms when they are considered to be more important than items that are deemed to be unimportant. This is usually done by surveying users of specific information.
3. Grouping of items into hierarchical categories.
The last method is the textual method, also within the semi-objective rating. This method will in general look at the readability, the thematic content and linguistic side of the disclosures. I will not further elaborate on these topics as these will not be used in this thesis.
2.6.2 LimitationsAs both the subjective, as the semi-objective method, classify texts based on either the text or the context, these ratings are not really ‘hard figures’. For the semi-objective disclosure index models, the quality of the text is measured by the quantity of the text. This is a major limitation because companies could increase the quantity of their disclosures, to appear better in several index studies.For subjective models, the limitations are even larger as individuals perceive different elements as having a different importance to the text. This decreases the comparability of the outcome.
19
2.7 Research in relation to the theoriesIn this chapter several theories have been discussed. The research that will be done in this thesis derives its fundament from these theories.In chapter 6 hypotheses are tested that relate to increase of environmental reporting in relation to incidents. The hypotheses are based implicitly on the theories that are discussed in this chapter. Therefore a link is established between the theories discussed and the hypotheses tested later in this thesis. Two theories are especially used: legitimacy theory and media agenda setting theory.
In specific legitimacy theory can be seen as a fundament: This as this theory explains why companies would report after an incident to a general set of stakeholders. Legitimacy theory says there is a dynamic ‘social contract’ between the company and society. As this is a dynamic and not a static contract it changes all the time. Therefore other expectations arise after a negative incident, such as the Deepwater Horizon oil spill. To regain the perception of being a legitimate company within society companies might alter their way of reporting. In this thesis the Deepwater Horizon oil spill is investigated and the effects it had on voluntary disclosure of the companies within the 2911 SIC code (Standard Industrial Classification). It can be expected that companies will increase their environmental disclosures to signal that they are a legitimate company within the industry.
The second theory that influences the hypotheses is the media agenda setting theory: As can be seen in chapters 4 and 5, the media reported relatively a lot on the deepwater horizon oil spill. This could have influenced the opinion of the general public and indirectly could have set the agenda for the companies. Media agenda setting theory is in line with legitimacy theory and therefore could have influenced the ‘social contract’ of the company with the general public. This in turn could indirectly influence the reporting from the companies towards the stakeholders.
Both hypotheses then investigate whether the incident influenced the reporting after the oil spill towards the general stakeholders.
2.8 ConclusionIn this chapter, theories, methods and frameworks are considered that are used in research currently conducted on voluntary disclosure of environmental and social information. In the first section, a general introduction to social and environmental reporting was given. It was found that the first forms already started at the beginning of the 20th century although it was not that common. It only started to grow quickly in the 1990’s. Currently one could not imagine a business community without any social and environmental reporting.
After this general introduction, the social and environmental reporting framework by Deegan and Unerman (2006) was discussed. They examined it by using the why-who-for what-how framework. In the ‘why’ section, two views were investigated: One can have a narrow (short-term, self-interested) view or a broad (longer-term, more considering) view. In the ‘who’ section it was found that, in line with the managerial side of stakeholder theory, some differences still exist between the importance of different stakeholders as considered by managers, with the shareholders being considered most important and the suppliers least. In the ‘for what’ part, it was found that when the company wants to identify the needs of stakeholders there are some difficulties. Five general difficulties are considered. In the last section, the ‘how’ part, two methods are discussed that can be used to report to several stakeholders: The TBL and GRI methods. The first still has some practical difficulties and the second is being used more and more.
20

It was found that the GRI consists of a framework and a set of indicators that can be used in communication to stakeholders. The indicators are more concrete and practical. Also a specific sector supplement is under construction that will improve the factors on which companies within the oil & gas sector can report.
Next to the GRI, a limited overview was given on other frameworks. The AccountAbility framework and two ISO standards were examined.
The first of the three political economy theories is the legitimacy theory. Companies have an explicit and implicit ‘social contract’ with society and when this contract is breached their legitimacy to operate might fall away.The second theory is the stakeholder theory. This theory has two branches. The first branch, the ethical/moral (normative) theory states that all stakeholders should be treated in an equal manner. The second theory is the managerial (positive) branch and predicts that more influential stakeholders would be heard more than less influential stakeholders. The third theory, the institutional theory, considers that companies are forced to disclose environmental and societal information. Also in this theory two branches exist: Isomorphism, which considers forces that actually changes the company, while the second branch, decoupling, says that companies might be forced to disclose information but in reality they would not change any policies.
Next to this, two other theories are investigated: The media agenda setting theory and the voluntary disclosure theory. The first theory explains that some concerns that are conveyed by the public to companies are actually instigated by media coverage. The second, voluntary disclosure theory, contrasts with the previous theories by saying that companies that perform better environmentally, will disclose more.
In the last section of this chapter, different methods were considered that can be used for the measurement of the quality of voluntary disclosures. In the paper of Beattie et al. (2004), two general methods are considered: the subjective method which is based on subjective ratings given by a certain group of stakeholders. The second method is the semi-objective method. This method can be divided into the disclosure index model and the textual method. After this, the limitations of the semi-objective and subjective methods were discussed.
21
3. Literature review
3.1 Introduction In this chapter, the most important literature in the field of social and environmental reporting is presented. I investigate why additional information is so often voluntary disclosed and what several studies find on voluntary social and environmental information. The studies have been selected on subject relevance.
In the second paragraph a broader and more general literature overview relating to social and environmental disclosure is given. In the third paragraph, a more specific part of the literature will be discussed. In this section, articles that explore voluntary social and environmental disclosures/reporting after certain incidents will be discussed. In the fourth paragraph multiple studies are listed that use models to classify disclosures. First, one of the first disclosure index model studies will be discussed. Secondly, several studies are listed that use environmental disclosure index models. From these models, a model is derived that will be used in the empirical part of this thesis.In Appendix 1 an overview of the discussed papers is given.
3.2 General literature
3.2.1 Capital market reactionsAnderson and Frankle (1980) make a link between the voluntary disclosure of social information and the effects on the capital market. They define social reporting as “the communication and reporting of information concerning a firm’s community involvement, human resources, environmental impact and products/service contributions”. The authors looked at the voluntary social disclosures of Fortune 500 firms that were listed at the New York Stock exchange in 1972. Subsequently they divided the companies into two groups: one group with voluntary social disclosures and one without these disclosures. As theoretical basis they used the capital asset pricing model (CAPM). Everything else being equal, one could expect that the return on investment should be the same between the two groups.
An interesting point of the research is that the authors define two different (competing) hypotheses next to the 0 hypothesis. The first expects that firms that do not engage in voluntary social reporting have a higher return on investment. This as the extra costs that are made by these firms would not be profitable. The second expects that the firms that do engage in voluntary social reporting have a higher return on investment. This can be explained as shareholders are willing to pay a premium for companies that operate ethically.
The results of the study show that all firms that voluntary disclose information have in general a higher return on investment compared to firms that do not disclose voluntary information. For portfolios that had a Beta of 0.8 and 1.2 this was significant on a 5% level. For the portfolio Beta=1.0, this was higher but not significant.A general conclusion can be drawn that the market favours companies that disclose social information to companies that do not.
22

A more recent study is from Botosan (1997). She investigated the relation between the disclosures made by companies and the cost of capital. This was done by investigating the annual reports and the disclosures made in them. In her research, the first hypothesis investigated whether there was a negative association between the disclosures of a company and the cost of capital. The second hypothesis examined whether this association is stronger for smaller companies than for larger companies. This, as smaller companies have less disclosures and the annual report plays a bigger role in their reporting process.
The sample consisted of 122 manufacturing firms. One industry was chosen by Botosan while different industries show different characteristics and this could influence the outcome of the study. A disclosure index model is created to assess the level of voluntary disclosure. 0 points were awarded for no disclosure, 1 point for qualitative disclosure and 2 points for quantitative disclosure as “precise information is more useful and may enhance management’s reporting reputation and credibility”, (Botosan 1997, p.334).
She found that companies with a lower analyst-following could significantly decrease their cost of capital as they would report more. Especially when they reported on forecast information and important non-financial statistics.
3.2.2 Characteristics of firms and countriesKolk et al. (2001) examined the largest 250 firms from the Fortune 500. The authors looked at their environmental reporting and how this differs with some firm specific characteristics. These characteristics are ‘sector’ and ‘nationality’.
In the first section they looked at additional disclosures in reports in general. They showed that, based on the reporting year 1999, there are some differences in reporting between sectors. They divided the reports into: Environmental reports, environmental information (less than the first category), no environmental information and non-response. Although 30% of the global 250 consists of financial firms, only 14.9% had environmental reports. 44.6% of the financial firms fell into the category: no environmental information. In general around 67% had some kind of environmental information.They first look at the link between nationality and additional disclosures. They find that in a country such as the Netherlands, where some environmental reporting is required there is a higher level than when this choice is voluntary. Also the UK and Germany score high in this index. The UK can be explained by the pressure exerted by the investment community, while in Germany the governments support the European Eco-Management and Audit Scheme (EMAS).
Then the authors shifted their attention to the different kinds of sectors. The trend is that sectors that clearly have an influence on society and the environment are more likely to issue some kind of environmental report. This can be seen in the pharmaceutical and chemical sectors. Here a score of 100% environmental reporting is reached. This is in line with legitimacy theory, which can explain the level of reporting. This contrasts with, for example, the insurance sector where still many companies do not report on their environmental behaviour. The authors expect that due to more standards (e.g. GRI) a second wave of environmental reporting will start.
Although by this time there is more and more emphasis on corporate environmental disclosure, there are still companies not adhering to this demand. Solomon and Lewis (2002) investigate this paradox. They attempt to identify why companies would or would not disclose additional information and what the incentives or disincentives are.
23
They start by identifying four sectors that can explain incentives in additional disclosures. These are: market, political, social and accountability incentives. When looking at market incentives, the best known is the incentive to reduce the cost of capital. Entities that operate in an ethical manner might have less difficulties attracting capital than companies that do not. Subsequently they discuss the other incentives. Disincentives mentioned in the paper are the lack of demand for environmental reporting and then cost of additional disclosures outweigh the benefits.To further examine this, the authors distributed a survey under 625 persons. Further there were 3 subgroups formed: users (normative users and interested groups) and providers. With the normative group being a group with strong views although probably a lack of use (e.g. academics, government officials) and examples of users of the interested group are financial analysts, media and banks.The survey wanted to examine whether the respondents were incentivized in any kind. With a usable response rate of 43% this survey can be considered as very reliable.
The main outcomes are that all three groups believe that corporate environmental reporting is important, with the main incentive being ‘accountability’. Both user groups expressed the opinion that companies sometimes use voluntary reporting to improve their corporate image. On the basis of this outcome the writers give some policy recommendations. One option could be making additional reporting mandatory. This would result in not getting a competitive advantage and in more comparability. A second is making all parties more aware of the demand and views from other parties on their actions undertaken. This might align the user groups more.
3.2.3 Mandatory reportingWhen then looking at an example of mandatory environmental reporting, as opposed to voluntary, the focus can be shifted to the paper of Larrinaga et al. (2002). They investigated the Spanish situation. In Spain a special standard is active that requires companies to mandatory disclose environmental information about the company. In the paper the authors show that ‘simply’ making environmental reporting mandatory, does not solve all problems. The new Spanish standard requires all companies to disclose information on their environmental performance. These disclosures have to be made in the annual accounts, in a prescribed manner and in a conventional accounting way. In the research 70 firms were examined. Of these 70 firms, only 23% complied with the disclosure process in 1999 (after introduction of the mandatory reporting process). The authors also included a content analysis based on the law that prescribed what to include in the annual accounts. Based on this they had a score: from 0 (non-reporting) to 7 (maximum reporting). The average was 0.5 (1.8 for reporting companies) in the year after the introduction, 1999. Even when companies were disclosing information, the authors found that the companies tended to report one side of their story: the side that enhanced the positive image of the company.
The authors conclude by making a clear distinction between two types of reforms in the environmental reporting sector. Reforms can be administrative or institutional. Administrative reforms are reforms that only change the rules and regulations. This happened in Spain by making environmental reporting mandatory in 1998. An institutional reform is created when entities actually change their behaviour and really want to comply with a change.
3.2.4 Different disclosuresCho and Patten (2007) think that mistakes are made continuously in environmental disclosure research. Not all environmental issues that are disclosed by management are disclosed to legitimize the organisation. Therefore the authors distinguish between litigation and non-litigation reporting. The authors argue that litigation related disclosures are mandatory and cannot be adjusted. Therefore one
24

has to examine non-litigation related disclosures. Secondly they distinguish between monetary (high valuated) disclosures and non-monetary (lower valuated) disclosures.The authors develop a classification that uses eight items. Next to an overall score that is assigned to a company, non-monetary and monetary items are also accounted for separately. Next to that they examined the 10-K reports. It was found by the authors that, all in line with legitimacy theory, within the non environmental sensitive industry, the lesser performing companies employed less monetary disclosures than more successful companies.
Clarkson et al. (2008) test two theories behind voluntary disclosures that are made by companies. Firstly they discuss the economic based theories: companies with good environmental performance will voluntary disclose a lot of information and this will be as objective as possible (to contrast with non good environmental performers). Secondly the socio-political theories: companies with a bad environmental performance will voluntary disclose a lot of information, this to legitimize themselves.
The authors used 191 firms that disclosed information in 2003 from firms that operate in the five most polluting sectors. They improved the previous models by not looking at mandatory disclosures (the same as Cho and Patten did) and they performed their content analysis based on the GRI. They find that there is a positive relationship between environmental reporting and voluntary disclosure and not a negative one. This contrasts with Cho and Patten (2007). Although they find this contrast, they also find that many companies that had negative media attention would increase their voluntary disclosure. This is then often done by making so called ‘soft claims’ (Clarkson et al. 2008, p.21). This is in line with the media agenda setting theory.
3.3 Specific incidentsThe first paper that is discussed is the paper of Patten (1992). This paper has been one of the first to examine the environmental disclosures after a certain incident. The incident that was taken into account was the ‘Exxon Valdez’ oil spill, where a ship of Exxon crashed into a reef off the coast of Alaska on the 24th of March 1989. This accident resulted in an oil spill of 11 million gallons of oil (41.5 million litres). Exxon, as expected by legitimacy theory, disclosed in the reporting year a total of 6 pages on the environment (3.5 on the oil spill and 2.5 on other environmental issues). In 1988, the oil company only reported 0.6 pages on their environmental policies.Patten, on the other hand, did not want to investigate the disclosures made by Exxon, but wanted to examine the disclosures made by the other oil companies. There was a chance that the legitimacy of the other oil companies was also at risk. Patten brought up two main arguments for this:
1. Seven oil companies (including Exxon) had a joint- venture (Alyeska) that was responsible for any oil spill. This service would have to respond within 5 hours, but in total in took 12 hours for the first response. Therefore they were partly responsible for the significance of the oil spill.
2. As with many accidents within a sector, the general public’s attitude towards a sector will change. Even when the company did not have any (business) link with the particular incident.
Patten therefore examined the annual reports of 21 of 23 publicly traded oil companies and looked at the environmental disclosures in 1989 compared to 1988. Patten took disclosures into account that fitted into a seven factor model and then just counted the page numbers as an absolute figure.
After the counting of the page numbers, Patten developed two tests. The first one simply checked the mean and standard deviation of the disclosures in the two years. Here a significant increase in disclosures was found in 1989 (mean: 1.9, σ: 1.469) compared to 1988 (0.61, σ: 0.784) at the 0.01
25

level: Also when the finding was split up into two parts: financial and non-financial disclosures, both were significant.
Secondly Patten developed a linear regression, which investigated whether the difference in disclosures of an individual company were related to a) the size, b) part-ownership/non-ownership of Alyeska2. Also here the results turned out to be both significant at the 0.05 level. This means that companies that were partly responsible for not responding had a significant higher level of disclosure compared to companies that were not in the cooperation. Secondly, companies that were larger also had reported significantly more than small companies.
The outcome from this test backs the legitimacy theory in that companies will have to legitimize them when operating in a sector that is sensitive: Also when they were not related to the incident themselves.
Next to environmental incidents as seen in the paper by Patten, there are also ‘soft’ incidents that can question a company’s legitimacy. This happened to ‘Grameen Bank’ (GB), a Microfinance Institute (MFI). The bank issues small loans to individuals in less developed countries. With this money they can start their own business and then they will repay the MFI. GB operates and reports in Bangladesh, but it has no obligation of making annual reports available. Therefore the disclosures made by GB are self regulated.In 2001, the Wall Street Journal (WSJ) was very critical about GB and the manner in which they reported. The main criticism was on certain policies of the bank of converting overdue loans in to so called ‘flexible’ loans.
Islam and Mathews (2009) decided to investigate whether this ‘soft’ incident had any effect on GB. Legitimacy theory would predict that the company would try to reclaim the legitimacy of operating in society and this especially holds for a company that started with an ideal to alleviate poverty. The authors examine the social disclosures that were made public by GB in the period of 1997 to 2005, with 2001 being the year in which the WSJ reported negatively on GB. Islam and Mathews decided to classify the content of the annual accounts into five sections, which are in line with the UN Millennium Goals: community poverty alleviation, community health, community education, environmental sustainability and others. As used in previous studies, this study also counted the number of sentences in the reports.
The findings are presented in Figure 4 (Islam and Mathews 2009, p.158).
2 Change in disclosure = α1 + β1Size + β2AlyeskaWhere: Change was the change from disclosure level from 1989 to 1988.Size was the logarithm of the revenue in 1989.Alyeska was a dummy variable. The value was 1 when the company was in the joint-venture of Alyeska and 0 if it was not.
26

Figure 4, Increase of reporting by Grameen Bank on CR themesSource: (Islam and Mathews 2009, p.158)
One can see that there is a clear distinction between some categories, with community poverty alleviation and community education significantly increasing after the incident. This increase in disclosure can be explained by the company wanting to reclaim their legitimacy.The final paper (Islam and Deegan, 2010) that is discussed does not look at a specific incident but it looks at two specific companies that are often associated with bad social or environmental policies: Nike and Hennes & Mauritz (H&M). The authors try to explain the corporate social disclosures by, as many other papers do, legitimacy theory, but also by the so called ‘media agenda setting theory’. Although this theory is not often seen within accountancy, more accountancy researchers are using it in combination with legitimacy theory. The theory partly explains why companies suddenly start reporting: The adverse media attention results in a sudden ‘legitimacy gap’. This gap between the perceptions of stakeholders and what the company actually does has to be filled up by disclosing either the right information or information that states the company has changed.
The Western world started to convey their concerns on bad labour conditions and child labour around the mid 1990’s. From this point onwards, more and more companies have disclosed information on their social and environmental policies in the developing countries where many of their products are fabricated.
The main hypothesis the writers want to test is, whether an increase in bad media attention resulted in an increase in reporting. They conducted this study by using the annual accounts from the two companies in the period from 1988 to 2006. The social and environmental disclosures were subsequently subtracted by using a content analysis model also used in previous studies. This was then compared to news items that were found in the major papers from all around the world.
For the nine items3 that were tested for H&M, eight were significantly correlated to the media attention. For Nike this was less: only four of the nine were significantly correlated, with the both companies corresponding with an increase on the points of ‘working conditions’ and ‘child labour’.
3 The items that the companies were tested for were split up into four themes: environment, human resources, product and community. Within these themes, 9 specific measurable items were selected. Examples are compliance with environmental standards, home based human resources, product research and development and community education support.
27

3.4 Environmental disclosure index models As disclosures made by companies are not quantified numbers but qualified information, a method has to be used to translate disclosures into hard numbers when investigating these disclosures. A method that is often used within environmental reporting is the environmental disclosure index model. By examining whether certain parts are or are not included, one can assign a score to a certain disclosure of a certain company within a certain year. With these hard numbers one can assess what the quality is of disclosures made by companies. It is often also considered to be a better measure than (automatic) content analysis. Aerts and Cormier (2009, p.9) say on this: “While this process is more subjective, it ensures that irrelevant or redundant generalities are not considered strategic environmental disclosures”. In this chapter several papers are examined that use disclosure index models. With a disclosure index model from one these papers, the disclosures of the oil companies in the sample can be examined and a score can be assigned.
3.4.1 Financial disclosuresOne of the first papers that uses an disclosure index model, is the paper of Singhvi and Desai (1971). Not to assess environmental or social disclosures made by companies but to assess financial disclosures. In total the authors used a model of 34 items, which then were given weights between 1 and 4. This based on information retrieved from the Committee on Corporate Information. By doing this a company could receive a total score of 68 points. `
The disclosure index model that was developed was made in such a manner that it reflected completeness, accuracy and reliability. From the score a formula was developed, that related the outcome of the index model with several variables: asset size, stockholders, listing status, CPA Firms, rate of return and earnings margin. This resulted in the following result: Assets had a positive relation with the index score (IS); stockholders had a positive relation with IS; companies that did not have to list anything had generally a lower score; a small CPA Firm usually resulted in a lower score; the rate of return had a positive relation on IS and companies with a lower earnings margin in general had a lower IS.
3.4.2 Environmental disclosuresOne of the papers that is often referred to when disclosure index models are used is the paper of Wiseman (1982) (Bewley and Li 2000; Cormier and Gordon 2001; Cormier and Magnan, 2003). She wanted to determine whether the environmental performance of a company was congruent with the environmental disclosures made by companies. To assess these environmental disclosures, she developed a method. This is one of the first environmental disclosure index models.For her model she used a sample of the 26 largest firms that could be found in the oil, steel and pulp and paper industry. A further selection was made on the availability of the counter variable: the hard numbers on environmental performance. These were made available by the CEP: Council on Economic Priorities. From these companies the annual report was used to test the environmental disclosures as “it is widely recognized as the principal means for corporate communication of activities and intentions to shareholders and is the primary source of environmental reporting by corporations” (Wiseman 1982, p.55).
The model was constructed by examining the environmental reporting literature. From this literature items were selected that were deemed to be important. By this 18 items were selected and an environmental disclosure index model was created. These items could be classified into the following categories: economic (factors that related to environmental expenditure such as: pollution control
28
expenditures), environmental litigation, pollution abatement (e.g. information on emissions) and other environmental factors (i.e. several factors that could not be classified into the previous categories).
Then she examined the disclosures and assigned a score to each disclosure. This was done by a 4-level scoring scale: 3 points for a quantitative measure, 2 points for non-quantitative disclosure, 1 for qualitative ‘general terms’ and 0 for not reporting on the item at all. Wiseman analyzed the disclosure-scores by double scoring them (i.e. another person checked the score for her).
Wiseman finds that oil companies in general had shorter disclosures opposed to other companies: “This finding may indicate the existence of industry-wide disclosure patterns for environmental reporting” (Wiseman 1982, p.60). In her final findings she cannot conclude there is a positive relationship between actual performance and the reflected performance.
Bewley and Li (2000) wanted to investigate the relation of corporate environmental disclosure in relation to five factors, consisting of: outsiders’ knowledge of environmental exposure, pollution propensity, political exposure, auditor quality and financial performance. The environmental disclosures are split up into two categories: general environmental disclosures and financial environmental disclosures. The latter one is the disclosures that are not as controllable as the former (although now with the development of a framework such as GRI, more guidelines could be applicable). For the measurement of the environmental disclosures, the authors used the Wiseman index, as used by Wiseman (1982). The same scoring method was also used: 3 being the highest score for each item (quantitative), while 0 was the lowest (not present). The score was split up into two scores: the financial score and the general score. The sample that was used consisted of 188 manufacturing companies that reported in Canada. They used these companies as most of them had some kind of environmental disclosure as they operate in a industry that is likely to cause some kind of environmental damage.The items that show significant results are the news items, pollution proxy for the SIC code, pollution proxy based on the NPRI database and the proxy for political exposure.
Cormier and Gordon (2001) investigated several electric utility companies (two publicly owned and one privately owned). This opposes many other studies that use large samples. The authors wanted to investigate whether the companies showed any significant differences in the disclosures of their annual reports. One of the variables that they employ is ENVIRDISAR. This variable shows a score that is derived from a disclosure index model that is based on the one developed by Wiseman (1982), only was updated. In total they use eight categories opposed to the four of Wiseman. This is done by adding: sustainable development reporting, land remediation and contamination, spills, environmental management and goals and targets. The authors use the same 4-level scoring scale.
Cormier and Magnan (2003) take another perspective on environmental disclosures. They derive that the level of disclosure also depends on the costs and benefits of disclosing. The benefits are expected to be the reduction in information costs by additional disclosures. The costs are expected to be the costs of disclosing proprietary information that is then also made available to competitors. Another factor is the environmental media visibility (the larger the stakeholder following, the larger is the effect). In total 50 firms were selected and in total for 6 years, 240 annual reports and 6 environmental reports were submitted.
29

The authors used an environmental disclosure index model to classify the reports. This index model consisted of 39 items. With these items they then try to explain several factors. They find that there is evidence that information costs and proprietary costs can be explained significantly by environmental reporting. However, there is less evidence for the third hypothesis: media visibility. Although this relation is not significant, there seems to be a relation.The 39 items are again based on the original environmental disclosure index model of Wiseman.
Van Staden and Hooks (2007) used a slightly different method. They used ranks from an independent ranking and compared them to given ranks based on scores from their own environmental disclosure index model. They did this to see whether there was a positive relation between actual performance and disclosures. Opposed to others they found this positive relation. The sample consisted of 32 companies in New Zealand.
Their measuring model was also an environmental disclosure index model. They say it was partly derived from elements as specified by the UN in their “SustainAbility” index. They also used items used in other studies with the first example being the one of Wiseman (1982). A difference with the model of Wiseman is that instead of using a scoring-scale of 4 points, they used a scoring scale of 5 points (with 4 being the highest and 0 the lowest). The scoring scale is nearly the same as those used in previous studies, only four points are awarded when a “truly extraordinary/benchmarking against the best practice” (Van Staden and Hooks 2007, p.202) was given. Additionally, not every category could get the same score. So although there were 32 items, the highest score was 100 instead of 4x32. The outcome of the study is that there is an actual proactive approach. Companies in their sample actually have a higher level of reporting when they are ranked higher by the independent ranking.
An explanation for the outcome can be the content of the sample. The authors say on this in the conclusion: “New Zealand is a small country with a positive environmental image and our study could therefore be seen as a controlled experiment in that we used companies that all faced the same environmental expectations” (van Staden and Hooks 2007, p.207).
Aerts and Cormier (2009) write that one limitation of the current literature is that many studies search for a direct relation between environmental performance and environmental disclosures: By doing this scholars omit other factors that can be adjusted by managers. The authors take into account press releases and economic based segments of annual reports. As the contra variable they use ‘direct legitimacy’. This as this form of legitimacy is broader than just for one incident or company. By this they want to investigate whether more disclosures (annual reports and press releases) are related to a higher level of (media) legitimacy. Secondly, they also investigate whether this relation is different (lower) for companies that operate in ESI (environmental sensitive industry): This as they often have a less high alignment and use the disclosures as a form of legitimacy. Their last hypothesis is set up to investigate whether the association between reactive press releases and environmental (media) legitimacy is higher than with proactive press releases.
The authors first establish what the difference is between annual reports and press releases, saying: “Press releases are among the most common and widespread communication vehicles used by public firms to disseminate voluntary information and their content is highly discretionary. Further, they differ from annual report disclosures in their capacity to process rich information and, consequently, may fulfil complementary communication goals” (Aerts and Cormier 2009, p.5). They also go on by saying that press releases in general are more for ‘tactical’ use, while annual reports are more ‘comprehensive and longer-term’. The press releases can be classified as ‘proactive’
30

or ‘reactive’. Proactive press releases are usually positive and try to build up a good image, while reactive press releases are usually defensive: Often published after negative attention.
The sample consists of 158 firms from Canada and the USA. The way they classify the annual report environmental disclosures is similar to previous studies (Wiseman 1982; Cormier and Magnan 2003). They use 39 items that can be divided into six categories. Like previous studies they also use the 4-level scoring scale, with 3 points being the highest and 0 the lowest score for each item.
Press releases had to be collected differently: Most could be retrieved from company websites (144 firms). The last 21 had to collected by using the ‘Lexis/Nexis’ database. In total 236 press releases were captured, of which 83 reactive press releases and 153 proactive press releases.
The findings of the research were that there was a proven significant association between annual report disclosures and reactive press releases and environmental (media) legitimacy. They also find that negative news legitimacy is a direct driver for more environmental press releases.On the contrary, proactive press releases do not seem to influence the legitimacy. This as ‘narcissistic’ behaviour is expected from companies.
3.4.3 Additional factors: litigation and monetary and non-monetary information Cho and Patten (2007) assess that there are still some contradicting studies on the topic of environmental performance and environmental disclosures of companies. Some studies find that companies that are classified as ‘bad performers’ by rating institutions show high levels of environmental disclosure (Hughes et al., 2000; Hughes et al.,2001), while other studies find an opposing relationship (Al-Tuwaijri et al., 2004). They argue that one should not take any litigation related disclosures into account. This because these disclosures are mandatory and a company cannot influence them. As managers cannot influence them, it can also not change the legitimacy of companies. Next to this they also account for differences between monetary and non-monetary disclosures. As some firms are reluctant providing monetary information, as this information can be used by competitors.
The authors name their disclosure index model items, ‘environmental disclosure content analysis items’. It contained eight items, with four items relating to monetary disclosures and four to non-monetary disclosures. Subsequently the 10-K reports of 81 firms were examined. It turned out that worse environmental performers compensated by disclosing more environmental information.The authors also examined different industries resulting in two groups: non-environmental sensitive industry companies and environmental sensitive industry (ESI) companies. ESI companies were companies that could be found within SIC codes 13xx, 26xx, 28xx, 29xx and 33xx. Within the non-ESI group there was a significant higher level of monetary disclosures, while within ESI there was not. Opposed to this, there was a significant higher level of monetary environmental disclosures by worse environmental performers in the ESI group compared to better environmental performers in the ESI group and the counterparts in the non-ESI group.
3.4.4 Model for this studyAfter discussing several previous studies with different kind of investigations, we can now derive our own model. One of the similarities between the existing studies is that in general they use the same way of classifying environmental reporting. This is both done for the way in which items receive scores as for the model that is used in the research.
31
A study that is often referred to in developing environmental disclosure index models is the one of Wiseman (1982). She developed a model that is still used, although in a different format. Authors such as Cormier and Magnan (2003) and Aerts and Cormier (2009) used an adjusted version, this as environmental disclosures have changed during the last 29 years. The differences between the previous two studies are minimal. They both use 39 items, classified into six different categories.As the models used in environmental reporting have not changed that much over the last eight years, the model that is used in Aerts and Cormier (2009) will also be used in this research. The full model can be found in Appendix 3.
Next to the model, another similarity that was found was, the way of assigning a weight to the items that were disclosed by companies. Many studies use the same way of classifying (Wiseman, 1982; Cormier and Gordon, 2001; Aerts and Cormier, 2009). As ascertained in many studies, quantitative disclosures are in general more useful to users of disclosures than non-quantitative disclosures. Therefore a difference is made in the points that are assigned when classifying them. Next to quantitative disclosures, a company can also use qualitative disclosures. Also here one differs between extensive/specific and ‘general’ disclosures. The respective points that then are often assigned are 3;2;1 points. For no disclosure 0 points are awarded. As this method is often used within the literature, the same scoring scale will be used within this study.An overview of the literature discussed in chapter 3 is given in Appendix 1.
3.5 Conclusion In this section, the literature available on environmental and social disclosures was reviewed. First, the more general literature on this reporting process and the link with legitimacy theory, were investigated. In the paper by Anderson and Frankle (1980), the first link was established with an improved return on investment. From that time more and more literature came available as more companies were disclosing this type of information. These papers often concluded that additional non-financial reporting should become mandatory to create a more comparable situation. This idea was rejected by Larrinaga et al. (2002), who found that although Spanish authorities made it mandatory, there were still many companies that did not comply. In Clarkson et al. (2008) many other studies were contrasted stating that most of the environmental disclosures could be explained by economic theories, not socio-political ones (e.g. legitimacy theory). However, many other studies show that legitimacy theory still holds, such as in Cho and Patten (2007).In the third paragraph, the papers that were reviewed were more case related. The first case was related to the Exxon Valdez oil spill. Patten (1992) found that although some other oil companies were not directly related to Exxon, they still increased their environmental and social disclosures. He also found that the increase was significantly related to the size of the firm and having a partial ownership in a company that had to respond to the oil spill.Also in Islam and Mathews (2009) investigated an ‘incident’: bad publicity from the Wall Street Journal. It was directed towards a Microfinance Institution from Bangladesh, the Grameen Bank. The authors found that they significantly increased their additional disclosures. In the final paper, (Islam and Deegan, 2010), it was found that two global retailers also increased their disclosures after more media attention. Thirdly, a separate paragraph discussed several papers that used environmental disclosure index models. From one, Aerts and Cormier (2009), the disclosure index was derived that will be used in this study.All papers used in this chapter were summarized in Appendix 1.
32
4. The BP oil spill
4.1 IntroductionIn this chapter I will discuss the background of the BP oil spill – also known as the Deepwater Horizon oil spill. Both terms will be used interchangeably. This as the oil spill is the reason for this research. In the second part a general overview of the BP oil spill is given. In the third paragraph the parties that were involved and their responsibility are examined.
4.2 An overviewAs part of their normal operations BP leased an oil rig, the deepwater horizon, from Transocean Ltd. for a period up to 2013. This resulted in BP having control over the oil rig and using it for their normal operations in the Gulf of Mexico. Next to the lease of the oil rig, BP also leased the Mississippi Canyon Block 252 and the Macando Well (See Figure 5) was located within this block.On 20th of April 2010, it went all wrong due to 8 main reasons as identified by BP in their own report (BP, 2010). These reasons were:
1. On the 19th of April 2010, BP pumped down cement to make sure that no hydrocarbons would escape. As this cement was a special light and foamy form, this resulted in that the hydrocarbons could escape the cement.
2. A second barrier that had to prevent of hydrocarbons entering the process also failed.3. A test that had to establish whether something was wrong (see reasons 1 & 2), showed that
something could be wrong but this was interpreted differently by the BP employees.4. The crew could only respond after the hydrocarbons had passed the Blow-out-preventer and
were rapidly coming up to the surface.5. As a response to the incident the BP personnel decided to redirect the stream to a special part
called the ‘mud gas separator’. This was to stop the flow of the hydrocarbons. When they had just diverted the stream overboard, BP could have had more time to restore normal production.
6. The mud gas separator diverted the hydrocarbons directly to the oil rig.7. The hydrocarbons were diverted to areas of the oil rig that could ignite the gas.8. The blowout preventer did not work when it had to work.
Figure 5, Location of the Deepwater Horizon incidentSource: Created with ESRI ArcGIS 9 Software
33

As one can see in the eight reasons, BP says that the deepwater horizon oil spill was caused by a series of events rather than just one reason. In Figure 6 one can see the eight factors presented graphically with certain critical factors in the process.
Figure 6, Eight reasons of the incident and critical factorsSource: (BP 2010, p.32)
In Figure 7 one can see a graphical representation of the incident and what went wrong in the Macando Well.
Figure 7, The Macando well and reasons of the incidentSource: (BP 2010, p.12)
34

Due to the failure of the eight steps that should have prevented the incident, the hydrocarbons could escape and this resulted in an explosion and the leak. The explosion resulted in the loss of eleven lives and another 17 were injured. The fire only ended after 36 hours. After which the Deepwater Horizon sank. After that, the well remained open for another 87 days.
In total the Deepwater Horizon oil spill was the largest accidental oil spill ever recorded4: Even larger than the Exxon Valdez oil spill on the coast of Alaska in 1989. In total 4.9 million barrels of oil leaked out of the Macando Well (whereas the Exxon Valdez lost significantly less, although there are still some disputes on the exact amount5).
At the beginning of the day of the incident the BP share price was 655 pence, while on the 25th of June it was only 296 pence (a decrease of 54.8%).
4.3 ResponsibilityThe explosion on the deepwater horizon and the subsequent oil spill resulted in damage that affected a great part of the Gulf of Mexico. This resulted in companies and individuals losing nature that usually provides them with income. Here one can think of the tourist industry and fishing industry. BP tried to limit the environmental damage by “removing oil from the surface of the Gulf, preventing oil from reaching the shoreline and cleaning up any oil that did reach the shores” (BP, 2011).
BP was given the main responsibility for the deepwater horizon oil spill6. Although the National Commission (2011) that investigated the incident stated in their report to the President: “BP, its partners (Anadarko and MOEX), and its key contractors (particularly Halliburton and Transocean) face potential liability for the billions more necessary to restore natural resources harmed by the spill.”Transocean being the owner of the oil rig and Halliburton assisted in injecting cement (see section 4.2, reason 1).
As part of this responsibility they set up a special entity: “Gulf Coast Claims Facility” (GCCF). As of 31st of December, 468,869 business and private claimants put forward their claim and this resulted in settlements of 2,776 million dollars. Next to these claimants, some claims also came from government organisations and these summed up to 550 million dollars (BP, 2011).Next to this entity, BP also established the Deepwater Horizon Oil Spill Trust that will have a 20 billion dollar fund for potential claims. This trust will be open up until 2016. Any money that remains will be refunded to BP.In total 40.9 billion dollars was charged (pre-tax) in 2010 to assist in solving the BP oil spill. “This comprises costs incurred up to 31 December 2010, estimated obligations for future costs that can be estimated reliably at this time, and rights and obligations relating to the trust fund” (BP, 2011).
4.4 ConclusionIn this chapter a short overview was given on the incident central to this research: the deepwater horizon oil spill. In the second paragraph an overview was given with the eight reasons stated that
4 http://www.telegraph.co.uk/finance/newsbysector/energy/oilandgas/7924009/BP-leak-the-worlds-worst-accidental-oil-spill.html# 5 http://www.adn.com/2010/06/05/1309722/size-of-exxon-spill-remains-disputed.html# 6 http://www.politico.com/politico44/perm/0410/cabinetlevel_oil_spill_meet_bcb87e48-b21e-4b72-8716-3d3a87ac7ffa.html
35

caused the explosion and fire on the deepwater horizon. Also information on date and casualties is given.The third part discusses the responsibility of the oil spill, with the American government naming BP as the main company against claims can be made.
36

5. Hypotheses development and research design
5.1 IntroductionIn this chapter the hypotheses and the research design will be discussed. For this, theories as seen in chapter two and the findings in the literature in chapter three will be used. In the second section the hypotheses that will be used in the final research will be defined. In the third section the research and sample will be defined.
5.2 HypothesesThe hypotheses that will be used in this research will be derived from the previous theories that were discussed in chapter two of this thesis. In this chapter there were four main theories presented: legitimacy theory, stakeholder theory, institutional theory and media agenda setting theory. Next to these theories the so called GRI, Global Reporting Initiative was discussed. This initiative was started to make a standard, often an issue of which scholars thought of being a prerequisite to come to a more transparent way of corporate responsibility reporting. Legitimacy theory predicts that companies will disclose more information when their legitimacy is affected. This often is done more in relative sensitive industries, compared to industries that are not that sensitive. An example of when a company’s legitimacy is affected could be after an incident, in this case the BP Deepwater Horizon oil spill. Patten (1992) even found that oil companies that were not related to such an incident responded by trying to legitimize themselves. They did this by increasing their annual report environmental disclosures.Next to this, the topic had been discussed extensively by the media. An International journalism website found that in the 100 day period after the oil spill it was the number 1 news story, accounting for 22% of all news7. Based on Patten’s research, together with the legitimacy theory and media agenda setting theory, the first hypothesis is derived:
Hypothesis1: Companies in the oil sector will increase their environmental disclosures in 2010compared to 2009.
Patten (1992) also investigated whether the size of the company and being part of Alyeska had any influence on the level of disclosures made. Patten investigated this by using a regression model. After this he did the regression with these two factors with respect to the change in the disclosure level from the year after the incident with the year before the incident as seen in section 3.3. Both items were positively significant at a 0.05 levelWith the BP oil spill there was no joint-venture partly responsible, as Alyeska was with the Exxon Valdez. I will control for the size as Patten did, but there was no specific joint-venture partly responsible. Instead the investigation will focus on the difference in score changes between US companies and non-US companies. This is because, as the incident occurred in the US and therefore the companies closer to the disaster could be expected to feel the need to legitimize more.This gives the second hypothesis:
Hypothesis2: There is a positive relation between company size and the increase of environmental disclosures, and whether the company location is US or not.
7 http://www.journalism.org/analysis_report/100_days_gushing_oil
37

The relation with the study of Patten is made, as the BP oil spill will now be the explaining factor leading up to this possible increase.
5.3 Research and sampleThe study is partly based on the study by Patten (1992) where the disclosures of other oil companies after the Exxon Valdez were examined. However, social and environmental disclosures were minimal before the first half of the 1990’s (Islam and Deegan, 2010; KPMG, 2005; KPMG, 2008; KPMG, 2011) and maybe therefore a significant increase was expected. Now CSR reporting and environmental disclosure reporting is practiced by more and more companies and this might result in the same level of additional disclosures by these firms. It is therefore interesting to see whether any changes have occurred in the relation between incidents and disclosures over 19 years time.
Annual reports of the firms within the oil sector will be used to examine the difference between the two years. The annual report is often used to get an idea of how the company is performing, both financially as non-financially. As not every company published a CSR report, and some companies that publish them had not published them at the time of the study, I decided to use the annual reports. Some studies also only use annual reports (e.g. Patten, 1992; Islam and Deegan, 2010), while others would also use other disclosures such as press releases (e.g. Aerts and Cormier, 2009).
The sample that will be used in this research will consist of 17 oil companies that can be found in the same SIC category. This is SIC category 2911. BP is classified within this category, but also many other large companies such as Chevron and ExxonMobil. Although these 17 companies will reflect a great part of the oil sector, it is still a relatively limited sample. One important issue is that BP will be included in the research. Subsequently, the hypotheses are tested both with BP in the sample and without BP.
The sample was retrieved by using the SIC code 2911 (‘Petroleum Refining’). Here the full list was first used and subsequently companies were selected. This was done by using the following conditions to include or exclude companies from the sample:
- Companies had been publishing up to 2009. Companies that stopped publishing before this year cannot be examined as we need both the 2009 and 2010 documents. This condition is included as many companies are listed that are not operating anymore.
- Companies that published their annual reports on 10-K or 20-F forms should do so in the first 5 months of the year. This deadline was taken as companies that only publish after this date cannot be used for this thesis.
- Companies that were a financing entity and related to a main corporation were excluded. Instead the main corporation that operated in the Petroleum Refining industry was taken.
- Companies would end their fiscal year in December. (In EDGAR SIC database: ‘Fiscal year: 1231’)
- They should publish an ‘annual report’ next to the ‘basic’ 10-K form. Only companies that had separate annual reports where examined. This requirement was included because annual reports are less regulated and give management more opportunity to give their opinion by means of voluntary information.
See Appendix 2 for the sample that will be used in the study.
38
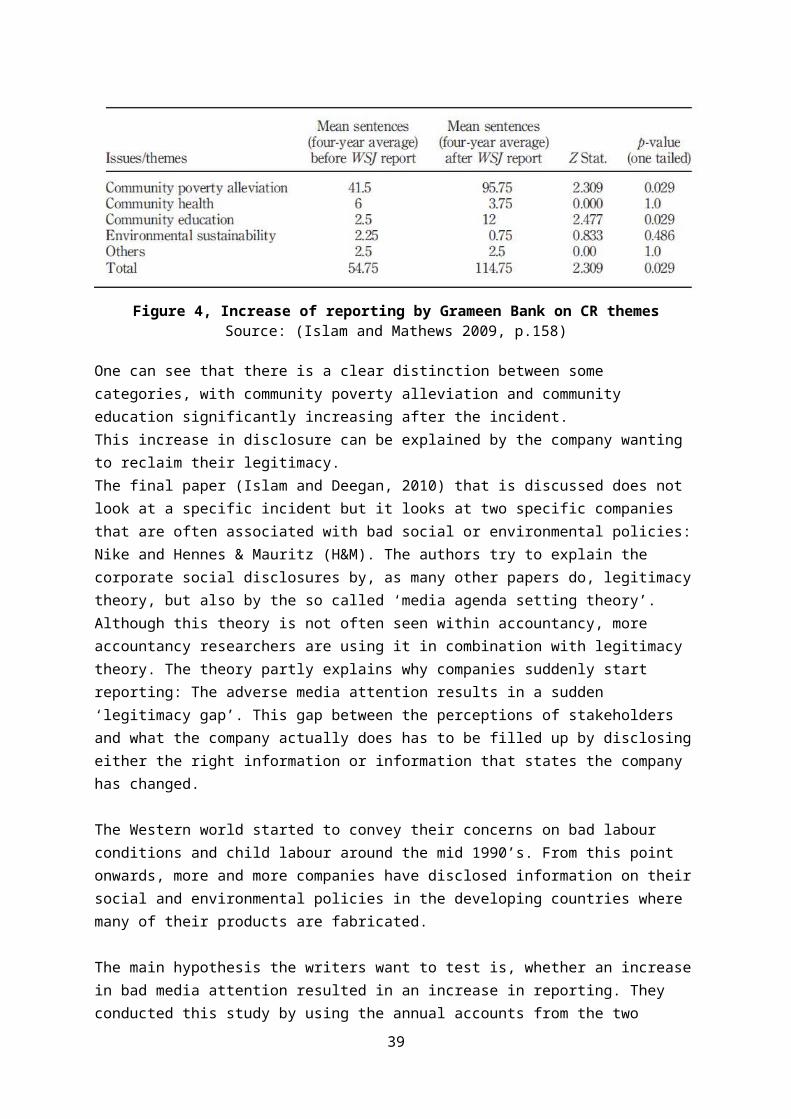
5.4 Methodology A disclosure index model as discussed in the paper by Aerts and Cormier (2009, p.24) will be used. With this disclosure index study, a thorough examination of the reports can be made. A disclosure index model examines whether certain items are included in the disclosures which are provided by the companies. Although this then would imply that merely disclosing specific items would increase the quality, no better method has been developed. Botosan (1997) says on this “researchers tend to assume quantity and quality are positively related. This assumption seems justified given the importance of managers' reporting reputations and the constraints placed on managers by legal liability”.
The scope of the study that is investigated here is environmental reporting. This is because companies, according to the legitimacy theory, would want to report on their environmental performance. This is a clear boundary and other information will not be taken into account.
The same score-method as in the research of Aerts and Cormier (2009) will be used: When no information is given the score will be 0. When the company provides general qualitative information the score will be 1. When the company provides extensive qualitative information the score will be 2. When the company provides quantitative information the score will be 3. This, as “precise information is more useful and may enhance management’s reporting reputation and credibility”, Botosan (1997, p.334).Each company will get a certain environmental total score for each year, EN_TOTAL_SCOREj,t. This EN_TOTAL_SCORE is created by accumulating all individual points that are given to separate indicators and categories: EN_SCOREi. This can be shown by:
EN_TOTAL_SCOREj,t = ∑ EN_SCOREi,j,t
Subscript i indicates the individual scoring item, j indicates the company and subscript t indicates the year (in this study either 2009 or 2010).
For hypothesis 1, one can estimate whether an increase in disclosures has occurred by using a t-test. This will be based on the outcomes of the disclosure index study.
A regression analysis will be made to test hypothesis 2. This regression will consist of two factors: size and whether the company is an US-company or not.
EN_TOTAL_SCOREj, 2010 - EN_TOTAL_SCOREj, 2009= a1 + b1Size + b2Country
Where:Size is the logarithm of the revenue from 2010, as also used in Patten (1992);Country is whether the company is an US-company (1) or not (0)
5.5 ConclusionIn this chapter the upcoming research was outlined. In the second paragraph, the H1 and H2 hypotheses were derived. In the third part it was explained why these hypotheses are tested and how this will be done. Then, the model that will be used in this research was presented. It is a disclosure index model. The model was derived from a previous study that also used an environmental disclosure index model.
39

6. Results and analysisIn this chapter the outcomes of the investigation will be presented. First some descriptive statistics will be presented. After this the statistical results of the study will be discussed.
6.1 Descriptive resultsThe analysis of 34 annual reports returned a large set of data. This data can be found in Appendix 4. More non-company specific descriptive statistics of the overall outcomes can be found in Table 2. The statistics are organized in the way the model categorises them: ER (expenditures and risks; range 0 – 27 points), CLR (compliance with laws and regulations; range 0 – 15 points), PA (pollution abatement; range 0 – 18 points), SD (sustainable development; range 0 – 9 points), LRC (land remediation and contamination; range 0 – 15 points) and EM (environmental management; range 0 – 30 points).
N=16 ERCLR PA SD
LRC EM EN_TOTAL_SCORE
Average score 2009 7.63 7.06 5.31 1.13 6.31 3.88 31.31Median score 2009 7 7 6 1 6 3 30.5Lowest score 2009 1 1 0 0 1 0 12Highest score 2009 15 13 8 3 11 12 55Standard deviation 2009 4.36 3.94 2.06 0.96 3.63 3.14 11.76 Average score 2010 8.25 7.81 6.19 1.44 6.94 5.00 35.63Median score 2010 8.5 9 7 1 7.5 4 36.5Lowest score 2010 2 1 0 0 2 0 8Highest score 2010 14 14 9 4 11 13 56Standard deviation 2010 3.73 4.75 2.46 1.36 3.15 4.24 11.99 Average increase score % 8.2 10.6 16.5 27.8 9.9 29.0 13.8
Table 2, Non-company specific descriptive statistics
The first change that can be seen is the difference in the average scores, from 31.31 on average in 2009 for the total score, to 35.63 in 2010. This is an increase of 13.8% in one year. Within the categories, EM, SD and PA provide the most of the increase with respective percentage increases of 29.0%, 27.8% and 16.5%. EM and SD both are classified as social-based categories by Aerts and Cormier (2009, p.17). Later, a test will examine whether social-based indicators move more than economic-based ones.
Looking at the median, the differences are illustrated even more. Five of the six categories increase their median and one category remains the same. This results in the median changing from 30.5 in 2009 to 36.5 in 2010. Also the highest and lowest scores that can be found within each category tend to increase: The highest total score from 55 in 2009 to 56 in 2010. An outlier in the general increase from 2009 to 2010 is the decrease in the lowest total score, which decreases from 12 in 2009 to 8 in 2010.
Finally, there is a slight increase of the standard deviation from 11.76 in 2009 to 11.99 in 2010. This can be seen in the larger spread between the highest and lowest score.
40
The scores that were assigned to BP are excluded from the descriptive statistics. BP scored 47 points in 2009 and this score increased to 74 in 2010. This is an increase of 57.45%. This increase can be explained by both mandatory information that they had to report with respect to the oil spill, but also additional voluntary information. A whole section of the annual report was dedicated to the oil spill (6 pages). Next to the separate section, references were made to the incident in the other parts of the 2010 BP annual report.
If the above results are compared to the descriptive results of Aerts and Cormier (2009, p.12) there are some differences. I chose to compare the descriptive results with their article as they use the exact same model. They use the classification used by the S&P 500 to present their outcome. Therefore I compare my results with their category ‘Energy’. The ‘S&P Sector Indices: Equity Indices’ classifies Energy as “Companies engaged in the exploration, production, marketing, refining and/or transportation of oil and gas products, coal and other consumable fuels” and this therefore seems the most appropriate category for comparison.
Their sample consists of 13 companies. The average scores assigned to the categories: ER, CLR, PA, SD, LRC, EM and the total score are 14.14, 8.41, 11.90, 3.49, 18.00, 4.68 and 60.63 respectively. These findings differ in their averages from my findings. A possibility is that their team of classifiers were more lenient while assigning scores and therefore their sample received higher scores.
Next to the summary statistics given in Table 3, the relations between the several statistics can be further investigated by presenting a correlation table: The several ‘Pearson Correlations’ are shown in Table 3 on the next page.
41

Correlations ER09 CLR09 PA09 SD09 LRC09 EM09 Total09 ER10 CLR10 PA10 SD10 LRC10 EM10 Total10
ER09 1 0.606** -0.038 -0.132 0.934** 0.074 0.865** 0.923** 0.604** 0.107 -0.262 0.842** 0.043 0.755**
CLR09 1 0.425 -0.232 0.689** -0.231 0.766** 0.543* 0.923** 0.302 -0.538* 0.650** -0.259 0.614**
PA09 1 0.385 -0.032 0.275 0.398 -0.011 0.436* 0.806** 0.138 -0.131 0.245 0.402
SD09 1 -0.166 0.671** 0.150 -0.196 -0.302 0.415 0.721** -0.196 0.509* 0.115
LRC09 1 -0.072 0.847** 0.801** 0.692** 0.083 -0.406 0.906** -0.095 0.698**
EM09 1 0.297 0.054 -0.158 0.384 0.496* 0.013 0.896** 0.410
Total09 1 0.768** 0.756** 0.443* -0.188 0.774** 0.223 0.890**ER10 1 0.548* 0.031 -0.206 0.727** 0.118 0.744**
CLR10 1 0.409 -0.521* 0.694** -0.073 0.748**
PA10 1 0.332 0.019 0.365 0.548*
SD10 1 -0.489* 0.530* -0.030
LRC10 1 0.005 0.714**
EM10 1 0.498*
Total10 1
Table 3, Pearson correlations of the different categories (one-tailed, significant at 1 %(**) and 5 %(*))
42

Several correlations between variables can be found. The correlation between the total scores of the two years (Total09 and Total10) can be seen clearly (.890, at a significant level). An explanation for this could be that companies that provide many environmental disclosures one year will not suddenly change the second year.Next to this, all the other 2009 variables are correlated significantly with the variables of the following year.
Besides the non-company specific descriptive statistics which show the changes in the whole sample, there are also more company specific descriptive statistics. These statistics show the percentage increase or decrease of the scores assigned to the companies. Only the total scores are shown.
The company specific descriptive statistics can be found in Table 4. I decided only to include the overall increases in the scores from 2009 to 2010 assigned to the companies instead of the separate categories. This as several categories have a low maximum score and therefore small increments could lead to high percentual increases.
Companyj / Scoresi
% change EN_Total_Score
Alon USA Energy 2,8BP PLC 57,4Chevron Corp. 16,7China Petroleum & Chemical Corp (Sinopec) 25,0ConocoPhillips 12,5CVR Energy -4,3Exxon Mobil 56,3Frontier Oil corp 14,7Hess 44,1HOLLY CORP 16,1Marathon oil corporation -4,3Murphy Oil Corporation 33,3Royal dutch shell 1,8Statoil 50,0Suncor Energy 12,5Sunoco 2,5Valero -33,3
Table 4, Company specific descriptive statistics: % change in total score
All firms have different scores for the two years. In total three of the seventeen have lower scores and fourteen have higher scores. BP has the largest increase (57.4%) and Valero the largest decrease (-33.3%). There are some companies that just have slight changes (+-5%) in their scores. These are Sunoco, Shell, Marathon, CVR and Alon USA.
43

Alon USA
BP Plc.
Chevron Corp
.
Sinopec
ConocoPhillip
s
CVR Energ
y
Exxon M
obil
Frontier
Oil corp Hess
Holly Corp.
Marathon O
il Corp.
Murphy O
il Corp.
Royal Dutch
Shell
Statoil
Suncor E
nergy
Sunoco
Valero
01020304050607080
20092010
Figure 8, Total scores of the sample companies in 2009 and 2010
The column chart in Figure 8 illustrates the increase of BP compared to the other companies. Only Royal Dutch Shell had a higher score in 2009 compared to BP, but in the following year the 74 points assigned to BP was the highest given score. Valero on the other hand had the lowest assigned score and in 2010 their score even decreased to 8.
6.2 Statistical resultsThe first hypothesis was “Companies in the oil sector will increase their environmental disclosures in 2010 compared to 2009”. To test this hypothesis we will use a dependent (also known as paired) student t-test, this is because the same subjects are tested for different years. Next to examining the overall scores, also the separate categories are compared to each other. The outcomes that are presented by SPSS, a statistical software package, are listed in Appendix 5. A significance level of 5% (*) is used in the tests, and if achieved a 1 %(**) level.
Table 5 lists the outcomes of the student t-test.
44

Outcome student t-test: Differences in mean environmentaldisclosure between 2010 and 2009 (n=16;df= 15)
Average Disclosure
Standard Deviation
ER09 7,63 4,365ER10 8,25 3,733p-value 0,082 CLR09 7,06 3,941CLR10 7,81 4,750p-value 0,066 PA09 5,31 2,056PA10 6,19 2,455p-value 0,015 * SD09 1,13 0,957SD10 1,44 1,365p-value 0,103 LRC09 5,50 3,628LRC10 6,94 3,151p-value 0,063 EM09 3,88 3,138EM10 5,00 4,243p-value 0,020 * Total09 31,3125 11,763Total10 35,625 11,994p-value 0,004 ** Table 5, Outcomes student t-test comparing 2010 with 2009
Of the six sub categories, two are significant. These are the pollution abatement (0.015, p < 0.05) and environmental management (0.020, p < 0.05). The other four categories come near the significance level of 5% but are not significant. When the overall score is investigated, it can be seen that there is a significant increase at a 1% level (0.004, p <0.01). The increase in the scores of the companies differed significantly from 2009 to 2010.
Comparing these outcomes with Patten (1992), the reference study used for this study, we can conclude that large (all companies are publicly listed companies) companies within the oil sector still react to a large incident within their industry by disclosing more the year after the incident. This can be seen as companies have increased their overall environmental disclosures (KPMG, 2005; KPMG, 2008; KPMG, 2011). On the other hand Cho and Patten (2007, p.646) found in 2007 that: ‘companies do appear to use financial report environmental disclosures as a legitimizing tool”.
A main theory in both the previous studies is the legitimacy theory. This theory has already been described in chapter two. The outcomes of this test are as predicted by theory. Companies that see their ‘legitimacy to operate’ threatened by an incident, will increase their disclosures. In this particular
45
instance this is done by increasing environmental disclosures. Companies that currently make a profit and operate within society do not want to lose their ‘social contract’ with their stakeholders. Whether or not this differs for different type of stakeholders cannot be said. The only publications that I investigated were the annual reports and so no different disclosures for different publications could be tested.
A factor that could have influenced the outcome is the media. They played an important role in bringing information to households on the Deepwater Horizon oil spill. Similar cases are explained by previous articles (Islam and Mathews, 2009; Islam and Deegan, 2010). This in turn could have had a result on the disclosures made by the companies.
Aerts and Cormier (2009) then make a distinction between two types of information embodied by the six indicators from the model. On the one hand, economic-based disclosures, on the other hand ‘social-related’ disclosures. The first one can be found in the items ER, CLR, PA and LRC, while the ‘social-related’ disclosures can be found in SD and EM.
Also Clarkson et al. (2008) discuss the differences between economic-related and social-related disclosures. They find that companies that need legitimization will increase their social disclosures. They cannot find this relation for economic-related disclosures.
Table 6 shows the outcome of the two additional tests.
Outcome student t-test: Differences in mean environmentaldisclosure between 2010 and 2009 for economic and social items (n=16;df=15)
Average Disclosure
Standard Deviation
Economic09 26.31 11.306Economic10 29.19 10.962p-value 0.003 ** Social09 5.00 3.847Social10 6.44 5.099p-value 0.021 *
Table 6, Different types of disclosure items
Both the economic disclosure items as well as the social items are found to be significant. The economic disclosure categories at a 1% level, the social disclosure categories at a 5% level (0.021, p < 0.05).
This outcome is partially in line with the outcome of Clarkson et al. (2008). As companies feel the need to legitimize themselves the social-related disclosures are increased. They name them “soft disclosures”, and they are easier to make than ‘hard disclosures’ which need the backing of actual facts. Opposed to Clarkson et al. (2008), I also find an increase in the “hard disclosures”, which is significant even at a 1% level (0.003, p < 0.01).
46
When comparing the outcomes of my study to Aerts and Cormier (2009) more similarities can be found. First of all, they find that general environmental disclosures do indeed help companies to positively improve the legitimacy of companies, where this relation is to the largest extent influenced by the economic annual report disclosures. This outcome implies that the finding in Table 6 (economic disclosure items increase significantly at 1% level) aligns with the previous findings. Suggesting that companies increase economic annual report disclosures in a time when legitimacy needs to be regained, as can be seen here.The authors name the economic disclosures which can be found in annual reports (and reactive press releases) “perception management tools”. However, no significant relation can be found for the two social categories of the disclosure index model with media legitimacy: This suggests that the increase (that can be found in the results of social disclosures in the annual reports) will not affect the legitimacy of the company. It can be seen that companies from this study do not differ that much between economic and social disclosures, since they both increase significantly.
For hypothesis two, I wanted to test whether company size (measured as the natural logarithm of the revenues of the companies in 2010) and location, were related to the change of company scores. Patten (1992) also examined whether larger companies had a larger increases in their scores. Next to this he also examined whether companies which were related to Exxon via the joint-venture that was responsible to respond to any oil spill had a higher level of disclosure. As this is not the case with BP, I investigated whether companies from the US (where the accident happened and are therefore related by the location) increased their disclosures by a higher amount than companies that have their base somewhere else in the world.
As opposed to the significant results that were found using the t-test, the regression shows no significant results: Both the ‘Size’ and ‘Country’ variables do not significantly explain the increase or decrease in total score. A summary of the outcome is listed in Table 7.
Results for the regression analysis (n=16) Model: change = a1 + b1Size + b2Country
Multiple R 0.217 ANOVA d.f.Sum of Sq.
Mean Sq.
R Square 0.047 Regress 2 21.952 10.976Adj. R Sq. -0.099 Resid 13 443.486 34.114St. Error 5.841 F=.322 Sig. F 0.73 B Sb Beta t Sig. tConstant -0.123 26.946 -0.005 0.996Size 0.249 1.047 0.070 0.238 0.816
Country -2.244 3.661-
0.180 -0.613 0.55Change = EN_Total_Score 2010 - EN_Total_Score 2009
Size =Log revenues for 2010
Country = 1 for US companies; 0 for Non-US companiesTable 7, Results of the regression analysis
It appears from these outcomes that company size does not influence the level of additional disclosures after an incident anymore (.816, p > 0.05).
47

If these results are compared to the study by Patten, there are differences. A main difference is that Patten does find a significant result for both his independent factors that are entered in the model: ‘Size’ and ‘Alyeska’. For ‘size’, a p-value of .0225 was found (significant at 5% level) and for ‘Alyeska’, a p-value of 0.0347 was found (significant at 5% level). Both variables are related by this to the increase from the disclosures of the companies in the sample from 1988 to 1989. This resulted in an adjusted R2 of 43%. This suggests that the two variables (Size of the company; membership of Alyeska) explained 43% of the change between the two years.
The results in this study show another outcome. Both variables are not significant and therefore do not explain which companies increase their disclosures around an incident most. So larger companies in 2010 do not increase their disclosure after an incident to a larger extent than small companies (p- value was .816). This was different in Patten his study, where larger companies increased their disclosures significantly more than smaller companies.The disclosures for the following year were also influenced by whether the company was a member of Alyeska or not. As no other company from our sample was responsible for the oil spill this factor could not be compared. Instead the location of the companies was tested: US against non-US companies. Also for this test no significant difference could be found between 2010 and 2009(p value is .55). The overall model has an R2 of .047 and an adjusted R2 of .01.
One should consider that companies are different nowadays compared to companies at the end of the 1990’s. This is illustrated by Table 1 in chapter two. Here only 12% of the largest 100 companies for individual countries had a corporate responsibility report (compared to 64% in 2011). The contrast is even larger for the Global 250 largest companies: In 1993 none of them had a corporate responsibility report while in 2011 95% of the companies published one. Although a CSR report does not directly explains why companies had less environmental disclosures, indirectly it shows how companies thought more about the environment. Today another approach can be expected: Partially because the companies already accumulated many disclosures about the environment over the years. Many of these are also used in the year(s) after. So when companies increase their disclosures, the increase might be less related to size than previously.
For the second factor another explanation is required. The factor ‘Alyeska’ which Patten used was different with the factor ‘Country’, in that ‘Alyeska’ measured whether companies that were partially responsible for the oil spill, increased their disclosures to a larger extent. The factor ‘Country’ assesses whether companies in the US increased their score to a larger extent than non-US companies.Therefore the two factors are not one-on-one comparable.It seems that US companies did not increase their scores more than non-US companies. A possibility is that the Deepwater Horizon oil spill was a relative large incident, that media over the whole world gave the spill attention. Therefore all companies and stakeholders of the companies knew about it and thus it was more a global problems than a local problem.Another explanation is the sample itself. All companies that are included in the sample are large listed companies. These companies have operations all over the world and therefore their largest operating sites are far away from their historic locations. The fact that they are all listed in the US could also contribute to the finding. This would mean that a large group of the stakeholders of the companies (irrespective of historic location) were also located in the United States.
A problem often seen in regressions is multicollinearity. Multicollinearity is the problem that several factors are to a large extent correlated with each other. When testing for multicollinearity in the
48
regression one can use the “VIF score” (Variance Inflation Factor). Both variables return a score of 1.179. A VIF score of 3 or higher could be an indication of multicollinearity (Field 2005, p.175). Therefore this is not the case.
To assess whether the assumed relation between size and overall score still holds, I will conduct another two tests. These tests measure whether there is still a relationship between size and location of the company and the scores. The dependent variable is now the absolute scores that were assigned in 2009 and 2010 instead of the change in scores.
Both 2009 (p-value of .434) as 2010 (p-value of .420) have no significant relation between the two variables. This means that larger companies do not always have higher score. Also US companies are not likely to have larger absolute score than non-US companies.
This outcome could be explained by the finding of Botosan (1997). She found that (smaller) companies with a lower analyst following could significantly decrease their cost of capital if they would report more. If companies would have applied this strategy, the difference in disclosures between smaller and larger companies should have decreased.Also one should take into account that all the companies in the sample are already relatively large and so the differences between them could be minimal.
The outcome of the additional tests can be found in Table 8. Again, the more extensive SPSS results can be found in Appendix 5.
Summary of the test outcomes 2009 2010R 0.347 0.354R Sq. 0.120 0.125Adj. R Sq. -0.015 -0.010F-value 0.890 0.929P-value 0.434 0.420
Table 8, Outcome of the additional regressions
49

7. Conclusion
7.1 Summary and findingsIn this thesis social and environmental reporting around incidents has been discussed. This is a phenomenon that has affected many companies in their voluntary disclosures. Many of these companies make these disclosures on a voluntary basis and are not required to make these (although some nations made it obligatory, e.g. Spain).
In the first chapter of this thesis an introduction was given to the topic: the shift from only financial reporting to a more broad form of reporting. It also explained to whom the company reports: the stakeholders. Then the topic was split up and one general and several sub questions were defined. Thirdly the structure of this thesis was outlined.
In the second chapter, the theories behind voluntary social and environmental reporting were looked at. Four main theories were identified: legitimacy theory, stakeholder theory, institutional theory and media agenda setting theory. All four theories attempt to demonstrate why companies would disclose information on a voluntary basis.Legitimacy theory does this by stating that a company has an implicit social contract with society. They have to align themselves with this contract when they operate within society. When they do not do that, their legitimacy is damaged and they will have to restore this. This is where social and environmental disclosures emerge. They will emphasize the measures which they have in place or have taken to ensure the continuity of the social contract.In Stakeholder theory one does not talk about one social contract, but about many social contracts, each differing for each stakeholder. Within the Stakeholder theory there are also two branches: ethical (normative) and managerial (positive) stakeholder theory. The former one states that the company should treat every stakeholder the same, while the latter states that the management will treat stakeholders differently. This branch predicts that more attention will go to the stakeholders that are important to the company (e.g. providers of capital) than to stakeholders that do not have a direct relation with the company (e.g. the public). Institutional theory states that entities are ‘forced’ to disclose social and environmental information as other companies also disclose this information. Also here two braches exist: Isomorphism and decoupling. The first one says that the forces actually change the company, while the latter one says it will change the reporting process but not the actual performance.The last theory is media agenda setting theory. This theory explains that the media often influence the public and other stakeholders. They then in turn have expectations about what companies must report on. Therefore media can be seen as an indicator for the public opinion and what companies will disclose.
In the third chapter the current literature on environmental/social/ethical reporting was discussed. In the first part the general literature in this field was discussed. Many studies find evidence that theories such as legitimacy theory can explain many of the voluntary disclosures that are made by companies (e.g. Cho and Patten, 2007). Another recommendation, made by many authors, is that environmental reporting should be made mandatory. Although initially this would suggest an increase in comparability, Larrinaga et al. (2002) found that, at least in Spain this strategy did not work.When looking at voluntary disclosures surrounding incidents, a significant change can be seen. This was found in the studies of Patten (1992), Islam and Mathews (2009) and Islam and Deegan (2010).
50

A separate section discussed models which were used in previous studies. The model used by Aerts and Cormier (2009) was used in this study.
The fourth chapter discussed the Deepwater Horizon oil spill. Firstly, an overview of the incident was sketched. The eight reasons as identified by BP were listed. Also, a short summary of the events in the months after the explosion were given and the effect on the stock price.After this the responsibility of the oil spill was examined. A special entity was created (Gulf Coast Claims Facility), to which both individuals as well as businesses can address their claims.
In the fifth chapter the research outline was given. The hypotheses were derived and background information was given on how these hypotheses were developed. The sample that was used consisted of annual reports of oil companies that are listed in United States with SIC code 2911. The methodology that was used in chapter six was also described.
The main question posed in the introduction was: “What are the reasons for voluntary disclosure and how do companies respond to certain incidents?” It can now be partially answered. It can be said that reasons for voluntary disclosures can be found in the four theories that are discussed in chapter two. These are legitimacy, stakeholder, institutional theory and media agenda setting theory. These theories can be seen as overlapping theories and of course these theories do not explain all disclosures.Companies seem to act differently in their disclosure processes after certain incidents, even when they did not cause the incident themselves: It seems that companies associated with incidents provide more environmental and social information to their stakeholders than companies not associated with these incidents.
These theoretical findings are partially in line with the findings in this study. The main article of reference and comparison has been Patten (1992). This study investigated whether companies in the oil sector would react to an oil spill of another company by increasing environmental disclosures in their annual reports. It was found that companies (unrelated to the polluting company) increased their environmental disclosures significantly after the Exxon Valdez oil spill. Next to that he found that larger companies showed a significantly larger increase and companies that were a member of the joint-venture partly responsible for a cleanup response showed a significant larger increase.
Since the study was conducted 19 years ago, a lot has changed in company disclosures. Therefore it was interesting to see whether the relations found in the study of Patten still hold. First of all the overall means of the disclosures of the companies (also excluding BP) differed significantly (at 1% level). This suggests that companies feel the need to legitimize themselves after an incident, even if they are in a business sense unrelated to the company. Subcategories Pollution Abatement and Environmental Management also increased significantly (both at 5% level).
The six categories in the model can also be divided into two groups: ‘Economic’ and ‘Social’. The four categories that can be classified as Economic represent ‘hard’, ‘reactive’ disclosures, often in relation to future investments or litigation. The two categories that can be classified as Social represent ‘soft’ disclosures. These disclosures are often easier to make. This study found that companies both increase their economic (1%) disclosures as well as social (5%) disclosures significantly. This shows that companies significantly increase both types of disclosure, however economic disclosures increased to a larger extent than social disclosures. In this way
51
companies do not differ between the two categories to a large extent as found in previous studies (Clarkson et al., 2008; Aerts and Cormier, 2009).
7.2 Limitations and suggestions for future researchAs with many studies not everything can be examined. As some companies do not publish a CSR report and some companies had not published their CSR reports at the time of this research, I could not include this type of report in the study. It may be that, although some companies report on a broad perspective of environmental subjects in their CSR reports, they still have a low score in this study as only annual reports were examined.
Secondly only a subset of companies is taken into account: the companies that report their operations in annual accounts are included and not the companies that are privately owned and are not obliged to disclose this information. The annual reports can only be examined using a disclosure index model if they are available to the public.
Thirdly, although the BP oil spill was a significant event, other factors such as other negative news items for the companies themselves can influence their reporting behaviour. Many (small) accidents happen at regular intervals in the oil sector as a part of normal operations. One example is the media attention for Royal Dutch Shell in Nigeria8. They are accused of polluting the Niger delta area. Based on the attention, one can expect that they increase their disclosures as a way of legitimizing their operations (although in this research, Shell had only a slight increase of 1.8%). So all separate incidents for companies might give the outcome some ‘noise’.
Fourthly, the general level of social and environmental reporting has increased since the 1990’s. More and more companies use these disclosures to meet the demand of stakeholders. As this is an increasing trend, a ‘normal’ outcome will be an increase in the score of companies. In this research I cannot account for this as only two years are investigated.
Lastly, many previous authors used teams of assistants to help them classify reports. When there was any disagreement another person would examine the disclosure (e.g. Cormier and Magnan, 2003). Since this paper is a master thesis, this is not attainable.
Possibilities for further research can be derived from this study. One can focus more on the direct disclosures (e.g. direct interviews and press conferences) instead of reactive disclosures. There is a chance that companies might disclose more and more information by these ways, as the internet has created more possibilities to do so.
Another possibility is looking at a longer time-frame for pre-incident and post-incident reporting. When taken over a longer time, the findings might smooth out as less information is given after the second year of the incident. On the other hand, one might find more information when the company decided to maintain the level of post-incident reporting.
Media agenda setting theory was discussed in this thesis but was not investigated in a quantitative manner. As the media attention was quite extensive for this incident it might be interesting to see whether the media played an important role by for example investigating media disclosures around the incident.
8 http://www.guardian.co.uk/world/2010/may/30/oil-spills-nigeria-niger-delta-shell
52
7.3 GeneralisabilityThe findings of this study are partly in line with current literature. When the results are compared to the article by Patten (1992), which this study was based on, it can be concluded that the main relation that was found still holds. Companies in the oil sector will increase their disclosures after a large oil spill. Even when they are not related in a business sense to the company that was responsible for the oil spill. Whether these results can be applied to all companies, even outside the oil sector, cannot be said. The oil sector is an environmentally sensitive industry. Previous studies already found that there is a large difference between non-environmentally sensitive industries and environmentally sensitive industries (Cho and Patten 2007; Aerts and Cormier 2009). Whether these relations still hold is not tested in this study.Also whether the finding holds for all oil companies is questionable. Only companies that were listed in the United States from SIC code 2911 were selected for this study. Patten (1992) also selected companies that were publicly traded. By that, the generalisability of this study’s results is that large publicly listed companies will increase their environmental disclosures after a ‘large’ incident. In this study it was even found that both economic as well as social disclosures are used for this. Earlier studies with different models found different outcomes (Clarkson et al. 2008; Aerts and Cormier 2009). As there were no significant outcomes for the second hypothesis it cannot be explained which factors cause the amount of increase in environmental disclosures.
53
8. Bibliography
AccountAbility. (2008a). AA1000 AccountAbility principles standard 2008. London: AccountAbility.
AccountAbility. (2008b). AA1000 Assurance standard 2008. London: AccountAbility.
AccountAbility. (2008c). AA1000 Stakeholder engagement standard 2008. London: AccountAbility.
AccountAbility. (2011). AccountAbility. Accessed 11 April, 2011, from AccountAbility: http://www.accountability.org/standards/aa1000aps.html
Ader, C. (1995). A longitudinal study of agenda setting for the issue of environmental pollution. Journalism & Mass Communication Quarterly, 72(3), 300-311.
Aerts, W., & Cormier, D. (2009). Media legitimacy and corporate environmental communication. Accounting, Organizations and Society, 34(1) , 1-27.
Al-Tuwaijri, S. A., Christensen, T. E., & Hughes, K. E. (2004). The relations among environmental disclosure, environmental performance, and economic performance: a simultaneous equations approach. Accounting, Organizations and Society, 29(5-6), 447-471.
Anderson, J. C., & Frankle, A. W. (1980). Voluntary social reporting: an iso-beta portfolio analysis. The Accounting Review, 55(3), 467-479.
Beattie, V., McInnes, B., & Fearnley, S. (2004). A methodology for analysing and evaluating narratives in annual reports: a comprehensive descriptive profile and metrics for disclosure quality attributes. Accounting Forum, 28(3), 205-236.
Bewley, K., & Li, Y. (2000). Disclosure of environmental information by Canadian manufacturing companies: a voluntary disclosure perspective. Advances in Environmental Accounting & Management, 1(1), 201-226.
Botosan, C. A. (1997). Disclosure level and the cost of equity capital. The Accounting Review, 72(3), 323-349.
BP. (2011). Annual Report 2010. BP.
BP. (2010). Deepwater Horizon Accident Investigation Report. BP.
Capriotti, P. (2009). Economic and social roles of companies in the mass media: The impact media visibility has on businesses' being recognized as economic and social actors. Business & Society, 48(2), 225-242.
Cho, C. H., & Patten, D. M. (2007). The role of environmental disclosures as tools of legitimacy: a research note. Accounting, Organizations and Society, 32(7-8), 639–647.
Clarkson, P. M., Li, Y., Richardson, G. D., & Vasvari, F. P. (2008). Revisiting the relation between environmental performance and environmental disclosure: an empirical analysis. Accounting, Organizations and Society, 33(4-5), 303–327.
54
Cormier, D., & Gordon, I. M. (2001). An examination of social and environmental reporting strategies. Accounting, Auditing and Accountability Journal, 14(5), 587-616.
Cormier, D., & Magnan, M. (2003). Corporate environmental disclosure strategies: determinants, costs and benefits. Journal of Accounting, Auditing and Finance, 14(3), 429-451.
Deegan, C., & Unerman, J. (2006). Financial Accounting Theory. European Edition. Maidenhead: McGraw-Hill Education.
Dillard, J. F., Rigsby, J. T., & Goodman, C. (2005). The making and remaking of organization context: duality and the institutionalization process. Accounting Auditing & Accountability Journal, 17(4), 506-542.
DiMaggio, P. J., & Powell, W. W. (1983). The iron cage revisited: institutional isomorphism and collective rationality in organizational fields. American Sociological Review, 48(2), 146-160.
Field, A. (2005). Discovering Statistics Using SPSS. 2nd edition. London: SAGE Publications Ltd.
Global Reporting Initiative . (2006). Sustainability Reporting Guidelines. Boston, MA: Global Reporting Initative.
Gray, R., Owen, D., & Adams, C. (1996). Accounting and Accountability: Changes and Challenges in Corporate Social and Environmental Reporting. London: Prentice-Hall.
Hogner, R. H. (1982). Corporate social reporting: eight decades of development at US Steel. Research in Corporate Performance and Policy, 4, 243-250.
Hughes, S. B., Anderson, A., & Golden, S. (2001). Corporate environmental disclosures: are they useful in determining environmental performance? Journal of Accounting and Public Policy, 20(1), 217-240.
Hughes, S. B., Sander, J. F., & Reier, J. C. (2000). Do environmental disclosures in US annual reports differ by environmental performance? Advances in Environmental Accounting and Management, 1(1), 141-161.
ICAEW. (2004). Sustainability: the role of accountants. London: Institute of Chartered Accountants in England & Wales.
International Integrated Reporting Committee. (2011). What is Integrated Reporting? Accessed 8 March, 2011, from International Integrated Reporting Committee: http://www.integratedreporting.org/node/3
Islam, M. A., & Deegan, C. (2010). Media pressures and corporate disclosure of social responsibility performance information: a study of two global clothing and sports retail companies. Accounting and Business Research, 40(2), 131-148.
Islam, M., & Mathews, M. (2009). Grameen Bank's social performance disclosure: responding to a negative assessment by Wall Street Journal in late 2001. Asian Review of Accounting, 17(2), 149-162.
ISO. (2011a, April 8). Accessed 8 April, 2011, from International Organization for Standardization: http://www.iso.org/iso/iso_catalogue/management_and_leadership_standards/environmental_management.htm
ISO. (2011b, April 12). Accessed 12 April, 2011, from International Organization for Standardization: http://www.iso.org/iso/iso_catalogue/management_and_leadership_standards/social_responsibility/
55

sr_discovering_iso26000.htmKolk, A., Walhain, S., & van de Wateringen, S. (2001). Environmental reporting by the Fortune Global 250: exploring the influence of nationality and sector. Business Strategy and the Environment, 10(1), 15-28.
KPMG. (2010). Integrated Reporting: Closing the loop of strategy. Amsterdam: KPMG.
KPMG. (2005). KPMG International Survey of Corporate Responsibility Reporting 2005. Amsterdam: KPMG International.
KPMG. (2008). KPMG International Survey of Corporate Responsibility Reporting 2008. Amsterdam: KPMG International.
KPMG. (2011). KPMG International Survey of Corporate Responsibility Reporting 2011. Amsterdam: KPMG International.
Larrinaga, C., Carrasco, F., Correa, C., Llena, F., & Moneva, J. M. (2002). Accountability and accounting regulation: the case of the Spanish environmental disclosure standard. European Accounting Review, 11(4), 723–740.
National Commission. (2011). Deep Water: The Gulf Oil Disaster and the Future of Offshore Drilling. National Commission on the BP Deepwater Horizon Oil Spill and Offshore Drilling.
Owen, D., Shaw, K., & Cooper, S. (2005). The Operating and Financial Review: A catalyst for improved social and environmental disclosure? London: ACCA.
Patten, D. M. (1992). Intra-industry environmental disclosures in response to the Alaskian oil spill: a note on legitimacy theory. Accounting, Organisations and Society, 17(5), 471-475.
Singhvi, S. S., & Desai, H. B. (1971). An empirical analysis of the quality of corporate financial disclosure. The Accounting Review, 46(1), 129-138.
Solomon, A., & Lewis, S. (2002). Incentives and disincentives for corporate environmental disclosure. Business Strategy and the Environment, 11(3), 154-169.
Van Staden, C. J., & Hooks, J. (2007). A comprehensive comparison of corporate environmental reporting and responsiveness. British Accounting Review, 39(3), 197-210.
Wiseman, J. (1982). An evaluation of environmental disclosures made in corporate annual reports. Accounting, Organizations and Society, 7(1), 53-63.
56
Appendix 1Appendix 1 gives an overview of the literature as seen in chapter three.
author(s) object of studysample information methodology outcome
Anderson and Frankle (1980)
Relation between voluntary social reporting and impact of capital markets
Annual reports of the fortune 500 firms (500). United States, 1972
2 groups: companies that provided voluntary social disclosures and a group that did not. Further the effect was measured after the report was published. Use of the CAPM model to assess the impact on the capital market
Companies that provide voluntary disclosures make a higher return on investment
Botosan (1997)
Does voluntary disclosure influence the cost of capital? Is size also important?
122 manufacturing firms found in the 1994 Ward's Business directory
Using a disclosure index model and comparing this to a model to estimate returns based on dividends and the earnings to price ratio
There was a significant outcome that companies with a low analyst following would benefit from increased disclosure
Cho and Patten (2007)
If environmental disclosure is really used to legitimize a companies' actions.
KLD database information of 2002 and 10-K report from 2001. 100 sample firms
Analysing non-litigatious disclosures from several companies. Then distinguish between monetary and non-monetary disclosures
Legitimacy theory still holds. One should distinguish between non-litigation information and litigation information
Clarkson, Li, Richardson, Vasvari (2008)
Relation between environmental performance and disclosures. Positive or negative?
191 firms' disclosures from 2003. 5 high polluting industries
Using voluntary disclosures of companies and then testing them by using a GRI based content analysis
Positive Association between environmental performance and disclosures. Socio-political theories explain partly soft disclosures
Islam and Deegan (2010)
Does media pressure influence two big corporations like Nike and Hennes & Mauritz? Do they disclose more after bad news?
Annual reports from Nike and Hennes & Mauritz from 1988 to 2006.
The authors used a previous content analysis model for environmental and social disclosures. The model counted the number of words. The same system classified media articles. The Dow Jones Factiva index was used to retrieve relevant news articles
Positive correlations: H&M had 8/9 positively correlated items. Nike had 4/9.
57

author(s) object of studysample information methodology outcome
Islam and Mathews (2009)
Does a 'soft' incident (bad media attention from the Wall Street Journal) affect the disclosures of a company?
Annual report social disclosure of Grameen Bank in the period 1997-2005
Counting the sentences that related to one of the five factors set out in the Millennium goals by the UN. Then the disclosures were compared between the two periods
There is an significant increase on the topic of poverty alleviation and education after the incident
Kolk, Walhain and van de Wateringen (2001)
Environmental reporting done by the fortune global 250. Their specific characteristics are taken into account
The 250 firms in the fortune global 250. 1999
Analysis of the disclosures of the global 250. Subsequently classified
There are clear differences in environmental reporting depending on sector and nationality
Larringa, Carrasco, Correa, Llena and Moneva (2002)
Environmental reporting in Spain after making it mandatory
70 Spanish firms (non-financial). 1997-1999.
Analysing their disclosures, if any. Further analysing them by content analysis.
Although environmental reporting is enforced still companies do not disclose (enough). Institutional reform is needed.
Patten (1992)
Legitimacy theory: do companies have to legitimize them when a competitor causes an incident?
21 public oil companies that reported in 1988 and 1989, excluding Exxon Mobile
Examination of the environmental disclosures in 1988 and 1989 in the annual reports of these companies. This was based on a 7 factor model. Subsequently the disclosures were compared and accounted for in a linear regression
Significant increase in reporting by competitors. Further Size and part-ownership are explaining factors
Solomon and Lewis (2002)
Views of different users groups on corporate environmental reporting
625 individuals coming from 3 groups: normative users, interested users and companies. 2002
Analysis of the reactions from the users on a survey that incorporated some identified incentives and disincentives.
Views of the different users are not aligned at the moment on some points. Although there is a form of correlation on the different statements
58
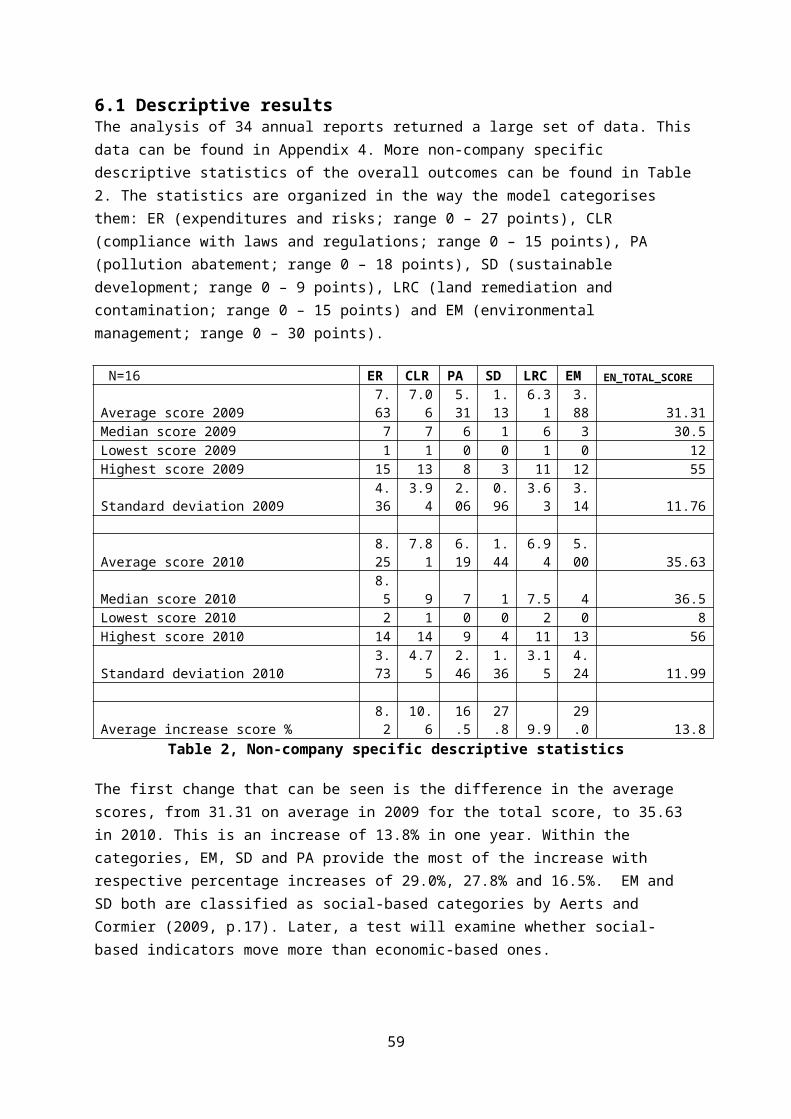
Author(s) Object of Study Sample Information Methodology Outcome
Aerts and Cormier (2009)
Relation between disclosures (annual reports + press releases) and media legitimacy. Also this is investigated for ESI.
158 Canadian or US firms that both had annual reports and press releases.
Usage of annual reports, press releases and 'legitimacy' were compared to each other
The findings of the research were that there was a proven significant association between annual report disclosures and reactive press releases and environmental (media) legitimacy. They also find that negative news legitimacy is a direct driver for more environmental press releases.On the contrary, proactive press releases do not seem to influence the legitimacy. This as ‘narcissistic’ behaviour is expected from companies
Bewly and Li (2000)
Relation between environmental disclosure (split up into financial and non-financial) and 5 factors.
188 Canadian manufacturing firms and their 1993 annual report
Wiseman index to measure the environmental disclosures and several proxies for the variables
Significant relation for the items: articles that relate to environmental exposure; pollution proxy SIC; pollution proxy NPRI; proxy political exposure. No difference between financial and non-financial
Cho and Patten (2007)
Relation between environmental performance and environmental reporting. Taken into account Litigation and monetary/non-monetary information
81 firms, split up in Environmental Sensitive Industries (ESI) and non-ESI
Usage of a disclosure index model with in total eight items: 4 relating to monetary information and 4 to non-monetary
The non-ESI group there was a significant difference higher level of monetary disclosures, while within ESI there was not. Opposed to this, there was a significant higher level of monetary environmental disclosures by worse environmental performers in the ESI group compared to better environmental performers in the ESI group and the counterparts in the non-ESI group.
Secondly, the literature related to the disclosure index models (paragraph 3.4).
59

Author(s) Object of Study Sample Information Methodology Outcome
Cormier and Gordon (2001)
Case study of three utility companies. See whether there are any differences between private and public
Annual reports and additional information from the three utility companies
One of the methods was using a disclosure index model derived from Wiseman (1982) but was updated
Certain factors are definitely related to ownership, but environmental disclosures is linked to additional costs
Cormier and Magnan (2003)
Relation between information costs, proprietary costs and media visibility with respect to environmental reporting
Annual reports from 240 French firms
Disclosure index model: 39 items, 6 categories
Significant relation between information costs and proprietary costs and environmental reporting. Not for media visibility, although there is a strong connection.
Singhvi and Desai (1971)
Relation between financial disclosures and asset size, stockholders, listing status, CPA Firms, rate of return and earnings margin
Largest 500 firms in the US taken from the Fortune 500
Financial disclosure index model, with 34 items. These items were divided into 4 categories
All items had a positive relation with the Index score outcome
Van Staden and Hooks (2007)
Relation between actual performance and environmental disclosures
32 firms from New Zealand
Disclosure index model, consisting of 32 items that in total can get 100 points. Instead of the 'usual' 4 point scale, 5 scoring points
There is a positive relation between performance and disclosures. One should consider that the companies are located in an 'environmental aware' country: New Zealand.
Wiseman (1982)
To what extent environmental performance aligns with environmental reporting
26 largest firms that could be found in the oil, steel and pulp and paper industry
Disclosure index model: 18 items into four categories
She cannot conclude there is a positive relationship between actual performance and the reflected performance
60

Appendix 2Appendix 2 lists companies that will be used in this study
Companyj / Scoresi Revenues $Country
Alon USA Energy 4.030.743.000,0
0 US
BP PLC 297.107.000.000,0
0 UK
Chevron Corp. 198.198.000.000,0
0 US
China Petroleum & Chemical Corp (Sinopec)
282.305.149.771,29 CN
ConocoPhillips 189.441.000.000,0
0 US
CVR Energy 4.079.768.000,0
0 US
Exxon Mobil 370.125.000.000,0
0 US
Frontier Oil Corp. 5.878.182.000,0
0 US
Hess 33.862.000.000,0
0 US
HOLLY CORP 8.322.929.000,0
0 US
Marathon Oil Corporation 72.204.000.000,0
0 US
Murphy Oil Corporation 23.401.117.000,0
0 US
Royal Dutch Shell 368.056.000.000,0
0 NL
Statoil 87.075.439.606,0
0 NO
Suncor Energy 32.199.802.536,0
0 CA
Sunoco 37.264.000.000,0
0 US
Valero 82.233.000.000,0
0 US
61

Appendix 3In this appendix the model for this study is given
Environmental Disclosure Index Model, based on Aerts and Cormier (2009) Expenditures and risks Sustainable developmentInvestments Natural resource conservationOperating costs RecyclingFuture investments Life cycle informationFuture operating costsFinancing for investments Land remediation and contaminationEnvironmental debts SitesRisk provisions Remediation effortsRisk litigation Potential liability-remediationProvisions for future expenditures Implicit liability
Spills (number, nature, reduction efforts)Compliance with laws and regulationsLitigation, actual and potential Environmental managementFines Environmental policies or company concern for the environmentOrders to comply Environmental management systemCorrective action Environmental auditingIncidents Goals and targetsFuture legislation and regulations Awards
Department, group, service, assigned to the environmentPollution abatement ISO 14000Emission of pollutants Involvement of the firm to develop environmental standardsDischarges Involvement of environmental organizations (industryWaste management committees, etc)Installation and process controls Joint environmental management projects with other firmsCompliance status of facilitiesNoise and odours
Rating: 3 points for quantitative/monetary disclosure; 2 points for extensive/specific description; 1 point for general qualitative description;0 points for no disclosure
62
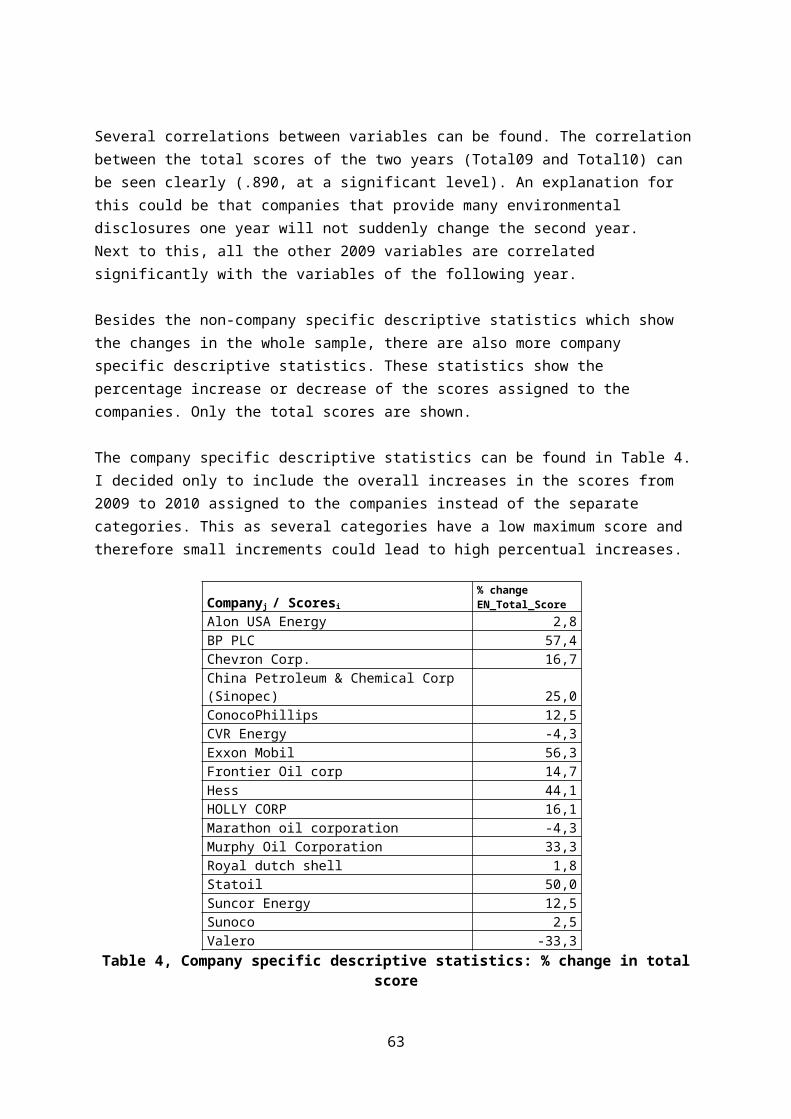
Appendix 4Data environmental index model2009:Year 2009 2009 2009 2009 2009 2009 2009Companyj / Scoresi ER CLR PA SD LRC EM EN_TOTAL_SCOREAlon USA Energy 10 9 6 0 10 1 36BP PLC 10 11 4 1 9 12 47Chevron Corp. 13 4 0 0 10 3 30China Petroleum & Chemical Corp (Sinopec) 4 2 6 3 4 5 24ConocoPhillips 2 1 5 1 1 6 16CVR Energy 13 12 8 1 10 2 46Exxon Mobil 6 1 2 1 4 2 16Frontier Oil Corp. 10 11 5 0 8 0 34Hess 7 7 6 1 6 7 34HOLLY CORP 7 10 6 1 6 1 31Marathon Oil Corporation 11 12 7 2 10 4 46Murphy Oil Corporation 4 7 6 1 6 3 27Royal Dutch Shell 15 8 6 3 11 12 55Statoil 6 6 8 1 2 7 30Suncor Energy 2 6 6 2 2 6 24Sunoco 11 13 4 0 10 2 40Valero 1 4 4 1 1 1 12
2010:Year 2010 2010 2010 2010 2010 2010 2010Companyj / Scoresi ER CLR PA SD LRC EM EN_TOTAL_SCOREAlon USA Energy 10 11 6 0 8 2 37BP PLC 19 15 9 1 15 15 74Chevron Corp. 14 5 0 0 11 5 35China Petroleum & Chemical Corp (Sinopec) 6 2 7 4 4 7 30ConocoPhillips 2 1 7 1 3 4 18CVR Energy 12 13 9 1 7 2 44Exxon Mobil 6 1 6 4 4 4 25Frontier Oil Corp. 12 11 6 0 10 0 39Hess 7 12 8 1 9 12 49HOLLY CORP 7 12 7 1 8 1 36Marathon Oil Corporation 10 12 8 1 10 3 44Murphy Oil Corporation 5 10 7 1 7 6 36Royal Dutch Shell 13 8 8 3 11 13 56Statoil 11 8 8 3 3 12 45Suncor Energy 4 4 6 2 4 7 27Sunoco 10 14 5 0 10 2 41Valero 3 1 1 1 2 0 8
63

Appendix 5Significance should be divided by 2 (SPSS only calculates two-sided paired t-tests). Refers to the output presented in Table 5
Paired Differences
t dfSig. (2-tailed)
Mean
Std. Deviatio
n
Std. Error Mean
95% Confidence Interval of the
Difference
Lower UpperER10 - ER09
.625 1.708 .427 -.285 1.535 1.464
15
.164
CLR10 - CLR09
.750 1.880 .470 -.252 1.752 1.596
15
.131
PA10 - PA09
.875 1.455 .364 .100 1.650 2.406
15
.029
SD10 - SD09
.313 .946 .237 -.192 .817 1.321
15
.206
LRC10 - LRC09
.625 1.544 .386 -.198 1.448 1.619
15
.126
EM10 - EM09
1.125
1.996 .499 .061 2.189 2.255
15
.040
TotalScore10 - TotalScore09
4.313
5.570 1.393 1.344 7.281 3.097
15
.007
Refers to the output presented in Table 6
Paired Differences
t dfSig. (2-tailed)Mean
Std. Deviation
Std. Error Mean
95% Confidence
Interval of the Difference
Lower UpperEconomic 2010 - Economic 2009
2.875 3.519 0.88 1 4.75 3.268
15 0.005
Social 2010 - Social 2009
1.438 2.581 0.645 0.062 2.813 2.228
15 0.042
Refers to the output presented in Table 7
Model
Summary
R
R Squar
e
Adjusted R
Square
Std. Error of the Estima
te.21
7.047 -.099 5.841
ANOVA
Sum of Squares df
Mean Square F Sig.
Regressio 21.952 2 10.976 .322 .730
64

nResidual 443.48
613
34.114
Total 465.438
15
Coefficients
Unstandardi
zed Coefficients
Standardized
Coefficients
tSig
.BStd.
Error Beta(Constant)
-.123
26.946 -.0
05.99
6Natural Logarithm of Revenues
.249 1.047 .070 .238
.816
Country of origin 1=US, 0=NON-US
-2.24
4
3.661 -.180 -.613
.550
Refers to the output presented in Table 8
ANOVA
2009Sum of Square
sdf
Mean Squar
e FSig.
Regression
250.033
2 125.016
.890
.434
Residual 1825.405
13
140.416
Total 2075.438
15
2010Sum of Square
sdf
Mean Squar
e FSig.
Regression
269.876
2 134.938
.929
.420
Residual 1887.874
13
145.221
Total 2157.750
15
65
Model Summary
RR
Square
Adjusted R
Square
Std. Error of
the Estimate
2009 .347 .120 -.015 11.850
2010 .354 .125 -.010 12.051

Coefficients
Unstandardized Coefficients
Standardized
Coefficients
tSig
.BStd. Error Beta
(Constant) 2009
102.806
54.668
1.881
.083
Country 2009
-6.286 7.428 -.239 -.846
.413
LN Revenues 2009
-2.717 2.123 -.361 -1.28
0
.223
(Constant) 2010
102.683
55.596
1.847
.088
Country 2010
-8.530 7.554 -.318 -1.12
9
.279
LN Revenues 2010
-2.468 2.159 -.322 -1.14
3
.274
66