environmental assessment of water and soil … · water quality monitoring in this estuary. to...
TRANSCRIPT
ORIGINAL ARTICLE
Environmental assessment of water and soil contaminationin Rajakhali Canal of Karnaphuli River (Bangladesh) impactedby anthropogenic influences: a preliminary case study
M. Rafiqul Islam1• N. G. Das1 • Prabal Barua2 • M. Belal Hossain3 •
S. Venkatramanan4 • S. Y. Chung4
Received: 9 February 2015 / Accepted: 23 June 2015 / Published online: 30 July 2015
� The Author(s) 2015. This article is published with open access at Springerlink.com
Abstract Soil and water quality determines the health of
an aquatic ecosystem. Rajakhali Canal, a tributary of
Karnaphuli River estuary, flowing through Chittagong
City (the commercial capital of Bangladesh) receives a
huge amount of domestic and industrial wastes and
sewages. Monitoring the environmental status of Karna-
phuli River and its tributaries is very important for their
ecological and economical services provided to city areas.
This study evaluated some environmental characteristics
of water and soil in the Rajakhali Canal as it affected the
environment, and ultimately the life and human beings of
Chittagong City. The mean concentrations of physico-
chemical parameters were pH (8.5), DO (0.1 mg/L), TA
(47.6 mg/L), TDS (631.8 mg/L), TSS (280 mg/L), SO4-S
(2.3 mg/L), NH3 (1.1 mg/L), NO3-N (0.2 mg/L) and PO4-
P (0.1 mg/L) in the dry season. During the rainy season,
the mean concentrations of physico-chemical parameters
were pH (7.01), DO (0.55 mg/L), TA (65.9 mg/L), TDS
(653.6 mg/L), TSS (300.3 mg/L), SO4-S (1 mg/L), NH3-
(0.6 mg/L), (NO3-N (0.3 mg/L) and PO4-P (0.5 mg/L) in
water. In case of soil, the mean concentration of physico-
chemical parameters in dry and rainy seasons was rep-
resented respectively as follows: pH (6.8), OM (4.5 %),
sand (71.7 %), silt (3.1 %), clay (25.2 %), organic nitro-
gen (45.4 ppm) and phosphorus (9.6 ppm); and pH (6.7),
OM (4.5 %), sand (74.4 %), silt (2.4 %), clay (23.2 %),
organic nitrogen (35.3 ppm) and phosphorus (7.6 ppm).
The result revealed that water and soil quality of this
canal became deteriorated and that the total environment
of the water body became polluted due to the anthro-
pogenic activities such as industrial, domestic and irri-
gation effluents. Statistical analyses also supported that
water and soil parameters were strongly correlated (1-
tailed 0.05 level and 0.01 level significant) with each
other at all stations during all seasons. The result of this
study will be useful for management and planning for
water quality monitoring in this estuary. To protect this
vital estuarine region, the government agencies, private
agencies and scientists should work with proper attention.
Keywords Karnaphuli River � Rajakhali Canal �Chittagong City water quality � Soil quality � Pollution
Introduction
Water is the most vital element among the natural
resources and is crucial for the survival of all living
organisms including humans, for food production and
economic development (Shiklomanov 1993; Pahl-Wostl
et al. 2008). Today, nearly 40 % of the world’s food supply
is grown under irrigation, and a wide variety of industrial
processes depend on water (BCAS 2000). Moreover, in
M. R. Islam and M. B. Hossain have contributed equally to this work.
& S. Venkatramanan
[email protected]; [email protected]
M. Belal Hossain
1 Institute of Marine Sciences and Fisheries, University of
Chittagong, 4331 Chittagong, Bangladesh
2 Bangladesh Centre for Advanced Studies, 1212 Dhaka,
Bangladesh
3 Biology Group, Faculty of Science, Universiti Brunei
Darussalam, Bandar Seri Begawan 1410, Brunei
4 Department of Earth and Environmental Sciences, Institute of
Environmental Geosciences, Pukyong National University,
599-1 Daeyeon-dong Nam-gu, Busan 608-737, Korea
123
Appl Water Sci (2017) 7:997–1010
DOI 10.1007/s13201-015-0310-2
Bangladesh, the environment, economic growth and
developments are all highly influenced by the quality and
quantity of surface and groundwater. The seasonal avail-
ability of surface and groundwater depends on the monsoon
climate and topography of the country (Alam 2009). In
terms of quality, the surface water of the country is vul-
nerable to pollution from untreated industrial effluents and
municipal wastewater, runoff from chemical fertilizers and
pesticides, and oil and lube spillage in the coastal area from
the operation of sea and river ports (Hossain 2001). Water
quality also depends on effluent types and discharge
quantity from different type of industries, types of agro-
chemicals used in agriculture and seasonal water flow and
dilution capability by the river system (DHV 1998).
Sewage may be defined as the products of municipal
drainage system, containing domestic wastes with or
without the addition of discharges from industry (including
highly acid and alkaline wastes, oil greases, some heavy
metals effluents, etc.) storm water and surface runoff
(Grant et al. 2005). Classes of sewage include sanitary,
commercial, industrial, agricultural and surface runoff. The
wastewater from residences and institutions, washing
water, food preparation wastes, laundry wastes and other
waste products of normal living are classed as domestic or
sanitary sewage (Kennish 1996). Liquid-carried wastes
from stores and service establishments serving the imme-
diate community, termed commercial wastes, are included
in the sanitary or domestic sewage category if their char-
acteristics are similar to household flows. Wastes that result
from an industrial process or the production or manufacture
of goods are classed as industrial wastewater (Kennish
1996). Their flows and strengths are usually more varied,
intense and concentrated than those of sanitary sewage.
Surface runoff, also known as storm flow or overland flow,
is that portion of precipitation that runs rapidly over the
ground surface to a defined channel.
Precipitation absorbs gases and particulates from the
atmosphere, dissolves and leaches materials from vegeta-
tion and soil, suspends matter from the land, washes spills
and debris from urban streets and highways and carries all
these pollutants as wastes in its flow to a collection point
(Luo et al. 2008). Under natural conditions, only when the
concerning ecosystems are not balanced sewage causes
various sorts of problems. Sewage contains a huge amount
of phosphorus (P) and nitrogen (N) causing eutrophication
and fatal consequents to the surrounding environment
(Landolt and Kandeler 1987).
The worldwide water and soil quality deterioration are
primarily contributable to growing human populations and
economic development, particularly elevating nutrients
leading to eutrophication and pollution in the aquatic
environment (Nriagu and Pacyna 1988; Peierls et al. 1998;
Holloway et al. 1998; Li et al. 2009; Pekey et al. 2004,
Venkatramanan et al. 2013a, 2014a, b). The natural sources
include volcanism, bedrock erosion, atmospheric transport
and the release from plants (Khan et al. 1996; Pekey et al.
2004) and anthropogenic activities; particularly, mining
and mineral processing have dominant influences of pri-
mary water and soil quality parameters.
There are rather few studies published in recent years on
pollution sources in Karnaphuli River (Hossain 1992,
2001). In this existing scenario, this research aims at
determining the pollution sources of Rajakhali Canal,
which is adversely impacted by industries together with
landfill leachate and municipal sewage effluents. This study
evaluates the seasonal variation, source and contamination
levels of water and soil quality.
Materials and methods
Study area settings
Bangladesh extending from 20�300 to 26�N and 88� to
90�500E, a small riverine country of 145,000 km2 (Alam
1994), lies in the north-east part of the South Asian sub-
continent. The country is bounded by India in its north, east
and west and for a small stretch in the southeast. It has a
common border with Myanmar in the south-east and the
Bay of Bengal is located in the south. The Ganges and the
Brahmaputra Delta is situated at the apex of the Bay of
Bengal. The country is crisscrossed by numerous large and
small rivers. Most of the big rivers originate outside the
country, i.e., India, Nepal and Myanmar. These rivers have
a strong influence on the aquatic environment in varying
degrees and time sequence, water quality, circulation,
nature of bottom and the inhabitants of that environment
(Banglapedia 2004).
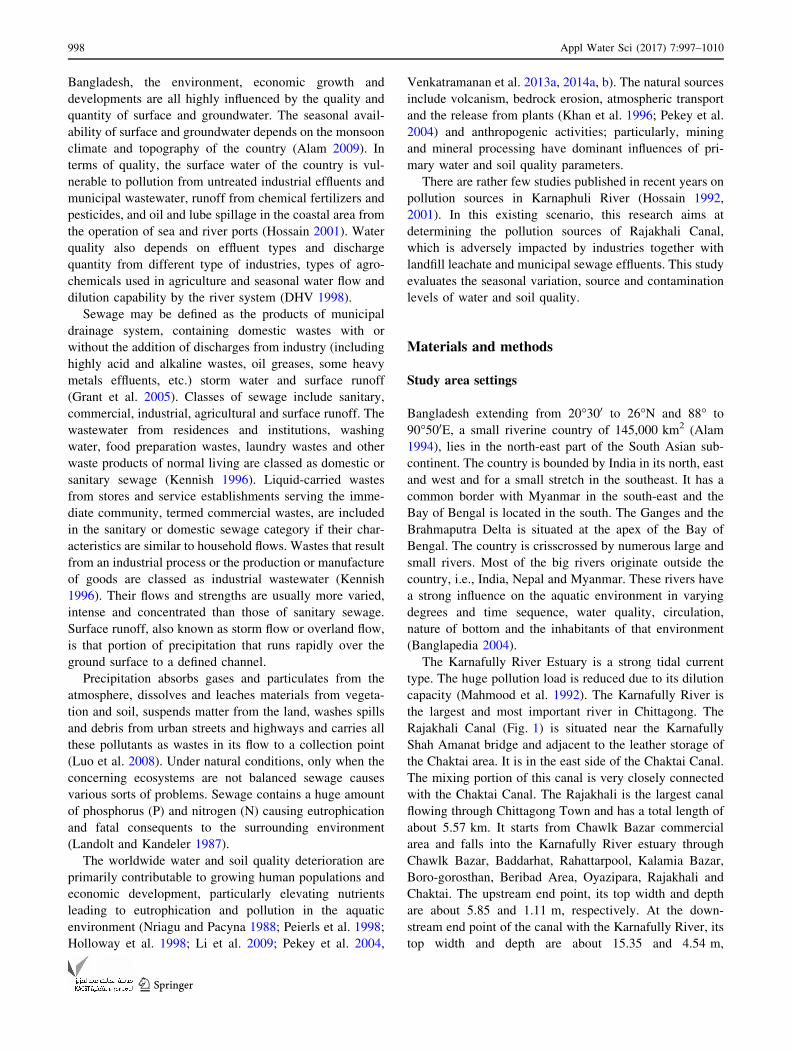
The Karnafully River Estuary is a strong tidal current
type. The huge pollution load is reduced due to its dilution
capacity (Mahmood et al. 1992). The Karnafully River is
the largest and most important river in Chittagong. The
Rajakhali Canal (Fig. 1) is situated near the Karnafully
Shah Amanat bridge and adjacent to the leather storage of
the Chaktai area. It is in the east side of the Chaktai Canal.
The mixing portion of this canal is very closely connected
with the Chaktai Canal. The Rajakhali is the largest canal
flowing through Chittagong Town and has a total length of
about 5.57 km. It starts from Chawlk Bazar commercial
area and falls into the Karnafully River estuary through
Chawlk Bazar, Baddarhat, Rahattarpool, Kalamia Bazar,
Boro-gorosthan, Beribad Area, Oyazipara, Rajakhali and
Chaktai. The upstream end point, its top width and depth
are about 5.85 and 1.11 m, respectively. At the down-
stream end point of the canal with the Karnafully River, its
top width and depth are about 15.35 and 4.54 m,
998 Appl Water Sci (2017) 7:997–1010
123
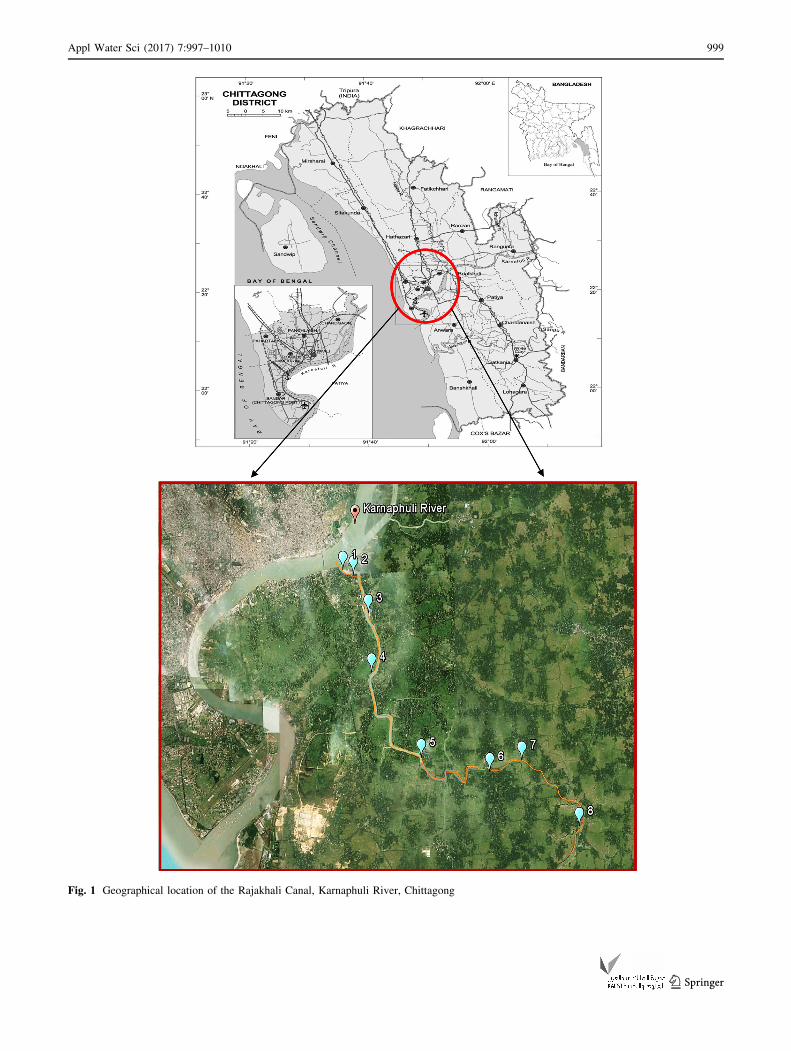
Fig. 1 Geographical location of the Rajakhali Canal, Karnaphuli River, Chittagong
Appl Water Sci (2017) 7:997–1010 999
123
respectively. Nevertheless, it is the major sewage drainage
canal of the city and carries at least 18 % wastes and
sewage of the city (Ahmed 1995).
Sample collection and analysis
The investigation was carried out in the municipal sewage
drainage canal named Rajakhali of Chittagong metropolitan
area. A total of 8 samples were collected in this canal sys-
tem. (Table 1). The water and soil samples were collected
from dry (February) and rainy (December) seasons in 2011.
For water, soil and sewage samples were collected in glass
bottles, polythene bag and BOD bottles. Sewage samples
were collected for determining DO. They were placed in a
wooden box to avoid direct sunlight, and sewage, water and
soil samples were transported to the laboratory for further
analysis. All samples were kept at 4 �C in a refrigerator
before analysis (WHO and UNEP 1990). The water tem-
perature was measured with a mercury thermometer; water
pH by a pen pH meter, dissolved oxygen by Winkler
method (Barnes 1959) and salinity of water by a hand
refractometer in field. The average monthly rainfall data are
shown in Fig. 2. Total dissolved solids (TDS) and total
suspended solids (TSS) were measured by the method
described in APHA (1995), alkalinity was measured by a
method described by Suess (1982), total hardness was
measured by a standard method (APHA 1995) and carbon
dioxide was measured by the titrimetric method (De Cura
et al. 1996). Unionized ammonia was determined by the
phenol hypochloride method (APHA 1995), and nitrite-ni-
trogen (NO2-N), phosphate-phosphorous (PO4-P) and sul-
fate-sulfur (SO4-S) were determined by the ultraviolet
Table 1 Characteristics of the study area
S.
no.
Station
no.
Characteristics of the study area
1 One Situated at the mouth of the canal where the canal and the Karnaphuli River are mixed together
Two Situated 150 ft upstream from the first sampling station where a small drain falls into the canal which flows from a garment
factory. The total effluents of the canal and the garbage of the garment factory mix at this point
Three Situated about 550 ft upstream from the first sampling station. This is a highly polluted area
Four Situated 500 ft upstream from the first sampling station is discharged from a portion of the Chittagong City area
Five Situated about 900 ft upstream than Station 1 inhabited by more human effluents
Six Situated 900 ft upstream from the 1st station and very close to a downtown market, Kalamia Bazar. All types of garbage,
greases and other dirty substances fall into the canal. This station is the meeting place between the Raja Canali Canal and
Beribad Sub-Canal
Seven Situated 1200 ft upstream from the first sampling station. There is a sub-canal named Boro-Gorosthan Canal which mixes with
the Rajacanali Canal. Another canal named Oyazipara also mixes with this canal. The surrounding area of the sampling
stations consists mainly of agricultural land and also human residences. Here, the effluents come from the upward area of the
city and also mix with agricultural and human pollutants and dust particles
Eight Last station of the Rajacanali Canal. The area is called Rahatterpoll. The width of the canal is much reduced here. The
municipal wastes from Chak Bazaar have been deposited at the mouth of the drain and flow downward toward the Rajacanali
Canal
0
100
200
300
400
500
600
700
800
Jan Feb Mar Apr May Jun Jul Aug Sep Oct Nov Dec
Rai
nfal
l Pre
cipi
tatio
n (m
m)
Month (Year -2011)
Fig. 2 Average monthly
rainfall precipitation of the year
1000 Appl Water Sci (2017) 7:997–1010
123

spectrophotometric method (APHA 1995). Soil pH of water
was determined by digital soil pH meter, soil texture was
analyzed by the formula described by Boyd and Tucker
(1992), soil salinity was measured by the formula described
by Richard (1954) and soil alkalinity method described by
Boyd and Pippopinyo (1994). The organic matter of the soil
was determined by a method described by Jackson (1958).
On the other hand, total nitrogen (N2) or organic nitrogen
(N2) was determined by micro Kjeldahl digestion and dis-
tillation procedure (Strickland and Parsons 1968). Stan-
dards and blanks were run frequently to check the accuracy
of the procedures. Care was taken to avoid handling errors.
Few samples were repeated to check concordant readings.
All the chemicals used were of analytical grade and pro-
cured from Merck. The accuracy of analytical experiments
was determined by calculating the ionic balance error,
which was generally within ±5 %. The accuracy of the soil
analytical method was examined by the standard reference
material MAG-1 (marine mud from the United States
Geological Survey).
Results and discussion
Seasonal variation of water parameters
Throughout the study period, the maximum concentration
of physico-chemical parameters in water were observed in
the dry season except DO, TH, NO2-N and PO4-P. In the
present study, water temperature of the studied area varied
from 27 to 33 �C during the dry season and from 26 to
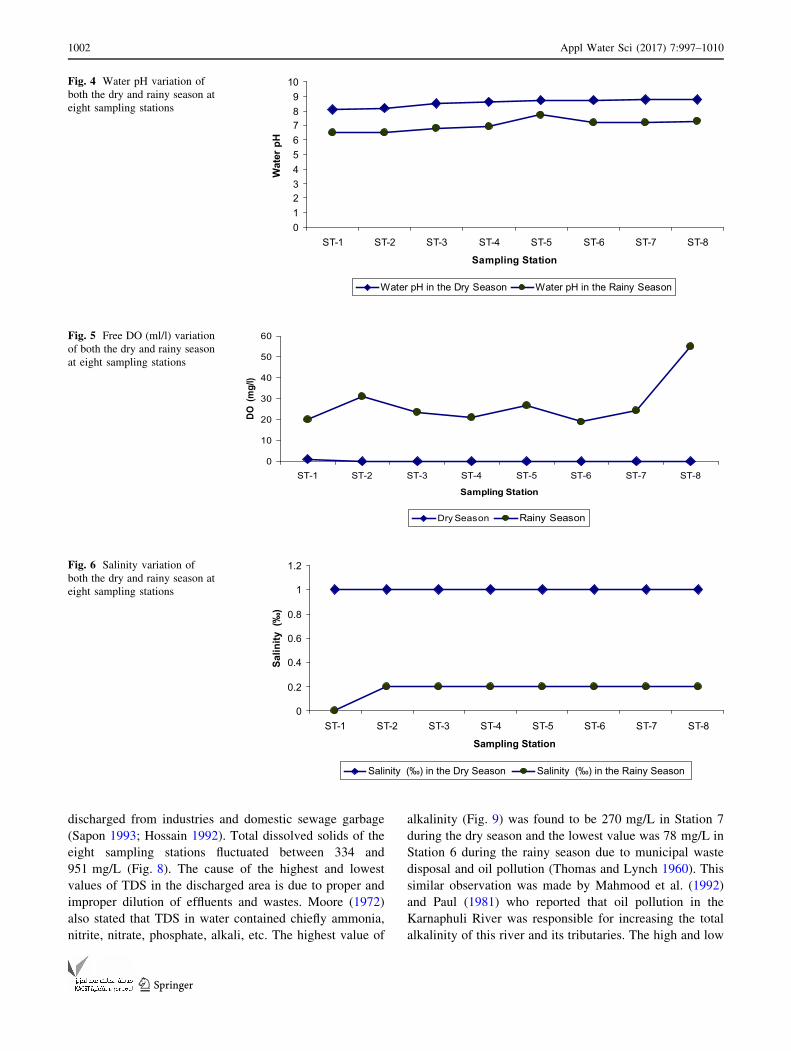
29.25 �C during the rainy season (Fig. 3). Water pH was
from 8.1 to 8.8 during the dry season and from 6.5 to 7.7
during the rainy season (Fig. 4). The maximum value of
water temperature was 33 �C in Station 7 during the dry
season and the minimum value was 26 �C in Stations 1, 2
and 4 during the rainy season. The difference between
maximum and minimum water temperature was higher in
the present study than in the previous year observed by
Hossain (1992). Water temperature increases in a stream,
and DO decreases due to the lower solubility of oxygen at
higher temperatures (Klein 1962). Remani et al. (1983) and
Chandran and Ramamoorthi (1984) mentioned that the
temperature fluctuation was a seasonal phenomenon
resulting from the monsoonal effect. The highest value of
pH was recorded as 8.8 in Stations 7 and 8 during the dry
season. On the other hand, the lowest value was 6.5 in
Stations 1 and 2 during the rainy season, respectively. The
value of pH in the discharged area showed a slightly acidic
nature. This study showed that the water pH of eight
sampling stations was changed from 6.5 to 8.8. This indi-
cates that the effluent of industrial and municipal waste
materials had a significant role in increasing or decreasing
pH of the adjacent water body where the waste materials
were dumped (Moore 1972; Bhouyan 1979; Mahmood
et al. 1992).
During the dry season, dissolved oxygen varied from 0
to 9.7 mg/L (Fig. 5), but during rainy season from 20 to
56 mg/L. The salinity values varied from 0.2 to 1 ppt in
both seasons(Fig. 6). The low DO of effluent and effluent
discharged area might be due to high content of total sus-
pended solids and total dissolved solids, which utilized the
significant amount of DO for bio-chemical degradation.
The higher value of DO may be due to large amount of
wastes discharged by the sewage system in both seasons
(Hossain 1992). During the dry season, salinity was found
to be higher than that of the rainy season. This exhibits the
large amount of fresh water discharge from monsoonal
rainfall. Total hardness of the eight sampling stations
fluctuated between 36.30 and 88.9 mg/L (Fig. 7). The
highest value of 88.9 mg/L was found in Station 4 during
the rainy season. On the other hand, the lowest value was
36.30 mg/L in Station 6 during the dry season. This may be
due to the presence of different types of total salts
0
5
10
15
20
25
30
35
ST-1 ST-2 ST-3 ST-4 ST-5 ST-6 ST-7 ST-8
Sampling Station
Tem
pera
ture
(0C)
Temperature in the Dry Season Temperature in the Rainy Season
Fig. 3 Temperature variation
of both the dry and rainy season
at eight sampling stations
Appl Water Sci (2017) 7:997–1010 1001
123
discharged from industries and domestic sewage garbage
(Sapon 1993; Hossain 1992). Total dissolved solids of the
eight sampling stations fluctuated between 334 and
951 mg/L (Fig. 8). The cause of the highest and lowest
values of TDS in the discharged area is due to proper and
improper dilution of effluents and wastes. Moore (1972)
also stated that TDS in water contained chiefly ammonia,
nitrite, nitrate, phosphate, alkali, etc. The highest value of
alkalinity (Fig. 9) was found to be 270 mg/L in Station 7
during the dry season and the lowest value was 78 mg/L in
Station 6 during the rainy season due to municipal waste
disposal and oil pollution (Thomas and Lynch 1960). This
similar observation was made by Mahmood et al. (1992)
and Paul (1981) who reported that oil pollution in the
Karnaphuli River was responsible for increasing the total
alkalinity of this river and its tributaries. The high and low
0123456789
10
ST-1 ST-2 ST-3 ST-4 ST-5 ST-6 ST-7 ST-8
Sampling StationW
ater
pH
Water pH in the Dry Season Water pH in the Rainy Season
Fig. 4 Water pH variation of
both the dry and rainy season at
eight sampling stations
0
10
20
30
40
50
60
ST-1 ST-2 ST-3 ST-4 ST-5 ST-6 ST-7 ST-8
Sampling Station
DO (
mg/
l)
Dry Season Rainy Season
Fig. 5 Free DO (ml/l) variation
of both the dry and rainy season
at eight sampling stations
0
0.2
0.4
0.6
0.8
1
1.2
ST-1 ST-2 ST-3 ST-4 ST-5 ST-6 ST-7 ST-8
Sampling Station
Salin
ity (
‰)
Salinity (‰) in the Dry Season Salinity (‰) in the Rainy Season
Fig. 6 Salinity variation of
both the dry and rainy season at
eight sampling stations
1002 Appl Water Sci (2017) 7:997–1010
123
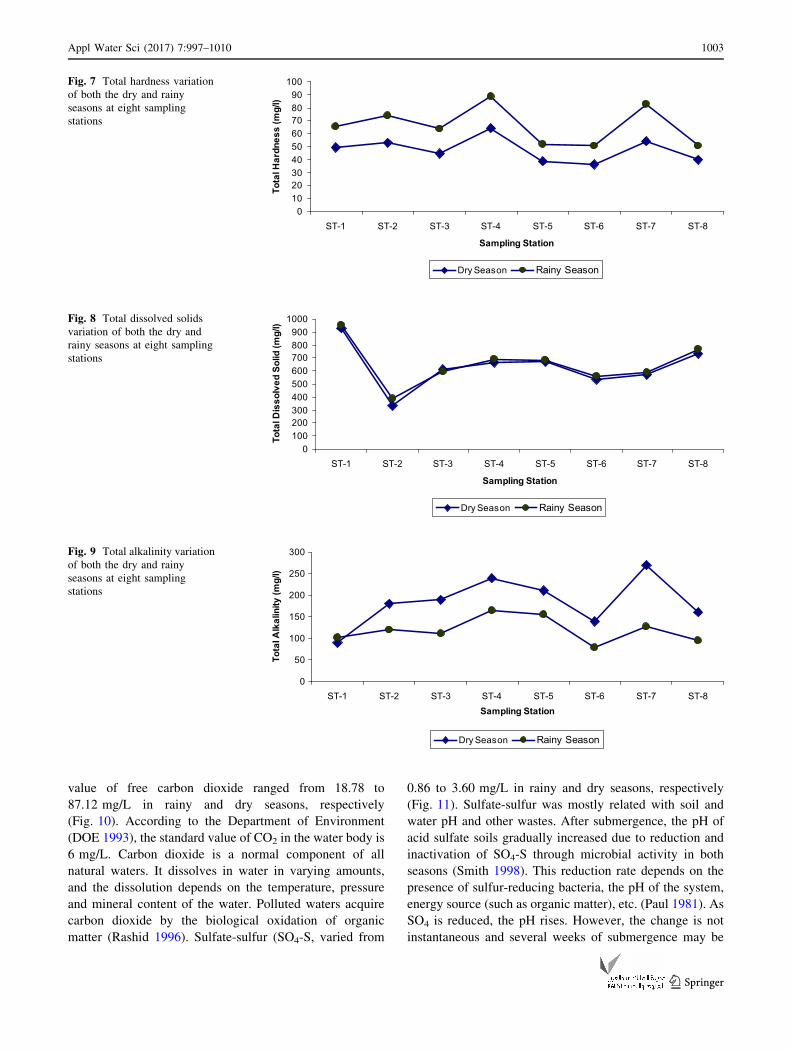
value of free carbon dioxide ranged from 18.78 to
87.12 mg/L in rainy and dry seasons, respectively
(Fig. 10). According to the Department of Environment
(DOE 1993), the standard value of CO2 in the water body is
6 mg/L. Carbon dioxide is a normal component of all
natural waters. It dissolves in water in varying amounts,
and the dissolution depends on the temperature, pressure
and mineral content of the water. Polluted waters acquire
carbon dioxide by the biological oxidation of organic
matter (Rashid 1996). Sulfate-sulfur (SO4-S, varied from
0.86 to 3.60 mg/L in rainy and dry seasons, respectively
(Fig. 11). Sulfate-sulfur was mostly related with soil and
water pH and other wastes. After submergence, the pH of
acid sulfate soils gradually increased due to reduction and
inactivation of SO4-S through microbial activity in both
seasons (Smith 1998). This reduction rate depends on the
presence of sulfur-reducing bacteria, the pH of the system,
energy source (such as organic matter), etc. (Paul 1981). As
SO4 is reduced, the pH rises. However, the change is not
instantaneous and several weeks of submergence may be
0102030405060708090
100
ST-1 ST-2 ST-3 ST-4 ST-5 ST-6 ST-7 ST-8
Sampling Station
Tota
l Har
dnes
s (m
g/l)
Dry Season Rainy Season
Fig. 7 Total hardness variation
of both the dry and rainy
seasons at eight sampling
stations
0100200300400500600700800900
1000
ST-1 ST-2 ST-3 ST-4 ST-5 ST-6 ST-7 ST-8
Sampling Station
Tota
l Dis
solv
ed S
olid
(mg/
l)
Dry Season Rainy Season
Fig. 8 Total dissolved solids
variation of both the dry and
rainy seasons at eight sampling
stations
0
50
100
150
200
250
300
ST-1 ST-2 ST-3 ST-4 ST-5 ST-6 ST-7 ST-8Sampling Station
Tota
l Alk
alin
ity (m
g/l)
Dry Season Rainy Season
Fig. 9 Total alkalinity variation
of both the dry and rainy
seasons at eight sampling
stations
Appl Water Sci (2017) 7:997–1010 1003
123
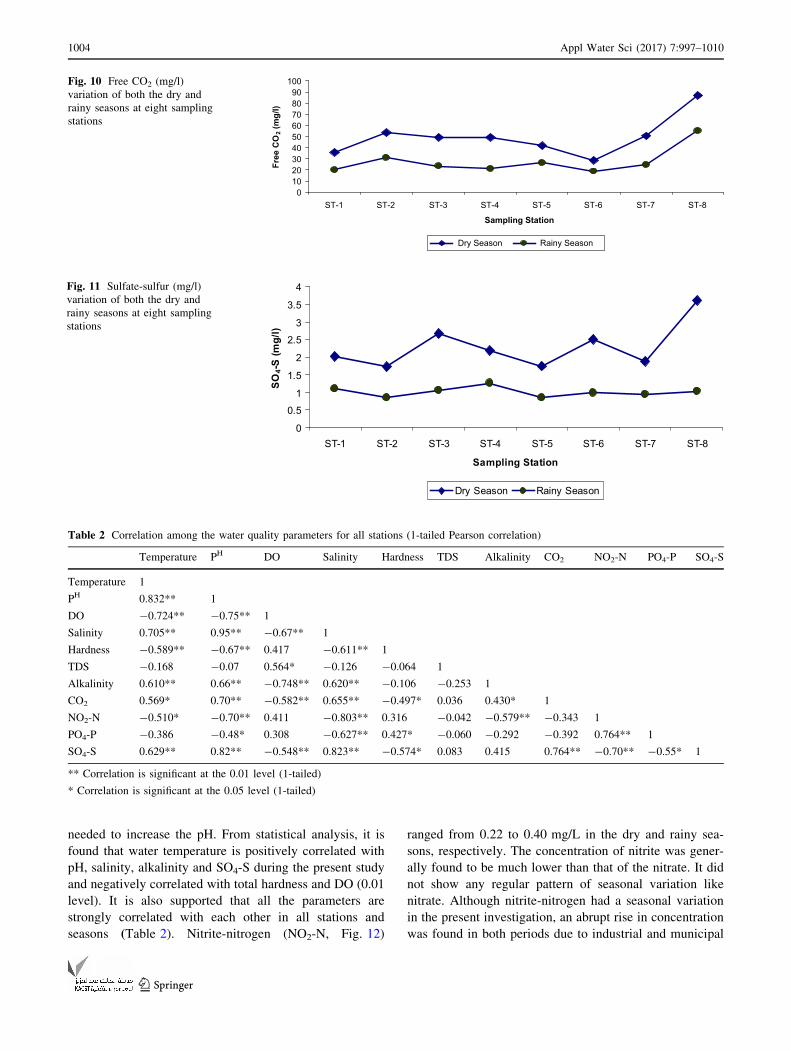
needed to increase the pH. From statistical analysis, it is
found that water temperature is positively correlated with
pH, salinity, alkalinity and SO4-S during the present study
and negatively correlated with total hardness and DO (0.01
level). It is also supported that all the parameters are
strongly correlated with each other in all stations and
seasons (Table 2). Nitrite-nitrogen (NO2-N, Fig. 12)
ranged from 0.22 to 0.40 mg/L in the dry and rainy sea-
sons, respectively. The concentration of nitrite was gener-
ally found to be much lower than that of the nitrate. It did
not show any regular pattern of seasonal variation like
nitrate. Although nitrite-nitrogen had a seasonal variation
in the present investigation, an abrupt rise in concentration
was found in both periods due to industrial and municipal
0102030405060708090
100
ST-1 ST-2 ST-3 ST-4 ST-5 ST-6 ST-7 ST-8
Sampling Station
Free
CO
2 (m
g/l)
Dry Season Rainy Season
Fig. 10 Free CO2 (mg/l)
variation of both the dry and
rainy seasons at eight sampling
stations
0
0.5
1
1.5
2
2.5
3
3.5
4
ST-1 ST-2 ST-3 ST-4 ST-5 ST-6 ST-7 ST-8
Sampling Station
SO4-
S (m
g/l)
Dry Season Rainy Season
Fig. 11 Sulfate-sulfur (mg/l)
variation of both the dry and
rainy seasons at eight sampling
stations
Table 2 Correlation among the water quality parameters for all stations (1-tailed Pearson correlation)
Temperature PH DO Salinity Hardness TDS Alkalinity CO2 NO2-N PO4-P SO4-S
Temperature 1
PH 0.832** 1
DO -0.724** -0.75** 1
Salinity 0.705** 0.95** -0.67** 1
Hardness -0.589** -0.67** 0.417 -0.611** 1
TDS -0.168 -0.07 0.564* -0.126 -0.064 1
Alkalinity 0.610** 0.66** -0.748** 0.620** -0.106 -0.253 1
CO2 0.569* 0.70** -0.582** 0.655** -0.497* 0.036 0.430* 1
NO2-N -0.510* -0.70** 0.411 -0.803** 0.316 -0.042 -0.579** -0.343 1
PO4-P -0.386 -0.48* 0.308 -0.627** 0.427* -0.060 -0.292 -0.392 0.764** 1
SO4-S 0.629** 0.82** -0.548** 0.823** -0.574* 0.083 0.415 0.764** -0.70** -0.55* 1
** Correlation is significant at the 0.01 level (1-tailed)
* Correlation is significant at the 0.05 level (1-tailed)
1004 Appl Water Sci (2017) 7:997–1010
123
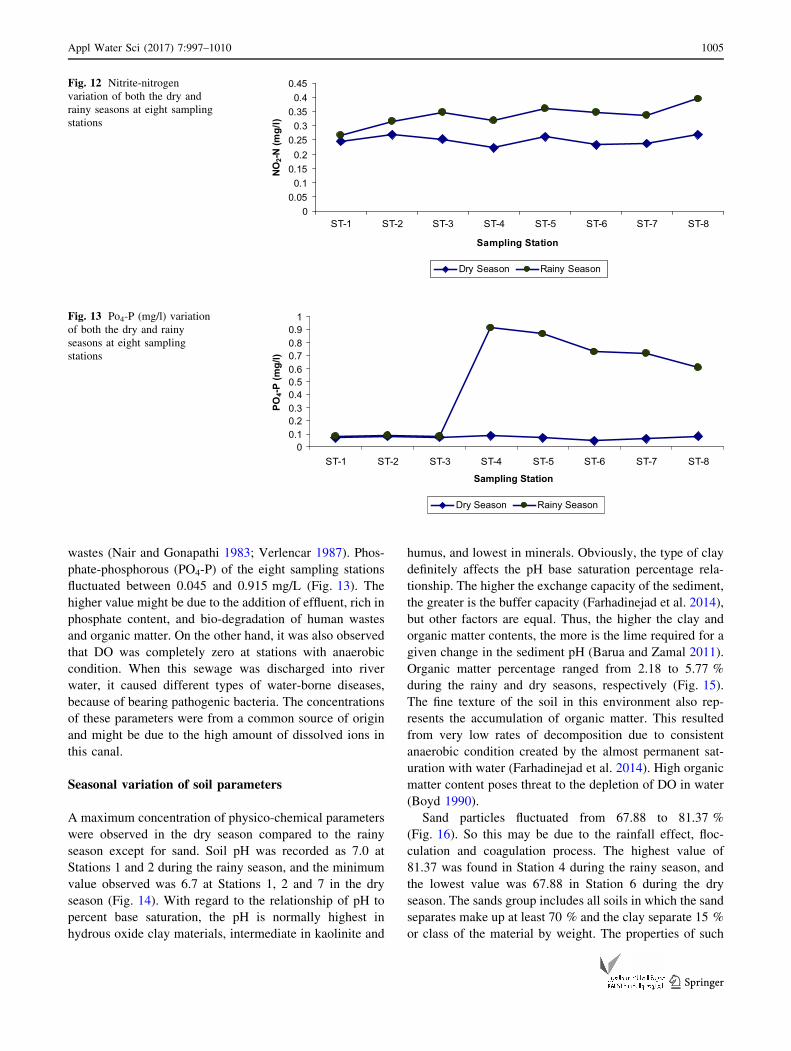
wastes (Nair and Gonapathi 1983; Verlencar 1987). Phos-
phate-phosphorous (PO4-P) of the eight sampling stations
fluctuated between 0.045 and 0.915 mg/L (Fig. 13). The
higher value might be due to the addition of effluent, rich in
phosphate content, and bio-degradation of human wastes
and organic matter. On the other hand, it was also observed
that DO was completely zero at stations with anaerobic
condition. When this sewage was discharged into river
water, it caused different types of water-borne diseases,
because of bearing pathogenic bacteria. The concentrations
of these parameters were from a common source of origin
and might be due to the high amount of dissolved ions in
this canal.
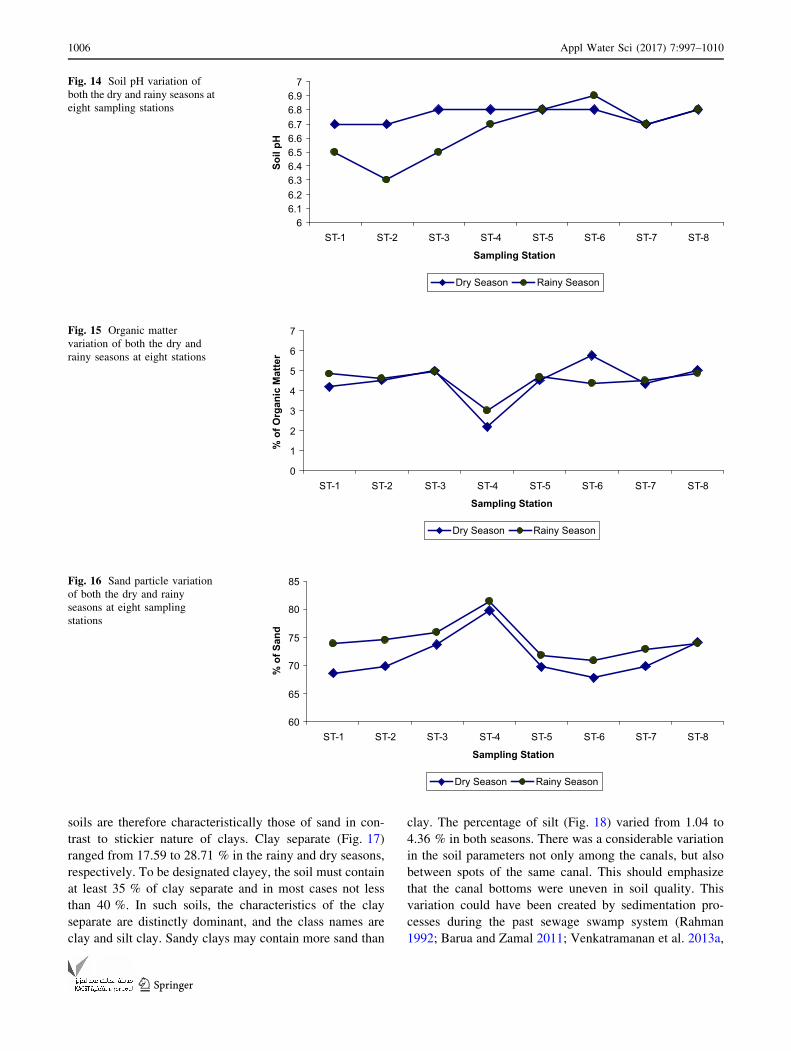
Seasonal variation of soil parameters
A maximum concentration of physico-chemical parameters
were observed in the dry season compared to the rainy
season except for sand. Soil pH was recorded as 7.0 at
Stations 1 and 2 during the rainy season, and the minimum
value observed was 6.7 at Stations 1, 2 and 7 in the dry
season (Fig. 14). With regard to the relationship of pH to
percent base saturation, the pH is normally highest in
hydrous oxide clay materials, intermediate in kaolinite and
humus, and lowest in minerals. Obviously, the type of clay
definitely affects the pH base saturation percentage rela-
tionship. The higher the exchange capacity of the sediment,
the greater is the buffer capacity (Farhadinejad et al. 2014),
but other factors are equal. Thus, the higher the clay and
organic matter contents, the more is the lime required for a
given change in the sediment pH (Barua and Zamal 2011).
Organic matter percentage ranged from 2.18 to 5.77 %
during the rainy and dry seasons, respectively (Fig. 15).
The fine texture of the soil in this environment also rep-
resents the accumulation of organic matter. This resulted
from very low rates of decomposition due to consistent
anaerobic condition created by the almost permanent sat-
uration with water (Farhadinejad et al. 2014). High organic
matter content poses threat to the depletion of DO in water
(Boyd 1990).
Sand particles fluctuated from 67.88 to 81.37 %
(Fig. 16). So this may be due to the rainfall effect, floc-
culation and coagulation process. The highest value of
81.37 was found in Station 4 during the rainy season, and
the lowest value was 67.88 in Station 6 during the dry
season. The sands group includes all soils in which the sand
separates make up at least 70 % and the clay separate 15 %
or class of the material by weight. The properties of such
00.05
0.10.15
0.20.25
0.30.35
0.40.45
ST-1 ST-2 ST-3 ST-4 ST-5 ST-6 ST-7 ST-8
Sampling Station
NO
2-N (m
g/l)
Dry Season Rainy Season
Fig. 12 Nitrite-nitrogen
variation of both the dry and
rainy seasons at eight sampling
stations
00.10.20.30.40.50.60.70.80.9
1
ST-1 ST-2 ST-3 ST-4 ST-5 ST-6 ST-7 ST-8
Sampling Station
PO4-
P (m
g/l)
Dry Season Rainy Season
Fig. 13 Po4-P (mg/l) variation
of both the dry and rainy
seasons at eight sampling
stations
Appl Water Sci (2017) 7:997–1010 1005
123
soils are therefore characteristically those of sand in con-
trast to stickier nature of clays. Clay separate (Fig. 17)
ranged from 17.59 to 28.71 % in the rainy and dry seasons,
respectively. To be designated clayey, the soil must contain
at least 35 % of clay separate and in most cases not less
than 40 %. In such soils, the characteristics of the clay
separate are distinctly dominant, and the class names are
clay and silt clay. Sandy clays may contain more sand than
clay. The percentage of silt (Fig. 18) varied from 1.04 to
4.36 % in both seasons. There was a considerable variation
in the soil parameters not only among the canals, but also
between spots of the same canal. This should emphasize
that the canal bottoms were uneven in soil quality. This
variation could have been created by sedimentation pro-
cesses during the past sewage swamp system (Rahman
1992; Barua and Zamal 2011; Venkatramanan et al. 2013a,
66.16.26.36.46.56.66.76.86.9
7
ST-1 ST-2 ST-3 ST-4 ST-5 ST-6 ST-7 ST-8
Sampling Station
Soil
pHDry Season Rainy Season
Fig. 14 Soil pH variation of
both the dry and rainy seasons at
eight sampling stations
0
1
2
3
4
5
6
7
ST-1 ST-2 ST-3 ST-4 ST-5 ST-6 ST-7 ST-8
Sampling Station
% o
f Org
anic
Mat
ter
Dry Season Rainy Season
Fig. 15 Organic matter
variation of both the dry and
rainy seasons at eight stations
60
65
70
75
80
85
ST-1 ST-2 ST-3 ST-4 ST-5 ST-6 ST-7 ST-8
Sampling Station
% o
f San
d
Dry Season Rainy Season
Fig. 16 Sand particle variation
of both the dry and rainy
seasons at eight sampling
stations
1006 Appl Water Sci (2017) 7:997–1010
123

b; Hossain et al. 2014). Scientific studies have shown that
the heavy metal concentration is controlled mainly by the
textural composition of the sample, i.e., fine-grained sedi-
ments register higher concentrations of trace metals than
sand-dominant sediments (Hossain et al. 2014; Dar 2014;
Venkatramanan et al. 2014a, b; Machender et al. 2014;
Rajganapathi et al. 2013). This information has wide-
ranging implications from the environmental perspective as
these contaminants get dispersed and find their way into the
food web of the aquatic ecosystems.
In the present investigation, experimental soils were
rather poor in total nitrogen (organic nitrogen) (Fig. 19) in
comparison to the organic matter content. The probable
high C/N ratios may inhibit the decomposition of organic
matter. This shows the characteristics of the peat layers. A
high organic matter poor in nitrogen is also conducive to
0
5
10
15
20
25
30
35
ST-1 ST-2 ST-3 ST-4 ST-5 ST-6 ST-7 ST-8
Sampling Station
% o
f Cla
yDry Season Rainy Season
Fig. 17 Clay particle variation
of both the dry and rainy
seasons at eight sampling
stations
00.5
11.5
22.5
33.5
44.5
5
ST-1 ST-2 ST-3 ST-4 ST-5 ST-6 ST-7 ST-8
Sampling Station
% o
f Silt
Dry Season Rainy Season
Fig. 18 Silt particle variation
of both the dry and rainy
seasons at eight sampling
stations
05
101520253035404550
ST-1 ST-2 ST-3 ST-4 ST-5 ST-6 ST-7 ST-8
Sampling Station
Org
anic
N2 (
mg/
100
gm)
Dry Season Rainy Season
Fig. 19 Organic nitrogen
variation of both the dry and
rainy seasons at eight sampling
stations
Appl Water Sci (2017) 7:997–1010 1007
123
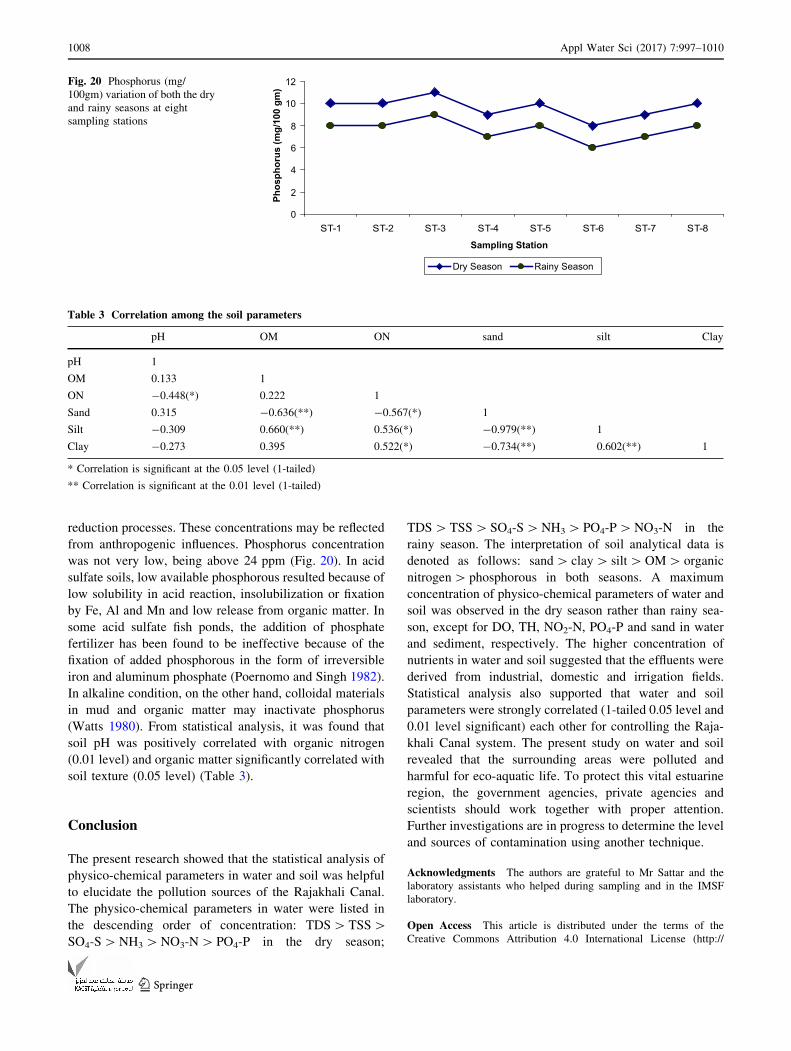
reduction processes. These concentrations may be reflected
from anthropogenic influences. Phosphorus concentration
was not very low, being above 24 ppm (Fig. 20). In acid
sulfate soils, low available phosphorous resulted because of
low solubility in acid reaction, insolubilization or fixation
by Fe, Al and Mn and low release from organic matter. In
some acid sulfate fish ponds, the addition of phosphate
fertilizer has been found to be ineffective because of the
fixation of added phosphorous in the form of irreversible
iron and aluminum phosphate (Poernomo and Singh 1982).
In alkaline condition, on the other hand, colloidal materials
in mud and organic matter may inactivate phosphorus
(Watts 1980). From statistical analysis, it was found that
soil pH was positively correlated with organic nitrogen
(0.01 level) and organic matter significantly correlated with
soil texture (0.05 level) (Table 3).
Conclusion
The present research showed that the statistical analysis of
physico-chemical parameters in water and soil was helpful
to elucidate the pollution sources of the Rajakhali Canal.
The physico-chemical parameters in water were listed in
the descending order of concentration: TDS[TSS[SO4-S[NH3[NO3-N[ PO4-P in the dry season;
TDS[TSS[SO4-S[NH3[ PO4-P[NO3-N in the
rainy season. The interpretation of soil analytical data is
denoted as follows: sand[ clay[ silt[OM[ organic
nitrogen[ phosphorous in both seasons. A maximum
concentration of physico-chemical parameters of water and
soil was observed in the dry season rather than rainy sea-
son, except for DO, TH, NO2-N, PO4-P and sand in water
and sediment, respectively. The higher concentration of
nutrients in water and soil suggested that the effluents were
derived from industrial, domestic and irrigation fields.
Statistical analysis also supported that water and soil
parameters were strongly correlated (1-tailed 0.05 level and
0.01 level significant) each other for controlling the Raja-
khali Canal system. The present study on water and soil
revealed that the surrounding areas were polluted and
harmful for eco-aquatic life. To protect this vital estuarine
region, the government agencies, private agencies and
scientists should work together with proper attention.
Further investigations are in progress to determine the level
and sources of contamination using another technique.
Acknowledgments The authors are grateful to Mr Sattar and the
laboratory assistants who helped during sampling and in the IMSF
laboratory.
Open Access This article is distributed under the terms of the
Creative Commons Attribution 4.0 International License (http://
0
2
4
6
8
10
12
ST-1 ST-2 ST-3 ST-4 ST-5 ST-6 ST-7 ST-8
Sampling Station
Phos
phor
us (m
g/10
0 gm
)Dry Season Rainy Season
Fig. 20 Phosphorus (mg/
100gm) variation of both the dry
and rainy seasons at eight
sampling stations
Table 3 Correlation among the soil parameters
pH OM ON sand silt Clay
pH 1
OM 0.133 1
ON -0.448(*) 0.222 1
Sand 0.315 -0.636(**) -0.567(*) 1
Silt -0.309 0.660(**) 0.536(*) -0.979(**) 1
Clay -0.273 0.395 0.522(*) -0.734(**) 0.602(**) 1
* Correlation is significant at the 0.05 level (1-tailed)
** Correlation is significant at the 0.01 level (1-tailed)
1008 Appl Water Sci (2017) 7:997–1010
123

creativecommons.org/licenses/by/4.0/), which permits unrestricted
use, distribution, and reproduction in any medium, provided you give
appropriate credit to the original author(s) and the source, provide a
link to the Creative Commons license, and indicate if changes were
made.
References
Ahmed S (1995). Comparative study of Municipal Sewage, Chit-
tagong. M.Sc. Thesis, Institute of Marine Sciences, University of
Chittagong, Chittagong, Bangladesh, p 58
Alam MM (1994). Study on the heavy metal concentrations in
estuarine water and shellfish of the Karnafully River estuary,
Chittagong. M.Sc. Thesis (unpublished), Institute of Marine
Sciences, University of Chittagong, Chittagong, Bangladesh,
p 44
Alam GJ (2009) Environmental pollution of Bangladesh—it’s effect
and control. Pulp Paper 51:13–17
American Public Health Association (APHA). (1995). Standard
methods for the examination of water and wastewater. American
Public Health Association, American Water Works Association,
and Water Pollution Control Federation. 19th edition, Washing-
ton, D.C
Banglapedia (2004) Asiatic Society of Bangladesh. http://www.
banglapedia.org/HT/K_0121.htm
Barnes H (1959) Apparatus and methods of oceanography (Chemi-
cal), vol 1. London and New York Academy Press. pp 178–183
Barua P, Zamal H (2011). Nutrient dynamics for coastal aquaculture
of Bangladesh. Lap Lambert Publishing, p 219
BCAS (2000) Pollution Study. Management of Aquatic Ecosystem
through Community Husbandry (MACH), Dhaka, p 102
Bhouyan AM (1979) Effect of industrial pollution on the biology of
the Karnafully River. M. Phil. Thesis, University of Chittagong,
Bangladesh, p 164
Boyd CE (1990) Water quality in ponds for aquaculture. Alabama
Agricultural Experiment Station, Auburn University, Alabama,
p 482
Boyd CE, Pippopinyo S (1994) Factors affecting respiration in dry
pond bottom soils. Aquaculture 120:283–293
Boyd CE, Tucker CS (1992) Water quality and pond soil analyses for
aquaculture. Alabama Agricultural Experiment Station, Auburn
University, Alabama, p 183
Chandran R, Ramamoorthi K (1984) Hydrobiological studies in the
gradient zone of the Vellar Estuary: 1. Physico-chemical
parameters. Mahasagar 17(2):69–77
Dar MA (2014) Distribution patterns of some heavy metals in the
surface sediment fractions at northern Safaga Bay, Red Sea,
Egypt. Arab J Geosci 7(1):55–67
De Cura B, Escaribano MI, Zamorano JP, Merodrio C (1996) High
CO2 treatment delays postharvest changes in RuBP Case ad
Polygalacturonase-related protein in cherimoya pee. J Am Soc
Hortic Sci 121:735–739
Department of Environment (1993) Institutional arrangement of
coastal zone management report prepared by Bangladesh centre
for advanced studies, p 45
DHV (1998) Southwest area water resources development project.
Feasibility study, final reports (vol 2 and 3) to Bangladesh water
development board, Government of Bangladesh
Farhadinejad T, Khakzad A, Jafari M, Shoaee Z, Khosrotehrani K,
Nobari R, Shahrokhi V (2014) The study of environmental
effects of chemical fertilizers and domestic sewage on water
quality of Taft region, Central Iran. Arab J Geosci 7(1):221–229
Grant N, Moodie, Weedon C (2005) Sewage solutions. Powys. CAT,
p 190
Holloway JM, Dahlgren RA, Hansen B, Casey WH (1998) Contri-
bution of bedrock nitrogen to high nitrate concentrations in
stream water. Nature 395:785–788
Hossain T (1992) Study on the Environment Impact Assessment
(EIA) of the effluent discharged by the Chittagong Urea
Fertilizer Limited (CUFL) on the Karnafully River estuary,
M.Sc. Thesis, Institute of Marine Sciences, University of
Chittagong, Chittagong, Bangladesh, p 55
Hossain M (2001) Biological aspects of the coastal and marine
environment of Bangladesh. Ocean Coast Manag 44(3):261–282
Hossain MB, Marshall DJ, Venkatramanan S (2014) Sediment
granulometry and organic matter content in the intertidal zone
of the Sungai Brunei estuarine system, Northwest coast of
Borneo. Carpath J Earth Environ Sci 9:231–239
Jackson ML (1958) Soil chemical analysis. Prentice-Hall Inc.
Englewood Cliffs, p 231
Kennish MJ (1996) Practical handbook of estuarine and marine
pollution, vol 10. CRC press, Taylor and Francis Group, pp 544
Khan YSA, Ahammod MS, Hossain MS (1996) Sewage pollution in
Chittagong Metropolitan Area, Bangladesh. Oriental Geographer
40:69–77
Klein L (1962) River pollution 2. Causes and Effects. Butter Worths
and Co. Ltd., London, p 206
Landolt E, Kandeler R (1987) Biosystematic Investigations in the
Family of Duckweeds (Lemnaceae): The Family of Lemnaceae-
a Monographic Study. Phytochemistry, physiology, application,
bibliography. Geobotanisches Institut der ETH
Li Z, Fang Y, Zeng G, Li J, Zhang Q, Yuan Q, Wang Y, Ye F (2009)
Temporal and spatial characteristics of surface water quality by
an improved universal pollution index in red soil hilly region of
South China: a case study in Liuyanghe River watershed.
Environ Geol 58:101–107
Luo XJ, Chen SJ, Ni HG, Yu M, Mai BX (2008) Tracing sewage
pollution in the Pearl River Delta and its adjacent coastal area of
South China Sea using linear alkylbenzenes (LABs). Mar Pollut
Bull 56(1):158–162
Machender G, Dhakate R, Rao SM, Rao BM, Prasanna L (2014)
Heavy metal contamination in sediments of Balanagar industrial
area, Hyderabad, Andhra Pradesh, India. Arab J Geosci
7(2):513–525
Mahmood N, Chowdhury MSU, Hossain MM, Haider SMB,
Chowdhury SR (1992) Review of the State of Environment
relating to Marine Fisheries of Bangladesh. Country status
report. BOBP (FAO) IMS. CU, p 85
Moore P (1972) Studies on the pollution of the Bhadra River Fisheries
and BhadraVathi (Mysore State) with industrial effluents. Nat Int
Sci Ind 22:132–160
Nair KVK, Gonapathi A (1983) Baseline Ecology of Edaeyur Sadras
Estuarine system at Kalpakkam part-1. General hydrographic
and chemical features. Mahassagar Bull Natl Inst Oceanogr
16:143–151
Nriagu JO, Pacyna JM (1988) Quantitative assessment of worldwide
contamination of air, water and soils by trace-metals. Nature
333:134–139
Pahl-Wostl C, Mostert E, Tabara D (2008) The growing importance
of social learning in water resources management and sustain-
ability science. Ecol Soc 13(1):24
Paul S (1981). Effect of oil pollution upon planktonic organisms of
the Karnafully River Estuary. M. Sc. Thesis, Institute of Marine
Sciences, University of Chittagong, Chittagong, Bangladesh,
p 48
Peierls BL, Caraco NF, Pace ML, Cole JJ (1998) Human influence on
river nitrogen. Nature 350:386–387
Appl Water Sci (2017) 7:997–1010 1009
123

Pekey H, Karaka D, Bakoglu M (2004) Source apportionment of trace
metals in surface waters of a polluted stream using multivariate
statistical analyses. Mar Pollut Bull 49:809–818
Poernomo A, Singh VP (1982) Problems, field identification and
practical solutions of acid sulfate soils for brackishwater
fishponds. Proc. Semi. Fish. Pond Engg., South China Sea
Program/Food and Agri. Orga., Surabaya, Indonesia, p 49–61
Rahman K (1992) Industrial pollution and control for sustainable
development. Training Manual on Environmental Management
in Bangladesh. DoE, Dhaka, pp 184–206
Rajganapathi VC, Jitheshkumar N, Sundararajan M, Bhat KH,
Velusamy S (2013) Grain size analysis and characterization of
sedimentary environment along Thiruchendur coast, Tamilnadu,
India. Arab J Geosci 6(12):4717–4728
Rashid MMU (1996) Study on water quality and commercial Ichthyo
Fauna of the Bankkhali River Estuary, M. Sc. Thesis, Institute of
Marine Sciences, University of Chittagong, Chittagong, Bangla-
desh, p 58
Remani KN, Devi S, Venugopal K, Unnithan RV (1983) Indicator
organisms of pollution in Cochin backwaters. Mahassagar Bull
Natl Inst Oceanogr 16:199–207
Richard LA (1954) Diagnosis and improvement of saline and alkali
soils. United States Department of Agriculture, Washington,
D.C. USA: Hand book 60
Sapon JSM (1993) Environmental impact assessment (EIA) of the
Municipal sewage discharge through Majhirghat canal on the
Karnafully River water, Chittagong. M. Sc Thesis. Institute of
Marine Sciences, University of Chittagong, Chittagong, Bangla-
desh, p 90
Shiklomanov IA (1993) World water resources. Water in Crisis. New
York, Oxford
Smith WG (1998) The tidal area study. An Interim Report. FAO/
UNDP fisheries resources survey system, Dhaka, p 58
Strickland JDH, Parsons TR (1968) A practical handbook of seawater
analysis. Pigment analysis, Bulletin of fisheries research. Bd.
Canada 167
Suess MJ (1982) Examination of water for pollution control, a
Reference Handbook, Pergamon Press. England 3:276–300
Thomas JFJ, Lynch J (1960) Determination of carbonate alkalinity in
natural waters. J Am Water Works Assoc 18:252–259
Venkatramanan S, Ramkumar T, Anithamary I (2013a) Distribution
of grain size, clay mineralogy and organic matter of surface
sediments from Tirumalairajanar Estuary, Tamilnadu, east coast
of India. Arab J Geosci 6:1371–1380
Venkatramanan S, Ramkumar T, Anithamary I, Jonathan MP (2013b)
Speciation of selected heavy metals geochemistry in surface
sediments from Tirumalairajan river estuary, east coast of India.
Environ Monit Assess 185:6563–6578
Venkatramanan S, Chung SY, Lee SY, Park N (2014a) Assessment of
river water quality via environmentric multivariate statistical
tools and water quality index: a case study of Nakdong river
basin, Korea. Carpath J Earth Environ Sci 9:125–132
Venkatramanan S, Ramkumar T, Anithamary I, Vasudevan S (2014b)
Heavy metal distribution in surface sediments of the Tiru-
malairajan river estuary and the surrounding coastal area, east
coast of India. Arab J Geosci 7(1):123–130
Verlencar XN (1987) Distribution of nutrients in the coastal and
estuarine water of Goa. Mahassagar Bull Natl Inst Oceanogr
20:205–215
Watts WA (1980) Late-Quaternary vegetation history at White Pond
on the inner coastal plain of South Carolina. Quatern Res
13(2):187–199
WHO, UNEP (1990) Assessment of fresh water quality report on the
results of the WHO/UNEP program on health related environ-
mental monitoring, 1, p 32
1010 Appl Water Sci (2017) 7:997–1010
123