environmental assessment update - canada-nova scotia offshore
TRANSCRIPT

January 30, 2014
Canada-Nova Scotia Offshore Petroleum Board1791 Barrington StreetHalifax, NS. B3J 3K9
Attention: Elizabeth MacDonald — Advisor, Environmental Affairs
Dear Ms. MacDonald,
Shell Canada Limited400 - 4th Avenue SW.P.O. Box 100, Station M
Calgary, Alberta T2P 2H5Tel (403) 691-3111lntemelwwsheLca
Subject: GeotechnicallGeologicallEngineering/Environmental Program AuthorizationChecklist # 8: - Environmental Assessment Update for Shell’s Shelburne Basin VentureSeabed Survey
In order to comply with the requirements of the Canada-Nova Scotia Offshore Petroleum Board inassociation with a Geotechnical/Geological/Bngineering/Environmental Program Authorization,Shell Canada Limited (Shell) submits an update to the previously approved EnvironmentalAssessment (BA) for Shell’s Shelburne Basin 3D Seismic Project in association with a seabedsurvey to be conducted in association with Exploration Licences 2423, 2424, 2425, 2426, 2429 and2430.
Please contact the undersigned at (403) 384-8747 with any questions, comments or concernsregarding this submission.
Sincerely,
/ 1 !(J %_
Candice Cook-OhrynEnvironment PlannerShell Canada Limited
cc. Erik Goodwin — ShellHeather Cousson — ShellScott McDonald - ShellGreg Krauss - ShellJoachim Pektzilikoglou — CNSOPB
huCfl
H — —
F.


Environmental Assessment Update:Shell Canada Limited’s Shelburne Basin Venture
Seabed Survey
Prepared by
environniental rcserch assoctates
for
©January 2014
Project No. SAl 249


Environmental Assessment Update:Shell Canada Limited’s Shelburne Basin Venture
Seabed Survey
Prepared by
LGL Limitedenvironmental research associates
388 Kenmount Road, Box 13248, Stn. A.St. John’s, NL A1B 4A5
Tel: 709-754-1992rbuchananlgl.com
www.lgl.com
and
P.O. Box 205, Mahone Bay, NS, BOJ 2E0adentremontlgl.com
Tel: 902-478-2268
Prepared for
Shell Canada Limited400 4th Avenue SWCalgary, AB T2P OJ1
January 2014Project No. SAl 249

Suggested format for citation:
LGL Limited. 2014. Environmental Assessment Update: Shell Canada Limited’s Shelburne Basin Venture Seabed Survey.LGL Rep. SA1249. Rep. by LGL Limited, St. John’s, NL and Mahone Bay, NS, for Shell Canada Limited, Calgary,AB. 24 p. + appendices.

Table of Contents
Page
Table of Contents iiList of Figures iiiList of Tables ivList of Acronyms v1 .0 Introduction I
1.1 Contacts 22.0 Description of the Project 3
2.1 Survey Vessel, Timing, and Duration 42.2 Seabed Sampling 42.3 Multibeam Echosounder 42.4 Autonomous Underwater Vehicle 5
3.0 Scope of the EA Update 63.1 Stakeholder Engagement 7
4.0 Valued Environmental Components (VEC) — Update 84.1 Species of Special Status 84.2 Special Areas 114.3 Other Users 11
4.3.1 Commercial Fisheries and DFO Scientific Research 114.3.2 Marine Shipping and DND Operations 13
5.0 MBES and Marine Mammals 135.1 Acoustic Modelling 145.2 Effects Assessment 15
5.2.1 Noise Criteria 155.2.2 Hearing Impairment 165.2.3 Disturbance Effects 18
6.0 Collection of Benthic Samples 197.0 Cumulative Effects 208.0 Mitigation and Monitoring 21
8.1 Marine Mammal and Sea Turtle Monitoring 228.2 Collection of Geotechnical Samples 22
9.0 Summary 2210.0 References 23Appendix A: Acoustic Modelling Report A-iAppendix B: Summary of Consultations B-i
Shelburne Bash Venture Seabed Survey LGL LimitedEnvironmental Assessment Update Page ii

List of FiguresPage
Figure 1.1 Location of Shell’s Exploration Licences 2Figure 2.1 Location of Shell’s Exploration Licences, Project Area and 2014 Activity Area 3Figure 2.2 Diagrammatic representation of a multibeam echosounder swath 5Figure 2.3 AUV mounted on a support vessel 6Figure 4.1 Locations of Special Areas in and near the Project Area as well as the locations of
the acoustic modelling sites 12Figure 7.1 Shell and BPs Licences on the Scotian Slope 21
Shelburne Basin Venture Seabed Survey LGL LimitedEnvironmental Assessment Update Page iii

List of Tables
Page
Table 4.1 SARA Schedule 1 and COSEWIC-listed marine species with reasonable likelihoodof occurrence in the Project and Study Areas 9
Table 4.2 Bird species included in bird families listed in Article I of the Migratory BirdsConvention Act (1994) with reasonable likelihood of occurrence in the Study Area 10
Shelburne Basin Venture Seabed Survey LGL LimitedEnvironmental Assessment Update Page iv

List of Acronyms
2D Two Dimensional (seismic survey)3D Three Dimensional (seismic survey)AZMP Atlantic Zone Monitoring ProgramAUV Autonomous Underwater VehicleCEAA Canadian Environmental Assessment ActCNSOPB Canada-Nova Scotia Offshore Petroleum BoardCOSEWIC Committee on the Status of Endangered Wildlife in CanadaCPAWS Canadian Parks and Wilderness SocietyCWS Canadian Wildlife ServiceDEC Department of Fisheries and Oceans CanadaDND Department of National DefenceEA Environmental AssessmentEAC Ecology Action CentreEL Exploration LicenceFAC Fisheries Advisory CommitteeFLO Fisheries Liaison OfficerHFC High-frequency CetaceanKMKNO Mi’kmaq Kwilmu’kw Maw-Klusuaqn Negotiation OfficeLEA Lobster Fishing AreaLFC Low-frequency CetaceanMBES Multibeam EchosounderMFC Mid-frequency CetaceanMMO Marine Mammal ObserverNOAA National Oceanic and Atmospheric AdministrationNMFS National Marine Fisheries ServicePTS Permanent Threshold ShiftPw Pinnipeds in WaterRAPID Rapid Climate Change Program (UK)RL Received LevelSARA Species atRiskActSBO Seabird ObserverSEA Strategic Environmental AssessmentSEL Sound Exposure LevelSL Source LevelSPL Sound Pressure LevelTTS Temporary Threshold ShiftVEC Valued Environmental ComponentWAZ Wide AzimuthWWF World Wildlife Fund
Shelburne Bash Venture Seabed Su’vey LGL LimitedEnvironmental Assessment Update Page v

1.0 Introduction
Shell Canada Limited (Shell or the Proponent) is proposing to conduct a seabed survey within the
southwest Scotian Slope region offshore of Nova Scotia, commencing in the second or third quarter of
2014. The seabed survey is being undertaken to satisfy the regulatory requirements of the Canada
Nova Scotia Offshore Petroleum Board (CNSOPB) under Section 8.2 of the Canada-Nova Scotia
Offshore Petroleum Board Geophysical and Geological Programs in the Nova Scotia Offshore Area
Guidelines for Work Programs, Authorizations and Reports (2012). The data collected from this
seabed survey will be utilized in combination with the reprocessed three dimensional (3D) Wide
Azimuth (WAZ) seismic data acquired in association with the Shelburne Basin 3D seismic survey
conducted in 2013 to produce a geohazard assessment that will assist in selecting appropriate drilling
locations.
The proposed survey will likely include the collection of bathymetry data using a multibeam
echosounder (MBES). There is possibility that there will also be a seabed sampling component
consisting of the collection of box and/or piston core samples from the ocean floor. Seabed
photography may also be undertaken as part of the program. Collectively, the above activities will be
referred to as “the 2014 Project”.
An environmental assessment or EA (LGL 2013) was submitted by Shell and approved by the
CNSOPB in 2013. This EA applied to all geophysical surveys (seismic and geohazard) conducted over
Shell’s Exploration Licences (ELs) during their initial six-year exploration period (Figure 1.1). The
current document is submitted to the CNSOPB as an update to Shell’s previously approved EA. As
with Shell’s original EA, this update has been guided by the Scoping Document released by the
CNSOPB in October 2012 (CNSOPB 2012) as well as advice provided from the CNSOPB in
association with this update.
Shelburne Basin Venture Seabed Survey LGL LimitedEnvironmental Assessment Update Page 1

EL2423 EL2424 EL2425
•Wote,p
LEGENDEpItahn LicEi,ceLoat (ml
N
Figure 1.1 Location of Shell’s Exploration Licences.
1.1 Contacts
Relevant Shell contacts for the 2014 Project include:
ATLANTICOCEAN
Erik GoodwinExploration Team LeadNova Scotia VentureShell Deepwater AmericasHouston, TX, USAPhone: (281) [email protected]
Candice Cook-OhrynEnvironment LeadShell Canada Limited400 4th Avenue SW.Calgary, AB T2P OJ1Phone: (403) [email protected]
Scott McDonald, P.EngEast Coast Operations ManagerShell Canada Limited1701 Hollis Streetgth Floor Founders SquareHalifax, NS B3J 3M8Phone: (902) 471-3798s. [email protected]
Shelburne Bash Venture Seabed SurveyEnvironmental Assessment Update
LGL LimitedPage 2
NW BRUNSWICK
NOVA SCOTIA
EL 2429
EL 2420
EL 2426

2.0 Description of the Project
The 2014 Project is located approximately 300 km south of Halifax, Nova Scotia, over portions ofShell’s Exploration Licences 2423, 2424, 2425, 2426, 2429, and 2430 in water depths ranging from1,500 to 3,500 m. The 2014 Project will be conducted over the 2013 Seismic Activity Area (Figure 2.1)as identified in the EA for Shell’s Shelburne Basin 3D survey (LGL 2013). Given that the context of thisupdate is the 2014 Project, this area will be referred to as the “2014 Activity Area”. The Project Areaoriginally defined in LGL (2013) will still apply to this project.
Figure 2.1 Location of Shell’s Exploration Licences, Project Area and 2014 Activity Area.
The final details (equipment, vessel, etc.) to be utilized for the 2014 Project have not yet beendetermined and are dependent upon bids received for the proposed Project. Shell anticipates makingthese decisions in the upcoming months, and the available information will be provided to theCNSOPB. As such, the technical details provided in this EA update are in consideration of the range ofoptions that may be chosen to support the 2014 Project.
The seabed survey is currently anticipated to consist of a MBES survey that will be used to providebathymetry data as well as identify seabed hazards at future drilling locations in combination with the
Shelburne Basin Venture Seabed SurveyEnvironmental Assessment Update
LGL LimitedPage 3

reprocessed 3D WAZ seismic data acquired in association with the Shelburne Basin 3D seismic surveyconducted in 2013. MBES are used worldwide for high resolution seabed mapping, geological,archaeological and oceanographic research, seabed cable routing, and offshore oil and gasexploration.
There is also a possibility that an autonomous underwater vehicle (AUV) equipped with sidescan sonar,MBES and/or sub-bottom profiler may be used to supplement the MBES survey at site specificlocations.
In addition to the MBES survey, the seabed sampling component of the 2014 Project will include thecollection of box cores and/or piston cores at specific locations, not presently determined, within the2014 Activity Area.
2.1 Survey Vessel, Timing, and Duration
The 2014 Project is anticipated to take approximately 45 days from mobilization to demobilization,weather permitting, with the MBES program occurring over a maximum of 20 days and seabedsampling over approximately 10 days. The Project will be undertaken during the April to Septembertimeframe assessed in the original EA (LGL 2013), although Shell’s preference at this time is to conductthe work from approximately 15 May to 1 July 2014. The field component will be followed by an office-based geohazard interpretation of potential drilling locations using the MBES data, core samples andphotographs, reprocessed 3D seismic data, and other available information on known obstructionssuch as seabed cables and shipwrecks.
The seabed survey will be undertaken by a single vessel, which will return to port every 21 to 28 days.No additional vessels will be required to support the 2014 Project. The vessel will conduct the MBESsurvey at a speed of between 4—8 knots.
2.2 Seabed Sampling
The exact number and locations of sampling have not yet been determined, but Shell currently expectssampling to occur at up to 15 specific locations within the 2014 Activity Area. The seabed samplingcomponent will include the collection of box cores (up to 10 sediment samples per location) for benthicinfaunal and epifaunal analysis, which will provide baseline benthic environmental data on prospectivedrilling locations. Drop camera still imagery of selected seafloor features may also be obtained duringthe seabed sampling. This seabed sampling may also consist of 6-m piston cores to be used forgeotechnical investigations and MBES backscatter characterization/extrapolation.
2.3 Multibeam Echosounder
A hull mounted single head MBES will be used for the program. The echosounder will be mounted at adepth of about 3—7 m. MBES systems are designed to perform seabed mapping with high resolutionand accuracy to a maximum depth ranging from 7000 m to full ocean depth. Surveying will occur 24hours a day when possible, although the echosounder will be turned off once per day in order toundertake velocity casts used to measure the speed of sound in the water column and also during linechanges. Most of the data will be acquired in an east/west direction (parallel to the shelf break),although some tie lines may be acquired in a north/south direction. Primary survey line spacing will bebetween -3000—6000 m. Tie Line spacing will be —30 km.
Shelburne Basin Venture Seabed Survey LGL LimitedEnvironmental Assessment Update Page 4

MBES operate by emitting a narrow fan of multiple acoustic beams to characterize the seafloor (Figure2.2). Each MBES head can emit one to several hundreds of beams. The systems operate at highfrequencies (10 to 900 kHz), which creates narrow beam widths ranging from 1/10 to several degrees.A system that operates at 30 kHz will be used to support the 2014 Project. The beam swath providesvertical coverage for a 1000_2000 sector in the plane perpendicular to the towing direction. The beampattern of a multibeam system is highly anisotropic (directionally dependent), with most acoustic energyemitted in the across-track direction (see Figure 4 in Appendix A).
Figure 2.2 Diagrammatic representation of a multibeam echosounder swath.Source: www.simrad.com
2.4 Autonomous Underwater Vehicle
As noted earlier, there is a small chance that the MBES survey may be supplemented using an AUV.AUVs are equipped with different sensors which can include a multibeam echosounder, sidescansonar, sub-bottom profiler, passive geochemical sensor (e.g., mass spectrometer, fluorometer), and/orstill image camera. The underwater vehicle would have an overall length of 4.5 to 7 m and a vehiclespeed of 2—6 knots. It would be capable of operating at water depths up to 4500 m and would operateapproximately 6 to 40 m above the seafloor. The AUV is remotely controlled by an operator onboard aship and is typically launched and recovered by a vessel mounted winch or A-frame (Figure 2.3).MBES systems used with an AUV would be of a higher frequency range than those used in a hullmounted MBES, described above, ranging from 200 to 400 kHz. Sidescan sonar system frequenciesrange from 100 to 850 kl-lz, and sub-bottom profiler frequencies range from I to 16 kHz. Line spacingin these surveys is approximately 200 m. As a result of the variation in location of the sensor as well asthe associated frequencies, this type of survey would only be used to collect high resolution informationat site specific locations and could not be used to collect the regional bathymetric information thatwould be collected with the MBES survey described above.
Shelburne Basin Venture Seabed SurveyEnvironmental Assessment Update
LGL LimitedPage 5

Figure 2.3 AUV mounted on a support vessel.Source: www.bluefinrobotics.com/products/bluefin-21
3.0 Scope of the EA Update
The CNSOPB, in a letter to Shell dated I May 2013, determined that the seismic survey proposed byShell was not likely to result in significant adverse environmental effects. This determination was basedon the final EA submitted by Shell on 5 April 2013 (LGL 2013). The scope of the EA included bothgeohazard programs and 3D seismic surveys. The EA was primarily guided by a Scoping Documentreleased by the CNSOPB in September 2012, by strategic environmental assessments (SEA) for thesouthwestern Scotian slope (Hurley 2011, 2012) and the eastern Scotian slope (Stantec 2012) and byinformation provided during Shell’s stakeholder consultations and review of the draft EA in the fall andwinter of 2012.
The MBES (and AUV) component of the Project was included within the scope of the approved EA.Additionally, the 2014 Project will be undertaken within the same Project Area and in a shortertimeframe (over the spring and summer operating season) and has therefore, been assessed within thepreviously approved EA. This update will therefore focus on any relevant changes that may haveoccurred since April 2013. This includes considerations such as:
Shelburne Basin Venture Seabed Suivey LGL LimitedEnvironmental Assessment Update Page 6

• Any new Species of Special Concern that have been designated under the Species at RiskAct, by the Committee on the Status of Endangered Wildlife in Canada (COSEWIC) or underthe Migratory Birds Convention Act that may occur within the Project Area:
• Any recently designated Special Areas:• Any new or experimental fisheries and fisheries research surveys;• Any significant changes in marine shipping, military operations or offshore oil and gas
projects in the vicinity of the proposed Project: and• Any resultant changes in mitigation.
Acoustic modelling of a representative hull mounted MBES has been undertaken to assist theassessment of potential adverse effects on marine mammals, as well as to identify specific operationalmeasures (if applicable) to minimize potential effects on marine mammals, and to confirm that theStudy Area within the original EA (defined by the acoustic modelling of the 3D seismic survey) is stillappropriate. The acoustic modelling methods are summarized in Section 5.0, and the modelling reportis provided in Appendix A. Section 5.0 also includes a discussion of potential adverse effects onmarine mammals from MBES including consideration of the acoustic modelling results.
The collection of seabed samples represents a new component of the 2014 Project. This component ofthe 2014 Project is modest, involving the collection of box and/or piston core samples as well as photosof the sea bottom at select locations. In order to address this additional component, a brief discussionon the benthic environment within the Project Area is provided in Section 6.0. Mitigation measures forthis component of the 2014 Project are provided in Section 8.2.
3.1 Stakeholder Engagement
In association with the 2014 Project, further stakeholder engagement was conducted to provideupdates on the proposed 2014 activity and to obtain feedback. Parties contacted in association withthe 2014 Project and EA update were those identified in the original EA. This EA update is inclusive ofany input and information received to date in association with these further engagements.
Face to face meetings were held with stakeholders and interest groups in August and September 2013.Additionally, information packages were disseminated to stakeholders on 28 January 2014. Informationpackages included up to date descriptions of the proposed 2014 Project as well as relevant Projectdetails and location maps. Recipients have been asked to review the information packages andencouraged to contact Shell with any comments or desire for further discussions regarding the 2014Project activities. Shell anticipates follow up in February 2014 to ensure that stakeholders are engagedand made aware of the EA update filing. Follow up meetings and communication will be organizedwhere requested with several face to face meetings already proposed by Shell for February 2014.
Engagement for the 2014 Project is being undertaken with the following stakeholders, First Nations andgovernment agencies:
• Barrington Municipality• Canadian Parks and Wilderness Society (CPAWS), Nova Scotia• CNSOPB’s Fisheries Advisory Committee (FAC)• Ecology Action Centre (EAC)
Shelburne Basin Venture Seabed Survey LGL LimitedEnvironmental Assessment Update Page 7

• Environment Canada• Fisheries and Oceans Canada (DFO)• Indian Brook/Shubenacadie Mi’kmaq Nation• Maritime Aboriginal Peoples Council/Native Council of Nova Scotia• Maritimes Energy Association• Mi’kmaq Kwilmu’kw Maw-Klusuaqn Negotiation Office (KMKNO)• Nova Scotia Department of Energy• Other Fisheries Industry Representatives• Queen’s Municipality• Sierra Club of Canada, Atlantic Chapter• Shelburne, Town of Shelburne, Municipality of the District of• World Wildlife Fund (WWF)• Yarmouth, Town of
As noted in the original EA, engagement has been and will continue to be ongoing throughout the 2014Project. Shell will continue to work with stakeholders to identify and seek to address issues andconcerns, if any, and will also continue to provide information about the Project to stakeholders as itbecomes available through information sessions or follow up information packages.
Appendix B provides an overview of stakeholder engagement that have taken place to date inassociation with the 2014 Project and is inclusive of any issues and concerns identified as part of theengagement process to date.
4.0 Valued Environmental Components (VEC) — Update
This section provides an update to the VECs assessed under the EA for Shell’s Shelburne Basin 3DSeismic Survey (LGL 2013).
4.1 Species of Special Status
Table 4.1 summarizes species at risk that could occur within the Project or Study Areas. There havebeen few changes since this table was presented in the original EA; however, four species have beenadded:
• Smooth skate, assessed as “Special Concern” by COSEWIC (COSEWIC 2012a);• Cusk, updated COSEWIC assessment from “threatened” to “endangered” in November
2012 (COSEWIC 2012b);• Thorny skate, assessed as “Special Concern” by COSEWIC (COSEWIC 2012c); and• American plaice, assessed as “threatened” by COSEWIC (COSEWIC 2009).
As of 10 December 2013, no additional species of special status which may occur within the Project orStudy Areas have been added to Schedule 1 of SARA.
Shelburne Basin Venture Seabed Survey LGL LimitedEnvironmental Assessment Update Page 8

Table 4.1 SARA Schedule I and COSEWIC-listed marine species with reasonable likelihood of
occurrence in the Project and Study Areas.
SPECIES SARA Schedule 1 COSEWICb
Common Name Scientific Name Endangered Threatened Endangered ThreatenedSpecial I Specialconcern concern
SARA Schedule 1 SpeciesBlue whale Balaenoptera
x x(Atlantic population) musculus
Euba/aenaNorth Atlantic right whale X X
glacial/sNorthern bottlenose whale Hyperoodon
x x(Scotian Shelf population) ampullatus
DermochelysLeatherback sea turtle X X
coriaceaRoseate Tern Sterna dougallil X XRed Knot Cal/dr/s canutus
x xrufa subspecies rufa
CarcharodonWhite shark X X
carchariasAnarhichas
Northern wolfish X Xden ticulatus
Spotted wolfish Anarhichas minor X XFin whale Balaenoptera
x x(Atlantic population) physalus
Mesoplodonx xSowerby’s beaked whale
b/densAtlantic wolffish Anarhichas lupus X XNon-SARA Schedule I Species listed by COSEWICLoggerhead sea turtle Caretta caretta XAtlantic bluefin tuna Thunnus thynnus XAtlantic cod
Gadus morhua X(Southern population)
CoryphaenoidesRoundnose grenadier x
rupestrisPorbeagle shark Lamna nasus XAtlantic salmon(Nova Scotia Southern Salmo salar XUpland population)Cusk Brosme brosme XShortfin rnako shark
lsurus oxyrinchus X(Atlantic population)Acadian redfish
Sebastes fasciatus X(Atlantic population)Winter skate (Eastern
Leucoraja ocellata XScotian Shelf population)Harbour porpoise
Phocoena(Northwest Atlantic X
phocoenapopulation)Spiny dogfish
Squalus acanthias X(Atlantic population)Roughhead grenadier Macrourus berglax XBasking shark Cetorhinus
x(Atlantic population) maximusBlue shark
Prionace glauca X(Atlantic population)Winter skate(Georges Bank-Western Leucoraja
xScotian Shelf-Bay of ocellataaFundy population)Killer whale(Northwest Atlantic- Orcinus orca XEastern Arctic population)
Shelburne Basin Venture Seabed Survey LGL LimitedEnvironmental Assessment Update Page 9

SPECIES SARA Schedule Ia COSEWICb
Endangered I Threatened ICommon Name Scientific Name Endangered ThreatenedSpecial I I Specialconcern concern
Species listed either under SARA or by COSEWIC since the original EA
Smooth skate Malacoraja senta XCusk
Brosme brosme X(updated assessment)Thorny skate Amblyraja radiata XAmerican plaice (listed byCOSEWIC in 2009, but not
Hippoglossoides xplatessoides
included above)
Sources: SARA website (hnp:I/www.sararegistry.gc.caldefault_e.ctm) (original search 5 October 2012; updated search 10 December 2013);COSEWIC website (http://www.cosewic.gc.calindex.htm) (original table as of 5 October 2012; updated search as of 10 December 2013);
Leatherback sea turtles were split into two populations (Atlantic and Pacific) in May 2012 and assessed by COSEWIC as endangered. Thecurrent SARA listing for leatherback sea turtles considers both populations combined.
Table 4.2 provides a list of species included in bird families listed under the Migratory Birds ConventionAct. This list remains unchanged from the table provided in the original EA (LGL 2013).
Table 4.2 Bird species included in bird families listed in Article I of the Migratory Birds ConventionAct(1994) with reasonable likelihood of occurrence in the Study Area.
Common Name Scientific NameProcellariidae
Northern Fulmar Fulmarus glacialis
cory’s Shearwater Calonectris diomedea
Greater Shearwater Puffinus gravis
Sooty Shearwater Puffinus griseus
Manx Shearwater Puffinus puffinus
Hydrobatidae
Leach’s Storm-Petrel Oceanodroma Ieucorhoa
Wilson’s Storm-Petrel Oceanites oceanicus
Sulidae
Northern Gannet Morus bassanus
Charadriidae
Black-bellied Plover Pluvialis squatarola
American Golden-Plover Pluvialis dominica
Scolopacidae
Whimbrel Numenius phaeopus
Hudsonian Godwit Limosa haemastica
Red Knot Calidris can utus rufa
White-rumped Sandpiper Calidris fuscicollis
Red Phalarope Phalaropus fulicarius
Red-necked Phalarope Phalaropus lobatus
Laridae
Black-legged Kittiwake Rissa tridactyla
Ivory Gull Pagophila eburnea
Herring Gull Larus argentatus
Iceland Gull Larus glaucoides
Lesser Black-backed Gull Larus fuscus
Shelburne Basin Venture Seabed Survey LGL LimitedEnvironmental Assessment Update Page 10

Common Name Scientific Name
Glaucous Gull Larus hyperboreus
Great Black-backed Gull Larus marinus
Roseate Tern Sterna dougallii
Arctic Tern Sterna paradisaea
Stercorariidae
Great Skua Stercorarius skua
South Polar Skua Stercorarius maccormicki
Pomarine Jaeger Stercorarius pomarinus
Parasitic Jaeger Stercorarius parasiticus
Long-tailed Jaeger Stercorarius Iongicaudus
Parulidae
Warblers Setophaga spp.Source: LGL 2013.
4.2 Special Areas
Figure 4.1 provides the location and extent of special areas assessed under the original EA.Legislation designating Sable Island as a National Park Reserve came into force on 1 December 2013,including a one nautical mile drilling buffer around the island. Sable Island is 150 km from the ProjectArea; thus, potential adverse effects from the Project are not anticipated. The Scoping Document alsoconcluded that Sable Island National Park is sufficiently distanced from the Project; therefore, anassessment in this EA update is not required (CNSOPB 2012).
No additional special marine areas have been designated in the Study and Project Areas since thecompletion of the original seismic EA in 2013.
4.3 Other Users
4.3.1 Commercial Fisheries and DFO Scientific Research
Sections 6.3.1 and 6.3.3 of the EA for the Shelburne Basin 3D seismic program (LGL 2013) provideoverviews of the commercial fishery and DFO scientific research, respectively.
Commercial fishery data used in the EA were collected during the 2005 to 2010 period. No additionalempirical data have been made available since completion of the EA. Therefore, the backgroundmaterial and the assessment related to the commercial fishery in the EA remain valid for this updatedocument. Large pelagic fishes (e.g., swordfish, sharks, tunas) dominate the commercial fisheryharvesting in the 2014 Activity Area. Notable groundfishes that were harvested within the 2014 ActivityArea during 2005-2010 include silver hake, Atlantic cod, cusk and haddock (see Table 6.5 in LGL2013). These fishes are not likely to be sensitive to the high-frequency MBES sound that will beemitted during the Project.
Shelburne Basin Venture Seabed Survey LGL LimitedEnvironmental Assessment Update Page 11

LEGEND
LlStudy Area Haddock Spawning Closure
Project Area Haddock Nursey Closure
jJ2014 Activity Area Redfish Nursery Closure
Georges Bank Moratorium Area Hell Hole
Scotiart SlopelShelf Break EBSA Lobster Closure (LFA 40)
Right Whale Critical Habitat tsobath (m)
Coral Conservation Area © Acoustic Modelling Site
/
ATLANTICOCEAN
4414
Figure 4.1 Locations of Special Areas in and near the Project Area as well as theacoustic modelling sites.
locations of the
Both fixed and mobile gears are typically used in the commercial fisheries conducted within the 2014Activity Area. Longlining (mobile gear) accounts for most of the harvesting in this area (—72% of totalcatch weight), followed by bottom otter trawling (—1 1%), gillnetting (—6%), and rod and reel (—5%) (seeTable 6.7 in LGL 2013).
With implementation of the mitigation measures described in the original EA (see Section 6.3.1 in LGL2013), the residual effect of the Project on the commercial fisheries is judged to be not significant. Thelevel of confidence associated with this judgment is high.
Background material and assessment provided for DFO scientific research in the original EA (LGL2013) also remain valid for this update document. None of the Atlantic Zone Monitoring Program(AZMP) or Rapid Climate Change Program (UK) (RAPID) stations occur within the 2014 Activity Area.There will not be any interference caused by the Project on these particular programs. There ispotential for effects from the Project on the DFO multi-species trawl survey, but any effect will be
NEW BRUNSWICK
MAtNE
NOVA SCOTIA
—Hat ifa4
Western
Emvruld yt4inl
• Bark
LeHuvv?‘
——
---‘—
I— •i
iteO3
824
i....’. —
erw
Shelburne Basin Venture Seabed SurveyEnvironmental Assessment Update
LGL LimitedPage 12

negligible given the ongoing communication between Shell and DFO, and the low sensitivity of mostfishes to high-frequency sound.
With implementation of the mitigation measures described in the original EA (see Section 6.3.3 in LGL2013), the residual effect of the Project on the DFO scientific research is judged to be not significant.The level of confidence associated with this judgment is high.
4.3.2 Marine Shipping and OND Operations
The EA for the Shelburne Basin 3D seismic program (LGL 2013) provides overviews of marine shipping(Section 6.3.2) and Department of National Defence (DND) operations (Section 6.3.4) over the westernScotian Slope and Shelf. The EA concluded that potential adverse effects on both ocean users fromseismic and geohazard programs would be not significant. Due to the changing nature and location ofDND operations, Shell will continue to engage with DND regarding its proposed activities to ensure thatany potential conflicts at sea are avoided. In addition, Notices to Mariners will be issued prior tocommencement of operations.
With implementation of the mitigation measures described in the original EA (see Section 6.3.3 in LGL2013), the residual effect of the Project on the marine shipping and DND Operations is judged to be notsignificant. The level of confidence associated with this judgment is high.
5.0 MBES and Marine Mammals
A MBES is a mapping sonar system that transmits sound energy to the ocean floor and analyzes thereturning signals to collect bathymetric data. Sounds from the MBES are emitted in very short pings,occurring once every 5—20 s for approximately 2—15 ms. The beam is narrow (1—4°) in the fore-aftextent and wide (1500) in the cross-track extent. Each ping consists of several successive fan-shapedtransmissions (segments) at different cross-track angles. MBES systems used with AUVs have ahigher frequency range (200—400 kHz) than those used in a hull mounted MBES system. Sidescansonars use frequencies of 100—850 kHz, and sub-bottom profiler frequencies range from 1—16 kHz. Inassociation with biological effects, sonars such as MBES systems with narrowband tonal or swept-tonalsignals and long enough signals (relative to the frequency for there to be many cycles during theduration of one ping) are classified as non-impulsive (Southall et al. 2007, p. 427-429).
There has been some recent attention given to the effects of MBES on marine mammals, as a result ofa recent independent scientific review panel linking the operation of a MBES to a mass stranding ofmelon-headed whales (Peponocephala electra; Southall et al. 2013) off of Madagascar. During May-June 2008, —100 melon-headed whales entered and stranded in the Loza Lagoon system in northwestMadagascar at the same time that a 12-kHz MBES survey was being conducted —65 km away off thecoast. In reviewing available information on the event, an independent scientific review panelconcluded that the Kongsberg EM 120 MBES was the most plausible trigger of the stranding. It shouldbe noted that this event is the first known marine mammal mass stranding closely associated with theoperation of a MBES. In association with this determination, it was identified that an unequivocalconclusion on causality of the event was limited because of a lack of information about the event and anumber of potentially contributing factors. Additionally, the independent review panel report indicatedthat this incident was likely the result of a complicated confluence of environmental, social and otherfactors that have a very low probability of occurring again in the future, but recommended that thepotential be considered in environmental planning. As a result of these findings and recommendations,
Shelburne Basin Venture Seabed Survey LGL LimitedEnvironmental Assessment Update Page 13

Shell has chosen to further consider and characterize the potential effects associated with the use ofMBES for the 2014 Project in this EA update.
In LGL (2013), two primary types of effects were assessed for marine mammals (i.e., Species ofSpecial Status): the potential for hearing impairment and disturbance. The primary focus of the originalEA (LGL 2013) was the effects of airgun array pulses from the 3D WAZ seismic survey, which areimpulse sounds with very rapid onset of high pressure. It is this rapid onset (at least in terrestrialmammals) that is largely responsible for the greater hearing damage potential of impulse soundscompared with non-impulse sounds. Sounds with such rapid onset inherently have a substantialbandwidth. Conversely, narrowband tonal or swept-tonal sounds such as those from MBES systems,do not have the sudden rise time characteristic of impulse sounds and as such are considered to havea reduced potential for causing hearing damage.
There is no available information on marine mammal behavioural response to MBES sounds (Southallet al. 2013). Much of the literature on marine mammal response to sonars relates to the types ofsonars used in naval operations, including Low-Frequency Active (LFA) sonars (e.g., Miller et al. 2000,2012; Clark et al. 2001; Sivle et al. 2012) and Mid-Frequency Active (MFA) sonars (e.g., Tyack et al.2011; MelcOn et al. 2012; Miller et al. 2012; DeRuiter et al. 2013a,b; Goldbogen et al. 2013). Similarly,there is no information on sea turtle responses to MBES sounds, but sea turtles in tanks showedagitated behaviour when exposed to recordings from the U.S. Navy’s LEA sonar (Samuel et al. 2005,2006).
However, the MBES (and AUV sound sources) proposed for use by Shell is quite different than navalsonars. Ping duration of the MBES is very short relative to naval sonars. Also, at any given location,an individual marine mammal would be in the beam of the MBES for much less time given the generallydownward orientation of the beam and its narrow fore-aft beamwidth; naval sonars often use near-horizontally-directed sound. In addition, naval sonars have higher duty cycles. These factors would allreduce the sound energy received from the MBES relative to that from naval sonars.
5.1 Acoustic Modelling
As noted above, acoustic modelling of a representative MBES (Kongsberg EM® 302) was conducted(by JASCO Applied Sciences). The source level (SL) of the EM 302 MBES (for a 2°x2° beamwidth)reported as Sound Exposure Level (SEL) and Sound Pressure Level (SPL) was 221 dB re 1 iJPa2•s @1 m (SEL; based on a pulse duration of 200 ms); 228 dB re 1 pPa I m (rms SPL; 1 second); and 231dB re 1 pPa @ 1 m (peak SPL). Details on modelling methods are provided in Section 3 of AppendixA. It was assumed that the EM 302 MBES used an operational frequency of 30 kHz, a ping duration of200 ms, was deployed at a depth of 5.5 m, and utilized a 2°x2° beamwidth. A wider along-trackbeamwidth (i.e., a 2°x150° equi-angled swath) was selected for modelling to produce a conservativebasis for assessing effects since this configuration produces larger radii associated with source levels.Since the EM 302 can survey with two swaths, the acoustic signature for one swath was duplicated.
Acoustic modelling of the MBES was conducted for the same three modelling sites used in the originalShelburne EA. The three sites were selected to represent sound propagation properties within theProject Area (Figure 4.1) and considered the proximity to Sensitive Areas, including the Roseway Basinright whale critical habitat. Modelling results were produced for the months of May and July torepresent variable sound speed profiles. As described in Section 5 of LGL (2013), the predicteddistances to specific sound levels were computed from the planar grids of the maximum-over-depth
Shelburne Basin Venture Seabed Survey LGL LimitedEnvironmental Assessment Update Page 14

sound fields. Two distances from the source are reported for each sound level: (1) Rmax, the maximumrange at which the given sound level was encountered in the modelled field grid; and (2) R95%, themaximum range to a grid point at which the given sound level was encountered after exclusion of the5% farthest such points. Rmax ranges were used for assessing effects because these results are moreprecautionary. In addition, marine mammal frequency weighting (M-weighting) was applied to fourfunctional hearing groups to weight the importance of received sound levels at particular frequencies.These four functional hearing groups include:
• Low-frequency cetaceans (LFCs)—mysticetes (baleen whales);• Mid-frequency cetaceans (MFCs)—most odontocetes (toothed whales);• I-ugh-frequency cetaceans (HFCs)—odontocetes specialized for using high-frequencies;• Pinnipeds in water (Pw)—seals, sea lions, and walrus. (Sea lions and walruses do not occur
in the Project Area.)
Should the parameters of the MBES that will be used in the 2014 Project change enough to warrantadditional analysis, Shell will conduct additional acoustic modelling.
5.2 Effects Assessment
5.2.1 Noise Criteria
There is currently no accepted criterion for behavioural disturbance of a marine mammal exposed todiscrete non-impulse sounds, such as those from MBES (Southall et al. 2007). The U.S. NationalMarine Fisheries Service (NMFS) has been using a behavioural disturbance criterion for pulsed soundsat an SPL of 160 dB re 1 IJP8 (rms; see Southall et al. 2007), but the National Oceanic andAtmospheric Administration’s (NOAA) is currently working on developing new guidelines with respect toimpacts of sound on behaviour (NOAA 2014). The criterion for continuous sounds (e.g., ship noise andsome construction activities) currently used is 120 dB re 1 pPa (NMFS 2005) and is discussed in theEA relative to disturbance effects.
As discussed in LGL (2013), temporary or permanent hearing impairment is a possibility when marinemammals are exposed to very strong sounds. Temporary Threshold Shift (TTS) has beendemonstrated and studied in certain captive odontocetes and pinnipeds exposed to strong sounds(reviewed in Southall et al. 2007 and Appendix D of LGL 2013). However, there has been no specificdocumentation of TTS in free-ranging marine mammals.
In reviewing the available literature on noise-induced hearing loss in terrestrial and marine mammals,Southall et al. (2007) concluded that marine mammals below the surface can likely tolerate (beforeonset of permanent hearing damage) exposure to about 17 dB higher received acoustic energy level ifthe sound is non-impulsive as opposed to impulsive. Although this recommended criterion is currentlyunder re-evaluation by U.S. regulators taking into account new auditory data acquired since 2007(NOAA 2013), the new criteria have not formally been accepted. In addition, NOAA’s proposed newguidelines also indicate that marine mammals can tolerate exposure to higher energy levels if thesound is non-impulsive, but the specific energy-level tolerance variation from non-impulsive vs.impulsive sound has not yet been established. As a result, the scientific recommendations provided inSouthall et al. (2007), which were used to establish hearing impairment criteria for marine mammals
Shelburne Basin Venture Seabed Survey LGL LimitedEnvironmental Assessment Update Page 15

(included in the Species of Special Status VEC) in the EA are still considered appropriate and werealso used for this EA Update.
The following received levels (RL) of sound (or criteria) were used to assess potential risk of hearingimpairment effects of MBES “non-pulse” sound on those cetacean species listed on Schedule 1 ofSARA that require specific assessment as per the requirements outlined in the Scoping Document.
Permanent Threshold Shift (PTS)
• Received energy level (SEL) 215 dB re I pPa2 s (M-weighted) or• Received sound pressure level (peak) 230 dB re 1 pPa (flat or unweighted).
Temporary Threshold Shift (TTS)
• Received energy level (SEL) 195 dB re 1 iJPa2 s (M-weighted) or• Received sound pressure level (peak) 224 dB re I pPa (flat or unweighted).
There is uncertainty regarding the exposure period that should be used to calculate cumulative SEL forpurposes of assessing potential auditory effects. However, the suggestion by Southall et al. (2007) thatsound exposure be cumulated over 24 hours was very much a subjective judgement, with no specificempirical or other scientific basis insofar as marine mammals are concerned (W. John Richardson, LGLLimited, pers. comm., 2012). Here, the modeling results are not based on cumulative SEL but ratheron the exposure level of a single ping of the MBES.
5.2.2 Hearing Impairment
Given that many cetaceans are expected to exhibit at least localized avoidance of the survey vessel,Species of Special Status (right, blue, fin, northern bottlenose and Sowerby’s beaked whale consideredin LGL 2013) within the Study Area are unlikely to be exposed to levels of sound from the MBES (orAUV sound sources) high enough to cause hearing impairment. In addition to the non-impulsecharacter, MBES signals have other properties that reduce their potential for biological effects onmarine mammals which include the following:
(a) Though the transmitted MBES signals have high source levels, the sound transmitted in anyone direction is of short duration, which limits the total energy content of the sound signalreceived by any animal.
(b) An MBES sound source is normally in motion, so an animal at a specific location willnormally receive strong signals from only one or a few sequential pings, which would likelynot be enough cumulative sound to result in any hearing impairment. [An exception couldoccur if the animal is moving in parallel with the sound source, “keeping pace” with it.]
(c) Animals close to the transducer are the ones that could potentially receive the strongestsounds, but such animals are not likely to be in the narrow beam for long enough to receivemore than a single strong ping.
Shelburne Basin Venture Seabed Survey LGL LimitedEnvironmentalAssessment Update Page 16

Based on the acoustic modelling results (Appendix A), and using a TTS criterion of 195 dB SEL (Mweighted), it is estimated that MBES sounds may elicit a temporary change in hearing in LFC and MFCat <10 m from the source at the shallow- (Site 1), intermediate-depth (Site 2), and deep-water (Site 3)sites. Thus, a cetacean would have to be even closer to the MBES (within several metres) or receivemultiple pings to be exposed to sound levels thought to potentially cause PTS (based on SEL and peakSPL).
The chance of an animal remaining within the vicinity of the moving ship and receiving more than 1 or 2pings is considered unlikely. Marine mammals that encounter the MBES are unlikely to be subjected torepeated pings because of the narrow fore-aft width of the beam. They will receive only limitedamounts of energy because of the short duration of individual pings. Animals close to the ship (wherethe beam is narrowest) are especially unlikely to be ensonified for more than one or two pings.Similarly, Kremser et al. (2005) noted that the probability of a cetacean swimming through the area ofexposure when an MBES emits a ping is small. The animal would have to pass the transducer at closerange and be swimming at speeds similar to the vessel in order to receive the multiple pings that mightresult in sufficient exposure to cause TTS. Burkhardt et al. (2008) also reported that cetaceans arevery unlikely to incur PTS from operation of scientific sonars such as a MBES on a ship that isunderway. Lurton and DeRuiter (2011) suggested that because MBES pose a reduced risk ofauditory injury to marine mammals in comparison to military sonar and seismic airguns, that theoperation of MBES systems may in turn require a reduced level of mitigation. To further minimize thelikelihood of marine mammals (and sea turtles) incurring hear impairment, a 30 kHz MBES versus a12 kHz MBES was selected for use during the 2014 seabed survey.
The fact that baleen whales (right, blue and fin whales) are not expected to be as sensitive to MBESsounds as the operating frequency is outside their range of best hearing, and they are expected toexhibit at least localized avoidance of sound sources, there is little potential for baleen whales to getclose enough to the operating MBES to experience PTS. It is also unlikely that baleen whales wouldexperience TTS given that they typically avoid close approach to vessels (even in the absence ofMBES). If a right, blue or fin whale (i.e., Species of Special Status) did experience TTS, the effectswould be short-term in nature. Additionally, few right and blue whales are expected to occur within theProject Area where hearing impairment has the potential to occur.
MBES sounds are judged to have negligible to minor hearing impairment effects on LFC (right, blue,and fin whales), over a short-term duration of <1 month, in an area <1 km2. Therefore, hearingimpairment residual effects on baleen whales are judged to be not significant. The level of confidenceassociated with this judgement is high. Likewise, MBES sounds are judged to have negligible to minorhearing impairment effects on MFC (northern bottlenose and Sowerby’s beaked whales), over a short-term duration of <1 month, in an area <1 km2. Thus, hearing impairment residual effects on MFC arejudged to be not significant. The level of confidence associated with this judgement is high.
MBES and sidescan sonar systems used with an AUV would be of a higher frequency range (200—400 kHz and 100—850 kHz, respectively) than those used in a hull mounted MBES; sub-bottom profilerfrequencies range from 1—16 kHz. Given the fact that the frequencies of the AUV MBES and sidescansonar are generally outside of the best hearing range of most cetaceans, and that the AUV will beoperated intermittently 6-40 m above the seafloor, these sound sources are judged to have negligiblehearing impairment effects on cetaceans, over a short-term duration of <1 month, in an area <1 km2.Impacts from the sub-bottom profiler are appropriately considered in association with the assessment ofthe MBES. Kremser et al. (2005) noted that the probability of a cetacean swimming through the area of
Shelburne Basin Venture Seabed Survey LGL LimitedEnvironmental Assessment Update Page 17

exposure when a bottom profiler emits a ping is small. Therefore, hearing impairment residual effectsof AUV sound sources on cetaceans (right, blue, fin, northern bottlenose, and Sowerby’s beakedwhales) are judged to be not significant. The level of confidence associated with this judgement is high.
Although information on the effects of discrete, non-impulse sounds on sea turtles is lacking, it isunlikely that MBES or AUV operations would elicit hearing impairment in sea turtles given the briefexposure and the fact that the MBES frequency is far above the range of optimal hearing (100—700 Hz)by sea turtles (see Appendix E in LGL 2013). MBES and AUV operations are judged to have negligibleto minor hearing impairment effects on sea turtles, over a short-term duration of <1 month, in an area<1 km2. Therefore, hearing impairment residual effects on sea turtles are judged to be not significant.The level of confidence associated with this judgement is high.
5.2.3 Disturbance Effects
Although information on the effects of MBES sounds on cetaceans and sea turtles is lacking, there could be
behavioural or disturbance effects on these animals in the Study Area. Responses of free-ranging
cetaceans to military sonars appear to vary by species, circumstance, and behavioural state; some
individuals show temporary avoidance behaviour whereas others do not appear to respond overtly to
exposures (Southall et al. 2011). Impacts of operating sonars on most cetaceans are likely to be
related to disturbance and are expected to be negligible to minor, short-term, and limited to distances of
a few km from the ship given the brief duration of exposure.
Based on acoustic modelling and utilizing the 160 dB re 1 pPa rms sound level as a guide forbehavioural responses, the distance where responses would most likely occur would be up to 2 kmfrom the MBES. Even if a behavioural criterion of 120 dB re 1 pPa rms were used for continuoussounds, the distance to this sound level would be less <7 km. These distances are smaller than thosewhere avoidance would most likely occur from an operational seismic array (—8—26 km; see LGL 2013).In addition, distances to SPLs of >120 dB re 1 iJPa rms are relatively short and sound levels >120 dBfrom the MBES are not expected to occur in North Atlantic right whale critical habitat. The distance atwhich behavioural responses could occur are considered smaller for LFC compared with MFC, as themain frequency of the MBES is not within the best hearing range of the LFC. In contrast, the frequencyused by the MBES is within the functionally hearing range of MFC.
The Study Area is not known to contain any important feeding, breeding, or socializing areas for marinemammal Species of Special Status. Although North Atlantic right whale critical habitat is located near theStudy Area, no disturbing or potentially injurious sound levels from the MBES are expected to occur incritical habitat. Thus, right whales as well as other Special Status species (e.g., northern bottlenosewhale) will not be displaced from critical habitat, and localized displacement within the Study Area isunlikely to constitute a significant effect for cetaceans. Based on these considerations, sounds from theMBES are judged to have minor disturbance effects on LFC, over a short-term duration of <1 month and ageographic extent of 1-10 km2 to 11-100 km2. Sounds from the AUV equipment (sub-bottom profiler,200 or 400 kHz MBES, and sidescan sonar), which will be operated intermittently 6-40 m above theseafloor are judged to have minor disturbance effects on LFC, over a short-term duration of < 1 month anda geographic extent of 1-10 km2 to 11-100 km2. Therefore, residual effects related to disturbance, arejudged to be not significant for LFC. The level of confidence associated with this judgement is medium.MBES sounds and sound sources used by an AUV are judged to have minor to moderate disturbanceeffects on MFC, over a short-term duration of <1 month and a geographic extent of <1 km2 to 1-10 km2.
Shelburne Basin Venture Seabed Survey LGL LimitedEnvironmentalAssessment Update Page 18

Therefore, residual effects related to disturbance, are judged to be not significant for MFC. The level ofconfidence associated with this judgement is medium.
The Study Area does not contain critical habitat for any species of sea turtle. Thus, sea turtles withSpecial Status will not be displaced from critical habitat, and localized displacement within the StudyArea is unlikely to constitute a significant effect for sea turtles. Based on these considerations, soundsfrom the MBES and AUV operations are judged to have minor disturbance effects on sea turtles, over ashort-term duration of <1 month and a geographic extent of 1-10 km2. Residual effects on sea turtles arejudged to be not significant. The level of confidence associated with this judgement is high.
Given the location of the Shell survey area approximately 300 km offshore Nova Scotia and well awayfrom coastal areas where marine mammals could potentially strand, the likelihood of a stranding eventis considered quite low. Unlike the stranding of melon-headed whales in Madagascar (see Southall etal. 2013), where whales moved from their pelagic habitat into a nearby unfamiliar location that isconsidered unsuitable habitat (a lagoon system), the Study Area is located far enough from the NovaScotian coast that potential disturbance to cetaceans as a result of MBES is considered very unlikely toresult in a stranding event. Results from acoustic modelling further support this conclusion, as soundlevels >120 dB re I pPa rms are not expected to occur more than 7 km from the MBES.
6.0 Collection of Benthic Samples
A maximum of 150 box core samples will be collected within the 2014 Activity Area over a maximum of15 locations. This will also include drop camera still imagery of selected seafloor features. In addition,a small number of 6-rn piston cores may be collected for geotechnical investigations and MBESbackscatter characterization/extrapolation.
The seafloor within the 2014 Activity Area is mainly silt, clay and sand of Holocene age. Isolated gravelsize material is present but rare (Hurley 2011). Benthic faunal distribution is patchy and low inabundance and diversity based on observations in nearby exploration licences. The benthic communityis likely to be dominated by invertebrate groups such as (in order of relative abundance) anemones,ophiuroids, polychaetes, sponges, bivalves, gastropods, and sea urchins. The absence of hardsubstrate and low currents likely limits coral development although black corals and sea pens havebeen observed in water depths up to 3000 m off of the Northeast Channel (Hurley 2011).
The total volume of sediment to be collected will be small (up to 6 cubic metres based on a maximumsample size of 37 L per box core and a 7.5 cm diameter piston core) over a few square metres of seabottom. Sampling will be guided, if feasible, by images from the drop camera to avoid anyconcentrations of corals, if any. The information gathered from the box cores, and the drop cameraimages may contribute valuable baseline information on the benthic fauna at potential drilling locations.Residual effects related to the removal and disturbance of a negligible portion of benthic habitat overthe western Scotian slope is judged to be not significant. The level of confidence associated with thisjudgment is high.
Shelburne Basin Venture Seabed Survey LGL LimitedEnvironmental Assessment Update Page 19

7.0 Cumulative Effects
Section 9.0 of the EA of the Shelburne Basin 3D seismic project addresses potential cumulative effectsfrom past, present and reasonably foreseeable projects. For the most part, patterns of “other users” onthe western Scotian Shelf and slope have not changed since early 2013. The primary difference is asmall number of new projects listed on the CNSOPB’s Public Registry. These include:
• Shell’s Shelburne Basin Venture Exploration Drilling Project (also listed on the CEAARegistry); and
• BP Exploration Canada’s Tangier 3D Seismic Survey.
Both projects are presently in the process of completing their environmental assessments.
Shell’s proposed drilling project will not commence until 2015. The MBES and geotechnical workproposed under this EA update is being done in support of Shell’s proposed drilling program and isexpected to take place in 2014. It will provide valuable technical and environmental information in theplanning and safe execution of the program; significant adverse environmental effects are notanticipated.
BP’s Tangier 3D wide-azimuth seismic survey is scheduled to commence in 2014 over their fourlicences which run eastward from the eastern boundary of EL2426 (Figure 7.1). The seismic programis scheduled to operate during the operational window from 1 April to 30 November. Five seismicvessels will be used, all towing airgun source arrays with the two outer vessels also towing streamers(which contain the hydrophone receivers). As was the case with Shell’s 2013 survey, the arrays will notbe activated simultaneously but instead will be activated sequentially (i.e., only one airgun array isactivated at a time across all vessels). There is some overlap between the BP and Shell Study andProject areas. Shell and BP are coordinating efforts to minimize the potential for interaction duringsurveying in 2014. Each program will have one or more Fisheries Liaison Officers (FLO) on board andwill be expected by the CNSOPB to maintain communications with the fishery to reduce any potentialissues at sea.
The BP wide-azimuth seismic survey will implement mitigation and monitoring to minimize the potentialfor effects of sound on marine mammals and sea turtles produced during surveying. The BP seismicsurvey and the Shell MBES survey will use equipment that operate at very different main frequencies;seismic airgun surveys emit most energy in the low-frequency range (10—1 20 Hz), whereas the MBESand AUV sensors for Shell’s survey will use much higher frequencies (>30 kHz for the MBES andsidescan sonar; 1—16 kHzforthe sub-bottom profiler). In addition, the exposure area of Shell’s seabedsurvey is much smaller than the one for BP’s seismic survey; sound levels <120 dB re 1 pPa rms arenot expected to occur more than 7 km from the MBES. Given the monitoring and mitigation measuresfor the BP seismic survey, as well as the different frequency ranges and exposure areas of the twosurveys, there is minimal potential for synergistic cumulative effects on marine mammals and seaturtles. Nonetheless, it is possible that some marine mammals, particularly those that occur near or inthe area of overlap between the Shell and BP Project Areas could experience cumulative disturbanceeffects. This potential is reduced because BP will not operate airgun(s) during survey line changes. Nosignificant cumulative effects are expected on VECs, including marine mammal and sea turtle Speciesof Special Status.
Shelburne Basin Venture Seabed Survey LGL LimitedEnvironmental Assessment Update Page 20

Figure 7.1 Shell and BP’s Licences on the Scotian Slope.Source: www.cnsopb.ns.calsitesldefault/fileslpdfslweb_map_slope_zoom.pdf
8.0 Mitigation and Monitoring
Presently, there are no defined mitigation requirements for MBES surveys as there are for seismicsurveys in Canada. As discussed in Section 5, sounds from seismic surveys (i.e., airguns) are quitedifferent than those from a MBES—seismic sources produce impulse sounds with very rapid onset ofhigh pressure, therefore, have greater potential for acoustic impacts. Additionally, given the estimatedsound levels from the MBES and acoustic properties, including the narrow beam width of the MBES,hearing impairment effects for marine mammals and sea turtles are considered unlikely (see Section5.2.2). As noted earlier, during planning for the seabed survey, Shell determined that a 30 kHz (versus12 kHz) MBES will be used to further minimize the likelihood of marine mammals and sea turtlesexperiencing hearing impairment from MBES sounds. Given these considerations as well as a reviewof existing scientific data, acoustic modeling results for the MBES, and the assessment of the potentialeffects on marine mammals and sea turtles in the Study Area, operational mitigation measures specificto minimizing the effects of MBES and AUV sound sources on marine mammals and sea turtles (i.e.,Species of Special Status as per the Scoping Document) are deemed unnecessary. Although specificoperational mitigation measures will not be used for the MBES program, Marine MammalObservers/Seabird Observers (MMOs/SBOs) will be placed on the survey vessel to collect data onmarine mammals and sea turtles and conduct systematic seabird counts (see Section 8.1). The reader
Shelburne Basin Venture Seabed Survey LGL LimitedEnvironmental Assessment Update Page 21
Licence RepresentativesBP Canada Energy Company ExxonMobtl Canada Ltd.
OP Exploration (Canada) Umited ] ExxonMobil Canada Properties
Chevron Canada Ltd. Shell Canada Limtted
EnCana Corporation [] NS13-1 parcels

is referred to Section 11.0 of the original EA (LGL 2013) for a detailed summary of those mitigationsthat apply to lighting and stranded birds, fisheries interactions (exclusive of those that apply specificallyto seismic gear), interactions with other ocean users, general ship operations (exclusive of those thatapply specifically to seismic gear), vessel wastes and air emissions, and malfunctions and accidentalevents. Specific mitigation measures will be implemented during the collection of geotechnical samples(see Section 8.2).
8.1 Marine Mammal and Sea Turtle Monitoring
There will be two MMOs/SBOs on the survey vessel to conduct systematic watches for marinemammals and sea turtles during the seabed survey. These MMOs/SBOs will be tasked with visualmonitoring during all daylight hours. Each MMD will not conduct more than eight hours of visualwatches per day, and each watch will not exceed four hours.
The key responsibilities of MMOs/SBOs are as follow:
a. Conduct systematic watches for marine mammals and sea turtles, includingobservations on behaviour;
b. Conduct systematic sea bird surveys in accordance with the recommended CanadianWildlife Service protocol;
c. Perform daily searches of vessels for stranded birds and implement appropriate protocolfor any stranded birds found; and
d. Record and compile daily Marine Mammal and Seabird Observations.
8.2 Collection of Geotechnical Samples
Mitigation for the geotechnical component of the 2014 Project will include using a drop camera, wherefeasible, to verify the presence/absence of deepwater corals at the potential sampling locations, and toavoid removing or disturbing corals.
9.0 Summary
The MBES and AUV surveys for the 2014 Project fall within the scope of Shell’s original seismic EA,which was approved by the CNSOPB in May 2013. Modelling of a representative MBES system hasconfirmed that potential hearing impairment for cetaceans and sea turtles is unlikely, and disturbanceeffects on marine mammals and turtles will occur over a smaller spatial extent than for Shell’s WAZseismic survey in 2013. Judgments of the significance of potential adverse effects presented in theoriginal EA therefore apply to the 2014 Project. Residual effects from the MBES component and AUVsound sources on Species of Special Status, Special Areas and Other Users are judged to be notsignificant. The level of confidence is high for potential impacts on hearing impairment, and potentialeffects on Special Places and Other Users. The level of confidence is medium for residual effectsrelated to disturbance of marine mammals and high for residual effects related to disturbance of seaturtles.
Shelburne Basin Venture Seabed Suivey LGL LimitedEnvironmental Assessment Update Page 22

Given the small scope of the geotechnical sampling component of the 2014 Project, and limiteddisturbance of the seabed, potential residual effects are judged to be not significant. The level ofconfidence is high.
10.0 References
Burkhardt, E., 0. Boebel, H. Bornemann, and C. RuholI. 2008. Risk assessment of scientific sonars. Bioacoustics17:235-237.
Clark, C.W., P. Tyack, and W.T. Ellison. 2001. Revised Overseas Environmental Impact Statement andEnvironmental Impact Statement for Surveillance Towed Array Sensor System Low Frequency Active(SURTASS LEA) Sonar Technical Report 1: Low frequency Sound Scientific Research ProgramTechnical Report (Responses of four species of whales to sounds of SURTASS LEA sonartransmissions). Prepared for the U.S. Department of the Navy.
CNSOPB. 2012. Shell Canada Ltd. Shelburne Basin 3-D seismic survey for exploration licences 2423, 2424,2425, and 2426 — Scoping document for the environmental assessment. 8 p.
COSEWIC. 2009. COSEWIC assessment and status report on the American Plaice Hippoglossoidesplatessoides, Maritime population, Newfoundland and Labrador population and Arctic population, inCanada. Committee on the Status of Endangered Wildlife in Canada. Ottawa. x + 74 p.
COSEWIC. 2012a. COSEWIC assessment and status report on the Smooth Skate Malacoraja senta in Canada.Committee on the Status of Endangered Wildlife in Canada. Ottawa. xix + 77 p.
COSEWIC. 2012b. COSEWIC assessment and status report on the Cusk Brosme brosme in Canada. Committeeon the Status of Endangered Wildlife in Canada. Ottawa. x + 85 p.
COSEWIC. 2012c. COSEWIC assessment and status report on the Thorny Skate Amblyraja radiata in Canada.Committee on the Status of Endangered Wildlife in Canada. Ottawa. ix ÷ 75 p.
DeRuiter, S.L., IL. Boyd, D.E. Claridge, C.W. Clark, C. Gagnon, B.L. Southall, and P.L. Tyack. 2013a. Deiphinidwhistle production and call matching during playback of simulated military sonar. Mar. Mamm. Sci.29(2):E46-E59.
DeRuiter, S.L., B.L. Southall, J. Calambokidis, W.M.X. Zimmer, D. Sadykova, E.A. Ealcone, A.S. Eriedlaender,J.E. Joseph, D. Moretti, G.S. Schorr, L. Thomas, and P.L. Tyack. 2013b. First direct measurements ofbehavioural responses by Cuvier’s beaked whales to mid-frequency active sonar. Biol. Lett. 9:20 130223.http://dx.doi.org/l0.l098/rsbl.2013.0223.
Goldbogen, J.A., B.L. Southall, S.L. DeRuiter, J. Calambokidis, A.S. Friedlaender, E.L. Hazen, E. Ealcone, G.Schorr, A. Douglas, D.J. Moretti, C. Kyburg, M.F. McKenna, and P.L. Tyack. 2013. Blue whales respondto simulated mid-frequency military sonar. Proc. R. Soc. B. 280:20130657.http://dx.doi.org/l0.l098/rspb.2013.0657.
Hildebrand, J.A. 2005. Impacts of anthropogenic sound. p. 101-124 In: J.E. Reynolds, W.F. Perrin, R.R. Reeves,S. Montgomery, and T. Ragen (eds.) Marine Mammal Research: Conservation Beyond Crisis. JohnsHopkins Univ. Press, Baltimore, MD. 223 p.
Hurley, G.V. 2011. Strategic environmental assessment — Petroleum exploration activities on the southwesternScotian Shelf. Consultant rep. by Hurley Environmental Ltd. for the Canada-Nova Scotia OffshorePetroleum Board, November 2011.94 p. + appendices.
Hurley, G.V. 2012. Strategic environmental assessment Addendum — Petroleum exploration activities on thesouthwestern Scotian Shelf. Consultant rep. by Hurley Environmental Ltd. for the Canada-Nova ScotiaOffshore Petroleum Board, July 2012. 20 p.
Kremser, U., P. Klemm, and W.D. Kötz. 2005. Estimating the risk of temporary acoustic threshold shift, caused byhydroacoustic devices, in whales in the Southern Ocean. Antarctic Sci. 17(1):3-10.
LGL Limited. 2013. Environmental Assessment of Shell Canada Ltd.’s Shelburne Basin 3-D Seismic Survey. LGLRep. SA1175. Rep. by LGL Limited, St. John’s, NL and Mahone Bay, NS, for Shell Canada Limited,Calgary, AB. l27p + Appendices.
Lurton, X. and S. DeRuiter. 2011. Sound radiation of seafloor-mapping echosounders in the water column, inrelation to the risks posed to marine mammals. International Hydrographic Review. November 2011:7-17.
Shelburne Basin Venture Seabed Survey LGL LimitedEnvironmental Assessment Update Page 23

MelcOn, M.L., A.J. Cummins, S.M. Kerosky, L.K. Roche, S.M. Wiggins, J.A. Hildebrand. 2012. Blue whalesrespond to anthropogenic noise. PLoS ONE 7(2):1-6 (e32681).
Miller, P.J.O., N. Biassoni, A. Samuels, and P.L. Tyack. 2000. Whale songs lengthen in response to sonar. Nature405:903.
Miller, P.J.O., P.H. Kvadsheim, F.P.A. Lam, P.J. Wensveen, R. Antunes, A.C. Alves, F. Visser, L. Kleivane, P.L.Tyack, and L.D. Sivle. 2012. The severity of behavioral changes observed during experimental exposuresof killer (Orcinus orca), long-finned pilot (Globicephala me/as), and sperm whales (Physetermacrocephalus)to naval sonar. Aquat. Mamm. 38:362-401.
NMFS (National Marine Fisheries Service). 2005. Endangered fish and wildlife; notice of intent to prepare anenvironmental impact statement. Fed. Reg. 70(7): 1871—1875.
NOAA (National Oceanic & Atmospheric Administration. 2013. Draft guidance for assessing the effects ofanthropogenic sound on marine mammals/Acoustic threshold levels for onset of permanent andtemporary threshold shifts (Draft: 23 Dec. 2013). Nat. Marine Fish. Serv./NOAA, Silver Spring, MD. 76 p.
NOAA. 2014. NOAA’s marine mammal acoustic guidance. Status of NOAA’s guidance for assessing the effects ofanthropogenic sound on marine mammals. Accessed on 15 January 2014 athttp://www.nmfs.noaa.gov/pr/acoustics/guidelines.htm
Samuel, Y., S.J. Morreale, C.W. Clark, C.H. Greene, and M.E. Richmond. 2005. Underwater, low-frequency noisein a coastal sea turtle habitat. J. Acoust. Soc. Am. 117(3):1465-1472.
Samuel, Y., S.J. Morreale, C.W. Clark, M.E. Richmond, and C.H. Greene. 2006. Underwater noise andanthropogenic disturbance in critical sea turtle habitats. p. 93 In: N.J. Pllcher (ed.), Proc. 23’ Symp. onSea Turtle Biology and Conservation. NOAA Tech. Memo. NMFS-SEFSC-536. 283 p.
Sivle L.D., P.H. Kvadsheim, A. Fahlman, F.P.A. Lam, P.L. Tyack, and P.J.O. Miller. 2012. Changes in divebehavior during naval sonar exposure in killer whales, long-finned pilot whales, and sperm whales. Front.Physiol. 3(400). (doi:10.3389/fphys.2012.00400)
Southall, B.L., A.E. Bowles, W.T. Ellison, J.J. Finneran, R.L. Gentry, C.R. Greene Jr., D. Kastak, D.R. Ketten, J.H.Miller, P.E. Nachtigall, W.J. Richardson, J.A. Thomas, and P.L. Tyack. 2007. Marine mammal noise exposure criteria: initial scientific recommendations. Aquat. Mamm. 33(4):411-522.
Southall, B.L., J. Calambokidis, P. Tyack, D. Moretti, J. Hildebrand, C. Kyburg, R. Carison, A. Friedlaender, E.Falcone, G. Schorr, A. Douglas, S. DeRuiter, J. Goldbogen, T. Pusser, and J. Barlow. 2011. Biologicaland behavioural response studies of marine mammals in Southern California (SOCAL-lO). p. 270 In:Abstr. 19th Bienn. Conf. Biol. Mar. Mamm., Tampa, Florida, 27 November-2 December. 344 p.
Southall, B.L., T. Rowles, F. Gulland, R.W. Baird, and P.D. Jepson. 2013. Final report of the IndependentScientific Review Panel investigating potential contributing factors to a 2008 mass stranding of melon-headed whales (Peponocepha/a electra) in Antsohihy, Madagascar. Available at http://iwc.intJ2008-mass-stranding-in-madagascar
Stantec (Consulting). 2012. Strategic environmental assessment for offshore petroleum exploration activities.Eastern Scotian Slope (Phase 1B). Prep. for the Canada-Nova Scotia Offshore Petroleum Board.Halifax, NS.
Tyack, P.L., W.M.X. Zimmer, D. Moretti, B.L. Southall, D.E. Claridge, J.W. Durban, C.W. Clark, A. D’Amico, N.DiMarzio, S. Jarvis, E. McCarthy, R. Morrissey, J. Ward, and l.L. Boyd. 2011. Beaked whales respond tosimulated and actual navy sonar. PLoS One:6(e17009).
Shelburne Basin Venture Seabed Survey LGL LimitedEnvironmental Assessment Update Page 24

Appendix A: Acoustic Modelling Report
A-i

ASCOAPPLILI.) SC]EN(}S
Underwater Sound Modelling for Shell Canada Limited’sShelburne Basin Venture Seabed Survey
Multibeam Echosounder EM® 302
Submitted to:LGL Limited environmental research associatesSt. John’s, NLAuthors:Marie-Noel R Matthews
30 January 2014
JASCO Applied Sciences (Canada) Ltd.2305—4464 Markham Street
Victoria, BC V8Z 7X8 CanadaTel: +1-250-483-3300Fax: +1-250-483-3301
www.jasco.com
P001191-002Document 00706Version 2.0

JASCO AP[’IlFDSC IENCES Underwater Sound Modelling: Shelburne Basin Venture Seabed Survey
Document Version Control
Version Date Name Change
1.0 2014 Jan 13 M-N R Matthews Draft released to client for review.
Changes throughout based on client’s comment. The
2.0 2014 Jan 28 M-N R Matthews sound levels threshold considered were changed to reflect
that of a non-impulsive source.
Suggested citation:
Matthews, M.-N. R. 2014. Underwater Sound Modelling for Shell Canada Limited’s Shelburne BasinVenture Seabed Survey: Multibearn Echosounder EM 302. JASCO Document 00706, Version 2.0.Technical report by JASCO Applied Sciences for LGL Limited environmental research associates.

JASCO APPlIED Sc IENCES Underwater Sound Modelling: Shelburne Basin Venture Seabed Survey
Contents
1. Introduction 1
1.1. Project Overview and Modelling Approach
1.2. Acoustic Metrics 2
1.3. Marine Mammal Frequency Weighting 3
2. Scenarios 5
3. Methods 7
3.1. Source Levels and Directivity 7
3.1.1. Beam pattern calculation 7
3.1.2. Beam pattern of rectangular transducers and multibeam systems 8
3.2. Sound Propagation 9
3.3. Peak and rms SPL 11
3.4. Model Parameters 11
3.4.1. Bathyrnetry 11
3.4.2. Geoacoustics 11
3.4.3. Sound speed profile 12
3.5. Geometry 14
4. Results 15
4.1. Source Levels and Directivity 15
4.2. Sound Fields 17
4.2.1.Sitel 20
4.2.2. Site 2 23
4.2.3. Site 3 26
5. Discussion 29
Literature Cited 30
Version 2.0
JASCO .\P[’1lFD SClr-<CFS Underwater Sound Modelling: Shelburne Basin Venture Seabed Survey
Figures
Figure 1. M-weighting functions for the four underwater functional marine mammal hearing groupsas defined by Southall et al. (2007) 4
Figure 2. Location of the modelled sites within the project area, 300 km south of Halifax, NS 5
Figure 3. Typical 3-D beam pattern of a circular transducer 7
Figure 4. 2-D polar representation of a beam pattern obtained by measuring, in situ (vertical slice),a Kongsberg transducer. (This plot was obtained from Kongsberg) 8
Figure 5. Estimated beam pattern for a rectangular transducer with a 4° x 10° beamwidth 9
Figure 6. Calculated bean-i pattern for two rectangular transducers engaged successively, withindividual beamwidths of 1.5°x50° and a declination angle of 25° 9
Figure 7. Representation of Nx2-D and maximum-over-depth approaches 10
Figure 8. Example of maximum-over-depth sound exposure levels (SELs) colour contour maps fortwo random seismic sources 11
Figure 9. Monthly sound speed profiles in deep (>200 m) and shallow ( 200 m) waters within theproject area, derived from the GDEM ocean climatology of temperature and salinity 13
Figure 10. Calculated beam pattern for the Kongsberg EM® 302 transducer at 30 kHz 16
Figure 11. Calculated beam pattern vertical slice for the Kongsberg Sirnrad EM® 302 transducer at30 kHz (a) along- track; (b) across-track direction 16
Figure 12. Sound exposure levels (SELs,) at Site 1, May: Received maximum-over-depth soundlevels for a single pulse from the EM® 302. Blue contours indicate water depth in metres 20
Figure 13. Sound exposure levels (‘SELs) at Site L July: Received maximum-over-depth soundlevels for a single pulse from the EM’ 302. Blue contours indicate water depth in metres 21
Figure 14. Sound exposure levels (‘SELs,) at Site 2, May: Received maximum-over-depth soundlevels for a single pulse from the EM 302. Blue contours indicate water depth in metres 23
Figure 15. Sound exposure levels (‘SELs) at Site 2, July: Received maximum-over-depth soundlevels for a single pulse from the EM® 302. Blue contours indicate water depth in metres 24
Figure 16. Sound exposure levels (SELs,) at Site 3, May: Received maximum-over-depth soundlevels for a single pulse from the EM® 302. Blue contours indicate water depth in metres 26
Figure 17. Sound exposure levels (‘SELs) at Site 3, July: Received maximum-over-depth soundlevels for a single pulse from the EM® 302. Blue contours indicate water depth in metres 27
Version 2.0

JASCO AP1[,lEDSwNcL Underwater Sound Modelling: Shelburne Basin Venture Seabed Survey
Tables
Table 1. The low (J) and high (f1) frequency weighting parameters for four underwater functionalmarine mammal hearing groups as defined by Southall et al. (2007) 4
Table 2. Locations and water depths of the sites modelled within the project area 6
Table 3. Geoacoustic profile for Sites 1—3, which all have a multi-layered sandy bottom 12
Table 4. EM® 302 multibeam echosounder parameters 15
Table 5. Maximum (Rmax, m) and 95% (R95%, in) horizontal distances from the EM® 302 multibearnechosounder to modelled unweighted, maximum-over-depth per-pulse sound exposure levels(SELs) 18
Table 6. Maximum (Rmax, rn) and 95% (R95%, m) horizontal distances from the EM® 302 multibearnechosounder to modelled maximum-over-depth per-pulse rms sound pressure levels (nnsSPLs) 18
Table 7. Maximum (Rinax, in) and 95% (R95%, in) horizontal distances from the EM® 302 multibearnechosounder to modelled maximum-over-depth peak sound pressure levels (peak SPLs) 19
Table 8. Site 1, May: Maximum (Rmax, rn) and 95% (R95%, rn) horizontal distances from the EM® 302multibeam echosounder to modelled unweighted and in-weighted, maximum-over-depth per-pulse sound exposure levels (SEL5) 21
Table 9. Site 1, July: Maximum (Rinax, in) and 95% (R95%, in) horizontal distances from the EM® 302multibeam echosounder to modelled unweighted and m-weighted, maximum-over-depth per-pulse sound exposure levels (SELs) 22
Table 10. Site 2, May: Maximum (Rinax, m) and 95% (R95%, m) horizontal distances from the EM®302 multibearn echosounder to modelled unweighted and rn-weighted, maximum-over-depthper-pulse sound exposure levels (SELs) 25
Table 11. Site 2, July: Maximum (Rmax, m) and 95% (R95%, m) horizontal distances from the EM®302 multibeam echosounder to modelled unweighted and m-weighted, maximum-over-depthper-pulse sound exposure levels (SELs) 25
Table 12. Site 3, May: Maximum (Rmax, rn) and 95% (R95%, in) horizontal distances from the EM®302 multibeam echosounder to modelled unweighted and rn-weighted, maximum-over-depthper-pulse sound exposure levels (SELs) 28
Table 13. Site 3, July: Maximum (Rmax, m) and 95% (R95®,, m) horizontal distances from the EM®302 multibearn echosounder to modelled unweighted and m-weighted, maximum-over-depthper-pulse sound exposure levels (SELs) 28
Version 2.0 iv

JASCO :\Pl’IIFDS( IF\ L Underwater Sound Modelling: Shelburne Basin Venture Seabed Survey
1. Introduction
1.1 Project Overview and Modelling Approach
JASCO Applied Sciences (Canada) Ltd. (JASCO) conducted a modelling study for LGL Limited (LGL)to predict the underwater sound levels propagating from a representative hull-mounted multibearnechosounder being considered for use during Shell Canada Limited (Shell)’s Shelburne Basin VentureSeabed Survey. Shell plans to conduct this survey within Exploration Licences 2423, 2424, 2425, 2426,2429 and 2430 located approximately 300 km south of Halifax, Nova Scotia.
For purposes of the enviromnental assessment (EA) update, JASCO modelled underwater sound levelspropagating from the Kongsberg’s hull-mounted multibeam echosounder EM® 302. This modelling studyis an extension of the report produced for the Shell’s Shelburne Basin 3D survey (Matthews 2012)conducted in 2013. It is intended to provide reasonable scenarios to illustrate the sound levels that couldpotentially be reached during the survey. In this study, the survey area was assumed to be the same as the2013 survey utilized in the previous study, but as requested by Shell, the 2014 Activity Area is showed inall presented maps. As a result of a similar spatial area, the modelled sites in both studies are the same.
The underwater acoustic signature of the multibeam echosounder was predicted based on the standardformula for the beam pattern of rectangular transducers and the available specifications of Kongsberg’sEM® 302 system. Sound levels at distances from the echosounder were predicted using JASCO’sunderwater acoustic propagation model in conjunction with the modelled source signature. Thesepredictions considered two water temperature profiles representative of Shell’s currently preferredoperational months (May to July), and accounted for range-dependent environmental properties in thearea.
Sections 1.2 and 1.3 define the different metrics commonly used to represent underwater acoustic fields.Section 3 discusses the methodology for predicting the source signature and modelling soundpropagation, and describes the specifications of the source, the modelled source locations, and allenvironmental parameters used in the propagation model. Section 4 presents the model results in twoformats: tables of maximum and 95% distances to sound levels, and sound field contour maps, whichshow the directivity and range to various sound levels.
The distances from the multibeam echosounder to specific per-pulse levels are provided in 10 dBincrements for these metrics:
• unweighted (per pulse) sound exposure levels (SELs) of 200 to 120 dB re 1 iiPa2s.• M-weighted (per pulse) SELs of 200 to 120 dB re 1 iPa2sfor each marine mammal functional
hearing group (in water).
• root-mean-square (rms) sound pressure levels (SPLs) of 200 to 120 dB re 1 iPa.• peak SPLs of 220 to 120 dB re 1 jiPa.
Section 5 discusses the estimated maximum distances to sound isopleths, including (but not restricted to)the estimates most relevant to the EA, i.e., maximum distances to 215 and 195 dB re 1 iiPa2s(SEL) andto 230 and 224 dB re 1 jiPa (peak SPL).
Version 2.0

JASCO /\PPL1FD SCII>.CH Underwater Sound Modelling: Shelburne Basin Venture Seabed Survey
1.2 Acoustic Metrics
Underwater sound amplitude is measured in decibels (dB), relative to a standard reference pressure ofp0= 1 iiPa. Several sound level metrics are commonly used to describe impulsive noise. The primary soundlevel metrics relevant to this report are peak sound pressure level (peak SPL), root-mean-square (rrns)SPL, and sound exposure level (SEL).
The zero-to-peak SPL, or peak SPL (Lpk, dB re I liPa), is the maximum instantaneous sound pressurelevel in a stated frequency band attained by an irnpulse,p(t):
maxp2 (t))Lk =lOlog10
2 (1)p0
Although the peak SPL metric is commonly used to measure impulsive sounds, it does not account for theduration or bandwidth of the noise. At high intensities, the peak SPL can be a valid criterion for assessingwhether a sound is potentially injurious; however, because the peak SPL does not consider pulse duration,it is not a good indicator of perceived loudness.
The root-mean square (nns) SPL (Lv, dB re I iPa) is the rms pressure level in a stated frequency bandover a time window (T, s) containing the pulse:
= lOlogio[1jp2 (t)dt/P] (2)
The rms SPL measures the average pressure or the effective pressure over the duration of an acousticevent, such as the emission of one acoustic pulse. Because the window length, T, is a divisor, pulses morespread out in time have a lower rms SPL for the same total acoustic energy.
The SEL (dB re 1 jtPa2s, symbol LE) is the time integral of the squared pressure over a fixed timewindow containing the entire pulse, T:
LE=1Ologiofp2(t)dt/Top]
(3)
where T0 is a reference time interval of 1 s. The per-pulse SEL is measured in units of dB re 1 iiPaIs orequivalently dB re 1 tPa2s. This measure represents the total energy delivered over the duration of anacoustic event at a receiver location. It is related to sound energy (or exposure) rather than soundpressure. SEL can be either a metric that describes the sound level for a single sound pulse, or acumulative metric if it is applied over periods that contain multiple pulses.
Because rms SPL and SEL are both computed from the integral of square pressure, these metrics arerelated numerically by an expression (Equation 4) that depends on the duration of the integration timewindow, T:
L90 = LE — 10 log(T/T0) (4)
Version 2.0 2

JASCO \l1’IIED SCFENL Underwater Sound Modelling: Shelburne Basin Venture Seabed Survey
1.3 Marine Mammal Frequency Weighting
The potential for anthropogenic noise to affect a marine mammal depends on how well the animal canhear the noise; noises at frequencies that animals cannot hear well are less likely to disturb or injure them(Southall et al. 2007). An exception occurs when the sound pressure is so high that it causes physicalinjury. The importance of sound levels to an animal can be determined with frequency weighting basedon audiograrns (Nedwell and Turnpenny 1998, Nedwell et a!. 2007).
Based on a literature review of marine mammal hearing and on physiological and behavioural responsesto anthropogenic sound, Southall et al. (2007) proposed standard frequency weighting functions—referredto as M-weighting functions—for five functional marine mammal hearing groups:
• Low-frequency cetaceans (LFCs)—rnysticetes (baleen whales)
• Mid-frequency cetaceans (MFCs)—sorne odontocetes (toothed whales)
• High-frequency cetaceans (HFCs)—odontocetes specialized for using high frequencies
• Pinnipeds in water (Pw)—seals, sea lions, and walrus
• Pinnipeds in air (not addressed here)
For member species of these hearing groups, the discount applied by the M-weighting functions for less-audible frequencies is less than that indicated by the corresponding audiograms (where available). Therationale for applying a smaller discount than suggested by audiograms is due in part to this observedmammalian hearing characteristic: perceived equal loudness curves increasingly have less rapid roll-offoutside the most sensitive hearing frequency range when sound levels increase. This is why, for example,C-weighting curves for humans, which are used to assess how humans perceive loud sounds such asblasts, are flatter than A-weighting curves, which are used to assess humans’ reactions to quiet throughmid-level sounds. Additionally, out-of-band frequencies, though less audible, can still cause physicalinjury if pressure levels are sufficiently high. The M-weighting functions therefore should only be appliedat high sound levels where effects such as temporary threshold shift (TTS) or pennanent threshold shift(PTS) in hearing may occur. Using M-weighting is considered cautionary (in the sense of overestimatingthe potential for impact) when it is applied to lower level effects such as the onset of behaviouralresponses. Figure 1 shows the frequency dependence of the M-weighting functions (in dB) for the fourfunctional marine mammal hearing groups addressed in this report, based on Southall et al. (2007).
Version 2.0 3
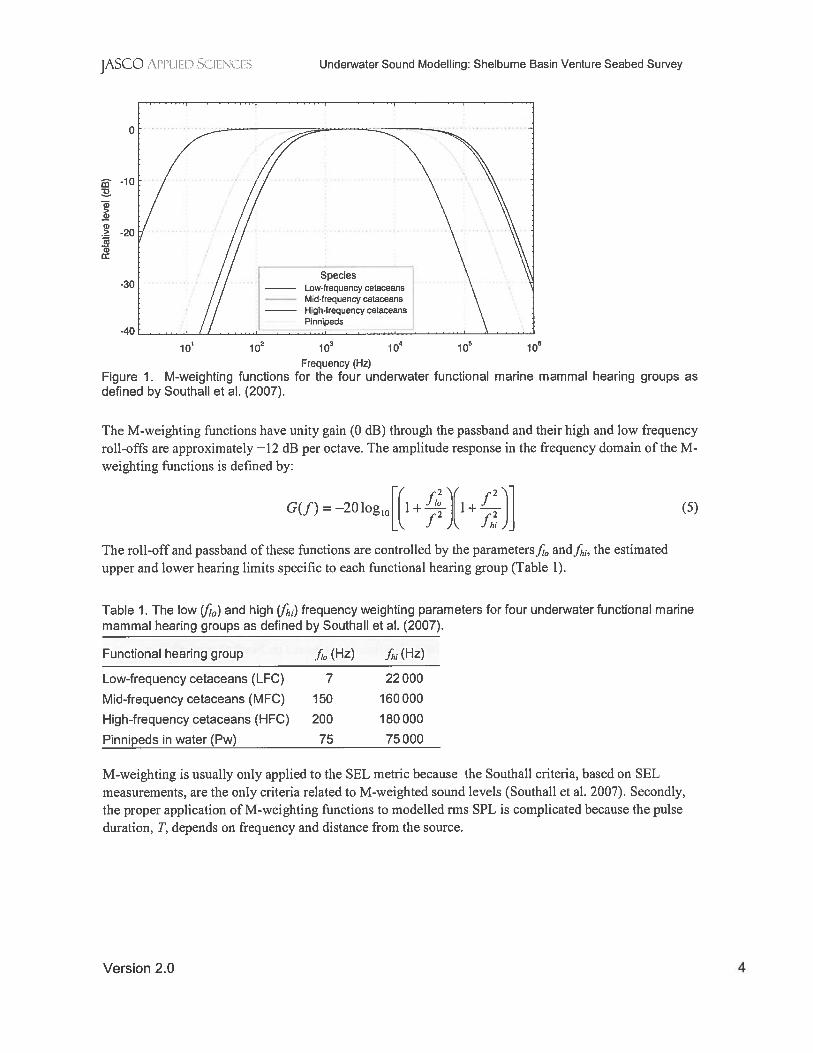
JASCO ArliliDS 1 Underwater Sound Modelling: Shelburne Basin Venture Seabed Survey
-o
0>0
tl)>
cr30cc
Frequency (Hz)Figure 1. M-weighting functions for the four underwater functional marine mammal hearing groups asdefined by Southall et al. (2007).
The M-weighting functions have unity gain (0 dB) through the passband and their high and low frequencyroll-offs are approximately —12 dB per octave. The amplitude response in the frequency domain of theM-weighting functions is defined by:
G(f) =_2oloio[1+9j1+fr’J] (5)
The roll-off and passband of these functions are controlled by the parameters];0and];,, the estimatedupper and lower hearing limits specific to each functional hearing group (Table 1).
Table 1. The low (f) and high (t1) frequency weighting parameters for four underwater functional marinemammal hearing groups as defined by Southall et al. (2007).
Functional hearing group ff1, (Hz) f (Hz)
Low-frequency cetaceans (LEO) 7 22 000
Mid-frequency cetaceans (MFC) 150 160000
High-frequency cetaceans (HFC) 200 180 000
Pinnipeds in water (Pw) 75 75 000
M-weighting is usually only applied to the SEL metric because the Southall criteria, based on SELmeasurements, are the only criteria related to M-weighted sound levels (Southall et al. 2007). Secondly,the proper application of M-weighting functions to modelled rms SPL is complicated because the pulseduration, T, depends on frequency and distance from the source.
SpeciesLow-frequency cetaceansMd-trequency cetaceansHigh-frequency cetaceansPinnipods
101 102 io3
Version 2.0 4

JASCO ArrI.1FD SCIENCES Underwater Sound Modelling: Shelburne Basin Venture Seabed Survey
2. Scenarios
The 2014 Activity Area is located approximately 300 km south of Halifax, NS. Figure 2 presents anoverview of the region.
Three sites, shown in Figure 2 and Table 2, were chosen to sample the sound propagation propertieswithin the project area:
• Site 1: Closest to the Roseway Basin North Atlantic Right Whale Critical Habitat (NARWCH). Thiscritical habitat area, designated as an important feeding and socializing area for the North AtlanticRight Whale, is at its closest point, —105 km from the 2013 proposed seismic area and -—41 km fromthe project area (Figure 2).
• Site 2: The northern point of the 2013 proposed seismic area; site closest to the Haddock Box,established to protect haddock recruits and to help rebuild stock.
• Site 3: The southern point of the 2013 proposed seismic area. The farthest point from the continentalshelf break, located in the deepest water within the 2013 proposed seismic area.
The NARWCH and the Haddock Box are noted on all sound field contour maps presented in this report.
Shell’s preferred operational period for conducting the multibeam echosounder survey is from Maythrough July. As a result, the temporal variation in sound propagation for the multibeam echosounderEM® 302 in May and July was studied. Base on the 2012 study (Matthews 2012), it is expected thatmaximum distances to sound isopleths will be smaller later in the year (i.e., in August and September)than during the preferred operational period.
64°O’OW 60°O’O”W
The Gully(Marine Protected Area)
NadIr Atlantic Right Whalecritical Habitat
jHaddodk Box
02014 Activity Area
11 Project Area
Internationalen rind arlee
Figure 2. Location of the modelled sites within the project area, 300 km south of Halifax, NS.
Version 2.0 5

JASCO \PItlF P SC II N.ES Underwater Sound Modelling: Shelburne Basin Venture Seabed Survey
Table 2. Locations and water depths of the sites modelled within the project area.
DepthSite Description Latitude Longitude
(m)
1 Closest to the North Atlantic Right Whale Critical4228’O4.8O” N 6442’36.OO” W 339
Habitat
2 Closest to the Haddock Box 42°41’35.67” N 62°0743.97” W 1305
3 Deepest water 41°4028.80’ N 63M2’05.43” W 3145
Version 2.0 6

JASCO :\[IIJFDSL 1EN. L Underwater Sound Modelling: Shelburne Basin Venture Seabed Survey
3. Methods
3.1 Source Levels and Directivity
Multibearn echosounders ping with multiple beams, which range from one to several hundreds of beamsper echosounder head. Dual-head systems that can produce more than 500 individual beams are common(e.g., Kongsberg EM® 302). The systems operate at high frequencies (10 to 900 kHz), which createsnarrow beamwidths ranging from 1/10 to several degrees. The beam fan of each head provides verticalcoverage for a 1000_2000 sector in the plane perpendicular to the towing direction. The beam pattern of amultibeam system is highly anisotropic, with most acoustic energy emitted in the across-track direction.
3.1.1 Beam pattern calculationThe acoustic radiation pattern, or beam pattern, of a transducer is the relative measure of acoustic poweras a function of a spatial angle. Directionality is generally measured in decibels relative to the maximumradiation level along the central axis, perpendicular to the transducer surface. The pattern is definedlargely by the operating frequency, size, and shape of the transducer.
Beam patterns generally consist of a main lobe extending along the central axis of the transducer, andmultiple secondary lobes separated by nulls (Figure 3). The width of the main lobe depends on the size ofthe active surface relative to the sound wavelength in the medium, with larger transducers producingnarrower beams. Figure 3 presents a 3-D visualization of a generic beam pattern of a circular transducer.
Figure 3.Typical 3-D beam pattern of a circular transducer (Massa 1999).
The beamwidth, a key characteristic of transducers, is generally defined as the total angular range wherethe sound pressure level of the main beam is within 3 dB of the on-axis peak power (Massa 1999). Thetrue beam pattern of a transducer, especially the secondary lobes, may be irregular (Figure 4), and maydiffer from the beam pattern calculated through transducer theory. The true beam pattern can be obtained
Version 2.0 7

JASCO ArPIllDSclENES Underwater Sound Modelling: Shelburne Basin Venture Seabed Survey
sin(7r L2 sin(b))R(cb)=
LAsin(q5)
50LA
100
by measuring, in situ, the emitted energy around the device; however because such data is not alwaysreadily available, it is often sufficient to estimate the beam pattern based on transducer theory.
90
Figure 4. 2-D polar representation of a beam pattern obtained by measuring, in situ (vertical slice), aKongsberg transducer. (This plot was obtained from Kongsberg).
3.1.2 Beam pattern of rectangular transducers and multibeam systems
The beam pattern for the multibeam echosounder EM® 302 was calculated based on the standard formulafor the beam pattern of a rectangular acoustic array (Kinsler et al. 1950, ITC 1993), which is the productof the toroidal beam patterns of two line arrays, where the directional characteristics in the along- andacross-track directions are computed from the along- and across-track beamwidths, respectively. Thedirectivity function of a toroidal beam, relative to the on-axis pressure amplitude, is given by:
(6)
where L). is the transducer dimension in wavelengths, °b1, is the beamwidth in degrees, and is the anglefrom the transducer axis. The beam pattern of a transducer can be calculated using either the specifiedbeamwidth in each plane, or the dimensions of the active surface and the operating frequency of thetransducer. Figure 5 is an example of the calculated beam pattern for a rectangular transducer with alongand across-track beamwidths of 4° and 10°, respectively.
Version 2.0 8

JASCO ArI’I ii- r Sc ucis Underwater Sound Modelling: Shelburne Basin Venture Seabed Survey
0)a
C)
-90
aU)
aC0
aC
C)a
-180 -135 -90 -45 0 45 90 135 180
Declination angle left-right (deg)
Figure 5. Estimated beam pattern for a rectangular transducer with a 4° x 10° beamwidth. Beam powerfunction shown relative to the on-axis level, using the Robinson projection.
For multibeam systems, the beam pattern of each transducer is calculated individually and combined into
the total beam of the system based on the engagement type of the beams—simultaneous or successive. If
the beams are engaged successively, the source level of the system along a specific direction is assumedto equal the maximum source level realized from each of the individual transducers, whereas if the beams
are engaged simultaneously, the beam pattern of the system is simply the sum of all beam patterns.Figure 6 is an example of the predicted beam pattern for two rectangular transducers engagedsuccessively in which the individual transducers have along- and across-track beamwidths of 1.50 and
50°, respectively.
-180 -135 -90 -45 0 45 90 135 180
Declination angle left-right (deg)
Figure 6. Calculated beam pattern for two rectangular transducers engaged successively, with individualbeamwidths of 1.5°x50° and a declination angle of 25°. Beam power function shown relative to the on-axis level, using the Robinson projection.
3.2 Sound Propagation
Underwater sound propagation (i.e., transmission loss) was predicted with JASCO’s Marine OperationsNoise Model (MONM). This model computes sound propagation from highly-directional, high-frequencyacoustic sources via the BELLHOP Gaussian beam acoustic ray-trace model (Porter and Liu 1994). Thisversion of MONM accounts for sound attenuation due to energy absorption through ion relaxation and
viscosity of water in addition to acoustic attenuation due to reflection at the medium boundaries and
Version 2.0 9

jASCO APPlIED S lENCE Underwater Sound Modelling: Shelburne Basin Venture Seabed Survey
internal layers (Fisher and Simmons 1977). The former type of sound attenuation is significant forfrequencies higher than 5 kHz and cannot be neglected without noticeably affecting the model results.
MONM computes acoustic fields in three dimensions by modelling transmission loss within two-dimensional (2-D) vertical planes aligned along radials covering a 3600 swath from the source, anapproach commonly referred to as Nx2_D. These vertical radial planes are separated by an angular step
size of A9, yielding N= 3600/zO number of planes (Figure 7). The angular step size of the radials ischosen to sufficiently sample the source beam pattern. MONM accounts for the variability of the soundlevel of the emitted pulse with both azimuth and depression angles according to the 3-D beam pattern ofthe source and estimates sound levels at various horizontal distances from the source as well as at variousdepths.
The received sound level at a sampling location is taken as the maximum value that occurs over allsamples within the water column below, i.e., the maximum-over-depth received sound level (Figure 7).These maximum-over-depth levels are then presented as colour contours around the source (e.g.,Figure 8).
Jr
Sound ‘ : : : : ; : : : : : :Source : : liz
• Sampling location )• Sampling location with maximum-over-depth level
1800
170W
16000 150_JD
0
130
0 20 40 60 80 100
Distance (km)Figure 7. Representation of Nx2-D and maximum-over-depth approaches.
4 a
‘v
Version 2.0 10

jASCO r\Pj’llfDS(If\({S Underwater Sound Modelling: Shelburne Basin Venture Seabed Survey
. I)
————
1i•.
——— I.c
—4 T
Ytt3 so.nd1e4d iI.ct
Figure 8. Example of maximum-over-depth sound exposure levels (SELs) colour contour maps for tworandom seismic sources.
3.3 Peak and rms SPL
Although the peak and rrns SPL of an acoustic event is easily measured in situ (at least for signals wellabove background noise), these metrics are generally difficult to model because they are sensitive to thespecific multipath arrival pattern and can vary greatly with distance from the source or with receiverdepth.
To precisely predict the peak and rms SPL for the echosounder pulse, the full wavefonn of the acousticevent must be modelled; full-wave modelling, however, is computationally expensive and oftenprohibitively time consuming. Considering those challenges, MONM, as detailed in Section 3.2, was usedto more efficiently compute the SEL field. We applied constant offsets to SELs at all ranges, depths, andazimuths to estimate peak and rms SPLs, thus producing cautionary distances to sound level isopleths.The offsets were calculated based on the manufacturer’s specifications. This estimate is considered validfor high-frequency sources with relatively long pulse length and high pulse rate, like the EM’ 302 (seeSection 4.1 for system specifications).
3.4 Model Parameters
3.4.1 Bathymetry
Water depths throughout the modelled area were obtained from the SRTM3O+ (v7.0), a global topography
and bathymetry grid with a resolution of 30 arc-seconds (Rodriguez et al. 2005), and seismically deriveddata, delivered by Shell, with a resolution of 100 x 100 m. At the studied latitude, the SRTM3O+resolution is about 675 x 925 m. The bathymetry for a 550 x 550 km area was re-gridded, by minimumcurvature gridding, onto a Universal Transverse Mercator (UTM) Zone 20 projection with a horizontalresolution of 200 x 200 m.
3.4.2 Geoacoustics
MONM assumes a single geoacoustic profile of the seafloor for the entire modelled area. Thispropagation model requires these acoustic properties:
Version 2.0 11

JASCO APPIlID SCIENCES Underwater Sound Modelling: Shelburne Basin Venture Seabed Survey
• sediment density• compressional-wave (or P-wave) sound speed• P-wave attenuation in decibels per wavelength• shear-wave (or S-wave) speed• S-wave attenuation, also in decibels per wavelength
The geological stratification at the edge of the Scotian Shelf is composed of a thin surficial layer of sandatop a thicker layer of Sable Island sand and gravel, then a layer of glacial till called Scotian Shelf drift,next a layer of tertiary bedrock, and a basement of granite 1500 m below the seafloor. Although thethickness of the surficial layers may vary spatially, the general geoacoustic properties of the seabed withinthe area present little variation; therefore, one generic geoacoustic profile was developed for the threemodelled sites (Table 3). The assumed thickness of each layer follows descriptions by Chapman and Ellis(1980), Osler (1994), Cochrane (2007),whereas the corresponding geoacoustic parameters are based onpublications by Osler (1994), and Ellis and Hughes (1989).
Table 3. Geoacoustic profile for Sites 1—3, which all have a multi-layered sandy bottom. Within eachsediment layer, parameters vary linearly within the stated range.
P-wave S-wave S-waveDepth below Density P-wave
Material attenuation speed attenuationseafloor (m) (g/cm3) speed (mis)
(dB1A) (m/s) (dB1A)
0—2 Sand 1.9—2.0 1700—1800 0.85—0.36 200 2.0
Sable Island Sand2—50 2.0—2.1 1800—2000 0.36—1.00
and Gravel
50—1 00 Scotian Shelf Drift 2.0—2.2 1900—2100 0.47—0.21
100—1500 Tertiary bedrock 2.2—2.6 2100—5500 0.21—0.28
> 1500 Granite 2.6 5500 0.28
3.4.3 Sound speed profile
The sound speed profiles for the modelled sites were derived from temperature and salinity profiles fromthe US Naval Oceanographic Office’s Generalized Digital Environmental Model V3.O (GDEM; Teagueet al. 1990, Cames 2009). GDEM provides climatology of temperature and salinity for the world’s oceanson a latitude-longitude grid with 0.250 resolution, with a temporal resolution of one month, based onglobal historical observations from the US Navy’s Master Oceanographic Observation Data Set(MOODS). The climatology profiles include 78 fixed depth points, up to a maximum depth of 6800 m(where the ocean is that deep), including 55 standard depths between 0 and 2000 m. The GDEMtemperature-salinity profiles were converted to sound speed profiles (c) according to the equations of(Coppens 1981):
Version 2.0 12

JASCO /\Pl1 l[DSClFNL Underwater Sound Modelling: Shelburne Basin Venture Seabed Survey
c(z,T, S,95) = 1449.05 + 45.71 —
5.2112— 0.23t3
+ (i .333 — 0.126t + 0.00912 Xs —35)+
A=16.3Z+0.18Z2 (7)
Z=
(i — 0.0026 cos(2Ø))
where z is water depth (rn), Tis temperature (°C), S is salinity (psu), and is latitude (radians).
Shell is currently planning to conduct the multibearn echosounder survey from May through July 2014.Sound speed profiles were derived from GDEM temperature and salinity profiles for each of these monthswithin the project area (Figure 9).
Sound Speed (mis) Sound Speed (m/s)1480 1490 1500 1510 1520 1460 1470 1480 1490 1500
0 _‘__ o300 .— 16
600
(732
900 48
1200S S
1500 80
1800 96
2100 112
2400 128
2700 ..
Jun
Jul.)VUU -
_______
1480 1490 1500 1510 1520 1460 1470 1480 1490 1500
Deep water Shallow waterFigure 9. Monthly sound speed profiles in deep (> 200 m) and shallow ( 200 m) waters within the projectarea, derived from the GDEM ocean climatology of temperature and salinity (Teague et al. 1990, Carnes2009).
In deep and shallow waters, the monthly variation occurs mainly in the upper 100 m of the profile. Soundspeed profiles in the mid-latitude regions of the globe tend to develop a surface duct or a sound channel (awell-defined minimum in the sound speed) in the spring to summer months.
In the modelled area, the May sound speed profile features surface duct, i.e. a sharp increase in soundspeed between —50 and 100 m, which traps the sound between the surface and —100 m depth. In June, theprofile is characterized by a sound channel, i.e. a sharp decrease in sound speed between the water surfaceand —50 m depth, followed by a sharp increase in sound speed at depths of—50 to 100 m. In July, thesurface temperature is warm enough to increase the sound speed in the upper section of the profile,causing the sound to be mainly refracted down toward the seafloor. In this study, sound propagation wasmodelled for May and July. Base on the 2012 study (Matthews 2012), it is expected that maximum
144 — layJun
160 Jul
Version 2.0 13

JASCO APPlIED SCiEcciS Underwater Sound Modelling: Shelburne Basin Venture Seabed Survey
distances to sound level thresholds will be smaller if the operation occurs in August or September thanduring the preferred operational period.
3.5 Geometry
For each of the three sites, sound fields from single pulses were modelled over a 10 x 10 km area, centredon the source, with a horizontal separation of 10 m between receiver points along the modelled radials.Modelling these sound fields in this manner resolved the detailed features of the sound footprint, close tothe source. In each area, sound fields were modelled with a horizontal angular resolution that variedbetween 0.0 10 and 2.5°, generating a total of N= 4192 radial planes, to resolve source directionality.
The receiver depths span the entire water column over the modelled areas, from 1 to 4000 m, with stepsizes that increase with depth. For all sites, the vertical step size increased from 1.5 to 500 m, withincreasing depth.
The echosounder tow direction was set to 252° east of UTM north, i.e., approximately parallel to the 2014Activity Area boundary and to the continental slope. By orientating the echosounder’s broadsideperpendicular to the continental slope, the angles of high source levels (Section 4.1) were oriented towarddeep water. Sound generally propagates farther in deep water because of fewer bottom interactions and,therefore, generates a lower attenuation rate. Thus, a tow direction of 252° is estimated to producecautionary (longer) distances to specific sound levels.
The hull-mounted multibearn echosounder was modelled at a depth of 5.50 m.
Version 2.0 14

jASCO \PIIIED iF\FS Underwater Sound Modelling: Shelburne Basin Venture Seabed Survey
4. Results
4.1 Source Levels and Directivity
The Kongsberg EM 302 (hereafter referred to as EM’ 302) is a multibeam echosounder systemoperating at 30 kHz. The system contains 288 transducers with beam spacing that can be equidistant orequi-angled, and an angular coverage of 150° across-track. The individual transmitters have a possiblealong-track bearnwidth of 10 or 2°. Technical notes obtained from the manufacturer’s website specify thatthe source level (peak SPL) varies from 231—241 dB re 1 iPa @ 1 rn, depending the on across-trackbeamwidth of each transducer (Hammerstad 2005, Kongsberg Maritime AS 2013a, b). Table 4summarizes the EM® 302 specifications.
Table 4. EM® 302 multibeam echosounder parameters.
Multibeam Echosounder EM® 302
Operational frequency 30 kHz
Pulse duration (ms) 0.7 to 200
Pulserate(Hz) >10
peak SPL (dB re 1 pPa @ 1 m) 241 237 237 231 231 ?
SEL per pulse (dB re 1 pPa2s@ I m) 231* 227* 227* 221* 221* ?
1 s rms SPL (dB re 1 pPa @ 1 m) 238 234 234 228 228 7
Number of beams per swath 288 288 288 288 144 144
Transducerbeamwidth 0.5x1° 1°x1 1x2 2°x2 2°x2 4°x4
Array across-track beamwidth 1 50
Number of swaths 1 or 2
Swath declination variable* Source level calculated using a pulse duration of 200 ms.
The beam patterns from the 288 successively engaged rectangular transducers (2°x2° beamwidth) werecalculated using Equation 6, and summed to produce the total beam pattern (2°x150° equi-angled swath)presented in Figure 10. We chose this configuration for modelling since a wider along-track beamwidthproduces larger radii associated with source levels. Figure 11 shows the vertical slices of the calculatedbeam pattern at 30 kHz.
Since the EM 302 can survey with two swaths, the signature for one swath was duplicated with an alongtrack separation equivalent to an individual swath tilt of 4° (in the along-track direction).
Version 2.0 15

JASCO AP[’I IF F) SS lF\ L Underwater Sound Modelling: Shelburne Basin Venture Seabed Survey
‘0
C)
C0
C)
C
Ca
C
-180 -135 -90 -45 0 45 90 135 180
Declination angle Ielt-rlght (deg)Figure 10. Calculated beam pattern for the Kongsberg EM’ 302 transducer at 30 kHz. Beam powerfunction shown relative to the on-axis level, using the Robinson projection.
Figure 11. Calculated beam pattern vertical slice for the Kongsberg(a) along- track; (b) across-track direction.
EMe 302 transducer at 30 kHz
Version 2.0 16

JASCO /\PPIIFD SClF\ F Underwater Sound Modelling: Shelburne Basin Venture Seabed Survey
4.2 Sound Fields
The modelled underwater sound fields were sampled such that the received sound level at each point inthe horizontal plane was taken to be the maximum value over all modelled depths for that point (Section3.2). The resultant maximum-over-depth sound fields for each site are presented below in two formats: astables of distances to sound levels and as contour maps that show the directivity and range to varioussound level isopleths.
The predicted distances to specific sound levels were computed from the maximum-over-depth soundfields. Two distances, relative to the source, are reported for each sound level: (1) the maximumrange at which the given sound level was encountered in the modelled maximum-over-depth sound field;and (2) R95%, the maximum range at which the given sound level was encountered after excluding the 5%farthest such points. R95% is provided since the maximum-over-depth sound field footprint might not becircular and along a few azimuths might extend far beyond the main ensonification zone. Regardless ofthe geometric shape of the maximum-over-depth footprint, R95% is the predicted range encompassing atleast 95% of the area (in the horizontal plane) that would be exposed to sound at or above that level. Thedifference between and R95% depends on the source directivity and the heterogeneity of the acousticenvironment, i.e., the variability of the bathyinetry, sound speed profile, and geoacoustics. The R95%
excludes the ends of protruding areas that are not representative of the nominal ensonification zone.
and R95% may vary depending on the orientation of the source and its location within the modelledarea. By considering the distances to the sound levels in combination with the maps of the propagatedsound field, variations that occur in the sound field can be better evaluated when the source tow directionand location differ from those modelled.
Tables 5 to 7 compare the distances to (unweighted) SELs, rms SPLs, and peak SPLs at the threemodelled sites for May and July. Subsections 4.2.1 to 4.2.3 present maps of (unweighted) SEL isoplethsand tables of distances to unweighted and M-weighted SELs. The results are discussed in Section 5.
Version 2.0 17

JASCO AP1i II DSClFNCIS Underwater Sound Modelling: Shelburne Basin Venture Seabed Survey
Table 6. Maximum (Rmax, m) and 95% (R95%, m) horizontal distances from the EM® 302 multibeamechosounder to modelled maximum-over-depth per-pulse rms sound pressure levels (rms SPL5).
Site 1—May Site 1—July Site 2—May Site 2—July Site 3—May Site 3—JulyrmsSPL
.
(dB re Rmax R5% Rnx R95% Rmax R95% Rrnax R95% Rrrx R95% Rmax RgsvI pPa) (m) (m) (m) (m) (m) (m) (m) (m) (m) (m) (m) (ni)
-r200 10 10 10 10 10 10 10 10 10 10 10 10
190 156 133 156 133 230 218 230 218 455 452 455 452
180 389 348 389 354 404 361 417 367 570 535 570 535
170 1 135 876 1 135 870 803 716 825 732 899 779 906 796
160 1837 1543 1990 1559 1427 1235 1461 1259 1460 1252 1493 1281
150 2878 2318 3002 2401 2449 2033 2470 2055 2230 1847 2279 1888
140 3820 2770 3821 2764 3520 2882 3479 2913 3131 2540 3184 2577
130 4972 2942 5530 3172 4681 3365 4649 3586 4150 3069 4181 3310
120 6160 3532 6711 3690 5710 3912 5760 4240 5279 3777 5282 4045
SEL(dB re1 pPa2s)
Table 5. Maximum (Rmax, m) and 95% (R95%, m) horizontal distances from the EM® 302 multibeamechosounder to modelled unweighted, maximum-over-depth per-pulse sound exposure levels (SELs).
Site 1—May Site 1—July Site 2—May Site 2—July Site 3—May Site 3—July
..
.
R95% Rmax R95% Rmax R95% Rmax R955 Rmax R95% Rmax R95%(m) (m) (m) (m) (m) (m) (m) (m) (m) (m) (m) (m)
200
195
190
180
170
160
150
140
130
120
<10 —
10 10
32 32
200 190
515 452
1271 1065
2312 1819
3201 2483
4128 2772
5259 3104
<10 _F <o —
10 10 10 10
32 32 32 32
190 184 259 238
515 462, 512 452
1 252 1 085 967 854
2392 1 863 1 673 1 436
3242 2555 2752 2316
4228 2790 3732 3112
5702 3292 5019 3580
<10 —
10 10
32 32
259 238
512 461
998 882
1706 1463
2784 2348
3792 3152
4811 3786
<10 —
10 10
32 32
475 470
649 592
1040 904
1675 1426
2482 2039
3428 2754
4443 3310
<10 —
10 10
32 32
475 470
659 595
1 069 926
1706 1458
2536 2081
3467 2795
4506 3529
Version 2.0 18

JASCO APPilFDSClFN L Underwater Sound Modelling: Shelburne Basin Venture Seabed Survey
Table 7. Maximum (Rmax, m) and 95% (R95%, m) horizontal distances from the EM® 302 multibeamechosounder to modelled maximum-over-depth peak sound pressure levels (peak SPLs).
Peak Site 1—May Site 1—July Site 2—May Site 2—July Site 3—May Site 3—July
SPL(d B re Rmax R95, Rmax R951 Rmax R95 Rmax R95, Rmax R95% F?ypj R95
1 jPa) (m) (m) (m) (m)r__(m)
(m) (m) (m) (m) (m)_— (m) (m)
220 <10 — <10 — <10 — <10 —l <10 — <10 —
210 10 10 10 10 10 10 10 10 10 10 10 10
200 32 32 32 32 32 32 32 32 32 32 32 32
190 200 190 190 184 259 238 259 238 475 470 475 470
180 515 452 515 462 512 452 512 461 649 592 659 595
170 1 271 1 065 1 252 1 085 967 854 998 882 1 040 904 1 069 926
160 2312 1819 2392 1863 1673 1436 1706 1463 1675 1426 1706 1458
150 3201 2483 3242 2555 2752 2316 2784 2348 2482 2039 2536 2081
140 4128 2772 4228 2790 3732 3112 3792 3152 3428 2754 3467 2795
130 5259 3104 5702 3292 5019 3580 4811 3786 4443 3310 4506 3529
120 6660 3632 6942 3896 6006 4033 6062 4396 5686 3999 5699 4286
Version 2.0 19

JASCO AFFI D SClIcL Underwater Sound Modelling: Shelburne Basin Venture Seabed Survey
4.2.1 Site I
a single pulse from water depth in metres.
Version 2.0 20

JASCO APl[ 11 DS( \. . Underwater Sound Modelling: Shelburne Basin Venture Seabed Survey
Figure 13. Sound exposure levels (SELs) at Site 1, July: Received maximum-over-depth sound levels fora single pulse from the EM® 302. Blue contours indicate water depth in metres.
Table 8. Site 1, May. Maximum (Rmax, m) and 95% (R95%, m) horizontal distances from the EM® 302multibeam echosounder to modelled unweighted and m-weighted, maximum-over-depth per-pulse soundexposure levels (SELs)
Unweighted LFC I MFC HFC PwSEL(dB re Rmax R95% Rg5y Rmax R95 RmOK R95% Rmax R95%1 pPa s) (m) (m) (m) (m) (m) (m) (m) (m) (m) (iii)
200 <10 —— —i <10 — <10 — — —
195 10 10 <10 — 10 10 10 10 <10 —
190 32 32 10 10 32 32 32 32 10 10
180 200 190, 32 32 200 190 200 190 184 168
170 515 452 214 199 515 452: 515 452 501 446
160 1 271 1 065 557 493 1 271 1 065 1 271 1 065 1 271 1 047
150 2312 1819 1297 1118: 2312 1819 2312 1819 2112 1802
140 3201 2483. 2356 18971 3201 2483 3201 2483 3163 2464
130 4128 2772: 3271 2529 4128 2772 4128 2772 4080 2786
120 5259 3104: 4286 2728: 5259 3104 5259 3104 5228 3102
AzQ0.
6445OW 644OO”W
f
/
/
/
/
/
-/
/
MultibeamEchosounder EM 302(2 swaths)Model Site 01 - July
SE L(dB re I iJP’-s)
— 190180-190
— 170.180
190-170
150-160
140-160
— 130-140120-1 30
_, North Aitanrtc Ri9ht INhaleL....J CIical Hhilat
Haddock Box
2014 Activity Ama
Project AmaTow DirOclion: 252’(from UTM North)
Coo ooo Oyvro NAO 192 UTU Zooo 2CRProjOrJ;Ofl Troncvr%T MerC.vCt
I.’\SCOz0U).(N
(N
.
0 1 21km —. t0
4 —
64°45OW
‘O&.A
0 50 100 200 km
64°40O°W
Version 2.0 21

JASCO APPIJIDSC Underwater Sound Modelling: Shelburne Basin Venture Seabed Survey
Table 9. Site 1, JuIy Maximum (Rmax, m) and 95% (R95®, m) horizontal distances from the EM® 302multibeam echosounder to modelled unweighted and rn-weighted, maximum-over-depth per-pulse soundexposure levels (SELs)
Unweighted LFC MFC HFC PwSEL .
(dB re2 Rmax R95® Rmax R95% Rmax R95% RmaK R95% Rmax R95%1 pPa •s) m) (m) (m) (m) (m) (m) (m) m) m) (m)
200 10 10 — —<10 —<10 —i — —
195 32 32 <10 — 10 10 10 10 <10 —
190 82 82 10 10 32 32 32 32 10 10
180 190 184 32 32 184 168 184 168 161 158
170 515 462 214 199 515 452 515 452 470 421
160 1 252 1 085 573 506 1 252 1 070 1 252 1 072 1 148 987
150 2392 1863 1360 1119 2344 1828 2382 1832 2087 1750
140 3242 2555 2477 1997 3242 2543 3242 2546 3178 2492
130 4228 2790 3317 2588 4181 2787 4181 2787 4023 2776
120 5702 3292 4374 2809 5702 3277 5702 3280 5621 3233
Version 2.0 22

JASCO ApInl,,FD SC1F-cJF Underwater Sound Modelling: Shelburne Basin Venture Seabed Survey
4.2.2 Site 2
621 00W 6250W
MultibeamEchosounder EM 302(2 swaths)Model Site 02 - May
SEL(dB re 1 pPa’-s)
— ‘ 190
I 180190
— 170.180
160-170
1 50-160
140-150
— 130-140
120-130
North Atlantic Ri0ht WhaleCritical Habitat
Haddock Box
f::J 2014 Aclreity Area
JProject Area
Tow Direction: 252(horn UTM North)
NAO t9?r UT1rZ,e ?ONPrcjeclcn TtOflSvrSe Mr,ca:o,
Figure 14. Sound exposure levels (SELs) at Site 2, May: Received maximum-over-depth sound levels fora single pulse from the EM® 302. Blue contours indicate water depth in metres.
Version 2.0 23

JASCO :\PP11i l)S. lFNr. Is Underwater Sound Modelling: Shelburne Basin Venture Seabed Survey
621 00W 6250’W
MultibeamEchosounder EM 302(2 swaths)Model Site 02 - July
SEL1dB re 1 pPas)
—> 190180-160
• 170.180
160-1 70
1 50-160
140-150
— 130-140120-130
....., North At’antic Right WhaleL....J Crrtical Habitat
Haddock Box
2014 Activity Aie
Project Area
Tow Direction: 252(tram IJTM North)
Coord, Cyw NAO lO2 U1MZoc 20NPrarerJ:Gfl Ttflncwrv> MrrCavr
1’\SCQ
Figure 15. Sound exposure levels (SELs) at Site 2, July: Received maximum-over-depth sound levels fora single pulse from the EM® 302. Blue contours indicate water depth in metres.
Version 2.0 24

JASCO Arru1n S lE\c .L Underwater Sound Modelling: Shelburne Basin Venture Seabed Survey
Table 10. Site 2, May: Maximum (Rmax, m) and 95% (R95%, m) horizontal distances from the EM® 302multibeam echosounder to modelled unweighted and rn-weighted, maximum-over-depth per-pulse soundexposure levels (SELs)
Unweighted LEO MFC HFC PwSEL ........
(dB re. Rm R95% Rrnax R951 Rmaç R95, Rmax R95% Rmax R95%
I pPa_.s)7 (m) (rn) (m) (m) m) (m) m) m) (m) (m)
200 1<10 — —— <10 — <10 — — —
195 10 10 <10 — 10 10 10 10 <10 —
190 32 32 10 10 32 32 32 32 10 10
180 259 238 32 32 259 238 259 238 238 218
170 512 452 283 251 504 452 512 452 472 421
160 967 854 542 484 971 864 967 854 918 819
150 1 673 1 436 1 020 904 1 673 1 440 1 673 1 436 1 602 1 376
140 2752 2316 1741 1498 2774 2321 2752 2316 2687 2226
130 3732 3112 2850 2390 3741 3134 3732 3112 3665 3047
120 5019 3580 3845 3159 4742 3766 5019 3580 4699 3691
Table 11. Site 2, July Maximum (Rmax, m) and 95% (R95%, m) horizontal distances from the EM® 302multibeam echosounder to modelled unweighted and rn-weighted, maximum-over-depth per-pulse soundexposure levels (SELs)
Unweighted LFC MFC HFC Pw
dBre2 Rm R95% Rmax Rg Rrnax R95% Rrnax R95%1 pPa s) (m) (m) (m) (m) (m) (m) (m) (m) (m) (m)
200 <10 — — —<10 — <10 — — —
195 10 10 <10 — 10 10 10 10 <10 —
190 32 32 10 10 32 32 32 32 10 10
180 259 238 32 32 259 238 259 238 238 218
170 512 461 283 251 504 452 512 461 472 421
160 998 882 542 484 971 864 998 882 918 819
150 1 706 1 463 1 042 923 1 673 1 440 1 706 1 463 .1 602 1 376
140 2784 2348 1791 1531 2774 2321 2784 2348 2687 2226
130 3792 3152 2888 2423 3741 3134 3792 3152 3665 3047
120 4811 3786 3853 3213 4742 3766 4811 3786 4699 3691
Version 2.0 25

JASCO ArvIJ[DS IEN([S Underwater Sound Modelling: Shelburne Basin Venture Seabed Survey
4.2.3 Site 3
Figure 16. Sound exposure levels (SELs) at Site 3, May: Received maximum-over-depth sound levels fora single pulse from the EM® 302. Blue contours indicate water depth in metres.
6345OW 634OOW
MultibeamEchosounder EM 302(2 swaths)Model Site 03 - May
SEL(dB re I pPas
—> 190180-160170.180
I 160-170
150-160
. 140-150
— 130-140
120-130
NorTh Atlantic Rrjht WhaleCritical Habitat
Haddock Box
EZJ 2014 Activity Area
1ZJ Proiect Area
Tow Direction; 252(tram UTM North)
Codn, NAO 1 011.’ 20NPIOICOCI T1IOSVm3C MNCYCIAsc)
Version 2.0 26

jASCO /\P1’IlFDS( l[\TS Underwater Sound Modelling: Shelburne Basin Venture Seabed Survey
contours indicate water depth in metres.
Version 2.0 27

jASCO APPlIED SCllNCFS Underwater Sound Modelling: Shelburne Basin Venture Seabed Survey
Table 12. Site 3, May: Maximum (Rmax, m) and 95% (R95%, m) horizontal distances from the EM® 302multibeam echosounder to modelled unweighted and rn-weighted, maximum-over-depth per-pulse soundexposure levels (SELs).
Unweighted LFC MFC HFC PwSEL
.............-........
.......................
(dB re Rmax R95% Rma,, R95, Rmax R95% R95® Rmax R95%1 jPa s) (rn) (m) (m) (m) (m) (m) (m) (m) (m) (m)
200 <10 <10 <10
195 10 10 <10 10 10 10 10 <10
190 32 32 10 10 32 32 32 32 10 10
180 475 470 32 32 475 470 475 470 464 460
170 649 592 484 470 635 587 649 592 613 570
160 1 040 904 672 613 1 028 891 1 040 904 972 851
150 1 675 1 426 1 086 939 1 645 1 407 1 675 1 426 1 581 1 350
140 2482 2039 1736 1477 2457 2021 2482 2039 12381 1955
130 3428 2754 2568 2099 3390 2732 3428 2754 3301 2665
120 4443 3310 3503 2799 4411 3283 4443 3310 4307 3201
Table 13. Site 3, July Maximum (Rmax, m) and 95% (R95%, m) horizontal distances from the EM® 302multibeam echosounder to modelled unweighted and rn-weighted, maximum-over-depth per-pulse soundexposure levels (SEL5).
Unweighted LFC MFC HFC PwSEL . . . ..
(dB re Rmax R95% Rmax R95% Rmax R95% Rma R95% R05%1 pPa s) (m) (m) (m) m) (m) m) (m) (m) (m) (m)
200 <10 <10 1<10
195 10 10 <10 10 10 10 10 <10
190 32 32 10 10 32 32 32 32 10 10
180 475 470 32 32 475 470 475 470 464 460
170 659 595 484 470 635 587 659 595 613 570
160 1 069 926 683 617 1 047 914 1 069 926 1 000 871
150 1 706 1 458 1 105 962 1 675 1 440 1 706 1 458 1 622 1 390
140 12536 2081 1776 1512 2513 2065 :2536 2081 2425 1998
130 3467 2795 2612 2142 3449 2777 3467 2795 3350 2704
120 4506 3529 3547 2860 4461 3508 4506 3529 4370 3437
Version 2.0 28

jASCO \liHID Sit \L Underwater Sound Modelling: Shelburne Basin Venture Seabed Survey
5. DiscussionThe modelled scenarios provide a good estimate of the variation in sound propagation around themultibeam echosounder EM® 302 within the 2014 Activity area. Sites 1 and 2 illustrate soundpropagation when the echosounder is close to the continental shelf, and the water depth is shallow (339 mat Site 1), and intennediate (1305 m at Site 2). Site 3 illustrates sound propagation when the echosounderis farther away from the continental shelf and surveying in deep water (3145 m).
Distances to rrns SPL isopleths 120 dB re I liPa are relatively short (<7 kin) and are not expected to beencountered within the North Atlantic Right Whale Critical Habitat. The distances to lower levels (e.g.less than nns SPLs of 180 dB re 1 pPa; Table 6) are longer in shallow environments. Differences betweenmodel results in May versus July are negligible at all locations.
Because of the source level directivity, the echosounder tow direction was set to an angle subparallel tothe continental slope. This angle resulted in cautionary distances to modelled sound levels since thebroadside of the echosounder faces deep water where bottom interactions are reduced and soundpropagates to longer ranges. It is expected that tow directions set a few degrees (e.g., 30°) off the generalslope direction may decrease distances to the 150 dB re 1 jiPa nns SPLs, which are levels thatpropagate far enough as to be influenced by the bathymetry.
Applying M-weighting for low-frequency cetaceans most significantly reduced distances to sound levelisopleths (up to -59% at 171 dB re 1 iPa2s), since the main frequency of the EM® 302 (30 kHz) isoutsides that filter’s passband. Applying M-weighting to pinnipeds in water did not reduce the distancesby much (up to —15% at 180 dB re 1 jiPa2s). Applying M-weighting for mid- and high-frequencycetaceans did not reduce the distances at all.
All distances to sound levels thresholds most relevant to the EA, i.e. maximum distances to 215 and 195dB re 1 iiPa2s (SEL) and to 230 and 224 dB re 1 iPa (peak SPL), are estimated to be equal to, or lessthan 10 in from the modelled multibeam echosounder.
Version 2.0 29

JASCO Al1>L H [) SllNC I Underwater Sound Modelling: Shelburne Basin Venture Seabed Survey
Literature Cited
[ITC] International Transducer Corporation. 1993. Application Equations for Underwater Sound Transducers (pamphlet).International Transducer Corporation, Santa Barbara, CA.
Carnes, M.R. 2009. Description and Evaluation of GDEM-V 3.0. NRL Memorandum Report 7330-09-9165. US NavalResearch Laboratory, Stennis Space Center, MS. 21 p.
Chapman, D.M.F. and D. Ellis. 1980. Propagation Loss Modelling on the Scotian Shelf: The Geo-Acoustic Model. InKuperman, W.A.a.F.B.J. (ed.). Bottom Interacting Ocean Acoustics. New York. pp. 525-539.
Cochrane, N.A. 2007. Ocean Bottom Acoustic Observations In The Scotian Shelf Gully During An Exploration SeismicSurvey—A Detailed Study. Canadian Technical Report of Fisheries and Aquatic Sciences 2747(viii+): 73.
Coppens, A.B. 1981. Simple equations for the speed of sound in Neptunian waters. Journal of the Acoustical Society ofAmerica 69(3): 862-863.
Ellis, D. and S. Hughes. 1989. Estimates of sediment properties for ARPS. Dartmouth, NS, Canada.
Fisher, F.H. and V.P. Simmons. 1977. Sound absorption in sea water. Journal of the Acoustical Society of America 62(3):55 8-564.
Hammerstad, E. 2005. EM Technical Note: Sound Levels from Kongsberg Multibeams. 3 p.
Kinsler, L.E., A.R. Frey, A.B. Coppens, and J.V. Sanders. 1950. Fundamentals of acoustics. John Wiley & Sons Inc., NewYork.
Kongsberg Maritime AS. 2013a. EM® 302 30 kHz multibeam echo sounder: technical specifications (pamphlet). AS, K.M.,Horten, Norway.http://www.km.kongsberg.comlks/web/nokbgo24o.nsf/Al lWeb/87 1 BO55B3DEODAC3C 12571 5E002B5C68’?OpenDocument.
Kongsberg Maritime AS. 2013b. The hydrographic product family: Sound in water reveals the secrets of the deep blue(pamphlet).http://www.km.kongsberg.com/ks/web/nokbg0240.nsf/A1lWeb/87 1BO55B3DEODAC3C 12571 5E002B5C68?OpenDocument.
Massa, D.P. 1999. Choosing and ultrasonic sensor for proximity or distance measurement; part 2: Optimizing sensorselection (webpage). Sensors, March 1, 1999. http://www.sensorsmag.comlsensors/acoustic-ultrasound/choosingultrasonic-sensor-proximity-or-distance-measurement-83 8.
Matthews, M.-N.R. 2012. Underwater Sound Modelling of Shell’s 2013 Shelburne Basin 3-D Seismic Survey. JASCODocument 00421, Version 5.0. Technical report by JASCO Applied Sciences for LGL Limited, environmentalresearch associates.
Nedwell, J.R. and A.W. Turnpenny. 1998. The use of a generic frequency weighting scale in estimating environmental effect.Workshop on Seismics and Marine Mammals. 23—25th June, London, U.K.
Nedwell, J.R., A.W.H. Turnpenny, J. Lovell, S.J. Parvin, R. Workman, and J.A.L. Spinks. 2007. A validation of the dBht as ameasure of the behavioural and auditory effects of underwater noise. Report No. 534R1231 prepared bySubacoustech Ltd. for the UK Department of Business, Enterprise and Regulatory Reform under Project No.RDCZ/0 11/0004. www.subacoustech.com/informationJdownloads/reports/534R1 231 .pdf.
Osler, J.C. 1994. A geo-acoustic and oceanographic description of several shallow water experimental sites on the ScotianShelf. Technical Memorandum 94/216. Defence Research Establishment Atlantic, Dartmouth, NS. 42 p.http://www.dtic.mil/cgi-binlGetTRlJoc?Location=U2&doc=GetTRDoc.pdf&AD=ADA288300.
Porter, M.B. and Y.-C. Liu. 1994. Finite-element ray tracing. In: Lee, D. and M.H. Schultz (eds.). Proceedings of theInternational Conference on Theoretical and Computational Acoustics. Volume 2. World Scientific Publishing Co.
pp. 947-956.
Version 2.0 30

JASCO \P11 IF [) SLIt \ 1 Underwater Sound Modelling: Shelburne Basin Venture Seabed Survey
Rodriguez, B., C.S. Morris, Y.J.E. Belz, E.C. Chapin, J.M. Martin, W. Daffer, and S. Hensley. 2005. An Assessment of theSRTM Topographic Products. JPL D-31639. Jet Propulsion Laboratory, Pasadena, CA.
Southall, B.L., A.E. Bowles, W.T. Ellison, J.J. Finneran, R.L. Gentry, C.R. Greene, Jr., D. Kastak, D.R. Ketten, J.H. Miller,et al. 2007. Marine mammal noise exposure criteria: Initial scientific recommendations. Aquatic Mammals 33: 411-521.
Teague, W.J., M.J. Carron, and P.J. Hogan. 1990. A comparison between the Generalized Digital Environmental Model andLevitus climatologies. Journal of Geophysical Research 95(C5): 7167-7183.
Version 2.0 31


Appendix B: Summary of Consultations
A enc EA Section where
Stakeholder GroupContact(s) Details of Engagement CommentslConcerns Comment!Concern
Addressed! ResponseFisheries Advisory
• Eric Theriault and Information on the Query regarding the FLO/MMO details wereCommittee (FAC) Elizabeth seabed survey was first number of FLO/MMOs to included in the following
MacDonald (as co- introduced to the FAC on be used on the program sections:
chairs/schedulers of 25 Sept 2013 as part of Section 4.3.1
this Committee) Shell’s regularly Section 8.1scheduled update.Provision of thisinformation included apower point presentationand opportunity todiscuss with memberspresent; meeting minuteswere also drafted andcirculated by the FAC cochairs to ensureinformation sharing withFAC members that wereunable to attend.
Canada-Nova Scotia Elizabeth MacDonald, Provision of an overview Direction provided that EA CNSOPBOffshore Petroleum Board Advisor, Environmental of proposed scope of update to include recommendation were(C-NSOPB) Affairs seabed survey as well as consideration of the addressed in the following
timeline and scope of EA following: sections:was provided on 26 • updates to VECs Section 4.0September2013 as part identified in EA Section 6.0of a regulatory update scoping document Section 8.0meeting. • updates on
cumulative effectsFollow up phone call on • inclusion of a24 November2013 to description of thediscuss EA update benthic environmentscope and timeline. to consider seabed
samplingMi’kmaq Kwilmu’kw Maw- Twila Gaudet, KMKNO Information on the No comments or concerns N/AKlusuaqn Negotiation Consultation Liaison proposed seabed survey at this timeOffice (KMKNO) Officer was first provided to the
KMKNO on 26 Sept2013Melissa Nevin, KMKNO as part of Shell’s regularlyConsultation Liaison scheduled update; thisOfficer included a power point
presentation andAllison Bemard, KMKNO opportunity to discussCommercial Fisheries with members present.Coordinator
A project informationpackage was sent toKMKNO representativeson 28 Jan 2014; packageincluded operationalspecifics and maps.Recipients encourage toprovide any question orcomments back to Shell.
B-i

A enc EA Section whereg ‘ Contact(s) Details of Engagement Comments/Concerns CommentlConcern
Stakeholder Group Addressed! ResponseIndian Jim Michael Information on the No Comments or N/ABrook/Shubenacadie Consultation Director proposed seabed survey concerns at this timeMi’kmaq Nation was first provided to
Shubenacadie on 4 Dec2013 as part of Shell’sfirst introductions sessionfollowing this Nationsseparation from theKMKNO; this sessionincluded a power pointpresentation andopportunity to discusswith members present.
A project informationpackage was sent to theShubenacadierepresentative on 28 Jan2014; package includedoperational specifics andmaps. Recipientsencouraged to provideany questions orcomments back to Shell.
Maritime Aboriginal Roger Hunka Information on the No comments or concems N/APeople’s Council/Native Consultation Director proposed seabed survey at this timeCouncil of Nova Scotia was provided to the
Tim Martin Native Council (via theCommercial Fisheries FAC) on 25 Sept 2013 asDirector part of Shell’s regularly
scheduled project update;this included a powerpoint presentation andopportunity to discusswith members present;meeting minutes werealso drafted andcirculated by the FAC cochairs to ensureinformation sharing withFAC members that wereunable to attend.
A project informationpackage was sent to theNative Councilrepresentatives on 28Jan 2014; packageincluded operationaldetails and associatedmaps. Recipientsencouraged to provideany questions orcomments back to Shell.
World Wildlife Federation Tonya Wimmer Information on the Query regarding timing of Information regarding the(WWF) proposed seabed survey the survey and effects of timing of the proposed
was provided to WWF on MBES on marine survey and the potential
30 September2013 mammals effects of MBES on
during a face to face manne mammals were
meeting to provide an provided in the followingsections:
B-2

Agency!EA Section where
Contact(s) Details of Engagement Comments/Concerns CommentlConcernStakeholder Group Addressed! Response
update on future • Section 2.1activities. This information • Section 5.0was provided as a powerpoint presentation andopportunity to discusswith members present.
A project informationpackage was sent to the‘MNF on 28 Jan 2014;package included detailsand associated maps.Recipients encouraged toprovide any questions orcomments back to Shell.
Ecology Action Center Mark Butler, Policy Information on the No comments or concerns N/A(EAC) Director proposed seabed survey to date
Geoff Hurley, was provided to the EACIndependent consultant on 30 Sept2013 during a
face to face meeting toprovide an update onfuture activities. Thisinformation was providedas a power pointpresentation andopportunity to discusswith members present.
A project informationpackage was sent to theEAC on 28 Jan 2014;package included detailsand associated maps.Recipients encouraged toprovide any questions orcomments back to Shell.
Fisheries (both FAC and Information on the Query regarding the FLO/MMO details werenon-FAC groups) Fisheries Interests proposed seabed survey number of FLO/MMOs to included in the following
Including: was first provided to be used on the program sections:members of the FAC on Section 4.3.1
• Atlantic Herring and 25 Sept 2013 as part of Section 8.1
Full Bay Scallop Shell’s regularlyscheduled update. AAssociationspower point presentation
• Nova Scotia Sword was provided to theFisherman’s attending members of theAssociation meeting outlining the
• Clearwater proposed 2014 Project.Fisheries Limited An opportunity to discuss
with members present• Seafood ProducersAssociation of Nova was provided at the close
of the meeting. MeetingScotia,minutes were also drafted
Eastem Shore Fish and circulated by thePackers FAC co-chairs to ensureAssociation, information sharing withNova Scotia Fish FAC members that were
Packers unable to attend.Association,
Scotia HarvestA project information
Seafoods package was sent tofisheries representatives
Southwest Nova on 28 Jan 2014; packageTuna Association included operational
specifics and maps.
B-3

EA Section whereAgency!Contact(s) Details of Engagement Comments/Concerns Comment/ConcernStakeh older Group Addressed! Response
Halifax WestCommercialFisherman’sAssociation
• Swordfish HarpoonAssociation
• Nova Scotia FixedGear 45-65 Society
Lobster Area #34
Ground Fish
Recipients encouraged toprovide any questions orcomments back to Shell.
EnterpriseAllocation Council
• Shelbume CountyGillnet Fisherman’sAssociation
• J Fraelic and SonsFisheries
• Maritime AboriginalPeoplesCouncil/NativeCouncil of NovaScotia- via fisheriesrep
• Unama’ki Institute ofNatural Resources
• Mi’kmaq Kwilmu’kwMaw-KlusuaqnNegotiation Office(KMKNO)- viafisheries rep
• Indian Brook!Shubenacadie-viafisheries rep
B-4

Kenda Landry
From: Elizabeth MacDonaldSent: Friday, January31, 20149:02 AMTo: Document ControlCc: Keith Landra; Eric TheriaultSubject: FW: REGULATORY SUBMISSION- Shelburne Basin Seabed Survey- Checklist #8 -
Environmental Assessment UpdateAttachments: Cover Letter - EA Update- Checklist # 8.pdf; SAl 249-Shell EA Update-30 Jan 14-rev 4 pm.pdf
30,008.28
From: Candice.C.Cook@shell .com [mailto:Candice.C.Cookshell .com]Sent: Thursday, January 30, 2014 3:36 PMTo: Elizabeth MacDonaldCc: [email protected]; [email protected]; Heather.Coussonshell.com; Joachim Pektzilikoglou;[email protected]: REGULATORY SUBMISSION- Shelburne Basin Seabed Survey- Checklist #8 - Environmental Assessment Update
Ms. MacDonald,
Please find attached a cover letter and associated EA update to complywith Geotechnical/Geological/Engineering/Environmental Program Authorization Checklist Requirement #8 —
Environmental Assessment. This submission is in association with Shell’s Shelburne Basin Venture Seabed Survey to beconducted in 2014.
Please contact me if you have any questions or concerns with this submission.
Sincerely,
Candice Cook-Ohryn, M.E.DesEnvironmental PlannerShell Canada Limited400 4th Avenue S.W., Calgary, Alberta T2P Oji, Canada
Tel: +1 403 384 8747Cell: +1 403 815 6841Email: [email protected]: http: / /www.shell.ca
1
