environmental benefit index for wetland restoration … · credit valley conservation technical...
TRANSCRIPT

SEPTEMBER 2016
EnvironmEntal BEnEfit indEx for WEtland rEstoration on PrivatE lands
in thE GrEEnBElt rEGion of ontario, Canada
User Manual
Prepared by: Shashi Kant
Kant & Wang Consultants
Mark EastmanCredit Valley Conservation
Prepared for:Credit Valley Conservation
1255 Old Derry RoadMississauga ON L5N 6R4


Credit Valley Conservation Technical Report Series
i
Environmental Benefit Index for Wetland Restoration on Private Lands in the Greenbelt
Region of Ontario, Canada
User Manual
Prepared by: Shashi Kant
Kant & Wang Consultants
Mark Eastman Credit Valley Conservation
Prepared for:
Credit Valley Conservation 1255 Old Derry Road
Mississauga ON L5N 6R4
September 2016

ii

Credit Valley Conservation
iii
TABLE OF CONTENTS
LIST OF TABLES ............................................................................................................iv
ACKNOWLEDGEMENTS ............................................................................................... v
EXECUTIVE SUMMARY ................................................................................................vi
1.0 INTRODUCTION ..................................................................................................... 9
2.0 ENVIRONMENTAL BENEFIT INDEX DEVELOPMENT PROCESS ....................... 11
3.0 ENVIRONMENTAL BENEFIT INDEX .................................................................... 13
3.1 MAXIMUM SCORES...................................................................................... 14 3.2 SCORING CRITERIA ..................................................................................... 16
1.0 Component: Biological ............................................................................. 17 2.0 Component: Hydrological ......................................................................... 33 3.0 Component: Social .................................................................................. 45
3.3 WEIGHTING OF ATTRIBUTES ..................................................................... 51 3.4 CLIMATE MITIGATION AND POLLUTION REDUCTION SCORES .............. 52
4.0 ENVIRONMENTAL BENEFIT INDEX CALCULATOR ............................................ 53
5.0 CONCLUSIONS ..................................................................................................... 55
6.0 REFERENCES ...................................................................................................... 56
7.0 APPENDICES ........................................................................................................ 57
APPENDIX 1: ENVIRONMENTAL BENEFIT INDEX ................................................. 57 APPENDIX 2: RUNOFF COEFFICIENTS .................................................................. 67

Credit Valley Conservation
iv
LIST OF TABLES Table 1.1.1: Weights and Scoring Criteria for Wetlands Types Table 1.1.2: Weights and Scoring Criteria for Effective Project Area Table 1.1.3: Weights and Scoring Criteria for Proximity to Other Wetlands Table 1.1.4: Weights and Scoring Criteria for Open Water Types Table 1.1.5: Weights and Scoring Criteria for Interspersion Table 1.1.6: Weights and Scoring Criteria for Vegetation Communities Table 1.1.7: Weights and Scoring Criteria for Diversity of Surrounding Habitat Table 1.1.8: Weights and Scoring Criteria for Carbon Sequestration Table 1.2.1: Weights and Scoring Criteria for Reproductive Habitat for Endangered and/or
Threatened Species Table 1.2.2: Weights and Scoring Criteria for Traditional Migration Feeding or Hibernation
Habitat for Endangered and/or Threatened Species Table 1.2.3: Weights and Scoring Criteria for Presence of Locally, Regionally, and/or
Provincially Significant Plant and Animal Species Table 1.2.4: Weights and Scoring Criteria for Nesting and Feeding Habitat for Colonial
Waterbirds Table 1.2.5: Weights and Scoring Criteria for Waterfowl Breeding, Staging and/or Moulting Area Table 1.2.6: Weights and Scoring Criteria for Migratory Passerine, Shorebird, or Raptor
Stopover Area Table 1.2.7: Weights and Scoring Criteria for Fish Habitat Table 2.1.1: Weights and Scoring Criteria for Flood attenuation capacity Table 2.1.2: Weights and Scoring Criteria for Ground Water Discharge Table 2.1.3: Weights and Scoring Criteria for Ground Water Recharge Table 2.2.1: Weights and Scoring Criteria for Short-term Water Quality Improvement in Wetland Table 2.2.2: Weights and Scoring Criteria for Short-term Water Quality Improvement in Upland
Buffer Table 2.2.3: Weights and Scoring Criteria for Long-term Nutrient (Nitrogen/Phosphorous) Trap
in Wetland Table 2.2.4: Weights and Scoring Criteria for Shoreline Erosion Control Table 2.2.5: Weights and Scoring Criteria for Carbon Storage Table 3.1.1: Weights and Scoring Criteria for Goods Table 3.1.2: Weights and Scoring Criteria for Recreation Table 3.1.3: Weights and Scoring Criteria for Aesthetics Table 3.1.4: Weights and Scoring Criteria for Education and Research Table 3.1.5: Weights and Scoring Criteria for Historical, Religious and Cultural Values

Credit Valley Conservation
v
ACKNOWLEDGEMENTS Many individuals contributed to the creation of the wetland restoration Environmental Benefit
Index. The authors would like to thank the following people for their valuable contributions:
Steering Committee (Credit Valley Conservation staff)
• Mike Puddister
• Lisa Brusse
• Bob Morris
• Scott Sampson
• Aviva Patel
• Neelam Gupta
• Amanjot Singh
• Paul Biscaia
• Tatiana Koveshnikova
Expert Panel
• Christopher Davidson, Golder & Associates
• Marissa Skinner, University of Guelph Student
• Felix Whitton, Friends of the Greenbelt Foundation
• Shelley Petrie, Friends of the Greenbelt Foundation
• Alexandra Service, Ducks Unlimited
• Brooke Marshall, Region of Peel
• Elizabeth Snell, Snell and Cecile Environmental Research
• Laura DelGiudice, Toronto and Region Conservation Authority
• Tony Zammit, Grand River Conservation Authority
• Irena Creed, University of Western Ontario
• Nick Pirzas, Don Naylor & Associates
• Dan Mansel, asiOTUS Natural Heritage Consultants
Communications (Credit Valley Conservation Staff)
• Baljit Sharma
• Kourtney Partington
Lastly, we would like to thank the Friends of the Greenbelt Foundation for providing the
necessary funding to complete this work.

Credit Valley Conservation
vi
EXECUTIVE SUMMARY In the Greenbelt region, wetlands cover approximately 12% of the area providing multiple
ecosystem services worth more than a billion dollars per year. However, the majority of
wetlands are held in private ownership and require restoration to maximize their production of
ecosystem services. Globally, a wide range of market based instruments have been used to
promote restoration and rehabilitation of degraded ecosystems, but reverse auctions have an
economic advantage over other instruments because of the competitive bidding process
involved.
The design and implementation of reverse auctions is a complex process involving multiple
steps. In the Credit River watershed, the initial steps of valuing the ecosystem services provided
by wetlands and determining rural landowner’s views and preferences for wetland restoration
were completed through previous ecosystem valuation and willingness to pay and accept
studies (Kennedy and Wilson, 2009; Trenholme et al, 2013). This study aims to develop a
Greenbelt-specific Environmental Benefit Index (EBI) to be used by conservation practitioners
(preferably with experience conducting Ontario wetland evaluations) to measure incremental
changes in multiple ecosystem services as a result of private landowners undertaking specific
wetland restoration activities.
The Greenbelt-specific wetland restoration EBI was developed utilizing a combination of EBIs
developed in the USA, Australia, and Canada and two supporting documents; the CVC Wetland
Restoration Strategy (Snell et al, 2009) and the Ontario Wetland Evaluation System (OWES,
2013). The preliminary framework included biological, hydrological, and social benefits, and
each of these benefits was assigned equal weight. The EBI included 17, 7, and 9 attributes of
biological, hydrological, and social benefits, respectively.
The preliminary framework was critically examined and refined by a project Steering Committee
comprised of members with expertise in the biological, hydrological and social benefits of
wetlands. The refined EBI was presented to the Wetland Restoration EBI Expert Panel,
comprised of 12 experts from 11 organizations. The observations/suggestions made by the
Expert Panel were later discussed by the Steering Committee, and required modifications were
made to the EBI. The modified EBI was tested with three mock projects: (i) wetland
enhancement through livestock restriction and buffer, and wetland planting; (ii) wetland creation
through disruption of an agricultural tile drain system, and; (iii) wetland type conversion from a

Credit Valley Conservation
vii
bog to a marsh. The EBI was further refined and finalized on the basis of the results of the three
test runs.
The final EBI has three components which include: biological, hydrological, and social benefits.
The biological and hydrological components both have two sub-components and the social
component has five sub-components. The number of biological, hydrological, and social
attributes is 15, 8, and 5, respectively. The Steering Committee felt strongly that both the quality
of the existing project site and the quality of the restoration project were factors worth
considering in the EBI. Therefore, both the existing condition and the restored condition are
assessed separately for each attribute. The maximum number of points to assign each attribute
was based on local watershed priorities. The result was that a maximum of 204 and 283 points
were assigned to the biological attributes existing condition and restored condition, respectively.
A maximum of 315 and 325 points were assigned to the hydrological attributes existing and
restored condition, respectively. A maximum of 25 and 125 points were assigned to the social
attributes existing and restored condition, respectively. Therefore, the total maximum points
attainable in the EBI are 544 and 733 for the existing and restored conditions, respectively.
The total EBI score is the sum of the existing condition score and the change in conditions score
(i.e. restored conditions-existing conditions). However, after a careful analysis, it was
determined that the existing conditions score and change in conditions score required a
weighting of 0.55 for existing condition and 0.45 for change in conditions in order to have the
EBI produce the desired results. To calculate the final EBI score the weighted existing
conditions score and the weighted change in conditions scores are summed.
An EBI calculator has been developed to assist with the computations involved in the calculation
of the final EBI score.
Use of the EBI within a wetland restoration reverse auction program will allow the conservation
practitioner to make two determinations: i) which projects to fund based on the biological,
hydrological and social benefits provided by the restored wetland, and; ii) which projects to fund
based on the cost-to-benefit ratio of each proposed project.

Credit Valley Conservation
viii
This page intentionally left blank
Credit Valley Conservation
9
1.0 INTRODUCTION The Greenbelt Act (2005) protects approximately 720,000 hectares of environmentally
significant lands and farmlands from urban sprawl in Ontario. A Natural Heritage System (NHS)
of approximately 219,000 hectares, where the main focus is on protecting, restoring, and
reconnecting natural features such as wetlands and woodlands and their functions, is one of the
key features of the Greenbelt (Ducks Unlimited Canada et al., 2012). Wetlands cover
approximately 96,000 hectares (12%) of land across the Greenbelt and provide ecosystem
services worth $1.3 billion (in 2005$) per year (David Suzuki Foundation, 2008). More locally,
within the Credit River watershed, wetlands were shown to be the most valuable of all natural
land types providing at least $187 million (in 2007$) per year in ecosystem services to the
residents of the watershed (Kennedy and Wilson, 2009).
Land use changes have resulted in the loss of and degradation of the ecosystem services
wetlands once provided. The Government of Ontario has created a strong legal and policy
framework to protect wetlands in the Greenbelt region. However, infrastructure development,
aggregate extraction, intensifying agricultural practices, peat extraction, and water takings still
continue to adversely impact wetlands (Ducks Unlimited Canada et al., 2012).
In the Greenbelt region, a high proportion of wetlands are under private ownership. Hence,
effective and efficient economic tools such as market-based instruments are required to
effectively engage farm and non-farm rural wetland owners in wetland restoration incentive
programs delivered at affordable costs. Reverse auctions have advantages over other market-
based instruments because the competitive bidding process increases the cost effectiveness of
the incentive program.
The design and implementation of a reverse auction is a complex process. Generally, this
process is location specific and involves many steps. Key initial steps are to develop: (i) an
understanding of the key ecosystem services provided by wetlands and their relative importance
to improve the quality of the natural environment for the area; (ii) an understanding of
landowners’ views on wetland restoration; and (iii) an understanding of economic and
environmental preferences of landowners so that an effective incentive program can be
designed. In the case of the Credit River watershed, this information was obtained with the
completion of two studies funded in part by the Friends of the Greenbelt Foundation. In 2009,
Kennedy and Wilson completed a valuation of ecosystem services and in 2013 Trenholm et al.

Credit Valley Conservation
10
assessed landowners’ views about wetland restoration and their economic and environmental
preferences. It was this work that demonstrated the remarkable value of wetlands to society and
that a wetland restoration incentive program based on the principles of a reverse auction is the
preferred method to restore wetlands on private lands in the Credit River watershed.
In this study, an Environmental Benefit Index (EBI) specific to wetlands and suitable for use
within the Greenbelt landscape is developed. In addition, a Microsoft Excel-based Wetland
Restoration EBI Calculator is developed to assist in the EBI calculations. Wetlands located in
the Credit River watershed are treated as a representative sample of wetlands present across
the Greenbelt. Therefore, the EBI is developed for the Credit River watershed but it is applicable
to all wetlands across the Greenbelt. The proposed EBI measures environmental as well as
social benefits associated with undertaking wetland restoration projects. The EBI serves as a
tool for implementing market-based landowner engagement incentive programs - such as
reverse auctions – where the measurement of benefits associated with undertaking a specific
wetland restoration project is a prerequisite to awarding funding.
In this manual we provide context on how the EBI was developed (Section 2) and present the
EBI including the maximum scores, scoring criteria and weighting of each environmental and
social attribute (Section 3). In addition, guidance on how to use the Wetland Restoration EBI
Calculator Tool is included in Section 4 and concluding remarks are provided in Section 5.

Credit Valley Conservation
11
2.0 ENVIRONMENTAL BENEFIT INDEX DEVELOPMENT PROCESS EBIs that are based on existing local knowledge and/or systems have the most value to
conservation practitioners and are able to make the most accurate measurements of ecosystem
services. Hence, a review of existing literature on EBIs was conducted prior to initiating the
development process. This review included a critical analyses of the EBIs used in the USA,
Australia, and Canada. After the review, two supporting key documents; the CVC Wetland
Restoration Strategy (Snell et al, 2009) and Ontario Wetland Evaluation System (OWES, 2013)
were examined. A preliminary framework for an EBI was proposed on the basis of the literature
review and the examination of these two documents.
Ontario Wetland Evaluation System (Southern Ontario Manual 3.2, 2013) is based on scientific
criteria and was designed to meet the needs of the planning process. The system recognizes
the role of wetlands in maintaining critical ecosystem functions as well as providing social
benefits. In the system, wetland values are classified into four components: biological, social,
hydrological, and special features values. Each component is evaluated individually and
separately. Each component is subdivided into sub-components, and some sub-components
into attributes and some attributes into sub-attributes. The relative value is assessed by
ascribing point scores to predefined values. Within each component, sub-component, attribute
and/or sub-attribute, values are weighted to reflect their importance relative to each other. The
sum of point scores for sub-attributes and attributes gives a measure of value at the sub-
component and component levels. The maximum score for each of the four components is 250,
and therefore any wetland can score a maximum of 1000 points.
In the proposal of the preliminary EBI, OWES (2013) was used as the starting point and the
components, sub-components, attributes and their scores were modified for their computability
and suitability to privately owned wetlands in the Credit River watershed and Greenbelt region.
The preliminary EBI framework included three components: biological, hydrological, and social.
The relevant attributes of the special feature values component in the OWES were imbedded in
the proposed three components. Each of these three components was assigned equal weight of
250. The numbers of attributes were 17 biological, 7 hydrological and 9 social.
A Steering Committee, represented by CVC staff with specialties in all three components of the
EBI was formed. The preliminary framework was presented and discussed with the Steering
Committee. In this process of refinement, the Steering Committee modified attributes, refined

Credit Valley Conservation
12
the weights of components, and revised the scoring mechanisms for each attribute. In addition,
the Steering Committee decided that it was important to score wetland benefits for both a
change in condition (as a result of the restoration project) and for the quality of the existing (pre-
restoration) site. Including both of these elements in the EBI encourages wetland restoration
activities that not only provide the greatest amount of improved public benefit as a result of the
restoration project, but also encourages wetland restoration to be undertaken in locations where
they will have the greatest success at providing long-term benefits. This is based on the
ecological concept of it being more efficient to improve and protect the best ecosystems first. In
the first refinement of the EBI, the existing site condition and the restored condition were
assigned equal weight.
A draft EBI was presented to a group of 12 wetland experts representing 11 organizations.
Following this, the observations/suggestions of the Expert Panel were discussed in a Steering
Committee meeting, and required enhancements were made to the EBI. The modified EBI was
tested with three mock projects: (i) wetland enhancement through livestock restriction and
buffer, and wetland planting; (ii) wetland creation through disruption of an agricultural tile drain
system, and; (iii) wetland type conversion from a bog to a marsh. This was an invaluable
process which resulted in further modifications to the scoring criteria and weights for many of
the EBI attributes. The final EBI is presented in Section 3.

Credit Valley Conservation
13
3.0 ENVIRONMENTAL BENEFIT INDEX The final EBI has three components which include: biological, hydrological, and social benefits.
The biological and hydrological components each have two sub-components and the social
component has five sub-components. The number of biological, hydrological, and social
attributes is 15, 8, and 5, respectively. The Steering Committee decided how many points to
assign each attribute based on local priorities. The result was that a maximum of 204 and 283
points were assigned to the biological attributes existing condition and restored condition,
respectively. A maximum of 315 and 325 points were assigned to the hydrological attributes
existing and restored condition, respectively, and a maximum of 25 and 125 points were
assigned to the social attributes existing and restored condition, respectively. Therefore, the
maximum points attainable in the EBI are 544 and 733 for the existing and restored conditions,
respectively.
The complete EBI inclusive of its components, sub-components, attributes, maximum possible
scores and scoring criteria is presented in Appendix 1.

Credit Valley Conservation
14
3.1 MAXIMUM SCORES The greater the maximum score, the greater the value that attribute provides to the public and
therefore, the greater weight that attribute has in the calculation of the final EBI Score.
Looking to the future, the Steering Committee felt it was important to develop an EBI that
measures both the quality of the existing site and the change in condition upon implementation
of the wetland restoration project. Including both measures enhances the likelihood that the
proposed reverse auction would fund projects that not only provide the greatest amount of
improved public benefit but also encourage restoration of sites that are currently fair in quality
and that may only require minimal work to unlock their full benefit potential. Valuing the
condition of the existing site as well as the change in condition also discourages reverse auction
participants from intentionally degrading the quality of their site in an effort to improve the
attractiveness of their proposed wetland restoration project. This helps prevent future wetland
loss and ensures responsible program spending.
As displayed in the EBI (Appendix 1) a maximum score for both the existing condition and
restored condition has been included. For some attributes the maximum score for the existing
condition matches that of the restored condition and for others they are different. When the
existing condition maximum score is automatically assigned a score of zero this indicates that it
is not practical to score the existing condition for that specific attribute. In other instances where
the existing condition maximum score is greater than zero but less than the restored condition
maximum score, this indicates that it is practical to have existing wetlands in fair condition but
that with restoration, an even better score is attainable for that attribute. For instance, when
scoring attribute 1.1.8 Carbon Sequestration, a perfect scenario for the existing conditions is
having a wetland that is dominated by trees (i.e. a swamp). This would score 15 points out of a
maximum of 15 points. However, the proposed wetland restoration project may intend to expand
the size of the wetland and plant additional trees in the newly expanded wetland area. This
proposed action would result in a score of 25 points out of a maximum of 25 points,
representing a change in condition of 10 points. By assigning different maximum scores for the
existing and restored conditions, the EBI is able to value additionality benefits for those
attributes.
The total maximum points for both the existing and restored condition for each attribute were
arrived at through discussions on local priorities held by the Steering Committee and with input

Credit Valley Conservation
15
provided by the Wetland Restoration Expert Panel members. For instance, water quality
attributes were deemed to be the most important sub-component and as such a total of 200
maximum points (restored condition) was placed on the water quality and carbon storage sub-
component, whereas, other sub-components receive fewer total maximum points.
The total maximum EBI points available for the existing condition are 544. This is comprised of
204 from the biological component, 315 from the hydrological component and 25 from the social
component.
The total maximum points available for the restored condition are 733. This is comprised of 283
from the biological component, 325 from the hydrological component and 125 from the social
component.
The intent of the proposed EBI is to measure public benefits from the restoration of private
wetlands and the Steering Committee decided that the provision of public social benefits from
private wetlands is limited as compared to biological and hydrological benefits. Hence, the total
weight of social benefits for the restored condition only represents 17% of the total maximum
points, compared to 39% for biological and 44% for hydrological. It should be noted that
ecosystem services such as water and air purification, species biodiversity and flood attenuation
are all social benefits that the public receives from wetlands but these have been categorized as
biophysical attributes under the biological and hydrological sections of the EBI. Therefore,
attributing 17% of the total maximum points to the more direct social component (i.e. recreation,
education, etc.) is not viewed as an undervaluing of the social benefits provided by wetlands.

Credit Valley Conservation
16
3.2 SCORING CRITERIA The OWES (2013), as stated earlier, was the starting point for this EBI. Similar, to the
identification of components, sub-components, and attributes, the OWES (2013) provided the
platform to further refine the scoring criteria for this EBI. However, the scoring criterion of many
attributes has been modified to suit the local conditions of private wetlands in the Greenbelt
region. The scoring method for each attribute is discussed in this section.
Please note, the heading number convention within this section corresponds to the EBI
(Appendix 1) and is not meant to be consistent with the heading number convention used in
other sections of this report.

Credit Valley Conservation
17
1.0 Component: Biological 1.1 Sub-Component: Wetland Site Characteristics and Biodiversity 1.1.1 Attribute: Wetland type Wetlands may consist of different wetland ecosystem components such as marshes, swamps,
bogs or fens, and similar to OWES (2013), the EBI classifies these as wetland types. Wetland
types differ in their physical appearance, types and numbers of plant and animal species
present, and rates of primary productivity. The EBI user (conservation practitioner) must
determine wetland types based on the major plant species, physical substrate, and hydrological
condition of the wetland and immediate surroundings. For detailed guidance on determining
wetland type refer to OWES (2013). In this system, shallow open water marshes are simply
treated as marsh wetlands.
The OWES values wetland type for its ability to provide primary productivity and therefore
marshes are scored highest followed by swamps, fens and lastly bogs. The Steering Committee
decided to deviate from this logic and score wetland type based on rarity within the Greenbelt
region. As a result, bogs and fens are ranked highest followed by swamps and then marshes.
The wetland type EBI scoring criteria for the existing and restored wetland conditions are
provided in table 1.1.1.
Table 1.1.1 Weights and Scoring Criteria for Wetland Types Existing Condition - Scoring Criteria Maximum Score – 10
Restored Condition - Scoring Criteria Maximum Score - 10
- Zero points for no existing wetland - Fractional Area x 5 points for marsh - Fractional Area x 8 points for swamp - Fractional Area x 10 points for bog and/or fen
- Fractional Area x 5 points for marsh - Fractional Area x 8 points for swamp - Fractional Area x 10 points for bog and/or fen
Notes: - The Fractional Area (FA) of all wetlands must equal 1, regardless of whether or not there are multiple wetland
types present. For example, a wetland that only contains marsh would have a score of 5 points (FA(1) x 5 = 5 points), however, a wetland that contains 50% swamp and 50% bog would have a score of 9 points (FA(0.5) x 8 = 4 points swamp and FA(0.5) x 10 = 5 points bog, totaling 9 points).
- Scores must be recorded as whole numbers. If necessary, use standard rounding rules to calculate final score (i.e. 7.5 is recorded as 8 and 7.4 is recorded as 7).

Credit Valley Conservation
18
1.1.2 Attribute: Effective Project Area The effective project area is the area of wetland created or enhanced as a result of the
restoration project. The wetland area is measured out to the high water mark or to the point
where there is less than 50% wetland vegetation, whichever is greater. The effective project
area is an important component of restoration projects because the larger a wetland restoration
project area, the more likely it will provide multiple ecosystem benefits such as biodiversity and
wildlife habitat. Hence, a minimum score of 2 is assigned for projects smaller than 0.5 hectares
and a maximum score of 20 is assigned to projects greater than or equal to 10 hectares.
Because this attribute specifically relates to the change in wetland size as a result of the
restoration project, the existing condition is not scored and automatically awarded zero points.
The effective project area EBI weights and scoring criteria for the existing and restored
conditions are provided in table 1.1.2.
Table 1.1.2 Weights and Scoring Criteria for Effective Project Area Existing Condition - Scoring Criteria Automatic Score - zero
Restored Condition - Scoring Criteria Maximum Score – 20
- Not applicable - 2 points for less than 0.5 hectare - 5 points for greater than or equal to 0.5 hectare but
less than 2 hectares - 10 points for greater than or equal to 2 hectares but
less than 5 hectares - 15 points for greater than or equal to 5 hectares but
less than 10 hectares - 20 points for greater than or equal to 10 hectares
Note: - The wetland area is measured from the high water mark or to the point where there is less than 50% wetland
vegetation, whichever is greater

Credit Valley Conservation
19
1.1.3 Attribute: Proximity to Other Wetlands Habitat connectivity is a biological attribute provided by wetlands. Proximity and connectivity to
other wetlands provide more favorable habitat for wildlife species. Wetland proximity can be
very important for smaller size wetlands and specifically when these smaller wetlands meet the
specialized needs of sensitive wildlife species. The relative weights for the presence of another
wetland are assigned on the basis of the distance between another wetland and the restoration
project. The distance is to be measured from the outer boundary line of the wetlands. The
proximity to other wetlands EBI weights and scoring criteria for existing and restored conditions
are provided in table 1.1.3
Table 1.1.3 Weights and Scoring Criteria for Proximity to Other Wetlands Existing Condition - Scoring Criteria Maximum Score – 10
Restored Condition - Scoring Criteria Maximum Score - 10
- 4 points for no wetland within 120m of the restoration project
- 6 points for a wetland that exists within 30-120 m of the restoration project
- 8 points for a wetland that exists within 10 – 29 m of the restoration project
- 10 points for a wetland that exists less than 10 m from the wetland restoration project

Credit Valley Conservation
20
1.1.4 Attribute: Permanent and Seasonal Open Water Types Open water areas contribute to the overall habitat diversity and the quality of a wetland. The
aerial configuration and relative proportion of open water spaces is very important to many
wildlife species. For example, many waterfowl species use islands and irregular shorelines for
feeding, nesting, and resting. Hence, the percentage as well as the pattern of open water is
assessed. Please note that: (i) open water types include the presence of streams and rivers
within the wetland limits; (ii) permanent open water is year round standing water with or without
emergent vegetation; (iii) seasonal open water includes intermittent watercourses and vernal
pools that contain ponded water for greater than 2 months of the year; and (iv) when assessing
open water do not include areas with vegetation so dense that a duck could not swim through it.
The open water types EBI weights and scoring criteria for existing and restored conditions are
provided in table 1.1.4. If necessary, the conservation practitioner may refer to the OWES
(2013) for further details on this attribute.
Table 1.1.4 Weights and Scoring Criteria for Open Water Types Existing Condition - Scoring Criteria Maximum Score – 10
Restored Condition - Scoring Criteria Maximum Score - 10
- Zero points for no permanent or seasonal open water - 2 points for more than 95% of the area as permanent
open water - 4 points for less than 5% of the area as permanent
open water and/or less than 5% of the area as seasonal open water
- 4 points for 5-25% of area as permanent open water and it is occurring in the central portion of wetland
- 4 points for 76-95% of area as permanent open water, occurring in large central area; vegetation is peripheral
- 6 points for 5-25% of area as permanent open water, occurring in various sized ponds; vegetation in dense patches or diffuse open stands
- 6 points for 76-95% of area as permanent open water; vegetation occurs in patches or diffuse open stands
- 8 points for 26-75% of area as permanent open water, occurring in central portion of wetland
- 10 points for 26-75% of area as permanent open water, occurring in pattern of small ponds; embayments are common and/or 6-100% of area as seasonal open water.
- Zero points for no permanent or seasonal open water
- 2 points for more than 95% of the area as permanent open water
- 4 points for less than 5% of the area as permanent open water and/or less than 5% of the area as seasonal open water
- 4 points for 5-25% of area as permanent open water and it is occurring in the central portion of wetland
- 4 points for 76-95% of area as permanent open water, occurring in large central area; vegetation is peripheral
- 6 points for 5-25% of area as permanent open water, occurring in various sized ponds; vegetation in dense patches or diffuse open stands
- 6 points for 76-95% of area as permanent open water; vegetation occurs in patches or diffuse open stands
- 8 points for 26-75% of area as permanent open water, occurring in central portion of wetland
- 10 points for 26-75% of area as permanent open water, occurring in pattern of small ponds; embayments are common and/or 6-100% of area as seasonal open water.
Notes: - Open water includes the presence of streams and rivers within the wetland limits. - Permanent open water is year round standing water with or without emergent vegetation. - Seasonal open water includes intermittent watercourses and vernal pools that contain ponded water for greater
than 2 months of the year. - When assessing open water do not include areas with vegetation so dense that a duck could not swim through it.

Credit Valley Conservation
21
1.1.5 Attribute: Interspersion Many wildlife species prefer the “edge” areas between different types of habitat, and therefore
the number of species and the population density of many species is often highest in these
zones. Interspersion is a measure of the amount of edge and is an important component to
consider when planning a wetland restoration project. Following the OWES (2013) method,
interspersion is measured by completing the following steps:
1. Develop a map of the wetland showing the wetland boundary and the vegetation
communities.
2. Measure the longest distance of the wetland from boundary to boundary (i.e. high water
mark or to the point where there is less than 50% wetland vegetation, whichever is
greater).
3. Divide this distance by 12 and draw a square grid covering the wetland.
4. Count the number of times the horizontal and vertical grid lines intersect a wetland or
vegetation community boundary. When an intersection occurs at the location where the
horizontal and vertical gridlines meet this is counted as two intersections.
If further instruction is required, consult the OWES (2013). The interspersion EBI weights and
scoring criteria for existing and restored conditions are provided in table 1.1.5.
Table 1.1.5 Weights and Scoring Criteria for Interspersion Existing Condition - Scoring Criteria Maximum Score – 10
Restored Condition - Scoring Criteria Maximum Score - 10
- 2 point for less than 20 intersections - 4 points for 21-30 intersections - 6 points for 31-40 intersections - 8 points for 41-50 intersections - 10 points for greater than 50 intersections
- 2 point for less than 20 intersections - 4 points for 21-30 intersections - 6 points for 31-40 intersections - 8 points for 41-50 intersections - 10 points for greater than 50 intersections

Credit Valley Conservation
22
1.1.6 Attribute: Vegetation Communities on the Site A vegetation community is defined as a group of plant species occupying a specific area. The
number of vegetation communities is a good measure of biodiversity, and an important aspect
of the landscape. Hence, restoration and enhancement of vegetation communities are important
aspects of wetland restoration projects. Local Ecological Land Classification mapping (GIS data
set available here: https://www.javacoeapp.lrc.gov.on.ca/geonetwork/srv/en/main.home) may be used to define vegetation communities on the site. Similar to OWES (2013), the EBI
recognizes the value of both vegetation communities and forms. Forms are the physical
structure or shape of a plant. There are 16 vegetation forms recognized for wetlands and these
include:
1. Deciduous trees
2. Coniferous trees
3. Dead deciduous trees
4. Dead coniferous trees
5. Tall shrubs
6. Low shrubs
7. Dead shrubs
8. Herbs (ground cover)
9. Mosses
10. Robust emergent
11. Narrow leaved emergent
12. Broad leaved emergent
13. Floating plants (rooted)
14. Free floating plants
15. Submerged plants
16. No vegetation
Each vegetation community may contain one or several combinations of vegetation forms, and
therefore we propose a scoring system, similar to OWES (2013), based on the number of
vegetation communities and vegetation forms. The vegetation communities EBI weights and
scoring criteria for existing and restored conditions are provided in table 1.1.6.
Table 1.1.6 Weights and Scoring Criteria for Vegetation Communities
Existing Condition - Scoring Criteria Maximum Score - 45
Restored Condition - Scoring Criteria Maximum Score - 45
# of communities with 1-3 forms 1 = 1.5 points 2 = 2.5 points 3 = 3.5 points 4 = 4.5 points 5 = 5 points 6 = 5.5 points 7 = 6 points 8 = 6.5 points 9 = 7 points 10 = 7.5 points 11 = 8 points + 0.5 for each additional
# of communities with 4-5 forms 1 = 2 points 2 = 3.5 points 3 = 5 points 4 = 6.5 points 5 = 7.5 points 6 = 8.5 points 7 = 9.5 points 8 = 10.5 points 9 = 11.5 points 10 = 12.5 points 11 = 13 points + 0.5 for each additional

Credit Valley Conservation
23
community community community community Note: - Sum all community scores together to calculate the final score. For example, a wetland with 3 x one form
communities, 4 x two form communities and 2 x five form community would score 10 points (i.e. 7 x 1-3 forms = 6 points + 2 x 4-5 forms = 3.5 points = 9.5 points which would round-up to 10 points)

Credit Valley Conservation
24
1.1.7 Attribute: Diversity of the Surrounding Habitat Not only is the diversity of the wetland an important consideration for wildlife habitat, so too is
the diversity of the wetlands surrounding habitat. Many wildlife species use both upland habitat
and wetland habitat during their life cycles. Similar to the OWES (2013), the EBI measures the
diversity of the surrounding habitat based on the number of ecological land classifications
present within 120 metres of the wetland boundary. The diversity of surrounding habitat EBI
weights and scoring criteria for existing and restored conditions are provided in table 1.1.7.
Table 1.1.7 Weights and Scoring Criteria for Diversity of Surrounding Habitat Existing Condition - Scoring Criteria Maximum Score - 10
Restored Condition - Scoring Criteria Maximum Score - 10
(check all appropriate items) For each surrounding habitat type assign 1 point to a maximum of 10 points _ non-intensive agriculture (hay/pasture) _ abandoned agricultural land _ deciduous forest _ coniferous forest _ mixed forest _ abandoned pits and quarries _ open lake or deep river _ terrain appreciably undulating, hilly or with ravines _ creek flood plain _ grassland
(check all appropriate items) For each surrounding habitat type assign 1 point to a maximum of 10 points _ non-intensive agriculture (hay/pasture) _ abandoned agricultural land _ deciduous forest _ coniferous forest _ mixed forest* _ abandoned pits and quarries _ open lake or deep river _ terrain appreciably undulating, hilly or with ravines _ creek flood plain _ grassland
Notes: - Assess this attribute for the area within 120m of the restored wetland boundary. - Mixed forest defined as either 25% coniferous trees distributed singularly or in clumps in deciduous forest, or
25% deciduous trees distributed singly or in clumps in coniferous forest.

Credit Valley Conservation
25
1.1.8 Attribute: Carbon Sequestration Carbon sequestration is the process of atmospheric carbon capture and long-term storage in
plant biomass. All vegetation types capture carbon through photosynthesis but the amount of
carbon sequestered depends in part on bio-physical features of the vegetation. In general, trees
capture more carbon than grasses and grasses capture more carbon than aquatic vegetation.
The carbon sequestration EBI weights and scoring criteria for existing and restored conditions
are provided in table 1.1.8.
Table 1.1.8 Weights and Scoring Criteria for Carbon Sequestration Existing Condition - Scoring Criteria Maximum Score – 15
Restored Condition - Scoring Criteria Maximum Score - 25
- 5 points for aquatic dominated vegetation - 10 points for grass/forb dominated vegetation - 15 points tree dominated vegetation
- Add zero points to existing condition score if no plantings are planned as part of the proposed wetland project
- Add 5 points to existing condition score if aquatic vegetation will be planted
- Add 8 points to existing condition score if grass/forbs will be planted
- Add 10 points to existing condition score if trees will be planted
Note: - For the existing condition, choose the option that best represents the project location (i.e. wetland and natural
buffer area) - For the restored condition, add points until a maximum of 25 is reached

Credit Valley Conservation
26
1.2 Sub-Component: Wildlife and Wildlife Habitat Wildlife habitat is an ecosystem function provided by wetlands, and the value of a wetland from
a wildlife habitat perspective is strongly tied to the biological condition of the wetland. Therefore,
the wildlife habitat sub-component is included within the biological component of the EBI, and
we identify seven attributes that collectively measure the wildlife habitat value of wetlands. Each
attribute is described in greater detail below.
1.2.1 Attribute: Reproductive Habitat for Endangered and/or Threatened Species Endangered and threatened species and their habitats have been provided with protection
under provincial legislation. Some endangered and threatened species depend on wetlands for
reproduction and wetland restoration projects that improve this function are encouraged. The
reproductive habitat for endangered and/or threatened species EBI weights and scoring criteria
for existing and restored conditions are provided in table 1.2.1.
Table 1.2.1 Weights and Scoring Criteria for Reproductive Habitat for Endangered and/or Threatened Species
Existing Condition - Scoring Criteria Maximum Score – 12
Restored Condition - Scoring Criteria Maximum Score - 24
- zero points for no record of endangered or threatened species reproducing in the existing wetland or no wetland currently exists
- 6 points for confirmed reproductive use of the existing wetland by one endangered and/or threatened species
- 12 points for confirmed reproductive use of the existing wetland by more than one endangered and/or threatened species
- Add zero points to existing condition score if there is no predicted reproductive benefit to endangered or threatened species as a result of the wetland restoration project
- Add 6 points to existing condition score if there is a predicted reproductive benefit to one endangered or threatened species as a result of the wetland restoration project
- Add 12 points to existing condition score if there is a predicted reproductive benefit to more than one endangered or threatened species as a result of the wetland restoration project
Notes: - Local records to be used to validate presence/absence of species at risk - Record must be no more than 20 years old to be considered valid - Species at risk recovery strategies are to be used to validate likelihood that the proposed project will have a
reproductive benefit to species at risk
Credit Valley Conservation
27
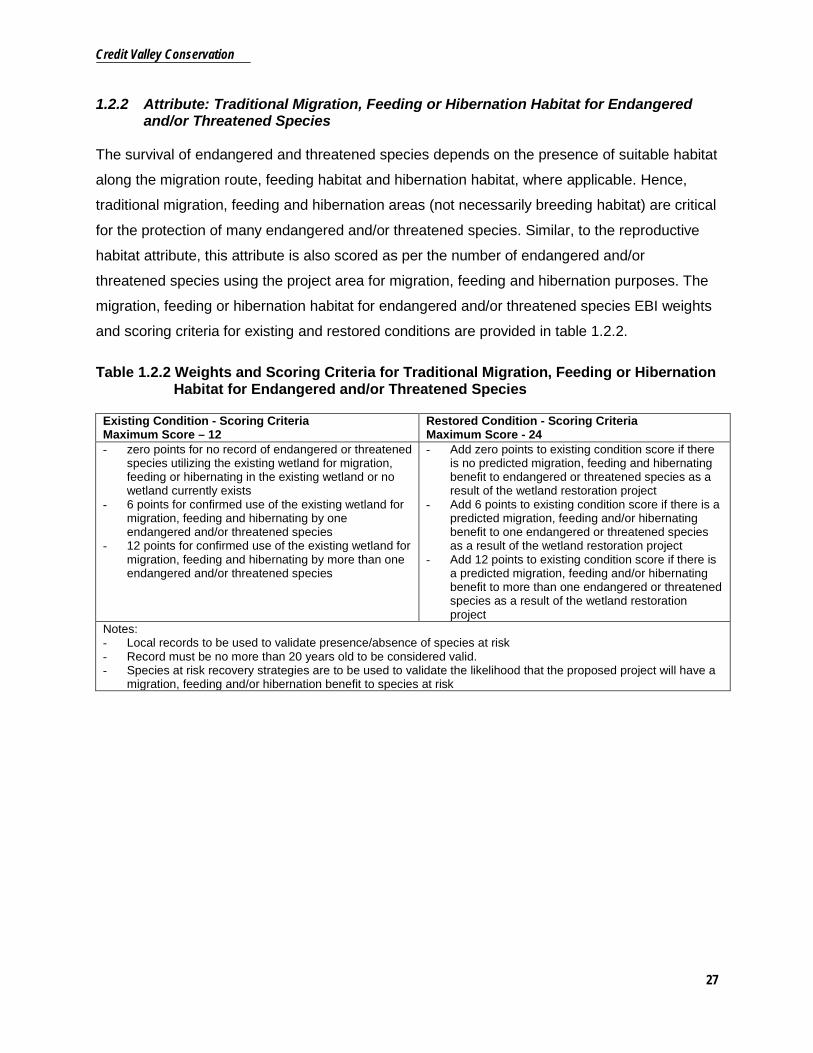
1.2.2 Attribute: Traditional Migration, Feeding or Hibernation Habitat for Endangered and/or Threatened Species
The survival of endangered and threatened species depends on the presence of suitable habitat
along the migration route, feeding habitat and hibernation habitat, where applicable. Hence,
traditional migration, feeding and hibernation areas (not necessarily breeding habitat) are critical
for the protection of many endangered and/or threatened species. Similar, to the reproductive
habitat attribute, this attribute is also scored as per the number of endangered and/or
threatened species using the project area for migration, feeding and hibernation purposes. The
migration, feeding or hibernation habitat for endangered and/or threatened species EBI weights
and scoring criteria for existing and restored conditions are provided in table 1.2.2.
Table 1.2.2 Weights and Scoring Criteria for Traditional Migration, Feeding or Hibernation Habitat for Endangered and/or Threatened Species
Existing Condition - Scoring Criteria Maximum Score – 12
Restored Condition - Scoring Criteria Maximum Score - 24
- zero points for no record of endangered or threatened species utilizing the existing wetland for migration, feeding or hibernating in the existing wetland or no wetland currently exists
- 6 points for confirmed use of the existing wetland for migration, feeding and hibernating by one endangered and/or threatened species
- 12 points for confirmed use of the existing wetland for migration, feeding and hibernating by more than one endangered and/or threatened species
- Add zero points to existing condition score if there is no predicted migration, feeding and hibernating benefit to endangered or threatened species as a result of the wetland restoration project
- Add 6 points to existing condition score if there is a predicted migration, feeding and/or hibernating benefit to one endangered or threatened species as a result of the wetland restoration project
- Add 12 points to existing condition score if there is a predicted migration, feeding and/or hibernating benefit to more than one endangered or threatened species as a result of the wetland restoration project
Notes: - Local records to be used to validate presence/absence of species at risk - Record must be no more than 20 years old to be considered valid. - Species at risk recovery strategies are to be used to validate the likelihood that the proposed project will have a
migration, feeding and/or hibernation benefit to species at risk

Credit Valley Conservation
28
1.2.3 Attribute: Presence of Locally, Regionally, and/or Provincially Significant Plant and Animal Species that Directly Benefit from Existence of Wetlands
Provincially significant species are determined by the Natural Heritage Information Centre
(NHIC). There is conservation concern at a global, national or provincial level for certain
provincially significant species. These species include individual species or assemblages of
species (e.g. plant communities or wildlife concentration areas) and federally or provincially
listed species at risk including listed populations or designatable units (genetically,
geographically, etc.) of a specific species. One important aspect of these species is that “fauna”
in this section includes invertebrates. It is recommended that NHIC lists for provincially
significant species be consulted early on in the wetland restoration planning process to gain
familiarity with the rare species that may be present in the project area. The presence of locally
and regionally rare plant and animal species can often be obtained from the local conservation
authority. Similar to the two previous attributes, 1.2.1 and 1.2.2, this attribute is scored as per
the number of these species reported in the project area. The presence of locally, regionally,
and/or provincially significant plant and animal species EBI weights and scoring criteria for
existing and restored conditions are provided in table 1.2.3.
Table 1.2.3 Weights and Scoring Criteria for Presence of Locally, Regionally, and/or Provincially Significant Plant and Animal species
Existing Condition - Scoring Criteria Maximum Score – 20
Restored Condition - Scoring Criteria Maximum Score - 30
- zero points for no locally, regionally, and/or provincially significant plant or animal species within 120m of the effective project area
- 10 points for one locally, regionally, and/or provincially significant plant or animal species within 120 m of the effective project area
- 20 points for more than one locally, regionally, and/or provincially significant plant and/or animal species within 120 m of the effective project area
- Add zero points to existing condition score if the project is not anticipated to benefit a locally, regionally and/or provincially significant plant or animal species.
- Add 5 points to existing condition score if the project is anticipated to benefit one locally, regionally and/or provincially significant plant or animal species.
- Add 10 points to existing condition score if the project is anticipated to benefit more than one locally, regionally, and/or provincially significant plant and/or animal species.
Notes: - Local records to be used to validate presence/absence of significant species - Record must be no more than 20 years old to be considered valid - Where available, species at risk strategies or other documents are to be used to validate the likelihood that the
proposed project will have a benefit to any locally, regionally, and/or provincially significant species

Credit Valley Conservation
29
1.2.4 Attribute: Nesting and Feeding Habitat for Colonial Waterbirds
Colonial waterbirds indicate a special type of secondary and tertiary productivity. The nesting of
these birds is localized but it is of special interest to many people and the colonies are quite
vulnerable to destruction. Some wetland areas, while not used for nesting, are regularly used as
feeding areas by the members of a nearby colony. Colonial wetland-dependent nesting birds
that can be scored under this section are: Red-necked Grebe, Black-crowned Night Heron,
Great Egret, Black Tern, Caspian Tern, Common Tern, and Great Blue Heron. The Great Blue
Heron is scored only for nesting occurrences because they can be found feeding in nearly all
wetlands in southern Ontario (OWES, 2013). The nesting and feeding habitat for colonial
waterbirds EBI weights and scoring criteria for existing and restored conditions are provided in
table 1.2.4.
Table 1.2.4 Weights and Scoring Criteria for Nesting and Feeding Habitat for Colonial Waterbirds
Existing Condition - Scoring Criteria Maximum Score – 10
Restored Condition - Scoring Criteria Maximum Score -15
- Zero points for not known or not possible (i.e. no open water) to have fed or nested
- 4 points for active feeding area (except great blue heron)
- 7 points for known to have nested within the past 5 years
- 10 points for currently nesting colony
- Add zero points to existing condition score for no improved benefit to nesting and feeding habitat for colonial waterbirds as a result of the wetland restoration project
- Add 5 points to existing condition score for improvement to the nesting and/or feeding habitat for colonial waterbirds as a result of the wetland restoration project
Notes: - Only the following wetland dependent colonial waterbirds are eligible to be scored: red-necked grebe, black-
crowned night heron, great egret, black tern, caspian tern, common tern and great blue heron (scored for nesting only).
- Local records to be used to validate feeding/nesting of colonial waterbirds.. - Record must be no more than 20 years old to be considered valid. - Where available, documents are to be used to validate the likelihood that the proposed project will have a
benefit to colonial waterbirds.

Credit Valley Conservation
30
1.2.5 Attribute: Waterfowl Breeding, Staging and/or Moulting Area In the case of waterfowl, staging and moulting areas are also important in addition to breeding
areas. A ‘staging area’ is an area where birds that migrate in flocks rest and feed either
immediately before or during migration. A ‘moulting area’ is an area that waterfowl use to shed
old feathers. These areas are important because during this period waterfowl are often unable
to fly and are susceptible to predation. The scoring mechanism for this attribute is based on the
scale of significance (i.e. local, watershed or provincially significant). The waterfowl breeding,
staging and/or moulting area EBI weights and scoring criteria for existing and restored
conditions are provided in table 1.2.5. .
Table 1.2.5 Weights and Scoring Criteria for Waterfowl Breeding, Staging, and/or Moulting Area
Existing Condition - Scoring Criteria Maximum Score -10
Restored Condition - Scoring Criteria Maximum Score - 15
- Zero points for no evidence of waterfowl breeding, staging and/or moulting or no wetland currently exists
- 2 points for evidence of waterfowl breeding, staging and/or moulting at any scale
- 4 points for evidence of waterfowl breeding, staging and/or moulting to a scale that would be considered locally significant
- 7 points for evidence of waterfowl breeding, staging and/or moulting to a scale that would be considered watershed significant
- 10 points for evidence of waterfowl breeding, staging and/or moulting to a scale that would be considered provincially significant
- Add zero points to existing condition score for no increase in wetland area
- Add 2 points to existing condition score for an increase in wetland area of up to 0.5 hectares
- Add 3 points to existing condition score for an increase in wetland area of more than 0.5 hectares but less than 2 hectares
- Add 5 points to existing condition score for an increase in wetland area greater than or equal to 2 hectares.
Notes: - Local records to be used to validate significance of waterfowl breeding, staging and/or moulting area - Record must be no more than 20 years old to be considered valid - Geese are not considered an eligible species of waterfowl to score. Wetland restoration designs intended to
benefit geese are not encouraged.

Credit Valley Conservation
31
1.2.6 Attribute: Migratory Passerine, Shorebird, or Raptor Stopover Area All wetlands have some significance as migratory bird stopover areas and a few, such as certain
wetlands along the north shores of Lakes Erie and Ontario in particular, are places where
passerines and/or shorebirds in great numbers stop to rest and feed for short periods during
migration. The scoring mechanism for this attribute is based on the scale of significance (i.e.
local, watershed, provincially significant). The migratory passerine, shorebird, or raptor stopover
area EBI weights and scoring criteria for existing and restored conditions are provided in table
1.2.6.
Table 1.2.6 Weights and Scoring Criteria for Migratory Passerine, Shorebird, or Raptor Stopover Area
Existing Condition - Scoring Criteria Maximum Score – 10
Restored Condition - Scoring Criteria Maximum Score - 15
- Zero points for no evidence of existing wetland being used for stopover habitat by migratory passerine, shorebird, or raptors or no wetland currently exists
- 2 points for evidence of migratory passerine, shorebird or raptors utilizing the existing wetland for stopover habitat at any scale
- 4 points for evidence of migratory passerine, shorebird or raptors utilizing the existing wetland for stopover habitat to a scale that would be considered locally significant
- 7 points for evidence of migratory passerine, shorebird or raptors utilizing the existing wetland for stopover habitat to a scale that would be considered watershed significant
- 10 points for evidence of migratory passerine, shorebird or raptors utilizing the existing wetland for stopover habitat to a scale that would be considered provincially significant
- Add zero points to existing condition score for no increase in wetland area
- Add 2 points to exiting condition score for an increase in wetland area of up to 0.5 hectares
- Add 3 points to existing condition score for an increase in wetland area of more than 0.5 hectares but less than 2 hectares
- Add 5 points to existing condition score for an increase in wetland area greater than or equal to 2 hectares
Notes: - Local records to be used to validate significance of migratory passerine, shorebird, or raptor stopover area - Record must be no more than 20 years old to be considered valid

Credit Valley Conservation
32
1.2.7 Attribute: Fish Habitat As per the Fisheries Act, fish habitat includes spawning grounds, nursery, rearing, food supply
and migration areas on which fish depend directly or indirectly on in order to carry out their life
processes. Wetland fish habitat is usually found in marsh and swamp wetland types, although
fens have also been documented as providing spawning habitat in some instances. The area
and quality of fish habitat can vary considerably from a small area in an isolated wetland that
supports one or two species, to a large wetland that supports a great diversity of fish species.
The EBI scores the quality of fish habitat based on the habitat duration (i.e. seasonal or
permanent) and whether or not piscivores (fish that eat other fish) are present. The fish habitat
EBI weights and scoring criteria for existing and restored conditions are provided in table 1.2.7.
Table 1.2.7 Weights and Scoring Criteria for Fish Habitat Existing Condition - Scoring Criteria Maximum Score – 20
Restored Condition – Scoring Criteria Maximum Score - 20
- Zero points for no existing fish habitat - Fractional Area of wetland feature x 3 points for
seasonal habitat without piscivores - Fractional Area of wetland feature x 8 points for
seasonal habitat with piscivores - Fractional Area of wetland feature x 15 points for
permanent habitat without piscivores - Fractional Area of wetland feature x 20 points for
permanent habitat with piscivores
- Fractional Area of wetland feature x 3 point for seasonal habitat predicted to not have piscivores
- Fractional Area of wetland feature x 8 points for seasonal habitat predicted to have piscivores
- Fractional Area of wetland feature x 15 points for permanent habitat predicted to not have piscivores
- Fractional Area of wetland feature x 20 points for permanent habitat predicted to have piscivores
Notes: - The Fractional Area (FA) of all wetlands must equal 1, regardless of whether or not there are multiple wetland
types present - Scores must be recorded as whole numbers. If necessary, use standard rounding rules to calculate final score
(i.e. 7.5 is recorded as 8 and 7.4 is recorded as 7). - When calculating FA only include the area up to the high water mark - Record must be no more than 20 years old to be considered valid - Piscivores: fish that eat other fish - Fish stocking is not regarded as a wetland restoration activity

Credit Valley Conservation
33
2.0 Component: Hydrological The hydrological component captures the role wetlands plays in the maintenance, control,
and/or modification of the quantity and quality of water passing through a drainage basin. The
hydrological component is designed to determine the net hydrological benefit provided by a
specific wetland to the portion of the basin downstream of the wetland.
To assess the hydrological function of a wetland, it must be evaluated relative to its role in the
drainage basin where it is located and the hydrological setting in that specific drainage basin.
The component has two sub-components; each component and associated attributes are
described in detail below.
2.1 Sub-Component: Flood Attenuation and Ground Water Recharge/Discharge 2.1.1 Attribute: Flood Attenuation Capacity Flood protection for areas downstream of wetlands is an important ecological service provided
by wetlands. Wetlands reduce storm floods by temporarily holding back water and by allowing a
space for surface water to seep into the ground where it may recharge groundwater supplies
and/or be transpired by vegetation. This water would otherwise flow quickly downstream and in
some instances causing flooding. This attribute is scored on the potential flood water generation
of the catchment upstream of the wetland and the flood water retention capacity of the wetland.
The flood attenuation capacity EBI weights and scoring criteria for existing and restored
conditions are provided in table 2.1.1.
Table 2.1.1 Weights and Scoring Criteria for Flood Attenuation Capacity Existing Condition - Scoring Criteria Maximum Score – 75
Restored Condition - Scoring Criteria Maximum Score – 75
Step #1: Determine flood volume generated by upstream catchment area under a 5, 10, 25, 50 and 100 year design storm–return period. Volume= Area (ha) x Runoff Coefficient (dimensionless) x Rainfall Amount (mm) Where: - Area = catchment area upstream of proposed
project site. Note: the use of GIS mapping programs facilitates this process.
- Runoff Coefficient= 0-1 rating depending on extent of imperviousness of upstream catchment area. See Appendix 2 for a table and description on how to calculate this value.
- Rainfall Amount= a fixed amount of rainfall expected for specific design storm events. These rainfall
Step #1: Determine flood volume generated by upstream catchment area under a 5, 10, 25, 50 and 100 year design storm–return period. Volume= Area (ha) x Runoff Coefficient (dimensionless) x Rainfall Amount (mm) Where: - Area = catchment area upstream of proposed
project site. Note: the use of GIS mapping programs facilitates this process.
- Runoff Coefficient= 0-1 rating depending on extent of imperviousness of upstream catchment area. See Appendix 2 for a table and description on how to calculate this value.
- Rainfall Amount= a fixed amount of rainfall expected for specific design storm events. These

Credit Valley Conservation
34
amounts are determined utilizing the Ministry of Transportation of Ontario (MTO) online tool found here: http://www.mto.gov.on.ca/IDF_Curves/terms.shtml Note: copy the rainfall amount values found in Row A of the MTO online tool and place them under the corresponding design storm–return period in the table below:
Design Storm – Return Period
5 year
10 year
25 year
50 year
100 year
Rainfall Amount
Step #2: Calculate the maximum available flood volume storage of the existing wetland (if one exists). Volume = (a1+a2/2) x H Where: Volume= total potential wetland flood water storage a1= area of wetland base a2= area of wetland high water mark H = depth of water when at high water boundary of wetland Step #3: Score wetland flood attenuation capacity Compare Volumes calculated in Step #1 to the Volume calculated in Step #2 to determine the design storm flood attenuation capacity of the existing wetland. Note: the design storm flood attenuation capacity is the greatest design storm where the Volume calculated in Step #2 (wetland storage) is greater than the Volume calculated in Step #1 (runoff generated). If the wetland storage volume is less than the runoff amount generated at a specific design storm, the wetland is unable to attenuate all of these flows.
Design Storm – Return Period
2-5 year
10 year
25 year
50 year
100 year
Total
15 points
15 points
15 points
15 points
15 points
75 points
rainfall amounts are determined utilizing the Ministry of Transportation of Ontario (MTO) online tool found here: http://www.mto.gov.on.ca/IDF_Curves/terms.shtml Note: copy the rainfall amount values found in Row A of the MTO online tool and place them under the corresponding design storm–return period in the table below:
Design Storm – Return Period
5 year
10 year
25 year
50 year
100 year
Rainfall Amount
Step #2: Calculate the maximum available flood volume storage of the proposed wetland. Volume = (a1+a2/2) x H Where: Volume= total potential wetland flood water storage a1= area of wetland base a2= area of wetland high water mark H = depth of water when at high water boundary of wetland Step #3: Score wetland flood attenuation capacity Compare Volumes calculated in Step #1 to the Volume calculated in Step #2 to determine the design storm flood attenuation capacity of the proposed wetland. Note: the design storm flood attenuation capacity is the greatest design storm where the Volume calculated in Step #2 (wetland storage) is greater than the Volume calculated in Step #1 (runoff generated). If the wetland storage volume is less than the runoff amount generated at a specific design storm, the wetland is unable to attenuate all of these flows.
Design Storm – Return Period
2-5 year
10 year
25 year
50 year
100 year
Total
15 points
15 points
15 points
15 points
15 points
75 points
Notes: - This calculation assumes that the wetland is storing no water at the time of a runoff event and is therefore
based on maximum potential flood water attenuation. - Example Calculation: If a wetland has a storage capacity of up to the 50 year design storm event the score for
this wetland would be 60 points (i.e. 15+15+15+15 points).

Credit Valley Conservation
35
2.1.2 Attribute: Groundwater Discharge Groundwater discharging into a wetland is typically nutrient and mineral rich allowing for the
development of locally unique ecosystems and improvements to overall biodiversity. The
ecological consequences of such discharge are reflected in the attributes of the biological
component. In the hydrology component, the water quality and quantity improvement as a result
of groundwater discharge is captured. Generally, it is assumed that the groundwater which
emerges in a wetland is of better quality as compared to if the wetland was not present due to
the filtering effects of wetland soils, flora and microorganisms. Groundwater discharge wetlands
are valuable during dry periods when there is little surface runoff occurring. Discharging
wetlands maintain base flows in receiving watercourses long-after surface runoff ceases. The
accurate measurement of ground water discharge contributions is complex, and therefore
similar to OWES (2013), a number of wetland characteristics are used as groundwater
discharge indicators in an effort to score the value of this attribute. The ground water discharge
EBI weights and scoring criteria for existing and restored conditions are provided in table 2.1.2.
For further explanation of the wetland characteristics, please refer to OWES (2013).
Table 2.1.2 Weights and Scoring Criteria for Groundwater Discharge Existing Condition - Scoring Criteria Maximum Score – 25
Restored Condition - Scoring Criteria Maximum Score - 25
Wetland Characteristic
None to Little
Some High
Dominant Wetland Type
Bog = 0 Swamp/Marsh = 2
Fen = 5
Topography Flat/rolling = 0
Hilly = 2 Steep = 5
Wetland area: upslope catchment area
Large (>50%) =0
Moderate (5-50%) = 2
Small (<5%) = 5
Lagg development
None = 0 Minor = 2 Extensive = 5
Seeps None = 0 Seasonal = 2 Permanent = 5
Surface marl deposits
None = 0 Present = 5
Iron precipitates
None = 0 Present = 5
Wetland Characteristic
None to Little Some High
Dominant Wetland Type
Bog = 0 Swamp/Marsh = 2
Fen = 5
Topography Flat/rolling = 0 Hilly = 2 Steep = 5 Wetland area: upslope catchment area
Large (>50%) =0
Moderate (5-50%) = 2
Small (<5%) = 5
Lagg development
None expected= 0
Minor Lagg expected = 2
Extensive Lagg expected = 5
Seeps No additional seeps expected = 0
Additional seeps expected = 5
Note: - Score to a maximum of 25 points

Credit Valley Conservation
36
2.1.3 Attribute: Groundwater Recharge The ability of a wetland to recharge groundwater depends on characteristics of the wetland as
well as the surrounding topography and geologic conditions. To provide significant groundwater
recharge, a wetland requires a reasonably constant source of water such as a flowing
watercourse or surrounding sloping land and the wetland must be located on permeable soils
and/or fractured bedrock. Similar to the groundwater discharge function, the measurement of
groundwater recharge is complex. However, certain observations can help in understanding and
scoring recharge function.
Many cities, towns and private property owners rely on groundwater for domestic use. Without
groundwater recharge areas, drinking water quality and quantity would be threatened.
Furthermore, groundwater often maintains base flows in watercourses during the dry season, as
described in the groundwater discharge section of this report. Therefore, without groundwater
recharge, groundwater discharge and subsequently surface water flows are likely to diminish
during dry periods. Headwater wetlands (ones located high in drainage basins) have the highest
value for groundwater recharge. The EBI utilizes scoring criteria based upon site type and soils.
The groundwater recharge EBI weights and scoring criteria for existing and restored conditions
are provided in table 2.1.3.
Table 2.1.3 Weights and Scoring Criteria for Groundwater Recharge Existing Condition - Scoring Criteria Maximum Score – 25
Restored Condition - Scoring Criteria Maximum Score - 25
If wetland is located within a municipal well head protection zone the wetland automatically scores 25. There is no need to calculate scores below. Wetland Site Type:
- Zero points for wetlands greater than 50% lacustrine (by area) or located on a major river
- Fractional Area of isolated or palustrine wetland X 20 =
- Fractional Area of riverine wetland X 8 = - Fraction Area of lacustrine wetland (not dominant
site type) x 0 = Sum the three fractional area’s if the site type is less than 50% lacustrine and add this to the Soil Recharge Potential found below: Soil Recharge Potential:
Dominant Wetland Site Type
Sands, gravels, loams
Clays, substrates in high water tables or shallow substrates over
If wetland is located within a municipal well head protection zone the wetland automatically scores 25. There is no need to calculate scores below. Wetland Site Type:
- Zero points for wetlands greater than 50% lacustrine (by area) or located on a major river
- Fractional Area of isolated or palustrine wetland X 20 =
- Fractional Area of riverine wetland X 8 = - Fraction Area of lacustrine wetland (not
dominant site type) x 0 = Sum the three fractional area’s if the site type is less than 50% lacustrine and add this to the Soil Recharge Potential found below: Soil Recharge Potential:
Dominant Wetland Site Type
Sands, gravels, loams
Clays, substrates in high water tables or shallow substrates over

Credit Valley Conservation
37
impervious materials such as consolidated bedrock
Lacustrine or major river
0 0
Isolated 5 3 Palustrine 4 2 Riverine 2 1
impervious materials such as consolidated bedrock
Lacustrine or major river
0 0
Isolated 5 3 Palustrine 4 2 Riverine 2 1
Notes: - Major Rivers include: St. Clair, Detroit, Niagara, St. Lawrence, Ottawa - For the Soil Recharge Potential Table, circle the number that best represents the project site - Maximum total score =25 points
Credit Valley Conservation
38
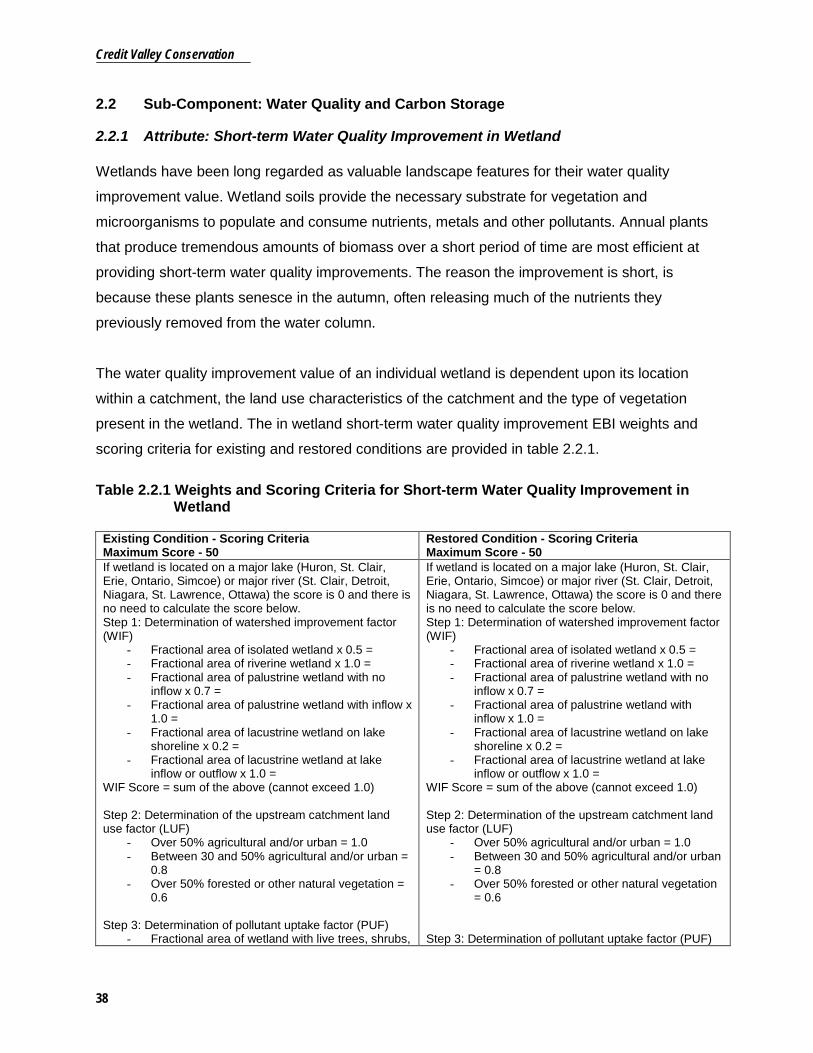
2.2 Sub-Component: Water Quality and Carbon Storage 2.2.1 Attribute: Short-term Water Quality Improvement in Wetland Wetlands have been long regarded as valuable landscape features for their water quality
improvement value. Wetland soils provide the necessary substrate for vegetation and
microorganisms to populate and consume nutrients, metals and other pollutants. Annual plants
that produce tremendous amounts of biomass over a short period of time are most efficient at
providing short-term water quality improvements. The reason the improvement is short, is
because these plants senesce in the autumn, often releasing much of the nutrients they
previously removed from the water column.
The water quality improvement value of an individual wetland is dependent upon its location
within a catchment, the land use characteristics of the catchment and the type of vegetation
present in the wetland. The in wetland short-term water quality improvement EBI weights and
scoring criteria for existing and restored conditions are provided in table 2.2.1.
Table 2.2.1 Weights and Scoring Criteria for Short-term Water Quality Improvement in Wetland
Existing Condition - Scoring Criteria Maximum Score - 50
Restored Condition - Scoring Criteria Maximum Score - 50
If wetland is located on a major lake (Huron, St. Clair, Erie, Ontario, Simcoe) or major river (St. Clair, Detroit, Niagara, St. Lawrence, Ottawa) the score is 0 and there is no need to calculate the score below. Step 1: Determination of watershed improvement factor (WIF)
- Fractional area of isolated wetland x 0.5 = - Fractional area of riverine wetland x 1.0 = - Fractional area of palustrine wetland with no
inflow x 0.7 = - Fractional area of palustrine wetland with inflow x
1.0 = - Fractional area of lacustrine wetland on lake
shoreline x 0.2 = - Fractional area of lacustrine wetland at lake
inflow or outflow x 1.0 = WIF Score = sum of the above (cannot exceed 1.0) Step 2: Determination of the upstream catchment land use factor (LUF)
- Over 50% agricultural and/or urban = 1.0 - Between 30 and 50% agricultural and/or urban =
0.8 - Over 50% forested or other natural vegetation =
0.6
Step 3: Determination of pollutant uptake factor (PUF) - Fractional area of wetland with live trees, shrubs,
If wetland is located on a major lake (Huron, St. Clair, Erie, Ontario, Simcoe) or major river (St. Clair, Detroit, Niagara, St. Lawrence, Ottawa) the score is 0 and there is no need to calculate the score below. Step 1: Determination of watershed improvement factor (WIF)
- Fractional area of isolated wetland x 0.5 = - Fractional area of riverine wetland x 1.0 = - Fractional area of palustrine wetland with no
inflow x 0.7 = - Fractional area of palustrine wetland with
inflow x 1.0 = - Fractional area of lacustrine wetland on lake
shoreline x 0.2 = - Fractional area of lacustrine wetland at lake
inflow or outflow x 1.0 = WIF Score = sum of the above (cannot exceed 1.0) Step 2: Determination of the upstream catchment land use factor (LUF)
- Over 50% agricultural and/or urban = 1.0 - Between 30 and 50% agricultural and/or urban
= 0.8 - Over 50% forested or other natural vegetation
= 0.6
Step 3: Determination of pollutant uptake factor (PUF)

Credit Valley Conservation
39
herbs or mosses x 0.75 = - Fractional area of wetland with emergent,
subemergent or floating vegetation x 1.0 = - Fractional area of wetland with little or no
vegetation x 0.5 = PUF Score = sum of the above (cannot exceed 1.0) Step 4: Calculation of final score
- 50 x WIF x LUF x PUF
- Fractional area of wetland with live trees, shrubs, herbs or mosses x 0.75 =
- Fractional area of wetland with emergent, subemergent or floating vegetation x 1.0 =
- Fractional area of wetland with little or no vegetation x 0.5 =
PUF Score = sum of the above (cannot exceed 1.0) Step 4: Calculation of final score
- 50 x WIF x LUF x PUF

Credit Valley Conservation
40
2.2.2 Attribute: Short-term Water Quality Improvement in Upland Buffer
Wetlands have the ability to improve downstream water quality as described in Section 2.2.1.
However, the ability of the wetland to improve water quality depends upon the condition of the
surrounding upland buffer. For instance, a wetland surrounded by steeply sloping, bare lands
with visible signs of erosion gullying will deposit significant amounts of sediment in the wetland,
potentially limiting vegetation growth, storage capacity and the water quality improvement
function of the wetland. Upland buffer areas that are well vegetated, wide and encourage
infiltration remove many water quality contaminants before the water enters the wetland.
The location of the wetland within the catchment area, the land use activities adjacent the
wetland buffer, the vegetation composition of the buffer, the soil type and buffer width and
steepness all factor into a buffers ability to improve short-term water quality. The short-term
water quality improvement in the upland buffer EBI weights and scoring criteria for existing and
restored conditions are provided in table 2.2.2.
Table 2.2.2 Weights and Scoring Criteria for Short-term Water Quality Improvement in Upland Buffer
Existing Conditions - Scoring Criteria Maximum Score - 50
Restored Conditions - Scoring Criteria Maximum Score - 50
If buffer is greater than or equal to 50m wide, 50 points are scored and there is no need to complete the calculations below. If no buffer currently exists, 0 points are scored and there is no need to complete the calculations below. Step 1: Determination of watershed improvement factor (WIF)
- Fractional area of isolated wetland x 0.5 = - Fractional area of riverine wetland x 0.8 = - Fractional area of palustrine wetland with no
inflow x 0.7 = - Fractional area of palustrine wetland with inflow x
1.0 = - Fractional area of lacustrine on lake shoreline (all
but Major Lakes) x 0.5 = - Fractional area of lacustrine on lake shoreline
(Major Lakes) x 0.2 WIF Score = sum of the above (cannot exceed 1.0) Step 2: Determination of adjacent land use factor (LUF)
- Over 50% agricultural and/or urban = 1.0 - Between 30 and 50% agricultural and/or urban =
0.6 - Over 50% forested or other natural vegetation =
0.4 Step 3: Determination of pollutant uptake factor (PUF)
If buffer is already or proposed to be greater than or equal to 50m wide, 50 points are scored and there is no need to complete the calculations below. If no buffer is proposed a score of 0 points is awarded and there is no need to complete the calculations below. Step 1: Determination of watershed improvement factor (WIF)
- Fractional area of isolated wetland x 0.5 = - Fractional area of riverine wetland x 0.8 = - Fractional area of palustrine wetland with no
inflow x 0.7 = - Fractional area of palustrine wetland with
inflow x 1.0 = - Fractional area of lacustrine on lake shoreline
(all but Major Lakes) x 0.5 = - Fractional area of lacustrine on lake shoreline
(Major Lakes) x 0.2 WIF Score = sum of the above (cannot exceed 1.0) Step 2: Determination of adjacent land use factor (LUF)
- Over 50% agricultural and/or urban = 1.0 - Between 30 and 50% agricultural and/or urban
= 0.6 - Over 50% forested or other natural vegetation
= 0.4 Step 3: Determination of pollutant uptake factor (PUF)
- Simple species buffer containing only trees, or

Credit Valley Conservation
41
- Simple species buffer containing only trees, or shrubs or grasses/forbs = 0.3.
- Complex species buffer containing trees, shrubs and grasses/forbs = 1.0.
Step 4: Determination of percent of boundary buffered factor (POBB).
- 100% of the wetland boundary on the subject property is buffered = 1.0.
- 50-99% of the wetland boundary on the subject property is buffered = 0.5.
- <50% of the wetland boundary on the subject property is buffered = 0.2
Step 5: Determination of the width factor (WF).
- 15m to less than 50 m wide = 1.0 - 10m to less than 15 m wide = 0.8 - 5m to less than10 m wide = 0.6 - Less than 5 m wide = 0.4
Step 6: Determination of steepness factor (SF)
- Less than 5% = 1.0 - 5% to less than 10% = 0.8 - 10% to less than 15% = 0.6 - Greater than 15% = 0.4
Step 7: Determination of soil texture factor (STF)
- Sand = 1.0 - Loam = 0.7 - Clay = 0.4
Step 8: Calculation of final score
- 50 x WIF x LUF x PUF x POBB x WF x SF x STF
shrubs or grasses/forbs = 0.3. - Complex species buffer containing trees,
shrubs and grasses/forbs = 1.0. Step 4: Determination of percent of boundary buffered factor (POBB).
- 100% of the wetland boundary on the subject property is buffered = 1.0.
- 50-99% of the wetland boundary on the subject property is buffered = 0.5.
- <50% of the wetland boundary on the subject property is buffered = 0.2
Step 5: Determination of the width factor (WF).
- 15m to less than 50 m wide = 1.0 - 10m to less than 15 m wide = 0.8 - 5m to less than10 m wide = 0.6 - Less than 5 m wide = 0.4
Step 6: Determination of steepness factor (SF)
- Less than 5% = 1.0 - 5% to less than 10% = 0.8 - 10% to less than 15% = 0.6 - Greater than 15% = 0.4
Step 7: Determination of soil texture factor (STF)
- Sand = 1.0 - Loam = 0.7 - Clay = 0.4
Step 8: Calculation of final score
- 50 x WIF x LUF x PUF x POBB x WF x SF x STF

Credit Valley Conservation
42
2.2.3 Attribute: Long-term Nutrient (Nitrogen/Phosphorus) Trap in Wetland
Wetlands have the ability to trap nutrients and other chemicals (in the long-term) found in the
water which flows through them. Many pollutants found in watercourses are bound to
suspended sediments. Water velocities slow when they enter wetlands, allowing for the
deposition of some of the sediment and associated pollutants. As this process continues newly
settled sediments bury older sediments and no longer can the sediment bound pollutants
interact with the water in the wetland and are therefore considered trapped in the long-term.
Generally, the location and physiographic features of the wetland determines how valuable it is
a long-term nutrient trap. Wetlands located in a river mouth and/or have permanent open water
and subsequently an ample accumulation of organic sediments are considered the most
valuable in terms of long-term water quality protection. The long-term nutrient trap in wetland
EBI weights and scoring criteria for existing and restored conditions are provided in table 2.2.3.
Table 2.2.3 Weights and Scoring Criteria for Long-term Nutrient (Nitrogen/Phosphorous) Trap in Wetland
Existing Condition - Scoring Criteria Maximum Score - 50
Restored Condition - Scoring Criteria Maximum Score - 50
- No wetland currently present = zero points - Wetland does not have permanent open water = 10
points - Wetland does have permanent open water = 20
points - Wetland is located in a river mouth = 50 points
- Add zero points to the existing condition score if the proposed wetland is not located in a river mouth and does not intend to have permanent open water or does not intend to add to the extent of permanent open water
- Add 20 points to the existing condition score if the proposed wetland is not located in a river mouth and does intend to add to the extent of the permanent open water.
- Wetland will be located in a river mouth = 50 points
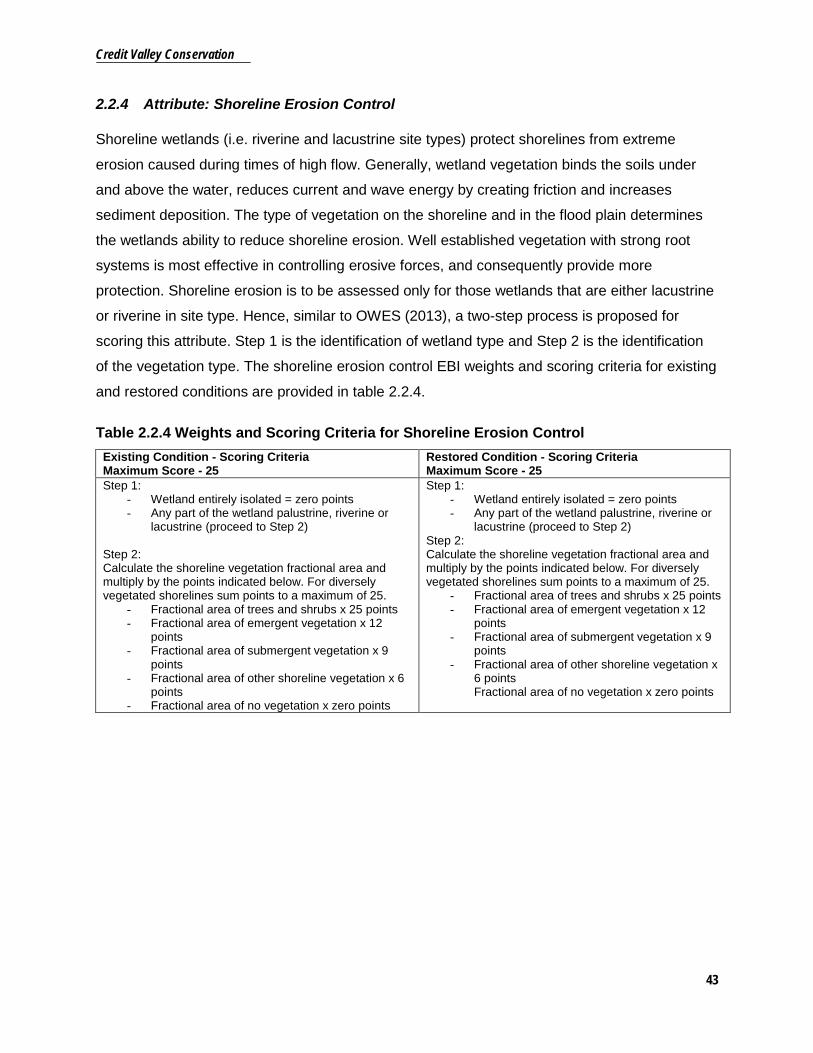
Credit Valley Conservation
43
2.2.4 Attribute: Shoreline Erosion Control Shoreline wetlands (i.e. riverine and lacustrine site types) protect shorelines from extreme
erosion caused during times of high flow. Generally, wetland vegetation binds the soils under
and above the water, reduces current and wave energy by creating friction and increases
sediment deposition. The type of vegetation on the shoreline and in the flood plain determines
the wetlands ability to reduce shoreline erosion. Well established vegetation with strong root
systems is most effective in controlling erosive forces, and consequently provide more
protection. Shoreline erosion is to be assessed only for those wetlands that are either lacustrine
or riverine in site type. Hence, similar to OWES (2013), a two-step process is proposed for
scoring this attribute. Step 1 is the identification of wetland type and Step 2 is the identification
of the vegetation type. The shoreline erosion control EBI weights and scoring criteria for existing
and restored conditions are provided in table 2.2.4.
Table 2.2.4 Weights and Scoring Criteria for Shoreline Erosion Control Existing Condition - Scoring Criteria Maximum Score - 25
Restored Condition - Scoring Criteria Maximum Score - 25
Step 1: - Wetland entirely isolated = zero points - Any part of the wetland palustrine, riverine or
lacustrine (proceed to Step 2) Step 2: Calculate the shoreline vegetation fractional area and multiply by the points indicated below. For diversely vegetated shorelines sum points to a maximum of 25.
- Fractional area of trees and shrubs x 25 points - Fractional area of emergent vegetation x 12
points - Fractional area of submergent vegetation x 9
points - Fractional area of other shoreline vegetation x 6
points - Fractional area of no vegetation x zero points
Step 1: - Wetland entirely isolated = zero points - Any part of the wetland palustrine, riverine or
lacustrine (proceed to Step 2) Step 2: Calculate the shoreline vegetation fractional area and multiply by the points indicated below. For diversely vegetated shorelines sum points to a maximum of 25.
- Fractional area of trees and shrubs x 25 points - Fractional area of emergent vegetation x 12
points - Fractional area of submergent vegetation x 9
points - Fractional area of other shoreline vegetation x
6 points Fractional area of no vegetation x zero points

Credit Valley Conservation
44
2.2.5 Attribute: Carbon Storage The long-term storage of carbon occurs within wetlands that are actively accumulating organic
sediments under saturated conditions. These sediments are accumulated through the growth
and death of wetland vegetation and through the settling of suspended sediments within the
wetland. Keeping carbon stored in the long-term is dependent on water levels in the wetland. If
water levels drop and the organic soils are exposed to oxygen, mineralization of the carbon
quickly occurs and as result, atmospheric carbon dioxide is produced. Because the long-term
storage of carbon is dependent on saturated conditions, this attribute is evaluated within the
hydrological component. The carbon storage EBI weights and scoring criteria for existing and
restored conditions are provided in table 2.2.5.
Table 2.2.5 Weights and Scoring Criteria for Carbon Storage Existing Condition - Scoring Criteria Maximum Score - 15
Restored Condition - Scoring Criteria Maximum Score - 25
- Wetland does not have permanent open water = 5 points
- Wetland does have permanent open water = 15 points
- Add zero points to the existing condition score if the proposed wetland does not intend to have permanent open water or does not intend to add to the extent of the existing permanent open water
- Add 10 points to the existing condition score if the proposed wetland does intend to add to the extent of the permanent open water

Credit Valley Conservation
45
3.0 Component: Social The social component of the EBI measures the value of the goods, recreation, aesthetics,
education/research and cultural and aboriginal benefits provided by wetlands. It is important to
note that the EBI is only intended to measure public benefits provided by the wetland and it is
not intended to value the benefits experienced directly by the landowner who is undertaking the
wetland restoration project. For example, if a property owner cuts firewood from the wetland for
personal use, this is not considered a public benefit. However, if firewood is cut from the
wetland and it is sold to the public, this would be considered a public benefit and therefore
eligible to receive points.
The social component differs from the biological and hydrological component when attempting
to assess the value of the wetlands existing condition. For the biological and hydrological
components, this exercise is practical because characteristics of the landscape provide the
necessary information to measure the existing condition. Measuring the existing condition for
many of the social component attributes is more challenging because it is not the measurement
of biophysical properties. Instead, statements from the wetland manager would have to be used.
Given that it is impossible to confirm these statements as accurate, it was decided by the
Steering Committee to assign an automatic score of zero to the existing conditions for all
attributes within the social component and only measure the restored condition. The one
exception to this is the landscape aesthetics attribute. This attribute is evaluated for both the
existing and restored condition.
This component is comprised of five sub-components each with one attribute. Within this
section, each attribute of the social component is described in detail.
3.1 Sub-Component: Goods 3.1.1 Attribute: Sustainable Use of the Wetland for Harvesting Goods Wetlands provide a variety of ecosystem goods such as fuelwood, fibre, meat/fish and timber.
Without practicing responsible resource management and harvesting best practices, the
wetlands’ ability to supply these goods in the long-term is threatened. Therefore, the wetland
restoration EBI only recognizes sustainable harvesting of goods as a public benefit. The
sustainable use of the wetland for harvesting goods EBI weights and scoring criteria for the
restored condition are provided in table 3.1.1.

Credit Valley Conservation
46
Table 3.1.1 Weights and Scoring Criteria for the Sustainable Use of the Wetland for Harvesting Goods
Existing Condition - Scoring Criteria Automatic Score – zero
Restored Condition - Scoring Criteria Maximum Score - 25
- Not applicable - Zero points for no harvesting of food, fuel and/or fibre or allow harvesting without ensuring best management practices are followed (i.e. do not have a Managed Forest Plan, do not use licensed hunters, anglers or trappers)
- 25 points for allowing the harvesting of food, fuel and/or fibre and ensure that best management practices are followed (i.e. fuel and fibre wood harvested in accordance with a Managed Forest Plan and licensed hunters, anglers and trappers utilized to harvest pelts)
Notes: - If the timber associated with the wetland is immature at the moment and the Managed Forest Plan does not call
for a thinning within the next 10 years award 25 points if the landowner intends to allow timber harvesting in subsequent Managed Forest Plan updates.
- If fish are harvested, points are to be scored here and not within the Recreation Sub-Component - Due to the devastating impacts to wetland quality, peat extraction is not recognized as a public good scored in
this tool

Credit Valley Conservation
47
3.2 Sub-Component: Recreation 3.2.1 Attribute: Sustainable Use of the Wetland for Recreation Wetlands may be used for a variety of recreational activities including: catch and release fishing,
hiking, bird watching and nature enjoyment.
Currently, many researchers are working in the area of “EcoHealth” to better define the
correlation between outdoor recreation and personal health and well-being, and although much
work is to be completed in this field, it is agreed that there are positive public benefits
associated with natural space recreation. Hence, sustainable use of wetlands for recreational
activities is included as part of the EBI. EBI weights and scoring criteria for the restored
condition are provided in table 3.2.1.
Table 3.2.1 Weights and Scoring Criteria for Recreational Activities Existing Condition - Scoring Criteria Automatic Score – zero
Restored Condition - Scoring Criteria Maximum Score - 25
- Not applicable - Zero points for no public allowance - 10 points for public allowance on an infrequent
situation by situation (daily) basis - 20 points for public allowance on a more frequent
(long-standing) informal basis - 25 points for year round formalized access (i.e.
Bruce Trail crosses the property) Notes: - Example recreation activities eligible for points include: catch and release fishing, hiking, bird watching and nature
enjoyment - If angling is catch and release only, points are to be scored here and not within the Goods Sub-Component

Credit Valley Conservation
48
3.3 Sub-Component: Aesthetics 3.3.1 Attribute: Landscape Aesthetics The rural countryside and its forests, farm fields, rivers, meadows and wetlands provide a
variety of beautiful sights, valued by photographers, painters, residents and tourists. Natural
spaces, including wetlands, have the ability to bring joy into the lives of those who are able to
view them. Aesthetic appreciation of a wetland often relates to the qualities of openness,
diversity and uniqueness. Not only does the wetland have to be within visible range of the
public, it must also be distinct from its surroundings in order to be valued for its aesthetic quality.
The landscape aesthetics EBI weights and scoring criteria for the existing and restored
condition are provided in table 3.3.1.
Table 3.3.1 Weights and Scoring Criteria for Landscape Aesthetics Existing Condition - Scoring Criteria Maximum Score – 25
Restored Conditions – Scoring Criteria Maximum Score - 25
- Zero points for wetland greater than or equal to 120m from a public road/trail/navigable waterway or neighbouring property and wetland is not distinctly recognizable on the landscape
- 10 points for wetland greater than or equal to 120m from a public road/trail/navigable waterway or neighbouring property and wetland is distinctly recognizable on the landscape
- 20 points for wetland less than 120m from a public road/trail/navigable waterway or neighbouring property
- 25 points for wetland that is immediately adjacent a public road/trail/navigable waterway or neighbouring property

Credit Valley Conservation
49
3.4 Sub-Component: Education and Research 3.4.1 Attribute: Use of the Wetland for Education and/or Research Activities Wetlands may be used by school groups for educational exercises and/or observations or by
researchers to advance our knowledge of the natural and human sciences. Wetland-owners that
provide access to their lands for educational and research purposes are providing a public
benefit. The use of the wetland for education and Research activities EBI weights and scoring
criteria for the restored condition are provided in table 3.4.1.
Table 3.4.1 Weights and Scoring Criteria for Education and Research Activities Existing Condition - Scoring Criteria Automatic Score – zero
Restored Conditions - Scoring Criteria Maximum Score - 25
- Not applicable - Zero points for no public allowance - 10 points for minimal public allowance on an
infrequent situation by situation (daily) basis - 20 points for public allowance on a more frequent
(ongoing) basis - 25 points for public allowance on a more frequent
(ongoing) basis and landowner is willing to participate in education and research activities

Credit Valley Conservation
50
3.5 Sub-Component: Cultural and Aboriginal values 3.5.1 Attribute: Enhancement to the Historical, Religious and/or Spiritual Values of the
Wetland Many wetlands have cultural significance. Cultural values may stem from a noteworthy historic
event that transpired in or at the edge of a wetland or because there is evidence of physical
change brought about by humans. These values may include archaeological sites, historic trails
or portages, log chutes, burial sites, and historic fishing ports (OWES, 2013). Wetland
restoration projects that include enhancement to the historical, religious, and/or spiritual values
of the wetland are eligible activities to score points. The EBI weights and scoring criteria for the
restored condition of this attribute are provided in table 3.5.1.
Table 3.5.1 Weights and Scoring Criteria for Historical, Religious, and Spiritual Values Existing Condition - Scoring Criteria Automatic Score – zero
Restored Condition - Scoring Criteria Maximum Score - 25
- Not applicable - Zero points for no enhancements to the historical, national, religious or spiritual value of the wetland
- 25 points for a documented enhancement to the historical, national, religious or spiritual value of the wetland
Notes: - Applicants are encouraged to contact local First Nations and historical societies to determine site significance - Example activities eligible for points include: interpretive signage (e.g. sign informing visitors of a historic trade
route through the wetland or preservation of a historical dam), public use of the wetland for religious ceremonies, or presence of sacred sites or use of the wetland for song, chant and/or stories

Credit Valley Conservation
51
3.3 WEIGHTING OF ATTRIBUTES As previously stated, the maximum score for each attribute suggests the importance of that
attribute relative to other attributes in the EBI. For instance, flood attenuation has a maximum
score of 75 points, whereas groundwater discharge has a maximum score of 25 points.
Therefore, the EBI weights the value of wetlands for flood attenuation services three times
higher than that of groundwater discharge services. The maximum score for each attribute, and
therefore weight can be reviewed and if necessary modified by the conservation practitioner to
meet local conditions and priorities.
The total maximum points awarded in the EBI are 544 and 733 for the existing and restored
conditions, respectively. To calculate the final EBI score, two values are considered; the existing
conditions total score and change in condition total score (i.e. restored condition score minus
existing condition score).
The Steering Committee conducted a sensitivity analysis utilizing a variety of different weighting
proportions for the existing and the change in conditions scores and determined that a weighing
of 0.55 for the existing condition and 0.45 for the change in condition produced the most
desirable EBI results. Proposed projects that would result in significant wetland restoration
improvements to sites of already fair quality would score best and conversely projects proposing
poor restoration projects, regardless of the existing wetland state would score poorly. Similar to
the attribute scores, conservation practitioners must review the existing condition and the
change in condition weights and adjust them to meet local conditions and priorities when
necessary.
To calculate the final EBI score the weighted existing conditions score and the weighted change
in conditions scores are summed. To observe how the existing and change in condition scores
are weighted and how the final EBI score is calculated, refer to the Wetland Restoration EBI
Calculator found here: http://www.creditvalleyca.ca/watershed-science/our-
watershed/ecological-goods-services/

Credit Valley Conservation
52
3.4 CLIMATE MITIGATION AND POLLUTION REDUCTION SCORES Climate change is regarded as the most significant ecological stressor facing the planet. A
rapidly changing climate disrupts physical processes which in turn affect all biological
processes. All species of flora and fauna are likely to struggle with adapting to the changing
climate and it is possible that many may not succeed. The restoration of wetlands assists with
the mitigation of and adaptation to climate change by sequestering and storing carbon, reducing
the likelihood of floods, maintaining base flows in watercourses and ensuring aquifers are
supplied with groundwater. Because climate change mitigation and adaptation is of extreme
significance, the EBI includes a climate mitigation score. The maximum possible score for
climate mitigation is 175 and this is simply the sum of the change in condition scores for the
carbon sequestration, flood attenuation, groundwater discharge, groundwater recharge and
carbon storage attributes.
Similar to climate change, pollution of our air and water is a widespread issue of concern.
Intensive land use activities such as urbanization, agricultural production, golf course operations
and aggregate extraction alter the natural processes that connect land, water and air and as a
result, air and water quality is often impaired. The restoration of wetlands improves air and
water quality by reducing, capturing and/or treating many contaminants of concern. To account
for this, the EBI includes a pollution reduction score. The maximum possible score is 225 and is
simply the sum of the change in condition scores for the carbon sequestration, short-term water
quality improvement in the wetland and in the buffer, long-term nutrient trap, shoreline erosion
control protection and carbon storage.
These two scores cannot be utilized as the primary scores to evaluate the value of a proposed
wetland restoration project. Doing so would neglect the value provided by the other biological,
hydrological and social attributes not accounted for in these scores. Hence, it is recommended
that the climate change and/or pollution reduction scores be utilized for information purposes or
potentially as a tie-breaking measure when two proposed wetland restoration projects happen to
achieve the same total EBI score.

Credit Valley Conservation
53
4.0 ENVIRONMENTAL BENEFIT INDEX CALCULATOR The Wetland Restoration EBI Calculator was developed to facilitate the computation of the final
EBI score and climate mitigation and pollution reduction scores. As previously mentioned,
conservation practitioners may wish to alter the maximum scores and weights so that the EBI is
appropriate for their geographic location and/or to meet local priorities. Because of this
necessary program flexibility, Microsoft Excel was used as the platform for developing the EBI
Calculator Tool. An additional benefit of using Microsoft Excel is that it is a widely available
program and many conservation practitioners are familiar with using the program.
The EBI and associated Calculator Tool allows conservation practitioners that are engaged in
wetland restoration incentive programming to make two determinations: i) which projects to fund
based on the biological, hydrological and social benefits provided by the restored wetland, and;
ii) which projects to fund based on the cost-to-benefit ratio of each proposed project. The EBI
can be adapted for use within a variety of incentive program designs. Conservation practitioners
are encouraged to investigate multiple incentive program designs before committing to a
specific design. In addition, care should be taken when considering how to use the EBI as the
benefits evaluation tool and funding decision tool within the chosen incentive program design.
Follow the steps below to begin using the Wetland Restoration EBI Calculator:
Determination of Quality Wetland Restoration Projects
1. Save the WetlandRestorationEBICalculator.xlsx file from the CVC Ecosystem Goods and
Services website (http://www.creditvalleyca.ca/watershed-science/our-
watershed/ecological-goods-services/) to your computer.
2. Open the Wetland Restoration EBI Calculator file from your computer and save the file as:
Project Name_Wetland_Restoration_EBI_Calculator.xlsx. It is best to use a unique
identifier for the project name such as the property address so as to avoid multiple files
with the same name.
3. Repeat step 2 as many times as necessary to create a file for each proposed wetland
restoration project.

Credit Valley Conservation
54
4. Review the maximum points for the existing (Column D) and restored (Column F)
conditions for each attribute to ensure that they appropriately reflect your geographic
location and/or local priorities. Remember that the higher the maximum score, the more
that attribute is valued as a public good/service. If changes are made to the maximum
scores, in the calculator tool remember that the scoring criteria must also be changed.
5. Review the weighting assigned to the existing condition and change in condition in Row 48
to ensure that they appropriately reflect your geographic location and/or local priorities.
Remember, increasing the weighting number of change in condition and reducing the
weighting number of existing condition favours restoration projects that bring about
significant environmental improvements regardless of the project sites initial quality.
Increasing the weighting number of existing condition and reducing the weighting of
change in condition favours restoration projects that are proposed for already fair quality
sites. Caution should be used when deviating far from a weighting of 0.55 for existing conditions and 0.45 for change in conditions. Also remember that the sum of weighting for existing conditions and change in conditions should always be equal to 1.00.
6. Utilizing the scoring criteria presented in Section 3 of this report, score each attribute for
the existing and proposed restored condition of the project site.
7. Once complete, save the file for future reference.
8. To compare multiple projects create a new EXCEL file called:
Final_Scores_Wetland_Restoration_EBI.xlsx and save it to your computer.
9. Within the newly created file create a table that summarizes the EBI Scores, Climate
Mitigation Scores and Pollution Reduction Scores for all evaluated projects. Sort this data
from highest to lowest final EBI scores to achieve a ranking of the most beneficial to the
least beneficial projects.
10. If two or more projects have the same EBI scores, use Climate Mitigation and/or Pollution
Reduction scores to rank those projects.

Credit Valley Conservation
55
5.0 CONCLUSIONS Wetlands are the most valuable ecosystem. Despite this, wetlands continue to be lost or
negatively impacted by urbanization, agriculture, golf courses and aggregate sites. Within the
Greenbelt, most wetlands, and land where wetlands once existed, are privately owned,
therefore public institutions are unable to rectify this problem without cooperation from private
landowners. CVC has a long history of working with rural landowners to restore natural features
and functions on their lands, however, wetland restoration has always been challenging due to
high costs and an undervaluing of the benefits they provide.
In this study, an Environmental Benefit Index (EBI) specific to wetlands that is suitable for use
within the Greenbelt landscape was developed. In addition, a Microsoft Excel based Wetland
Restoration EBI Calculator was created to aid in the EBI calculations. Completion of this EBI
allows for the administration of a wetland restoration reverse auction program. In such a
program, the EBI would be used as the tool to measure the benefits associated with undertaking
the proposed wetland restoration projects. The benefits would be assessed against the cost of
each proposed project to determine the most cost-beneficial projects to implement.
Credit Valley Conservation
56
6.0 REFERENCES Brikowski, T., 2007. GEOS 5313 Lecture Notes. University of Texas at Dallas. Downloaded on
March 5, 2015 from: http://www.utdallas.edu/~brikowi/Teaching/Applied_Modeling/SurfaceWater/LectureNotes/Rational_Method/Runoff_Coefficient.html
David Suzuki Foundation. 2008. Ontario’s wealth, Canada’s future: Appreciating the value of the
Greenbelt’s eco-services. Vancouver, BC.
Ducks Unlimited Canada, Earthroots, Ecojustice, and Ontario Nature. 2012. Protecting
Greenbelt Wetlands: How Effective is Policy?
Kennedy, M., and Wilson, J. 2009. Estimating the Value of Natural Capital in the Credit River
Watershed. The Pembina Institute and Credit Valley Conservation. Downloaded on April
20, 2015 from:
http://www.creditvalleyca.ca/wp-content/uploads/2011/06/Natural-Credit-Estimating-the-
Value-of-Natural-Capital-in-the-Credit-River-Watershed.pdf
Ontario Wetland Evaluation System (OWES), Southern Manual, 3rd Edition, Version 3.2, 2013.
Snell, E., J. Dougan, K. Shaw-Lukavsky, L. Wardle and R. Scheckenberger. 2009. Wetland
Restoration Strategy. Credit Valley Conservation.
Trenholm, R. Anderson, T., Lantz, V., and Haider, W. 2013. Landowners Views on Wetland
Enhancement and Restoration in and adjacent to the Credit River Watershed. Credit
Valley Conservation. Downloaded on April 25. 2015 from:
http://www.creditvalleyca.ca/wp-
content/uploads/2013/03/CVC_LandownerWetlandSurvey_Finalreport_Feb1_2013.pdf
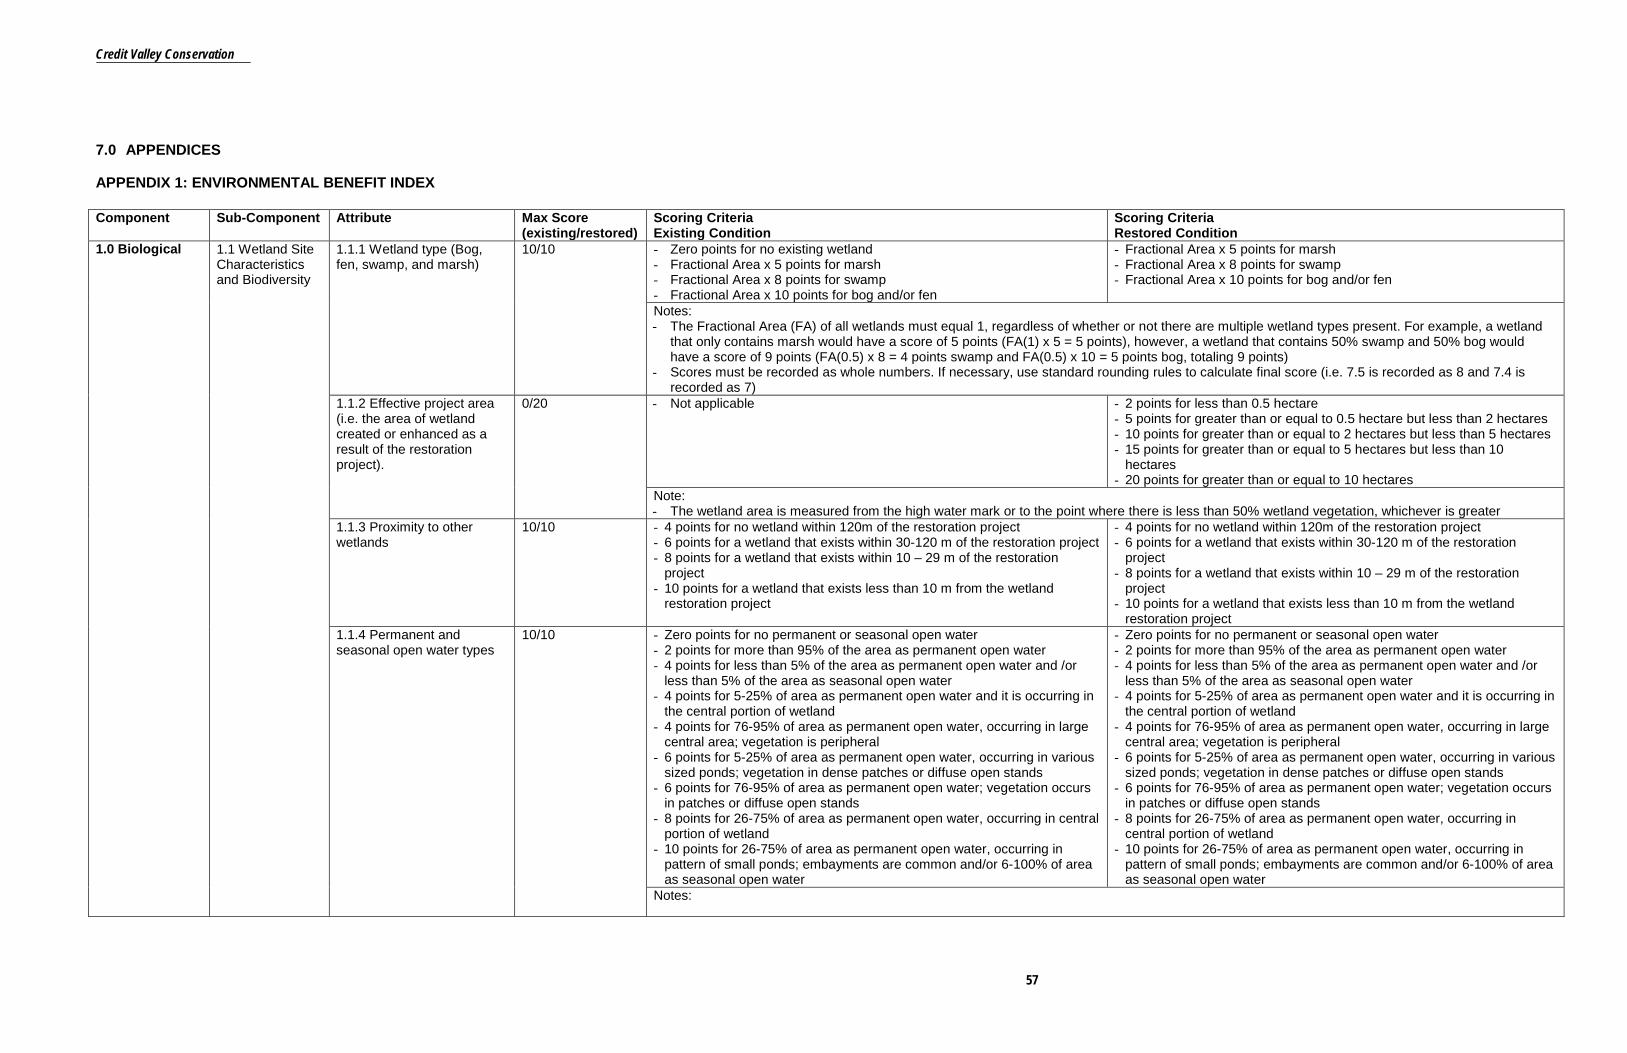
Credit Valley Conservation
57
7.0 APPENDICES
APPENDIX 1: ENVIRONMENTAL BENEFIT INDEX Component Sub-Component Attribute Max Score
(existing/restored) Scoring Criteria Existing Condition
Scoring Criteria Restored Condition
1.0 Biological 1.1 Wetland Site Characteristics and Biodiversity
1.1.1 Wetland type (Bog, fen, swamp, and marsh)
10/10 - Zero points for no existing wetland - Fractional Area x 5 points for marsh - Fractional Area x 8 points for swamp - Fractional Area x 10 points for bog and/or fen
- Fractional Area x 5 points for marsh - Fractional Area x 8 points for swamp - Fractional Area x 10 points for bog and/or fen
Notes: - The Fractional Area (FA) of all wetlands must equal 1, regardless of whether or not there are multiple wetland types present. For example, a wetland
that only contains marsh would have a score of 5 points (FA(1) x 5 = 5 points), however, a wetland that contains 50% swamp and 50% bog would have a score of 9 points (FA(0.5) x 8 = 4 points swamp and FA(0.5) x 10 = 5 points bog, totaling 9 points)
- Scores must be recorded as whole numbers. If necessary, use standard rounding rules to calculate final score (i.e. 7.5 is recorded as 8 and 7.4 is recorded as 7)
1.1.2 Effective project area (i.e. the area of wetland created or enhanced as a result of the restoration project).
0/20 - Not applicable
- 2 points for less than 0.5 hectare - 5 points for greater than or equal to 0.5 hectare but less than 2 hectares - 10 points for greater than or equal to 2 hectares but less than 5 hectares - 15 points for greater than or equal to 5 hectares but less than 10
hectares - 20 points for greater than or equal to 10 hectares
Note: - The wetland area is measured from the high water mark or to the point where there is less than 50% wetland vegetation, whichever is greater
1.1.3 Proximity to other wetlands
10/10 - 4 points for no wetland within 120m of the restoration project - 6 points for a wetland that exists within 30-120 m of the restoration project - 8 points for a wetland that exists within 10 – 29 m of the restoration
project - 10 points for a wetland that exists less than 10 m from the wetland
restoration project
- 4 points for no wetland within 120m of the restoration project - 6 points for a wetland that exists within 30-120 m of the restoration
project - 8 points for a wetland that exists within 10 – 29 m of the restoration
project - 10 points for a wetland that exists less than 10 m from the wetland
restoration project 1.1.4 Permanent and seasonal open water types
10/10 - Zero points for no permanent or seasonal open water - 2 points for more than 95% of the area as permanent open water - 4 points for less than 5% of the area as permanent open water and /or
less than 5% of the area as seasonal open water - 4 points for 5-25% of area as permanent open water and it is occurring in
the central portion of wetland - 4 points for 76-95% of area as permanent open water, occurring in large
central area; vegetation is peripheral - 6 points for 5-25% of area as permanent open water, occurring in various
sized ponds; vegetation in dense patches or diffuse open stands - 6 points for 76-95% of area as permanent open water; vegetation occurs
in patches or diffuse open stands - 8 points for 26-75% of area as permanent open water, occurring in central
portion of wetland - 10 points for 26-75% of area as permanent open water, occurring in
pattern of small ponds; embayments are common and/or 6-100% of area as seasonal open water
- Zero points for no permanent or seasonal open water - 2 points for more than 95% of the area as permanent open water - 4 points for less than 5% of the area as permanent open water and /or
less than 5% of the area as seasonal open water - 4 points for 5-25% of area as permanent open water and it is occurring in
the central portion of wetland - 4 points for 76-95% of area as permanent open water, occurring in large
central area; vegetation is peripheral - 6 points for 5-25% of area as permanent open water, occurring in various
sized ponds; vegetation in dense patches or diffuse open stands - 6 points for 76-95% of area as permanent open water; vegetation occurs
in patches or diffuse open stands - 8 points for 26-75% of area as permanent open water, occurring in
central portion of wetland - 10 points for 26-75% of area as permanent open water, occurring in
pattern of small ponds; embayments are common and/or 6-100% of area as seasonal open water
Notes:

Credit Valley Conservation
58
- Includes the presence of streams and rivers within the wetland limits - Permanent open water is year round standing water with or without emergent vegetation - Seasonal open water includes intermittent watercourses and vernal pools that contain ponded water for greater than 2 months of the year. - When assessing open water do not include areas with vegetation so dense that a duck could not swim through it
1.1.5 Interspersion 10/10 - 2 point for less than 20 intersections - 4 points for 21-30 intersections - 6 points for 31-40 intersections - 8 points for 41-50 intersections - 10 points for greater than 50 intersections
- 2 point for less than 20 intersections - 4 points for 21-30 intersections - 6 points for 31-40 intersections - 8 points for 41-50 intersections 10 points for greater than 50 intersections
1.1.6 Vegetation communities on the site
45/45 # of communities with 1-3 forms 1 = 1.5 points 2 = 2.5 points 3 = 3.5 points 4 = 4.5 points 5 = 5 points 6 = 5.5 points 7 = 6 points 8 = 6.5 points 9 = 7 points 10 = 7.5 points 11 = 8 points + 0.5 for each additional community
# of communities with 4-5 forms 1 = 2 points 2 = 3.5 points 3 = 5 points 4 = 6.5 points 5 = 7.5 points 6 = 8.5 points 7 = 9.5 points 8 = 10.5 points 9 = 11.5 points 10 = 12.5 points 11 = 13 points + 0.5 for each additional community
# of communities with 1-3 forms 1 = 1.5 points 2 = 2.5 points 3 = 3.5 points 4 = 4.5 points 5 = 5 points 6 = 5.5 points 7 = 6 points 8 = 6.5 points 9 = 7 points 10 = 7.5 points 11 = 8 points + 0.5 for each additional community
# of communities with 4-5 forms 1 = 2 points 2 = 3.5 points 3 = 5 points 4 = 6.5 points 5 = 7.5 points 6 = 8.5 points 7 = 9.5 points 8 = 10.5 points 9 = 11.5 points 10 = 12.5 points 11 = 13 points + 0.5 for each additional community
Note: - Sum all community scores together to calculate the final score. For example, a wetland with 3 x one form communities, 4 x two form communities and
2 x five form community would score 10 points (i.e. 7 x 1-3 forms = 6 points + 2 x 4-5 forms = 3.5 points = 9.5 points which would round-up to 10 points) 1.1.7 Diversity of surrounding habitat (within 120m of restored wetland boundaries)
10/10 (check all appropriate items) For each surrounding habitat type assign 1 point to a maximum of 10 points _ non-intensive agriculture (hay/pasture) _ abandoned agricultural land _ deciduous forest _ coniferous forest _ mixed forest* _ abandoned pits and quarries _ open lake or deep river _ terrain appreciably undulating, hilly or with ravines _ creek flood plain _ grassland
(check all appropriate items) For each surrounding habitat type assign 1 point to a maximum of 10 points _ non-intensive agriculture (hay/pasture) _ abandoned agricultural land _ deciduous forest _ coniferous forest _ mixed forest* _ abandoned pits and quarries _ open lake or deep river _ terrain appreciably undulating, hilly or with ravines _ creek flood plain _ grassland
Notes: - Assess this attribute for the area within 120m of the restored wetland boundary - Mixed forest defined as either 25% coniferous trees distributed singularly or in clumps in deciduous forest, or 25% deciduous trees distributed singly or
in clumps in coniferous forest 1.1.8 Carbon Sequestration 15/25 - 5 points for aquatic dominated vegetation
- 10 points for grass/forb dominated vegetation - 15 points tree dominated vegetation
- Add zero points to existing condition score if no plantings are planned as part of the proposed wetland project.
- Add 5 points to existing condition score if aquatic vegetation will be planted

Credit Valley Conservation
59
- Add 8 points to existing condition score if grass/forbs will be planted - Add 10 points to existing condition score if trees will be planted
Notes: - For the existing condition, choose the option that best represents the project location (i.e. wetland and natural buffer area) - For the restored condition, add points until a maximum of 25 is reached
Subtotal 110/140
1.2 Wildlife and Wildlife Habitat
1.2.1 Reproductive habitat for endangered and/or threatened species
12/24 - zero points for no record of endangered or threatened species reproducing in the existing wetland or no wetland currently exists
- 6 points for confirmed reproductive use of the existing wetland by one endangered and/or threatened species
- 12 points for confirmed reproductive use of the existing wetland by more than one endangered and/or threatened species
- Add zero points to existing condition score if there is no predicted reproductive benefit to endangered or threatened species as a result of the wetland restoration project
- Add 6 points to existing condition score if there is a predicted reproductive benefit to one endangered or threatened species as a result of the wetland restoration project
- Add 12 points to existing condition score if there is a predicted reproductive benefit to more than one endangered or threatened species as a result of the wetland restoration project
Notes: - Local records to be used to validate presence/absence of species at risk - Record must be no more than 20 years old to be considered valid - Species at risk recovery strategies are to be used to validate likelihood that the proposed project will have a reproductive benefit to species at risk
1.2.2 Traditional migration, feeding or hibernation habitat for endangered and/or threatened species
12/24 - zero points for no record of endangered or threatened species utilizing the existing wetland for migration, feeding or hibernating in the existing wetland or no wetland currently exists
- 6 points for confirmed use of the existing wetland for migration, feeding and hibernating by one endangered and/or threatened species
- 12 points for confirmed use of the existing wetland for migration, feeding and hibernating by more than one endangered and/or threatened species
- Add zero points to existing condition score if there is no predicted migration, feeding and hibernating benefit to endangered or threatened species as a result of the wetland restoration project
- Add 6 points to existing condition score if there is a predicted migration, feeding and/or hibernating benefit to one endangered or threatened species as a result of the wetland restoration project
- Add 12 points to existing condition score if there is a predicted migration, feeding and/or hibernating benefit to more than one endangered or threatened species as a result of the wetland restoration project
Notes: - Local records to be used to validate presence/absence of species at risk - Record must be no more than 20 years old to be considered valid - Species at risk recovery strategies are to be used to validate the likelihood that the proposed project will have a migration, feeding and/or hibernation
benefit to species at risk 1.2.3 Presence of locally, regionally, and/or provincially significant plant and animal species that directly benefit from the existence of wetlands.
20/30 - zero points for no locally, regionally, and/or provincially significant plant or animal species within 120m of the effective project area
- 10 points for one locally, regionally, and/or provincially significant plant or animal species within 120 m of the effective project area
- 20 points for more than one locally, regionally, and/or provincially significant plant and/or animal species within 120 m of the effective project area
- Add zero points to existing condition score if the project is not anticipated to benefit a locally, regionally and/or provincially significant plant or animal species
- Add 5 points to existing condition score if the project is anticipated to benefit one locally, regionally and/or provincially significant plant or animal species
- Add 10 points to existing condition score if the project is anticipated to benefit more than one locally, regionally, and/or provincially significant plant or animal species
Notes: - Local records to be used to validate presence/absence of significant species - Record must be no more than 20 years old to be considered valid - Where available, species at risk strategies or other documents are to be used to validate the likelihood that the proposed project will have a benefit to
any locally, regionally, and/or provincially significant species 1.2.4 Nesting and feeding habitat for colonial
10/15 - Zero points for not known or not possible (i.e. no open water) to have fed or nested
- Add zero points to existing condition score for no improved benefit to nesting and feeding habitat for colonial waterbirds as a result of the

Credit Valley Conservation
60
waterbirds
- 4 points for active feeding area (except great blue heron) - 7 points for known to have nested within the past 5 years - 10 points for currently nesting colony
wetland restoration project - Add 5 points to existing condition score for improvement to the nesting
and/or feeding habitat for colonial waterbirds as a result of the wetland restoration project
Notes: - Only the following wetland dependent colonial waterbirds are eligible to be scored: red-necked grebe, black-crowned night heron, great egret, black
tern, caspian tern, common tern and great blue heron (scored for nesting only) - Local records to be used to validate feeding/nesting of colonial waterbirds - Record must be no more than 20 years old to be considered valid - Where available, documents are to be used to validate the likelihood that the proposed project will have a benefit to colonial waterbirds
1.2.5 Waterfowl breeding, staging and/or moulting area
10/15 - Zero points for no evidence of waterfowl breeding, staging and/or moulting or no wetland currently exists
- 2 points for evidence of waterfowl breeding, staging and/or moulting at any scale
- 4 points for evidence of waterfowl breeding, staging and/or moulting to a scale that would be considered locally significant
- 7 points for evidence of waterfowl breeding, staging and/or moulting to a scale that would be considered watershed significant
- 10 points for evidence of waterfowl breeding, staging and/or moulting to a scale that would be considered provincially significant
- Add zero points to existing condition score for no increase in wetland area
- Add 2 points to existing condition score for an increase in wetland area of up to 0.5 hectares
- Add 3 points to existing condition score for an increase in wetland area of more than 0.5 hectares but less than 2 hectares
- Add 5 points to existing condition score for an increase in wetland area greater than or equal to 2 hectares
Notes: - Local records to be used to validate significance of waterfowl breeding, staging and/or moulting area - Record must be no more than 20 years old to be considered valid - Geese are not considered an eligible species of waterfowl to score. Wetland restoration designs intended to benefit geese are not encouraged.
1.2.6 Migratory passerine, shorebird, or raptor stopover area.
10/15 - Zero points for no evidence of existing wetland being used for stopover habitat by migratory passerine, shorebird, or raptors or no wetland currently exists
- 2 points for evidence of migratory passerine, shorebird or raptors utilizing the existing wetland for stopover habitat at any scale
- 4 points for evidence of migratory passerine, shorebird or raptors utilizing the existing wetland for stopover habitat to a scale that would be considered locally significant
- 7 points for evidence of migratory passerine, shorebird or raptors utilizing the existing wetland for stopover habitat to a scale that would be considered watershed significant
- 10 points for evidence of migratory passerine, shorebird or raptors utilizing the existing wetland for stopover habitat to a scale that would be considered provincially significant
- Add zero points to existing condition score for no increase in wetland area
- Add 2 points to exiting condition score for an increase in wetland area of up to 0.5 hectares
- Add 3 points to existing condition score for an increase in wetland area of more than 0.5 hectares but less than 2 hectares
- Add 5 points to existing condition score for an increase in wetland area greater than or equal to 2 hectares
Notes: - Local records to be used to validate significance of migratory passerine, shorebird, or raptor stopover area - Record must be no more than 20 years old to be considered valid
1.2.7 Fish Habitat
20/20 - Zero points for no existing fish habitat - Fractional Area of wetland feature x 3 points for seasonal habitat without
piscivores - Fractional Area of wetland feature x 8 points for seasonal habitat with
piscivores - Fractional Area of wetland feature x 15 points for permanent habitat
without piscivores - Fractional Area of wetland feature x 20 points for permanent habitat with
piscivores
- Fractional Area of wetland feature x 3 point for seasonal habitat predicted to not have piscivores
- Fractional Area of wetland feature x 8 points for seasonal habitat predicted to have piscivores
- Fractional Area of wetland feature x 15 points for permanent habitat predicted to not have piscivores
- Fractional Area of wetland feature x 20 points for permanent habitat predicted to have piscivores
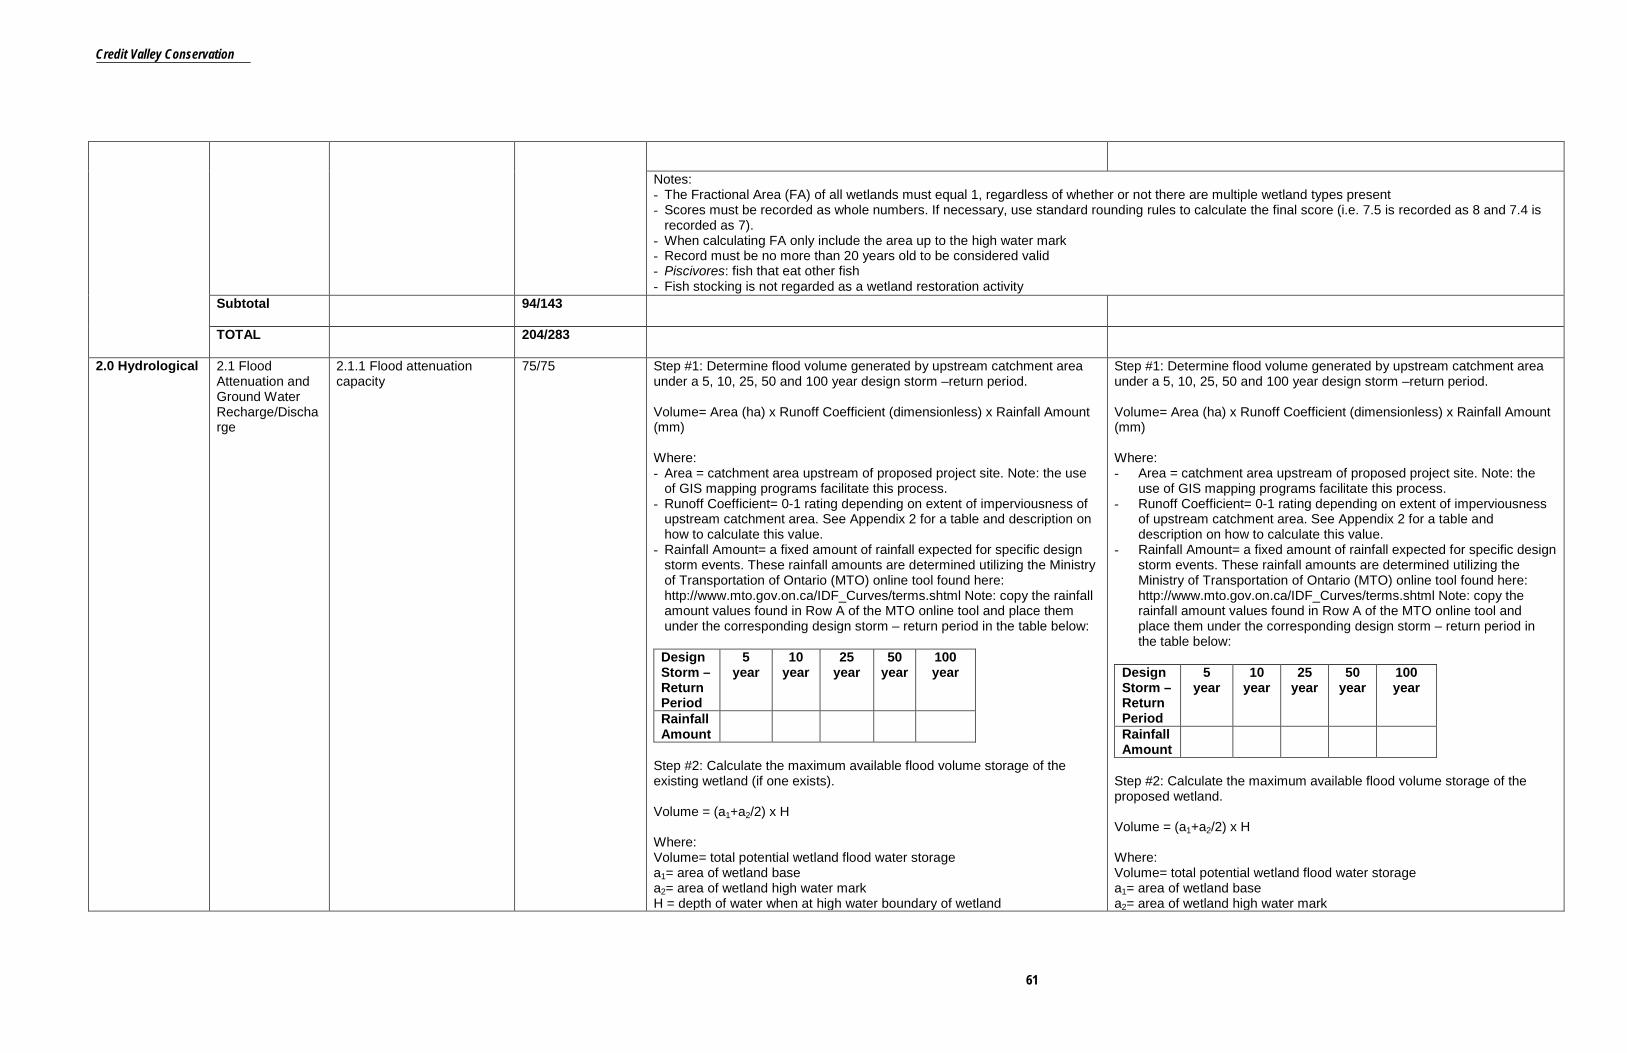
Credit Valley Conservation
61
Notes: - The Fractional Area (FA) of all wetlands must equal 1, regardless of whether or not there are multiple wetland types present - Scores must be recorded as whole numbers. If necessary, use standard rounding rules to calculate the final score (i.e. 7.5 is recorded as 8 and 7.4 is
recorded as 7). - When calculating FA only include the area up to the high water mark - Record must be no more than 20 years old to be considered valid - Piscivores: fish that eat other fish - Fish stocking is not regarded as a wetland restoration activity
Subtotal
94/143
TOTAL 204/283
2.0 Hydrological 2.1 Flood Attenuation and Ground Water Recharge/Discharge
2.1.1 Flood attenuation capacity
75/75 Step #1: Determine flood volume generated by upstream catchment area under a 5, 10, 25, 50 and 100 year design storm –return period. Volume= Area (ha) x Runoff Coefficient (dimensionless) x Rainfall Amount (mm) Where: - Area = catchment area upstream of proposed project site. Note: the use
of GIS mapping programs facilitate this process. - Runoff Coefficient= 0-1 rating depending on extent of imperviousness of
upstream catchment area. See Appendix 2 for a table and description on how to calculate this value.
- Rainfall Amount= a fixed amount of rainfall expected for specific design storm events. These rainfall amounts are determined utilizing the Ministry of Transportation of Ontario (MTO) online tool found here: http://www.mto.gov.on.ca/IDF_Curves/terms.shtml Note: copy the rainfall amount values found in Row A of the MTO online tool and place them under the corresponding design storm – return period in the table below:
Design Storm – Return Period
5 year
10 year
25 year
50 year
100 year
Rainfall Amount
Step #2: Calculate the maximum available flood volume storage of the existing wetland (if one exists). Volume = (a1+a2/2) x H Where: Volume= total potential wetland flood water storage a1= area of wetland base a2= area of wetland high water mark H = depth of water when at high water boundary of wetland
Step #1: Determine flood volume generated by upstream catchment area under a 5, 10, 25, 50 and 100 year design storm –return period. Volume= Area (ha) x Runoff Coefficient (dimensionless) x Rainfall Amount (mm) Where: - Area = catchment area upstream of proposed project site. Note: the
use of GIS mapping programs facilitate this process. - Runoff Coefficient= 0-1 rating depending on extent of imperviousness
of upstream catchment area. See Appendix 2 for a table and description on how to calculate this value.
- Rainfall Amount= a fixed amount of rainfall expected for specific design storm events. These rainfall amounts are determined utilizing the Ministry of Transportation of Ontario (MTO) online tool found here: http://www.mto.gov.on.ca/IDF_Curves/terms.shtml Note: copy the rainfall amount values found in Row A of the MTO online tool and place them under the corresponding design storm – return period in the table below:
Design Storm – Return Period
5 year
10 year
25 year
50 year
100 year
Rainfall Amount
Step #2: Calculate the maximum available flood volume storage of the proposed wetland. Volume = (a1+a2/2) x H Where: Volume= total potential wetland flood water storage a1= area of wetland base a2= area of wetland high water mark

Credit Valley Conservation
62
Step #3: Score wetland flood attenuation capacity Compare Volumes calculated in Step #1 to the Volume calculated in Step #2 to determine the design storm flood attenuation capacity of the existing wetland. Note: the design storm flood attenuation capacity is the greatest design storm where the Volume calculated in Step #2 (wetland storage) is greater than the Volume calculated in Step #1 (runoff generated). If the wetland storage volume is less than the runoff amount generated at a specific design storm, the wetland is unable to attenuate all of these flows.
Design Storm – Return Period
2-5 year
10 year 25 year
50 year
100 year
Total
15 points
15 points
15 points
15 points
15 points
75 points
H = depth of water when at high water boundary of wetland Step #3: Score wetland flood attenuation capacity Compare Volumes calculated in Step #1 to the Volume calculated in Step #2 to determine the design storm flood attenuation capacity of the proposed wetland. Note: the design storm flood attenuation capacity is the greatest design storm where the Volume calculated in Step #2 (wetland storage) is greater than the Volume calculated in Step #1 (runoff generated). If the wetland storage volume is less than the runoff amount generated at a specific design storm, the wetland is unable to attenuate all of these flows.
Design Storm – Return Period
2-5 year
10 year
25 year
50 year
100 year
Total
15 points
15 points
15 points
15 points
15 points
75 points
Notes: - This calculation assumes that the wetland is storing no water at the time of a runoff event and is therefore based on maximum potential flood water
attenuation - Example Calculation: If a wetland has a storage capacity of up to the 50 year design storm event the score for this wetland would be 60 points (i.e.
15+15+15+15=60 points) 2.1.2 Ground water discharge
25/25 Wetland Characteristic
None to Little Some High
Dominant Wetland Type
Bog = 0 Swamp/Marsh = 2
Fen = 5
Topography Flat/rolling = 0 Hilly = 2 Steep = 5 Wetland area: upslope catchment area
Large (>50%) =0
Moderate (5-50%) = 2
Small (<5%) = 5
Lagg development
None = 0 Minor = 2 Extensive = 5
Seeps None = 0 Seasonal = 2 Permanent = 5 Surface marl deposits
None = 0 Present = 5
Iron precipitates
None = 0 Present = 5
Wetland Characteristic
None to Little Some High
Dominant Wetland Type
Bog = 0 Swamp/Marsh = 2
Fen = 5
Topography Flat/rolling = 0 Hilly = 2 Steep = 5 Wetland area: upslope catchment area
Large (>50%) =0 Moderate (5-50%) = 2
Small (<5%) = 5
Lagg development
None expected= 0
Minor Lagg expected = 2
Extensive Lagg expected = 5
Seeps No additional seeps expected = 0
Additional seeps expected = 5
Note: - Score to a maximum of 25 points
2.1.3 Ground water recharge
25/25 If wetland is located within a municipal well head protection zone the wetland automatically scores 25 points. There is no need to calculate scores below. Wetland Site Type:
- Zero points for wetlands greater than 50% lacustrine (by area) or located
If wetland is located within a municipal well head protection zone the wetland automatically scores 25 points. There is no need to calculate scores below. Wetland Site Type:
- Zero points for wetlands greater than 50% lacustrine (by area) or located

Credit Valley Conservation
63
on major rivers - Fractional Area of isolated or palustrine wetland X 20 = - Fractional Area of riverine wetland X 8 = - Fraction Area of lacustrine wetland (not dominant site type) x 0 = Sum the three fractional area’s if the site type is less than 50% lacustrine and add this to the Soil Recharge Potential found below: Soil Recharge Potential:
Dominant Wetland Site Type
Sands, gravels, loams
Clays, substrates in high water tables or shallow substrates over impervious materials such as consolidated bedrock
Lacustrine or major river
0 0
Isolated 5 3 Palustrine 4 2 Riverine (not on a major river)
2 1
Notes: - Major rivers include: St. Clair, Detroit, Niagara, St. Lawrence, Ottawa - For the Soil Recharge Potential Table, circle the number that best represents the project site - Maximum total score = 25 points
Subtotal 125/125
2.2 Water Quality and Carbon Storage
2.2.1 Short-term water quality improvement in wetland
50/50 If wetland is located on a major lake (Huron, St. Clair, Erie, Ontario, Simcoe) or major river (St. Clair, Detroit, Niagara, St. Lawrence, Ottawa) the score is 0 and there is no need to calculate the score below. Step 1: Determination of watershed improvement factor (WIF) - Fractional area of isolated wetland x 0.5 = - Fractional area of riverine wetland x 1.0 = - Fractional area of palustrine wetland with no inflow x 0.7 = - Fractional area of palustrine wetland with inflow x 1.0 = - Fractional area of lacustrine wetland on lake shoreline x 0.2 = - Fractional area of lacustrine wetland at lake inflow or outflow x 1.0 = WIF Score = sum of the above (cannot exceed 1.0) Step 2: Determination of the upstream catchment land use factor (LUF) - Over 50% agricultural and/or urban = 1.0 - Between 30 and 50% agricultural and/or urban = 0.8 - Over 50% forested or other natural vegetation = 0.6 Step 3: Determination of pollutant uptake factor (PUF) - Fractional area of wetland with live trees, shrubs, herbs or mosses x 0.75
= - Fractional area of wetland with emergent, subemergent or floating
vegetation x 1.0 = - Fractional area of wetland with little or no vegetation x 0.5 = PUF Score = sum of the above (cannot exceed 1.0) Step 4: Calculation of final score
If wetland is located on a major lake (Huron, St. Clair, Erie, Ontario, Simcoe) or major river (St. Clair, Detroit, Niagara, St. Lawrence, Ottawa) the score is 0 and there is no need to calculate the score below. Step 1: Determination of watershed improvement factor (WIF) - Fractional area of isolated wetland x 0.5 = - Fractional area of riverine wetland x 1.0 = - Fractional area of palustrine wetland with no inflow x 0.7 = - Fractional area of palustrine wetland with inflow x 1.0 = - Fractional area of lacustrine wetland on lake shoreline x 0.2 = - Fractional area of lacustrine wetland at lake inflow or outflow x 1.0 = WIF Score = sum of the above (cannot exceed 1.0) Step 2: Determination of the upstream catchment land use factor (LUF) - Over 50% agricultural and/or urban = 1.0 - Between 30 and 50% agricultural and/or urban = 0.8 - Over 50% forested or other natural vegetation = 0.6 Step 3: Determination of pollutant uptake factor (PUF) - Fractional area of wetland with live trees, shrubs, herbs or mosses x 0.75
= - Fractional area of wetland with emergent, subemergent or floating
vegetation x 1.0 = - Fractional area of wetland with little or no vegetation x 0.5 = PUF Score = sum of the above (cannot exceed 1.0) Step 4: Calculation of final score

Credit Valley Conservation
64
- 50 x WIF x LUF x PUF - 50 x WIF x LUF x PUF
2.2.2 Short-term water quality improvement in upland buffer
50/50 If buffer is greater than or equal to 50m wide, 50 points are scored and there is no need to complete the calculations below. If no buffer currently exists, 0 points are scored and there is no need to complete the calculations below. Step 1: Determination of watershed improvement factor (WIF) - Fractional area of isolated wetland x 0.5 = - Fractional area of riverine wetland x 0.8 = - Fractional area of palustrine wetland with no inflow x 0.7 = - Fractional area of palustrine wetland with inflow x 1.0 = - Fractional area of lacustrine on lake shoreline (all but Major Lakes) x 0.5
= - Fractional area of lacustrine on lake shoreline (Major Lakes) x 0.2 WIF Score = sum of the above (cannot exceed 1.0) Step 2: Determination of adjacent land use factor (LUF) - Over 50% agricultural and/or urban = 1.0 - Between 30 and 50% agricultural and/or urban = 0.6 - Over 50% forested or other natural vegetation = 0.4 Step 3: Determination of pollutant uptake factor (PUF) - Simple species buffer containing only trees, or shrubs or grasses/forbs =
0.3. - Complex species buffer containing trees, shrubs and grasses/forbs = 1.0. Step 4: Determination of percent of boundary buffered factor (POBB). - 100% of the wetland boundary on the subject property is buffered = 1.0. - 50-99% of the wetland boundary on the subject property is buffered = 0.5. - <50% of the wetland boundary on the subject property is buffered = 0.2 Step 5: Determination of the width factor (WF). - 15m to less than 50 m wide = 1.0 - 10m to less than 15 m wide = 0.8 - 5m to less than10 m wide = 0.6 - Less than 5 m wide = 0.4
Step 6: Determination of steepness factor (SF) - Less than 5% = 1.0 - 5% to less than 10% = 0.8 - 10% to less than 15% = 0.6 - Greater than 15% = 0.4 Step 7: Determination of soil texture factor (STF) - Sand = 1.0 - Loam = 0.7 - Clay = 0.4 Step 8: Calculation of final score - 50 x WIF x LUF x PUF x POBB x WF x SF x STF
If buffer is already or proposed to be greater than or equal to 50m wide, 50 points are scored and there is no need to complete the calculations below. If no buffer is proposed a score of 0 points is awarded and there is no need to complete the calculations below. Step 1: Determination of watershed improvement factor (WIF) - Fractional area of isolated wetland x 0.5 = - Fractional area of riverine wetland x 0.8 = - Fractional area of palustrine wetland with no inflow x 0.7 = - Fractional area of palustrine wetland with inflow x 1.0 = - Fractional area of lacustrine on lake shoreline (all but Major Lakes) x 0.5
= - Fractional area of lacustrine on lake shoreline (Major Lakes) x 0.2 WIF Score = sum of the above (cannot exceed 1.0) Step 2: Determination of adjacent land use factor (LUF) - Over 50% agricultural and/or urban = 1.0 - Between 30 and 50% agricultural and/or urban = 0.6 - Over 50% forested or other natural vegetation = 0.4 Step 3: Determination of pollutant uptake factor (PUF) - Simple species buffer containing only trees, or shrubs or grasses/forbs =
0.3. - Complex species buffer containing trees, shrubs and grasses/forbs = 1.0. Step 4: Determination of percent of boundary buffered factor (POBB). - 100% of the wetland boundary on the subject property is buffered = 1.0. - 50-99% of the wetland boundary on the subject property is buffered =
0.5. - <50% of the wetland boundary on the subject property is buffered = 0.2 Step 5: Determination of the width factor (WF). - 15m to less than 50 m wide = 1.0 - 10m to less than 15 m wide = 0.8 - 5m to less than10 m wide = 0.6 - Less than 5 m wide = 0.4 Step 6: Determination of steepness factor (SF) - Less than 5% = 1.0 - 5% to less than 10% = 0.8 - 10% to less than 15% = 0.6 - Greater than 15% = 0.4 Step 7: Determination of soil texture factor (STF) - Sand = 1.0 - Loam = 0.7 - Clay = 0.4 Step 8: Calculation of final score - 50 x WIF x LUF x PUF x POBB x WF x SF x STF
2.2.3 Long-term nutrient (nitrogen/phosphorus) trap in wetland
50/50 - No wetland present = zero points - Wetland does not have permanent open water = 10 points - Wetland does have permanent open water = 20 points - Wetland is located in a river mouth = 50 points
- Add zero points to the existing condition score if the proposed wetland is not located in a river mouth and does not intend to have permanent open water or does not intend to add to the extent of permanent open water
- Add 20 points to the existing condition score if the proposed wetland is

Credit Valley Conservation
65
not located in a river mouth and does intend to add to the extent of the permanent open water
- Wetland will be located in a river mouth = 50 points 2.2.4 Shoreline erosion control
25/25 Step 1: Wetland entirely isolated = zero points Any part of the wetland palustrine, riverine or lacustrine (proceed to Step 2) Step 2: Calculate the shoreline vegetation fractional area and multiply by the points indicated below. For diversely vegetated shorelines sum points to a maximum of 25. - Fractional area of trees and shrubs x 25 points - Fractional area of emergent vegetation x 12 points - Fractional area of submergent vegetation x 9 points - Fractional area of other shoreline vegetation x 6 points - Fractional area of no vegetation x zero points
Step 1: Wetland entirely isolated = zero points Any part of the wetland palustrine, riverine or lacustrine (proceed to Step 2) Step 2: Calculate the shoreline vegetation fractional area and multiply by the points indicated below. For diversely vegetated shorelines sum points to a maximum of 25. - Fractional area of trees and shrubs x 25 points - Fractional area of emergent vegetation x 12 points - Fractional area of submergent vegetation x 9 points - Fractional area of other shoreline vegetation x 6 points - Fractional area of no vegetation x zero points
2.2.5 Carbon Storage 15/25 - Wetland does not have permanent open water = 5 points - Wetland does have permanent open water = 15 points
- Add zero points to the existing condition score if the proposed wetland does not intend to have permanent open water or does not intend to add to the extent of the existing permanent open water
- Add 10 points to the existing condition score if the proposed wetland does intend to add to the extent of the permanent open water
Subtotal 190/200
TOTAL 315/325
3.0 Social 3.1 Goods 3.1.1 Sustainable use of the wetland for harvesting goods
0/25
- Not applicable - Zero points for no harvesting of food, fuel and/or fibre or allow harvesting without ensuring best management practices are followed (i.e. do not have a Managed Forest Plan, do not use licensed hunters, anglers or trappers).
- 25 points for allowing the harvesting of food, fuel and/or fibre and ensure that best management practices are followed (i.e. fuel and fibre wood harvested in accordance with a Managed Forest Plan and licensed hunters, anglers and trappers utilized to harvest pelts).
Notes: - If the timber associated with the wetland is immature at the moment and the Managed Forest Plan does not call for a thinning within the next 10 years
award 25 points if the landowner intends to allow timber harvesting in subsequent Managed Forest Plan updates - If fish are harvested, points are to be scored here and not within the Recreation Sub-Component - Due to the devastating impacts to wetland quality, peat extraction is not recognized as a public good scored in this tool
Subtotal 0/25
3.2 Recreation
3.2.1 Sustainable use of the wetland for recreation
0/25 - Not applicable - Zero points for no public allowance - 10 points for public allowance on an infrequent situation by situation
(daily) basis. - 20 points for public allowance on a more frequent (long-standing)
informal basis. - 25 points for year round formalized access (i.e. Bruce Trail crosses the
property
Notes: - Example recreation activities eligible for points include: catch and release fishing, hiking, bird watching and nature enjoyment - If angling is catch and release only, points are to be scored here and not within the Goods Sub-Component

Credit Valley Conservation
66
Subtotal 0/25
3.3 Aesthetics 3.3.1 Landscape aesthetics 25/25 - Zero points for wetland greater than or equal to 120m from a public road/trail/navigable waterway or neighbouring property and wetland is not distinctly recognizable on the landscape
- 10 points for wetland greater than or equal to 120m from a public road/trail/navigable waterway or neighbouring property and wetland is distinctly recognizable on the landscape
- 20 points for wetland less than 120m from a public road/trail/navigable waterway or neighbouring property
- 25 points for wetland that is immediately adjacent a public road/trail/navigable waterway or neighbouring property
- Zero points for wetland greater than or equal to 120m from a public road/trail/navigable waterway or neighbouring property and wetland is not distinctly recognizable on the landscape
- 10 points for wetland greater than or equal to 120m from a public road/trail/navigable waterway or neighbouring property and wetland is distinctly recognizable on the landscape
- 20 points for wetland less than 120m from a public road/trail/navigable waterway or neighbouring property
- 25 points for wetland that is immediately adjacent a public road/trail/navigable waterway or neighbouring property
Subtotal 25/25
3.4 Education and Research
3.4.1 Use of wetland for education and/or research activities
0/25 - Not applicable - Zero points for no public allowance. - 10 points for minimal public allowance on an infrequent situation by
situation (daily) basis - 20 points for public allowance on a more frequent (ongoing) basis
25 points for public allowance on a more frequent (ongoing) basis and landowner is willing to participate in education and research activities
Subtotal 0/25
3.5 Cultural and Aboriginal Values
3.5.1 Enhancement to the historical, religious and/or spiritual value
0/25 - Not applicable - Zero points for no enhancements to the historical, national, religious or spiritual value of the wetland
- 25 points for a documented enhancement to the historical, national, religious or spiritual value of the wetland
Notes: - Applicants are encouraged to contact local First Nations and historical societies to determine site significance - Example activities eligible for points include: interpretive signage (e.g. sign informing visitors of a historic trade route through the wetland or
preservation of a historical dam), public use of the wetland for religious ceremonies, or presence of sacred sites or use of the wetland for song, chant and/or stories
Subtotal 0/25
TOTAL 25/125
GRAND TOTAL 544/733

Credit Valley Conservation
67
APPENDIX 2: RUNOFF COEFFICIENTS
Source: http://www.utdallas.edu/~brikowi/Teaching/Applied_Modeling/SurfaceWater/LectureNotes/Rational_Method/Runoff_Coefficient.html
Notes: - A, B, C, D refers to catchment soil type. A=Sandy Soil, B=Sandy Loam Soil, C= Clay Loam Soil,
D=Clay Soil. - 0-2%, 2-6% and greater than 6% refers to catchment slope