environmental challenges and physiological solutions
TRANSCRIPT

Environmental Challenges and Physiological Solutions: ComparativeEnergetic Daily Rhythms of Field Mice Populations from DifferentEcosystemsScantlebury, M., & Haim, A. (2012). Environmental Challenges and Physiological Solutions: ComparativeEnergetic Daily Rhythms of Field Mice Populations from Different Ecosystems. PLoS ONE, 7(12), [e51247].https://doi.org/10.1371/journal.pone.0051247
Published in:PLoS ONE
Document Version:Publisher's PDF, also known as Version of record
Queen's University Belfast - Research Portal:Link to publication record in Queen's University Belfast Research Portal
Publisher rights© 2012 The AuthorsThis is an open access article distributed under the terms of the Creative Commons Attribution License(https://creativecommons.org/licenses/by/4.0/), which permits unrestricted use, distribution, and reproduction in any medium, provided theoriginal author and source are credited
General rightsCopyright for the publications made accessible via the Queen's University Belfast Research Portal is retained by the author(s) and / or othercopyright owners and it is a condition of accessing these publications that users recognise and abide by the legal requirements associatedwith these rights.
Take down policyThe Research Portal is Queen's institutional repository that provides access to Queen's research output. Every effort has been made toensure that content in the Research Portal does not infringe any person's rights, or applicable UK laws. If you discover content in theResearch Portal that you believe breaches copyright or violates any law, please contact [email protected].
Download date:17. Mar. 2022
Environmental Challenges and Physiological Solutions:Comparative Energetic Daily Rhythms of Field MicePopulations from Different EcosystemsMichael Scantlebury1,2*, Abraham Haim1,3
1Department of Biology, University of Haifa Oranim campus, Tivon, Israel, 2 School of Biological Sciences, Queen’s University Belfast, Belfast, United Kingdom, 3 The Israeli
Centre for Interdisciplinary Research in Chronobiology, University of Haifa, Mount Carmel, Israel
Abstract
Daily and seasonal variations in physiological characteristics of mammals can be considered adaptations to temporal habitatvariables. Across different ecosystems, physiological adjustments are expected to be sensitive to different environmentalsignals such as changes in photoperiod, temperature or water and food availability; the relative importance of a particularsignal being dependent on the ecosystem in question. Energy intake, oxygen consumption (VO2) and body temperature(Tb) daily rhythms were compared between two populations of the broad-toothed field mouse Apodemus mystacinus, onefrom a Mediterranean and another from a sub-Alpine ecosystem. Mice were acclimated to short-day (SD) ‘winter’ and long-day (LD) ‘summer’ photoperiods under different levels of salinity simulating osmotic challenges. Mediterranean mice hadhigher VO2 values than sub-Alpine mice. In addition, mice exposed to short days had higher VO2 values when given waterwith a high salinity compared with mice exposed to long days. By comparison, across both populations, increasing salinityresulted in a decreased Tb in SD- but not in LD-mice. Thus, SD-mice may conserve energy by decreasing Tb during (‘winter’)conditions which are expected to be cool, whereas LD-mice might do the opposite and maintain a higher Tb during(‘summer’) conditions which are expected to be warm. LD-mice behaved to reduce energy expenditure, which might beconsidered a useful trait during ‘summer’ conditions. Overall, increasing salinity was a clear signal for Mediterranean-micewith resultant effects on VO2 and Tb daily rhythms but had less of an effect on sub-Alpine mice, which were moreresponsive to changes in photoperiod. Results provide an insight into how different populations respond physiologically tovarious environmental challenges.
Citation: Scantlebury M, Haim A (2012) Environmental Challenges and Physiological Solutions: Comparative Energetic Daily Rhythms of Field Mice Populationsfrom Different Ecosystems. PLoS ONE 7(12): e51247. doi:10.1371/journal.pone.0051247
Editor: Frank Seebacher, University of Sydney, Australia
Received December 19, 2011; Accepted November 5, 2012; Published December 14, 2012
Copyright: � 2012 Scantlebury, Haim. This is an open-access article distributed under the terms of the Creative Commons Attribution License, which permitsunrestricted use, distribution, and reproduction in any medium, provided the original author and source are credited.
Funding: This project was funded by a Royal Society Postdoctoral Visiting Research Fellowship to MS, PDFs00/AU/nvb (http://royalsociety.org/), and by theUniversity of Haifa Research Authorities to AH. The funders had no role in study design, data collection and analysis, decision to publish, or preparation of themanuscript.
Competing Interests: The authors have declared that no competing interests exist.
* E-mail: [email protected]
Introduction
Ecological physiology aims to understand how organisms
function in and respond to their natural environment [1–3]. In
many cases, environmental stresses are not constant over time but
take place on a cyclical/seasonal basis (e.g. daily or annually).
Animals subsequently display variations in their behavioural and
physiological traits, such as activity patterns and body temperature
(Tb) or oxygen consumption (VO2) daily rhythms; the latter
reflecting changes in metabolic processes [4–6]. Such endogenous
rhythms allow animals to inhabit different environments and can
normally be entrained by a ‘Zeitgeber’, such as photoperiod [7]. In
ecosystems that vary temporally, mammals often display daily and
seasonal variations in their thermoregulatory system, which are
considered necessary adaptations to their habitats [8,9,10].
Indeed, comparing physiological variables of closely related
individuals from different habitats or ecosystems using chronobi-
ological tools makes it possible to examine the potential outcome
of natural selection for physiological characteristics [11–13].
Environmental adjustments of terrestrial animals to different
habitats and different seasons may be achieved by seasonal
acclimatization of the digestive, thermoregulatory and osmoreg-
ulatory systems [14–19]. Small mammals inhabiting challenging
ecosystems with reduced water and food resources have lower
energy demands and an increased digestive efficiency compared
with those inhabiting mesic and more productive environments
[20–22]. By comparison, those that inhabit seasonally cold
environments regularly have increased metabolic capacities and
energy requirements for thermoregulation [18,23–25].
The Levant sub-region is one of extreme biogeographical
heterogeneity; large seasonal variations in ambient temperature,
water and food occur in a relatively restricted area [26]. Low-lying
hills, such as the Mount Carmel ridge, are characterised by short,
wet winters and long, hot and dry summers (8–9 months). By
comparison, high mountainous areas such as Mount Hermon are
characterised by low ambient temperatures (Tas) and snow during
the winter [27]. In this area of the eastern Mediterranean, many
species of plants and animals originating from different zoogeo-
graphical origins (e.g. Ethiopian and Palaearctic) coexist and reach
the limits of their geographical ranges [28]. For example, the
common spiny mouse Acomys cahirinus, of Ethiopian origin, which
has the northern-most limits of its distribution in southern Turkey
PLOS ONE | www.plosone.org 1 December 2012 | Volume 7 | Issue 12 | e51247
[29], coexists with the broad-toothed field mouse Apodemus
mystacinus, of Palaearctic origin, which has the southern-most
limits of its distribution in the Judean hills [30]. The fact that such
species are at the edges of their geographical distribution ranges is
possibly indicative of limits to their ecophysiological abilities to
cope with the environmental challenges encountered in these
habitats [12]. Therefore, this offers a valuable natural opportunity
with which to explore physiological responses to environmental
challenges.
Populations of A. mystacinus are found in the Mediterranean
ecosystem in Israel as on the coastal slopes of Mount Carmel
(Mediterranean mice), with mean Tas in January and August of 12
and 26uC, respectively, and a mean annual precipitation of
550 mm. Populations of this species also exist on the slopes of
Mount Hermon on the eastern side of the Great African Rift
Valley at altitudes of 1650 m (sub-Alpine mice), a sub-alpine
ecosystem with mean Tas in January and August of 6 and 22uC,
respectively, and a mean annual precipitation of over 900 mm
[31]. These two populations appear to have been genetically
separated for some time, having originated from different
invasions [32,33]. In the Carmel, severe shortages of water at
the end of long hot and dry summers have been suggested to
present the most problematic environmental challenge for this
population [34,35]. During this season, the vegetation is expected
to have an increased particle (or osmotic) concentration due to the
high evaporation of water as a result of increased solar radiation
[36]. Indeed, increased salinity in the water source or food can
effectively induce dehydration responses to both VO2 and Tb
[16,37]. By comparison, cold winters and snow are presumed to
present the most challenging conditions for active (non-hibernat-
ing) mice inhabiting the sub-alpine ecosystem [34]. Bearing in
mind the differences between the two ecosystems, Mediterranean
mice may face greater challenges with respect to osmotic load
whereas sub-Alpine mice may face greater challenges with respect
to low Tas. Results of previous studies have revealed that
acclimation to short photoperiod is an environmental cue for
winter acclimatization of the thermoregulatory system whilst
acclimation to long photoperiod simulates heat acclimation or
summer acclimatization [4,14,38–41] We therefore propose the
following hypothesis: ‘‘If Mount Carmel is a less thermally but
more xerically challenging environment than Mount Hermon, the
latter sub-Alpine population is predicted to be more responsive to
changes in photoperiod such as short day conditions (simulating
winter) whereas the former Mediterranean population should be
more responsive to osmotic load (simulating aridity)’’. Conse-
quently we aimed to examine whether physiological responses to
photoperiod and osmotic load would reflect differences in the
abilities of mice from these two populations to cope with the
seasonal challenges faced in their natural environments. Although
it is not possible to establish the effects of an independent variable,
such as salinity or photoperiod, by the study of only two species or
populations that differ in this trait [42], we present the results of
VO2 and Tb daily rhythms, variation in Heterothermy index (HI),
a species-independent index of Tb [43], as well as energy intake for
two populations of A. mystacinus as an indication of the role that
climatic differences might play in shaping physiological diversity.
Methods
Ethics StatementPermission was granted from the Nature and Parks Authority of
Israel to collect mice from both field sites (below). The protocol
was approved by the committee on the ethics of animal
experiments of the University of Haifa (permit number 016
2002). The study was performed in accordance with the
recommendations in the Guide for the Care and Use of
Laboratory Animals of the National Institutes of Health.
AnimalsStudied individuals of A. mystacinus were captured from a site on
the slopes of Mount Hermon representing a sub-alpine ecosystem
(35u009 E 33u009 N; 1650 m elevation) in December 2002 (‘sub-
Alpine’mice) and in June 2003 and from Har Horshan region on
the Carmel ridge representing a Mediterranean ecosystem (32u439
E 34u589 N; 100 m elevation) in March 2003 (‘Mediterranean’
mice). Young or juvenile animals and females that were obviously
pregnant or lactating were released. Mice were taken to the
laboratory at the University of Haifa Oranim campus, Kiryat
Tivon where they were maintained individually in cages
(35625615 cm) and provided with sawdust and tissue paper as
bedding material. Mice were kept in the laboratory for at least
three weeks to establish whether any of the females were pregnant.
No females were pregnant. They were acclimated to laboratory
conditions after capture from the wild for at least two months
(short-day; ‘SD’ - 8L: 16D, lights on between 08:00–16:00 h)
before any measurements were taken. They were offered dried
rodent chow (21% crude protein, 4% crude fat, 4% cellulose, 13%
moisture, 7% ash, 17.4 kJ/g gross energy; Koffolk, Israel) ad libitum
and agar gel (20 g of agar gel dissolved in 1000 ml of water) as
a source of moisture. Mice were then subjected to various
measurements of different physiological variables (digestibility,
VO2, and Tb measurements, sections 2.3, 2.4 and 2.5) at three
different salinity levels. The same mice were used for the different
experiments which were always conducted in the same sequence,
i.e. digestibility, VO2 and then Tb measurements. They were then
acclimated to a long photoperiod (long day; ‘LD’ - (16L: 8D, lights
were on between 06:00–22:00 h) for two months and all
measurements were repeated. These photoperiod regimes simu-
lated thermogenic acclimation that would have been a result of
seasonal acclimatization in the wild, as photoperiod is the primary
cue for seasonal acclimatisation [4,35,41]. In this case, Ta was kept
constant at 2560.1uC throughout the entire experimental period.
The intensity of light during the photophase was 450 lux, which
was provided by white fluorescent lighting with a dominant wave
length of about 470 nm. A dim red light in the corner of the room
was on continuously (25 lux) which allowed experimenters to work
during the ‘dark’ periods [44,45]. The current study is a contin-
uation of previous work by the authors on measurements of the
daily rhythms of Tb and VO2 in A. mystacinus [6], of measurements
from Mount Hermon [34] and Mount Carmel [35] populations,
and of osmoregulatory variation in Mediterranean and sub-Alpine
mice [46]. There is no data overlap with the present study.
Osmotic LoadingTo simulate changes of osmotic load experienced in the wild
across the seasons, animals were exposed to different levels of
osmotic load by altering the level of salt (NaCl) dissolved into the
agar that was provided as their water source [12,46]. We dissolved
NaCl in the agar at concentrations of 0.9%, 1.4% and 1.8%; the
lowest salinity (0.9%) representing the osmotic loading that they
would experience in the wild [36]. Several physiological variables
were then measured for each of the six different treatment
conditions (i.e. for the two photoperiods and the three salinity
levels) for mice from both ecosystems. Acclimation to each
increase in salinity, at a given photoperiod regime, lasted for two
weeks (which is sufficient time for acclimation of the thermoreg-
ulatory system [47–50]).
Comparative Energetics of Mouse Populations
PLOS ONE | www.plosone.org 2 December 2012 | Volume 7 | Issue 12 | e51247

Energy IntakeMice were transferred to cages with paper towelling (4 sheets,
approximately 40630 cm per sheet), with no sawdust at the
beginning of a 7-day trial period. They were offered an amount of
food (c. 80 g 60.01 g) dried to constant weight. One week later,
the remaining food and the faeces produced were removed from
each cage and dried to constant weight in an oven (Memmert,
Germany; 60uC). Subsequently, for each mouse, at each level of
salinity and photoperiod regime, the dry food and faeces remains
were separated by hand, weighed (Sartorius, Germany; 60.01 g),
homogenised, and the faecal calorific value (FE, kJ/g) determined
by adiabatic bomb calorimetry (Semi-micro Calorimeter 1425.
Parr, USA). We assume that bacterial breakdown of faeces was
negligible since conditions were dry and even under ideal
conditions faecal breakdown for this time period is typically less
than 10% [51]. We obtained measures of food intake and faecal
output at each level of salinity and photoperiod regime. We
determined dry matter intake (DMI, g) as the mean dry food
consumed per day and faecal output (FO, g) as the mean dry
faeces produced per day. Both variables were calculated per gram
body mass (Wb). Apparent digestible energy intake (ADEI, kJ/day)
and digestible efficiency (DE) was then calculated [52] as:
ADEI(kJ=day)~½DMI(g)x17:4(kJ=g)�{½FO(g)xFE(kJ=g)� ð1Þ
DE~½(DMI{FO)=DMI � ð2Þ
Daily Rhythms of Oxygen Consumption (VO2)Oxygen consumption (VO2) daily rhythms were monitored
using a 6-chamber switching device in an open circuit system
[53,54]. Five metabolic chambers (5020 ml volume for each) were
used for measuring VO2 with the sixth used to obtain a baseline.
Each chamber was sampled in turn and concentrations of O2 in
the dried efflux air were monitored in 100 s time bins with flush-
out times of 100 s [55,56]) using a Servomex Xentra 4100
automated oxygen analyser linked to a computer (Logal hardware
and software for VO2 analysis, MODCON systems, Wonderware
InTouch 7,1,0,0; Tuchenhagen, Ireland, Ltd.). Oxygen consump-
tion readings were taken during the stable period after the 100 s
flush-out which provided measurements of VO2 for each mouse
approximately every 20 minutes. We verified that there were no
air leaks in the system before each measurement. Air was dried
before entry into the metabolic chambers by passing it through
a freeze-dryer at 270uC, and again before entering the analyser.
The flow rate through each chamber was set to 500 ml/min
(mass-flow meter, Modcon systems, Israel) which was calibrated
with a bubble flowmeter [57]. The oxygen analyser was calibrated
to an upper value (20?95% O2, atmospheric air) prior to each
measurement and to a lower value (0?0% O2, N2 gas) every 2
weeks. The thermocouples within the metabolic chamber were
calibrated to 0.0uC prior to each measurement by placing them in
ice water. Mice were placed in the chambers at midday for 72 h
with food and agar gel provided ad libitum (c. 50 g of rodent chow
and 20 g of fresh agar was placed in the chamber with each
animal). Chambers were placed inside an incubator (Labline),
which was set at 25uC and had an internal lighting regime
(including a dim red light) that was consistent with laboratory
acclimation conditions. Four sheets of paper towelling (40630 cm
per sheet) were provided as bedding material. We analysed the
final 48 h of VO2 data and not the first 24 h to allow mice to
become accustomed to chamber conditions.
Daily Rhythms of Body Temperature (Tb)Rectal Tbs were measured for a total of 36 h using a copper-
constantan thermocouple connected to a TH-65 Wescor ther-
mometer. To minimise the disturbance to each animal, mice were
measured in two batches with only half of the animals measured
every four hours thus each individual animal was measured only
once every eight hours [58]. For each measurement, the
thermocouple was inserted 2.5 cm into the rectum of a mouse
for no more than 30 seconds. We did not implant data logging
devices or transmitters because we had ethical concerns working
with such small (20–30 g) animals [59,60].
StatisticsGeneral linear models were used to determine differences
between groups in DMI and ADEI and a Generalized Linear
Model with a logit link function was used to assess differences in
DE. Body mass and salinity entered as covariates while habitat and
photoperiod were entered as factors [61]. Cosinor analysis was
used to determine the VO2 and the Tb daily rhythms of measured
individuals with the period set to 24 h. The mean (mesor) values,
amplitude and the acrophase of the VO2 and Tb daily rhythms
were calculated for each individual [62,63]. While cosine curves
adequately fitted the VO2 data, they were less adept at fitting the
Tb data. Therefore, Repeated measures ANOVA was used to
examine the variation in cosinor parameters (mesor, amplitude,
acrophase) of VO2 with habitat and photoperiod entered as
factors. Restricted maximum likelihood was used to estimate the
model parameters. By comparison, general additive models were
used to examine variation in Tb data [64–66]. Finally, variation in
HI was reported. Heterothermy index was calculated as the square
root of the sum of the squares of the individual differences between
the modal Tb and each individual Tb [43] for each animal, under
each condition. Relationships between photoperiod, habitat and
salinity with HI were investigated using general linear models.
Results
Energy IntakeMean body mass of all animals was 32.165.67 g. There were
no effects of habitat, photoperiod or salinity on body mass
(F1,105 = 0.51, p = 0.475; F1,105 = 0.13, p = 0.717 and F1,105 = 0.18,
p = 0.677 respectively, Table 1). There were consistent differences
in body mass between individuals, with large individuals remain-
ing large. Dry matter intake decreased with increasing salinity in
mice from both populations and under the two photoperiod
regimes (F1,104 = 34.68, p,0.001) (Fig. 1A). Mediterranean mice
had significantly greater DE values than sub-Alpine mice
(x2 = 5.33, p = 0.021) (Fig. 1B). A significant interaction was noted
between photoperiod and salinity (x2 = 22.33, P,0.001); DE
values were greater for mice exposed to long days at low levels of
salinity but greater for mice exposed to short days at higher levels
of salinity. For ADEI the overall effect of increasing salinity
resulted in a decrease of energy intake in both populations.
However, there was a significant interaction between photoperiod
and salinity with ADEI higher in LD- than in SD-acclimated mice
at low levels of salinity but not at higher levels (F1,103 = 4.42,
P = 0.034) (Fig. 1C).
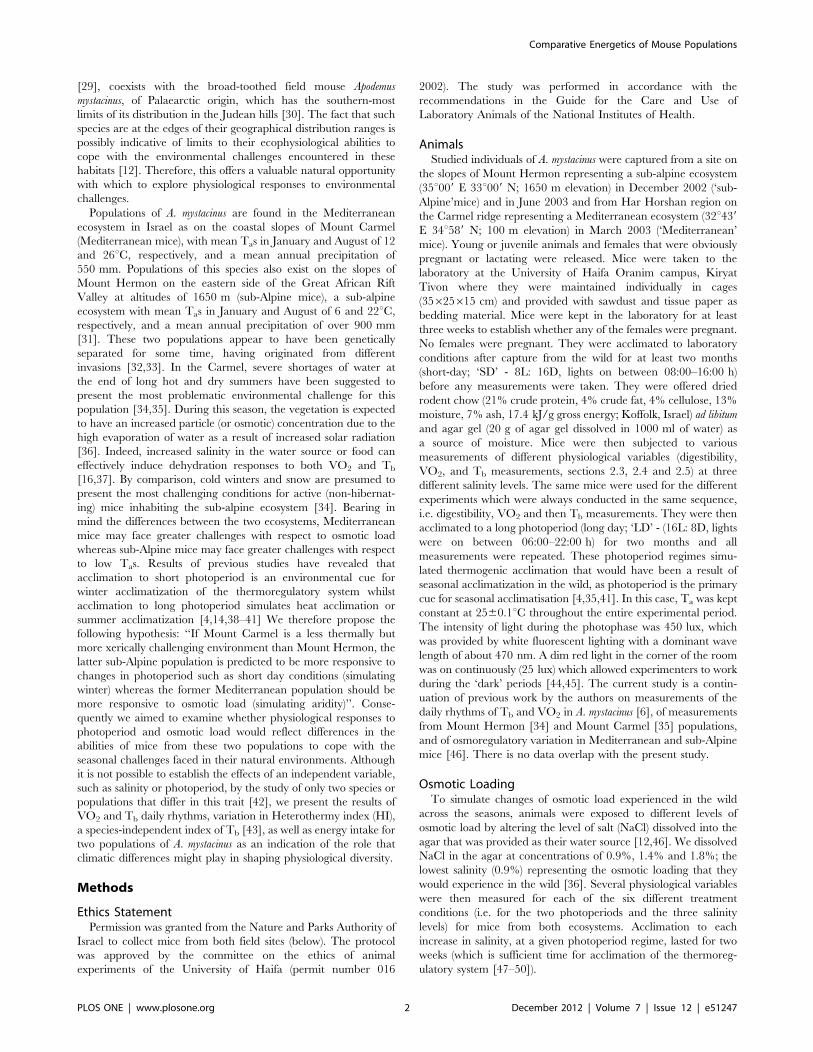
Daily Rhythms of Oxygen Consumption (VO2)There were differences in VO2 between populations under the
different challenges. Mesor values were significantly higher in
Comparative Energetics of Mouse Populations
PLOS ONE | www.plosone.org 3 December 2012 | Volume 7 | Issue 12 | e51247

Figure 1. Digestibility Experiments. (A) Dry matter intake (DMI: g/100 g Wb.day); (B) Digestible efficiency (DE) and (C) apparent digestibleenergy intake (ADEI: kJ/100 g Wb.day) of A. mystacinus at salinity regimes of 0.9, 1.4 and 1.8%. Open and dotted bars denote long-day (16L:8D)Mediterranean and sub-Alpine mice; dark bars and hashed bars denote short-day (16D:8L) Mediterranean and sub-Alpine mice, respectively. ‘‘/100 gWb.day’’ denotes per 100 g body mass per day. Error bars denote standard errors.doi:10.1371/journal.pone.0051247.g001
Comparative Energetics of Mouse Populations
PLOS ONE | www.plosone.org 4 December 2012 | Volume 7 | Issue 12 | e51247

Mediterranean- than sub-Alpine mice (F1,6 = 8.02, p = 0.050)
(Table 1, Fig. 2). Compared to mice exposed to long days, those
exposed to short days maintained higher VO2 values when given
water with high salinity than they did when given water with low
salinity (F1,6 = 32.82, p,0.001). By comparison, amplitude values
were significantly greater in Mediterranean than sub-Alpine mice
(F1,6 = 6.15, p = 0.048), however, there were no effects of
photoperiod or salinity (F1,6 = 0.19, p = 0.681; F1,6 = 0.08,
p = 0.932, respectively). Finally, acrophase also differed signifi-
cantly between populations (F1,6 = 8.89, p = 0.025); Mediterra-
nean-mice exhibited a VO2 peak at approximately 02:30 h while
sub-Alpine-mice showed a peak at approximately 00:45 h (Fig. 2).
Daily Rhythms of Body Temperature (Tb)Significant differences between populations under the different
photoperiod regimes and different salinity levels were noted in the
variables describing the Tb daily rhythms. Tb values were
significantly higher in sub-Alpine- than Mediterranean mice
(F1,7 = 19.93, p,0.001) (Fig. 3). Compared to mice exposed to
short days, those exposed to long days maintained warmer bodies
when given water with high salinity than they did when given
water with low salinity (F1,7 = 26.90, p,0.001). Under the
different salinity conditions acrophase responded significantly to
photoperiod in mice from both populations (F1,8 = 8.02,
p = 0.022). Mean HI value across all individuals was
0.45360.463uC. Compared with mice exposed to long days,
those exposed to short days maintained higher HI values when
given water with low salinity (0.9% and 1.4%) than they did when
given water with a high salinity (1.8%) (F1,116 = 8.31, p = 0.005).
Combined Energy Intake and Energy ExpenditureAverage daily energy intake (ADEI) calculated from food intake
and average daily energy expenditure (DEE) calculated from VO2
data were compared. Whilst there was no direct effect of habitat
under LD-acclimation, there was a significant effect of salinity with
mice from lower salinity regimes having a greater ADEI than those
from higher salinity regimes (F2,39 = 20.34, p,0.001) (Fig. 4A). By
comparison, under SD-acclimation, the effect of salinity was
weaker but mice from lower salinities continued to have greater
energy intakes than those under higher salinity regimes
(F2,19 = 4.49, p = 0.025) (Fig. 4B). The interaction between salinity
and habitat failed to reach significance (F2,19 = 2.90, p = 0.079).
This effect was caused primarily by the different responses of mice
on 1.8% salinity compared with mice on lower salinity regimes.
Post-hoc analyses revealed that, at 1.8% salinity and SD
conditions, there was a significant interaction between habitat
and photoperiod (F1,18 = 5.56, p = 0.030) with Mediterranean
mice having a higher energy expenditure relative to energy intake
than sub-Alpine mice.
Discussion
Variation in physiological capabilities between populations
inhabiting different environments has been suggested to provide
an insight into the dynamics of evolutionary changes [1,67].
Across different zoogeographical zones, there is a large corre-
sponding variation in small mammal energy metabolism [68,69].
Physiological variations within a population may allow adaptation
to environments differing in temperature, aridity and productivity
[70,71]. Comparing differences in the daily rhythms and
photoperiod-induced changes of physiological characteristics can
Table 1. Daily rhythms of oxygen consumption and body temperature.
CARMEL HERMON
SD LD SD LD
Salinity 0.9 1.4 1.8 0.9 1.4 1.8 0.9 1.4 1.8 0.9 1.4 1.8
n 7 7 9 8 8 8 13 9 12 11 6 11
body mass (g) 30.37 32.73 31.28 32.40 30.10 31.05 30.21 33.01 33.15 32.91 34.08 32.93
se 4.02 2.14 2.19 2.31 1.00 1.08 1.78 2.13 2.43 1.39 2.71 1.60
VO2 daily rhythms
n 5 6 5 7 7 7 7 7 7 8 8 8
Mesor (ml O2/g.h) 2.11 3.17 4.03 3.34 2.94 3.33 1.91 2.87 2.14 2.36 2.52 2.21
Amplitude (ml O2/g.h) 0.660 0.695 0.463 0.876 0.537 0.722 0.322 0.517 0.517 0.634 0.418 0.574
Acrophase 2:58 2:01 2:58 1:24 1:48 1:55 23:24 2:31 0:02 1:47 0:32 0:37
% rhythm 63.90 63.92 55.56 43.30 42.79 44.69 54.97 50.79 65.20 50.24 43.50 37.25
p value 0.05 0.02 0.10 0.04 0.03 0.02 0.05 0.03 0.15 0.05 0.002 0.02
Tb daily rhythms
n 8 10 11 9 8 8 13 11 12 11 11 11
Mesor (uC) 37.03 37.13 0.35 37.31 38.15 38.02 37.71 37.26 37.22 37.80 38.18 38.45
Amplitude (uC) 0.651 0.130 36.610 0.244 0.282 0.812 0.214 0.558 0.182 0.107 0.093 0.165
Acrophase 2:41 11:36 19:41 14:22 22:48 0:19 7:44 10:18 8:33 0:44 15:08 23:20
% rhythm 61.81 2.41 58.46 15.80 32.64 84.93 19.24 23.36 6.49 4.52 6.30 31.17
p value 0.01 0.91 0.03 0.60 0.31 0.003 0.36 0.35 0.76 0.87 0.83 0.33
Mean and standard errors (se) of body mass (g) as well as mesor, amplitude and acrophase values of oxygen consumption (VO2, mlO2/g.h) and body temperature (Tb,uC) daily rhythms of A. mystacinus from Mount Carmel (‘Carmel’) and Mount Hermon (‘Hermon’) acclimated to short day (SD, 16D: 8L) and long day (LD, 16L:8D)photoperiods and to salinity regimes of 0.9, 1.4 and 1.8%. Percent rhythm and probability (p values) of the goodness of fit of the cosine curve [63] are shown.doi:10.1371/journal.pone.0051247.t001
Comparative Energetics of Mouse Populations
PLOS ONE | www.plosone.org 5 December 2012 | Volume 7 | Issue 12 | e51247
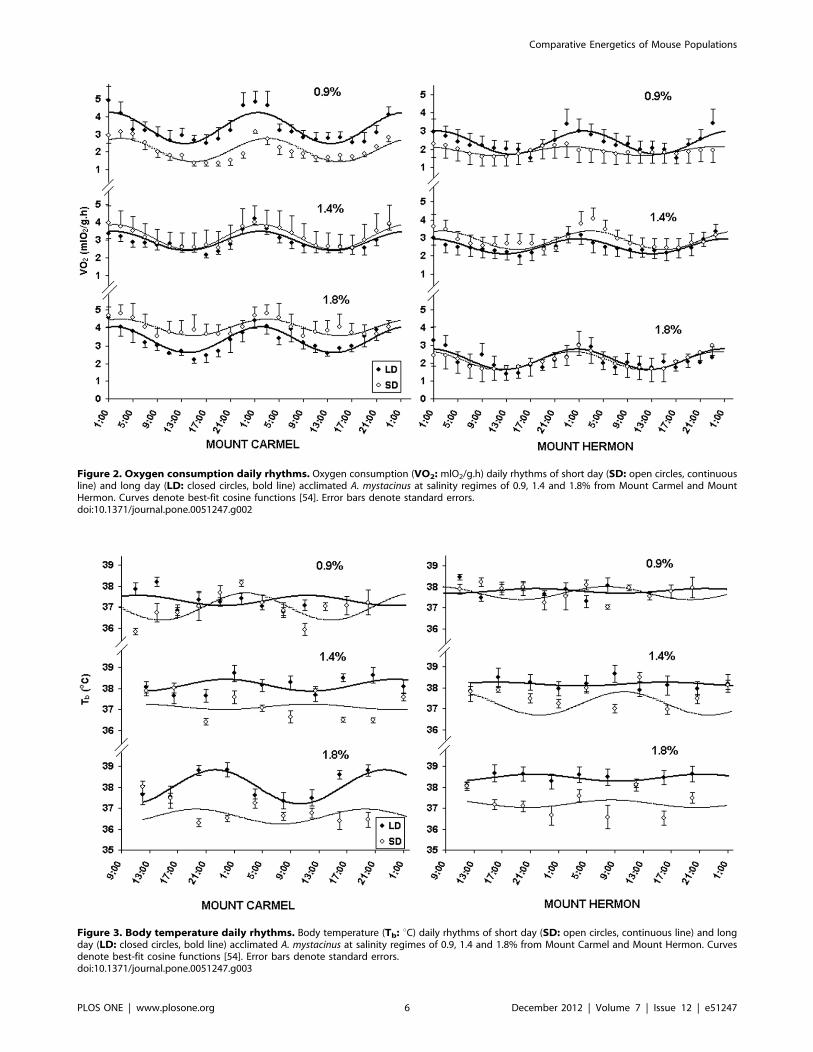
Figure 2. Oxygen consumption daily rhythms. Oxygen consumption (VO2: mlO2/g.h) daily rhythms of short day (SD: open circles, continuousline) and long day (LD: closed circles, bold line) acclimated A. mystacinus at salinity regimes of 0.9, 1.4 and 1.8% from Mount Carmel and MountHermon. Curves denote best-fit cosine functions [54]. Error bars denote standard errors.doi:10.1371/journal.pone.0051247.g002
Figure 3. Body temperature daily rhythms. Body temperature (Tb: uC) daily rhythms of short day (SD: open circles, continuous line) and longday (LD: closed circles, bold line) acclimated A. mystacinus at salinity regimes of 0.9, 1.4 and 1.8% from Mount Carmel and Mount Hermon. Curvesdenote best-fit cosine functions [54]. Error bars denote standard errors.doi:10.1371/journal.pone.0051247.g003
Comparative Energetics of Mouse Populations
PLOS ONE | www.plosone.org 6 December 2012 | Volume 7 | Issue 12 | e51247

add another important dimension, namely responses to a temporal
environment. Various studies have shown that changes in osmotic
loading can affect the VO2 and Tb of small mammal populations
from different habitats or ecosystems in different ways [12,16,35]
and that this variation might indicate physiological plasticity or
adaptation to local conditions [6,46]. In the current study, we used
two environmental signals - photoperiod and osmotic load - that
affect energy metabolism and body temperature regulation in
different ways. Our setup can therefore be considered: (1) when
both signals convey the same season (e.g. either ‘summer’ - LD and
high osmotic load or ‘winter’ - SD and no osmotic load), and (2)
where signals convey conflicting information (e.g. SD and high
osmotic load or LD and no osmotic load) (Table 2). The
interaction between these effects is of particular importance in
elucidating site-dependant differences in the sensitivity to these
signals, which may indicate population level differences in
physiological characteristics.
Energy IntakeThe general physiological response to increased osmotic load is
a reduction in food intake [72] which reduces stress on the kidneys
by decreasing urea secretion. In the current study, there were no
effects of salinity on body mass. However, we did note that A.
mystacinus could not maintain their body mass when offered
a salinity loading of 2.5% (M. Scantlebury and A. Haim
unpublished data). Hence, one can conclude that while 1.8%
osmotic loading did have a physiological effect on the mice, the
maximum osmotic load chosen may not have been reached. For
both populations, DMI and ADEI decreased with increasing
salinity, confirming the expected response. However, there was
also an interaction between photoperiod and salinity for DE and
ADEI. LD-mice had greater DE values at the low salinity whereas
SD-mice had greater DE values at the highest salinity. In general,
animals living in less productive environments have an increased
digestive efficiency, compared with those from more productive
environments [22]. There were differences in the rates and
digestive efficiency between populations of common spiny mice
acclimatised to different seasons and acclimated to different
photoperiod regimes [73,74]. The fact that SD-mice in the current
study were able to increase DE at a higher salinity load suggests
that they were able to conserve energy by utilising the food source
more efficiently and conserve water by decreasing faecal output
[74]. However, the fact that LD-mice decreased their DE with
increasing salinity suggests that they may have reduced water loss
in other avenues, for example by producing dryer faeces, by
dissipating more heat through non-evaporative routes or by
increasing the efficiency of their kidneys [46]. Hence, the LD
signal can be presumed to ‘prepare’ mice for the dry season, which
is characterised by water limitations and osmotic load [41].
Indeed, under the two higher salinities, LD-mice had significantly
higher mesor values of Tb than SD-mice (Fig. 3).
Daily Energy Expenditure (DEE)In a previous study in which the VO2 daily rhythms of
Mediterranean-mice were measured under a photoperiod of
12L:12D at their lower critical temperature and fresh carrots
provided as a water source [6], the mesor values obtained (2.89
mlO2/g.h) were similar to those of SD and LD-mice when they
were kept on 1.4% NaCl. Of note is that salinity had a large effect
on SD-mice (Fig. 2). In particular, increasing salinity resulted in
increased VO2 values in SD Mediterranean-mice whereas no such
change was observed in LD-mice. This may be because SD is the
environmental signal for water availability in Mount Carmel,
which results in an expected reduction in osmotic load [46].
However, when photoperiod and salinity signals were presented in
opposing directions (i.e. SD and high salinity) the response of mice
was an increase in energy expenditure. It can be presumed that
this shows a potential energetic cost of osmoregulation for mice not
‘accustomed’ to dealing with these ‘confusing’ conditions. In the
case of sub-Alpine mice, a smaller increase in VO2 was noted
when salinity was increased under SD-acclimation compared with
Mediterranean mice. One possibility why sub-Alpine mice had
a reduced response to photoperiod might be that temperature is
a more important environmental cue for them than salinity.
Results of a previous study on A. mystacinus showed that sub-
Alpine-mice exhibited a higher resistance to cold and significantly
higher VO2 values upon exposure to low ambient temperature
compared with Mediterranean-mice [34]. This would make sense
Figure 4. Energy intake and energy expenditure. Energy intake(Apparent digestible energy intake, ADEI, kJ/100 g Wb.day) measuredby food intake and faecal output against energy expenditure (DEE, kJ/100 g Wb.day) measured by oxygen consumption for Mount Carmel(MC) and Mount Hermon (MH) A. mystacinus acclimated to (A) longday (LD; 16L:8D) and (B) short day (SD; 16D: 8L) photoperiod regimes.0.9% salinity MC mice are denoted by solid squares and a solid line (‘a’);0.9% salinity MH mice are denoted by open squares and a dotted line(‘b’); 1.8% salinity MH mice are denoted by open circles and a hashedline (‘c’) and 1.8% salinity MC mice are denoted by solid circles anda dot-hashed line (‘d’). ‘‘/100 g Wb.day’’ denotes per 100 g body massper day.doi:10.1371/journal.pone.0051247.g004
Comparative Energetics of Mouse Populations
PLOS ONE | www.plosone.org 7 December 2012 | Volume 7 | Issue 12 | e51247

as the environment in Mount Hermon is manifest as greater
seasonal variability in Ta compared with that of Mount Carmel.
The lack of response to photoperiod observed in sub-Alpine-mice
could therefore be due in part to lack of exposure to low Tas (at or
below 6uC).
Interestingly, Mediterranean-mice had greater amplitudes of
variation than sub-Alpine-mice (Fig. 2). One possibility might be
that Mediterranean mice were attempting to conserve water and
energy by reducing the Tb-to-Ta gradient [60] suggesting that
Mediterranean mice might be more suited to live in conditions
with high osmotic load. Finally, there were differences in
acrophase between the two populations with sub-Alpine mice
peaking in VO2 earlier in the dark phase than Mediterranean
mice, indicating differences in activity patterns (Fig. 2). These
differences could emerge for several reasons, both biotic and
abiotic. For example, A. mystacinus on Mount Carmel coexist with
the competitively superior common spiny mouse Acomys cahirinus
that has been suggested to lead to temporal exclusion [75]. It is
also possible that differences in acrophase occur because there are
differences in Ta values between the habitats - i.e. as nocturnal
animals; sub-Alpine-mice might be active earlier than Mediterra-
nean mice, before the night becomes too cold.
Balance of Energy Intake and Energy ExpenditureThere were differences in energy flux between the different
groups of mice. This can be seen as differences in the gradients of
the graphs describing the relationships between ADEI and DEE
under LD acclimation (Fig. 4). Under SD and a high salinity load,
the gradient [i.e. delta (X)/delta (Y)] between ADEI and DEE
increased and mice expended more energy relative to food intake,
whereas the opposite was true for a low salinity load. If it is
assumed that activity was independent of salinity, then one
possibility is that the kidneys utilised energy to process the high
levels of salt intake. This was more notable for SD-mice, which as
previously suggested, may not be ‘expecting’ osmotic load under
this photoperiod.
Body Temperature Daily RhythmsBody temperature daily rhythms are an outcome of two
different other rhythms, namely heat production and heat
dissipation and are suggested to be related to feeding and activity
patterns [6,76,77]. Short photoperiod acclimated fat jirds (Meriones
crassus) had longer periods of maximal Tb compared with long
photoperiod acclimated individuals under the same Ta, which was
interpreted as an adaptation enabling jirds to forage for longer
periods during the winter [14]. Similarly, Rubal et al. [6]
suggested that higher Tb values for a longer period within the
24 h cycle indicated adaptation to a cooler environment in A.
mystacinus. The results of the current study can be compared with
those obtained earlier on A. mystacinus from Mount Carmel and
Mount Hermon populations in which mice were not challenged
with photoperiod manipulations [6] or salinity [34,35]. Values
obtained for Mediterranean mice for both photoperiod regimes
under a salinity of 0.9% were significantly lower than those
obtained previously (38.4460.06uC) [6] (p,0.001 for both LD
and SD acclimation). Sub-Alpine mice in the current study also
had lower values than sub-Alpine mice acclimated to 12L:12D at
the same ambient temperature [34]. However, for both popula-
tions, the values of LD-acclimated mice at 1.4% and 1.8% were
similar to those that appear in literature [6,34]. The reasons why
salinity may be linked to Tb may emerge from the fact that LD
conditions co-occur with increasing salinity (osmolality or partic-
ulate matter) in food items and higher Ta’s. Hence, by providing
opposing signals to mice (e.g. high salinity under SD conditions)
one ‘confuses’ their thermoregulatory system. The higher Tb
values noted in LD-mice under high salinity of both populations
may confer an advantage for heat dissipation under restricted
water conditions. However, SD-mice did not increase their Tb
values with increasing salinity. This can be understood in terms of
their inability to raise Tb in order to dissipate heat at a time of the
year (i.e. short photoperiod conditions representing winter) when
water deprivation and osmotic load do not co-occur. Interestingly,
at 1.8% salinity, LD sub-Alpine mice did not show a Tb daily
Table 2. Expected ambient conditions for each treatment.
Photoperiod Habitat Expected Expected Expected Salinity Conflicting
Ta aridity osmolarity regime signal
Short day Mediterranean Cool mesic/wet low 0.9 No
low 1.4
low 1.8 Yes*
sub-Alpine Cold freezing low 0.9 No
low 1.4
low 1.8 Yes*
Long day Mediterranean Hot arid high 0.9 Yes**
high 1.4
high 1.8 No
sub-Alpine Hot arid high 0.9 Yes**
high 1.4
high 1.8 No
Expected conditions of ambient temperature (Ta), aridity, and osmolarity of the food source for Mount Carmel (Mediterranean) and Mount Hermon (sub-Alpine) miceexposed to short day (winter) and long day (summer) conditions. The laboratory conditions of short day (8L:16D) and long day (16L:8D) and salinity regimes of thedrinking water source (0.9%, 1.4% and 1.8%) present mice with environmental signals which can either represent what occurs in the wild, in which case theenvironmental signals are not conflicting (No); or they can represent different conditions to what the mice experience in the wild, in which case the environmentalsignals are conflicting (Yes). * indicates a potentially stressful situation as mice do not expect a high salinity load; ** indicates a potentially stressful situation as mice donot expect a low salinity load.doi:10.1371/journal.pone.0051247.t002
Comparative Energetics of Mouse Populations
PLOS ONE | www.plosone.org 8 December 2012 | Volume 7 | Issue 12 | e51247

rhythm pattern whilst LD Mediterranean mice had a clear
pattern. This is consistent with previous studies which show that
both seasonal acclimatization (July) and acclimation to LD resulted
in arrhythmic Tb daily rhythms in Mediterranean mice with no
water stress [35]. A possible interpretation of the fact that a high
salinity signal resulted in a clear daily rhythm pattern only for
Mediterranean mice is that salinity is likely to be a more important
cue for challenging Mediterranean mice; whereas, as previously
mentioned, other cues such as low temperature could be more
important for sub-Alpine mice. Finally, both photoperiod and
salinity had a significant effect on HI. Observed values were
greater in SD than LD-acclimated individuals at lower levels of
salinity, but greater in LD than SD-acclimated individuals at the
highest level of salinity. This is consistent with the notion that
animals are able to increase Tb variation when they are
experiencing realistic ‘winter’ or SD conditions (i.e. SD and low
salinity) or realistic ‘summer’ or LD conditions (i.e. LD and high
salinity) but are less able to effect Tb variation when the ambient
conditions are conflicting (i.e. SD and high salinity or LD and low
salinity).
ConclusionsDaily rhythms of thermoregulatory variables of two populations
of mice from different ecosystems separated by the Great African
Rift Valley were assessed for their responses to photoperiod and
osmotic load. Mediterranean mice were more responsive to
osmotic load than sub-Alpine mice, with salinity acting as a clear
signal for changes in Tb daily rhythms and an increase of VO2.
This indicates that Mediterranean mice may be able to respond to
and cope with variations in osmotic load whereas sub-Alpine mice
may be more sensitive to and able to cope with variations in
ambient temperature [34]. In addition, LD-mice behaved
differently to SD-mice upon exposure to increased salinity, with
the former appearing to adopt mechanisms to reduce energy
expenditure and water loss. Under LD-acclimation, mice were
able to cope better with osmotic load which they may have been
‘expecting’ as a stressor.
The links between physiological adaptation and species
distribution have received particular interest in the light of climate
change and the requirements for prediction of future biodiversity
[68,78,79]. Bacigalupe et al. [80] suggest that it is important to
consider how the thermal environment may shape inter-popula-
tion differences in physiology over evolutionary time. The results
of our study highlight how daily rhythms of energy expenditure
and Tb may vary across populations of the same species as a result
of differences in photoperiod and water stress. Whilst we are aware
that phenotypic plasticity may account for many of the differences
noted between the populations, intraspecific comparisons such as
this can be seen as a first approach towards understanding whether
differences in traits can be adaptive.
Acknowledgments
We are grateful to JWH Ferguson for providing advice on the cosinor
analysis, to Ruth Kelly for advice using R, and to H. Kunk for helpful
comments on a previous version of the manuscript. We would like to thank
the animal house staff at Oranim, in particular D. Rozenband, for looking
after the animals. L. Buckley provided valuable help with the Laboratory
work. JWHF designed the software used in analysis and DR looked after
the animals. The experiments in this study complied with the current laws
and regulations in Israel.
Author Contributions
Conceived and designed the experiments: MS AH. Performed the
experiments: MS AH. Analyzed the data: MS AH. Contributed
reagents/materials/analysis tools: AH. Wrote the paper: MS AH.
Designed software used in analysis: JWHF
References
1. Bartholomew GA (1987) Interspecific comparison as a tool for ecological
physiologists. In: Feder ME, Bennett AF, Burggren WW, Huey RB, editors. New
directions in ecological physiology. Cambridge: Cambridge University Press.
11–37.
2. McNab BK (2002) The Physiological Ecology of Vertebrates: A View from
Energetics. Ithaca New York: Cornell University Press.
3. Wilmer P, Stone G, Johnston I (2005) Environmental Physiology of Animals.
Oxford UK: Blackwell.
4. Heldmaier G, Steinlechner S, Ruf T, Wiesinger H, Klingenspor M (1989)
Photoperiod and thermoregulation in vertebrates: body temperature rhythms
and thermogenic acclimation. J Biol Rhythms 4: 251–265.
5. Refinetti R, Menaker M (1992) The circadian rhythm of body temperature.
Physiol Behav 51: 613–637.
6. Rubal A, Choshniak I, Haim A (1992) Daily rhythms of metabolic rate and body
temperature of two murids form extremely different habitats. Chronobiol Int 9:
341–349.
7. Morgan E (2004) Ecological significance of biological clocks. Biol Rhythm Res
35: 3–12.
8. Geiser F, Baudinette RV (1987) Seasonality of torpor and thermoregulation in
three dasyurid marsupials. J Comp Physiol B 157: 335–344.
9. Haim A, Shanas U, Zubidad AE, Scantlebury M (2005) Seasonality and Seasons
Out of Time - The Thermoregulatory Effects of Light Interference. Chronobiol
Int 22: 59–66.
10. Angilletta MJ, Cooper BS, Schuler MS, Boyles JG (2010) The evolution of
thermal physiology in endotherms. Front Biosci E2: 861–881.
11. Haim A, Heth G, Avnon Z, Nevo E (1984) Adaptive physiological variation in
nonshivering thermogenesis and its significance in speciation. J Comp Physiol B
154: 145–147.
12. Scantlebury M, Afik D, Shanas U, Haim A (2002) Comparative non-shivering
thermogenesis in adjacent populations of the common spiny mouse (Acomys
cahirinus) from opposite-slopes: the effects of increasing salinity. J Comp Physiol B
172: 1–5.
13. Scantlebury M, Shanas U, Kupshtein H, Speakman JR, Haim A (2004)
Differential energy costs of winter acclimatized common spiny mice Acomys
cahirinus from two adjacent habitats. Comp Biochem Physiol A 137: 419–423.
14. Haim A, Levi G (1990) Role of body temperature in seasonal acclimatization:photoperiod-induced rhythms and heat production in Meriones crassus. J Exp Zool
256: 237–241.
15. Weissenberg S, Shkolnik A (1994) Metabolic rate and water economy in thedesert and Mediterranean popoulations of the common spiny mouse (Acomys
cahirinus) in Israel. Isr J Zool 40: 135–143.
16. Shanas U, Afik D, Scantlebury M, Haim A (2002) The effects of season anddietary salt content on body temperature daily rhythms of common spiny mice
from different micro-habitats. Comp Biochem Physiol A 132: 287–295.
17. Shanas U, Afik D, Scantlebury M, Haim A (2003) Differential osmoregulatorycapabilities of common spiny mice (Acomys cahirinus) from adjacent microhabitats.
J Zool Lond 261: 7–13.
18. Bozinovic F, Rosenmann M (1989) Maximum metabolic rate of rodents:physiological and ecological consequences of distributional limits. Func Ecol 3:
173–181.
19. Wang D-H, Pei Y-X, Yang J-C, Wang Z-W (2003) Digestive tract morphology
and food habits in six species of rodents. Folia Zool 52: 51–55.
20. Haim A (1987) Metabolism and thermoregulation in rodents: are these
adaptations to habitat and food quality? South Afr J Sci 83: 639–642.
21. McNab BK (1989) Laboratory and field studies of the energy expenditure of
endotherms – a comparison. TREE 4: 111–112.
22. Mueller P, Diamond J (2001) Metabolic rate and environmental productivity:
well provisioned animals evolved to run and idle fast. Proc Natl Acad Sci U S A
98: 12550–12554.
23. Gross JE, Wang Z, Wunder BA (1985) Effects of food quality and energy needs:changes in gut morphology and capacity of Microtus ochrogaster. J Mamm 66: 661–
667.
24. Speakman JR (2000) The cost of Living: field metabolic rates of small mammals.In: Fitter AH, Rafaelli DG, editors. Advances in Ecological Research. London:
Academic Press.
25. Li X, Wang D (2005) Seasonal adjustments in body mass and thermogenesis inMongolian gerbils (Meriones unguiculatus): the roles of short photoperiod and cold.
J Comp Physiol B 175: 593–600.
26. Tchernov E, Yom-Tov Y (1988) Zoogeography of Israel. In: Yom-Tov Y,Tchernov E, editors. The Zoogeography of Israel, The distribution and
abundance at a zoogeographical crossroad. Dordrecht, The Netherlands. WJunk publishers.
Comparative Energetics of Mouse Populations
PLOS ONE | www.plosone.org 9 December 2012 | Volume 7 | Issue 12 | e51247

27. Goldreich Y (2003) The Climate of Israel: Observation, Research, and
Application. New York: Springer.28. Mendelssohn H, Yom-Tov Y (1999) Fauna Palaestina Mammalia of Israel.
Jerusalem, Israel: Academy of Sciences Keterpress. 366–373 p.
29. Bates PJJ (1994) The distribution of Acomys (Rodentia: Muridae) in Africa andAsia. Israel J Zool 40: 199–214.
30. Harrison DL, Bates PJJ (1991) The mammals of Arabia, second ed. Sevenoaks,Kent, UK: Harrison Zoologica Museum Lakeside Printing. 354 p.
31. Jaffe S (1988) Climate of Israel. In: Yom-Tov Y, Tchernov E, editors. The
Zoogeography of Israel: distribution and abundance at a zoological crossroad.Dordrecht, The Netherlands: W Junk Publishers.
32. Vohralık V, Frynta D, Mikulova P, Nova P (2002) Multivariate morphometricsof Apodemus mystacinus in the Near East and its divergence from European A. m.
epimelas (Mammalia: Rodentia). Isr J Zool 48: 135–148.33. Nir R (2006) Comparative ecophysiology and RAPD analysis of two populations
of Apodemus sylvaticus in the Golan Heights and the Galil mountains. Isr J Ecol
Evol 52: 74–75.34. Haim A, Rubal A, Harari J (1993) Comparative thermoregulatory adaptations
of field mice of the genus Apodemus to habitat challenges. J Comp Physiol B 163:602–607.
35. Haim A, Rubal A (1994) Seasonal acclimatization of daily rhythms of body
temperature in two rodent species of different origins inhabiting Mediterraneanwoodland. Polish Ecol Stud 20: 357–363.
36. Grammatikopoulos G (1999) Mechanisms for drought tolerance in twoMediterranean seasonal dimorphic shrubs. Aust J Plant Physiol 26: 587–593.
37. Ron U, Haim A (2001) How dehydration affects the thermoregulatory andosmoregulatory abilities of the golden spiny mouse Acomys russatus. Isr J Zool 47:
15–29.
38. Lynch GR (1970) Effect of photoperiod and cold acclimation on non-shivering,thermogenesis in Peromyscus leucopus. Am Zool 10: 308.
39. Haim A (1982) Effects of long scotophase and cold acclimation on heatproduction in two diurnal rodents. J Comp Physiol B 148: 77–81.
40. Haim A, Yahav S (1982) Non-shivering thermogenesis in winter-acclimatized
and in long-scotophase and cold-acclimated Apodemus mystacinus (Rodentia).J Therm Biol 7: 193–195.
41. Banin D, Haim A, Arad Z (1994) Metabolism and thermoregulation in theLevant vole Microtus guentheri: the role of photoperiodicity. J Therm Biol 19: 55–
62.42. Garland T, Adolph SC (1994) Why not do 2-species comparative-studies:
Limitations on inferring adaptation. Physiol Zool 67: 797–828.
43. Boyles JG, Smit B, McKechnie AE (2010) A new metric for estimatingheterothermy in endotherms. Physiol Biochem Zool 84: 115–123.
44. Neuman A, Gothilf Y, Haim A, Ben-Aharon G, Zisapel N (2005) Nocturnalpatterns and up-regulated excretion of melatonin metabolite 6-sulfatoxymela-
tonin in the diurnal rodent Psammomys obesus post-weaning under a short
photoperiod, Comp Biochem Physiol A 142: 297–307.45. Workman JL, Trainor BC, Sima Finy M, Nelson RJ (2008) Inhibition of
neuronal nitric oxide reduces anxiety-like responses to pair housing. Behav BrainRes 187: 109–115.
46. Scantlebury M, Shanas U, Or-Chen K, Haim A (2009) Osmoregulatory traits ofbroad-toothed field mouse (Apodemus mystacinus) populations from different
habitats. Comp Biochem Physiol A 154: 551–556.
47. Haim A, McDevitt RM, Speakman JR (1995) Thermoregulatory responses tomanipulations of photoperiod in wood mice Apodemus sylvaticus from high
latitudes (57uN). J Therm Biol 20: 437–443.48. Klingenspor M, Ivemeyer M, Weisinger H, Haas K, Heldmaier G, et al. (1996)
Biogenesis of thermogenic mitochondria in brown adipose tissue of Djungarian
hamsters during cold adaptation. Biochem J 316: 607–613.49. Geiser F, Drury RL, McAllan BM, Wang DH (2003) Effects of temperature
acclimation on maximum heat production, thermal tolerance, and torpor ina marsupial J Comp Pyhsiol B 173: 437–442.
50. Zhang X, Wang D (2006) Energy metabolism, thermogenesis and body mass
regulation in Brandt’s voles (Lasiopodomys brandtii) during cold acclimation andrewarming. Horm Behav 50: 61–69.
51. Angel SK, Wicklow DT (1974) Decomposition of Rabbit Faeces: An Indicationof the Significance of the Coprophilous Microflora in Energy Flow Schemes.
J Ecol 62: 429–437.52. Haim A, Van Aarde RJ, Skinner JD (1990) Metabolism and thermoregulation in
the Cape porcupine Hystrix africaeaustralis. Physiol Zool 63: 795–802.
53. Depocas F, Hart JS (1957) Use of Pauling oxygen analyzer for measurements ofoxygen consumption of mammals in open circuit system and in short lag, closed
circuit apparatus. J Appl Physiol 20: 388–392.
54. Hill RW (1972) Determination of oxygen consumption by use of theparamagnetic oxygen analyzer. J Appl Physiol 33: 261–263.
55. Zubidat AE, Ben-Schlomo R, Haim A (2007) Thermoregulatory and endocrine
responses to light pulses in short-day acclimated social voles (Microtus socialis).
Chronobiol Int 24: 269–288.
56. Zubidat AE, Nelson RJ, Haim A (2010) Differential effects of photophase
irradiance on metabolic and urinary stress hormone concentrations in ‘blind’
and sighted rodents. Chronobiol Int 27: 487–516.
57. Bennett NC, Clarke BC, Jarvis JUM (1992) A comparison of metabolic
acclimation in two species of social mole-rats (Rodentia: Bathyergidae) in
southern Africa. J Arid Environ 22: 189–98.
58. Haim A, McDevitt RM, Speakman JR (1995) Daily variations in the response ofwood mice Apodemus sylvaticus to noradrenaline. J Exp Biol 198: 561–565.
59. Adams CS, Korytko AI, Blank JL (2001) A novel mechanism of body mass
regulation. J Exp Biol 204: 1729–1734.
60. Haim A, Zisapel N (1995) Oxygen consumption and body temperature rhythms
in the golden spiny mouse, response to changes in day length. Physiol Behav 58:
775–778.
61. IBM Corp. (2012) IBM SPSS Statistics for Windows, Version 21.0. Armonk,NY: IBM Corp.
62. Nelson W, Tong YL, Lee J-K, Halberg F (1979) Methods for cosinor
rhythmicity. Chronobiologica 6: 305–323.
63. Minors DS, Waterhouse JM (1989) Analysis of biological time series. In: Arendt
J, Minors DS, Waterhouse JM, editors. Biological Rhythms in Clinical Practice.
London: Wright. 272–293.
64. Peek MS, Russek-Cohen E, Wait DA, Forseth IN (2002) Physiological responsecurve analysis using nonlinear mixed models. Oecologia. 132: 175–180.
65. Zuur AF, Ieno EN, Walker NJ, Saveliev AA, Smith GM (2009) Mixed effects
models and extensions in ecology with R. New York: Springer.
66. R Development Core Team (2009) R: A language and environment for
statistical computing. R Foundation for Statistical Computing, Vienna, Austria.
ISBN 3–900051–07–0, URL http://www.R-project.org.
67. Jorgensen CB (1983) Ecological physiology, background and prespective. CompBiochem Physiol A 75: 5–7.
68. Humphries MM, Thomas DW, Speakman JR (2002) Climate-mediated
energetic constraints on the distribution of hibernating mammals. Nature 418:313–316.
69. Lovegrove BG (2000) The zoogeography of mammalian basal metabolic rate.
Am Nat 156: 201–219.
70. Haim A, Borut A (1981) Heat production and dissipation in Golden spiny mouseAcomys russatus from two extreme habitats. J Comp Physiol B 142: 445–450.
71. Scantlebury M, Afik D, Shanas U, Kupstein H, Haim A (2003) Energetics and
water economy of two populations of the common spiny mouse (Acomys cahirinus)from adjacent habitats. Func Ecol 17: 178–185.
72. Palgi N, Haim A (2003) Thermoregulatory and osmoregulatory responses to
dehydration in the bushy-tailed gerbil Sekeetamys calurus. J Arid Environ 55: 727–736.
73. Haim A, Afik D, Shanas U (2001) Thermoregulatory and metabolic responses to
photoperiod manipulations in a mesic population of the common spiny mouse,Acomys cahirinus. In: Denys C, Granjon L, Poulet A, editors. Proceedings of the
8th International Symposium on African Small Mammals, July 1999. Paris: IRDEditions. 365–376.
74. Scantlebury M, Shanas U, Afik D, Haim A (2005) Comparative seasonal
acclimatization of food and energy consumption in adjacent populations of thecommon spiny mouse Acomys cahirinus. J Zool Lond 267: 1–6.
75. Wube T, Haim A, Fares F (2008) Reproductive response of xeric and mesic
populations of the spiny mouse Acomys to photoperiod acclimation. J Arid
Environ 72: 440–447.
76. Aschoff J (1982) The circadian rhythms of body temperature as a function of
body size. In: Taylor CR, Johanson K, Bolis L, editors. A Companion to Animal
Physiology. Cambridge: Cambridge University Press. 173–188.
77. Ingram DL, Dauncey MJ (1985) Circadian rhythms in the pig. Comp. Biochem.
Physiol. A 82: 1–5.
78. Walther G-R, Post E, Convey P, Menzel A, Parmesan C, et al. (2002) Ecological
responses to recent climate change. Nature 416: 389–395.
79. Buckley LB (2008) Linking traits to energetics and population dynamics to
predict lizard ranges in changing environments. Am Nat 171: E1–E19.
80. Bacigalupe LD, Nespolo RF, Opazo JC, Bozinovic F (2004) Phenotypicflexibility in a novel thermal environment: phylogenetic inertia in thermogenic
capacity and evolutionary adaptation in organ size. Physiol Biochem Zool 77:
808–815.
Comparative Energetics of Mouse Populations
PLOS ONE | www.plosone.org 10 December 2012 | Volume 7 | Issue 12 | e51247