environmental characterization report st. joseph wind energy project · 2019-08-02 · st. joseph...
TRANSCRIPT

Environmental Characterization Report St. Joseph Wind Energy Project
Prepared for: Bowark Energy Ltd.
c/o Helimax Energy Inc. 4100 Molson Street #100
Montréal, QC H1Y 3N1
Project No. 0745 Date: July 22, 2008

50 Westmount Rd. N., Unit 230, Waterloo, Ontario, N2L 2R5 Tel: (519) 725-2227 Fax: (519) 725-2575 Web: www.nrsi.on.ca
Environmental Characterization Report St. Joseph Wind Energy Project
Project Team:
Staff Role David Stephenson Project Supervisor/Senior Biologist Andrew Ryckman Terrestrial Biologist Jessica Grealey Terrestrial Biologist Susan Coleman-Smith Terrestrial Biologist Andrew Schiedel Aquatic Biologist Nathan Badger GIS Coordinator Shawn MacDonald GIS Technician
Report submitted on July 22, 2008
________________________________
David E. Stephenson

TABLE OF CONTENTS 1.0 Introduction ........................................................................................................... 1 2.0 Study Area ............................................................................................................ 2 3.0 Soils, Terrain and Drainage .................................................................................. 4 4.0 Vegetation ............................................................................................................ 5
4.1 Natural Areas ........................................................................................................ 5 4.2 Study Methodology ............................................................................................... 5 4.3 Results ................................................................................................................. 5 4.4 Significant Species ............................................................................................... 6
5.0 Birds ..................................................................................................................... 8 5.1 Introduction ........................................................................................................... 8 5.2 Daytime Migration Monitoring ............................................................................... 8
5.2.1 Study Methodology .................................................................................... 8 5.2.2 Results ..................................................................................................... 12
5.2.2.1 Spring 2007 ...................................................................................... 12 5.2.2.2 Fall 2007 ........................................................................................... 19 5.2.2.3 Spring 2008 ...................................................................................... 26
5.3 Diurnal Raptor Monitoring ................................................................................... 31 5.3.1 Study Methodology .................................................................................. 31 5.3.2 Results ..................................................................................................... 32
5.4 Breeding Birds .................................................................................................... 34 5.4.1 Study Methodology .................................................................................. 34 5.4.2 Results ..................................................................................................... 35
5.5 Lek Surveys ........................................................................................................ 39 5.5.1 Study Methodology .................................................................................. 39 5.5.2 Results ..................................................................................................... 39
5.6 Significant Species ............................................................................................. 40 5.7 Partners in Flight Priority Species ....................................................................... 43 5.8 Aerial Flight Displays .......................................................................................... 45 5.9 Significant Bird Areas ......................................................................................... 45 5.10 Discussion .......................................................................................................... 45
6.0 Bats .................................................................................................................... 47 6.1 Introduction ......................................................................................................... 47 6.2 Study Methodology ............................................................................................. 47 6.3 Results ............................................................................................................... 51
6.3.1 Spring Migration ....................................................................................... 54 6.3.2 Summer Swarming and Fall Migration ...................................................... 54
6.4 Significant Species ............................................................................................. 59 6.5 Discussion .......................................................................................................... 59
7.0 Mammals ............................................................................................................ 61 7.1 Significant Species ............................................................................................. 61
8.0 Herpetofauna ...................................................................................................... 64 8.1 Study Methodology ............................................................................................. 64 8.2 Results ............................................................................................................... 66 8.3 Significant Herpetofaunal Species ...................................................................... 67
9.0 Butterflies ........................................................................................................... 68 10.0 Aquatic Habitats .............................................................................................. 69

10.1 Introduction ......................................................................................................... 69 10.2 Study Methodology ............................................................................................. 69 10.3 Results ............................................................................................................... 70
10.3.1 Aquatic Habitat ......................................................................................... 70 10.3.2 Fish Community ....................................................................................... 73 10.3.3 Significant Species ................................................................................... 74
11.0 Summary ........................................................................................................ 76 12.0 References...................................................................................................... 81
List of Tables Table 1. Description of Vegetation Communities ............................................................ 6 Table 2. Daytime Migration Monitoring Station Locations ............................................... 8 Table 3. Average Utilization Rates (birds/ha/min) by Station and Date for Spring 2007 16 Table 4. Average Utilization Rate (birds/ha/m) by Station and Height Category for
Spring 2007 ............................................................................................................ 16 Table 5. Average Utilization Rates by Height Category by Time of Day for Spring 2007
............................................................................................................................... 17 Table 6. Average Utilization Rates (birds/ha/min) by Station and Date for Fall 2007 .... 23 Table 7. Average Utilization Rate (birds/ha/min) by Station and Height Category ......... 23 Table 8. Average Utilization Rates by Height Category by Time of Day for Fall 2007 ... 24 Table 9. Average Utilization Rate (birds/ha/m) by Station and Height Category for Spring
2008 ....................................................................................................................... 29 Table 10. Average Utilization Rates by Height Category by Time of Day for Spring 2008
............................................................................................................................... 29 Table 11. Raptor Observations in the St. Joseph Study Area ....................................... 34 Table 12. Observations During Breeding Bird Surveys by Bird Group .......................... 36 Table 13. Number of Individual Birds Observed by Habitat Type and Station ............... 38 Table 14. Significant Bird Species of the Lake Manitoba Plain Ecoregion .................... 41 Table 15. Priority Landbirds in Bird Conservation Region 11 ........................................ 44 Table 16. Significant Mammal Species with Range Maps that Overlap with the Study
Area ........................................................................................................................ 63 Table 17. Descriptions of Amphibian Monitoring Station Locations ............................... 64 Table 18. Amphibian Species Present During the 2007 Call Surveys by Station .......... 66 Table 19. Fish Collection Records for Buffalo Cr., Plum R., and Rivière aux Marais ..... 73

List of Figures Figure 1. St. Joseph Wind Farm Study Area................................................................... 3 Figure 2. Vegetation Communities ................................................................................. 7 Figure 3 Bird Monitoring Stations ................................................................................... 9 Figure 4. Relative Abundance of Bird Groups During the Spring Monitoring Period..... 13 Figure 5. Average Utilization Rates by Date for the Spring Monitoring Period. ............. 14 Figure 6. Average Utilization Rates for Spring 2007 by Time of Day and Station .......... 15 Figure 7. Spring 2007 Flight Directions and Percentages for Station BMM-001 ............ 17 Figure 8. Spring Flight 2007 Directions and Percentages for Station BMM-002 ............ 17 Figure 9. Spring 2007 Flight Directions and Percentages for Station BMM-003 ........... 18 Figure 10. Spring 2007 Flight Directions and Percentages for Station BMM-004 ........... 18 Figure 11. Relative Abundance of Bird Groups during the Fall Monitoring Period. ........ 19 Figure 12. Average Utilization Rates by Date for the Fall Migration Monitoring Period. 21 Figure 13. Average Utilization Rate for Fall 2007 by Station and Time of Day .............. 22 Figure 14. Fall 2007 Flight Directions and Percentages for Stations BMM-001 ............ 24 Figure 15. Fall 2007 Flight Directions and Percentages for Stations BMM-002 ............ 24 Figure 16. Fall 2007 Flight Directions and Percentages for Stations BMM-003 ............ 25 Figure 17. Fall 2007 Flight Directions and Percentages for Stations BMM-004 ............ 25 Figure 18. Relative Abundance of Bird Groups During the Spring 2008 Monitoring
Period. .................................................................................................................... 27 Figure 19. Average Utilization Rates for Spring 2008 by Time of Day and Station ........ 28 Figure 20. Spring 2008 Flight Directions……………………………………………………31 Figure 21. Spring 2007 Flight Directions…………………………………………………….30 Figure 22. Bat Monitoring Stations ............................................................................... 50 Figure 23. Observed Bat Passage Rates by Date ........................................................ 56 Figure 24. Bat Activity by Time of Night. ........................................................................ 57 Figure 25. Average Bat Passage Rates by Station. ...................................................... 58 Figure 26. Herpetofaunal Monitoring Stations............................................................... 65 Figure 27. Aquatic Features ......................................................................................... 71
List of Appendices Appendix I Bird Observations and Data Sheets Appendix II Breeding Bird Evidence Observations Appendix III Mammals with Range Maps that Overlap with the Study Area Appendix IV Herpetofauna with Range Maps that Overlap with the Study Area and Data Sheets Appendix V Fish Species from Collection Records for the Red River

___________________________________________________________________________ Natural Resource Solutions Inc. St. Joseph Wind Energy Project Environmental Characterization Report
1
1.0 Introduction
Natural Resource Solutions Inc. (NRSI) was retained in March 2007 by Helimax Energy
Inc. on behalf of BowArk Energy Ltd. to conduct an assessment of natural environment
features that might influence the location, potential impacts, and mitigation of a proposed
wind power facility. The proposed St. Joseph Wind Energy Project is located
approximately 85km south of Winnipeg, near the Town of St. Joseph, Manitoba.
A monitoring program for this project was developed, through consultation with
appropriate agencies and review of applicable guidance documents (Environment
Canada 2007; Environment Canada CWS 2007). Surveys of the following biological
components were undertaken during the 2007 monitoring period: spring and fall bird
migration, breeding birds, diurnal raptors, lek searches, calling amphibians, spring and
fall bat migration, bat summer swarming, vegetation mapping, and aquatic habitat
assessment. Following the completion of 2007 monitoring, an expansion to the study
area was added, resulting in additional vegetation mapping and spring bird migration
surveys. Avian and bat monitoring stations were selected to represent different habitat
types and cover as much of the study area as possible. They were selected based on
original project boundaries received in April 2007, with two additional bird migration
monitoring stations added in spring 2008 to cover the expansion area. Changes to
project area boundaries and turbine layouts resulted in a reduced monitoring effort in the
southern extents of the project area.
This report summarizes the methodology and detailed findings of the biological surveys
undertaken by NRSI in 2007 and 2008. Detailed species lists based on field
observations and background review are appended to this report.

___________________________________________________________________________ Natural Resource Solutions Inc. St. Joseph Wind Energy Project Environmental Characterization Report
2
2.0 Study Area
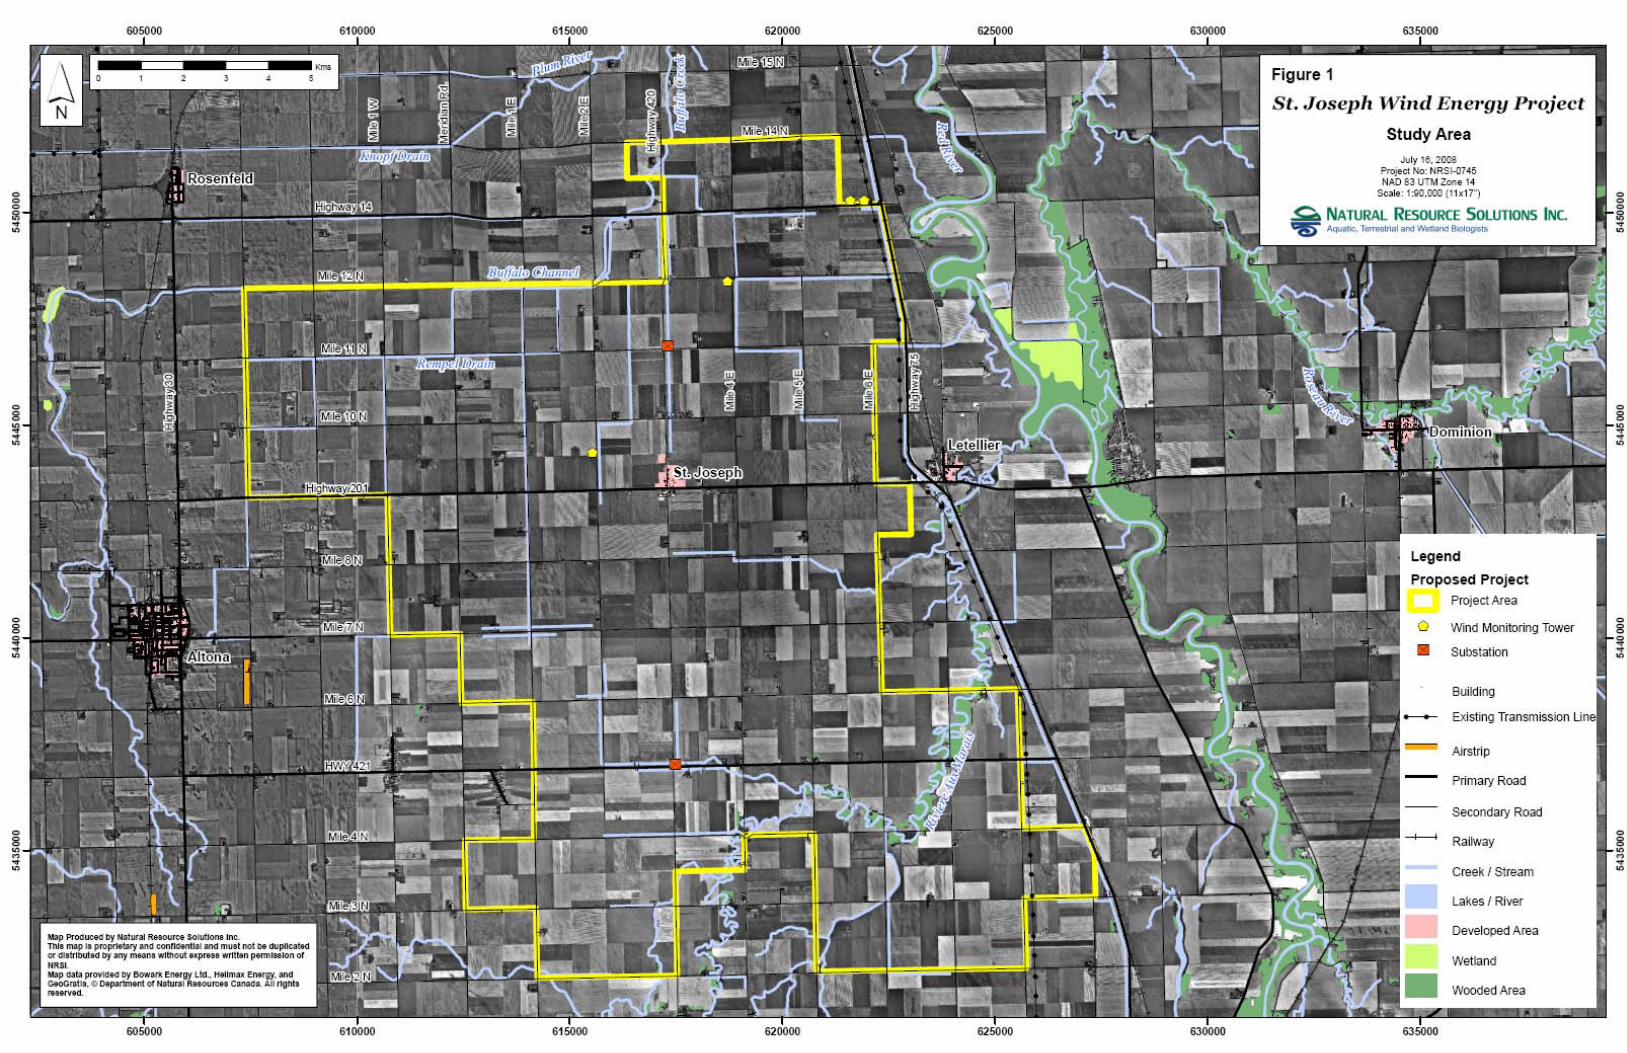
The St. Joseph study area is located approximately 85km south of Winnipeg in the south
central portion of the Red River Valley. This area has been heavily cultivated and a
variety of agricultural crops are grown in the area. For the purposes of this report, the
term “study area” refers to the project area plus a 1km buffer. It has to be noted that the
initial project area was expanded to the south in 2008 and further field work was
conducted in the spring of 2008 to characterize vegetation communities and bird
migration through this expansion area. The entire project area is located west of
Highway 75 and the Red River, and is bound by Mile 2 Road N. to the south, Mile 14
Road N. and Mile 12 Road N. to the north, Mile 1 Road W and Mile 3 Road W to the
west and Highway 75 to the east (see Figure 1).

___________________________________________________________________________ Natural Resource Solutions Inc. St. Joseph Wind Energy Project Environmental Characterization Report
4
3.0 Soils, Terrain and Drainage
The study area is located within the Glacial Lake Agassiz Clay Plain. This Plain is
characterized by massive deposits of clay, silt and a little sand which was deposited by
glaciers into proglacial lakes during the Quaternary Period (Matile & Keller 2004).
The study area is located entirely within the Lake Manitoba Plain Ecoregion. No
significant topographic features have been identified within the study area. The study
area is nearly level to gently rolling plains consisting primarily of hummocky to kettled
glacial moraine and lacustrine deposits.
The Canada Land Inventory (CLI) reports that the soil rating within the study area is
Class 2 (moderate limitations that restrict range of crops or require special conservation
practices) (Natural Resources Canada 2007).
The study area is almost entirely composed of agricultural fields that are drained by
constructed linear drains. Most of this drainage flows north into the Buffalo River, which
in turn enters Plum Creek and finally the Red River. The southeastern part of the study
area is composed mainly of agricultural fields which drain into the Rivière aux Marais,
which ultimately outlets into the Red River. The only natural wooded areas found within
the study area are associated with this stream corridor.

___________________________________________________________________________ Natural Resource Solutions Inc. St. Joseph Wind Energy Project Environmental Characterization Report
5
4.0 Vegetation
4.1 Natural Areas
The study area is located within the Manitoba Plains Ecoregion. According to Manitoba
Conservation (MB Conservation 2007a), no significant topographic features or Areas of
Special Interest (ASI) are located near the study area. According to the Protected
Areas Initiative (PAI), there are no protected areas in or around the study area (MB
Conservation 2007b).
4.2 Study Methodology
The initial study area is comprised almost entirely of agricultural fields. The only
naturally vegetated features, such as woodlots and wetlands, are associated with the
riparian corridor of the Rivière aux Marais. As a result of turbines being proposed in
areas of active agriculture, a detailed land classification system to document vegetation
communities within the study area was not necessary. Alternatively, NRSI biologists
mapped hedgerows and compiled a list of tree species present within the vegetated
areas in the study area.
4.3 Results
Vegetation within the initial study area and the majority of the expansion consists of
scattered hedgerows and pockets of vegetation associated with private residents (see
Figure 2). Agricultural fields within the study area were planted with a variety of crops.
Soybeans and canola were found to be most common but a variety of vegetables and
grains such as beans, rye, carrots and wheat are also present. The majority of
hedgerows in the study area are planted with deciduous tree species including Manitoba
maple (Acer negundo), plains cottonwood (Populus deltoides monilifera), red ash
(Fraxinus pennsylvanica), white elm (Ulmus americana), and trembling aspen (Populus
tremuloides). There are also a few scattered white cedar (Thuja occidentalis)
hedgerows. Occasional blue spruce (Picea pungens) and white spruce (Picea glauca)
also occur within the study area. Besides hedgerows, treed and shrubby areas are
exclusive to areas surrounding private residences and the borders of constructed ponds.

___________________________________________________________________________ Natural Resource Solutions Inc. St. Joseph Wind Energy Project Environmental Characterization Report
6
Vegetation within the southern portion of the project area consists of scattered
hedgerows and wooded communities along the riparian corridor. These communities
are shown on Figure 2 and described in more detail in Table 1
Table 1. Description of Vegetation Communities
Vegetation Community Species
Community #1 This is the largest wooded community in the study area and is composed of bur oak (Quercus macrocarpa), Manitoba maple, willows (Salix sp.), plains cottonwood, sugar maple (Acer saccharum), balsam poplar (Populus balsamifera) and linden species (Tilia sp.).
Community #2 This is a small cultural community adjacent to the riparian corridor consisting of scattered bur oak and spruce species in grassy pasture
Community #3 This is a small cultural woodlot associated with a tributary of the Rivière aux Marais, consisting mainly of maples and willows.
Community #4 This community is a grassy marsh surrounded by deciduous trees in a low area adjacent to highway 75.
4.4 Significant Species
No plant species known to occur in the study area are considered significant or rare
species.


___________________________________________________________________________ Natural Resource Solutions Inc. St. Joseph Wind Energy Project Environmental Characterization Report
8
5.0 Birds
5.1 Introduction
A number of bird monitoring and survey techniques were employed to characterize all
aspects of bird behavior and movement within the study area. Bird studies began in
April 2007 and finished in April 2008, occurring during each of the major periods of bird
activity, including spring and fall migration, breeding birds, and summer raptor surveys.
The 2007 avian monitoring stations were selected based on initial St. Joseph project
area boundaries. Following the completion of the 2007 field work, an expansion area
was added to the southern portion of the study area. Spring migration monitoring was
conducted at two additional stations in spring 2008 in the southern portion of the study
area to document movements within the updated project boundaries.
5.2 Daytime Migration Monitoring
5.2.1 Study Methodology
The spring and fall 2007 pre-construction daytime bird migration monitoring occurred at
4 stations (see Figure 3). The station locations were selected to provide good coverage
across the initial study area. In order to provide a good representation of the dominant
habitat and areas proposed for turbine placement, all 4 stations were located in
agricultural habitat except for BMM-002 which was located near a small riparian area. In
2008, spring pre-construction daytime bird migration monitoring occurred at 2 stations
within the expanded project boundaries. These additional stations were located within
agricultural habitat adjacent to riparian and wooded areas. Locations and elevations of
each of the six monitoring stations are listed in Table 2.
Table 2. Daytime Migration Monitoring Station Locations
BMM Station #
Elevation (m) Station Location
BMM-001 237 Mile 12 Road North and Mile 5 Road East
BMM-002 244 Mile 12 Road North and Meridian Road
BMM-003 244 Mile 7 Road North and Highway 420
BMM-004 235 Meridian Road just south of Highway 201
BMM-005 668 Mile 4 Road North and Mile 5 Road East
BMM-006 635 Mile 3 Road North and Highway 420

___________________________________________________________________________ Natural Resource Solutions Inc. St. Joseph Wind Energy Project Environmental Characterization Report
10
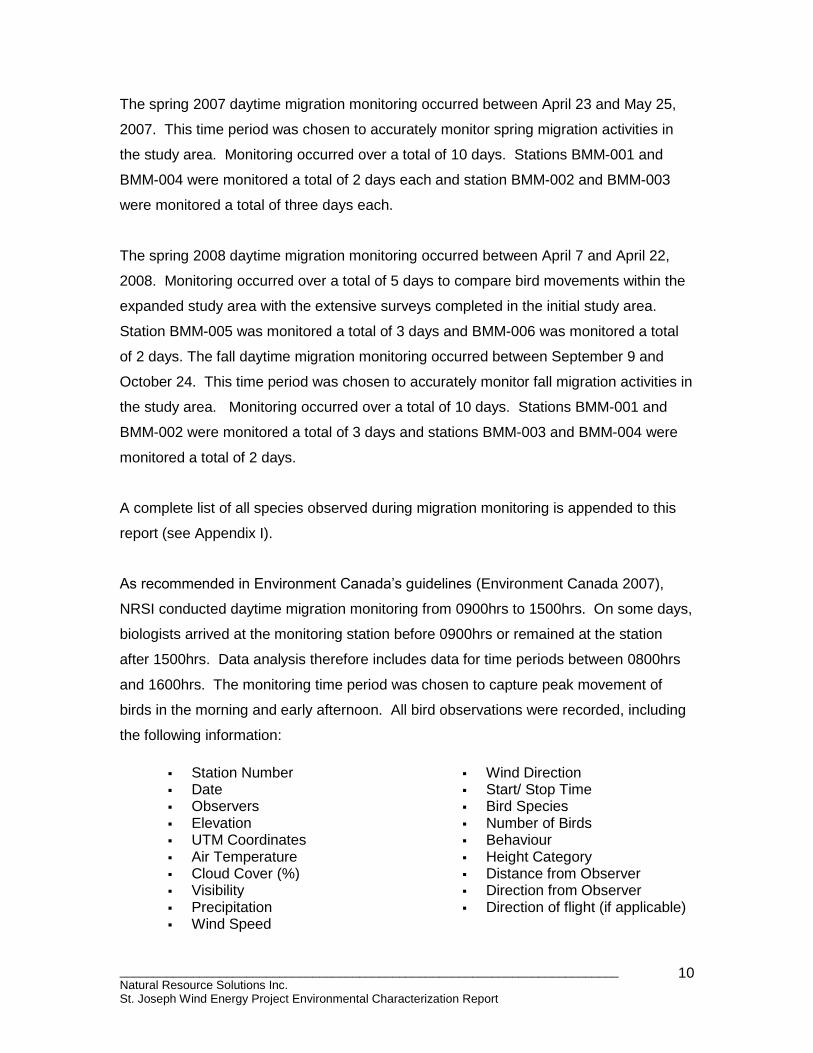
The spring 2007 daytime migration monitoring occurred between April 23 and May 25,
2007. This time period was chosen to accurately monitor spring migration activities in
the study area. Monitoring occurred over a total of 10 days. Stations BMM-001 and
BMM-004 were monitored a total of 2 days each and station BMM-002 and BMM-003
were monitored a total of three days each.
The spring 2008 daytime migration monitoring occurred between April 7 and April 22,
2008. Monitoring occurred over a total of 5 days to compare bird movements within the
expanded study area with the extensive surveys completed in the initial study area.
Station BMM-005 was monitored a total of 3 days and BMM-006 was monitored a total
of 2 days. The fall daytime migration monitoring occurred between September 9 and
October 24. This time period was chosen to accurately monitor fall migration activities in
the study area. Monitoring occurred over a total of 10 days. Stations BMM-001 and
BMM-002 were monitored a total of 3 days and stations BMM-003 and BMM-004 were
monitored a total of 2 days.
A complete list of all species observed during migration monitoring is appended to this
report (see Appendix I).
As recommended in Environment Canada‟s guidelines (Environment Canada 2007),
NRSI conducted daytime migration monitoring from 0900hrs to 1500hrs. On some days,
biologists arrived at the monitoring station before 0900hrs or remained at the station
after 1500hrs. Data analysis therefore includes data for time periods between 0800hrs
and 1600hrs. The monitoring time period was chosen to capture peak movement of
birds in the morning and early afternoon. All bird observations were recorded, including
the following information:
Station Number Wind Direction Date Start/ Stop Time Observers Bird Species Elevation Number of Birds UTM Coordinates Behaviour Air Temperature Height Category Cloud Cover (%) Distance from Observer Visibility Direction from Observer Precipitation Direction of flight (if applicable) Wind Speed

___________________________________________________________________________ Natural Resource Solutions Inc. St. Joseph Wind Energy Project Environmental Characterization Report
11
A copy of the field datasheet is appended to this report (see Appendix I).
The data were recorded and analyzed according to three Height Categories (0- 39m, 40
– 120m and >120m). These height categories were used to provide an accurate
representation of the flight altitude of birds with respect to the typical wind turbine blade
sphere.
At each of the monitoring stations, all bird observations were recorded. However, only
birds that were observed within a 200m radius of the observer were used in the analysis
of migration data utilization rates. This value was chosen to ensure accurate
representations of birds in each of the height categories. Birds at higher heights are
easier to see at further distances, and therefore using a large (or unlimited) study radius
would give a higher proportion of birds at greater heights than is representative of the
actual distribution of the bird use. A 200m study radius gives equal opportunity to see
and hear birds at all heights equally, giving a more accurate representation of birds
observed.
Information on bird usage was converted to utilization rates based on total number of
birds, time spent monitoring, and area surveyed. Calculation of utilization rates allows
for a comprehensive understanding of bird densities under a variety of different
circumstances and conditions. In addition to utilization rates, bird species composition
and bird group composition were calculated as a percent of total observations. Flight
direction radial graphs were also used to examine the primary flight directions during the
study period. These graphs give an indication of the extent of migration during the
monitoring period, and were further separated and analyzed by individual height zones.
The results of daytime bird migration monitoring are provided below in Section 5.2.2.

___________________________________________________________________________ Natural Resource Solutions Inc. St. Joseph Wind Energy Project Environmental Characterization Report
12
5.2.2 Results
Over the course of the daytime bird migration monitoring in spring and fall 2007, a total
of 6,428 individual birds were observed. Fifty-six species were confirmed during the
monitoring period. During spring 2008 migration monitoring, an additional 647 birds were
observed, representing 30 species. The study area is located in primarily agricultural
habitat, and not surprisingly the most abundant species were landbirds such as
blackbirds and sparrows. When observing members of these bird groups, especially at
a distance, it can be very difficult to identify individuals to species. NRSI biologists
recorded bird species whenever possible, however when an individual or flock could not
be identified to species, it was recorded according to bird group or family. The results
for the spring and fall 2007 monitoring periods and the spring 2008 monitoring period are
discussed separately below.
5.2.2.1 Spring 2007
Species Composition and Abundance
During the spring 2007 migration monitoring period a total of 2,725 birds were recorded
representing 42 different species. The majority of observations recorded over the
monitoring period were individual birds or small flocks numbering less than 20
individuals. The majority of species identified were horned lark (Eremophila alpestris),
red-winged blackbird (Agelaius phoeniceus), snow bunting (Plectrophenax nivalis),
tundra swan (Cygnus columbianus), and brown-headed cowbird (Molothrus ater). A few
large flocks of birds were observed, numbering between 220 and 350 individuals.
Figure 4 outlines the relative abundance of the five general bird groups observed. The
most abundant bird group by number of observations was landbirds (89%). The
remaining bird groups represented relatively low numbers- waterfowl represented 7% of
individuals observed, followed by shorebirds (1.5%), waterbirds (1.3%), unknown
species (1%) and raptors (0.3%). No owls were observed during the monitoring period.

___________________________________________________________________________ Natural Resource Solutions Inc. St. Joseph Wind Energy Project Environmental Characterization Report
13
Waterbirds
1.3%
Unknow n
1.0%
Raptors
0.3%Waterfow l
7.0%
Shorebirds
1.5%
Landbirds
89.0%
Figure 4. Relative Abundance of Bird Groups During the Spring Monitoring Period.
A total of 2,425 landbirds, the most abundant bird group, were observed representing 30
species. The most abundant landbirds observed were horned lark, red-winged
blackbirds, snow buntings and brown-headed cowbird.
A total of 191 waterfowl were observed representing 3 species, the most abundant being
tundra swan which were all observed in small flocks.
Thirty-six waterbirds were observed representing 4 species, the most abundant being
gull species, half of which were ring-billed gulls (Larus delawarensis).
Forty shorebird observations were recorded of two species. The killdeer (Charadrius
vociferus) represented all shorebird observations except for one of the spotted sandpiper
(Actitis macularia).
Raptors were the least abundant group observed during spring migration monitoring with
only seven raptors observed representing four different species.
One percent of the total observations were of unidentified species observed in small
flocks which could not be classified based to bird group.

___________________________________________________________________________ Natural Resource Solutions Inc. St. Joseph Wind Energy Project Environmental Characterization Report
14
Distribution by Date and Time
Most of the birds observed in the study area during the spring monitoring period were
observed in late April and early May (Figure 5). The highest utilization rate (0.1256
birds/ha/min) was recorded on April 24 when a total of 1,136 individuals were observed.
This increase in activity at the end of April suggests a slight peak in spring migration
movements through the area.
0.0000
0.0200
0.0400
0.0600
0.0800
0.1000
0.1200
0.1400
23-A
pr-0
7
24-A
pr-0
7
11-M
ay-0
7
12-M
ay-0
7
13-M
ay-0
7
23-M
ay-0
7
24-M
ay-0
7
25-M
ay-0
7
Date
Uti
lizati
on
Rate
(b
ird
s/h
a/m
in)
Figure 5. Average Utilization Rates by Date for the Spring Monitoring Period.
Figure 6 displays the average utilization rate at each bird migration monitoring station by
time of day. More than 30% of all bird observations were between 0900hrs and 0959hrs
(1,259 individuals). For the remainder of the monitoring period, utilization rates were
comparable except for a peak in activity around 1100hrs at station BMM-004. This peak
in activity at BMM-004 was due to the observation of two large flocks of passerines,
totaling 330 birds, on April 24 around 1130hrs.

___________________________________________________________________________ Natural Resource Solutions Inc. St. Joseph Wind Energy Project Environmental Characterization Report
15
0.0000
0.0100
0.0200
0.0300
0.0400
0.0500
0.0600
0800
-085
9
0900
-095
9
1000
-105
9
1100
-115
9
1200
-125
9
1300
-135
9
1400
-145
9
1500
-155
9
Time of Day (hrs)
Av
era
ge
Uti
liza
tio
n R
ate
(bir
ds
/ha
/min
)
BMM-001
BMM-002
BMM-003
BMM-004
Figure 6. Average Utilization Rates for Spring 2007 by Time of Day and Station
Distribution by Station
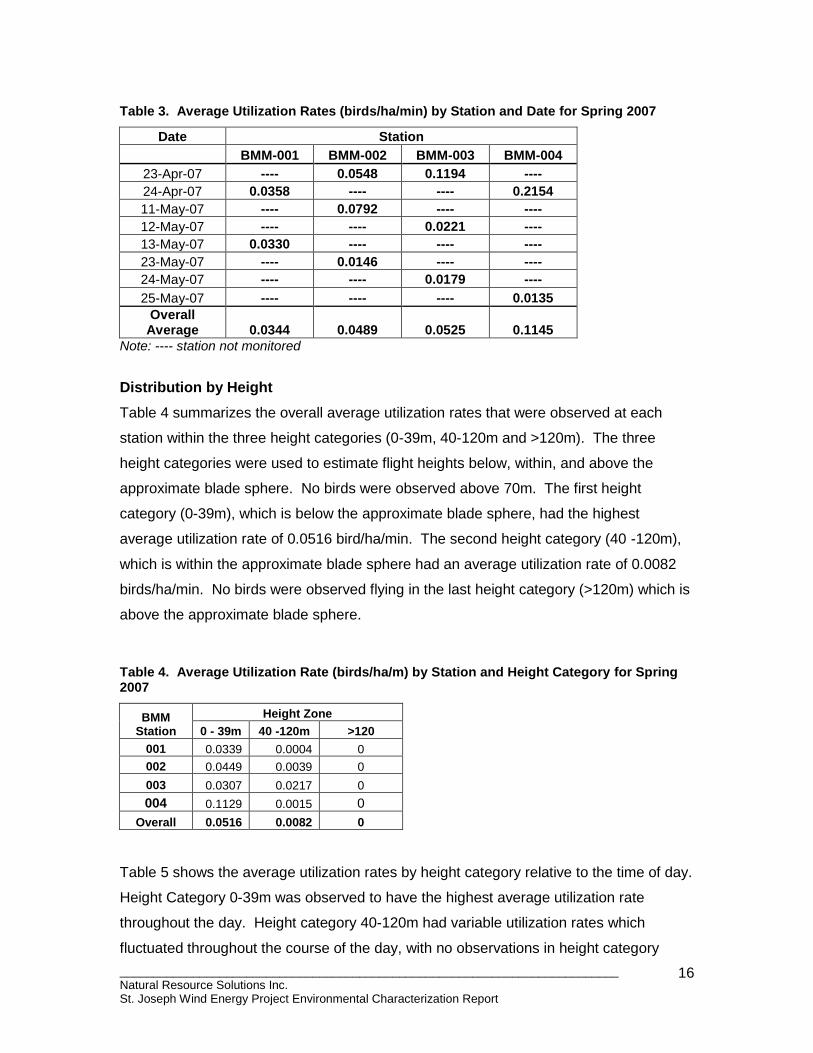
Table 3 lists the average utilization for each of the migration monitoring stations during
the spring monitoring period. Utilization rates were variable, with BMM-004 showing the
highest overall average utilization rate, 0.1145 bird/ha/min. The single highest average
utilization rate was observed on April 24, 2007 at BMM-004. This utilization rate of
0.2154 birds/ha/min, represents a date when 8 flocks of 10 or more birds and three large
flocks numbering 100-350 birds were observed.
___________________________________________________________________________ Natural Resource Solutions Inc. St. Joseph Wind Energy Project Environmental Characterization Report
16
Table 3. Average Utilization Rates (birds/ha/min) by Station and Date for Spring 2007
Date Station
BMM-001 BMM-002 BMM-003 BMM-004
23-Apr-07 ---- 0.0548 0.1194 ----
24-Apr-07 0.0358 ---- ---- 0.2154
11-May-07 ---- 0.0792 ---- ----
12-May-07 ---- ---- 0.0221 ----
13-May-07 0.0330 ---- ---- ----
23-May-07 ---- 0.0146 ---- ----
24-May-07 ---- ---- 0.0179 ----
25-May-07 ---- ---- ---- 0.0135
Overall Average 0.0344 0.0489 0.0525 0.1145
Note: ---- station not monitored
Distribution by Height
Table 4 summarizes the overall average utilization rates that were observed at each
station within the three height categories (0-39m, 40-120m and >120m). The three
height categories were used to estimate flight heights below, within, and above the
approximate blade sphere. No birds were observed above 70m. The first height
category (0-39m), which is below the approximate blade sphere, had the highest
average utilization rate of 0.0516 bird/ha/min. The second height category (40 -120m),
which is within the approximate blade sphere had an average utilization rate of 0.0082
birds/ha/min. No birds were observed flying in the last height category (>120m) which is
above the approximate blade sphere.
Table 4. Average Utilization Rate (birds/ha/m) by Station and Height Category for Spring 2007
BMM Station
Height Zone
0 - 39m 40 -120m >120
001 0.0339 0.0004 0
002 0.0449 0.0039 0
003 0.0307 0.0217 0
004 0.1129 0.0015 0
Overall 0.0516 0.0082 0
Table 5 shows the average utilization rates by height category relative to the time of day.
Height Category 0-39m was observed to have the highest average utilization rate
throughout the day. Height category 40-120m had variable utilization rates which
fluctuated throughout the course of the day, with no observations in height category

___________________________________________________________________________ Natural Resource Solutions Inc. St. Joseph Wind Energy Project Environmental Characterization Report
17
>120m. In general, the utilization rates were observed to steadily decline through the
daily monitoring period and were the highest at 0900hrs decreasing in the afternoon
after 1200hrs.
Table 5. Average Utilization Rates by Height Category by Time of Day for Spring 2007
Height Category in (m)
0800 hrs 0900 hrs 1000 hrs 1100 hrs 1200 hrs 1300 hrs 1400 hrs 1500 hrs
0-39 0.0584 0.1271 0.0273 0.0673 0.0410 0.0151 0.0342 0.0159
40-120 0.0000 0.0398 0.0019 0.0000 0.0005 0.0016 0.0056 0.0000
>120 0 0 0 0 0 0 0 0
Flight Directions
Flight directions and the numbers of birds (expressed as percent of total individuals
observed) are summarized in Figure 7 through Figure 10 below. At BMM-001 (Figure 7)
flight directions were variable with large flocks of sparrows moving southwest and
northeast. Flight directions were also variable at BMM-002 (Figure 8) with large flocks
of sparrows observed heading north, northwest and east. At stations BMM-003 (Figure
9) and BMM-004 (Figure 10) the general trend of bird observations indicate that the
majority of birds were observed to be heading in a northeastern direction toward the Red
River.
Figure 7. Spring 2007 Flight Directions and Figure 8. Spring Flight 2007 Directions Percentages for Station BMM-001 and Percentages for Station BMM-002
0.0
5.0
10.0
15.0
20.0
25.0
30.0N
E
S
W0.0
5.0
10.0
15.0
20.0
25.0
30.0
N
E
S
W

___________________________________________________________________________ Natural Resource Solutions Inc. St. Joseph Wind Energy Project Environmental Characterization Report
18
Figure 9. Spring 2007 Flight Directions Figure 10. Spring 2007 Flight Directions and Percentages for Station BMM-003 and Percentages for Station BMM-004
Weather
Over the course of the monitoring period, a total of 10 days were monitored. Seven of
these days were conducted in ideal weather conditions (no precipitation), and the
remaining three monitoring days were conducted in fair weather conditions, with light
rain or fog during portions of the monitoring period. In addition to general weather
conditions, the temperature was also recorded at the beginning of each monitoring day,
and ranged from 4 to 20ºC during the entire 2007 spring migration monitoring period.
Incidental Observations
Birds that were observed at a distance greater then 200m were recorded as incidentals
and were not included in the data analysis. A total of 3,845 individuals representing 38
species were recorded as incidental observations because they were more then 200m
from the observer. Many of these observations were small to large flocks of geese,
passerines, and sparrows migrating through the area.
A complete list of all birds observed during the spring monitoring period can be seen in
Appendix I.
0.0
10.0
20.0
30.0
40.0
50.0
N
E
S
W0.0
10.0
20.0
30.0
40.0N
E
S
W

___________________________________________________________________________ Natural Resource Solutions Inc. St. Joseph Wind Energy Project Environmental Characterization Report
19
5.2.2.2 Fall 2007
Species Composition and Abundance
During the fall monitoring period a total of 3,703 birds were recorded representing 38
different species. The majority of observations recorded over the monitoring period were
individual birds or small flocks numbering 20 or less individuals. Of the small flocks that
were observed flying through the area, the majority were passerines, consisting of 10-20
individuals, mostly sparrow and warbler species. A few larger flocks of birds were
observed, including blackbirds (304 individuals) and other passerines (400 individuals).
The most abundant species recorded during the fall monitoring period were Canada
geese (Branta canadensis), rock pigeons (Columba livia), barn swallows (Hirundo
rustica), and European starlings (Sturnus vulgaris).
Figure 11 outlines the relative abundance of the five general bird groups observed. The
most abundant bird group by number of observations was landbirds (92%). Shorebirds
(4.3%), waterfowl (2.6%), raptors (1%), and waterbirds (0.1%) all represented relatively
low percentages of the total bird observations during fall 2007 monitoring. No owls were
observed during the monitoring period.
Waterbirds
0.1%Shorebirds
4.3%
Waterfow l
2.6%Raptors
1.0%
Landbirds
92.0%
Figure 11. Relative Abundance of Bird Groups during the Fall Monitoring Period.
A total of 3,407 landbirds, representing 23 species, were recorded. The most abundant
landbird observed were rock pigeons. A total of 161 shorebirds were observed

___________________________________________________________________________ Natural Resource Solutions Inc. St. Joseph Wind Energy Project Environmental Characterization Report
20
representing 4 species, which were observed in flocks ranging from 9 to 60 individuals.
Several large flocks of shorebirds were observed flying through the study area and
foraging in nearby fields.
Ninety-five waterfowl were observed representing 4 species, the most abundant being
Canada geese. Snow geese were also relatively common but relatively few flocks of
ducks were observed.
Thirty-seven raptor observations were recorded of 4 species. Red-tailed hawk (Buteo
jamaicensis) represented 46% of all raptor observations and northern harrier (Circus
cyaneus) represented 30% of the raptor observations. Additional raptors observed in
small numbers included 2 merlins (Falco columbarius) and 1 prairie falcon (Falco
mexicanus) foraging near the ground. The remaining raptor observations consisted of
unidentified raptor and buteo species. Raptors were observed to be more abundant
within the study area when winds were conducive to fall migration movements, blowing
from the north. When strong winds were coming from the north, raptors were observed
to be flying in a southern direction and passing through the study area very quickly.
Waterbirds were the least abundant group observed during fall migration monitoring with
only 3 individuals observed, 2 sandhill cranes (Grus canadensis) and 1 great blue heron
(Ardea herodias).
Distribution by Date and Time
Most of the birds observed in the study area during the fall monitoring period were
observed in October (Figure 12). The highest utilization rate (0.2408 birds/ha/min) was
recorded on October 23, when a total of 1,089 individuals were observed. This increase
in activity at the end of October suggests a slight peak in fall migration movements
through the area.

___________________________________________________________________________ Natural Resource Solutions Inc. St. Joseph Wind Energy Project Environmental Characterization Report
21
0.0000
0.0500
0.1000
0.1500
0.2000
0.2500
0.3000
9-Sep
-07
10-S
ep-0
7
23-S
ep-0
7
24-S
ep-0
7
25-S
ep-0
7
9-Oct-0
7
10-O
ct-0
7
11-O
ct-0
7
23-O
ct-0
7
24-O
ct-0
7
Date
Uti
lizati
on
Rate
(b
ird
s/h
a/m
in)
Figure 12. Average Utilization Rates by Date for the Fall Migration Monitoring Period.
Figure 13 displays the average utilization rate at each bird migration monitoring station
by time of day. All monitoring conducted in the fall took place between 0900hrs and
1500hrs, following Environment Canada‟s recommended guidelines for migration
monitoring. More than 37% of all bird observations occurred between 0900hrs and
0959hrs (1,384 individuals). The huge spike in activity at station BMM-002 during this
time period was due to the observation of two large flocks (304 birds on September 9
and 400 birds on October 23). For the remainder of the monitoring period, utilization
rates were fairly consistent.

___________________________________________________________________________ Natural Resource Solutions Inc. St. Joseph Wind Energy Project Environmental Characterization Report
22
0.0000
0.0100
0.0200
0.0300
0.0400
0.0500
0.0600
0.0700
0.0800
0.0900
0900
-095
9
1000
-105
9
1100
-115
9
1200
-125
9
1300
-135
9
1400
-145
9
Time of Day (hrs)
Avera
ge U
tilizati
on
Rate
(bir
ds/h
a/m
in)
BMM-001
BMM-002
BMM-003
BMM-004
Figure 13. Average Utilization Rate for Fall 2007 by Station and Time of Day
Distribution by Station
Table 6 lists the average utilization rates for each of the bird migration monitoring
stations for the fall monitoring period. Utilization rates were variable, with BMM-002
showing the highest overall average utilization rate, 0.1325 bird/ha/min. The single
highest average utilization rate was observed on October 23, 2007 at BMM-002. This
high utilization rate, 0.2408 birds/ha/min, represented a date when large numbers of bird
flocks were observed including 14 flocks of 10 or more birds, two flocks of more than
100 birds and one flock of 400 birds.

___________________________________________________________________________ Natural Resource Solutions Inc. St. Joseph Wind Energy Project Environmental Characterization Report
23
Table 6. Average Utilization Rates (birds/ha/min) by Station and Date for Fall 2007
DATE Station
BMM-001 BMM-002 BMM-003 BMM-004
9-Sep-07 ------- 0.1042 ------- -------
10-Sep-07 ------- ------- 0.0226 -------
23-Sep-07 0.0458 ------- ------- -------
24-Sep-07 ------- ------- ------- 0.0144
25-Sep-07 ------- ------- 0.0807 -------
9-Oct-07 0.0237 ------- ------- -------
10-Oct-07 ------- ------- ------- 0.1320
11-Oct-07 ------- 0.0524 ------- -------
23-Oct-07 ------- 0.2408 ------- -------
24-Oct-07 0.1024 ------- ------- -------
Overall Average 0.0573 0.1325 0.0516 0.0732
Distribution by Height
Table 7 summarizes the overall average utilization rates that were observed at each
station within the three height categories (0-39m, 40-120m and >120m). The first height
category (0-39m), which is below the approximate blade sphere, had the highest overall
average utilization rate of 0.0779 bird/ha/min. The second height category (40 -120m),
which is within the approximate blade sphere had an average utilization rate of 0.0036
birds/ha/min. The third height category (>120m), which is above the approximate blade
sphere, had the lowest utilization rate (0.0003 birds/ha/min).
Table 7. Average Utilization Rate (birds/ha/min) by Station and Height Category
BMM Station
Height Zone
0 - 39m 40 -120m >120 m
001 0.0512 0.0060 0.0000
002 0.1311 0.0007 0.0007
003 0.0453 0.0060 0.0002
004 0.0708 0.0022 0.0002
Overall 0.0779 0.0036 0.0003
Table 8 shows the average utilization rates by height category relative to time of day.
Height category 0-39m was observed to have the highest average utilization rate for all
of the times during the day. This is likely due to the high numbers of birds that were
foraging in, and flying between, the agricultural fields. Height category 40-120m had
low, but fairly consistent utilization rates throughout the course of the day. There were
few observations in height category >120, resulting in relatively low utilization rates at

___________________________________________________________________________ Natural Resource Solutions Inc. St. Joseph Wind Energy Project Environmental Characterization Report
24
every station. In general, utilization rates were observed to be highest around 0900 hrs
and decline throughout the rest of the day. This pattern is consistent with observations
during spring 2007 bird migration monitoring. The spike in activity around 1300hrs in
height category 0-39m is due to the observation of several small flocks (10-50
individuals) and one large flock (150 individuals) on several different days.
Table 8. Average Utilization Rates by Height Category by Time of Day for Fall 2007
Height Category in (m)
0800 hrs 0900 hrs 1000 hrs 1100 hrs 1200 hrs 1300 hrs 1400 hrs 1500 hrs
0-39 0.0000 0.1823 0.0916 0.0395 0.0417 0.0843 0.0281 0.0000
40-120 0.0000 0.0011 0.0024 0.0028 0.0011 0.0062 0.0084 0.0000
>120 0.0000 0.0003 0.0003 0.0013 0.0000 0.0000 0.0000 0.0000
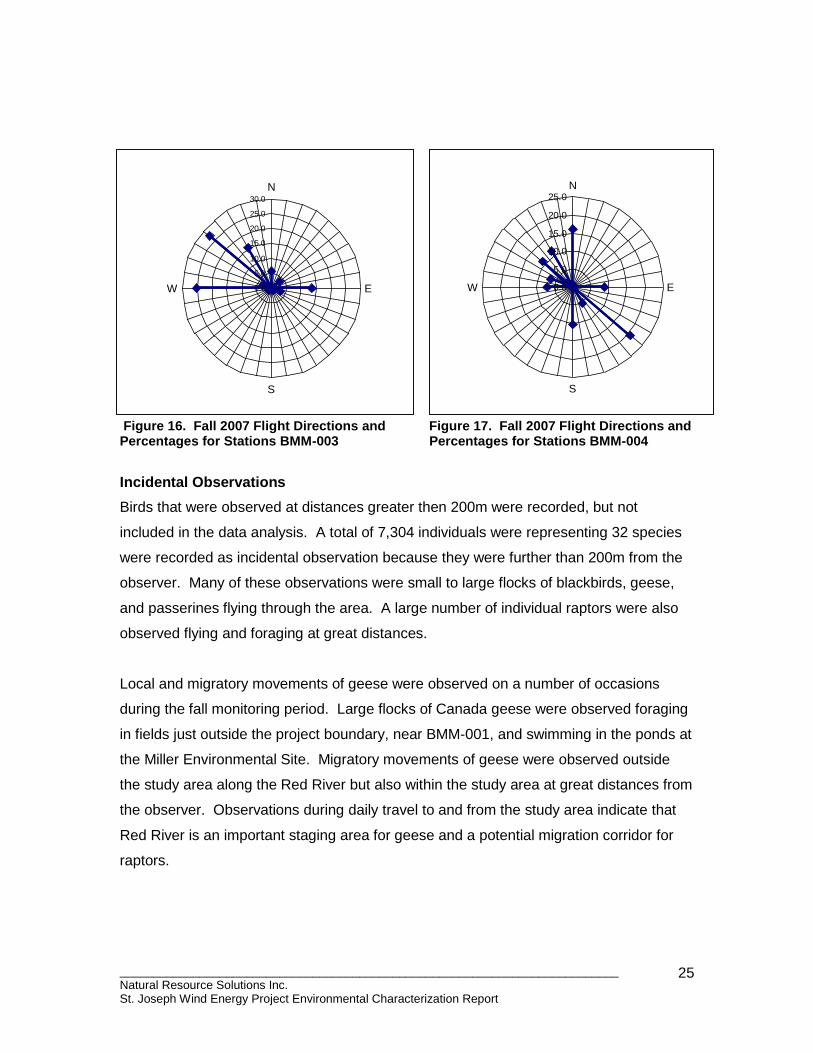
Flight directions and the numbers of birds (expressed as percent of total individuals
observed) are summarized below in Figure 14 through Figure 17. At station BMM-001
(Figure 14) flight directions were variable with a flock of sparrows (75 individuals) and
flock of Canada geese (43 individuals) observed flying northwest and a large flock of
sparrows (150 individuals) moving southeast. Flight directions were also variable at
station BMM-003 ( Figure 17) with the majority of birds observed moving west and
northwest. At stations BMM-002 ( Figure 15) and BMM-004 ( Figure 17) the general
trend of bird observations indicate that the majority of birds were observed to be heading
north or southeast.
Figure 14. Fall 2007 Flight Directions and Figure 15. Fall 2007 Flight Directions and Percentages for Stations BMM-001 Percentages for Stations BMM-002
0.0
5.0
10.0
15.0
20.0
25.0
30.0
35.0
N
E
S
W 0.0
5.0
10.0
15.0
20.0
25.0
30.0N
E
S
W
___________________________________________________________________________ Natural Resource Solutions Inc. St. Joseph Wind Energy Project Environmental Characterization Report
25
Figure 16. Fall 2007 Flight Directions and Figure 17. Fall 2007 Flight Directions and Percentages for Stations BMM-003 Percentages for Stations BMM-004
Incidental Observations
Birds that were observed at distances greater then 200m were recorded, but not
included in the data analysis. A total of 7,304 individuals were representing 32 species
were recorded as incidental observation because they were further than 200m from the
observer. Many of these observations were small to large flocks of blackbirds, geese,
and passerines flying through the area. A large number of individual raptors were also
observed flying and foraging at great distances.
Local and migratory movements of geese were observed on a number of occasions
during the fall monitoring period. Large flocks of Canada geese were observed foraging
in fields just outside the project boundary, near BMM-001, and swimming in the ponds at
the Miller Environmental Site. Migratory movements of geese were observed outside
the study area along the Red River but also within the study area at great distances from
the observer. Observations during daily travel to and from the study area indicate that
Red River is an important staging area for geese and a potential migration corridor for
raptors.
0.0
5.0
10.0
15.0
20.0
25.0
30.0
N
E
S
W 0.0
5.0
10.0
15.0
20.0
25.0N
E
S
W

___________________________________________________________________________ Natural Resource Solutions Inc. St. Joseph Wind Energy Project Environmental Characterization Report
26
Large flocks of passerines, mainly sparrows, blackbirds or warblers, numbering as many
as 400 individuals, were observed perched on the ground and foraging south of BMM-
002 and northeast of BMM-003.
A complete list of all birds observed during the fall monitoring period may be seen in
Appendix I.
Weather
Over the course of the monitoring period a total of 10 days were monitored. Eight of
these days were conducted in good weather condition, with no precipitation. The
remaining 2 days of monitoring were conducted in fair weather conditions, with periods
of light rain or fog. In addition to general weather conditions, the temperature was also
recorded at the beginning of each monitoring day and ranged from 4 to 32ºC over the
entire monitoring period.
5.2.2.3 Spring 2008
Species Composition and Abundance
During the spring 2008 migration monitoring period a total of 647 birds were recorded
representing 30 different species. The majority of observations recorded over the
monitoring period were individual birds or small flocks numbering less than 30
individuals. The majority of species observed were snow bunting, red-winged blackbird,
American white pelican (Pelecanus erythrorhynchos), Canada geese, horned lark, and
killdeer. No large flocks of birds were observed. These species observations are similar
to the spring 2007 monitoring period although no large flocks of birds were observed in
2008.
Figure 18 outlines the relative abundance of the five general bird groups observed in
2008. The most abundant bird group by number of observations was landbirds (78.7%).
As in 2007, the remaining bird groups in 2008 monitoring represented relatively low
numbers- waterfowl represented 10.4% of individuals observed, followed by shorebirds
(3.4%), waterbirds (6.5%) and raptors (1.1%). No owls were observed during the
monitoring period.

___________________________________________________________________________ Natural Resource Solutions Inc. St. Joseph Wind Energy Project Environmental Characterization Report
27
Waterbirds
6.5% Raptors
1.1%
Waterfow l
10.4%
Shorebirds
3.4%
Landbirds
78.7%
Figure 18. Relative Abundance of Bird Groups During the Spring 2008 Monitoring Period.
A total of 509 landbirds, the most abundant bird group, were observed representing 18
species. The most abundant landbirds observed were snow buntings which were most
often seen foraging in fields in small to medium sized flocks (20-40 individuals). Also
abundant were horned lark, red-winged blackbirds, and European starlings.
A total of 67 waterfowl were observed representing 4 species. The most abundant
waterfowl species was Canada goose due to a flock of 38 individuals flying through the
study area. Forty-two waterbirds were observed representing 3 species, the most
abundant being American white pelicans. Twenty shorebird observations, all of killdeer
were recorded. Similar to the 2007 monitoring period, raptors were the least abundant
group observed with only seven raptors observed representing four different species.
The spring 2008 migration monitoring results were very comparable to the 2007
monitoring period. The percentages of bird groups and the most commonly observed
species were very similar. The only notable exception was the difference in waterbird
species observed. During the 2007 spring migration monitoring, gull species were the
most abundant species observed and no pelicans were recorded during the spring 2007
monitoring period.

___________________________________________________________________________ Natural Resource Solutions Inc. St. Joseph Wind Energy Project Environmental Characterization Report
28
Distribution by Date, Time, and Station
As in 2007, most of the birds observed in the study area during the spring monitoring
period were observed in late April. The highest utilization rate (0.0845 birds/ha/min) was
recorded on April 22 when a total of 329 individual birds were observed. This increase
in activity at the end of April is consistent with the 2007 monitoring results which
suggested a slight peak in spring migration movements through the area at this time.
Figure 6 displays the average utilization rate at each bird migration monitoring station by
time of day. The majority of bird observations were between 0900hrs and 1059hrs (400
individuals). For the remainder of the monitoring period, utilization rates were
comparable for each station. However, utilization rates between stations were notably
different, with BMM-005 having consistently more activity than BMM-006. This
increased activity at BMM-005 was due to the observation of several flocks of snow
buntings, totaling 314 birds, as well as the stations proximately to the wooded riparian
corridor.
0.0000
0.0020
0.0040
0.0060
0.0080
0.0100
0.0120
0.0140
0.0160
0.0180
0.0200
0800
-085
9
0900
-095
9
1000
-105
9
1100
-115
9
1200
-125
9
1300
-135
9
1400
-145
9
Time of Day (hrs)
Av
era
ge
Uti
liza
tio
n R
ate
(bir
ds
/ha
/min
)
BMM-005
BMM-006
Figure 19. Average Utilization Rates for Spring 2008 by Time of Day and Station

___________________________________________________________________________ Natural Resource Solutions Inc. St. Joseph Wind Energy Project Environmental Characterization Report
29
Distribution by Height
Table 9 summarizes the overall average utilization rates that were observed at each
station within the three height categories (0-39m, 40-120m and >120m). Flight heights
observed in spring 2008 were very similar to spring 2007. The first height category (0-
39m), which is below the approximate blade sphere, had the highest overall average
utilization rate of 0.0337 bird/ha/min. The second height category (40 -120m), which is
within the approximate blade sphere had an average utilization rate of 0.0069
birds/ha/min and the last height category (>120m) which is above the approximate blade
sphere has an average utilization rate of 0.0056.
Table 9. Average Utilization Rate (birds/ha/m) by Station and Height Category for Spring 2008
BMM Station
Height Zone
0 - 39m 40 -119m >120m
005 0.0414 0.0099 0.0042
006 0.0204 0.0014 0
Overall 0.0337 0.0069 0.0056
Table 10 shows the average utilization rates by height category relative to the time of
day. Height Category 0-39m was observed to have the highest average utilization rate
throughout the day. Height category 40-120m had variable utilization rates which
fluctuated throughout the course of the day, and as previously mentioned, height
category >120m had the lowest utilization rates that were highly variable throughout the
day. The peak in activity at 1300hrs in height category >120m is due to a flock of
Canada geese flying through the area. In general, the utilization rates were observed to
be fairly constant throughout the day, but slightly higher in the morning.
Table 10. Average Utilization Rates by Height Category by Time of Day for Spring 2008
Height Category in (m) 0800 0900 1000 1100 1200 1300
0-39 0.0159 0.0541 0.0436 0.0088 0.0314 0.0155
40-119 0.0000 0.0016 0.0027 0.0186 0.0066 0.0106
120+ 0.0000 0.0000 0.0118 0.0000 0.0000 0.3025

___________________________________________________________________________ Natural Resource Solutions Inc. St. Joseph Wind Energy Project Environmental Characterization Report
30
Flight Directions
Flight directions and the numbers of birds (expressed as percent of total individuals
observed) are summarized in Figure 20 and Figure 21. At BMM-005 (Figure 20) flight
directions were variable with several flocks of snow buntings observed moving
northeast. Flight directions were less variable at BMM-006 (Figure 21) with a flock of 40
snow buntings observed heading south. As in spring 2007, flight directions were highly
variable, and consistent flight patterns were not observed through the study area.
Figure 20. Spring 2008 Flight Directions Figure 21. Spring 2007 Flight Directions and Percentages for Station BMM-005. and Percentages for Station BMM-006
Weather
Over the course of the monitoring period, a total of 5 days were monitored. Three of
these days were conducted in ideal weather conditions (no precipitation), and the
remaining two monitoring days began in fair weather conditions (fog and light
precipitation), and ended on the onset of heavy rain and inclement weather. The
ambient temperature was also recorded at the beginning of each monitoring day, and
ranged from 0-10ºC.
0
2
4
6
8
10
12
14
16
N
E
S
W0.0
5.0
10.0
15.0
20.0
25.0
30.0N
E
S
W

___________________________________________________________________________ Natural Resource Solutions Inc. St. Joseph Wind Energy Project Environmental Characterization Report
31
Incidental Observations
Birds that were observed at a distance greater then 200m were recorded as incidentals
and not included in the data analysis. A total of 549 individuals representing 16 species
were recorded as incidental observations because they were more then 200m from the
observer. Many of these observations were small to large flocks of geese species and
snow buntings moving through the area. Additionally, NRSI biologists noted several
groups of tundra swans (20 or more individuals) flying from the Red River in a
northwestern direction over the study area when driving to and from the project area.
A complete list of all birds observed during the spring monitoring period can be seen in
Appendix I.
5.3 Diurnal Raptor Monitoring
5.3.1 Study Methodology
Daytime raptor monitoring occurred at two stations (HWK-001 and HWK-002), which
correspond to two of the migration monitoring stations (see Figure 3). These stations
were selected to be representative of the habitat within the study area but are also
expected to record any raptor movement between the study area and the Red River.
Monitoring occurred on 6 days between June 3 and June 22, 2007. Monitoring began
between 0900hrs and 1000hrs, often immediately following breeding bird surveys.
Raptor monitoring lasted an average of 5.5hrs, lasting well into the early afternoon.
At each of the monitoring stations all bird observations were recorded. Non-raptor birds
observed during these surveys were recorded and discussed as incidentals. Data was
recorded using the same data sheet used for collecting bird migration data (Appendix I).

___________________________________________________________________________ Natural Resource Solutions Inc. St. Joseph Wind Energy Project Environmental Characterization Report
32
5.3.2 Results
During the daytime raptor surveys, a total of 10 raptors were observed representing 3
species. Northern harriers represented half of all individuals observed. Four
unidentified raptor species and one red-tailed hawk were also observed. Raptor
observations occurred on 3 of the 6 monitoring days with the majority occurring on June
3 (4 individuals) and June 20 (5 individuals). No raptors were observed during surveys
conducted on June 7, 19 or 22nd.
Half of all raptors observed were observed flying below the approximate blade sphere
(Height Category 0-39m) and half were observed flying within the approximate blade
sphere (Height Category 40-120m). However, it should be noted that the raptors
observed flying within the blade sphere were observed at distance of 600m or more,
making an accurate estimate of flight height difficult for the observer. Seven of the 10
raptors observed were seen soaring or circling. There was no indication that raptors
regularly fly between the study area and the Red River.
Weather conditions during the raptor surveys varied. Temperatures ranged from 10ºC to
22ºC with rain occurring on one of the survey days (June 7).
Incidental Observations
A total of 282 birds representing 24 species were recorded as incidental observations
during the diurnal raptor surveys. The majority of these observations were landbirds
(74.5%). Shorebirds, composed entirely of killdeer, made up 11.7% of all incidental
observations while waterfowl represented the remaining 13.8% of observations.
For a complete list of species observed during diurnal raptor monitoring refer to
Appendix I.

___________________________________________________________________________ Natural Resource Solutions Inc. St. Joseph Wind Energy Project Environmental Characterization Report
33
Additional Raptor Observations
A number of raptor observations occurred during different bird surveys throughout the
monitoring period. To ensure that raptors occurring in the study area are accurately
represented in this report, raptor observations for the entire monitoring period are
summarized below.
Table 11 displays all raptors observed during the 2007 and 2008 monitoring periods,
including incidental observations, and during which surveys they were observed. A total
of 7 species were identified in the study area, none of which are considered a
conservation priority in Manitoba or a significant species by COSEWIC (Committee of
the Status of Endangered Wildlife in Canada). Preferred habitat for 6 of the 7 raptor
species observed is present in the study area.
Preferred habitat for the bald eagle (Haliaeetus leucocephalus), such as large bodies of
open water, is not present in the study area. One bald eagle was observed on October
9 and another on October 24, both observed from migration station BMM-001 during the
fall migration surveys. In both instances, bald eagles were recorded as incidental
observations as a result of their distance from the observer. Station BMM-001/HWK-001
is the closest bird monitoring station to the Red River which provides ideal feeding
habitat for the eagles.
Preferred foraging habitat for the northern harrier, sharp-shinned hawk (Accipiter
striatus), red-tailed hawk, prairie falcon (Falco mexicanus) and merlin (Falco
columbarius) exists within the study area. These species all prefer areas of open field or
edge habitat such as hedgerows. The northern harrier was the only raptor species
observed during the breeding bird surveys, and it is the only raptor species for which
appropriate breeding habitat occurs in the study area.
Results of raptor spring migration counts in 2005 and 2006 by A Rocha Canada near the
study area (approximately 50km southwest) have indicated that large numbers of raptors
migrate through the area from March to April (Schritt et al., 2007). During these counts,
a total of 17,580 individuals were counted during the two spring counts, the most
common species being red-tailed hawk. Additional species observed during these raptor
counts that were not observed in the study area include: turkey vulture (Cathartes aura),

___________________________________________________________________________ Natural Resource Solutions Inc. St. Joseph Wind Energy Project Environmental Characterization Report
34
osprey (Pandion haliaetus), Cooper‟s hawk (Accipiter cooperii), northern goshawk
(Accipiter gentilis), Swainson‟s hawk (Buteo swainsoni), Ferruginous hawk (Buteo
regalis), golden eagle (Aquila chrysaetos), American kestrel (Falco sparverius), and
peregrine falcon (Falco mexicanus).
Table 11. Raptor Observations in the St. Joseph Study Area
HAWKS, KITES & EAGLES
Spring 2007
Migration Fall
Migration Breeding
Birds
Diurnal Raptor surveys
Spring 2008
Migration Nest Site Habitat
Preference
Bald Eagle 2 TR L
Northern Harrier 9 32 2 5 5 GR OP
Sharp-shinned Hawk 2 TR M, ED
Red-tailed Hawk 3 35 1 TR M, ED
Rough-legged Hawk 1 1
CL, TR, AN OP
Raptor Sp. 2 15 4 1
Buteo Sp. 15 72 1
Accipiter Sp. 2
Eagle Sp. 2
CARACARAS & FALCONS
Merlin 3 TR, AN OP, M, ED
Prairie Falcon 2 OP
LEGEND
Nest Site Habitat Preference
TR-Tree ED-edge, hedgerow, scattered trees
GR-Ground L-lakes, ponds, calm water
CL-Cliff M-mature dense woodland
AN-Abandoned Nest OP-open field
5.4 Breeding Birds
5.4.1 Study Methodology
Breeding bird monitoring stations were set up independently of the bird migration and
diurnal raptor monitoring sites (see Figure 3). A total of 40 breeding bird point count
stations were monitored to observe evidence of breeding in the initial study area.
Station selection followed Environment Canada‟s recommended protocols (Environment
Canada 2007), with 21 stations placed in the dominant habitat type, agricultural. Based

___________________________________________________________________________ Natural Resource Solutions Inc. St. Joseph Wind Energy Project Environmental Characterization Report
35
on the limited extent of riparian and hedgerow habitat, an additional 10 and 9 stations
were respectively placed in these two habitat types. All 40 stations had a radius of
approximately 100m and were distributed equally throughout the study area.
The surveys occurred on June 3, 4, 6, 7, 19, 20, 22, and 23, 2007. These dates are
within the peak period for assessing breeding birds in this portion of Manitoba. Each
station was surveyed twice at least 10 days apart, following Environment Canada‟s
recommended protocols (2007), with the exception of BMB-004 and BMB-024. These
two stations were only surveyed once because poor weather resulted in very poor road
conditions, making these stations inaccessible.
The activity of bird species encountered during these surveys was noted using a
standard breeding bird monitoring methodology, recording the highest breeding
evidence observed during the field visit. A data sheet and complete list of all species
observed during breeding bird surveys are appended to this report (see Appendix I).
Point counts were performed according to the Environment Canada Guidelines
(Environment Canada 2007). Bird species, activity, number of individuals and distance
from the observer were recorded. Stations were monitored during early morning hours,
beginning a half hour before sunrise and ending before 1000hrs. Each station was
monitored for 10 minutes. The data were then analyzed to determine the relative
abundance of species within the study area based on the individuals recorded within the
100m point count radius. The remaining individuals beyond this distance were recorded
as incidental observations.
5.4.2 Results
During the 2007 breeding bird surveys, a total of 1,693 individual birds, representing 38
species were observed by NRSI. The three most abundant species observed were red-
winged blackbird, representing 38% of all observations, followed by brown-headed
cowbird (Molothrus ater) and Brewer‟s blackbird (Euphagus cyanocephalus) which
represented 12.6% and 6.5% of all observations respectively. All observations were of
individual birds or small groups of birds (2-30 individuals). No large flocks were
observed during the breeding bird surveys.

___________________________________________________________________________ Natural Resource Solutions Inc. St. Joseph Wind Energy Project Environmental Characterization Report
36
All observations were classified according to bird group (Table 12). Landbirds
represented over 90% of all individuals observed. These observations were expected
given that the majority of habitat in the study area is active agricultural land or meadow,
and is very attractive to landbirds. The remaining groups were represented by much
smaller numbers of individuals. Waterfowl, mostly consisting of Canada geese and
mallards, represented 5.2% of all individuals observed and shorebirds represented
3.7%. Raptors and waterbirds represented the two lowest percentages of total birds
observed at 0.3% and 0.2% respectively.
Table 12. Observations During Breeding Bird Surveys by Bird Group
Bird Group
# of Individuals
# of Species
% of Total Observation
Landbird 1536 31 90.7
Waterfowl 85 3 5.0
Shorebird 64 1 3.8
Raptor 5 1 0.3
Waterbird 3 2 0.2
TOTAL 1693 38 100.0
Table 13 displays the habitat type at each breeding bird station. Monitoring stations
were classified as agricultural (A), hedgerow (H), or riparian (R). The number of
observations between habitat types was comparable. Table 13 also displays the
number of individuals observed at each station by visit, and the total number of species
observed at each station.
The highest single visit number of individuals was observed during the first visit to station
BMB-028 on June 8, with 61 birds observed. This relatively high number of observations
was the result of 25 brown-headed cowbirds and 10 red-winged blackbirds being present
at the station. Large numbers of birds were also observed at BMB-019 (60 individuals)
on June 23, when in addition to many individuals, a flock of 32 Brewer‟s blackbirds was
recorded. In contrast, the lowest number of individuals was observed at station BMB-
035 (1st visit) on June 6 when only 2 savannah sparrows (Passerculus sandwichensis)
were observed, and at station BMB-017 (2nd visit) on June 19 when only 1 American
crow and 1 killdeer were observed.

___________________________________________________________________________ Natural Resource Solutions Inc. St. Joseph Wind Energy Project Environmental Characterization Report
37
The greatest diversity of species was observed in hedgerow habitat, which averaged
10.6 species per station. The highest single station species diversity was recorded at
station BMB-041, a hedgerow station, where a total of 16 species were recorded over
two visits. Riparian habitat had the second highest species diversity, averaging 9.2
species per station, and agricultural habitat had the lowest diversity, averaging 8.8
species per station.
Out of the 38 species observed during the breeding bird surveys, 36 displayed some
evidence of breeding in the study area. Breeding evidence was recorded as possible
(PO), probable (PR) or confirmed (CO). Twenty one species displayed possible
breeding evidence which included observing them in their preferred breeding habitat
and/or hearing males singing. Eight species were recorded as probable breeders in the
study area because they were observed in pairs or demonstrated some form of territorial
behaviour. The remaining seven species were confirmed to be breeding in the study
area through observations of distraction displays, adults carrying food, adults occupying
a nest, or observation of a nest containing eggs.
For a complete list of species observed during the breeding bird surveys refer to
Appendix I. Appendix II lists the birds observed during breeding bird surveys and the
highest evidence or breeding they exhibited.
Incidental Observations
All birds observed during the breeding bird surveys were recorded, however, only birds
observed within 100m were included in analysis. An additional 639 birds were observed
during these surveys greater than 100m from the observer. One species, the double-
crested cormorant (Phalacrocorax auritus), was observed outside the survey area but
not within the 100m to be included in the analysis. All other incidental observations were
of species that were also observed within the 100m survey area.

___________________________________________________________________________ Natural Resource Solutions Inc. St. Joseph Wind Energy Project Environmental Characterization Report
38
Table 13. Number of Individual Birds Observed by Habitat Type and Station
BMB Station # Habitat Type
Total # of Birds Total Number of Species
Visit #1 Visit #2
001 A 20 24 9
002 A 10 37 8
003 A 24 33 8
004 H ------ 57 5
006 A 14 30 12
007 A 19 16 8
008 H 29 31 13
009 A 23 12 10
010 A 15 8 9
011 A 32 40 9
012 A 22 46 12
013 H 35 28 13
014 A 16 15 7
015 H 16 32 9
016 A 18 42 9
017 A 7 2 4
018 A 15 17 10
019 H 26 60 12
020 R 9 18 8
021 A 17 14 8
022 A 11 12 6
023 R 8 11 8
024 H ------ 7 4
025 R 20 29 9
026 A 10 19 5
027 A 6 14 10
028 A 61 23 12
029 R 14 26 8
030 H 13 19 14
031 A 7 37 7
032 R 27 16 7
033 R 30 25 10
034 R 39 20 11
035 H 2 16 6
036 R 31 20 9
037 H 21 21 11
038 A 3 19 12
039 H 27 38 14
040 R 25 34 13
041 H 10 39 16
* ---- Station not monitored due to road conditions

___________________________________________________________________________ Natural Resource Solutions Inc. St. Joseph Wind Energy Project Environmental Characterization Report
39
5.5 Lek Surveys
5.5.1 Study Methodology
Some ground birds, such as sharp-tailed grouse (Tympanuchus phasianellus), are
known to gather in groups called leks to perform courtship displays. Lek surveys can be
conducted from mid-March to May, depending on spring weather conditions. Peak
activity at the leks begins in mid-April. Under ideal conditions (e.g., cool, no wind, no
hills, no trees), dancing behaviour can be heard at distances up to 1000m (A.S.R.D.
2005). Surveys were conducted along transects throughout the study area to determine
if any leks were actively using land within the study area for breeding.
Lek surveys occurred on May 11, 12, 13, 24, and 25. NRSI biologists drove along
transect routes looking and listening for any evidence of leks in the area on mornings
prior to migration monitoring. Transects were searched in the early morning hours when
activity at leks would be at its peak. Birds are known to start arriving at the dancing
ground one hour before sunrise and stay until two or three hours after sunrise (Ministry
of Environment BC 1997). The surveys were conducted between 0700hrs and 0900hrs
in order to observe this activity. All non-ground bird observations were recorded as
incidental observations during lek surveys. Results of the lek surveys are provided in
Section 5.3.4.
5.5.2 Results
Over the course of the 2007 monitoring period no leks were observed in the initial study
area. Lek surveys within the study area were focused on searching for sharp-tailed
grouse. During focused lek surveys no partridges, grouse or turkeys were observed.
Incidental Observations
All birds observed incidentally during lek transect surveys were recorded. A total of 291
birds were observed, representing 23 species. The majority of these observations
(61.9%) were of landbirds, mostly consisting of blackbird species. Waterfowl
represented 35.7% of all observations, the majority of which was due to the observation
of a large flock of tundra swans (98 individuals). A few raptors and shorebirds were also
observed representing 1.4% and 1% of observations respectively.

___________________________________________________________________________ Natural Resource Solutions Inc. St. Joseph Wind Energy Project Environmental Characterization Report
40
For a complete list of species observed during lek surveys refer to Appendix I.
5.6 Significant Species
No birds observed within the study area in 2007 are considered a conservation priority
(Manitoba Conservation Data Centre 2001) or a Species at Risk (Manitoba Conservation
2008a and Government of Canada 2007). During the spring 2008 monitoring period,
American white pelicans were observed within the study area. This species is
considered uncommon in the province (Manitoba Conservation Data Centre 2001) but
Not at Risk (Manitoba Conservation 2008a and Government of Canada 2007).
The study area is located in the Lake Manitoba Plain Ecoregion of Manitoba (Manitoba
Conservation 2001). Within this Ecoregion, Manitoba Conservation lists 12 species of
birds to be species of conservation concern. These species, their Sub-national ranks
(Srank) and their provincial and national Species at Risk designations are listed in Table
11. Habitat for five of these species potentially exists within the study area which is
discussed below in more detail.
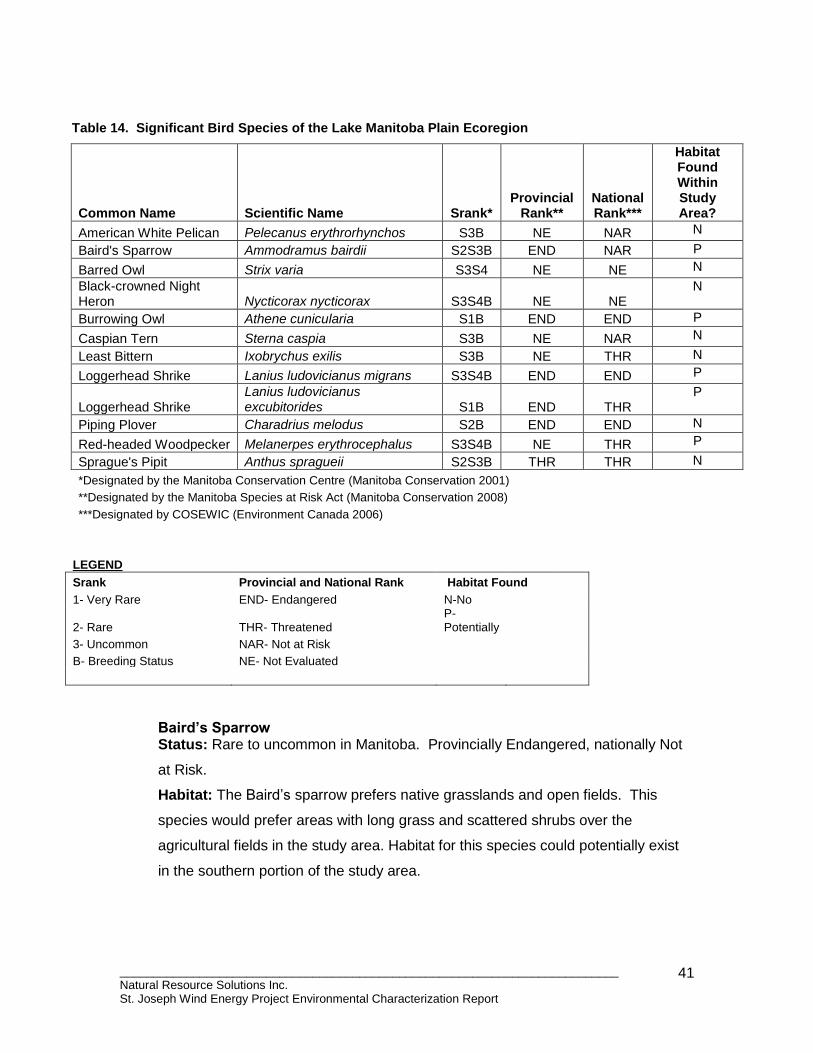
___________________________________________________________________________ Natural Resource Solutions Inc. St. Joseph Wind Energy Project Environmental Characterization Report
41
Table 14. Significant Bird Species of the Lake Manitoba Plain Ecoregion
Common Name Scientific Name Srank* Provincial
Rank** National Rank***
Habitat Found Within Study Area?
American White Pelican Pelecanus erythrorhynchos S3B NE NAR N
Baird's Sparrow Ammodramus bairdii S2S3B END NAR P
Barred Owl Strix varia S3S4 NE NE N
Black-crowned Night Heron Nycticorax nycticorax S3S4B NE NE
N
Burrowing Owl Athene cunicularia S1B END END P
Caspian Tern Sterna caspia S3B NE NAR N
Least Bittern Ixobrychus exilis S3B NE THR N
Loggerhead Shrike Lanius ludovicianus migrans S3S4B END END P
Loggerhead Shrike Lanius ludovicianus excubitorides S1B END THR
P
Piping Plover Charadrius melodus S2B END END N
Red-headed Woodpecker Melanerpes erythrocephalus S3S4B NE THR P
Sprague's Pipit Anthus spragueii S2S3B THR THR N
*Designated by the Manitoba Conservation Centre (Manitoba Conservation 2001)
**Designated by the Manitoba Species at Risk Act (Manitoba Conservation 2008)
***Designated by COSEWIC (Environment Canada 2006)
LEGEND
Srank Provincial and National Rank Habitat Found
1- Very Rare END- Endangered N-No
2- Rare THR- Threatened P- Potentially
3- Uncommon NAR- Not at Risk
B- Breeding Status NE- Not Evaluated
Baird’s Sparrow Status: Rare to uncommon in Manitoba. Provincially Endangered, nationally Not
at Risk.
Habitat: The Baird‟s sparrow prefers native grasslands and open fields. This
species would prefer areas with long grass and scattered shrubs over the
agricultural fields in the study area. Habitat for this species could potentially exist
in the southern portion of the study area.
___________________________________________________________________________ Natural Resource Solutions Inc. St. Joseph Wind Energy Project Environmental Characterization Report
42
Burrowing Owl
Status: Very rare in Manitoba. Provincially and nationally Endangered.
abitat: The burrowing owl requires treeless plains largely free of visual
obstructions, such as grasslands grazed by livestock. As well, grasslands with
thicker vegetation which support the small mammals they eat need to be close by
(Environment Canada 2006). It uses burrows abandoned by ground-dwelling
mammals to nest in and is sometimes found in agricultural areas. This species
could locate potential habitat in the study area.
Loggerhead Shrike (migrans subspecies)
Status: Uncommon or possibly secure in Manitoba. Provincially and nationally
Endangered.
Habitat: The loggerhead shrike migrans subspecies prefers open, grazed habitat
for feeding with scattered trees and shrubs for perching and nesting (Environment
Canada 2006). Intensive agriculture and the resulting reduction in the land used
for grazing has decreased habitat for this species substantially. Although the
study area is comprised mainly of agricultural fields, the scattered hedgerows and
abundant open areas may provide adequate habitat for this species.
Loggerhead Shrike (excubitorides subspecies)
Status: Very rare in Manitoba. Provincially Endangered and Nationally
Threatened.
Habitat: The loggerhead shrike excubitorides subspecies prefers open habitats,
including grasslands, sagebrush stands, pastures, agricultural areas and thinly
wooded areas. It nests in small bushy trees and dense or thorny shrubs
(Environment Canada 2006). Suitable habitat for nesting occurs within the study
area but the required native grassland component of required habitat is missing. It
is therefore unlikely that this subspecies would be found in the study area.
Red-headed Woodpecker
Status: Uncommon or possibly secure in Manitoba. Provincially has not been
evaluated, nationally Threatened.
Habitat: The red-headed woodpecker is found in a variety of habitats including
thinly treed deciduous forests, woodland and field edges, but also urban parks,

___________________________________________________________________________ Natural Resource Solutions Inc. St. Joseph Wind Energy Project Environmental Characterization Report
43
farmyards and marsh (Environment Canada 2006a). Habitat for this species
potentially exists along the wooded riparian corridor in the southern portion of the
study area however, it prefers savanna-like grasslands with forest edges and
scattered trees.
According to the Species at Risk Public Registry, two of these species, the least bittern
and Sprague‟s pipit, have range maps that overlap with the study area (Environment
Canada 2006b). Additionally, the Species at Risk Public Registry (Government of
Canada 2007) indicates that the yellow rail (Coturnicops noveboracensis) also has range
map that overlaps with the study area. The yellow rail is considered Special Concern by
COSEWIC but is not considered at this time to be provincially significant by Manitoba
Conservation. Suitable habitat for the yellow rail, which prefers wet habitat such as
marshes, wet meadows and floodplains, does not occur within the study area.
NRSI biologists observed American white pelicans flying through the study area,
although it is unlikely this species would utilize habitat within the study area. One flock
of 40 pelicans was observed flying approximately 150m in the air, indicating they were
traveling through the area. The American white pelican prefers habitat near lakes in
treed and treeless areas. It nests in colonies on islands of interior lakes. Suitable
habitat for this species does not exist within the study area.
No rare bird species were recorded by NRSI biologists during the 2007 or 2008
monitoring periods, and Manitoba Conservation has no records of any rare or
endangered species within the boundaries of the study area (Firlotte 2008).
5.7 Partners in Flight Priority Species
The study area is located within Conservation Region (BCR) 11 in Canada Landbird
Conservation Plan (Canadian Prairie Partners in Flight 2004). Twenty-five priority bird
species are found within the Canadian Portion of BCR 11 (Table 15) which merit
conservation concern due to large or important populations within the region or overall
global or regional, importance due to declining populations. NRSI observed four of
these priority species within the study area: northern harrier, prairie falcon, clay-colored
sparrow (Spizella pallida), and bobolink (Dolichonyx oryzivorus).

___________________________________________________________________________ Natural Resource Solutions Inc. St. Joseph Wind Energy Project Environmental Characterization Report
44
Table 15. Priority Landbirds in Bird Conservation Region 11
Scientific Name Common Name Habitat Requirements Reason for Concern
Centrocercus urophasianus Great Sage-Grouse Sagebrush Stands, lek sites Habitat loss
Tympanuchus phasianellus Sharp-tailed Grouse grassland, wetland, WD, lek sites
Habitat disturbance, particularly at leks
Circus cyaneus Northern Harrier open habitat Habitat disturbance
Buteo swainsoni Swainson's Hawk open habitat loss of prey availability
Buteo regalis Ferruginous Hawk open habitat, grassland Habitat loss and disturbance
Aquila chrysaetos Golden Eagle grasslands, thickets
Collision with infrastructure, lead poisoning, and habitat loss
Falco mexicanus Prairie Falcon open habitat, grassland
Human disturbance, management of prey
Coccyzus erythropthalmus Black-billed Cuckoo thicket Habitat disturbance, management of prey
Nyctea scandiaca Snowy Owl open habitat, thicket Knowledge deficiency
Athene cunicularia Burrowing Owl open habitat management of prey, habitat fragmentation
Asio otus Long-eared Owl wetland and grassland Habitat loss
Asio flammeus Short-eared Owl open habitat, wetland habitat loss
Lanius ludovicianus Loggerhead Shrike open habitat habitat loss due to agricultural practices
Cistothorus platensis Sedge Wren open habitat Habitat loss and disturbance
Anthus spragueii Sprague's Pipit grassland Habitat loss due to invasives, pesticide use
Bombycilla garrulus Bohemian Waxwing Fruit-bearing trees or shrubs Knowledge deficiency
Spizella pallida Clay-colored Sparrow thicket, open habitat habitat disturbance
Calamospiza melanocorys Lark Bunting Knowledge deficiency
Ammodramus savannarum Grasshopper Sparrow grassland habitat disturbance, pesticide use?
Ammodramus bairdii Baird's Sparrow grassland Habitat loss and disturbance, pesticide use
Ammodramus leconteii Le Conte's Sparrow open habitat, grassland habitat loss
Ammodramus nelsoni Nelson's Sharp-tailed Sparrow Wetland Habitat loss
Carcarius mccownii McCown's Longspur grassland habitat disturbance, pesticide use?
Calcarius ornatus Chestnut-collared Longspur grassland habitat disturbance
Dolichonyx oryzivorus Bobolink grassland habitat disturbance

___________________________________________________________________________ Natural Resource Solutions Inc. St. Joseph Wind Energy Project Environmental Characterization Report
45
5.8 Aerial Flight Displays
Several species of birds are known to perform aerial flight displays, which may put them
at higher risk of collision with operational turbines. During the bird monitoring period, 3
species known to perform aerial flight displays were observed. These birds include
bobolink (Dolichonyx oryzivorus), horned lark (Eremophila alpestris), and vesper
sparrow (Pooecetes gramineus).
Bobolinks perform song flights which can reach 2-40m in height which is just below the
height of the turbine blades. These song flights are frequent during the breeding season
(Martin and Gavin 1995). Horned larks song flight can be as high as 80-250 m in height
and can last from less than a minute to 8 minutes in length. Because of the height of
their flight, they run the risk of collision with turbine blades (Beason 1995). Vesper
sparrows ascend to approximately 25-75m before flying horizontally for approximately
100-200m. These activities put them into the blade sphere of the turbine range and
therefore run the risk of collision with turbine blades (Jones and Cornely 2002).
5.9 Significant Bird Areas
There are no Important Bird Areas (IBA‟s) in or around the study area (IBA Canada
2004).
5.10 Discussion
In order to record an accurate representation of local and migratory bird abundance and
activities within the study area several different survey techniques were employed.
These surveys included spring and fall migration monitoring, breeding bird surveys,
daytime raptor surveys and lek transects. Over the course of the 2007 and 2008
monitoring period a total of 21,006 birds were observed representing 88 different
species.
The majority of observed species observed were landbirds, the most abundant species
being sparrows and blackbirds. Large flocks of geese were also observed during most
surveys. It is apparent through observations while driving to and from the study area
that the Red River is an important staging area for waterfowl and an important migratory
corridor for birds.

___________________________________________________________________________ Natural Resource Solutions Inc. St. Joseph Wind Energy Project Environmental Characterization Report
46
The majority of the species observed within the study area are likely local residents of
the area, and therefore displayed evidence of breeding in the area. Small passerines
were often observed foraging within hedgerows and farm fields.
Manitoba Conservation lists 11 species of birds as a “conservation concern” within the
Lake Manitoba Plain Ecoregion. Suitable habitat for 5 of these species potentially exists
within the study area. NRSI biologists did not observe any significant bird species within
the study area during the 2007 surveys.

___________________________________________________________________________ Natural Resource Solutions Inc. St. Joseph Wind Energy Project Environmental Characterization Report
47
6.0 Bats
6.1 Introduction
There are six species of bats that are indigenous to Manitoba, all of which have ranges
that overlap with the study area. Review of background sources, topographic mapping,
aerial photographs, on-site vegetation mapping, and agency consultation were all used
to analyze the habitats within the study area for the potential to concentrate bat activity.
Additionally, NRSI biologists conducted acoustic bat monitoring from May to September
2007 in order to collect data on spring migrants, summer swarming and fall migration
activities. Following the 2007 monitoring period the study area was extended to include
lands south and east of the initial study area.
6.2 Study Methodology
To date, the Province of Manitoba has not produced any recommended guidelines for
monitoring bats at potential wind farm sites (Watkins pers. comm. 2008). Therefore,
recommended protocols developed in Ontario (OMNR 2007) and Alberta (AFWD 2005)
were consulted to guide bat monitoring at the St. Joseph Wind Farm study area.
Monitoring was conducted at six stations (see Figure 22) on a total of 33 nights (from
dusk to dawn), beginning on May 21st and lasting through September 9th, focusing on the
known periods of increased bat activity. Monitoring occurred on the following nights in
2007:
May 21/22, 22/23, 23/24, 24/25
July 23/24, 24/25,
August 1/2, 2/3, 6/7, 7/8, 18/19, 19/20, 29/30, 30/31
September 6/7, 7/8, 8/9
On all of the above dates except one, monitoring occurred at more than one station on
the same night, contributing to the overall 33 nights of monitoring.
The monitoring stations were selected based on initial project boundaries in habitats that
appeared to be representative of the habitat found within the initial study area, and were
located near areas proposed for turbine placement. Descriptions of each of the
monitoring stations including general location and habitat type are provided below.

___________________________________________________________________________ Natural Resource Solutions Inc. St. Joseph Wind Energy Project Environmental Characterization Report
48
BAT-001
This station is located on the south side of Mile 8 Road North, east of Mile 1 Road East. The station was set up adjacent to a pond surrounded by scattered deciduous trees. It is located approximately 450m from the nearest proposed turbine. BAT-002 This station is located on the north side of Mile 10 Road north, between Mile 2 Road East and Highway 420. It is located along a hedgerow of deciduous trees, adjacent to a riparian area, surrounded by agricultural fields. This station is approximately 760m from proposed turbines to the north. BAT-003 This station is located north of Highway 201, east of Meridian Road. It is located along a young coniferous hedgerow surrounded by agricultural fields. It is located approximately 1.4 km from the nearest proposed turbine. BAT-004 This station is located north of Highway 201, just west of Mile 5 Road East. It is located on the edge of an agricultural field approximately 1.5km from the nearest proposed turbine. BAT-005 This station is located south of Mile 7 Road North, just east of Mile 4 Road East. It is located along a deciduous hedgerow adjacent to a riparian area, surrounded by agricultural fields. The nearest proposed turbine is approximately 660m to the north of the station. BAT-006 This station is located north of Mile 11 Road North, east of Mile 1 Road West. It is located along a mature deciduous hedgerow surrounded by agricultural fields. It is located less then 1.1km from the nearest proposed turbine location.
During the monitoring period, all six species of Manitoba bats are known to be active and
all have ranges that overlap with the proposed study area. This chosen monitoring
period corresponded to the anticipated periods of summer swarming and peak migration
of Manitoba‟s bat species.
Acoustic monitoring was used to gather information on usage rates of bats in different
areas and habitats within the study area. Data was collected and analyzed for the
presence of bat passes, and total passes through the night. Passage rates (passes/hr)
were calculated based on total number of passes recorded and length of monitoring
period, which give an indication of total activity recorded through the night. Bat „calls‟
were also recorded directly into laptop computers using Pettersson D240x ultrasonic
monitoring devices. The calls were recorded using a time expansion of 10x, and were

___________________________________________________________________________ Natural Resource Solutions Inc. St. Joseph Wind Energy Project Environmental Characterization Report
49
analyzed with SonoBat software, and compared with recorded calls of known species.
Call sonograms were compared on the basis of peak frequency, call length, call shape,
harmonics, and other acoustic attributes.
Bat call sonograms are often extremely variable and may share attributes with multiple
species. It has been well documented that even expert bat researchers may misidentify
bat species based on call sonograms. NRSI biologists have used large call libraries
from various sources, including previous projects, as a basis for call analysis.
In addition to acoustic monitoring, point counts along transects were conducted using a
handheld BATBOX III Ultrasonic Detector, to locate any large concentrations of bat
activity. No such large concentrations were found within the study area.


___________________________________________________________________________ Natural Resource Solutions Inc. St. Joseph Wind Energy Project Environmental Characterization Report
51
6.3 Results
Brief natural history information for each of the six bats with ranges that overlap the
study area is provided below. Information is based on Banfield (1974), Gerson (1984),
Barclay (1984), Van Zyll de Jong (1985), Firlotte (2008) and Asmundson and Larche
(1996).
Little Brown Bat (Myotis lucifugus) Manitoba Conservation has indicated that breeding occurrences of this species are common in Manitoba, while non-breeding occurrences are rare. In general for this species; winter concentrations may include tens of thousands but summer home range is poorly understood. Little brown bats will use a variety of different habitats, usually preferring forests with nearby rivers, creeks, or meadows. This species has also adapted to urban settings and will regularly roost in buildings. Little brown bats emerge relatively late at dusk and forage most actively for the first few hours following sunset. After this initial feeding period they congregate in night roosts, emerging again later in the night for a second foraging period. Little brown bats will return to hibernacula in September, congregating in caves and mines. Females will move from hibernation sites to nurseries in April, while males will remain in hibernation until mid-May. Little brown bats may move hundreds of kilometers to return to hibernacula from summer roosts. This species has secure populations in Manitoba. Big Brown Bat (Eptesicus fuscus) Found throughout southern Manitoba, big brown bats are the most urbanized of any Manitoba bat species, and are frequently found near cities and towns, foraging along streetlamps. They can be found in wooded and semi-open habitats and are the bat species most closely associated with buildings. Big brown bats often forage above meadows, ponds, rivers, and along streetlights in towns and cities. Roosting of this species regularly occurs in barns and other buildings. Occasionally they will roost under bark or within small rock crevices. They emerge early at dusk for an initial feeding period within 5 hours of sunset after which they return to their night roosts. Big brown bats are very cold tolerant, and will often not begin hibernation until late in the fall, sometimes as late as early December. Hibernation of this species occurs within Manitoba, often in close proximity to summer roosting sites. Of the three species known to hibernate in Manitoba, the big brown bat is the only one that has not been found to use caves. Big brown bats are usually the first bat to emerge from hibernation in early April. The population status of this species is unknown in Manitoba.

___________________________________________________________________________ Natural Resource Solutions Inc. St. Joseph Wind Energy Project Environmental Characterization Report
52
Red Bat (Lasiurus borealis) Red bats are a very distinctive, medium-sized, bat species. They are found throughout southern Manitoba during migratory periods but uncommon in mid summer. Isolated sightings of this species have been recorded as far north as the Northwest Territories. Red bats are known to be strong fliers and many records of this species have been found well outside of its distribution range. Red bats are one of Manitoba‟s three migrating bat species. During fall migration, they pass through southern Manitoba from late July to the end of September, returning in May during spring migration. Foraging of this species often occurs at or above tree height, sometimes as high as 200 m above the ground. Preferred foraging habitats include hilly forest, streams, ponds, and can sometimes be found foraging in towns near streetlights. Roosting of this species will usually occur solitarily in trees. They typically emerge 30 minutes after sunset and peak activity occurs 2-3 hours after sunset. The population status of this species is unknown in Manitoba.
Hoary Bat (Lasiurus cinerus) Hoary bats are Manitoba‟s largest species of bats, and one of the most distinctive. They are a solitary species, often roosting high in the trees, usually on the edge of clearings or fields. Hoary bats will emerge from their daytime roosts late in the evening to forage among forested habitats, often near open meadows or lakes within a forested community. In Manitoba they are active from 30 minutes after sunset until just before sunrise. As one of Manitoba‟s three migratory bat species, hoary bats do not usually arrive in Manitoba until late May or early June. In Canada, fall migration takes place from mid-August to October, and peaks in Manitoba during the first week of September. The majority of hoary bats will over winter in the United States or Mexico. Migratory populations of hoary bats are abundant and secure in Manitoba. Silver-haired Bat (Lasionycteris noctivagans) As one of Manitoba‟s three migrating species, silver-haired bats will usually remain in Manitoba until August and September before migrating south to the United States. After hibernation, silver-haired bats will usually return to Manitoba in late May to early June. Distribution of this species stretches north of Lake Winnipeg, with the majority of the known populations occurring in southern Manitoba. Silver-haired bats can often be found foraging near forested habitats, above lakes and streams for aquatic insects. They prefer wooded habitat but may be found in open areas during migration. Summer roosting will usually occur in hollow trees, loose bark, or large, abandoned bird nests. In Manitoba, this species is active from 30 minutes after sunset until just before sunrise. Migratory populations of this species are abundant and secure in Manitoba.
___________________________________________________________________________ Natural Resource Solutions Inc. St. Joseph Wind Energy Project Environmental Characterization Report
53
Northern Long-eared Bat (Myotis septentrionalis) Northern long-eared bats can be found foraging in forested areas with nearby meadows and rivers. They emerge shortly after sunset in the summer to forage, with a secondary peak in activity 7-8 hours after sunset. Roosting habitats of this species can include under tree bark, rock crevices, and sometimes behind shutters or under shingles. In winter they commonly hibernate in caves or old mines but never in large numbers. This species can be found within much of southern Manitoba. Northern long-eared bats will often use the same hibernation sites as little brown bats and begin hibernation in late October, emerging again in early May. The population status of this species is unknown in Manitoba.
NRSI biologists identified the presence of hoary bat, red bat, and big brown/silver-haired
bat within the St. Joseph study area. Big brown and silver-haired bats are often difficult
to differentiate based on recordings as they are known to have very similar call
characteristics (OMNR 2006). These two species are often combined together when
analyzing bat sonograms. At least two of Manitoba‟s three migratory bat species, red
bat and hoary bat, have been identified within the study area. The third species, silver-
haired bat may also be present, but separation of silver-haired bat from the common big
brown bat based on call sonogram is very difficult.
Of the three bat species known to over-winter in Manitoba, (little brown bat, big brown
bat and northern long-eared bat), only the big brown bat was recorded within the study
area. The closest known caves that act as bat hibernacula in Manitoba are located more
then 270km north of the study area. There are no known bat hibernacula or caves in or
near the study area (Asmundson and Larche 1996; Firlotte 2008). The lack of forest
cover may discourage resident species, particularly little brown bats and northern long-
eared bats, from occurring in the study area.
The most commonly recorded calls were of big brown/silver-haired bats. Although
difficult to distinguish between the later two species, based on the habitat within the
study area and the availability of barns for roosting in the area, it is expected that a
majority of these calls are of local populations of big brown bats. Red bat and hoary bat
calls were recorded in late July and August. This time period corresponds to a time
period when bats are expected to be migrating through the area, and may suggest that
some bat migration occurs through the study area at this time.

___________________________________________________________________________ Natural Resource Solutions Inc. St. Joseph Wind Energy Project Environmental Characterization Report
54
Abundance results for the spring migration period and the summer swarming/fall
migration period are discussed separately below.
6.3.1 Spring Migration
The Alberta Fish and Wildlife Department recommend that bat monitoring be conducted
between May and September in their pre-construction protocols (AFWD 2005). The St.
Joseph Wind Farm study Area is considered a “Medium Sensitivity” site according to the
criteria in the Ontario government‟s guidelines for monitoring potential impacts to bats at
wind power locations and therefore the Ontario guidelines only recommend monitoring
from August through mid-September (OMNR 2007).
Based on the little information available on bat movements through Manitoba, NRSI
decided to conduct bat monitoring during the anticipated period of spring bat migration.
However, based on the recommendations and guidelines for both Alberta and Ontario,
the spring bat migration monitoring effort was considerably less then the summer and fall
monitoring effort. Monitoring took place on four nights at the end of May, during which a
total of 16 bat passes were recorded in 18.2 hours of acoustic monitoring, resulting in an
overall passage rate of 0. 9 passes/hr.
Monitoring station BAT-001 had the highest passage rate of 1.8 passes/hr. This station
is located near the edge of a pond, surrounded by deciduous trees which likely provides
attractive foraging habitat for bats in the area. Passage rates varied considerably
throughout the night with peaks in activity between 2030hrs and midnight and secondary
peaks in activity between 0230hrs and 0530hrs.
No concentrations of bats were observed during the spring monitoring period.
6.3.2 Summer Swarming and Fall Migration
In order to accurately represent the periods of summer swarming and fall migration in
the study area, bat monitoring was conducted from late July through mid-September. A
total of 509 bat passes were recorded in 152 hours of acoustic monitoring, resulting in
an overall passage rate of 3.3 passes/hr.

___________________________________________________________________________ Natural Resource Solutions Inc. St. Joseph Wind Energy Project Environmental Characterization Report
55
Monthly Abundance Trends
The chosen monitoring period of late July through mid September is expected to
encompass peak periods of bat activity, including the summer swarming and fall
migration periods of Manitoba bat species. Data collected during the entire monitoring
period was analyzed by date to determine if periods of increased bat activity were
recorded within the study area during expect periods of increased bat activity. Average
passage rates in August (5.3 passes/hr) were noticeably higher then July or September
which were 0.5 passes/hr and 1.1 passes/hr respectively. These trends in bat activity
correspond to the period of summer swarming activity, overlapping with the initial stages
of fall migration of Manitoba‟s migratory bat species.
Analysis by date revealed that consistent activity was recorded from late July through
early August, peaking on August 18/19 (see Figure 23). During this time period, average
passage rates were recorded between 0.1 and 1.4 passes/hr on 8 monitoring nights,
peaking at 17.5 passes/hr. The remainder of the monitoring period had consistently
lower average passage rates, with a small activity peak of 2 passes/hr in early
September. These dates are more typical of fall migration of Manitoba‟s migratory bat
species, and may suggest the presence of limited bat migration through the study area.
Passage rates are lower than would be expected of an area of concentrated activity.
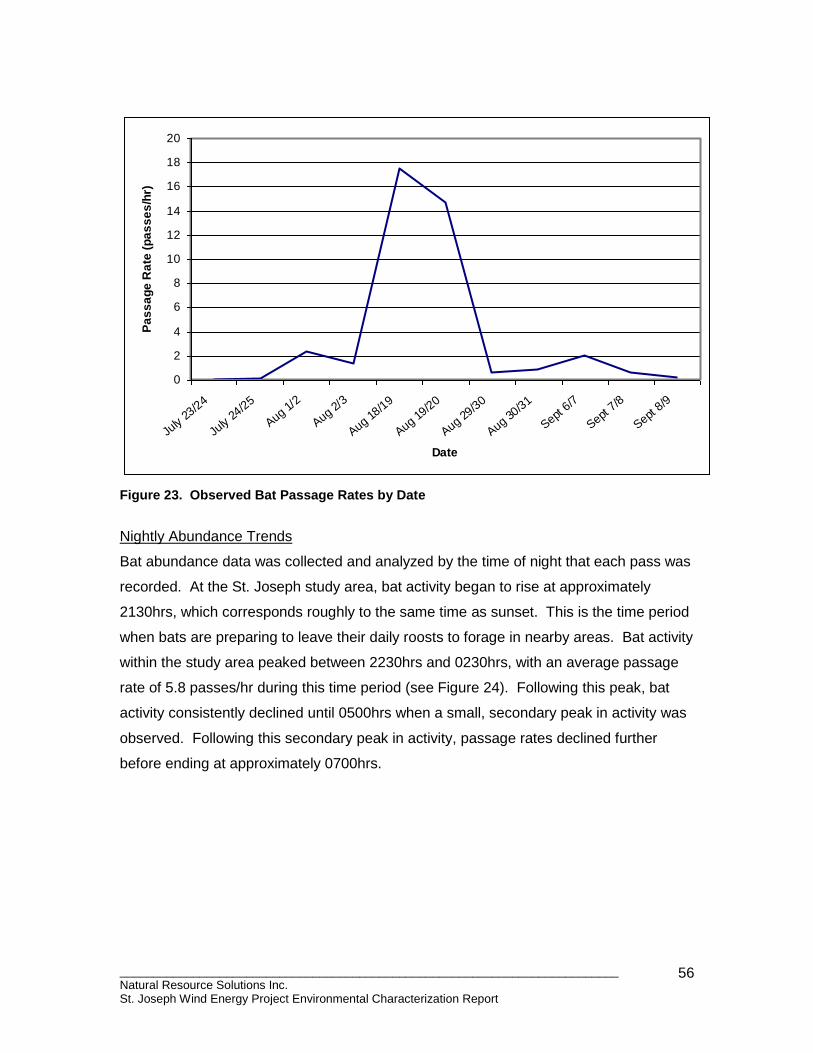
___________________________________________________________________________ Natural Resource Solutions Inc. St. Joseph Wind Energy Project Environmental Characterization Report
56
0
2
4
6
8
10
12
14
16
18
20
July
23/2
4
July
24/2
5
Aug 1/
2
Aug 2/
3
Aug 18
/19
Aug 19
/20
Aug 29
/30
Aug 30
/31
Sept 6
/7
Sept 7
/8
Sept 8
/9
Date
Pa
ss
ag
e R
ate
(p
as
se
s/h
r)
Figure 23. Observed Bat Passage Rates by Date
Nightly Abundance Trends
Bat abundance data was collected and analyzed by the time of night that each pass was
recorded. At the St. Joseph study area, bat activity began to rise at approximately
2130hrs, which corresponds roughly to the same time as sunset. This is the time period
when bats are preparing to leave their daily roosts to forage in nearby areas. Bat activity
within the study area peaked between 2230hrs and 0230hrs, with an average passage
rate of 5.8 passes/hr during this time period (see Figure 24). Following this peak, bat
activity consistently declined until 0500hrs when a small, secondary peak in activity was
observed. Following this secondary peak in activity, passage rates declined further
before ending at approximately 0700hrs.

___________________________________________________________________________ Natural Resource Solutions Inc. St. Joseph Wind Energy Project Environmental Characterization Report
57
0.0
0.5
1.0
1.5
2.0
2.5
3.0
3.5
4.0
4.5
5.0
5.5
6.0
6.5
7.0
1900 2000 2100 2200 2300 0000 0100 0200 0300 0400 0500 0600 0700
Time (hrs)
Pa
ss
ag
e R
ate
(p
as
se
s/h
r)
Figure 24. Bat Activity by Time of Night.
Abundance Trends by Location and Habitat
Four of the six bat stations were monitored at the St. Joseph Wind Farm study area
during the summer swarming and fall migration period (BAT-001, 004, 005, and 006).
The reduction in the number of stations monitored compared to the spring monitoring
period, was due to changes to the proposed turbine layout and general project
boundaries in mid summer. The four stations monitored were selected to represent a
variety of habitat types and general locations within the study area, and where possible,
stations monitoring in the spring were used again during the summer and fall monitoring
periods. Abundance data was analyzed by monitoring station in order to determine if
areas of concentrated bat activity are present within the study area. The highest
passage rate of any station was 8.7 passes/hr observed at BAT-001, which is located
near a pond surrounded by deciduous trees (see Figure 22). The other three stations
had much lower passage rates compared to BAT-001 (see Figure 25). These stations
were located along deciduous hedgerows and field edges.

___________________________________________________________________________ Natural Resource Solutions Inc. St. Joseph Wind Energy Project Environmental Characterization Report
58
The proximity to water and presence of suitable roosting habitat, in the form of nearby
deciduous trees, at station BAT-001 is likely the cause of the increased passage rate
observed at this station. All six bat species that occur in Manitoba are insectivorous,
feeding primarily on mosquitoes and midges which congregate near open water.
1.1
0.5
1.1
8.7
0.0
1.0
2.0
3.0
4.0
5.0
6.0
7.0
8.0
9.0
10.0
BAT-001 BAT-004 BAT-005 BAT-006
Monitoring Station
Pa
ss
ag
e R
ate
[p
as
se
s/h
r]
Figure 25. Average Bat Passage Rates by Station.
Distance from the shoreline of the Red River does not appear to influence bat activity
within the St. Joseph study area. This trend is unlike other similar multi-station projects
near major shoreline that appeared to be influenced by proximity to the shoreline, with
higher passage rates observed at stations found closer to major shorelines. All
monitoring stations, with the exception of BAT-001, had very similar passage rates, and
represented varying distances from nearby large or small bodies of water. Monitoring
station BAT-004, the closest to the Red River shoreline, had very few passes recorded,
averaging 1.1 passes/hr. Passage rates observed at monitoring stations within the St.
Joseph study area had much lower passage rates than would be expected of an area
with concentrated bat activity, such as forested ridge, known hibernacula, or
concentrated migratory pathway.

___________________________________________________________________________ Natural Resource Solutions Inc. St. Joseph Wind Energy Project Environmental Characterization Report
59
6.4 Significant Species
Currently, no bat species that occur in Manitoba are protected by Manitoba‟s
Endangered Species Act or listed by COSEWIC. The little brown bat is considered to
have widespread and secure breeding populations in the province (S5B) but its summer
home range is poorly understood and considered rare in Manitoba (S2N) (MB
Conservation Data Centre 2001).
6.5 Discussion
The preceding sections discuss the results of the bat monitoring conducted during the
spring, summer and fall of 2007 at the St. Joseph Wind Farm by Natural Resource
Solutions Inc. This included surveys of bat habitat, abundance trends, and bat species
within the study area.
The monitoring periods of late May and July through late September correspond to the
spring migration, summer swarming and fall migration periods of Manitoba‟s bat species.
During these time periods, all six bat species known within Manitoba are expected to be
present and active.
The habitat found within the initial study area consists primarily of active agricultural
fields, mainly composed of rotational crops of canola, soy, and hayfields. Also present
within the study area are scattered hedgerows, drainage ditches, farm structures, and
agricultural ponds. These habitat types are expected to provide limited roosting habitat
for local bat populations. Snags, buildings, and riparian and aquatic habitat are
considered significant bat habitat (OMNR 2006) and are all present within the study
area. Other significant bat habitats, caves and abandoned mines, are not present within
the proposed study area (Asmundson and Larche 1996, Firlotte 2008). Two turbines are
approximately 1 km from the shoreline of the Red River, which could be considered a
concentrating factor for bat populations (OMNR 2007). Other concentrating factors,
including forested ridges and known hibernacula or maternity roosts, are not present
within the proposed study area.

___________________________________________________________________________ Natural Resource Solutions Inc. St. Joseph Wind Energy Project Environmental Characterization Report
60
During spring migration monitoring, bat activity was observed to be minimal and an
average passage rate of 0.9 passes/hr was recorded. Station BAT-001 was observed to
have a slightly higher passage rate then BAT-004 during this period.
During summer swarming and fall migration monitoring, an average passage rate of 3.3
passes/hr was recorded, peaking in mid-August. Bat activity began to peak prior to
midnight at approximately 2200hrs with a plateau in activity from 2230 hrs to 0230 hrs.
Species analysis indicates the presence of hoary bat, red bat, and big brown bat/silver-
haired bat. The latter two species have very similar call characteristics and are often
lumped together during call analysis. Population statuses of the red bat and big brown
are unknown in Manitoba, while the hoary bat and silver-haired bat are common with
secure populations in Manitoba. Currently none of these species are considered a
provincially or nationally rare species (MESA 2008a and Environment Canada 2006).
There is little known about bat passage rates and migration routes within Manitoba,
making comparison of passage rates with known areas of concentrated bat activity
difficult. Abundance trends and recorded species calls suggest that some bat migration
and summer swarming does occur within the study area in mid-August, however, low
overall passage rates indicate that significant numbers of bats do not occur within the
initial study area.

___________________________________________________________________________ Natural Resource Solutions Inc. St. Joseph Wind Energy Project Environmental Characterization Report
61
7.0 Mammals
A total of 39 non-bat mammals have ranges that overlap with the study area (Banfield
1981, Environment Canada 2006, Watkins 2005). A complete list of these species is
found in Appendix III. Bats are discussed separately in Section 6.0.
During the 2007 field surveys, NRSI biologists recorded all mammals observed within
the study area boundary. Four species of mammals were observed within the study
area by NRSI biologists, including coyote (Canis latrans), jack rabbit (Lepus townsendii),
thirteen-lined ground squirrel (Spermophilus tridecimlineatus), and white-tailed deer
(Odocoileus virginianus). Additionally, a den, likely belonging to a red fox (Vulpes
vulpes) was observed within the boundaries of the study area and pocket gopher
mounds and tunnels were observed in a number of locations. These mounds and
tunnels are likely of the northern pocket gopher (Thomomys talpoides), common in the
southern portions of Manitoba. NRSI biologists also observed raccoon (Procyon lotor)
tracks near station BMM-001.
7.1 Significant Species
One species, the plains pocket gopher (Geomys bursarius), has been assigned a sub-
national rank of S3 (uncommon) by the Manitoba Data Conservation Centre (Manitoba
Conservation 2001). NRSI observed gopher mounds and tunnels throughout out the
study area but it is unknown what species made them because the animals were not
observed directly. The northern pocket gopher is much more common and widespread
in southern Manitoba.
There are no provincially rare mammal species protected by the Manitoba Species at
Risk act known to occur in the study area.
Nationally, COSEWIC has assessed the status of 7 species with ranges that overlap
with the study area (Table 16). The status of the American badger (Taxidea taxus) and
the plains pocket gopher have been evaluated by COSEWIC and designated as Not at
Risk in Canada. During a study conducted on rare prairie rodents in Manitoba (Wrigley
et al. 1991) fox squirrels (Sciurus niger) were recorded in the Town of Morris. This

___________________________________________________________________________ Natural Resource Solutions Inc. St. Joseph Wind Energy Project Environmental Characterization Report
62
species has been evaluated and ranked as Not at Risk by COSEWIC. Populations of
fox squirrel have been rapidly expanding and dispersing in Manitoba in recent years.
The eastern cougar (Felis concolor couguar) is considered Data Deficient by COSEWIC
and therefore its national status is still unknown. Records indicate that it has been seen
as recently as 1996 in the vicinity of the study area, mainly along the Red River (Watkins
2005).
The plains bison (Bison bison bison) and the grey fox (Urocyon cinereoargenteus ) are
considered Threatened in Canada. Habitat for these two species does not occur within
the study area. The plains bison requires meadow and grassland areas to graze and the
grey fox prefers deciduous woodlands and marshes.
The eastern wolf (Canis lupus lycaon) is considered a Special Concern species and has
been documented in the vicinity of the study area (within approximately 20km) by
Environment Canada (2006b), however, the necessary forest cover that this species
requires is not found within the study area.
No significant non-bat mammal species were observed by NRSI within the study area.

___________________________________________________________________________ Natural Resource Solutions Inc. St. Joseph Wind Energy Project Environmental Characterization Report
63
Table 16. Significant Mammal Species with Range Maps that Overlap with the Study Area
Scientific Name Common Name GRANK SRANK COSEWIC
Habitat Present in the Study
Area?
Taxidea taxus American Badger G5 NAR Y
Bison bison bison Plains Bison G4 THR N
Felis concolor couguar Eastern Cougar* G5 DD N
Urocyon cinereoargenteus Gray Fox** G5 THR N
Canis lupus lycaon Eastern Wolf** G4 SC N
Geomys bursarius Plains Pocket Gopher ? S3 NAR Y
Sciurus niger Fox Squirrel G5 NAR N
Note: Reference Banfield (1981) unless otherwise indicated with an astrix
*Watkins 2005
** Environment Canada 2006
LEGEND
Srank COSEWIC Designations Habitat Presence
S3- Uncommon THR- Threatened Y- Yes
NAR- Not at Risk N-No
G-Rank (Global Rank) SC- Special Concern
G4-Common DD-Data Deficient
G5-Very Secure

___________________________________________________________________________ Natural Resource Solutions Inc. St. Joseph Wind Energy Project Environmental Characterization Report
64
8.0 Herpetofauna
8.1 Study Methodology
Amphibian monitoring was conducted following the Marsh Monitoring Program
guidelines (Bird Studies Canada 2003). Monitoring was conducted at 4 stations (Figure
26) which are described in Table 17. Each station was monitored 3 times, once in early
spring (April 23, 2007), once in mid-spring (May 13, 2007) and once in late spring/early
summer (June 4, 2007). Different species of amphibians are known to breed at different
times of the year. The chosen monitoring period of April to June was selected to
represent the peak breeding periods for species known to occur in the vicinity of the
study area. Monitoring stations were chosen based on initial project boundaries.
Three minute point counts were performed at each station, starting a half hour after
sunset and finishing prior to midnight. Call intensity and an estimated number of
individuals were recorded. At each monitoring station a variety of environmental and
weather conditions were also recorded, including air temperature, wind speed, and cloud
cover (see Appendix IV for a sample data sheet).
Table 17. Descriptions of Amphibian Monitoring Station Locations
Station Number Station Location Habitat Type
HRP-001 South side of Mile 8 Road North between Mile 1 Road east and Mile 2 Road east
Storm water pond with mature deciduous trees
HRP-002 Intersection of Mile 12 Road North and Mile 1 Road west (facing east)
Controlled channel (Buffalo Channel) buffered by 10m of tall grass
HRP-003 East side of Meridian Road between Highway 14 and Mile 12 Road North
Storm water pond surrounded by scattered deciduous trees and shrubs
HRP-004 South side of Highway 14 between Mile 4 Road east and Mile 5 Road east
Large open water habitat associated with Miller Environmental Property


___________________________________________________________________________ Natural Resource Solutions Inc. St. Joseph Wind Energy Project Environmental Characterization Report
66
8.2 Results
A total of 11 species of reptiles and amphibians have ranges that overlap with the study
area. A list of herpetofauna that have been documented in the general vicinity of the
study area can be found in Appendix IV. Suitable habitat for these herpetofauna is
present, but not overly abundant, within the study area due to the presence of
agricultural drains and small ponds.
Table 18 presents the results of the 2007 monitoring by summarizing the species
encountered during the evening amphibian call surveys by point count station.
During the 2007 point count surveys, a total of five amphibian species were recorded.
Table 18. Amphibian Species Present During the 2007 Call Surveys by Station
Station Number
Boreal Chorus
Frog American
Toad Canadian
Toad
Northern Leopard
Frog Wood Frog
HRP-001 X
HRP-002 X X
HRP-003 X X
HRP-004 X X X X X
The species recorded calling most frequently was the boreal chorus frog (Pseudacris
triseriata maculate), representing 56% of all observations. This species was only
observed to be present in early (April 23) and mid spring (May 13). During these
periods, the number of boreal chorus frogs was often large, making estimates of the total
number of individuals extremely difficult. Found throughout central and southern
Manitoba, chorus frogs are known to inhabit shallow, often temporary, bodies of water
often concealing themselves among the grass (Conant & Collins 1991). The drainage
ditches and storm water ponds found on the subject property provide abundant habitat
for this species.
American toads (Bufo americanus) were recorded in varying numbers in both mid (May
13) and late spring (June 4). Found in southeastern Manitoba, the American toad is
known to occur in a wide variety of habitat ranging from suburban yards to rustic
wilderness. They require shallow bodies of water to breed, including temporary ditches
or streams (Conant & Collins 1991).

___________________________________________________________________________ Natural Resource Solutions Inc. St. Joseph Wind Energy Project Environmental Characterization Report
67
Wood frogs (Rana sylvatica) were only recorded during the early spring visit on April 23,
2007. Found throughout Manitoba, they are usually encountered near moist woods but
can wander considerable distances from water (Conant & Collins 1991).
The northern leopard frog (Rana pipiens) was only recorded calling once on May 13,
2007 at Station HRP-004. This species prefers grasslands and wet woods but can
wander a considerable distance from water. Although the northern leopard frog used to
be considered widespread in Manitoba (Preseton 1982) it is now a significant species
(see Section 8.3).
The Canadian toad (Bufo hemiophrys) was also only recorded calling once on the May
13, 2007 visit at Station HRP-004. This species occupies a wide rang of habitats
including prairie, aspen parkland, sandy beaches and boreal forest (Preston 1982).
Two species of salamander, the tiger salamander (Ambystoma tigrinum) and a sub-
species, the gray tiger salamander (Ambystoma tigrinum diaboli), have ranges that
overlaps with the study area. They prefer areas with an abundance of breeding ponds.
No salamanders were observed by NRSI in the study area.
Three reptiles, including 2 snakes and 1 turtle, have range maps that overlap with the
study area. Ideal habitat for these species, such as larger permanent bodies of water or
rocky areas for basking, does not exist within the study area. No reptiles were observed
by NRSI in the study area.
8.3 Significant Herpetofaunal Species
The northern leopard frog was previously widespread in Manitoba (Preston 1982);
however, the western populations of this species are now designated as Special
Concern by COSEWIC. The northern leopard frog is not ranked or protected
provincially. It was heard calling by NRSI biologists during amphibian surveys in a
drainage ditch near HRP-004. Near this drainage ditch are the large ponds associated
with the Miller Environmental property. This observation was made approximately 500m
from the nearest proposed turbine location.

___________________________________________________________________________ Natural Resource Solutions Inc. St. Joseph Wind Energy Project Environmental Characterization Report
68
9.0 Butterflies
As a result of comments received from Environment Canada, NRSI recorded all
incidental butterfly observations during the monitoring period. Three species, the
mourning cloak (Nymphalis antiopa), the red admiral (Vanessa atalanta), and the
monarch (Danaus plexippus) were observed within the study area. The monarch
butterfly is considered a significant species in Canada and has been ranked by
COSEWIC as a species of Special Concern (Government of Canada 2007). Over the
course of the 2007 monitoring period, 134 incidental observations of monarch were
recorded within the study area, almost all of them within the month of June. It should
also be noted that milkweed (Asclepias spp.), the host plant of the monarch butterfly,
was observed to be plentiful within the study area, mainly confined to roadside ditches.

___________________________________________________________________________ Natural Resource Solutions Inc. St. Joseph Wind Energy Project Environmental Characterization Report
69
10.0 Aquatic Habitats
10.1 Introduction
The study area is almost entirely composed of agricultural fields that are drained by
constructed linear drains. As a result, the majority of the aquatic habitat in the study
area is found in constructed agricultural drains.
The drainage in the northern part of the study area flows into the Buffalo River, which in
turn enters Plum Creek and ultimately the Red River. The southern part of the study
area drains into the Rivière aux Marais, which also outlets into the Red River (Figure
27).
10.2 Study Methodology
The aquatic habitats in the study area were identified and mapped based on topographic
mapping information from the National Topographic Database (Natural Resources
Canada 2002) and direct observations in the field. Site visits were conducted on July 24
to 26, 2007, and on April 21 and 22, 2008.
Fish community information was obtained from Manitoba Conservation (2007).
Significant species information was obtained from COSEWIC (Government of Canada
2007), Species at Risk listed under the Manitoba Endangered Species Act (Manitoba
Conservation 2008a), and the Manitoba Conservation Data Centre (2001).

___________________________________________________________________________ Natural Resource Solutions Inc. St. Joseph Wind Energy Project Environmental Characterization Report
70
10.3 Results
10.3.1 Aquatic Habitat
The aquatic habitats in the study area are defined by the clay and silt of the Glacial Lake
Agassiz Clay Plain (Matile & Keller 2004). In the last century, the poor drainage
prompted the construction of numerous linear surface drains to facilitate drainage for
agricultural purposes. Many of these drains are situated alongside the roads. The size
of the drains varies from minor roadside ditches, to intermediate-size drains, to large
drains and rivers. The intermediate and large features are shown on Figure 27.
Watercourses
The intermediate-size agricultural drains in the study area are generally situated in
narrow corridors of grass and other herbaceous vegetation. There is typically a road
along one side and a cultivated field on the other side. The channel widths of the
intermediate-sized drains vary from approximately 2 to 7m (at the bottom of the drain).
Vegetation within the channels varies. Some drains have submerged aquatic
vegetation, and many have emergent cattails, sedges and rushes in sparse to high
density. The intermittent drains typically have grasses and herbs growing throughout the
channel. The substrates in the channels reflect the clay soils that characterize the study
area. On July 24, and 25, 2007, some of the drains were flowing, some had standing
water, and others were completely dry. Many of the drains had flowing or standing water
on April 21 and 22, 2008 after a rain event during the morning of April 21.
Some of the intermediate-sized drains outlet to the larger watercourses through culverts
with 1-way valves at their outlets. In the same way, minor drains outlet to intermediate-
sized drains through 1-way valve systems. This is a characteristic of the land drainage
scheme that prevents water from backing up through the system and flooding the
landscape during high flows. These 1-way valves also have the effect of impeding
upstream fish passage. The drainage from northern part of the study area flows
northerly into the Buffalo Channel – Plum Creek system. Buffalo Channel has two
separate channels that enter the study area from the west, and converge within the
study area to become the Plum River. The Plum River exits the study area to the north
and continues northeast to its outlet to


___________________________________________________________________________ Natural Resource Solutions Inc. St. Joseph Wind Energy Project Environmental Characterization Report
72
the Red River. The larger of the two channels associated with the Buffalo Channel flows
along the south side of Mile 12 North, and varies in width from 6 to 23m. It flows in a
very large bermed floodway corridor that is up to 100m wide in places. This corridor
consists of grasses and other herbaceous vegetation, and some parts of it are harvested
for hay. The smaller of the two channels enters the study area along Mile 10 North, and
follows roadways northward and eastward to where it is parallel to the larger channel
along Mile 12 North. The channel widths are 3.5 to 8m and the corridors range from 6 to
12m wide. The substrates are soft clay and soil. On July 24 and 25, 2007, these major
watercourses were flowing.
The Plum River is a large natural feature that flows through agricultural fields, and is a
much as 20 m wide within the study area. Grasses and sedges grow along the wetted
margins, and there is abundant submergent aquatic vegetation in the channel. It was
flowing during field investigations on July 26, 2007.
Drainage in the southern part of the study area flows into the Rivière aux Marais. This is
a natural river that flows through the southeast corner of the study area. Much of the
main stem is within a wooded corridor ranging from 20 to 100m wide. The vegetation in
this corridor is characterized in Section 4.0. The trees are separated from the channel
by a continuous grassy floodplain adjacent to the channel. Within the study area, the
channel width varies from 6 to 20m wide. Instream vegetation includes emergent plants
such as cattails and grasses, as well as submergent plants and floating duckweed of the
family Lemnaceae. Vegetation on the banks is dominated by grasses and other herbs.
On July 25, 2007 and April 22, 2008, the water was deep and flowing very slowly.
Tributaries of the Rivière aux Marais are much smaller and have little to no natural
corridor. Some sections are channelized with a narrow corridor of grass and
herbaceous vegetation, which is characteristic of the intermediate-sized drains in the
study area. Many sections of the tributaries have a natural plan-form but lack a
vegetated corridor. These meandering sections are typically swales in agricultural fields
that are cultivated, which indicates that flow is intermittent. There are also locations
where online ponds have been created, which may provide a refuge for fish when flow is
absent.

___________________________________________________________________________ Natural Resource Solutions Inc. St. Joseph Wind Energy Project Environmental Characterization Report
73
Isolated Ponds
In addition to the linear drainage features, there are isolated ponds in the study area.
These habitats are of secondary importance to the drains because they are
disconnected from other habitats. Nevertheless, they provide aquatic habitat of varying
quality. Many are constructed ponds intended for irrigation, aesthetic, or recreational
uses, but they are also considered aquatic habitat.
10.3.2 Fish Community
Table 19 provides a list of fish species based on collection records provided by Manitoba
Conservation (2007) for Buffalo Creek, Plum Creek, and the Rivière aux Marais. The
watersheds of these rivers include the study area. In addition, the Red River has a
diverse fish community, and there are many more species in or near the study area than
those listed below. A list of species known from the Red River is provided in Appendix V
(Manitoba Conservation 2007c). During field observations, schools of small fish of the
catfish family (Ictaluridae) were observed in the Buffalo Channel.
Table 19. Fish Collection Records for Buffalo Cr., Plum R., and Rivière aux Marais
Common Name Scientific Name G-Rank* S-Rank** COSEWIC Status***
bigmouth buffalo Ictiobus cyprinellus G5 - SC
black bullhead Ameiurus melas G5 - -
black crappie Pomoxis nigromaculatus G5 - -
blacknose shiner Notropis heterolepis G4 - -
burbot Lota lota G5 - -
common carp Cyprinus carpio G5 - -
chestnut lamprey Ichthyomyzon castaneus G4 S3S4 SC
creek chub Semotilus atromaculatus G5 - -
fathead minnow Pimephales promelas G5 - -
northern pike Esox lucius G5 - -
river darter Percina shumardi G5 - NAR
sand shiner Notropis stramineus G5 - -
white sucker Catostomus commersoni G5 - -
* Source: Eakins 2007
**Designated by the Manitoba Conservation Centre (Manitoba Conservation 2001)
***Designated by COSEWIC and protected by the Species at Risk Act (Government of Canada 2007)
Legend Srank (Provincial Rank) COSEWIC Status Grank (Global Rank) S3- Uncommon SC- Special Concern G5- Very Common S4- Apparently Secure NAR-Not at Risk G4- Common

___________________________________________________________________________ Natural Resource Solutions Inc. St. Joseph Wind Energy Project Environmental Characterization Report
74
10.3.3 Significant Species
The significant species listed below are known from the Lake Manitoba Plain Ecoregion,
the Red River or the Buffalo River. It is possible that they exist within the study area.
Chestnut Lamprey (Ichthyomyzon castaneus)
Status: The chestnut lamprey is a fish species of the lamprey family
(Petromyzontidae). It is ranked S3S4 – uncommon to apparently secure in
Manitoba, and G4 – globally common (MB Conservation Data Centre 2001). It has
been given the status of Special Concern by COSEWIC (Gov‟t of Canada 2007),
and is listed on Schedule 3 of the federal Species at Risk Act (Gov‟t of Canada
2008).
Habitat: The chestnut lamprey is a parasitic filterer that prefers “large creeks and
main channels of small- to medium-sized rivers (Eakins 2007).” The
“...ammocoetes inhabit sand- and silt-bottomed pools and backwaters (Eakins
2007).” The chestnut lamprey is known from the Lake Manitoba Plain Ecoregion
(MB Conservation Data Centre 2001), and is known to occur in the Red River (MB
Conservation 2007c). The aquatic habitat in the study area may be suitable for the
chestnut lamprey.
Silver Chub (Macrhybopsis storeriana)
Status: The silver chub is a fish species of the carp and minnow family
(Cyprinidae). It is ranked S3 – uncommon in Manitoba – and G5 – globally very
common (MB Conservation Data Centre 2001). It has been given the status of
Special Concern by COSEWIC (Gov‟t of Canada 2007), and is listed on Schedule
1 of the federal SARA (Gov‟t of Canada 2008).
Habitat: The silver chub is a benthic invertivore that prefers “sandy, silty pools and
backwaters of small to large rivers, river mouths and warm shallows (<20 m) of
lakes (Eakins 2007).” It is known from the Lake Manitoba Plain Ecoregion (MB
Conservation Data Centre 2001), and is known to occur in the Red River (MB
Conservation 2007c).

___________________________________________________________________________ Natural Resource Solutions Inc. St. Joseph Wind Energy Project Environmental Characterization Report
75
Bigmouth Buffalo (Ictiobus cyprinellus)
Status: The bigmouth buffalo is a fish species of the sucker family (Catostomidae).
It is ranked G5 – globally common (Eakins 2007). It has been given the status of
Special Concern by COSEWIC (Gov‟t of Canada 2007), and is listed on Schedule
3 of the SARA (Gov‟t of Canada 2008).
Habitat: The bigmouth buffalo is a benthic insectivore that prefers “main channels,
deeper pools and backwaters of turbid vegetated rivers, lakes and impoundments;
preferred water temperature range 18-26°C (Eakins 2007).” It is known from the
Red River, and more specifically from Buffalo Creek, part of which is within the
study area. The Buffalo Creek record is from August of 2005 (MB Conservation
2007c). The habitat in the larger drains and creeks of the study area is suitable for
the Bigmouth Buffalo.
Mapleleaf (Quadrula quadrula)
Status: The Mapleleaf is a freshwater mussel species of the family Unionidae. It
is ranked G5 – globally common, but does not have an S-Rank in Manitoba (MB
Conservation Data Centre 2001). It has been given the status of Endangered by
COSEWIC (Gov‟t of Canada 2007), but is not listed on Schedule 1 of the SARA
(Gov‟t of Canada 2008).
Habitat: The Mapleleaf prefers “(m)edium-sized to large rivers and reservoirs
where currents are slow to moderate in soft or coarse substrates (Metcalfe-Smith
et al 2005).” It is known from the Lake Manitoba Plain Ecoregion (MB
Conservation Data Centre 2001). The habitats in the drains and creeks of the
study area have the characteristics preferred by the Mapleleaf.

___________________________________________________________________________ Natural Resource Solutions Inc. St. Joseph Wind Energy Project Environmental Characterization Report
76
11.0 Summary
Between April 2007 and April 2008 NRSI biologists conducted a number of field
investigations to assess the natural environmental features within the proposed study
area for the St. Joseph Wind Energy Project. Biological components surveyed during
field investigations included spring and fall bird migration, breeding birds, diurnal raptors,
leks, amphibians, spring and fall bat migration, summer bat swarming, vegetation
mapping and aquatic habitat assessment.
Vegetation
The study area is almost entirely composed of agricultural lands with scattered
deciduous and coniferous hedgerows. Small areas with an abundance of trees exist
around private residents and constructed ponds. The only wooded area is a thin corridor
along the Rivière aux Marais in the southern portion of the study area. This corridor is
dominated by a number of common species such as bur oak, Manitoba maple, red ash,
willows, and poplars.
Birds
Over the course of the spring 2007 bird migration monitoring period, a total of 6,526
birds were observed representing 42 species (including incidentals observed >200m
from the observer). The majority of observations recorded during the monitoring period
were of individual birds or small flocks. The most abundant species in the spring were
horned lark, red-winged blackbird, snow bunting, tundra swan, and brown-headed
cowbird. Not surprisingly, landbirds were the most abundant bird group, representing
90% of all observations. Migration activity peaked between late April and early May and
the majority of observations were made before noon. Monitoring station BMM-004 was
observed to have the highest overall utilization rate. The majority of birds that were
observed flying during the spring monitoring period were recorded in Height Zone 0-
39m, which is below the blade sphere. Flight directions were variable between stations
but a general trend in a northern direction was observed at each station.
During the fall 2007 bird migration monitoring period a total of 11,008 birds were
observed representing 38 species (including incidentals observed >200m from the
observer). The majority of observations in the fall were also of individual birds or small

___________________________________________________________________________ Natural Resource Solutions Inc. St. Joseph Wind Energy Project Environmental Characterization Report
77
flocks. The most abundant species recorded in the fall were Canada geese, rock
pigeons, barn swallows, and European starlings. Again, landbirds were found to be the
most abundant bird group. Migration activity peaked in mid to late October and bird
activity varied throughout the day. Monitoring station BMM-002 was observed to have
the highest overall utilization rate. Similar to spring, the majority of birds observed flying
were seen within Height Category 0-39m. Flight directions were found to be variable in
the fall, however a general trend in a southern direction was observed at every station
except BMM-004, where flight directions were toward the west and northwest.
Over the course of the spring 2008 bird migration monitoring period, a total of 1,196
birds were observed representing 30 species (including incidentals observed >200m
from the observer). The majority of observations recorded during the monitoring period
were of individual birds or small flocks. The most abundant species were snow
buntings, red-winged blackbird, American white pelicans, Canada geese, horned lark,
and European starling. As in the spring of 2007, landbirds were the most abundant bird
group, representing 79% of all observations. Migration activity was observed to be
highest at the end of April observations were made before 1100hrs. Monitoring station
BMM-005 was observed to have the highest overall utilization rate. As in 2007, the
majority of birds that were observed flying during the spring 2008 monitoring period were
recorded in Height Zone 0-39m, which is below the blade sphere. Flight directions were
highly variable between stations.
Breeding bird surveys were conducted in June and began a half hour before sunrise.
Over the course of the breeding bird surveys, a total of 1,693 birds were recorded
representing 38 species. The most abundant species observed were red-winged black-
bird (38% of all individuals observed), brown-headed cowbird (12.6%), and brewer‟s
blackbird (6.5%). The majority of species observed were landbirds (90%). The greatest
diversity of species was observed in hedgerow habitat, followed by riparian habitat. The
lowest species diversity was observed in agricultural habitat. A total of 36 species
displayed some evidence of breeding, with 7 species confirmed to be breeding within the
study area.

___________________________________________________________________________ Natural Resource Solutions Inc. St. Joseph Wind Energy Project Environmental Characterization Report
78
Only 10 raptors were observed during the diurnal raptor surveys. The three raptor
species observed were northern harrier, which was most abundant, unidentified raptor
species, and red-tailed hawk. Half of the raptors observed were flying below the blade
sphere (Height Category 0-39m) and half were observed to be flying within the blade
sphere (40-120m). Six additional species of raptor were recorded during other 2007
field surveys.
No significant bird species were observed by NRSI within the study area. However,
habitat for five significant species (loggerhead shrike (both subspecies), burrowing owl,
Baird‟s sparrow, and red-headed woodpecker potentially exists within the study area.
Additionally, the least bittern, Sprague‟s pipit and yellow rail have been recorded by
Environment Canada as having range maps that overlap with the study area.
Bats
Over the course of the 2007 monitoring period a total of 525 bat passes were recorded
in over 170 hours of acoustic monitoring. The average passage rate during spring
migration monitoring was 0.9 passes/hr and during summer swarming and fall migration
the average passage rate was 3.3 passes/hr. The presence of hoary bats, red bats, and
big brown and/or silver haired bats was confirmed in the study area. Hoary bats, red
bats and silver haired bats all migrate to the southern United States during the Canadian
winter. Big brown bats are the only species recorded in the study area known to over-
winter in Manitoba.
Station BAT-001 had the highest overall passage rate during both spring migration (1.8
passes/hr) and summer swarming/fall migration (8.7 passes/hr). This station was
located next to a pond surrounded by deciduous trees whereas the other monitoring
stations were located adjacent to hedgerows or fields. Passage rates at the remaining
stations were comparable, but generally lower than those found at station BAT-001.
During the summer swarming/fall migration monitoring period, a peak in bat activity was
recorded in mid August which is consistent with fall bat migration patterns in Manitoba.
Bats were most active between 2130 hrs and 0230 hrs, with an average passage rate of
1.1 passes/hr during this time period.

___________________________________________________________________________ Natural Resource Solutions Inc. St. Joseph Wind Energy Project Environmental Characterization Report
79
No caves or mines exist in or near the study area and none of the six bat species that
occur in Manitoba are considered significant species. Based on the low passage rates
recorded during the 2007 monitoring period, it is unlikely that any large concentrations of
bats exist within the study area boundaries.
Mammals
A total of 39 non-bat mammals are known to have range maps that overlap with the
study area. During field investigations, NRSI observed evidence of 7 of these mammal
species. COSEWIC has assessed the status of 7 potentially rare mammal species that
have range maps that overlap with the study area, resulting in two of these species
being designated as Not at Risk and one as Data Deficient. Suitable habitat does not
exist for the remaining species within the study area. One species which may have a
range that overlaps with the study area, the plains pocket gopher, is listed as uncommon
by the Manitoba Data Conservation Centre. Although evidence of pocket gophers was
observed within the study area, the northern pocket gopher is much more common in
southern Manitoba than the plains pocket gopher.
___________________________________________________________________________ Natural Resource Solutions Inc. St. Joseph Wind Energy Project Environmental Characterization Report
80
Herpetofauna
A total of 11 reptiles and amphibians have range maps that overlap with the study area.
Amphibian monitoring occurred at four stations within the study area and each station
was monitored on three separate occasions throughout the known breeding season for
species in the area. During amphibian surveys a total of 5 species were confirmed. The
boreal chorus frog was most commonly observed species in the study area. The
American toad and wood frog were also fairly abundant. The northern leopard frog,
which is considered a Special Concern species by COSEWIC, and Canadian toad were
both recorded by NRSI biologists in a drainage ditch near station HRP-004. No snakes,
salamanders or turtles were observed in the study area.
Butterflies
Specific surveys to record butterfly abundance and diversity were not undertaken,
however all butterflies observed within the study area were recorded as incidental
observations. Three species were recorded by NRSI biologists, including the monarch
butterfly, a species listed as Special Concern by COSEWIC.
Aquatic Habitats
The characteristics of the aquatic habitats in the study area are defined by the Lake
Agassiz Clay Plain, and most of the habitat is located in constructed agricultural drains.
The habitat consists of roadside ditches, intermediate drains, and larger drains and
rivers. The channels and vegetated corridors are generally very uniform, with clay and
soil channel substrates and mostly herbaceous vegetation in the corridors. The
watercourses in the northern part of the study area outlet into the Buffalo Channel –
Plum Creek system. The watercourses in the southern part of the study area outlet into
the Rivière aux Marais. These receiving watercourses in turn outlet into the Red River.
There are also some isolated ponds in the study area that provide aquatic habitat.
The fish species known from the major watercourses of the study area reflect warm-
water habitat characteristics, and consist of species also found downstream in the Red
River. Three significant fish species and one significant freshwater mussel species have
potential to be present in the study area. These include chestnut lamprey, silver chub,
bigmouth buffalo, and Mapleleaf.

___________________________________________________________________________ Natural Resource Solutions Inc. St. Joseph Wind Energy Project Environmental Characterization Report
81
12.0 References
AFWD (Alberta Fish and Wildlife Division). 2005. Handbook of Inventory Methods and
Standard Protocols for Surveying Bats in Alberta. Original prepared 2002, updated by Alberta Sustainable Resource Development and Alberta Bat Action Team in 2005.
A.S.R.D. (Alberta Sustainable Resource Development): Department of Fish & Wildlife.
2005. Sensitive species inventory guidelines. Draft. Retrieved online: http://www.srd.gov.ab.ca/fw/guidres/pdf/inventoryguide/sensitive_species_inventory_guidelines_January_2005.pdf
Asmundson, J.D. and R.A. Larche. 1996. Bat Hibernacula Management Guidelines.
Manitoba Natural Resources, Wildlife Branch, December 1996. Banfield A. W. F. 1981. The Mammals of Canada. University of Toronto Press,
Toronto, Canada. Barclay R.M.R. 1984. Observations on the Ecology and Behavior of Bats at Delta
Marsh, Manitoba. Canadian Field Naturalist. Vol. 98, no. 3, pp. 331-336. Beason, R.C. 1995. Horned Lark (Eremophila alpestris). In The Birds of North America,
No. 195 (A. Poole and F. Gill, eds.). The Academy of Natural Sciences, Philadelphia, and The American Ornithologists‟ Union, Washington, D.C.
Bird Studies Canada. 2003. The Marsh Monitoring Program – Training Kit and
Instructions for Surveying Marsh Birds, Amphibians and their Habitats 2003 Edition. Bird Studies Canada in Cooperation with Environment Canada and the U.S. Environmental Protection Agency. 40 pp.
Canadian Prairie Partners in Flight. 2004. Landbird Conservation Plan for Prairie Pothole
Bird Conservation Region 11 in Canada. Canadian Wildlife Service, Edmonton, AB.
Conant, R. and J.T. Collins. 1991. Retiles and Amphibians: Eastern and Central North
American. Peterson Field Guide Series, New York, New York. CWS (Canadian Wildlife Service). 2001. Ontario Breeding Bird Atlas: Guide for
Participants. Atlas Management Board, Federation of Ontario Naturalists, Don Mills.
Eakins, R. J. 2007. Ontario Freshwater Fishes Life History Database. Version 3.01. On-
line database. (www.fishdb.ca), accessed 24 January and 4 February, 2008. Ejeckam, R.B. 2007. Response to Work plan for Monitoring at the St. Joseph Wind
Farm. Personal Communication. Environment Canada, Environmental Assessment Coordinator, Environmental Protection, Prairie and Northern Region.
Environment Canada. 2006a. Species at Risk. Online species search. Accessed
January 21, 2008. http://www.speciesatrisk.gc.ca/search/default_e.cfm

___________________________________________________________________________ Natural Resource Solutions Inc. St. Joseph Wind Energy Project Environmental Characterization Report
82
Environment Canada. 2006b. Species at Risk. Online geographic query. Accessed on
January 21, 2008. http://www.speciesatrisk.gc.ca/map/default_e.cfm Environment Canada. 2007. Recommended Protocols for Monitoring Impacts of Wind
Turbines on Birds. Final February 19, 2007. Environment Canada Canadian Wildlife Service (CWS). 2007. Wind Turbines and
Birds: A Guidance Document for Environmental Assessment. Final February 2007. Firlotte, N. 2008. Manitoba Conservation Data Centre. Personal Communication
through Data Information Request. Received January 29, 2008. Government of Canada. 2007. COSEWIC Species Search-Manitoba. Accessed
January 21, 2007. http://www.cosewic.gc.ca/eng/sct1/searchform_e.cfm Government of Canada. 2008. Schedules of the Species at Risk Act. Website:
http://www.sararegistry.gc.ca/species/default_e.cfm. Accessed: 24 January, 2008. Gerson, H. 1984. Habitat Management Guidelines for Bats of Ontario. Prepared for the
Ontario Ministry of Natural Resources. IBA Canada. 2004. Online geographic query-Manitoba IBA Network. Accessed
January 22, 2007. http://www.bsc-eoc.org/iba/regional.jsp?region=MB Jones, S. L., and J. E. Cornely. 2002. Vesper Sparrow (Pooecetes gramineus). In The
Birds of North America, No. 624 (A. Poole and F. Gill, eds.). The Birds of North America, Inc., Philadelphia, PA.
Manitoba Conservation. 2007a. Areas of Special Interest Map. Manitoba Protected
Areas Initiative. Accessed February 2008. http://www.gov.mb.ca/conservation/pai/pai_material.html
Manitoba Conservation. 2007b. Protected Areas in Manitoba- Map. Manitoba
Protected Areas Initiative. Accessed February 2008. http://www.gov.mb.ca/conservation/pai/pai_material.html
Manitoba Conservation. 2007c. Fish collection records provided by Wade Biggin, June &
July 2007. Manitoba Conservation. 2008a. Species at Risk: Species Listed under the Manitoba
Endangered Species Act. Wildlife and Ecosystem Protection Branch. Accessed January 12, 2007. http://www.gov.mb.ca/conservation/wildlife/managing/sar_facts.html
Mantioba Conservation. 2008b. The Wildlife Act. C.C.S.M. c. W130. Accessed
February 12, 2008. http://web2.gov.mb.ca/laws/statutes/ccsm/w130e.php.

___________________________________________________________________________ Natural Resource Solutions Inc. St. Joseph Wind Energy Project Environmental Characterization Report
83
Manitoba Conservation Data Centre. 2001. Lake Manitoba Plain- Species Information. Accessed January 12, 2007, and January 24, 2008. http://web2.gov.mb.ca/conservation/cdc/species/ecoregions/lakemb.php
Martin, S. G., and T. A. Gavin. 1995. Bobolink (Dolichonyx oryzivorus). In The Birds of
North America, No. 176 (A. Poole and F. Gill, eds.). The Academy of Natural Sciences, Philadelphia, and The American Ornithologists‟ Union, Washington, D.C.
Matile, G.L.D. and G.R. Keller. 2004. Manitoba Geological Survey 2004. Map # NTS
62H. Manitoba Mineral Resource Division. Metcalfe-Smith, Janice., Alistair MacKenzie, Ian Carmichael, & Daryl McGoldrick. 2005.
Photo Field Guide to the Freshwater Mussels of Ontario. St. Thomas Field Naturalist Club Inc., St. Thomas, Ontario.
Ministry of Environment British Columbia. 1997. Version 1.1 Standardized inventory .
methodologies for components of British Columbia‟s biodiversity: upland gamebirds. Retrieved online: http://ilmbwww.gov.bc.ca/risc/pubs/tebiodiv/gamebirds/gameml11.pdf
Natural Resources Canada. 2002. Centre for Topographic Information (Sherbrooke),
National Topographic Data Base (NTDB) Vector Digital Data, Edition 3.1.
Natural Resources Canada. 2007. Online Mapping- Soil Capability for Agriculture. Accessed Jan. 21, 2007. http://geogratis.cgdi.gc.ca/CLI/frames.html
Ontario Ministry of Natural Resources. 2006. Wind Power and Bats: Bat Ecology Background Information and Literature Review of Impacts. December 2006. Fish and Wildlife Branch. Wildlife Section. Lands and Waters Branch. Renewable Energy Section. Peterborough, Ontario. 61 p.
OMNR (Ontario Ministry of Natural Resources). 2007 Guideline to Assist in the Review
of Wind Power Proposals: Potential Impacts to Bats and Bat Habitats. Developmental Working Draft. August, 2007.
Preston, W.B. Amphibians and Reptiles of Manitoba. 1984. Manitoba Museum of Man
and Nature, Winnipeg, Canada. Schritt, A., D. Schritt, L. Blanchette, J.P. Goossen, and V. Goossen. 2007. The
Pembina valley 2005 and 2006 Spring Raptor Migration. A Rocha Pembina Valley Biodiversity Report, Series No. 1.
Van Zyll de Jong, C.G. 1985. Handbook of Canadian Mammals. National Museum of
Natural Sciences, National Museum of Canada, Ottawa, Canada. Watkins, B. 2005. Cougars Confirmed in Manitoba. Wild Cat News. June Issue,
pp. 6-8. Watkins, B. 2008. Biodiversity Conservation Section, Wildlife and Ecosystem Protection
Branch, Manitoba Conservation.

___________________________________________________________________________ Natural Resource Solutions Inc. St. Joseph Wind Energy Project Environmental Characterization Report
84
Wrigley, R.E., J.E. Dubois, and H.W.R. Copland. 1991. Distribution and Ecology of Six Rare Species of Prairie Rodents in Manitoba. The Canadian Field Naturalist. January- March 1991. Vol: 105: 1

Natural Resource Solutions Inc. Appendices
APPENDIX I
Birds Observed in the Study Area and Data Collection Sheets

Station #: Date:
Length Survey Breeding Migration Lek
Project St. Joseph Wind Farm DD/MM/YY
Observers
Weather
Air Temp. °C
Cloud Cover % Cloud Height High Med Low
Precipitation Visibility High Med Low
Station
Elevation Crop
Pressure mb UTM
Turbine yes no rpm
Operating yes no
Wind Speed
Raptor
Project #:
Wind Direction
Height Category: 0=0-9m; 1=10-19m; 2=20-29m; 3 = 30-39m etc.
Wind speed (Beaufort): 0=calm; 1=smoke drifts; 2=wind felt on face; 3=leaves move; 4=sm.branches move; 5=sm.trees move;
6=lrg branches move; 7=lrg trees move; 8=twigs break off, hard to walk; 9=light structural damage; 10=trees uprooted
POINT COUNT
Habitat
Start - End (24hr Clock)
Daytime/
(from)
ft / m
Rotation Speed
Behaviour should be recorded as: foraging, mobbing, migration, flying, perching, perched on ground, or swimming. Can also use
to record breeding evidence
Page ___of ___

Station#: Date:
Species Time # of Indivuals Behaviour Distance
from Obs.
Height
Category
Passes Direction of
Flight
Direction
from Obs.
Project #: 745
Page ___of ___

2008
Group Scientific Name Common Name GR
AN
K
SR
AN
K
CO
SE
WIC
Nest
Sit
e
Hab
itat
Pre
fere
nc
e
Overall Species
List
Spring
Migration
Fall
Migration
Breeding
Birds
Diurnal
Raptor
surveys
Lek
Surveys
Spring
Migration
LOONS
WB Loon sp. X
GREBES
WB Grebe sp. X X
PELICANS
WBc Pelecanus erythrorhynchos American White Pelican G3 C, GR L, WT X X
CORMORANTS
WBc Phalacrocorax auritus Double-crested Cormorant G5 S4B NAR
C, GR,
TR L X
HERONS & BITTERNS
WBc Ardea herodias Great Blue Heron G5 C, TR SL X X X
SWANS
WF Cygnus columbianus Tundra Swan G5 GR L X X X X
GEESE
WF Chen caerulescens Snow Goose G5 C, SH L, WT, OP X X X
WF Branta canadensis Canada Goose G5 SH GL X X X X X X X
DUCKS
WF Anas platyrhynchos Mallard G5 GR SL, WT X X X X X X X
WFg Anas discors Blue-winged Teal G5 GR SL, WT X X
WFg Anas clypeata Northern Shoveler G5 X
WF Aix sponsa Wood Duck G5 X
WF Duck sp. X X
HAWKS, KITES & EAGLES
RA Haliaeetus leucocephalus Bald Eagle G4 NAR TR L X
RAg* Circus cyaneus Northern Harrier G5 NAR GR OP X X X X X X X
RA Accipiter striatus Sharp-shinned Hawk G5 NAR TR M, ED X X
RAg Buteo jamaicensis Red-tailed Hawk G5 NAR TR M, ED X X X X X
RA Buteo lagopus Rough-legged Hawk G5 NAR
CL, TR,
AN OP X X
RA Raptor Sp. X X X X X
RA Buteo sp. Buteo Sp. X X
CARACARAS & FALCONS
RA Falco columbarius Merlin G5 NAR TR, AN OP, M, ED X X
RAg Falco mexicanus Prairie Falcon G5 CL OP X X
PARTRIDGES, GROUSE & TURKEY
LBg Perdix perdix Gray Partridge G5 X X
RAILS, GALLINULES & COOTS
WB Fulica americana American Coot X
2007

2008
Group Scientific Name Common Name GR
AN
K
SR
AN
K
CO
SE
WIC
Nest
Sit
e
Hab
itat
Pre
fere
nc
e
Overall Species
List
Spring
Migration
Fall
Migration
Breeding
Birds
Diurnal
Raptor
surveys
Lek
Surveys
Spring
Migration
2007
CRANES
WB Grus canadensis Sandhill Crane G5 NAR V WT, OP X X X
PLOVERS
SB Pluvialis squatarola Black-bellied Plover G5 GR SH X
SB Charadrius vociferus Killdeer G5 GR OP X X X X X X X
SANDPIPERS & PHALAROPES
SB Tringa melanoleuca Greater Yellowlegs G5 GR WT, SL, SH X X
SB Tringa flavipes Lesser Yellowlegs G5 GR WT, SL, SH X X
SB Actitis macularia Spotted Sandpiper G5 GR SH X X
GULLS
WBc Larus delawarensis Ring-billed Gull G5 C, GR SH, L, OP X X X
WBc Gull sp. GNR X X X
SKUAS, TERNS & SKIMMERS
WBc Chlidonias niger Black Tern G4 NAR FL, V WT X X
DOVES
LB Columba livia Rock Pigeon G5 B, CL D X X X X X
LB/LBg Zenaida macroura Mourning Dove G5 TR OP, ED X X X X X X X
WOODPECKERS
LB Colaptes auratus Northern Flicker G5 CA OW X X X X
Picoides villosus Hairy Woodpecker G5 CA M, ED, B X X
FLYCATCHERS
LB Empidonax minimus Least Flycatcher G5 TR OW, SG X X
LB Sayornis phoebe Eastern Phoebe G5 B SB X X
LBg Tyrannus verticalis Western Kingbird G5 TR OP, SB X X
LB Tyrannus tyrannus Eastern Kingbird G5 TR OP X X X
LB Flycatcher sp. X X X X
LARKS
LBg Eremophila alpestris Horned Lark G5 GR OP X X X X X X
SWALLOWS
LB Tachycineta bicolor Tree Swallow G5 NB, CA WT, L, WM X X
LBg Hirundo rustica Barn Swallow G5 B, CL OP, WT, L X X X X X
LB Petrochelidon pyrrhonota Cliff Swallow G5 X
LB Swallow sp. X X
CROWS & JAYS
LB Cyanocitta cristata Blue Jay G5 TR M, ED X X X
LBg Pica pica Black-billed Magpie G5 TR SB, ED, OP X
LB Corvus brachyrhynchos American Crow G5 TR
OP, M, ED, L,
WM, SH X X X X X X
LB Corvus corax Common Raven G5 TR, CL OP, M, ED X X X X X
LB Corvus sp. Corvid sp. X X

2008
Group Scientific Name Common Name GR
AN
K
SR
AN
K
CO
SE
WIC
Nest
Sit
e
Hab
itat
Pre
fere
nc
e
Overall Species
List
Spring
Migration
Fall
Migration
Breeding
Birds
Diurnal
Raptor
surveys
Lek
Surveys
Spring
Migration
2007
CHICKADEES
LB Poecile atricapillus Black-capped Chickadee G5 CA M, ED, SG, SB X X X
WRENS
LB Troglodytes aedon House Wren G5 CA SB, OW, B X
THRUSHES
LB Turdus migratorius American Robin G5 TR, BU
OW, OP, GL,
SG X X X X X
MIMIDS
LB Dumetella carolinensis Gray Catbird G5 TR SB, ED X X
LB Toxostoma rufum Brown Thrasher G5 TR SB, ED, SG X X
STARLINGS
LB Sturnus vulgaris European Starling G5
CA, NB,
B D, OP X X X X X
VIREOS
LB Vireo gilvis Warbling Vireo G5 TR OW, ED X X
WOOD WARBLERS
LB Dendroica petechia Yellow Warbler G5 TR SB X X
LB Dendroica coronata Yellow-rumped Warbler G5 TR OW, ED X X
LB Mniotilta varia Black-and-white Warbler G5 X
LB Setophaga ruticilla American Redstart G5 TR OW, SG X
LB Wilsonia pusilla Wilson's Warbler G5 GR WT, SG X
LB Warbler sp. X X X
SPARROWS
LB Spizella arborea American Tree Sparrow G5 GR SB, OP X X X
LB Spizella passerina Chipping Sparrow G5 TR SB, ED, OP X X X
LB Spizella pallida Clay-colored Sparrow G5 TR SB, OP X X X X
LBg Pooecetes gramineus Vesper Sparrow G5 GR OP, ED X X X X X X X
LBg* Passerculus sandwichensis Savannah Sparrow G5 GR OP, GL, WM X X X X X X X
LB/LBg Melospiza melodia Song Sparrow G5 GR, TR SB, ED X X X X X
LB Calcarius lapponicus Lapland Longspur G5 GR OP X X
LB Plectrophenax nivalis Snow Bunting G5 CL, GR OP X X X X
LB Zonotrichia leucophrys White-crowned Sparrow G5 X
LB Zonotrichia querula Harris's Sparrow G5 X
LB Sparrow sp. X X X X X
BLACKBIRDS
LBg* Dolichonyx oryzivorus Bobolink G5 GR GL, OP X X X X
LBg Agelaius phoeniceus Red-winged Blackbird G5 V WT, OP X X X X X X X
LBg* Sturnella neglecta Western Meadowlark G5 GR GL, OP X X X X X X X
LBg Euphagus cyanocephalus Brewer's Blackbird G5 GR, TR OP, SB, WT X X X X X X
LB Quiscalus quiscula Common Grackle G5 C, TR OP, WT, OW X X X X X X
LBg Molothrus ater Brown-headed Cowbird G5 P OP X X X X X

2008
Group Scientific Name Common Name GR
AN
K
SR
AN
K
CO
SE
WIC
Nest
Sit
e
Hab
itat
Pre
fere
nc
e
Overall Species
List
Spring
Migration
Fall
Migration
Breeding
Birds
Diurnal
Raptor
surveys
Lek
Surveys
Spring
Migration
2007
LB Blackbird sp. X X X X X X
ORIOLES
LB Icterus spurius Orchard Oriole G5 TR OP, OW X
LB Icterus galbula Baltimore Oriole G5 TR OP, OW X X
LB Oriole sp. X X
WINTER FINCHES
LB Carduelis tristis American Goldfinch G5 X X X X X X X X
OLD WORLD SPARROWS
LB Passer domesticus House Sparrow G5 X
LB Unknown species X X
Passarine species X X X
LEGEND
GROUP HABITAT PREFERENCE NEST SITE GRANK (Global Rank)
WB non-colonial waterbird B burntlands B building G5- Very Common
WBc colonial waterbird D developed areas BU burrow G4- Common
WF waterfowl ED edge, hedgerows, scattered trees C colonial GNR- Globally Not Ranked
SB non-colonial shorebird GL grassland CA cavity
SBc colonial shorebird L lakes, ponds, calm water CL cliff ledge COSEWIC
RA raptor M mature dense woodland FL floating NAR-Not at Risk
O owl OP open field GR ground
LB landbird OW open woodland NB nest boxes SRANK (Sub-national Rank)
g* grassland obligate R rivers, streams, flowing water P parasitic S4B- Apparently Secure-Breeding
g grassland generalist SB shrubland, thickets PL platform
SG second growth, immature woods SH shoreline, close to water
SH shoreline TR tree
SL shallow water V in vegetation
WM wet meadows AN abandoned nests
WT wetlands - swamps, marshes, bogs, fens

Natural Resource Solutions Inc. Appendices
APPENDIX II
Breeding Bird Evidence Observations

Breeding Bird Evidence Observed in the Project Area
Bird Group Species Name
Total Individuals Observed in
100m
Percent of Total
Observations
Highest Breeding Evidence
PO PR CO Obs.
LB American Crow 5 0.3 S
LB American Goldfinch 59 3.5 P
LB American Robin 9 0.5 S
LB Baltimore Oriole 3 0.2 CF
LB Barn Swallow 99 5.8 P
LB Blue Jay 1 0.1 S
WFg Blue-Winged Teal 1 0.1 H
LB Boblink 65 3.8 P
LB Brewer's Blackbird 111 6.5 CF
LB Brown-Headed Cowbird 213 12.6 P
WF Canada Goose 33 1.9 X
LB Clay-Coloured Sparrow 14 0.8 S
LB Common Grackle 13 0.8 CF
LB Eastern Kingbird 17 1.0 P
LB Eastern Phoebe 2 0.1 P
LB European Starling 6 0.4 H
LB Flycatcher sp. 2 0.1 S
LB Gray Catbird 5 0.3 S
LB Gray Partridge 1 0.1 H
WBc Great Blue Heron 2 0.1 X
WB Grebe sp. 1 0.1 H
LB Horned Lark 57 3.4 S
SB Killdeer 64 3.8 DD
LB Least Flycatcher 7 0.4 S
WF Mallard 51 3.0 NE
LB Mourning Dove 68 4.0 S
RA Northern Harrier 5 0.3 H
LB Oriole sp. 1 0.1 H
LB Red-Winged Blackbird 646 38.1 D
LB Rock Pigeon 20 1.2 AE
LB Savannah Sparrow 58 3.4 CF
LB Song Sparrow 9 0.5 S
LB Tree Swallow 2 0.1 H
LB Vesper Sparrow 3 0.2 H
LB Warbler sp. 1 0.1 S
LB Warbling Vireo 4 0.2 S
LB Western Meadowlark 27 1.6 P
LB Yellow Warbler 8 0.5 S

Legend
Breeding Evidence Codes
Observed CO-Confirmed
X- No evidence of Breeding DD- Distraction display
CF- Carrying food
PO-Possible AE- Adults at Occupied Nest
H- Suitable nesting habitat NE- Nest containing eggs
S- Singing Male
PR- Probable
P- Pair
D- Courtship or display

Natural Resource Solutions Inc. Appendices
APPENDIX III
Mammals with Range Maps that Overlap with the Study Area

Mammals with Range Maps Overlapping with the Study Area
Scientific Name Common Name NRSI
Observations GRANK SRANK COSEWIC
Taxidea taxus American Badger G5 NAR
Bison bison bison Plains Bison G4 THR
Sorex arcticus Black-backed Shrew G5
Lynx rufus Bobcat G5
Canis latrans Coyote X G5
Peromyscus maniculatus Deer Mouse G5
Tamias striatus Eastern Chipmunk G5
Sylvilagus floridanus Eastern Cottontail G5
Felis concolor couguar Eastern Cougar* G5 DD
Cervus elaphus Eastern Elk (Wapiti) G5
Mustela erminea Ermine G5
Sciurus niger Fox Squirrel G5 NAR
Sciurus carolinensis Gray Squirrel Black Phase G5
Sciurus carolinensis Gray Squirrel Gray Phase G5
Urocyon cinereoargenteus Gray Fox** G5 THR
Tamias mimumus Least Chipmunk G5
Mustela nivalis Least Weasel G5
Mustela frenata Long-tailed Weasel G5
Zapus hudsonius Meadow Jumping Mouse G5
Microtus pennsylvanicus Meadow Vole G5
Mustela vison Mink G5
Ondatra zibethicus Muskrat G5
Canis lupus lycaon Eastern Wolf** G4 SC
Thomomys talpoides Northern Pocket Gopher X ? NAR
Blarina brevicauda Northern Short-tailed Shrew G5
Geomys bursarius Plains Pocket Gopher ? ? S3
Erethizon dorsatum Porcupine G5
Microtus ochrogaster Prarie Vole ?
Sorex hoyi Pygmy Shrew G5
Procyon lotor Raccoon X G5
Vulpes vulpes Red Fox X G5
Tamiasciurus hudsonicus Red Squirrel G5
Spermophilus richardsonii Richardson's Ground Squirrel ?
Lepus americanus Snowshoe Hare G5
Clethrionomys gapperi Southern Red-backed Vole G5
Mephitis mephitis Striped Skunk G5
Spermophilus tridecimlineatus
Thirteen-lined Ground Squirrel X G5
Odocoileus virginianus White-tailed Deer X G5
Lepus townsendii White-tailed Jackrabbit X G5
Marmota monax Woodchuck G5

Note: Reference Banfield (1981) unless otherwise indicated with an astrix
*Watkins 2005
** Environment Canada 2006
LEGEND
Srank COSEWIC Designations
3- Uncommon NAR- Not at Risk
SC- Special Concern
G-Rank (Global Rank) DD-Data Deficient
G4-Common
G5-Very Secure ?-Unknown

Natural Resource Solutions Inc. Appendices
APPENDIX IV
Herpetofauna with Range Maps that Overlap with the Study Area and Data Collection Sheets

RIM PARK
Amphibian Data Form Observer:
Station Name: Visit #:
Date: Start time:
Approx. wind speed: % Cloud cover: Air Temp: Water Temp: Water pH:
Precipitation Description:
Construction Description:
Remarks:
CALL LEVEL CODES
1 Calls can be counted; not simultaneous. 2 Some simultaneous calls; yet distinguishable 3 Calls not distinguishable
Individually; overlapping
Beaufort 0 0-2 Calm 1 3 to 5 Light air movement2 6 to 11 Slight Breeze 3 12 to 19 Gentle breeze 4* 20-30 Moderate breeze 5* 31-39 Fresh breeze 6* 40-50 Strong breeze
direction______o
50 Westmount Rd. N., Unit 230, Waterloo, Ontario, N2L 2R5 Tel: (519) 725-2227 Fax: (519) 725-2575 Web: www.nrsi.on.ca

Reptiles and Amphibians with Range Maps that Overlap with the Study Area
SCIENTIFIC NAME COMMON NAME Observed by NRSI GRANK SRANK COSEWIC
Turtles
Chelydra serpentina serpentina Common Snapping Turtle G5T5
Snakes
Opheodrys vernalis Smooth Greensnake G5 S3S4
Thamnophis sirtalis parientalis Red-sided Gartersnake G5T?
Salamanders
Ambystoma tigrinum Tiger Salamander G5 NAR
Ambystoma tigrinum diaboli Gray Tiger Salamander ?
Toads and Frogs
Bufo americanus American Toad X G5
Bufo hemiophrys Canadian Toad X NAR
Hyla chrysoscelis Cope's Gray Treefrog G5 NAR
Pseudacris maculata Boreal Chorus Frog X G5
Rana pipiens Northern Leopard Frog X G5 SC
Rana sylvatica Wood Frog X G5
Legend
GRANK (Global Rank)
G5- Very Common
COSEWIC
NAR-Not at Risk
SC-Special Concern

Natural Resource Solutions Inc. Appendices
APPENDIX V
Fish Species from Collection Records for the Red River

Fish Species Records for the Red River Near the Project Area
Common Name Scientific Name
banded killifish Fundulus diaphanus
bigmouth buffalo Ictiobus cyprinellus
bigmouth shiner Notropis dorsalis
black bullhead Ameiurus melas
black crappie Pomoxis nigromaculatus
blackchin shiner Notropis heterodon
blacknose dace Rhinichthys obtusus
blacknose shiner Notropis heterolepis
blackside darter Percina maculate
bluntnose minnow Pimephales notatus
brassy minnow Hybognathus hankinsoni
brook stickleback Culaea inconstans
brown bullhead Ameiurus nebulosus
burbot Lota lota
(carp species)
central mudminnow Umbra limi
channel catfish Ictalurus punctatus
chestnut lamprey Ichthyomyzon castaneus
(cisco species)
common shiner Luxilus cornutus
creek chub Semotilus atromaculatus
emerald shiner Notropis atherinoides
fathead minnow Pimephales promelas
flathead chub Platygobio gracilis
freshwater drum Aplodinotus grunniens
golden shiner Notemigonus chrysoleucas
goldeye Hiodon alosoides
hornyhead chub Nocomis biguttatus
iowa darter Etheostoma exile
johnny darter Etheostoma nigrum
lake chub Couesius plumbeus
lake whitefish Coregonus clupeaformis
logperch Percina caprodes
longnose dace Rhinichthys Cataractae
longnose sucker Catostomus Catostomus
mimic shiner Notropis volucellus
ninespine stickleback Pungitius pungitius
northern pike Esox lucius
pearl dace Margariscus margarita
quillback Carpiodes cyprinus
river darter Percina shumardi
river shiner Notropis blennius
rock bass Ambloplites rupestris
rosyface shiner Notropis rubellus
sand shiner Notropis stramineus
sauger Sander Canadensis
shorthead redhorse Moxostoma macrolepidotum
silver chub Macrhybopsis storeriana
silver lamprey Ichthyomyzon unicuspis
silver redhorse Moxostoma anisurum
spottail shiner Notropis hudsonius
stonecat Noturus flavus
tadpole madtom Noturus gyrinus
trout perch Percopsis omiscomaycus
walleye Sander vitreus
white bass Morone chrysops
white sucker Catostomus commersoni
yellow perch Perca flavescens