environmental conditions and disk reliability in … · environmental conditions and disk...
TRANSCRIPT

This paper is included in the Proceedings of the 14th USENIX Conference on
File and Storage Technologies (FAST ’16).February 22–25, 2016 • Santa Clara, CA, USA
ISBN 978-1-931971-28-7
Open access to the Proceedings of the 14th USENIX Conference on
File and Storage Technologies is sponsored by USENIX
Environmental Conditions and Disk Reliability in Free-cooled Datacenters
Ioannis Manousakis, Rutgers University; Sriram Sankar, GoDaddy; Gregg McKnight, Microsoft; Thu D. Nguyen, Rutgers University; Ricardo Bianchini, Microsoft
https://www.usenix.org/conference/fast16/technical-sessions/presentation/manousakis

USENIX Association 14th USENIX Conference on File and Storage Technologies (FAST ’16) 53
Environmental Conditions and Disk Reliability in Free-Cooled Datacenters
Ioannis Manousakis,†∗ Sriram Sankar,‡ Gregg McKnight,δ Thu D. Nguyen,† Ricardo Bianchiniδ
†Rutgers University ‡GoDaddy δ Microsoft
AbstractFree cooling lowers datacenter costs significantly, butmay also expose servers to higher and more variable tem-peratures and relative humidities. It is currently unclearwhether these environmental conditions have a signifi-cant impact on hardware component reliability. Thus,in this paper, we use data from nine hyperscale datacen-ters to study the impact of environmental conditions onthe reliability of server hardware, with a particular fo-cus on disk drives and free cooling. Based on this study,we derive and validate a new model of disk lifetime as afunction of environmental conditions. Furthermore, wequantify the tradeoffs between energy consumption, en-vironmental conditions, component reliability, and data-center costs. Finally, based on our analyses and model,we derive server and datacenter design lessons.
We draw many interesting observations, including (1)relative humidity seems to have a dominant impact oncomponent failures; (2) disk failures increase signifi-cantly when operating at high relative humidity, due tocontroller/adaptor malfunction; and (3) though higherrelative humidity increases component failures, softwareavailability techniques can mask them and enable free-cooled operation, resulting in significantly lower infras-tructure and energy costs that far outweigh the cost of theextra component failures.
1 Introduction
Datacenters consume a massive amount of energy. Arecent study [18] estimates that they consume roughly2% and 1.5% of the electricity in the United States andworld-wide, respectively. In fact, a single hyperscale dat-acenter may consume more than 30MW [7].
These staggering numbers have prompted many ef-forts to reduce datacenter energy consumption. Perhapsthe most successful of these efforts have involved reduc-ing the energy consumption of the datacenter coolinginfrastructure. In particular, three important techniques
∗This work was done while Ioannis was at Microsoft.
have helped reduce the cooling energy: (1) increasingthe hardware operating temperature to reduce the needfor cool air inside the datacenter; (2) building datacen-ters where their cooling can directly leverage the outsideair, reducing the need for energy-hungry (and expensive)water chillers; and (3) eliminating the hot air recircula-tion within the datacenter by isolating the cold air fromthe hot air. By using these and other techniques, largedatacenter operators today can report yearly Power Us-age Effectiveness (PUE) numbers in the 1.1 to 1.2 range,meaning that only 10% to 20% of the total energy goesinto non-IT activities, including cooling. The low PUEsof these modern (“direct-evaporative-cooled” or simply“free-cooled”1) datacenters are substantially lower thanthose of older generation datacenters [14, 15].
Although lowering cooling costs and PUEs wouldseem like a clear win, increasing the operating tempera-ture and bringing the outside air into the datacenter mayhave unwanted consequences. Most intriguingly, thesetechniques may decrease hardware component reliabil-ity, as they expose the components to aggressive environ-mental conditions (e.g., higher temperature and/or higherrelative humidity). A significant decrease in hardware re-liability could actually increase rather than decrease thetotal cost of ownership (TCO).
Researchers have not yet addressed the tradeoffs be-tween cooling energy, datacenter environmental condi-tions, hardware component reliability, and overall costsin modern free-cooled datacenters. For example, theprior work on the impact of environmental conditions onhardware reliability [10, 25, 27] has focused on older(non-free-cooled) datacenters that maintain lower andmore stable temperature and relative humidity at eachspatial spot in the datacenter. Because of their focus onthese datacenters, researchers have not addressed the re-liability impact of relative humidity in energy-efficient,free-cooled datacenters at all.
1Throughout the paper, we refer to free cooling as the direct use ofoutside air to cool the servers. Some authors use a broader definition.

54 14th USENIX Conference on File and Storage Technologies (FAST ’16) USENIX Association
Understanding these tradeoffs and impacts is the topicof this paper. First, we use data collected from the opera-tions of nine world-wide Microsoft datacenters for 1.5years to 4 years to study the impact of environmentalconditions (absolute temperature, temperature variation,relative humidity, and relative humidity variation) on thereliability of server hardware components. Based on thisstudy and the dominance of disk failures, we then deriveand validate a new model of disk lifetime as a functionof both temperature and relative humidity. The modelleverages data on the impact of relative humidity on cor-rosion rates. Next, we quantify the tradeoffs between en-ergy consumption, environmental conditions, componentreliability, and costs. Finally, based on our dataset andmodel, we derive server and datacenter design lessons.
We draw many observations from our dataset and anal-yses, including (1) disks account for the vast majority(89% on average) of the component failures regardlessof the environmental conditions; (2) relative humidityseems to have a much stronger impact on disk failuresthan absolute temperature in current datacenter operat-ing conditions, even when datacenters operate withinASHRAE’s “allowable” conditions [4] (i.e., 10-35◦C in-let air temperature and 20–80% relative humidity); (3)temperature variation and relative humidity variation arenegatively correlated with disk failures, but this is a con-sequence of these variations tending to be strongest whenrelative humidity is low; (4) disk failure rates increasesignificantly during periods of high relative humidity,i.e. these periods exhibit temporal clustering of failures;(5) disk controller/connectivity failures increase signifi-cantly when operating at high relative humidity (the con-troller and the adaptor are the only parts that are exposedto the ambient conditions); (6) in high relative humiditydatacenters, server designs that place disks in the back ofenclosures can reduce the disk failure rate significantly;and (7) though higher relative humidity increases com-ponent failures, relying on software techniques to maskthem and operate in this mode also significantly reducesinfrastructure and energy costs, and more than compen-sates for the cost of the additional failures.
Note that, unlike disk vendors, we do not have accessto a large isolated chamber where thousands of disks canbe exposed to different environmental conditions in acontrolled and repeatable manner.2 Instead, we derivethe above observations from multiple statistical analy-ses of large-scale commercial datacenters under their realoperating conditions, as in prior works [10, 25, 27]. Toincrease confidence in our analyses and inferences, we
2From these experiments, vendors derive recommendations for theideal operating conditions for their parts. Unfortunately, it is very dif-ficult in practice to guarantee consistent operation within those con-ditions, as server layouts vary and the environment inside servers isdifficult to control exactly, especially in free-cooled datacenters.
personally inspected two free-cooled datacenters that ex-perience humid environments and observed many sam-ples of corroded parts.
In summary, we make the following contributions:• We study the impact of relative humidity and rela-
tive humidity variation on hardware reliability (witha strong focus on disk drives) in datacenters.
• We study the tradeoffs between cooling energy, en-vironmental conditions, hardware reliability, andcost in datacenters.
• Using data from nine datacenters, more than 1Mdisks, and 1.5–4 years, we draw many interestingobservations. Our data suggests that the impact oftemperature and temperature variation on disk reli-ability (the focus of the prior works) is much lesssignificant than that of relative humidity in moderncooling setups.
• Using our disk data and a corrosion model, we alsoderive and validate a new model of disk lifetime asa function of environment conditions.
• From our observations and disk lifetime model, wedraw a few server and datacenter design lessons.
2 Related Work
Environmentals and their impact on reliability. Sev-eral works have considered the impact of the cooling in-frastructure on datacenter temperatures and humidities,e.g. [3, 22, 23]. However, they did not address the hard-ware reliability implications of these environmental con-ditions. The reason is that meaningful reliability stud-ies require large server populations in datacenters thatare monitored for multiple years. Our paper presents thelargest study of these issues to date.
Other authors have had access to such large realdatasets for long periods of time: [5, 10, 20, 25, 27, 28,29, 35]. A few of these works [5, 28, 29, 35] consideredthe impact of age and other factors on hardware relia-bility, but did not address environmental conditions andtheir potential effects. The other prior works [10, 25, 27]have considered the impact of absolute temperature andtemperature variation on the reliability of hardware com-ponents (with a significant emphasis on disk drives) indatacenters with fairly stable temperature and relativehumidity at each spatial spot, i.e. non-air-cooled data-centers. Unfortunately, these prior works are inconclu-sive when it comes to the impact of absolute tempera-ture and temperature variations on hardware reliability.Specifically, El-Sayed et al. [10] and Pinheiro et al. [25]found a smaller impact of absolute temperature on disklifetime than previously expected, whereas Sankar et al.[27] found a significant impact. El-Sayed et al. alsofound temperature variations to have a more significantimpact than absolute temperature on Latent Sector Errors

USENIX Association 14th USENIX Conference on File and Storage Technologies (FAST ’16) 55
(LSEs), a common type of disk failure that renders sec-tors inaccessible. None of the prior studies consideredrelative humidity or relative humidity variations.
Our paper adds to the debate about the impact of ab-solute temperature and temperature variation. However,our paper suggests that this debate may actually be mootin modern (air-cooled) datacenters. In particular, our re-sults show that relative humidity is a more significantfactor than temperature. For this reason, we also extendan existing disk lifetime model with a relative humidityterm, and validate it against our real disk reliability data.
Other tradeoffs. Prior works have also considered theimpact of the cooling infrastructure and workload place-ment on cooling energy and costs, e.g. [1, 6, 8, 17, 19,21, 23]. However, they did not address the impact of en-vironmental conditions on hardware reliability (and theassociated replacement costs). A more complete under-standing of these tradeoffs requires a more comprehen-sive study, like the one we present in this paper. Specifi-cally, we investigate a broader spectrum of tradeoffs, in-cluding cooling energy, environmental conditions, hard-ware reliability, and costs. Importantly, we show thatthe increased hardware replacement cost in free-cooleddatacenters is far outweighed by their infrastructure andoperating costs savings.
However, we do not address effects that our datasetdoes not capture. In particular, techniques devised to re-duce cooling energy (increasing operating temperatureand using outside air) may increase the energy consump-tion of the IT equipment, if server fans react by spinningfaster. They may also reduce performance, if serversthrottle their speed as a result of the higher operatingtemperature. Prior research [10, 32] has considered theseeffects, and found that the cooling energy benefits ofthese techniques outweigh the downsides.
3 Background
Datacenter cooling and environmentals. The coolinginfrastructure of hyperscale datacenters has evolved overtime. The first datacenters used water chillers with com-puter room air handlers (CRAHs). CRAHs do not featurethe integrated compressors of traditional computer roomair conditioners (CRACs). Rather, they circulate the aircarrying heat from the servers to cooling coils carryingchilled water. The heat is then transferred via the waterback to the chillers, which transfer the heat to anotherwater loop directed to a cooling tower, before returningthe chilled water back inside the datacenter. The coolingtower helps some of the water to evaporate (dissipatingheat), before it loops back to the chillers. Chillers areexpensive and consume a large amount of energy. How-ever, the environmental conditions inside the datacenter
Technology Temp/RH Control CAPEX PUEChillers Precise / Precise $2.5/W 1.7Water-side Precise / Precise $2.8/W 1.19Free-cooled Medium / Low $0.7/W 1.12
Table 1: Typical temperature and humidity control, CAPEX[11], and PUEs of the cooling types [13, 34].
can be precisely controlled (except for hot spots that maydevelop due to poor air flow design). Moreover, thesedatacenters do not mix outside and inside air. We refer tothese datacenters as chiller-based.
An improvement over this setup allows the chillers tobe bypassed (and turned off) when the cooling towersalone are sufficient to cool the water. Turning the chillersoff significantly reduces energy consumption. When thecooling towers cannot lower the temperature enough, thechillers come back on. These datacenters tightly con-trol the internal temperature and relative humidity, liketheir chiller-based counterparts. Likewise, there is stillno mixing of outside and inside air. We refer to thesedatacenters as water-side economized.
A more recent advance has been to use large fans toblow cool outside air into the datacenter, while filter-ing out dust and other air pollutants. Again using fans,the warm return air is guided back out of the datacen-ter. When the outside temperature is high, these data-centers apply an evaporative cooling process that addswater vapor into the airstream to lower the temperatureof the outside air, before letting it reach the servers.To increase temperature (during excessively cold peri-ods) and/or reduce relative humidity, these datacentersintentionally recirculate some of the warm return air.This type of control is crucial because rapid reductionsin temperature (more than 20◦C per hour, according toASHRAE [4]) may cause condensation inside the data-center. This cooling setup enables the forgoing of chillersand cooling towers altogether, thus is the cheapest tobuild. However, these datacenters may also expose theservers to warmer and more variable temperatures, andhigher and more variable relative humidities than otherdatacenter types. We refer to these datacenters as direct-evaporative-cooled or simply free-cooled.
A survey of the popularity of these cooling infrastruc-tures can be found in [16]. Table 1 summarizes the maincharacteristics of the cooling infrastructures in terms oftheir ability to control temperature and relative humidity,and their estimated cooling infrastructure costs [11] andPUEs. For the PUE estimates, we assume Uptime Insti-tute’s surveyed average PUE of 1.7 [34] for chiller-basedcooling. For the water-side economization PUE, we as-sume that the chiller only needs to be active 12.5% of theyear, i.e. during the day time in the summer. The PUEof free-cooled datacenters depends on their locations, butwe assume a single value (1.12) for simplicity. This value

56 14th USENIX Conference on File and Storage Technologies (FAST ’16) USENIX Association
is in line with those reported by hyperscale datacenteroperators. For example, Facebook’s free-cooled datacen-ter in Prineville, Oregon reports an yearly average PUEof 1.08 with peaks around 1.14 [13]. All PUE estimatesassume 4% overheads due to factors other than cooling.
Hardware lifetime models. Many prior reliability mod-els associated component lifetime with temperature. Forexample, [30] considered several CPU failure modes thatresult from high temperatures. CPU manufacturers usehigh temperatures and voltages to accelerate the onset ofearly-life failures [30]. Disk and other electronics ven-dors do the same to estimate mean times to failure (meanlifetimes). The Arrhenius model is often used to calcu-late an acceleration factor (AFT ) for the lifetime [9].
AFT = eEak ·( 1
Tb− 1
Te)
(1)
where Ea is the activation energy (in eV) for the device,k is Boltzmann’s constant (8.62 · 10−5 eV/K), Tb is theaverage baseline operating temperature (in K) of the de-vice, and Te is the average elevated temperature (in K).
The acceleration factor can be used to estimate howmuch higher the failure rate will be during a certain pe-riod. For example, if the failure rate is typically 2%over a year (i.e., 2% of the devices fail in a year) ata baseline temperature, and the acceleration factor is 2at a higher temperature, the estimate for the acceleratedrate will be 4% (2% × 2) for the year. In other words,FRT = AFT ×FRT b, where FRT is the average failurerate due to elevated temperature, and FRT b is the aver-age failure rate at the baseline temperature. Prior works[10, 27] have found the Arrhenius model to approximatedisk failure rates accurately, though El-Sayed et al. [10]also found accurate linear fits to their failure data.
The Arrhenius model computes the acceleration fac-tor assuming steady-state operation. To extrapolate themodel to periods of changing temperature, existing mod-els compute a weighted acceleration factor, where theweights are proportional to the length of the temperatureexcursions [31]. We take this approach when proposingour extension of the model to relative humidity and free-cooled datacenters. Our validation of the extended model(Section 6) shows very good accuracy for our dataset.
4 Methodology
In this section, we describe the main characteristics ofour dataset and the analyses it enables. We purposelyomit certain sensitive information about the datacenters,such as their locations, numbers of servers, and hard-ware vendors, due to commercial and contractual rea-sons. Nevertheless, the data we do present is plenty tomake our points, as shall become clear in later sections.
DCTag Cooling Months Refresh
CyclesDiskPopul.
CD1 Chiller 48 2 117 KCD2 Water-Side 48 2 146 KCD3 Free-Cooled 27 1 24 KHD1 Chiller 24 1 16 KHD2 Water-Side 48 2 100 KHH1 Free-Cooled 24 1 168 KHH2 Free-Cooled 22 1 213 KHH3 Free-Cooled 24 1 124 KHH4 Free-Cooled 18 1 161 KTotal 1.07 M
Table 2: Main datacenter characteristics. The “C” and “D”tags mean cool and dry. An “H” as the first letter of the tagmeans hot, whereas an “H” as the second letter means humid.
Data sources. We collect data from nine hyperscale Mi-crosoft datacenters spread around the world for periodsfrom 1.5 to 4 years. The data includes component healthand failure reports, traces of environmental conditions,traces of component utilizations, cooling energy data,and asset information.
The datacenters use a variety of cooling infras-tructures, exhibiting different environmental conditions,hardware component reliabilities, energy efficiencies,and costs. The three first columns from the left of Table 2show each datacenter’s tag, its cooling technology, andthe length of data we have for it. The tags correspond tothe environmental conditions inside the datacenters (seecaption for details), not their cooling technology or lo-cation. We classify a datacenter as “hot” (“H” as thefirst letter of its tag) if at least 10% of its internal tem-peratures over a year are above 24◦C, whereas we clas-sify it as “humid” (“H” as the second letter of the tag)if at least 10% of its internal relative humidities over ayear are above 60%. We classify a datacenter that is not“hot” as “cool”, and one that is not “humid” as “dry”. Al-though admittedly arbitrary, our naming convention andthresholds reflect the general environmental conditionsin the datacenters accurately. For example, HD1 (hotand dry) is a state-of-the-art chiller-based datacenter thatprecisely controls temperature at a high setpoint. Moreinterestingly, CD3 (cool and dry) is a free-cooled data-center so its internal temperatures and relative humiditiesvary more than in chiller-based datacenters. However,because it is located in a cold region, the temperaturesand relative humidities can be kept fairly low the vastmajority of the time.
To study hardware component reliability, we gatherfailure data for CPUs, memory modules (DIMMs),power supply units (PSUs), and hard disk drives. Thetwo rightmost columns of Table 2 list the number ofdisks we consider from each datacenter, and the numberof “refresh” cycles (servers are replaced every 3 years)

USENIX Association 14th USENIX Conference on File and Storage Technologies (FAST ’16) 57
in each datacenter. We filter the failure data for entrieswith the following properties: (1) the entry was clas-sified with a maintenance tag; (2) the component is ineither Failing or Dead state according to the datacenter-wide health monitoring system; and (3) the entry’s errormessage names the failing component. For example, adisk error will generate either a SMART (Self-Monitoring,Analysis, and Reporting Technology) report or a failureto detect the disk on its known SATA port. The nature ofthe error allows further classification of the underlyingfailure mode.
Defining exactly when a component has failed perma-nently is challenging in large datacenters [25, 28]. How-ever, since many components (most importantly, harddisks) exhibit recurring errors before failing permanentlyand we do not want to double-count failures, we considera component to have failed on the first failure reported tothe datacenter-wide health monitoring system. This fail-ure triggers manual intervention from a datacenter tech-nician. After this first failure and manual repair, we countno other failure against the component. For example, weconsider a disk to have failed on the first LSE that getsreported to the health system and requires manual inter-vention; this report occurs after the disk controller itselfhas already silently reallocated many sectors (e.g., 2000+sectors for many disks in our dataset). Though this fail-ure counting may seem aggressive at first blush (a com-ponent may survive a failure report and manual repair),note that others [20, 25] have shown high correlations ofseveral types of SMART errors, like LSEs, with permanentfailures. Moreover, the disk Annualized Failure Rates(AFRs) that we observe for chiller-based datacenters arein line with previous works [25, 28].
Detailed analyses. To correlate the disk failures withtheir environmental conditions, we use detailed datafrom one of the hot and humid datacenters (HH1). Thedata includes server inlet air temperature and relative hu-midity values, as well as outside air conditions with agranularity of 15 minutes. The dataset does not containthe temperature of all the individual components insideeach server, or the relative humidity inside each box.However, we can accurately use the inlet values as theenvironmental conditions at the disks, because the disksare placed at the front of the servers (right at their air in-lets) in HH1. For certain analyses, we use CD3 and HD1as bases for comparison against HH1. Although we donot have information on the disks’ manufacturing batch,our cross-datacenter comparisons focus on disks that dif-fer mainly in their environmental conditions.
To investigate potential links between the compo-nents’ utilizations and their failures, we collect histori-cal average utilizations for the processors and disks in agranularity of 2 hours, and then aggregate them into life-time average utilization for each component.
Figure 1: HH1 temperature and relative humidity distribu-tions. Both of these environmentals vary widely.
We built a tool to process all these failure, environ-mental, and utilization data. After collecting, filtering,and deduplicating the data, the tool computes the AFRsand timelines for the component failures. With the time-lines, it also computes daily and monthly failure rates.For disks, the tool also breaks the failure data acrossmodels and server configurations, and does disk errorclassification. Finally, the tool derives linear and expo-nential reliability models (via curve fitting) as a functionof environmental conditions, and checks their accuracyversus the observed failure rates.
5 Results and Analyses
In this section, we first characterize the temperatures andrelative humidities in a free-cooled datacenter, and thehardware component failures in the nine datacenters. Wethen perform a detailed study of the impact of environ-mental conditions on the reliability of disks. We closethe section with an analysis of the hardware reliability,cooling energy, and cost tradeoffs.
5.1 Environmentals in free-cooled DCsChiller-based datacenters precisely control temperatureand relative humidity, and keep them stable at each spa-tial spot in the datacenter. For example, HD1 exhibits astable 27◦C temperature and a 50% average relative hu-midity. In contrast, the temperature and relative humid-ity at each spatial spot in the datacenter vary under freecooling. For example, Figure 1 shows the temperatureand relative humidity distributions measured at a spatialspot in HH1. The average temperature is 24.5◦C (thestandard deviation is 3.2◦C) and the average relative hu-midity is 43% (the standard deviation is 20.3%). Clearly,HH1 exhibits wide ranges, including a large fraction ofhigh temperatures (greater than 24◦C) and a large frac-tion of high relative humidities (greater than 60%).
5.2 Hardware component failuresIn light of the above differences in environmental condi-tions, an important question is whether hardware compo-nent failures are distributed differently in different types

58 14th USENIX Conference on File and Storage Technologies (FAST ’16) USENIX Association
DC Tag Cooling AFR Increase wrtAFR = 1.5%
CD1 Chiller 1.5% 0%CD2 Water-Side 2.1% 40%CD3 Free-Cooled 1.8% 20%HD1 Chiller 2.0% 33%HD2 Water-Side 2.3% 53%HH1 Free-Cooled 3.1% 107%HH2 Free-Cooled 5.1% 240%HH3 Free-Cooled 5.1% 240%HH4 Free-Cooled 5.4% 260%
Table 3: Disk AFRs. HH1-HH4 incur the highest rates.
of datacenters. We omit the full results due to space lim-itations, but highlight that disk drive failures dominatewith 76%–95% (89% on average) of all hardware com-ponent failures, regardless of the component models, en-vironmental conditions, and cooling technologies. As anexample, disks, DIMMs, CPUs, and PSUs correspondto 83%, 10%, 5%, and 2% of the total failures, respec-tively, in HH1. The other datacenters exhibit a similarpattern. Disks also dominate in terms of failure rates,with AFRs ranging from 1.5% to 5.4% (average 3.16%)in our dataset. In comparison, the AFRs of DIMMs,CPUs, and PSUs were 0.17%, 0.23%, and 0.59%, re-spectively. Prior works had shown that disk failures arethe most common for stable environmental conditions,e.g. [27]. Our data shows that they also dominate inmodern, hotter and more humid datacenters. Interest-ingly, as we discuss in Section 7, the placement of thecomponents (e.g., disks) inside each server affects theirfailure rates, since the temperature and relative humidityvary as air flows through the server.
Given the dominance of disk failures and rates, we fo-cus on them in the remainder of the paper.
5.3 Impact of environmentalsDisk failure rates. Table 3 presents the disk AFRs forthe datacenters we study, and how much they differ rela-tive to the AFR of one of the datacenters with stable tem-perature and relative humidity at each spatial spot (CD1).We repeat the cooling technology information from Ta-ble 2 for clarity. The data includes a small number ofdisk models in each datacenter. For example, CD3 andHD1 have two disk models, whereas HH1 has two diskmodels that account for 95% of its disks. More impor-tantly, the most popular model in CD3 (55% of the total)and HD1 (85%) are the same. The most popular model inHH1 (82%) is from the same disk manufacturer and se-ries as the most popular model in CD3 and HD1, and hasthe same rotational speed, bus interface, and form factor;the only differences between the models are their stor-age and cache capacities. In more detailed studies below,
we compare the impact of environmentals on these twomodels directly.
We make several observations from these data:1. The datacenters with consistently or frequently dry
internal environments exhibit the lowest AFRs, re-gardless of cooling technologies. For example, CD1and HD1 keep relative humidities stable at 50%.
2. High internal relative humidity increases AFRs by107% (HH1) to 260% (HH4), compared to CD1.Compared to HD1, the increases range from 55% to170%. For example, HH1 exhibits a wide range ofrelative humidities, with a large percentage of themhigher than 50% (Figure 1).
3. Free cooling does not necessarily lead to high AFR,as CD3 shows. Depending on the local climate (andwith careful humidity control), free-cooled datacen-ters can have AFRs as low as those of chiller-basedand water-side economized datacenters.
4. High internal temperature does not directly corre-late to the high range of AFRs (greater than 3%), assuggested by datacenters HD1 and HD2.
The first two of these observations are indications thatrelative humidity may have a significant impact on diskfailures. We cannot state a stronger result based solely onTable 3, because there are many differences between thedatacenters, their servers and environmental conditions.Thus, in the next few pages, we provide more detailedevidence that consistently points in the same direction.
Causes of disk failures. The first question then becomeswhy would relative humidity affect disks if they are en-capsulated in a sealed package? Classifying the disk fail-ures in terms of their causes provides insights into thisquestion. To perform the classification, we divide thefailures into three categories [2]: (1) mechanical (pre-fail) issues; (2) age-related issues; and (3) controller andconnectivity issues. In Table 4, we list the most com-mon errors in our dataset. Pre-fail and old-age errorsare reported by SMART. In contrast, IOCTL ATA PASS
THROUGH (inability to issue an ioctl command to the con-troller) and SMART RCV DRIVE DATA (inability to readthe SMART data from the controller) are generated in theevent of an unresponsive disk controller.
In Figure 2, we present the failure breakdown for thepopular disk model in HD1 (top), CD3 (middle), andHH1 (bottom). We observe that 67% of disk failures areassociated with SMART errors in HD1. The vast majority(65%) of these errors are pre-fail, while just 2% are old-age errors. The remaining 33% correspond to controllerand connectivity issues. CD3 also exhibits a substantiallysmaller percentage (42%) of controller and connectivityerrors than SMART errors (58%). In contrast, HH1 ex-periences a much higher fraction of controller and con-nectivity errors (66%). Given that HH1 runs its serverscooler than HD1 most of the time, its two-fold increase in
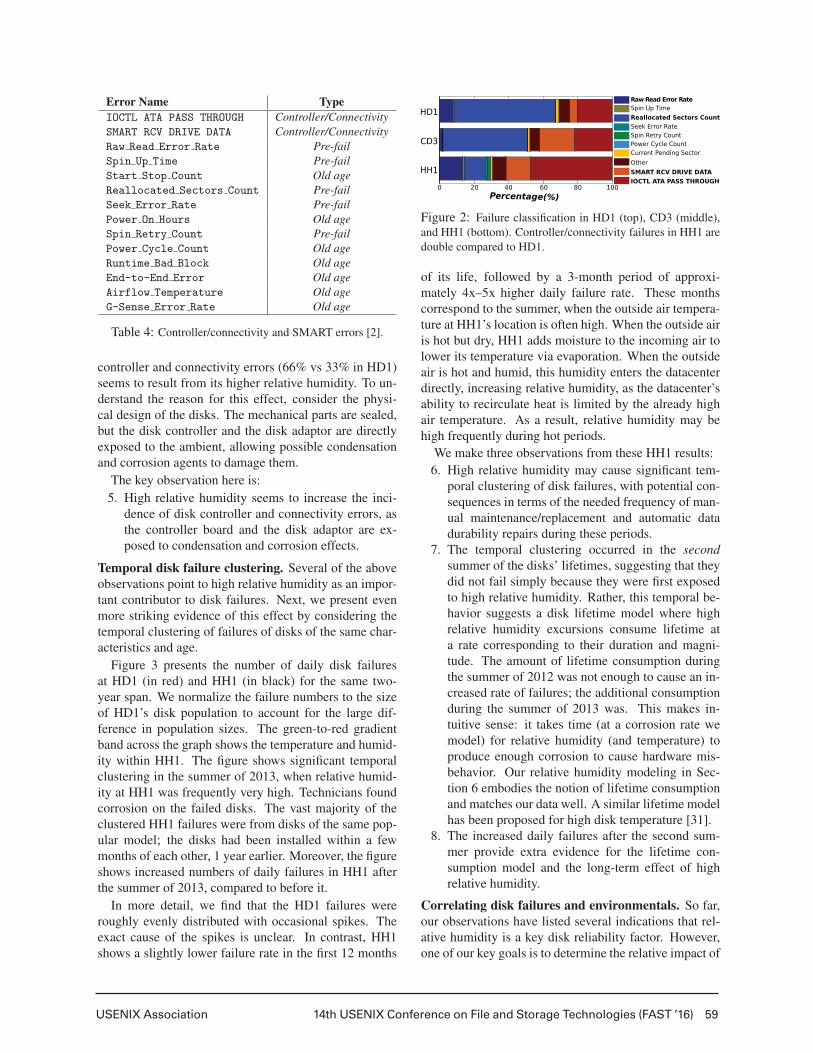
USENIX Association 14th USENIX Conference on File and Storage Technologies (FAST ’16) 59
Error Name TypeIOCTL ATA PASS THROUGH Controller/ConnectivitySMART RCV DRIVE DATA Controller/ConnectivityRaw Read Error Rate Pre-failSpin Up Time Pre-failStart Stop Count Old ageReallocated Sectors Count Pre-failSeek Error Rate Pre-failPower On Hours Old ageSpin Retry Count Pre-failPower Cycle Count Old ageRuntime Bad Block Old ageEnd-to-End Error Old ageAirflow Temperature Old ageG-Sense Error Rate Old age
Table 4: Controller/connectivity and SMART errors [2].
controller and connectivity errors (66% vs 33% in HD1)seems to result from its higher relative humidity. To un-derstand the reason for this effect, consider the physi-cal design of the disks. The mechanical parts are sealed,but the disk controller and the disk adaptor are directlyexposed to the ambient, allowing possible condensationand corrosion agents to damage them.
The key observation here is:5. High relative humidity seems to increase the inci-
dence of disk controller and connectivity errors, asthe controller board and the disk adaptor are ex-posed to condensation and corrosion effects.
Temporal disk failure clustering. Several of the aboveobservations point to high relative humidity as an impor-tant contributor to disk failures. Next, we present evenmore striking evidence of this effect by considering thetemporal clustering of failures of disks of the same char-acteristics and age.
Figure 3 presents the number of daily disk failuresat HD1 (in red) and HH1 (in black) for the same two-year span. We normalize the failure numbers to the sizeof HD1’s disk population to account for the large dif-ference in population sizes. The green-to-red gradientband across the graph shows the temperature and humid-ity within HH1. The figure shows significant temporalclustering in the summer of 2013, when relative humid-ity at HH1 was frequently very high. Technicians foundcorrosion on the failed disks. The vast majority of theclustered HH1 failures were from disks of the same pop-ular model; the disks had been installed within a fewmonths of each other, 1 year earlier. Moreover, the figureshows increased numbers of daily failures in HH1 afterthe summer of 2013, compared to before it.
In more detail, we find that the HD1 failures wereroughly evenly distributed with occasional spikes. Theexact cause of the spikes is unclear. In contrast, HH1shows a slightly lower failure rate in the first 12 months
Figure 2: Failure classification in HD1 (top), CD3 (middle),and HH1 (bottom). Controller/connectivity failures in HH1 aredouble compared to HD1.
of its life, followed by a 3-month period of approxi-mately 4x–5x higher daily failure rate. These monthscorrespond to the summer, when the outside air tempera-ture at HH1’s location is often high. When the outside airis hot but dry, HH1 adds moisture to the incoming air tolower its temperature via evaporation. When the outsideair is hot and humid, this humidity enters the datacenterdirectly, increasing relative humidity, as the datacenter’sability to recirculate heat is limited by the already highair temperature. As a result, relative humidity may behigh frequently during hot periods.
We make three observations from these HH1 results:6. High relative humidity may cause significant tem-
poral clustering of disk failures, with potential con-sequences in terms of the needed frequency of man-ual maintenance/replacement and automatic datadurability repairs during these periods.
7. The temporal clustering occurred in the secondsummer of the disks’ lifetimes, suggesting that theydid not fail simply because they were first exposedto high relative humidity. Rather, this temporal be-havior suggests a disk lifetime model where highrelative humidity excursions consume lifetime ata rate corresponding to their duration and magni-tude. The amount of lifetime consumption duringthe summer of 2012 was not enough to cause an in-creased rate of failures; the additional consumptionduring the summer of 2013 was. This makes in-tuitive sense: it takes time (at a corrosion rate wemodel) for relative humidity (and temperature) toproduce enough corrosion to cause hardware mis-behavior. Our relative humidity modeling in Sec-tion 6 embodies the notion of lifetime consumptionand matches our data well. A similar lifetime modelhas been proposed for high disk temperature [31].
8. The increased daily failures after the second sum-mer provide extra evidence for the lifetime con-sumption model and the long-term effect of highrelative humidity.
Correlating disk failures and environmentals. So far,our observations have listed several indications that rel-ative humidity is a key disk reliability factor. However,one of our key goals is to determine the relative impact of

60 14th USENIX Conference on File and Storage Technologies (FAST ’16) USENIX Association
Figure 3: Two-year comparison between HD1 and HH1 daily failures. The horizontal band shows the outside temperature andrelative humidity at HH1. HH1 experienced temporally clustered failures during summer’13, when the relative humidities werehigh. We normalized the data to the HD1 failures due to the different numbers of disks in these datacenters.
the four related environmental conditions: absolute tem-perature, relative humidity, temperature variation, andrelative humidity variation.
In Table 5, we present both linear and exponential fitsof the monthly failure rates for HH1, as a function ofour four environmental condition metrics. For example,when seeking a fit for relative humidity, we use x = theaverage relative humidity experienced by the failed disksduring a month, and y = the failure rate for that month.Besides the parameter fits, we also present R2 as an es-timate of the fit error. The exponential fit correspondsto a model similar to the Arrhenius equation (Equation1). We use the disks’ temperature and relative humid-ity Coefficient of Variation (CoV) to represent temporaltemperature and relative humidity variations. (The ad-vantage of the CoV over the variance or the standard de-viation is that it is normalized by the average.) El-Sayedet al. [10] studied the same types of fits for their data,and also used CoVs to represent variations. Note thatwe split HH1’s disk population into four groups (P1–P4)roughly corresponding to the spatial location of the disksin the datacenter; this accounts for potential environmen-tal differences across cold aisles.
We can see that the relative humidity consistently ex-hibits positive correlations with failure rates, by consid-ering the a parameter in the linear fit and the b parameterin the exponential fit. This positive correlation meansthat the failure rate increases when the relative humid-ity increases. In contrast, the other environmental condi-tions either show some or almost all negative parameters,suggesting much weaker correlations.
Interestingly, the temperature CoVs and the relativehumidity CoVs suggest mostly negative correlationswith the failure rate. This is antithetical to the physi-cal stresses that these variations would be expected toproduce. To explain this effect most clearly, we plottwo correlation matrices in Figure 4 for the most pop-ular disk model in HH1. The figure illustrates the corre-lations between all environmental condition metrics and
the monthly failure rate. To derive these correlations, weuse (1) the Pearson product-moment correlation coeffi-cient, as a measure of linear dependence; and (2) Spear-man’s rank correlation coefficient, as a measure of non-linear dependence. The color scheme indicates the cor-relation between each pair of metrics. The diagonal el-ements have a correlation equal to one as they repre-sent dependence between the same metric. As before, apositive correlation indicates an analogous relationship,whereas a negative correlation indicates an inverse rela-tionship. These matrices show that the CoVs are stronglynegatively correlated (correlations close to -1) with aver-age relative humidity. This implies that the periods withhigher temperature and relative humidity variations arealso the periods with low relative humidity, providing ex-tended lifetime.
For completeness, we also considered the impact ofaverage disk utilization on lifetime, but found no corre-lation. This is consistent with prior work, e.g. [25].
From the figures and table above, we observe that:9. Average relative humidity seems to have the
strongest impact on disk lifetime of all the environ-mental condition metrics we consider.
10. Average temperature seems to have a substantiallylower (but still non-negligible) impact than averagerelative humidity on disk lifetime.
11. Our dataset includes no evidence that temperaturevariation or relative humidity variation has an effecton disk reliability in free-cooled datacenters.
5.4 Trading off reliability, energy, and cost
The previous section indicates that higher relative hu-midity appears to produce shorter lifetimes and, con-sequently, higher equipment costs (maintenance/repaircosts tend to be small compared to the other TCO fac-tors, so we do not consider them. However, the set oftradeoffs is broader. Higher humidity results from freecooling in certain geographies, but this type of cooling

USENIX Association 14th USENIX Conference on File and Storage Technologies (FAST ’16) 61
Popul. %Linear Fit a · x+b
Temperature RH CoV - Temperature CoV - RHa b R2 a b R2 a b R2 a b R2
P1 30.1 5.17 ·10−5 −2.43 ·10−3 0.81 1.20 ·10−4 −4.88 ·10−3 0.83 −7.90 ·10−3 1.14 ·10−3 0.83 −6.56 ·10−3 3.29 ·10−3 0.84P2 25.6 −1.91 ·10−5 2.46 ·10−3 0.83 1.03 ·10−4 −1.73 ·10−3 0.84 −9.06 ·10−3 1.28 ·10−3 0.84 −3.71 ·10−3 1.98 ·10−3 0.83P3 23.3 1.41 ·10−3 −1.04 ·10−1 0.75 2.11 ·10−4 −5.59 ·10−3 0.71 −4.91 ·10−2 7.26 ·10−2 0.77 −4.46 ·10−2 2.42 ·10−2 0.78P4 19.6 1.73 ·10−3 −1.07 ·10−1 0.36 4.45 ·10−4 −16.4 ·10−3 0.44 −1.36 ·10−1 1.33 ·10−2 0.47 −8.02 ·10−2 4.13 ·10−2 0.55
Popul. %Exponential Fit a · eb·x
Temperature RH CoV - Temperature CoV - RHa b R2 a b R2 a b R2 a b R2
P1 30.1 2.38 ·10−3 −6.45 ·10−3 0.84 2.67 ·10−4 5.11 ·10−2 0.89 2.06 ·10−3 −1.74 ·100 0.72 1.74 ·10−2 −9.01 ·100 0.81P2 25.6 3.08 ·10−3 −1.64 ·10−2 0.85 5.37 ·10−4 5.38 ·10−2 0.88 1.84 ·10−3 −1.09 ·101 0.79 1.37 ·10−2 −1.63 ·101 0.81P3 23.3 2.57 ·10−3 6.35 ·10−3 0.76 5.31 ·10−5 9.93 ·10−2 0.69 5.13 ·10−3 −8.45 ·100 0.58 1.66 ·10−3 3.57 ·100 0.57P4 19.6 3.62 ·10−4 3.36 ·10−2 0.43 1.31 ·10−5 11.54 ·10−2 0.59 6.10 ·10−3 −3.91 ·100 0.23 7.17 ·10−3 −1.39 ·100 0.21
Table 5: Linear (a · x+b) and nonlinear (a · eb·x) fits for the monthly failure rates of four disk populations in HH1, as a function ofthe absolute temperature, relative humidity, temperature variation, and relative humidity variation.
Figure 4: Linear and non-linear correlation between themonthly failure rate and the environmental conditions we con-sider, for the most popular disk model in HH1. red = highcorrelation, dark blue = low correlation.
also improves energy efficiency and lowers both capitaland operating costs.
Putting all these effects together, in Figure 5 we com-pare the cooling-related (capital + operational + disk re-placement) costs for a chiller-based (CD1), a water-sideeconomized (HD2), and a free-cooled datacenter (HH4).For the disk replacement costs, we consider only thecost above that of a 1.5% AFR (the AFR of CD1), sothe chiller-based bars do not include these costs. Weuse HD2 and HH4 datacenters for this figure becausethey exhibit the highest disk AFRs in their categories;they represent the worst-case disk replacement costs fortheir respective datacenter classes. We use the PUEs andCAPEX estimates from Table 1, and estimate the cool-ing energy cost assuming $0.07/kWh for the electric-ity price (the average industrial electricity price in theUnited States). We also assume that the datacenter oper-ator brunts the cost of replacing each failed disk, whichwe assume to be $100, by having to buy the extra disk(as opposed to simply paying a slightly more expensivewarranty). We perform the cost comparison for 10, 15,and 20 years, as the datacenter lifetime.
The figure shows that, for a lifetime of 10 years, thecooling cost of the chiller-based datacenter is roughlybalanced between capital and operating expenses. Fora lifetime of 15 years, the operational cooling cost be-comes the larger fraction, whereas for 20 years it be-
Figure 5: 10, 15, and 20-year cost comparison for chiller-based, water-side, and free-cooled datacenters including thecost replacing disks.
comes roughly 75% of the total cooling-related costs.In comparison, water-side economized datacenters haveslightly higher capital cooling costs than chiller-basedones. However, their operational cooling costs are sub-stantially lower, because of the periods when the chillerscan be bypassed (and turned off). Though these data-centers may lead to slightly higher AFRs, the savingsfrom lower operational cooling costs more than compen-sate for the slight disk replacement costs. In fact, thefully burdened cost of replacing a disk would have tobe several fold higher than $100 (which is unlikely) forreplacement costs to dominate. Finally, the free-cooleddatacenter exhibits lower capital cooling costs (by 3.6x)and operational cooling costs (by 8.3x) than the chiller-based datacenter. Because of these datacenters’ some-times higher AFRs, their disk replacement costs may benon-trivial, but the overall cost tradeoff is still clearlyin their favor. For 20 years, the free-cooled datacen-ter exhibits overall cooling-related costs that are roughly74% and 45% lower than the chiller-based and water-sideeconomized datacenters, respectively.
Based on this figure, we observe that:12. Although operating at higher humidity may entail
substantially higher component AFRs in certain ge-ographies, the cost of this increase is small com-pared to the savings from reducing energy con-sumption and infrastructure costs via free cooling,especially for longer lifetimes.

62 14th USENIX Conference on File and Storage Technologies (FAST ’16) USENIX Association
Figure 6: Normalized daily failures in CD1 over 4 years. In-fant mortality seems clear.
6 Modeling Lifetime in Modern DCs
Models of hardware component lifetime have been usedextensively in industry and academia to understand andpredict failures, e.g. [9, 29, 30]. In the context of a dat-acenter, which hosts hundreds of thousands of compo-nents, modeling lifetimes is important to select the con-ditions under which datacenters should operate and pre-pare for the unavoidable failures. Because disk drivesfail much more frequently than other components, theytypically receive the most modeling attention. The twomost commonly used disk lifetime models are the bath-tub model and the failure acceleration model based onthe Arrhenius equation (Equation 1). The latter acceler-ation model does not consider the impact of relative hu-midity, which has only become a significant factor afterthe advent of free cooling (Section 5.3).
Bathtub model. This model abstracts the lifetimeof large component populations as three consecutivephases: (1) in the first phase, a significant number ofcomponents fail prematurely (infant mortality); (2) thesecond phase is a stable period of lower failure rate; and(3) in the third phase, component failure increase againdue to wear-out effects. We clearly observe infant mor-tality in some datacenters but not others, depending ondisk model/vendor. For example, Figure 3 does not showany obvious infant mortality in HH1. The same is thecase of CD3. (Prior works have also observed the ab-sence of infant mortality in certain cases, e.g. [28].) Incontrast, CD1 uses disks from a different vendor anddoes show clear infant mortality. Figure 6 shows thenormalized number of daily failures over a period of 4years in CD1. This length of time implies 1 server refresh(which happened after 3 years of operation). The figureclearly shows 2 spikes of temporally clustered failures:one group 8 months after the first server deployment, andanother 9 months after the first server refresh. A full de-ployment/refresh may take roughly 3 months, so the firstgroup of disks may have failed 5-8 months after deploy-ment, and the second 6-9 months after deployment.
A new disk lifetime model for free-cooled datacenters.Section 5.3 uses multiple sources of evidence to arguethat relative humidity has a significant impact on hard-
ware reliability in humid free-cooled datacenters. Thesection also classifies the disk failures into two maingroups: SMART and controller/connectivity. Thus, weextend the acceleration model above to include relativehumidity, and recognize that there are two main disk life-time processes in free-cooled datacenters: (1) one that af-fects the disk mechanics and SMART-related errors; and(2) another that affects its controller/connector.
We model process #1 as the Arrhenius accelerationfactor, i.e. AF1 = AFT (we define AFT in Equation 1),as has been done in the past [10, 27]. For process #2,we model the corrosion rate due to high relative humidityand temperature, as both of them are known to affect cor-rosion [33]. Prior works have devised models allowingfor more than one accelerating variable [12]. A generalsuch model extends the Arrhenius failure rate to accountfor relative humidity, and compute a corrosion rate CR:
CR(T ,RH) = const · e(−Eak·T ) · e(b·RH)+( c·RH
k·T ) (2)
where T is the average temperature, RH is the averagerelative humidity, Ea is the temperature activation energy,k is Boltzmann’s constant, and const, b, and c are otherconstants. Peck empirically found an accurate model thatassumes c = 0 [24], and we make the same assumption.Intuitively, Equation 2 exponentially relates the corro-sion rate with both temperature and relative humidity.
One can now compute the acceleration factor AF2 bydividing the corrosion rate at the elevated temperatureand relative humidity CR(Te,RHe) by the same rate at thebaseline temperature and relative humidity CR(Tb,RHb).Essentially, AF2 calculates how much faster disks willfail due to the combined effects of these environmentals.This division produces:
AF2 = AFT ·AFRH (3)
where AFRH = eb·(RHe−RHb) and AFT is from Equation 1.Now, we can compute the compound average failure
rate FR as AF1 ·FR1b +AF2 ·FR2b, where FR1b is theaverage mechanical failure rate at the baseline tempera-ture, and FR2b is the average controller/connector fail-ure rate at the baseline relative humidity and tempera-ture. The rationale for this formulation is that the twofailure processes proceed in parallel, and a disk’s con-troller/connector would not fail at exactly the same timeas its other components; AF1 estimates the extra failuresdue to mechanical/SMART issues, and AF2 estimates theextra failures due to controller/connectivity issues.
To account for varying temperature and relative hu-midity, we also weight the factors based on the dura-tion of those temperatures and relative humidities. Otherworks have used weighted acceleration factors, e.g. [31].For simplicity in the monitoring of these environmentals,we can use the average temperature and average relative

USENIX Association 14th USENIX Conference on File and Storage Technologies (FAST ’16) 63
Figure 7: AFR prediction using our new disk lifetime modeland the environmental conditions from HH1.
humidity per unit of time (e.g., hour, day) and computethe compound acceleration as a function of time t:
FR(t) = AF1(t) ·FR1b(t)+AF2(t) ·FR2b(t) (4)
Model validation. We validate our disk lifetime modelusing real temperature, relative humidity, and daily fail-ure rate data from HH1. (In the next section, we alsovalidate it for CD3.) We use daily failure rates as theyare finer grained than annualized failure rates and cap-ture the underlying processes well.
Since ours is an acceleration model, we need to buildit on a baseline failure rate. Unfortunately, our datasetdoes not include data that we could use as such a baseline(e.g., daily failure rates for a datacenter that keeps tem-perature and relative humidity consistently low and usesthe same disk model as HH1). Instead of this data, weuse daily failure rates derived from Equation 4 with tem-perature and relative humidity fixed at 20◦C and 30%,respectively. For this baseline, we use Ea = 0.46 as com-puted by Sankar et al. [27], and b = 0.0455 as we de-rive from the copper corrosion rate measured by Rice etal. [26]. These values produce an AFR = 1.5%, and anaverage daily failure rate of 1.5%/365.
Using the actual temperatures and relative humiditiesof HH1, we apply our acceleration model to the baselineaverage daily failure rate. We train the model with datafor populations P2 and P3 (for these data, b = 0.0652),and validate the results with data from P1 and P4. Wedo not include any infant mortality effects, because HH1does not exhibit them. If desired, infant mortality canbe modeled using a Weibull distribution, as other authorshave done, e.g. [28].
Figure 7 shows the predicted acceleration factors, pre-dicted daily failure rates, and the baseline failure rateover 2 years, starting in the beginning of the summer.Based on the daily baseline and acceleration factors, wecompute the predicted daily failure rates and depict themwith the red curve. These results show that our model isaccurate: from the red curve, we compute the predicteddisk AFR for P1 and P4 to be 3.04%, whereas the realAFR for these populations is 3.18%.
As one would expect from Section 5.3, the relative hu-midity contributes the most to the accuracy of the model.
Removing the temperature components from the acceler-ation factors shows that it accounts for only 8.12% of thepredicted AFR. Previous models (which are based solelyon temperature) predict no increase in failure rates withrespect to a baseline of 1.5%. Thus, models that do notaccount for relative humidity severely underestimate thecorresponding failure rates.
7 Design Lessons
We next derive design lessons for servers and datacen-ters. We start by using our acceleration model to discussdifferent server layouts, and then discuss the implicationsof our findings to the placement, design, and manage-ment of datacenters.
Server design lessons. Our discussion of server designsrelies on two main observations: (1) high relative humid-ity tends to produce more disk failures, as we have seenso far; and (2) higher temperature leads to lower relativehumidity, given a constant amount of moisture in the air.These observations suggest that the layout of the diskswithin a server blade or enclosure may have a significantimpact on its reliability in free-cooled datacenters.
To see this, consider Figure 8, where we present threepossible layouts for a two-socket server blade. Ourdataset has examples of all these layouts. In Figures 8(a)and (c), the disks are not exposed to the heat generatedby the processors and memory DIMMs. This means thatthe relative humidity to which the disks will be exposedis roughly the same as that in the server’s air inlet. In con-trast, in Figure 8(b), the disks will be exposed to lowerrelative humidity, as they are placed downstream fromthe processors and DIMMs. The difference in relativehumidity in this layout can be significant.
To demonstrate this difference, we consider the inletair temperature and relative humidity data from CD3, inwhich the server blades have the layout of Figure 8(b).This datacenter exhibits average inlet air temperaturesof 19.9◦C, leading to a much higher air temperature ofroughly 42◦C at the disks. Given these temperatures andan average inlet relative humidity of 44.1%, psychomet-rics calculations show that the average relative humidityat the disks would be only 13%. This is one of the rea-sons that CD3 exhibits such a low AFR. In fact, giventhis adjusted temperature and relative humidity, our ac-celeration model produces an accurate prediction of theAFR: 1.75% versus the real AFR of 1.8%.
In contrast with CD3, HH1 uses server blades with thelayout in Figure 8(a). As HH1 exhibits a wider range oftemperatures and relative humidities than CD3, we com-pute what the maximum relative humidity at any diskacross the entire range of air temperatures would be atthe back to the servers. The maximum values would be

64 14th USENIX Conference on File and Storage Technologies (FAST ’16) USENIX Association
Figure 8: The server blade designs. Server designs with disksnear the air exhaust lower their AFRs.
27% and 54.4◦C at the disks. These values suggest thatrelative humidity should no longer have an impact on theAFR, while temperature should have a stronger impact.Overall, our model predicts AFR = 2.7%, instead of theactual AFR = 3.1% with disks in the front. Thus, chang-ing the server layout in HH1 would decrease the impor-tance of the relative humidity, increase the importance oftemperature, but still produce a substantially lower AFR.
Obviously, placing disks at the back of servers couldcause other components to experience higher relative hu-midity. Memory DIMMs would perhaps be the most rel-evant concern, as they also have exposed connectors. Toprevent increases in AFR, DIMMs may be placed down-stream from CPUs, which are the components most re-sponsible for lowering relative humidity. Clearly, the fullAFR and cost implications of the different layouts needto be understood, especially in free-cooled datacenters.
Datacenter lessons. As we argue in Section 5.4, freecooling reduces capital and operational cooling expensessignificantly compared to other approaches. These sav-ings may come at the cost of higher AFRs, depending onthe outside environmental conditions at the datacenter’slocation. Fortunately, the server design lessons abovesuggest that organizations can lower the disk AFR oftheir hot and humid datacenters by simply using serverdesigns in which the disks are placed in the back.
In fact, since high relative humidity seems much moreharmful than high temperature, operators may considerrunning their datacenters somewhat hotter in the summer,instead of increasing the relative humidity to keep thetemperature lower. Obviously, this has to be done care-fully, since our observations and inferences apply only tothe conditions that our datacenters have experienced.
Another important lesson involves data availabil-ity/reliability. Clearly, a higher disk AFR could requirethe datacenter software (i.e., its online services and/ormanagement systems) to manage data redundancy moreaggressively. Fortunately, this does not pose a seriousproblem for at least two reasons: (1) in large datacenterswith hundreds of thousands of hardware components,failures are a common occurrence, so software is alreadycapable of tolerating them via data redundancy withinor across datacenters; (2) the increases in disk AFR thatmay result from using free cooling at challenging loca-tions (roughly 3x in our dataset) are not large enoughthat they would threaten the reliability of data stored bythese datacenters. In the worst case, the software wouldadd slightly more redundancy to the data (disk space hasnegligible cost per bit, compared to other TCO factors).Nevertheless, if software cannot manage the impact ofthe higher AFRs, datacenter operators must tightly con-trol the relative humidity and site their datacenters in lo-cations where this is more easily accomplished.
8 Conclusions
In this paper, we studied the impact of environmentalconditions on the reliability of disk drives from nine data-centers. We also explored the tradeoffs between environ-mental conditions, energy consumption, and datacentercosts. Based on these analyses, we proposed and vali-dated a new disk lifetime model that is particularly use-ful for free-cooled datacenters. Using the model and ourdata, we derived server and datacenter design lessons.
Based on our experience and observations, we con-clude that high relative humidity degrades reliability sig-nificantly, having a much more substantial impact thantemperature or temperature variation. Thus, the design offree-cooled datacenters and their servers must considerthe relative humidity to which components are exposedas a first-class issue. Organizations that operate datacen-ters with different cooling technologies in multiple ge-ographies can select the conditions under which their ser-vices strike the right tradeoff between energy consump-tion, hardware reliability, cost, and quality of service.
Acknowledgements: We thank Darren Carroll, EoinDoherty, Matthew Faist, Inigo Goiri, John Hardy, XinLiu, Sunil Panghal, Ronan Murphy, Brandon Ruben-stein, and Steve Solomon for providing some of the datawe use in this paper. We are also indebted to AnnemarieCallahan, Matthew Faist, Dave Gauthier, Dawn Larsen,Bikash Sharma, Mark Shaw, Steve Solomon, KushagraVaid, and Di Wang for comments that helped improvethe paper significantly. Finally, we thank our shepherd,Daniel Peek, and the anonymous referees for their exten-sive comments and support.

USENIX Association 14th USENIX Conference on File and Storage Technologies (FAST ’16) 65
References[1] AHMAD, F., AND VIJAYKUMAR, T. Joint Optimization of Idle
and Cooling Power in Data Centers while Maintaining ResponseTime. In Proceedings of the 15th International Conference on Ar-chitectural Support for Programming Languages and OperatingSystems (2010).
[2] ALLEN, B. Monitoring Hard Disks with SMART. Linux Journal,117 (2004).
[3] ANUBHAV, K., AND YOGENDRA, J. Use of Airside Economizerfor Data Center Thermal Management. In Proceedings of the 2ndInternational Conference on Thermal Issues in Emerging Tech-nologies (2008).
[4] ASHRAE TECHNICAL COMMITTEE TC 9.9. 2011 ThermalGuidelines for Data Processing Environments – Expanded DataCenter Classes and Usage Guidance, 2011.
[5] BAIRAVASUNDARAM, L. N., GOODSON, G. R., PASUPATHY,S., AND SCHINDLER, J. An Analysis of Latent Sector Errorsin Disk Drives. ACM SIGMETRICS Performance Evaluation Re-view 35, 1 (2007).
[6] BANERJEE, A., MUKHERJEE, T., VARSAMOPOULOS, G., ANDGUPTA, S. Cooling-Aware and Thermal-Aware Workload Place-ment for Green HPC Data Centers. In Proceedings of the Inter-national Green Computing Conference (2010).
[7] BARROSO, L. A., CLIDARAS, J., AND HOLZLE, U. TheDatacenter as a Computer: An Introduction to the Design ofWarehouse-Scale Machines, second ed. 2013.
[8] BASH, C., PATEL, C., AND SHARMA, R. Dynamic ThermalManagement of Air Cooled Data Centers. In Proceedings of the10th IEEE Intersociety Conference on Thermal and Thermome-chanical Phenomena in Electronic Systems (2006).
[9] COLE, G. Estimating Drive Reliability in Desktop Computersand Consumer Electronics Systems. Seagate Technology Paper,TP-338.1 (2000).
[10] EL-SAYED, N., STEFANOVICI, I., AMVROSIADIS, G.,HWANG, A., AND SCHROEDER, B. Temperature Managementin Data Centers: Why Some (Might) Like it Hot. In Proceed-ings of the 12th International Conference on Measurement andModeling of Computer Systems (2012).
[11] EMERSON NETWORK POWER. Energy Efficient Cooling Solu-tions for Data Centers, 2007.
[12] ESCOBAR, L. A., AND MEEKER, W. Q. A Review of Acceler-ated Test Models. Statistical Science 21, 4 (2006).
[13] FACEBOOK. Prineville Data Center – PUE/WUE, 2014.
[14] GREENBERG, A., HAMILTON, J., MALTZ, D. A., AND PATEL,P. The Cost of a Cloud: Research Problems in Data Center Net-works. ACM SIGCOMM Computer Communication Review 39,1 (2008).
[15] GREENBERG, S., MILLS, E., TSCHUDI, B., RUMSEY, P., ANDMYATT, B. Best Practices for Data centers: Lessons Learnedfrom Benchmarking 22 Data Centers. In ACEEE Summer Studyon Energy Efficiency in Buildings (2006).
[16] KAISER, J., BEAN, J., HARVEY, T., PATTERSON, M., ANDWINIECKI, J. Survey Results: Data Center Economizer Use.White Paper (2011).
[17] KIM, J., RUGGIERO, M., AND ATIENZA, D. Free Cooling-Aware Dynamic Power Management for Green Datacenters.In Proceedings of the International Conference on High-Performance Computing and Simulation (2012).
[18] KOOMEY, J. Growth in Data Center Electricity Use 2005 to 2010,2011. Analytic Press.
[19] LIU, Z., CHEN, Y., BASH, C., WIERMAN, A., GMACH, D.,WANG, Z., MARWAH, M., AND HYSER, C. Renewable andCooling Aware Workload Management for Sustainable Data Cen-ters. In Proceedings of the 12th International Conference onMeasurement and Modeling of Computer Systems (2012).
[20] MA, A., DOUGLIS, F., LU, G., SAWYER, D., CHANDRA, S.,AND HSU, W. RAIDShield: Characterizing, Monitoring, andProactively Protecting Against Disk Failures. In Proceedings ofthe 13th USENIX Conference on File and Storage Technologies(2015).
[21] MOORE, J., CHASE, J., RANGANATHAN, P., AND SHARMA,R. Making Scheduling “Cool”: Temperature-Aware WorkloadPlacement in Data Centers. In Proceedings of the 2005 USENIXAnnual Technical Conference (2005).
[22] PATEL, C. D., SHARMA, R., BASH, C. E., AND BEITELMAL,A. Thermal Considerations in Cooling Large Scale High Com-pute Density Data Centers. In Proceedings of the 8th IntersocietyConference on Thermal and Thermomechanical Phenomena inElectronic Systems (2002).
[23] PATTERSON, M. K. The Effect of Data Center Temperature onEnergy Efficiency. In Proceedings of the 11th Intersociety Con-ference on Thermal and Thermomechanical Phenomena in Elec-tronic Systems (2008).
[24] PECK, D. S. Comprehensive Model for Humidity Testing Cor-relation. In Proceedings of the 24th Annual Reliability PhysicsSymposium (1986).
[25] PINHEIRO, E., WEBER, W.-D., AND BARROSO, L. A. Fail-ure Trends in a Large Disk Drive Population. In Proceedings ofthe 5th USENIX Conference on File and Storage Technologies(2007).
[26] RICE, D., PETERSON, P., RIGBY, E. B., PHIPPS, P., CAPPELL,R., AND TREMOUREUX, R. Atmospheric Corrosion of Copperand Silver. Journal of the Electrochemical Society 128, 2 (1981).
[27] SANKAR, S., SHAW, M., VAID, K., AND GURUMURTHI, S.Datacenter Scale Evaluation of the Impact of Temperature onHard Disk Drive Failures. ACM Transactions on Storage 9, 2(2013).
[28] SCHROEDER, B., AND GIBSON, G. A. Understanding Disk Fail-ure Rates: What Does an MTTF of 1,000,000 Hours Mean toYou? ACM Transactions on Storage 3, 3 (2007).
[29] SHAH, S., AND ELERATH, J. G. Reliability Analysis of DiskDrive Failure Mechanisms. In Proceedings of the Annual Sympo-sium on Reliability and Maintainability (2005).
[30] SRINIVASAN, J., ADVE, S. V., BOSE, P., AND RIVERS, J. A.The Case for Lifetime Reliability-Aware Microprocessors. InProceedings of the 41st Annual International Symposium onComputer Architecture (2004).
[31] THE GREEN GRID. Data Center Efficiency and IT Equip-ment Reliability at Wider Operating Temperature and HumidityRanges, 2012.
[32] TOLIA, N., WANG, Z., MARWAH, M., BASH, C., RAN-GANATHAN, P., AND ZHU, X. Delivering Energy Proportional-ity with Non-Energy-Proportional Systems – Optimizing the En-semble. In Proceedings of the HotPower Workshop (2008).
[33] TULLMIN, M., AND ROBERGE, P. R. Corrosion of MetallicMaterials. IEEE Transactions on Reliability 44, 2 (1995).
[34] UPTIME INSTITUTE. 2014 Data Center Industry Survey Results,2014.
[35] VISHWANATH, K. V., AND NAGAPPAN, N. CharacterizingCloud Computing Hardware Reliability. In Proceedings of the1st ACM Symposium on Cloud Computing (2010).