environmental effects of engineered nanomaterials · 2 environmental effects of engineered...
TRANSCRIPT
Environmental effects of engineered nanomaterials
Estimations of Predicted No-Effect Concentrations (PNECs) Environmental project No. 1787, 2015
2 Environmental effects of engineered nanomaterials
Title: Authors:
Environmental effects of engineered
nanomaterials
Environmental effects of engineered
nanomaterials
Authors:
Hans-Christian Holten Lützhøft1
Nanna B. Hartmann1
Anna Brinch2
Jesper Kjølholt2
Anders Baun1
1 DTU Environment 2 COWI A/S
Published by:
The Danish Environmental Protection Agency
Strandgade 29
1401 Copenhagen K
Denmark
www.mst.dk/english
Year:
2015
ISBN nr.
978-87-93352-70-4
Disclaimer:
When the occasion arises, the Danish Environmental Protection Agency will publish reports and papers concerning
research and development projects within the environmental sector, financed by study grants provided by the Danish
Environmental Protection Agency. It should be noted that such publications do not necessarily reflect the position or
opinion of the Danish Environmental Protection Agency.
However, publication does indicate that, in the opinion of the Danish Environmental Protection Agency, the content
represents an important contribution to the debate surrounding Danish environmental policy.
Sources must be acknowledged.
Environmental effects of engineered nanomaterials 3
Table of content
Preface ...................................................................................................................... 5
Executive summary ................................................................................................... 7
Dansk sammendrag ................................................................................................. 13
1. Introduction ..................................................................................................... 19 1.1 Background – Environmental Risk Assessment and PNEC values for
nanomaterials ....................................................................................................................... 19 1.2 Objective and scope ............................................................................................................. 20 1.3 Report structure .................................................................................................................... 21
2. Current approaches for estimation of PNEC values and data evaluation for
traditional chemicals ........................................................................................ 23 2.1 Predicted No-Effect Concentration in the risk assessment paradigm ............................... 23 2.2 The Assessment Factor approach........................................................................................ 24 2.3 The Species Sensitivity Distribution approach ................................................................... 25 2.4 Data selection for PNEC estimation – the Klimisch score ................................................. 26
3. Currently existing PNEC values for nanomaterials – literature values and
REACH registrations ........................................................................................ 27 3.1 PNEC Estimation Methodologies ........................................................................................ 27 3.2 Alternative approaches to PNEC estimation for ENMs ..................................................... 28 3.3 Predicted No Effect Concentrations in REACH registrations ............................................ 29
3.3.1 PNECs for the ionic form ...................................................................................... 30 3.3.2 PNECs for the bulk form ....................................................................................... 30 3.3.3 PNECs for the nano form ....................................................................................... 31
3.4 PNEC established in the scientific literature for ENMs ..................................................... 32 3.5 Comparison of value ranges ................................................................................................ 34
4. A concept for evaluation of ecotoxicological data for ENMs ............................... 36 4.1 Guideline versus non-guideline test methodologies ...........................................................37 4.2 Evaluating the adequacy of ecotoxicity studies for ENMs ..................................................37
4.2.1 Step 1: Reliability evaluation – documentation of experimental
conditions and nanomaterial properties .............................................................. 38 4.2.2 Step 2: Relevance evaluation – applicability of data and test method ............... 42 4.2.3 Step 3: Adequacy – combining reliability and relevance .................................... 43
4.3 Recommendations and limitations for PNEC estimation for ENMs ................................. 44
5. PNEC estimations for selected NMs .................................................................. 45 5.1 Method for PNEC estimations for the selected ENMs and implications thereof .............. 45 5.2 Literature search strategy .................................................................................................... 46 5.3 PNEC estimation for TiO2 NPs ............................................................................................ 47
5.3.1 Overview and selection of key data based on a focused literature review .......... 47 5.3.2 PNEC for TiO2 nanoparticles ................................................................................ 48 5.3.3 Knowledge gaps and uncertainties ....................................................................... 48
5.4 PNEC estimation for ZnO NPs ............................................................................................ 49 5.4.1 Overview and selection of key data based on a focused literature review .......... 49
4 Environmental effects of engineered nanomaterials
5.4.2 PNEC for ZnO nanoparticles ................................................................................ 50 5.4.3 Knowledge gaps and uncertainties ........................................................................ 51
5.5 PNEC estimation for Ag NPs ................................................................................................ 51 5.5.1 Overview and selection of key data based on a focused literature review ........... 51 5.5.2 PNEC estimation for Ag nanoparticles ................................................................ 53 5.5.3 Knowledge gaps and uncertainties ....................................................................... 53
5.6 PNEC estimation for Carbon Nanotubes (CNTs) ............................................................... 54 5.6.1 Overview and selection of key data based on a focused literature review .......... 54 5.6.2 PNEC for CNT ........................................................................................................55 5.6.3 Knowledge gaps and uncertainties ........................................................................55
5.7 PNEC estimation for CuO NPs ............................................................................................ 56 5.7.1 Overview and selection of key data based on a focused literature review .......... 56 5.7.2 PNEC for CuO nanoparticles ................................................................................. 57 5.7.3 Knowledge gaps and uncertainties ........................................................................ 57
5.8 PNEC estimation for nano Zero Valent Iron (nZVI) .......................................................... 58 5.8.1 Overview and selection of key data based on a focused literature review .......... 58 5.8.2 PNEC for nZVI ...................................................................................................... 59 5.8.3 Knowledge gaps and uncertainties ....................................................................... 60
5.9 PNEC estimation for CeO2 NPs ............................................................................................ 61 5.9.1 Overview and selection of key data based on a focused literature review ........... 61 5.9.2 PNEC for CeO2 nanoparticles ............................................................................... 62 5.9.3 Knowledge gaps and uncertainties ....................................................................... 63
5.10 PNEC estimation for Quantum Dots (QDs) ........................................................................ 63 5.10.1 Overview and selection of key data based on a focused literature review .......... 63 5.10.2 PNEC for Quantum Dots ...................................................................................... 64 5.10.3 Knowledge gaps and uncertainties ....................................................................... 65
5.11 PNEC estimation for Carbon Black (CB) ............................................................................ 65 5.11.1 Overview and selection of key data based on a focused literature review .......... 65 5.11.2 PNEC for CB .......................................................................................................... 66 5.11.3 Knowledge gaps and uncertainties ....................................................................... 66
5.12 Overview of derived PNEC values for the selected ENMs.................................................. 67
6. Discussion ........................................................................................................ 68 6.1 PNEC estimates and comparison with literature values .................................................... 68 6.2 Validity of current approaches for PNEC estimation to NMs ............................................ 70
6.2.1 Nanomaterial and experimental issues ................................................................ 70 6.2.2 Biological issues .................................................................................................... 72 6.2.3 Risk assessment issues.......................................................................................... 72
6.3 Implications of the identified gaps for ENM Safety Assessment ........................................73
7. Conclusion ....................................................................................................... 76
8. References ....................................................................................................... 78
Environmental effects of engineered nanomaterials 5
Preface
This summary and assessment report on new knowledge concerning the processes governing environmental fate and
behaviour of engineered nanomaterials (ENMs) is the first in a series of reports from the project “Nanomaterials –
Occurrence and effects in the Danish Environment” (“NanoDEN”). The project was commissioned by the Danish EPA in
December 2012 and runs until mid-2015 and is one among a number of projects funded by the Danish EPA on
nanomaterials aiming to increase the knowledge and understanding regarding occurrence of ENMs in Denmark and the
risks posed by these to humans and the environment.
The NanoDEN project will upon its completion in 2015 have produced the following main reports addressing 10 selected
engineered nanomaterials:
Report 1: The current report on new knowledge about the fate and behaviour of nanomaterials in the
environment;
Report 2: A report on sources to nanomaterials in the Danish environment;
Report 3: A report on environmental dispersion and fate modelling and subsequent assessment of the exposure
of the Danish environment to nanomaterials;
Report 4: A report on environmental effects of nanomaterials;
Report 5: A final report summarising the main results and conclusions from the preceding reports and
presenting the overall environmental risk assessment for the selected ENMs under Danish conditions.
The NanoDEN project is carried out by a project team with participation of COWI A/S (lead partner) (project leader:
Jesper Kjølholt), the Technical University of Denmark (DTU Environment) (project leader: Anders Baun) and the Swiss
Nano Modelling Consortium (SNMC) (project leader: Fadri Gottschalk). DTU is the lead institution for Sub-project 1 and
this report.
A Steering Committee with the following participants was established for the NanoDEN project:
Flemming Ingerslev, Danish EPA (Chairman and project responsible)
Katrine Bom, Danish EPA
Jørgen Larsen, Danish EPA
Jesper Kjølholt, COWI (project manager)
Anders Baun, DTU
Fadri Gottschalk/Bernd Nowack, SNMC.
(DEPA to confirm or revise the list)
This report is part of the project “Nanomaterials – Occurrence and effects in the Danish
Environment” (“NanoDEN”). NanoDEN was commissioned by the Danish EPA in December 2012
and runs until mid-2015 and is one among a number of projects funded by the Danish EPA on
nanomaterials aiming to increase the knowledge and understanding regarding occurrence of
engineered nanomaterials in Denmark and the risks posed by these to humans and the
environment.
The NanoDEN project is part of the initiative of the Danish government and the Red-Green Alliance
(a.k.a. Enhedslisten) called “Bedre styr på nanomaterialer” (Better control of nanomaterials) for
2012-2015 that focuses on the use of nanomaterials in products on the Danish market and their
consequences for consumers and the environment.
The NanoDEN project is carried out by a project team with participation of COWI A/S (lead
partner) (project leader: Jesper Kjølholt), the Technical University of Denmark (DTU Environment)
(project leader: Anders Baun) and the Swiss Nano Modelling Consortium (SNMC) (project leader:
Fadri Gottschalk).
DTU Environment is the lead institution for this report. The contributors to the report are Hans-
Christian Holten Lützhøft, Nanna B. Hartmann and Anders Baun (DTU Environment), and Anna
Brinch and Jesper Kjølholt (COWI A/S).
The authors would like to acknowledge Aiga Mackevica, Sara Nørgaard Sørensen, Lars Michael
Skjolding and Rune Hjorth (DTU Environment) for their review of certain parts of Chapter 5.
A Steering Committee with the following participants was established for the NanoDEN project:
- Flemming Ingerslev, Danish EPA (Chairman and project responsible)
- Katrine Bom, Danish EPA
- Jørgen Larsen, Danish EPA
- Jesper Kjølholt, COWI A/S (project manager)
- Anders Baun, DTU Environment
- Fadri Gottschalk/Bernd Nowack, SNMC.

6 Environmental effects of engineered nanomaterials
Environmental effects of engineered nanomaterials 7
Executive summary
Background and Objective
The Danish EPA has under the Agreement "Better Control of Nanomaterials" (“Bedre styr på
nanomaterialer”) launched a number of projects aiming at investigating and generating new
knowledge on the presence of nanomaterials in products on the Danish market and assess the
possible associated risks to consumers and the environment. One of the projects, NanoDEN, has the
overall objective of assessing whether engineered nanomaterials (ENMs) give reason for concern in
the Danish environment.
The current report covers subproject 5 of the NanoDEN project, which has the purpose of providing
data on environmental effects of nine selected engineered nanomaterials (ENMs) in the form of
Predicted No-effect Concentration (PNEC) values. Together with the subprojects on environmental
fate modelling and exposure assessment, the results of this report will eventually feed into the
concluding environmental risk assessment of the selected ENMs (subproject 6).
Selection of nanomaterials
In the context of this report ENMs are defined as manufactured materials with one or more external
dimensions between 1 and 100 nm. In that respect ENMs is a part of a broader group of
nanomaterials, which can result from natural, anthropogenic (incidental) and engineered
(intentional) processes, however the NanoDEN project focuses on ENMs, as this is the most
relevant group of nanomaterials from an up-stream regulatory point of view. The following
materials have been selected for this project:
- Titanium Dioxide (TiO2) (rutile and anatase)
- Zinc Oxide (ZnO)
- Silver (Ag)
- Carbon Nanotubes (CNTs)
- Copper Oxide (CuO)
- Nano Zero Valent Iron (nZVI)
- Cerium Dioxide (CeO2)
- Quantum Dots (QDs)
- Carbon Black (CB)
The selection was based on expected production and use volumes in Denmark and their
applications in relevant consumer products, industrial processes, and environmental remediation
processes. In the NanoDEN project, CuCO3 nanoparticles are included as case study material for
copper-containing nanoparticles. However, in this report CuCO3 has been replaced by CuO
nanoparticles because CuO nanoparticles have been studied to some extent in ecotoxicity studies
whereas studies for CuCO3 are lacking. For copper-containing ENMs it has been found that the
release of copper ions is of great importance in relation to the ecotoxicity of this metal and this is
assumed to be a common feature of for both CuCO3 and CuO.
Key findings
- Investigations have shown that currently accepted PNEC estimation approaches within the
present European legislation (e.g. the legislation on chemicals, REACH) in principle can be
used for nanomaterials as well. This concerns the assessment factor (AF) and species
sensitivity distribution (SSD) approaches. These methods do, however, not take nano-
8 Environmental effects of engineered nanomaterials
specific processes (such as aggregation) during the testing of nanomaterials into account and
the tests may therefore not always be representative for natural conditions. Through a
literature review carried out within the current project, three other methods were suggested:
the probabilistic species sensitivity distribution (PSSD), the dissolved metal ion and the
indicative no effect concentration (INEC).
- It was found that the current approach to select data for PNEC estimation favours effect
studies conducted according to Good Laboratory Practice (GLP) and accepted guidelines. A
consequence is that effect studies conducted according to guidelines for soluble chemicals
may be unreliable as they do not take into account the specific nature of ENMs.
- Within the current project, an approach was therefore developed for transparent evaluation
of the suitability of effect studies to test ENMs and thereby to what extent they are adequate
for risk assessment. The approach has focused on nano-specific parameters and highlights
knowledge gaps and limitations in relation to data availability and relevance.
- More than 1.200 scientific papers on effect studies of ENMs were found in the open
literature. 500 of these revealed data on effects that potentially could be used for PNEC
derivation. 50% of these studies used daphnia as the test organism, 30% used fish and 20%
used algae. Hardly any chronic studies were performed with fish. Nevertheless, no single
study obtained the best score for risk assessment adequacy.
- The number of sufficient effect studies adequate for risk assessment was, despite the large
number of effect studies found, so low that PNEC estimation only could be made according
to the AF approach.
- Using the available data silver nanoparticles were found to be the most toxic ENM (PNEC =
12 ng/L), while TiO2 was found to be the least toxic (PNEC = 18 µg/L). Due to a lack of
adequate data it was not possible to derive PNEC values for carbon black and quantum dots.
- The derived PNEC values in this report were generally on the same level or slightly lower
than the PNEC values found in the open literature or in REACH registrations. Compared
with ion and bulk PNEC values in REACH registrations, the derived nano PNEC values in
this report were in same order of magnitude (silver) or one order of magnitude lower
(titanium dioxide, zinc oxide and copper oxide).
On the following pages, the above mentioned key findings will be elaborated.
PNEC methodologies and applicability to ENMs
Two approaches for determining PNEC values for conventional soluble chemicals are recommended
by REACH, namely: 1) the assessment factor (AF) approach and 2) the deterministic approach
using species sensitivity distributions (SSDs) (ECHA, 2008). Both approaches use AFs (10-1,000
and 1-5, respectively) to cover uncertainties in the extrapolation, e.g. laboratory data to field impact.
These approaches are in principle found to be applicable to ENMs as well in the REACH
Implementation Project on Nanomaterials (Aitken, Bassan et al. 2011).
In the open literature another three approaches were found as alternatives for PNEC estimation of
ENMs. The simplest is the Indicative No Effect Value (INEC), which, as the name says, is a value
that is only indicative of the no-effect level. A more conservative approach applies the PNEC for the
dissolved metal ion divided by a factor of two in order to take into account any nano-specific effects,
without at all addressing these effects. In the cases with sufficient data, the currently applied
methods will be more suitable. Closely related to the SSD is the probability species sensitivity
distribution (PSSD), which considers both acute and chronic ECX and NOEC data. AFs are used to
Environmental effects of engineered nanomaterials 9
produce long-term NOECs with the aim of performing the probability modelling. It was in fact
found that the PSSD approach resulted in PNEC values in the same order of magnitude and within a
factor of 4 (titanium dioxide, zinc oxide, silver, copper oxide and cerium dioxide), as PNEC values
derived in accordance with the AF approach. Only the PNEC value for CNTs showed to be to orders
of magnitude larger by applying the PSSD approach compared with the AF approach. For all
methods solid underlying effect data are required to produce a reliable PNEC. However, for the
PSSD method this is most likely more pronounced, because the current effect data in the literature
are seriously influenced by studies not suited for ENMs (see later), as all available effect data are
included in the modelling. At present the AF approach is the most widely used and for the time
being, there are no nano-specific arguments that this approach should not work, except for the fact
that ENMs agglomerate having serious impact on factors like dilution, i.e. application of AFs.
Application of a large AF may potentially bring a NOEC into a concentration level where the
agglomeration is less pronounced leaving more of the active nanoparticle in its free state.
It is, however, of utmost importance to emphasize that the validity of the assumption, that PNEC
values for ENMs can be estimated as though they were dissolved chemicals, has not been
addressed. Given the range of nano-specific concerns listed in this report, it is at present not
possible to claim that the use of the current approaches ensure that organisms will be protected at
concentrations below the derived PNEC. In other words, specific circumstances related to ENMs,
which differ from conventional soluble chemicals, could likely affect the validity of the approach for
deriving PNEC values in an unpredictable manner.
Data selection for PNEC estimation
In order to derive PNEC values according to the approaches currently recommended by the
European Chemicals Agency (ECHA), the regulatory relevance and reliability of a study needs to be
evaluated. In the ECHA guidance document (ECHA 2011) it is recommended that the risk
assessment adequacies are assessed according to the Klimisch score where studies conducted
according to GLP and accepted guidelines are preferred. At present there are no guidelines for effect
studies of ENMs. This often results in that ENMs are tested according to guidelines for conventional
soluble chemicals, which can lead to imprecise test results. It has therefore also been suggested that
other endpoints and/or test organisms may be more relevant. Seen in this light, data generated by
non-standard tests, but with emphasis on particular ENMs, could improve the scientific basis of risk
assessment. However, it is acknowledged that some criteria for data quality and comparability are
needed.
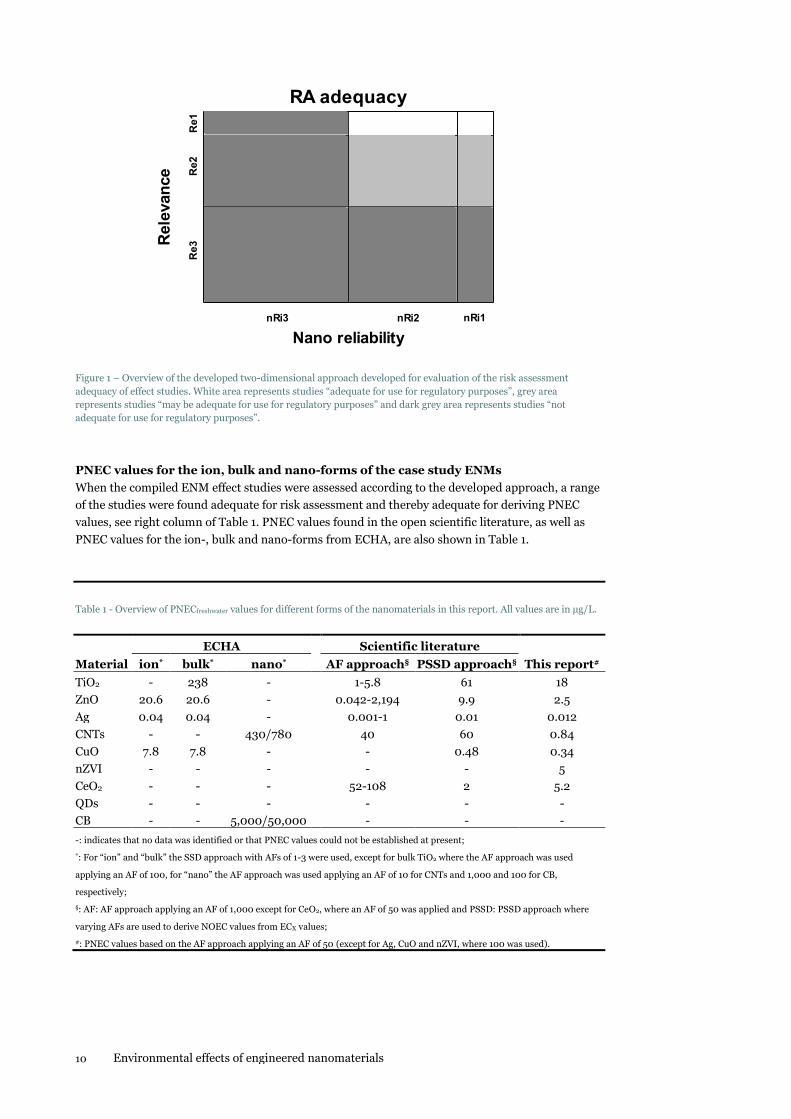
For the purpose of this work, a scoring system was developed for assessing the regulatory adequacy
of ecotoxicological studies of ENMs for PNEC estimation. The system assesses the effect studies in
two dimensions, so that both reliability and relevance are assessed. The study reliability is assessed
according to a list with 21 criteria focusing on the characterisation and exposure assessment of the
ENM and the relevance is assessed according to a list with 13 criteria. For both dimensions, each
criterion is assessed on a scale from 0-3 and each criterion is assigned a weight from 1-3 (see Figure
1). Effect studies assessed within the white or grey area of the graph were included in the PNEC
determination, whereas effect studies within the dark grey area were not included in the PNEC
determination.
10 Environmental effects of engineered nanomaterials
RA adequacy
20
30
40
50
60
70
80
90
100
Re1
Re2
Re3
nRi1nRi2nRi3
Nano reliability
Rele
van
ce
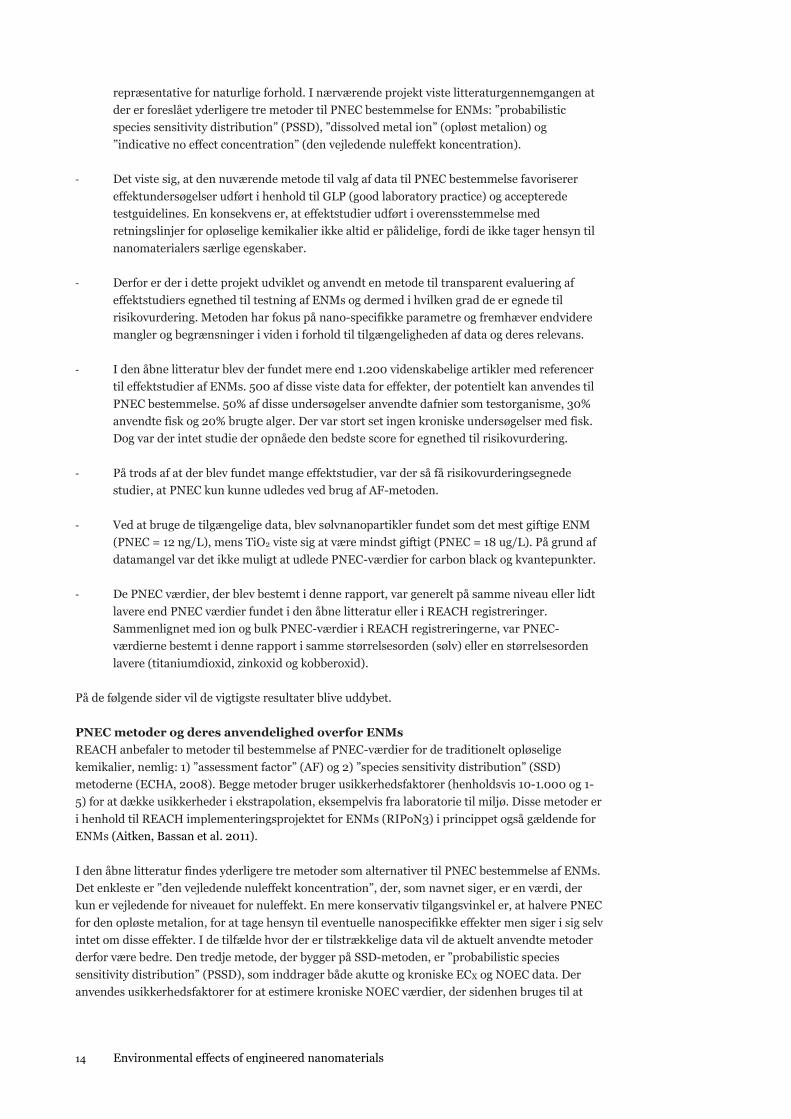
Figure 1 – Overview of the developed two-dimensional approach developed for evaluation of the risk assessment
adequacy of effect studies. White area represents studies “adequate for use for regulatory purposes”, grey area
represents studies “may be adequate for use for regulatory purposes” and dark grey area represents studies “not
adequate for use for regulatory purposes”.
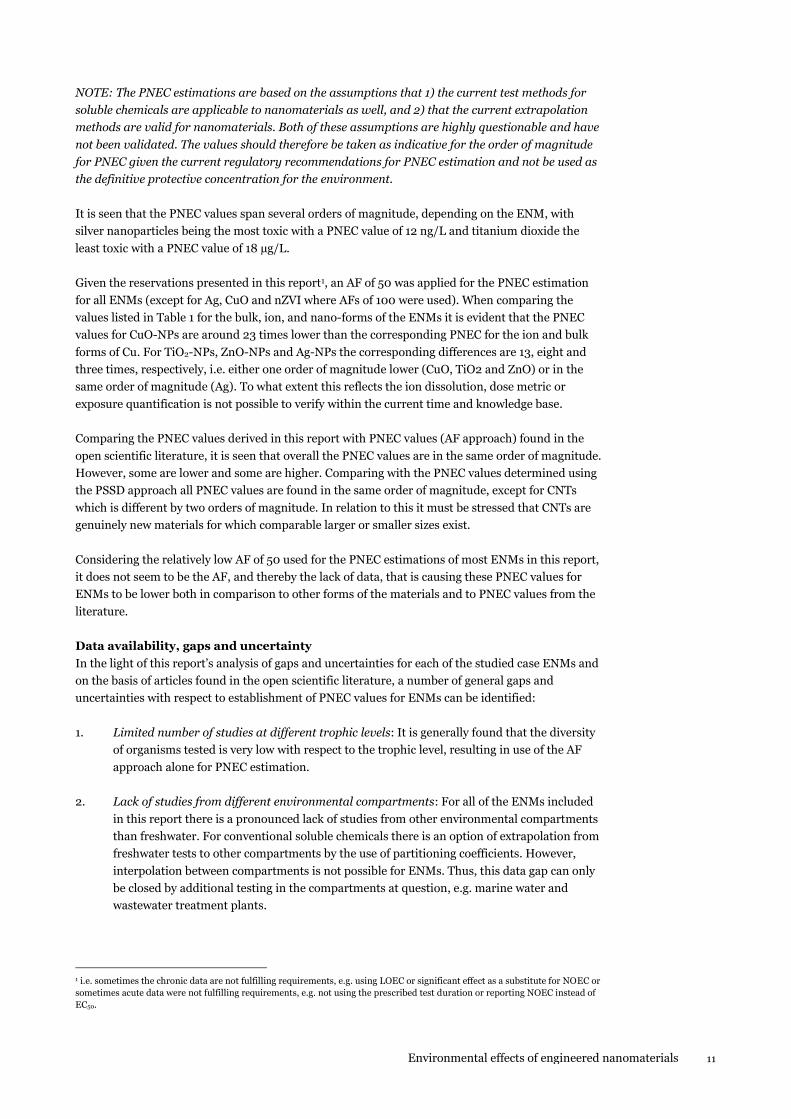
PNEC values for the ion, bulk and nano-forms of the case study ENMs
When the compiled ENM effect studies were assessed according to the developed approach, a range
of the studies were found adequate for risk assessment and thereby adequate for deriving PNEC
values, see right column of Table 1. PNEC values found in the open scientific literature, as well as
PNEC values for the ion-, bulk and nano-forms from ECHA, are also shown in Table 1.
Table 1 - Overview of PNECfreshwater values for different forms of the nanomaterials in this report. All values are in µg/L.
ECHA Scientific literature
Material ion* bulk* nano* AF approach§ PSSD approach§ This report#
TiO2 - 238 - 1-5.8 61 18
ZnO 20.6 20.6 - 0.042-2,194 9.9 2.5
Ag 0.04 0.04 - 0.001-1 0.01 0.012
CNTs - - 430/780 40 60 0.84
CuO 7.8 7.8 - - 0.48 0.34
nZVI - - - - - 5
CeO2 - - - 52-108 2 5.2
QDs - - - - - -
CB - - 5,000/50,000 - - -
-: indicates that no data was identified or that PNEC values could not be established at present;
*: For “ion” and “bulk” the SSD approach with AFs of 1-3 were used, except for bulk TiO2 where the AF approach was used
applying an AF of 100, for “nano” the AF approach was used applying an AF of 10 for CNTs and 1,000 and 100 for CB,
respectively;
§: AF: AF approach applying an AF of 1,000 except for CeO2, where an AF of 50 was applied and PSSD: PSSD approach where
varying AFs are used to derive NOEC values from ECX values;
#: PNEC values based on the AF approach applying an AF of 50 (except for Ag, CuO and nZVI, where 100 was used).
Environmental effects of engineered nanomaterials 11
NOTE: The PNEC estimations are based on the assumptions that 1) the current test methods for
soluble chemicals are applicable to nanomaterials as well, and 2) that the current extrapolation
methods are valid for nanomaterials. Both of these assumptions are highly questionable and have
not been validated. The values should therefore be taken as indicative for the order of magnitude
for PNEC given the current regulatory recommendations for PNEC estimation and not be used as
the definitive protective concentration for the environment.
It is seen that the PNEC values span several orders of magnitude, depending on the ENM, with
silver nanoparticles being the most toxic with a PNEC value of 12 ng/L and titanium dioxide the
least toxic with a PNEC value of 18 µg/L.
Given the reservations presented in this report1, an AF of 50 was applied for the PNEC estimation
for all ENMs (except for Ag, CuO and nZVI where AFs of 100 were used). When comparing the
values listed in Table 1 for the bulk, ion, and nano-forms of the ENMs it is evident that the PNEC
values for CuO-NPs are around 23 times lower than the corresponding PNEC for the ion and bulk
forms of Cu. For TiO2-NPs, ZnO-NPs and Ag-NPs the corresponding differences are 13, eight and
three times, respectively, i.e. either one order of magnitude lower (CuO, TiO2 and ZnO) or in the
same order of magnitude (Ag). To what extent this reflects the ion dissolution, dose metric or
exposure quantification is not possible to verify within the current time and knowledge base.
Comparing the PNEC values derived in this report with PNEC values (AF approach) found in the
open scientific literature, it is seen that overall the PNEC values are in the same order of magnitude.
However, some are lower and some are higher. Comparing with the PNEC values determined using
the PSSD approach all PNEC values are found in the same order of magnitude, except for CNTs
which is different by two orders of magnitude. In relation to this it must be stressed that CNTs are
genuinely new materials for which comparable larger or smaller sizes exist.
Considering the relatively low AF of 50 used for the PNEC estimations of most ENMs in this report,
it does not seem to be the AF, and thereby the lack of data, that is causing these PNEC values for
ENMs to be lower both in comparison to other forms of the materials and to PNEC values from the
literature.
Data availability, gaps and uncertainty
In the light of this report’s analysis of gaps and uncertainties for each of the studied case ENMs and
on the basis of articles found in the open scientific literature, a number of general gaps and
uncertainties with respect to establishment of PNEC values for ENMs can be identified:
1. Limited number of studies at different trophic levels: It is generally found that the diversity
of organisms tested is very low with respect to the trophic level, resulting in use of the AF
approach alone for PNEC estimation.
2. Lack of studies from different environmental compartments: For all of the ENMs included
in this report there is a pronounced lack of studies from other environmental compartments
than freshwater. For conventional soluble chemicals there is an option of extrapolation from
freshwater tests to other compartments by the use of partitioning coefficients. However,
interpolation between compartments is not possible for ENMs. Thus, this data gap can only
be closed by additional testing in the compartments at question, e.g. marine water and
wastewater treatment plants.
1 i.e. sometimes the chronic data are not fulfilling requirements, e.g. using LOEC or significant effect as a substitute for NOEC or
sometimes acute data were not fulfilling requirements, e.g. not using the prescribed test duration or reporting NOEC instead of
EC50.
12 Environmental effects of engineered nanomaterials
3. Most studies focused on acute toxicity: It was revealed from literature that the vast majority
of ecotoxicity data are short-term tests. For the ENMs for which it was possible to establish a
PNEC value, results from chronic tests were typically available from only two studies at two
different trophic levels, i.e. algae and daphnia, resulting in the use of 50 as the AF. To obtain
less uncertainty in the determination of PNEC in chemical safety assessment more studies
focussed at chronic endpoints are needed.
4. Most studies focused on zooplankton: In association with the previous point, the far
majority of effect studies were focused on testing daphnia (50%) in comparison to algae
(20%) and fish (30%). Hardly any chronic fish studies were performed, possibly due to the
high expenses and ethical considerations associated with fish studies.
5. Testing of high ENM concentrations: Often high and environmentally unrealistic
concentrations are used in standardized ecotoxicity tests influencing the ENM behaviour and
bioavailability. This may lead to either false-negative or false-positive results, which may
influence the validity of the PNEC estimation.
The quality of published data is crucial for the process of risk assessment. This is true for both
conventional and alternative approaches to PNEC estimation and risk characterisation. As shown
through the literature review in this report there are challenges and obvious problems regarding the
current framework for deriving PNEC values: 1) that effect studies are based on guidelines
developed for soluble chemicals and therefore not suitable for nanomaterials and 2) that effect
studies are assessed for their risk assessment adequacy according to the Klimisch score, which by
nature favours studies conducted according to GLP and in accordance with current guidelines.
Regarding the estimation of PNEC values for nanomaterials the primary problem is that most of the
available effect data are not reliable and there is as such a lack of valid data adequate for risk
assessment. When effect studies are conducted according to currently accepted international
(modified) guidelines developed for soluble chemicals, the inherent properties of the tested ENM
will often be reason for varying exposure conditions during the ecotoxicological testing. This may in
the end result in misleading test results.
This report’s specific recommendation is therefore that PNEC estimations of nanomaterials are
conducted after the effect studies have been assessed for their risk assessment adequacies according
to the transparent and reproducible approach developed, documented and applied in this report.
Environmental effects of engineered nanomaterials 13
Dansk sammendrag
Baggrund og mål
Den danske Miljøstyrelse har som led i udmøntningen af aftalen "Bedre styr på nanomaterialer"
igangsat en række projekter, der sigter mod at undersøge og skabe ny viden om tilstedeværelsen af
nanomaterialer i produkter på det danske marked og vurdere eventuelle risici i forhold til
forbrugerne og miljøet. Et af projekterne, NanoDEN, har det overordnede formål at vurdere, om
industrielt fremstillede nanomaterialer (ENMs) giver grund til bekymring i det danske miljø.
Nærværende rapport beskriver delprojekt 5 i NanoDEN projektet der har til formål at levere data
for miljøeffekter af ni udvalgte ENMs i form af Predicted No-Effect Concentration (PNEC) værdier.
Dette vil, sammen med delprojekterne om modellering af skæbne og eksponering i miljøet, i den
sidste ende indgå i den efterfølgende miljørisikovurderingen af de valgte ENMs (delprojekt 6).
Udvælgelse af nanomaterialer
I forbindelse med denne rapport defineres ENMs som materialer fremstillet med en eller flere
eksterne dimensioner på mellem 1 og 100 nm. I den henseende er ENMs en del af en bredere
gruppe af nanomaterialer, der kan forårsages af naturlige, menneskeskabte (tilfældige) og
forarbejdede (forsætlige) processer, men NanoDEN projektet har fokus på ENMs, da dette er den
mest relevante gruppe af nanomaterialer fra et opstrøms lovgivningsmæssigt synspunkt. Følgende
materialer er valgt til dette projekt:
- Sølv (Ag)
- Titaniumdioxid (TiO2) (rutil og anatase)
- Zinkoxid (ZnO)
- Kulstofnanorør (CNTs)
- Kobberoxide (CuO)
- Nanojern i oxidationstrin nul (nZVI)
- Ceriumdioxid (CeO2)
- Carbon black (CB)
- Kvantepunkter (QDs)
Udvælgelsen af disse nanomaterialer er baseret på forventning om høje produktions- og
anvendelsesmængder i Danmark samt på forventning om anvendelser i relevante
forbrugerprodukter, industrielle processer og miljøteknisk remediering. I NanoDEN projektet
indgår CuCO3 nanopartikler som casemateriale for kobberholdige nanopartikler. I denne rapport er
CuCO3 dog blevet erstattet af CuO nanopartikler på grund af, at CuO nanopartikler i langt større
grad er undersøgt for dets økotoksiske effekter, hvorimod undersøgelser for CuCO3 mangler. For
kobberholdige ENMs er frigivelsen af kobberioner fundet at være af stor betydning for
økotoksiciteten af dette metal, og dette formodes at gælde for såvel CuCO3 som for CuO.
De vigtigste resultater
- Undersøgelser har vist, at de aktuelt accepterede metoder til estimering af PNEC i den
nuværende EU-regulering (bl.a. kemikaliereguleringen, REACH) i princippet også kan
bruges til nanomaterialer. Det drejer sig om ”assessment factor” (AF) og ”species sensitivity
distribution” (SSD) metoderne. Imidlertid tager metoderne ikke direkte hensyn til nano-
specifikke processer (eksempelvis agglomerering) under testning og er således ikke altid
14 Environmental effects of engineered nanomaterials
repræsentative for naturlige forhold. I nærværende projekt viste litteraturgennemgangen at
der er foreslået yderligere tre metoder til PNEC bestemmelse for ENMs: ”probabilistic
species sensitivity distribution” (PSSD), ”dissolved metal ion” (opløst metalion) og
”indicative no effect concentration” (den vejledende nuleffekt koncentration).
- Det viste sig, at den nuværende metode til valg af data til PNEC bestemmelse favoriserer
effektundersøgelser udført i henhold til GLP (good laboratory practice) og accepterede
testguidelines. En konsekvens er, at effektstudier udført i overensstemmelse med
retningslinjer for opløselige kemikalier ikke altid er pålidelige, fordi de ikke tager hensyn til
nanomaterialers særlige egenskaber.
- Derfor er der i dette projekt udviklet og anvendt en metode til transparent evaluering af
effektstudiers egnethed til testning af ENMs og dermed i hvilken grad de er egnede til
risikovurdering. Metoden har fokus på nano-specifikke parametre og fremhæver endvidere
mangler og begrænsninger i viden i forhold til tilgængeligheden af data og deres relevans.
- I den åbne litteratur blev der fundet mere end 1.200 videnskabelige artikler med referencer
til effektstudier af ENMs. 500 af disse viste data for effekter, der potentielt kan anvendes til
PNEC bestemmelse. 50% af disse undersøgelser anvendte dafnier som testorganisme, 30%
anvendte fisk og 20% brugte alger. Der var stort set ingen kroniske undersøgelser med fisk.
Dog var der intet studie der opnåede den bedste score for egnethed til risikovurdering.
- På trods af at der blev fundet mange effektstudier, var der så få risikovurderingsegnede
studier, at PNEC kun kunne udledes ved brug af AF-metoden.
- Ved at bruge de tilgængelige data, blev sølvnanopartikler fundet som det mest giftige ENM
(PNEC = 12 ng/L), mens TiO2 viste sig at være mindst giftigt (PNEC = 18 ug/L). På grund af
datamangel var det ikke muligt at udlede PNEC-værdier for carbon black og kvantepunkter.
- De PNEC værdier, der blev bestemt i denne rapport, var generelt på samme niveau eller lidt
lavere end PNEC værdier fundet i den åbne litteratur eller i REACH registreringer.
Sammenlignet med ion og bulk PNEC-værdier i REACH registreringerne, var PNEC-
værdierne bestemt i denne rapport i samme størrelsesorden (sølv) eller en størrelsesorden
lavere (titaniumdioxid, zinkoxid og kobberoxid).
På de følgende sider vil de vigtigste resultater blive uddybet.
PNEC metoder og deres anvendelighed overfor ENMs
REACH anbefaler to metoder til bestemmelse af PNEC-værdier for de traditionelt opløselige
kemikalier, nemlig: 1) ”assessment factor” (AF) og 2) ”species sensitivity distribution” (SSD)
metoderne (ECHA, 2008). Begge metoder bruger usikkerhedsfaktorer (henholdsvis 10-1.000 og 1-
5) for at dække usikkerheder i ekstrapolation, eksempelvis fra laboratorie til miljø. Disse metoder er
i henhold til REACH implementeringsprojektet for ENMs (RIPoN3) i princippet også gældende for
ENMs (Aitken, Bassan et al. 2011).
I den åbne litteratur findes yderligere tre metoder som alternativer til PNEC bestemmelse af ENMs.
Det enkleste er ”den vejledende nuleffekt koncentration”, der, som navnet siger, er en værdi, der
kun er vejledende for niveauet for nuleffekt. En mere konservativ tilgangsvinkel er, at halvere PNEC
for den opløste metalion, for at tage hensyn til eventuelle nanospecifikke effekter men siger i sig selv
intet om disse effekter. I de tilfælde hvor der er tilstrækkelige data vil de aktuelt anvendte metoder
derfor være bedre. Den tredje metode, der bygger på SSD-metoden, er ”probabilistic species
sensitivity distribution” (PSSD), som inddrager både akutte og kroniske ECX og NOEC data. Der
anvendes usikkerhedsfaktorer for at estimere kroniske NOEC værdier, der sidenhen bruges til at
Environmental effects of engineered nanomaterials 15
udføre en sandsynlighedsmodellering. PSSD-metoden, på den anden side, viste sig rent faktisk at
give PNEC-værdier i samme størrelsesorden og inden for en faktor 4 (titaniumdioxid, zinkoxid,
sølv, kobberoxid og ceriumdioxid), som PNEC-værdier udledt i henhold til AF-metoden. Kun PNEC
for kulstofnanorør viste sig at være to størrelsesordener større ved brug af PSSD i forhold til AF-
metoden. For alle metoderne er det under alle omstændigheder nødvendigt med valide
underliggende effektdata, for at kunne beregne en pålidelig PNEC. Dog er det for PSSD metoden
endnu mere nødvendigt, da de aktuelle effektdata i litteraturen er alvorligt påvirket af brugen af
testmetoder, der ikke egner sig til test af ENMs (se senere), idet alle tilgængelige data inddrages i
modelleringen. På nuværende tidspunkt er AF-metoden den mest udbredte og indtil videre er der
ingen nano-specifikke argumenter for, at denne fremgangsmåde ikke bør anvendes. Dette såfremt
der ses bort fra at ENMs agglomererer, og at det har alvorlige konsekvenser for faktorer som
fortynding, dvs. anvendelse af usikkerhedsfaktorer. Ved anvendelsen af en høj usikkerhedsfaktor
kan NOEC potentielt bringes ned i et koncentrationsniveau, hvor agglomereringen er mindre udtalt
og dermed vil efterlade flere af de aktive nanopartikler i fri tilstand.
Det skal dog understreges, at det endnu ikke er undersøgt om det er gyldigt at antage at PNEC-
værdier for ENMs kan bestemmes med samme principper som for opløste kemikalier. I
betragtning af den række af nano-specifikke problemer, der er anført i denne rapport, kan det i
skrivende stund ikke hævdes, at de nuværende metoder sikrer beskyttelse af miljøet ved
koncentrationer under den beregnede PNEC. Der er med andre ord, særlige omstændigheder for
ENMs, der adskiller sig så betydeligt fra traditionelle opløselige kemikalier, at der er usikkerhed om
gyldigheden af de eksisterende metoder til PNEC bestemmelse.
Valg af data til PNEC estimering
For at kunne bestemme PNEC i henhold til de metoder der i øjeblikket er anbefalet af EU’s
kemikalieagentur (ECHA), skal effektstudiets pålidelighed og relevans evalueres. I vejledningen fra
ECHA (ECHA 2011) anbefales det at effektstudiernes risikovurderingsegnethed evalueres i henhold
til Klimischskalaen, der lægger vægt på studier udført efter GLP og anerkendte guidelines. I
øjeblikket mangler der retningslinjer for effektstudier af ENMs, hvilket resulterer i, at effektstudier
for ENMs ofte testes i henhold til retningslinjer for opløselige kemikalier. Dette kan føre til
unøjagtige testresultater. Det er derfor også blevet foreslået, at andre end-points og/eller
testorganismer kan være mere relevante. Set i det lys, kan data genereret af ikke-standardiserede
tests, men med fokus på det enkelte ENM, forbedre det videnskabelige grundlag for
risikovurdering. Dog er visse kriterier for datakvalitet og sammenlignelighed en nødvendighed.
Med henblik på dette arbejde blev et pointsystem udviklet til at evaluere ENM effektstudiers
risikovurderingsmæssige egnethed til PNEC bestemmelse. Systemet vurderer studierne i to
dimensioner, således at både pålidelighed og relevans evalueres. Studiets pålidelighed evalueres i
forhold til en liste med 21 kriterier med fokus på karakteriseringen og eksponeringen af
nanomaterialet og relevansen vurderes ud fra en liste med 13 kriterier. For begge dimensioner
gælder at hvert enkelte kriterie vurderes på en skala fra 0-3 og at hvert enkelt kriterie kan vægtes fra
1-3 (se Figur 1). Effektstudier med vurderinger i det hvide eller grå område af grafen, blev herefter
taget i betragtning til PNEC bestemmelse, hvor effektstudier i det mørkegrå område, ikke blev taget
i betragtning til PNEC bestemmelse.
16 Environmental effects of engineered nanomaterials
Risikovurderingsegnethed
20
30
40
50
60
70
80
90
100
Re1
Re2
Re3
nRi1nRi2nRi3
Nanopålidelighed
Rele
van
s
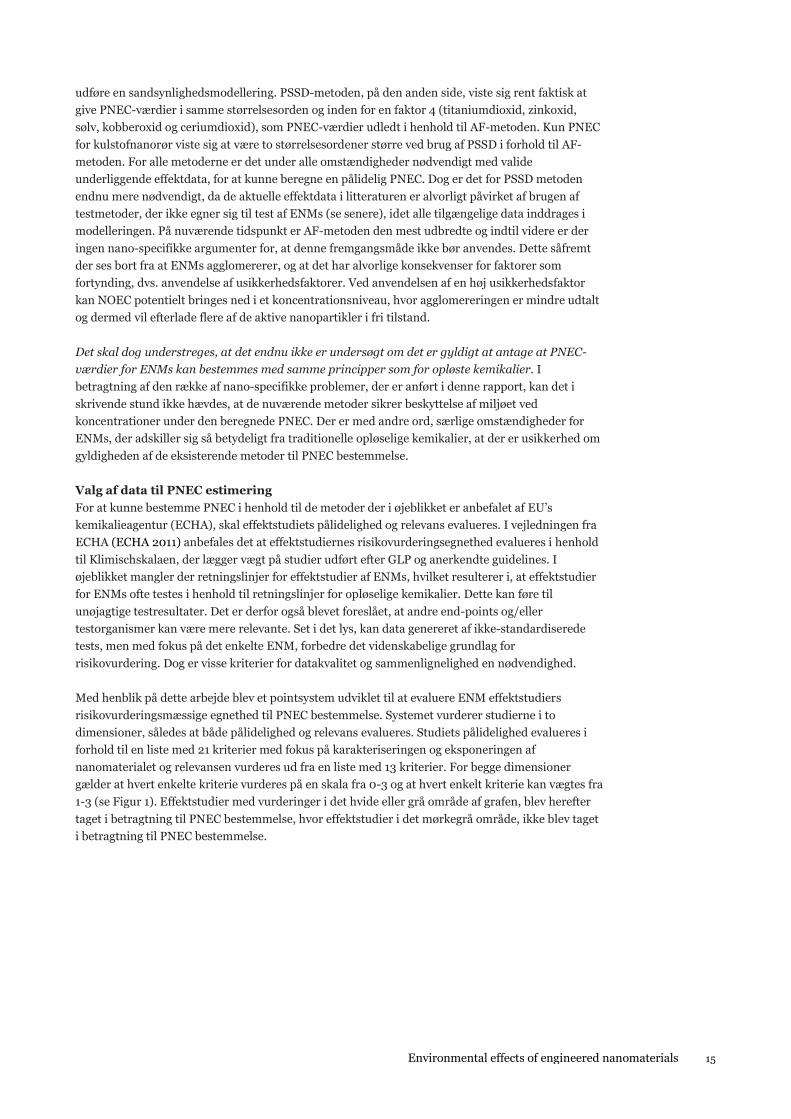
Figur 1 – Overblik over den udviklede todimensionelle metode til evaluering af et effektstudies
risikovurderingsegnethed. Det hvide område repræsenterer studier der anses for ”tilstrækkelige” i lovgivningsøjemed,
det grå område repræsenterer studier der “kan være tilstrækkelige” og det mørkegrå område repræsenterer studier der
”ikke er tilstrækkelige” i lovgivningsøjemed.
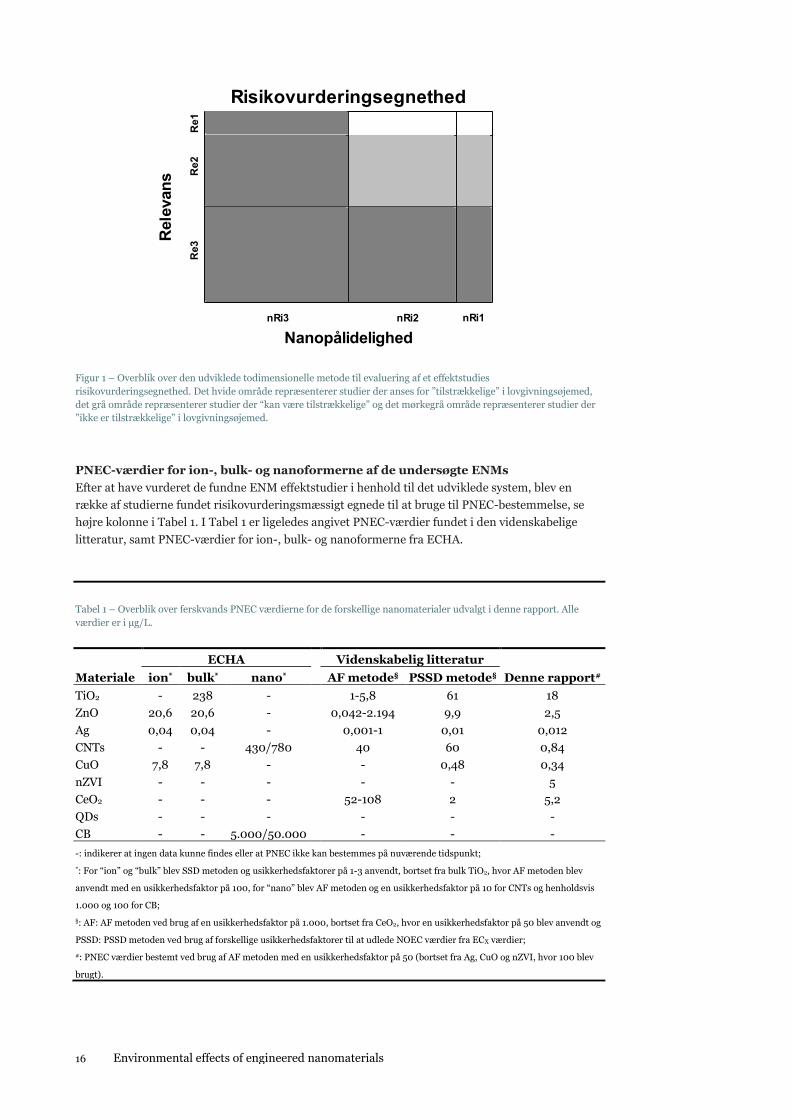
PNEC-værdier for ion-, bulk- og nanoformerne af de undersøgte ENMs
Efter at have vurderet de fundne ENM effektstudier i henhold til det udviklede system, blev en
række af studierne fundet risikovurderingsmæssigt egnede til at bruge til PNEC-bestemmelse, se
højre kolonne i Tabel 1. I Tabel 1 er ligeledes angivet PNEC-værdier fundet i den videnskabelige
litteratur, samt PNEC-værdier for ion-, bulk- og nanoformerne fra ECHA.
Tabel 1 – Overblik over ferskvands PNEC værdierne for de forskellige nanomaterialer udvalgt i denne rapport. Alle
værdier er i µg/L.
ECHA Videnskabelig litteratur
Materiale ion* bulk* nano* AF metode§ PSSD metode§ Denne rapport#
TiO2 - 238 - 1-5,8 61 18
ZnO 20,6 20,6 - 0,042-2.194 9,9 2,5
Ag 0,04 0,04 - 0,001-1 0,01 0,012
CNTs - - 430/780 40 60 0,84
CuO 7,8 7,8 - - 0,48 0,34
nZVI - - - - - 5
CeO2 - - - 52-108 2 5,2
QDs - - - - - -
CB - - 5.000/50.000 - - -
-: indikerer at ingen data kunne findes eller at PNEC ikke kan bestemmes på nuværende tidspunkt;
*: For “ion” og “bulk” blev SSD metoden og usikkerhedsfaktorer på 1-3 anvendt, bortset fra bulk TiO2, hvor AF metoden blev
anvendt med en usikkerhedsfaktor på 100, for “nano” blev AF metoden og en usikkerhedsfaktor på 10 for CNTs og henholdsvis
1.000 og 100 for CB;
§: AF: AF metoden ved brug af en usikkerhedsfaktor på 1.000, bortset fra CeO2, hvor en usikkerhedsfaktor på 50 blev anvendt og
PSSD: PSSD metoden ved brug af forskellige usikkerhedsfaktorer til at udlede NOEC værdier fra ECX værdier;
#: PNEC værdier bestemt ved brug af AF metoden med en usikkerhedsfaktor på 50 (bortset fra Ag, CuO og nZVI, hvor 100 blev
brugt).
Environmental effects of engineered nanomaterials 17
BEMÆRK: PNEC-bestemmelserne er baseret på følgende antagelser at, 1) de nuværende
testmetoder for opløselige kemikalier også gælder for nanomaterialer, og 2) de nuværende
ekstrapoleringsmetoder er gældende for nanomaterialer. Begge disse antagelser er yderst
tvivlsomme og ikke validerede. PNEC-bestemmelsen skal derfor tages som vejledende for
størrelsesorden for PNEC-værdierne, i betragtning af de nuværende lovgivningsmæssige
anbefalinger til PNEC estimering og dermed ikke anvendes som den endelige beskyttende
koncentration for miljøet.
Det ses, at PNEC-værdierne strækker sig over flere størrelsesordener, afhængigt af det enkelte ENM
med sølvnanopartikler som de mest giftige med en PNEC-værdi på 12 ng/L, og titaniumdioxid som
de mindst giftigt med en PNEC-værdi på 18 µg/L.
I betragtning af de forbehold, der præsenteres i denne rapport2, blev en usikkerhedsfaktor på 50
anvendt til PNEC bestemmelse for alle ENMs (bortset fra Ag, CuO og nZVI hvor en
usikkerhedsfaktor på 100 blev anvendt). Når man sammenligner PNEC værdierne for ion-, bulk- og
nanoformerne anført i Tabel 1, ses det at PNEC-værdierne for CuO-NPs er 23 gange lavere end de
tilsvarende PNEC-værdier for ion- og bulkformer af Cu. For TiO2-NPs, ZnO-NPs og Ag-NPs er de
tilsvarende forskelle henholdsvis 13, otte og tre gange. Således enten en størrelsesorden lavere
(CuO, TiO2 og ZnO) eller i samme størrelsesorden (Ag). Det er ikke muligt med den eksisterende
viden at afgøre om det afspejler frigivelse af metalioner, om det er enheden man bruger til at dosere
eller om det er grundet problemer med at kvantificere eksponeringen.
Sammenligner man med PNEC-værdierne udledt i denne rapport med PNEC-værdier (AF-metode)
fundet i litteraturen, ses overordnet PNEC-værdier i samme størrelsesorden, dog med forskelle
både til den lave og den høje side. Sammenligner man med PNEC-værdierne bestemt med PSSD-
metoden ses alle PNEC-værdier at være i samme størrelsesorden, dog bortset fra CNTs med en
forskel på to størrelsesordner. I denne sammenhæng skal det nævnes, at CNTs er genuine nye
materialer, for hvilke der hverken findes sammenlignelige større eller mindre former.
Men i betragtning af den relativt lave usikkerhedsfaktor på 50 der er anvendt til PNEC bestemmelse
i denne rapport, synes det ikke at være usikkerhedsfaktoren og dermed manglen på data, der er
årsag til disse lavere PNEC-værdier for ENMs både i forhold til de andre materialeformer og PNEC-
værdier fra litteraturen.
Datatilgængelighed, mangler og usikkerhed
På baggrund af denne rapports analyse af mangler og usikkerheder for hvert af de undersøgte
ENMs, samt fra artikler i litteraturen, er en række generelle mangler og usikkerheder med hensyn
til PNEC-bestemmelse for ENMs blevet identificeret:
1. Begrænset antal undersøgelser på forskellige trofiske niveauer: Det er generelt fundet, at
der kun er testet få arter på hvert trofisk niveau, hvilket resulterer i at kun AF-metoden kan
bruges til PNEC-bestemmelse.
2. Mangel på effektstudier i forskellige miljømatricer: For alle ENMs medtaget i denne
rapport, er der en udtalt mangel på undersøgelser fra andre miljømatricer end ferskvand.
For traditionelle opløselige kemikalier er det en mulighed at ekstrapolere fra ferskvandstests
til andre matricer ved brug af fordelingskoefficienter. Men ekstrapolation fra ferskvand til
andre matricer er ikke muligt for ENMs. Således kan denne mangel på data kun udfyldes
med yderligere forsøg i de pågældende matricer, eksempelvis havvand og renseanlæg.
2 at enkelte kroniske data undertiden ikke opfylder kravene til datakvalitet, eksempelvis ved at bruge LOEC eller en signifikant
effekt som erstatning for NOEC eller at enkelte akutte data undertiden ikke opfylder kravene, eksempelvis ved ikke at bruge den
foreskrevne testvarighed eller ved at rapportere NOEC i stedet for EC50.
18 Environmental effects of engineered nanomaterials
3. De fleste undersøgelser har haft akut toksicitet i fokus: Litteraturundersøgelsen viste at
langt størstedelen af de fundne økotoksicitetsdata er kortvarige test. For de ENMs hvor det
var muligt at bestemme en PNEC-værdi, var der typisk kun kroniske resultater tilgængelige
fra to studier på to forskellige trofiske niveauer, dvs. alger og dafnier, hvilket resulterede i
brugen af 50 som usikkerhedsfaktor. For at opnå mindre usikkerhed i PNEC bestemmelsen i
kemisk sikkerhedsvurdering, er der behov for flere undersøgelser med fokus på kroniske
end-points.
4. De fleste undersøgelser fokuserede på zooplankton: I forbindelse med det foregående punkt,
fokuserede langt størstedelen af effektstudierne på at teste dafnier (50%) sammenlignet med
alger (20%) og fisk (30%). Stort set ingen kroniske fiskestudier blev fundet, muligvis på
grund af de høje omkostninger samt etiske overvejelser, der er forbundet med fiskestudier.
5. Test af ENMs i høje koncentrationer: Ofte bliver høje og miljømæssigt urealistiske
koncentrationer anvendt i standard økotoksicitetsstudier, hvilket påvirker hvordan det
enkelte ENM opfører sig i testen og om det er biotilgængeligt. Dette kan føre til enten falsk
negative eller falsk positive resultater, hvilket igen kan påvirke PNEC-bestemmelsens
validitet.
Kvaliteten af de publicerede data er altafgørende for risikovurderingen. Dette gælder for både
konventionelle og alternative metoder til PNEC-bestemmelse og risikokarakterisering.
Litteraturgennemgangen i denne rapport viste, at der er udfordringer og åbenlyse problemer med
de nuværende rammer for PNEC-bestemmelse, nemlig at 1) effektstudier er baseret på
testguidelines udarbejdet for opløselige kemikalier og derfor ikke er egnede til ENMs og 2)
effektstudier vurderes for deres risikovurderingsegnethed i henhold til Klimisch skalaen, der i
sagens natur favoriserer undersøgelser udført i henhold til GLP og i overensstemmelse med
nuværende testguidelines.
Med hensyn til bestemmelse af PNEC-værdier for nanomaterialer, er problemet primært, at de
fleste effektdata der kan findes generelt ikke er pålidelige og at der således mangler valide data, der
er egnede til risikovurdering. Når effektstudier udføres i overensstemmelse med anerkendte
internationale (modificerede) testguidelines, der er udviklet til opløselige kemikalier, er
nanomaterialernes iboende egenskaber ofte årsag til varierende eksponeringsforhold under selve
den økotoksikologiske test, hvilket kan føre til misvisende testresultater.
Denne rapports konkrete anbefaling er således, at PNEC-bestemmelser for ENMs udføres efter at
effektstudierne er evalueret for deres risikovurderingsegnethed i henhold til den transparente og
reproducerbare metode som er udviklet, beskrevet og anvendt i denne rapport.
Environmental effects of engineered nanomaterials 19
1. Introduction
1.1 Background – Environmental Risk Assessment and PNEC values
for nanomaterials
Engineered nanomaterials (ENMs) may be introduced into the environment both intentionally and
non-intentionally throughout the life-cycle of ENM production, use and disposal. As the use of
nanomaterials increases across a wide range of sectors, environmental release is an inevitable
consequence. Today urban stormwater, landfill leachates, effluents from wastewater treatment
plants and waste incineration are all anthropogenic processes likely to contain ENMs from nano-
enabled consumer and industrial products either disposed of at the end of their use phase, released
through accidental spills during production or later during transport of ENMs. Wear and tear of
materials containing ENMs may also lead to potential release during the use-phase. In addition,
intentional release into the environment must be considered, such as via the use of e.g. nano-zero
valent iron (nZVI) in the remediation of groundwater polluted with chemicals such as chlorinated
solvents (Grieger, Baun et al. 2010).
With respect to environmental effects of ENMs, concerns are related to the fact that nano-scale
dimensions of materials tend to be more reactive and may behave differently than their bulk-scale
counterparts (Royal Commission 2008). For example, compared to bulk materials ENMs may
exhibit different catalytic potential, solubility, electrical conductivity, material strength, and
magnetic behaviour (Oberdorster, Oberdorster et al. 2005). By definition most ENMs are indeed
considered to be ‘novel’ materials, many of which were developed to take advantage of their highly
reactive properties, and novel effect characteristics may therefore be expected for ENMs.
The increasing use and hence anticipated increased release of ENMs from consumer products to the
environment makes environmental safety assessment of utmost importance. In the European Union
the procedure for this type of assessment entails an exposure assessment for deriving the Predicted
Environmental Concentration (PEC) and a dose-response (effect) assessment leading to Predicted
No-Effect Concentrations (PNECs). The latter is based on a critical evaluation of existing
ecotoxicological data and the procedures for PNEC estimation is described in detail in (ECHA
2008). These procedures have been developed for “regular” chemicals, but are also recommended
to be used for ENMs since they in principle should be applicable (Aitken, Bassan et al. 2011).
However, it should be emphasized that by using existing procedures and guidelines for effect
assessment, engineered nanoparticles are considered to be one of several different forms of the
parent materials and that present technical guidance for completing a risk assessment can be used
with some minor technical and/procedural amendments only (Grieger, Baun et al. 2010).
The OECD (Organisation for Economic Cooperation and Development) is a key player in the
establishment of test guidelines and guidance for safety testing of chemicals and is also heavily
involved in test method development for nanomaterials. The challenges for risk assessment posed
by ENMs have to some extent been addressed by the program of work at the OECD’s working party
on manufactured nanomaterials (OECD 2010). An array of projects are being directed, including
the development of a nanomaterial risk research database analysis of test methods (which underpin
chemical risk assessment) as applied to nanomaterial and a sponsorship program that will acquire
risk assessment data for nanomaterials of current relevance. In an OECD expert meeting held in
Berlin in 2013 it was concluded that several of the current test guidelines do not apply to
20 Environmental effects of engineered nanomaterials
nanomaterials and many others need to be adapted to be applicable (OECD 2014). Work is
currently ongoing to develop and adapt these documents.
In environmental risk assessment, reliable (and reproducible) results of ecotoxicological
experiments are mandatory prerequisites. Besides the above-mentioned challenges, the field of
nano-ecotoxicology is further challenged by the fact that before 2004 no ENMs had been studied
(Stone, Hankin et al. 2010). As outlined by Hartmann, Von der Kammer et al. (2010) problems of
reproducibility occur in standardized test systems when particle suspensions are tested and not
substances in solution as it is the case for chemicals for which the tests were developed. Problems of
uncontrollable aggregation affected by dilution, media composition and the organisms themselves
are frequently reported (Hartmann, Von der Kammer et al. 2010, Hartmann, Engelbrekt et al. 2013,
Tiede, Hassellov et al. 2009, Hasselloev, Readman et al. 2008, Baun, Hartmann et al. 2008) and
this hampers the interpretation of effects observed. While the number of ecotoxicity studies are
indeed rapidly increasing in these years it is not given that these studies are relevant for the effect
assessment carried out as a part of the environmental risk assessment of ENMs (Wickson,
Hartmann et al. 2014).
Environmental risk assessment is required to ensure safety of nanomaterials and to protect the
environment from unintentional adverse effects. In a regulatory context this requires reliable and
relevant environmental hazard data upon which PNEC values can be estimated. For nanomaterials
it is well-known that ecotoxicity testing is not straight-forward and that the applicability of
commonly used test guidelines and guidance can be questioned (e.g., Baun, Hartmann et al. (2009).
Nanomaterials are known to behave very differently in ecotoxicity test systems compared to soluble
chemicals, for which most guidelines were intended.
This current lack of appropriate guidance implies that previous and current guideline-based hazard
testing may not be appropriate for testing of ENMs. It further entails that the data, upon which
currently available PNEC values have been established, may not correctly reflect the actual
ecotoxicity of these ENMs. This means that existing data from non-standard tests – or tests
following modified test guidelines –in some cases may provide information of equal or higher
reliability compared to strictly guideline-based tests. This would be the case if these modifications
were applied to cater for nanomaterial properties and behaviour in the test system. Such data
should therefore not per se be considered less reliable as basis for PNEC estimation.
1.2 Objective and scope
The overall objective of this report is to provide data on environmental effects of nine selected
ENMs in order to derive their respective PNEC values. This will eventually feed into an
environmental risk evaluation of the selected ENMs, which constitutes the last component of the
NanoDEN project.
In the context of this report ENMs are defined as manufactured materials with one or more external
dimensions between 1 and 100 nm. In that respect an ENM is a part of a broader group of
nanomaterials, which can result from natural, anthropogenic (incidental) and engineered
(intentional) processes, however the NanoDEN project focuses on ENMs, as this is the most
relevant group of nanomaterials from an up-stream regulatory point of view. The following
materials have been selected for this project:
- Titanium Dioxide (TiO2) (rutile and anatase)
- Zinc Oxide (ZnO)
- Silver (Ag)
- Carbon Nanotubes (CNTs)
- Copper Oxide (CuO)
Environmental effects of engineered nanomaterials 21
- Nano Zero Valent Iron (nZVI)
- Cerium Oxide (CeO2)
- Quantum Dots (QDs)
- Carbon Black (CB)
The selection was based on expected production and use volumes in Denmark and their
applications in relevant consumer products, industrial processes, and environmental remediation
processes. In the NanoDEN project CuCO3 nanoparticles are included as a case material for copper
containing nanoparticles. However, in this report CuCO3 has been replaced by CuO nanoparticles
due to the fact that CuO nanoparticles have been studied to some extent in ecotoxicity studies,
whereas studies for CuCO3 are lacking.
Through a critical review this report will summarize the current knowledge with respect to PNEC
estimation methodologies, data selection criteria and their applicability to ENMs. This included a
specific review of nano-PNEC values in the scientific literature. Knowledge gaps in relation to
methodological limitations, data availability, relevance and read-across will be identified.
Alternative methodologies for PNEC estimation will be identified and compared to current
procedures, with a specific focus on their applicability to the special concerns that ENMs raise. A
transparent approach to assess the adequacy of effect data for PNEC estimation will likewise be
developed. This will result in recommendations and suggestions for pragmatic approaches to
estimating PNEC values for ENMs while at the same time highlighting current uncertainties and
future research needs. Finally, on this basis, estimated PNEC values will be included for the selected
ENMs chosen for this project.
In this report a strong focus is directed towards effects in the aquatic environment. This is because
the aquatic phase is seen as the starting point for understanding the environmental fate and
behaviour of ENMs as a main point of potential entry into the environment, creating a link between
the other environmental compartments such as soil, sediment and air (Hartmann, Skjolding et al.
2014). Furthermore, the behaviour of ENMs in complex matrices like soils and sediments is not
well-understood at present. The far majority of effect studies are performed on freshwater aquatic
organisms, also because the base-set test organisms belong to the freshwater compartment.
However, given similar sensitivities among organisms living in different compartments, there is an
option of extrapolating from one compartment to another, as e.g. known for organic chemicals from
freshwater to soil/sediment organisms using distribution coefficients. But this requires that
relevant physico-chemical parameters are available and that given relations exist.
1.3 Report structure
Following the above introduction the report is divided in 6 chapters.
For those readers not familiar with how PNEC values are derived according to the European
chemicals regulation, Chapter 2 gives an overview of the accepted approaches for PNEC derivation
as well as how effect studies are evaluated for their adequacy for risk assessment.
Chapter 3 contains an overview of existing PNEC values for the ENMs selected for study in this
report – both from REACH registrations as well as from the open literature. For the sake of
comparison PNEC values for the ionic and bulk forms of the ENMs are shown when applicable.
As the current way of evaluating the risk assessment adequacy of effect studies is not suited for
ENMs, Chapter 4 presents a state-of-the-art evaluation procedure for effect studies of ENMs with
respect to their risk assessment adequacy.
22 Environmental effects of engineered nanomaterials
In Chapter 5 effects studies for the selected ENMs are evaluated for their risk assessment adequacy
and the most appropriate study is selected for the PNEC derivation.
Chapter 6 sums up the report with a comparison of the PNEC values obtained in this report with
PNEC values found in the literature and from REACH (see Chapter 3). This is followed by a
discussion on how different properties of the ENM, experimental, biological as well as risk
assessment issues influence the PNEC derivation and how these identified GAPs have implications
for chemical safety assessment.
Finally, Chapter 7 presents the conclusions of the report.
Environmental effects of engineered nanomaterials 23
2. Current approaches for estimation of PNEC values and data evaluation for traditional chemicals
For readers who are not familiar with environmental risk assessment this section provides a brief
introduction to the key concepts for determining the PNEC value and currently recommended
approaches for PNEC estimation under the European chemicals regulation (REACH). Further the
section introduces the method used for evaluation of the regulatory adequacy of data from
ecotoxicological tests.
2.1 Predicted No-Effect Concentration in the risk assessment paradigm
In the European chemicals regulation (REACH) the chemical safety assessment (CSA) is the main
instrument to identify and control the risk of chemicals (ECHA 2008). The CSA is divided in three
steps: Hazard assessment, exposure assessment and risk characterisation. In this framework the
environmental hazard assessment aims to identify the hazards of the chemical substance to
ecosystem functions and organisms in the environment. This assessment encompasses a dose-
response evaluation, which is based on collection of ecotoxicological tests results that upon
evaluation are used to establish the threshold concentration below which exposure is considered to
be safe. This concentration is referred to as the Predicted No-Effect Concentration (PNEC) which by
ECHA is defined as “…the concentration of a substance in any environment below which adverse
effects will most likely not occur during long term or short term exposure” (ECHA 2008). It is a
requirement in REACH that the PNEC value is derived for substances manufactured, imported, or
used in more than 10 t/year. In order to derive a PNEC for a substance all available hazard
information must be evaluated. This will in most cases comprise laboratory studies following both
standard and non-standard methods. It is a general assumption that ecosystems, i.e. naturally
occurring organisms, are more sensitive to chemical substances than organisms used in the
laboratory. Furthermore, most laboratory studies are carried out on single organisms. In order to
compensate for, among other things the difference in sensitivity between organisms in their natural
habitats and organisms bred and kept in the laboratory, assessment factors are applied to the
laboratory test results. It is therefore not directly the test from the laboratory that is used, but an
extrapolation of the laboratory test result is carried out.
Two approaches for determining PNEC values are described within REACH and the EU technical
guidance documents, namely: 1) the assessment factor (AF) approach and 2) the deterministic
approach using species sensitivity distributions (SSDs) (ECHA 2008). The AF approach can in
principle be used when only short-term effect data exist for the three trophic levels defined as the
base-set organisms, i.e. algae, daphnia and fish, and the most sensitive organism is used for the
calculations of the PNEC value. In contrast to the simple AF approach the SSD approach requires at
least ten high quality NOECs/EC10-values from different organisms belonging to eight taxonomic
24 Environmental effects of engineered nanomaterials
groups. Hence, in the recognition of the general lack of such many and varied data for traditional
chemicals, it is often the AF approach that is used in practice, despite the wish to utilise a broader
range of data better representing the variety of organisms.
For both approaches, uncertainties in the extrapolation are assumed to be covered by applying AFs
according to (ECHA 2008). These uncertainties comprise:
Intra- and inter-laboratory variation of toxicity data;
Intra- and inter-organism variation (biological variation);
Short-term to long-term extrapolation; Laboratory data to field impact extrapolation (additive, synergistic and antagonistic effects
from the presence of other substances may also play a role here)
Obviously, the AF depends on the type of the effect data; with short-term and few data a high AF is
required, while lower AFs can be used if long-term and many data exist. While the scientific basis
for the use of AF is debateable, a consensus has developed among different regulatory frameworks
with regards to the magnitudes of AFs (van Leeuwen, Vermeire 2007).
2.2 The Assessment Factor approach
The general principle of the AF approach is that the result from a laboratory test is divided by an
AF. The less data available, the higher the AF applied. PNECs are then estimated by dividing the
lowest value found in toxicity tests with the chosen AF. The available effect data are simply
evaluated against short-term/long-term and trophic level criteria. The aim is to represent the
ecosystem by data from one organism at each of three different trophic levels: algae, crustaceans
and fish; i.e. the base-set test organisms. Additionally, these data should preferably be NOECs from
chronic studies. Alternatively EC10-values or extrapolations from LOECs can be used instead of
NOECs. If only short-term values exist, the lowest EC50-value should be used.
The PNEC is thus derived according to Equation 2-1.
AF
ECor NOEC Low estPNEC 50
Equation 2-1
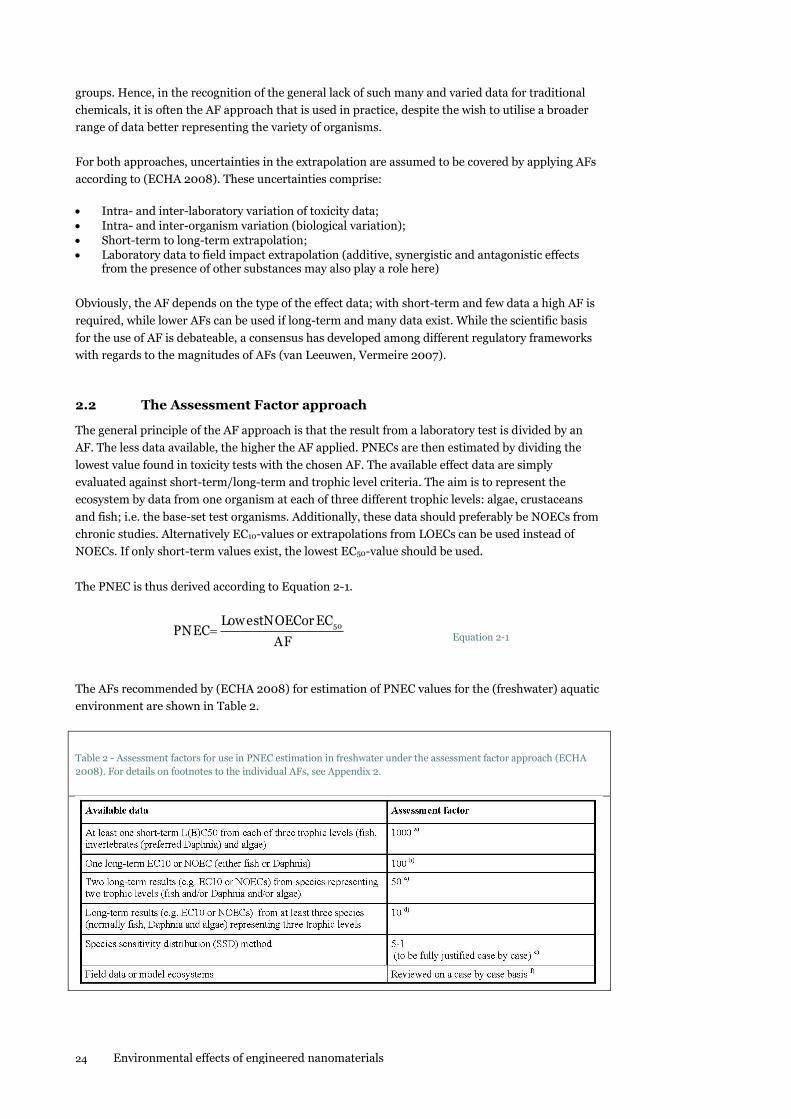
The AFs recommended by (ECHA 2008) for estimation of PNEC values for the (freshwater) aquatic
environment are shown in Table 2.
Table 2 - Assessment factors for use in PNEC estimation in freshwater under the assessment factor approach (ECHA
2008). For details on footnotes to the individual AFs, see Appendix 2.
Environmental effects of engineered nanomaterials 25
If long-term data are available for all organisms in the base-set the lowest NOEC should be divided
by an AF of 10 to obtain the corresponding PNEC. However, if the data only comprise chronic
NOEC values for two trophic levels, the lowest NOEC should be divided by an AF of 50. If the data
only consist of either a chronic NOEC from a fish or daphnia study, it should be divided by an AF of
100. Finally, if no long-term data exist, but only short-term values for the three base-set trophic
levels exist, an AF of 1,000 is applied.
2.3 The Species Sensitivity Distribution approach
The Species Sensitivity Distribution (SSD) is based on the assumption, that the sensitivities of the
organisms in the ecosystem follow a theoretical distribution and that the organisms tested in the
laboratory is a random sample of this distribution. In order to establish a SSD for a given substance
a substantial amount of effect data is needed. All of these effect data must be high-quality
NOECs/EC10-values from chronic or long-term studies.
According to (ECHA 2008) data have to be compiled for at least ten, but preferably 15,
ecotoxicological studies which should comprise eight different taxonomic groups, covering algae,
crustaceans, fish, insects, higher plants as well as other families of insects and fish.
In comparison to the base-set of ecotoxicological tests used for the AF approach, there may not exist
standardized methods for these other taxonomic groups. Thus, the requirements for regulatory
relevance and reliability of test results have to be assessed on a case-by-case basis.
If there is a sufficient amount of validated effect data for a given substance, the range of data is
fitted to the selected theoretical distribution. It should be noted that different distribution models
are recommended by different regulatory authorities; where the US EPA suggests a log-triangular
function, ECHA guidance document for safety assessment of chemicals in the EU operates with a
log-logistic or a log-normal function. If the fitting of the data to the selected model results in a lack-
of-fit, the SSD should not be used. However, if a good fit is obtained the so-called hazardous
concentration to 5% of the organisms (HC5) or the 5th percentile of the chronic toxicity data
distribution can be derived, which is then considered protective for most organisms in a
community. The HC5 can be derived with a 50 or 95% confidence interval, using Equation 2-2.
105
skx mmmHC Equation 2-2
where m is the number of organisms, xm is the sample mean of log NOEC data for m species, km is
the one-sided extrapolation constant for a logistic or normal distribution and sm is the sample
standard deviation of log NOEC values for m organisms.
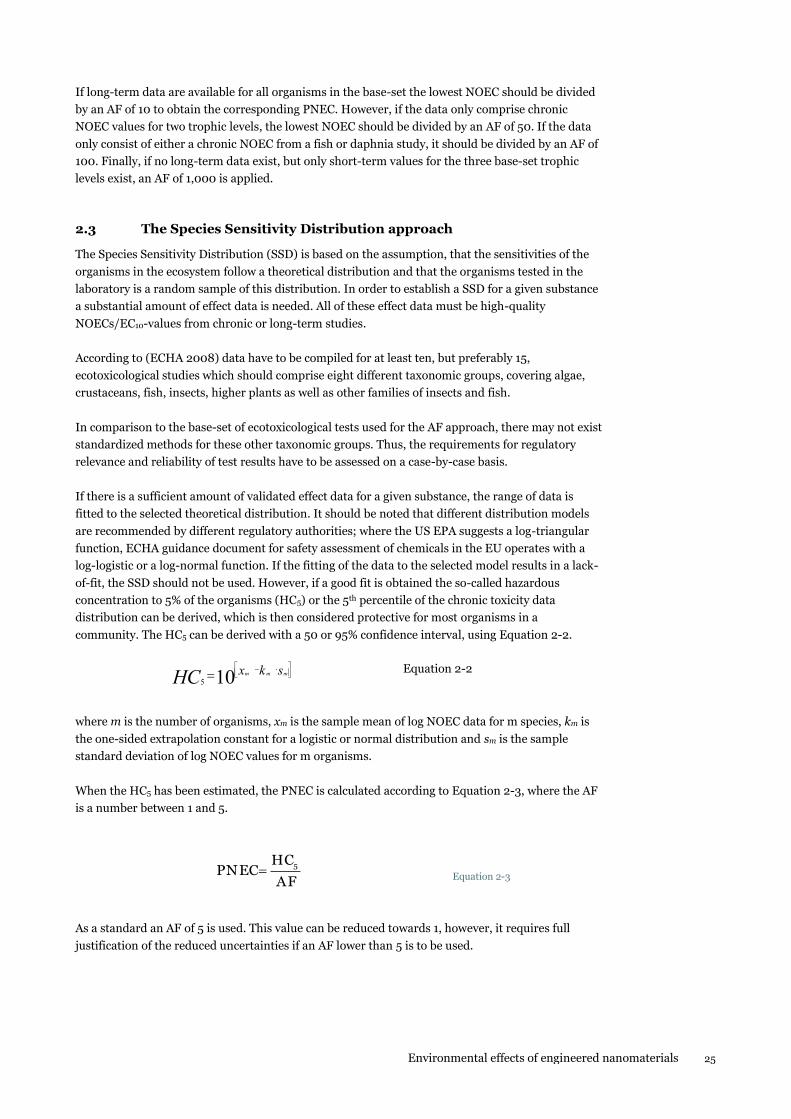
When the HC5 has been estimated, the PNEC is calculated according to Equation 2-3, where the AF
is a number between 1 and 5.
AF
HCPNEC 5
Equation 2-3
As a standard an AF of 5 is used. This value can be reduced towards 1, however, it requires full
justification of the reduced uncertainties if an AF lower than 5 is to be used.
26 Environmental effects of engineered nanomaterials
2.4 Data selection for PNEC estimation – the Klimisch score
In the currently recommended approach for safety assessment of chemicals the regulatory relevance
and reliability of a study needs to be evaluated before it can be used in either of the two approaches
for PNEC estimation described above. In the ECHA guidance document (ECHA 2011) it is
recommended that the quality of a given effect study is evaluated by assigning a so-called Klimisch
score to the study. Usually only studies assessed as K1 or K2 will be used for further PNEC
estimation. The Klimisch scores are described in the following (from Klimisch, Andreae et al. (1997)
as cited by ECHA (2011), “Guidance on information requirements and CSA. Chapter R.4: Evaluation
of available information”):
K1 = reliable without restrictions: “studies or data [...] generated according to generally valid
and/or internationally accepted testing guidelines (preferably performed according to GLP) or in
which the test parameters documented are based on a specific (national) testing guideline [...] or in
which all parameters described are closely related/comparable to a guideline method.”
K2 = reliable with restrictions: “studies or data [...] (mostly not performed according to GLP), in
which the test parameters documented do not totally comply with the specific testing guideline, but
are sufficient to accept the data or in which investigations are described which cannot be subsumed
under a testing guideline, but which are nevertheless well documented and scientifically
acceptable.”
K3 = not reliable: “studies or data [...] in which there were interferences between the measuring
system and the test substance or in which organisms/test systems were used which are not relevant
in relation to the exposure (e.g. unphysiological pathways of application) or which were carried out
or generated according to a method which is not acceptable, the documentation of which is not
sufficient for assessment and which is not convincing for an expert judgement.”
K4 = not assignable: “studies or data [...] which do not give sufficient experimental details and
which are only listed in short abstracts or secondary literature (books, reviews, etc.).”
Currently, ECHA uses the Klimisch categorisation for all effect studies and only studies obtaining
K1 or K2 will be considered in the overall risk assessment. The evaluation of reliability and
relevance of ecotoxicity data for regulatory environmental risk assessment is, as described in the
previous section, often based on the assignment of a Klimisch score. This means that toxicity data
from standard guideline tests are preferred over non-standard test data. In the case of ENMs
current test methods may not be directly applicable to testing of their potential hazardous
properties. It has therefore also been suggested that other endpoints and/or test organisms may be
more relevant (Ågerstrand, Breitholtz et al. 2011). In this light, data generated by non-standard
tests could improve the scientific basis of risk assessment by providing relevant and more sensitive
endpoints. At the same time it is acknowledged that some criteria for data quality must be agreed
upon to ensure comparability and mutual acceptance of data (MAD).
Environmental effects of engineered nanomaterials 27
3. Currently existing PNEC values for nanomaterials – literature values and REACH registrations
In this section established PNEC values are presented based on scientific literature and data from
registration dossiers submitted to ECHA. PNEC values for the ionic form (when applicable), the
bulk form (when applicable) as well as PNEC values for the nano form will be presented. These
values will later be compared to the PNEC values established based on the methodology developed
as part of this project with the purpose of discussing differences resulting from data selection and
estimation method. However, first an overview of existing and alternative approaches to PNEC
estimation for ENMs will be presented.
3.1 PNEC Estimation Methodologies
As mentioned in Chapter 2, there are two approaches for determining PNEC values described in
REACH, and these also constitute the basis for PNEC estimation of ENMs.
With regard to the AF approach, the RIPoN3 report (Aitken, Bassan et al. 2011) found that in
principle there does not seem to be nano-specific arguments to change the way assessment factors
are selected in the AF approach today, i.e. that more available data from long-term tests can reduce
the AF from 1,000 to 100, 50, and 10. However, the AFs were originally intended not only to cover
the uncertainty related to the amount of available data but also factors such as inter- and intra-
organism differences and extrapolations from laboratory to field, but when deciding on the
magnitude of the current AFs it was not considered also to cover potentially nano-specific effects or
test artefacts arising from the distinct different nature of ENMs compared with soluble chemicals.
The values of the AFs are based on regulatory practice and empirical knowledge on ecotoxicological
effects of chemicals. Since there is no history for evaluation of ENMs, it is at present not possible to
claim that the use of the presently available AFs will ensure that organisms will be protected at
concentrations below PNEC. The RIPoN3 report also found the SSD approach to be principally
acceptable for deriving PNEC values for ENMs. It should be noted that this approach requires at
least ten high quality NOECs/EC10-values from different organisms belonging to eight taxonomic
groups. This kind of data is not available for any ENM today and thus it remains to be shown that
the deterministic approach for PNEC determination will actually be applicable to ENMs.
Independent of the PNEC estimation methodology, i.e. application of AFs to derive safe levels, the
reliability of the underlying NOEC values is crucial. The fact that ENMs agglomerate/aggregate
when dispersed in solution potentially results in the transfer from small reactive particles to larger
non-reactive particles. In such a case, particles nominally expected to be small will show a reduced
effect, e.g. no effect, but when an AF is applied in order to derive the PNEC value, the derived PNEC
28 Environmental effects of engineered nanomaterials
may potentially represent a concentration that in fact has an effect on the environment, i.e. at a
particle concentration level where the degree of agglomeration is not the same as in lower
concentrations. Typically most agglomeration is seen at higher concentrations. The lower
agglomeration at low concentration will leave the ENM in the nano-sized range where the
potentially more reactive particles may exert biological effects not observed for the larger
particles/agglomerates. This phenomenon has much to do with the current difficulties in verifying
the exposure level and will as such have a large influence on the PNEC and should therefore have an
implication on the choice of the magnitude of the AF, which is not accounted for within the present
approach.
The currently available AFs are intended to cover uncertainties, e.g. from lab to field. As suggested
in the literature, see later, an extra nano-specific AF could be applied to the current approach in
order to cover estimation from e.g. ion to nano.
3.2 Alternative approaches to PNEC estimation for ENMs
Given the concerns on data availability, data quality and relevance of methods for ENMs, a number
of alternative approaches have been suggested for the estimation of nano-PNEC values. These
include:
- The Probability Species Sensitivity Distribution (PSSD) approach as described by
Gottschalk, Kost et al. (2013). It is stated that “this method accounts for inter- and intra-
organism differences in toxic effects that may be observed for different modifications of an
ENM to the same environmental organism.” To transform the raw data on ecotoxicity into
NOEC values, to be used for the PSSD, AFs were applied:
o A factor of 10 to reflect the uncertainty of short- to long-term effect extrapolation.
o A factor of 10 to derive NOEC values from L(E)C50 values
o A factor of 2 to derive NOEC values from L(E)C10–20 values.
The long-term NOEC values were then used to create SSDs for each individual organism
which are subsequently combined into a “generic probabilistic species sensitivity
distribution” for the specific ENM and environmental compartment (Gottschalk, Kost et
al. 2013). This method does not directly result in a PNEC value but rather a PSSD from
which conclusions can be made about e.g. percentile values, i.e. concentrations for which a
certain % of the organisms will be affected. This approach has further been developed in
order to derive PSSD-based PNEC values. The PSSD can also be compared to a probability
distribution for environmental concentrations to identify ‘critical concentration ranges’.
The appropriateness of this method to nano-PNEC estimations can be questioned by the
fact that the current uncertainty ‘embedded’ in the raw ecotoxicity data is likely to highly
influence the resulting PSSD. Though this is also the case with the AF and SSD
approaches, the PSSD approach include all available data, which severely may influence
the derived PNEC. A benefit of the PSSD approach is the possibility of including a wider
dataset (i.e. all available ECX and NOEC values), however, this is at the same time a
drawback, as AFs have to be applied in order to obtain NOEC values from the ECX data, i.e.
using estimated data for further estimations.
- Using PNEC values for the corresponding dissolved metal ion as a starting point and
applying a safety factor (Notter, Mitrano et al. 2014). This approach is relevant only to
soluble metal/metaloxide ENMs. The approach is based on a systematic comparison of
ecotoxicity data for metal or metal oxide ENMs and the corresponding soluble metal ion
toxicity. It was evaluated how often the metal ion was more toxic than the nanomaterial
Environmental effects of engineered nanomaterials 29
and vice versa. On this basis Notter, Mitrano et al. (2014) proposed to divide the
corresponding metal PNEC with a factor 2 to ensure a conservative PNEC for the ENM.
- Deriving so-called INECs (Indicative No Effect Values) (Aschberger, Micheletti et al.
2011). The term ‘indicative’ is used to indicate the uncertainty that is associated with the
estimated NEC value and that it should not be applied in regulatory risk assessment. It is
however compared to PEC values to compare the orders of magnitude between potential
effect concentrations and environmental concentrations.
As mentioned before, it is recognised that current standard methods and guidelines for ecotoxicity
testing are often not appropriate for testing of ENMs. Test methods have been developed and
refined over the last decade of nanoecotoxicology research and work is ongoing within the OECD
WPMN. However consensus on most appropriate methods has not yet been reached. This implies
that using all available data means using data that varies in reliability.
3.3 Predicted No Effect Concentrations in REACH registrations
The following sections will present a brief overview of PNEC values published in REACH
registrations based on searches in the ECHA database of registered substances
(http://echa.europa.eu/web/guest/information-on-chemicals/registered-substances). A chemical
substance may exist in several forms and in the context of ENMs the terms “ionic form”, “bulk
form” and “nano form” are often used to distinguish between these forms – especially for metal and
metal oxide materials. The terms are explained below in Box 1. Searches were carried out in the
ECHA database both for the particulate forms and the corresponding ionic forms. For materials that
can exist both as bulk and nano forms it was checked if the database dossiers intended to cover both
forms (i.e. the given PNEC is intended to cover both forms) or if specific PNEC values were
provided for the two forms separately. Some materials do not by definition exist in a bulk form (e.g
CNTs) and these database entries are therefore implicitly for the nano form of the material.
Box 1 – Explanation of terms used to describe different forms of the same chemical substance.
Ionic form: This refers to dissolvable metal salts or dissolved metal ions/metal ion complexes.
The metal corresponds to the metal that is/forms part of the corresponding particulate material for
which the ionic form is used as a reference compound and/or for read-across purposes. Examples of
ionic forms are CuSO4 or Cu2+ (and dissolved Cu-complexes), which can be used as a reference
substance in studies with e.g. Cu(s) or CuO(s) particles. Ionic forms are only relevant for metal-
containing substances.
Bulk form: This refers to a particulate form of a material, where the particle sizes are larger than
what is defined as nanoparticles (typically >100 nm). Some materials exist in different particle
sizes. An example is TiO2 that can be produced both as nanoparticles (i.e. in the nano form, see
below) and as larger sized particles (i.e., bulk form). It should be noted that some materials by
definition only exist as nanomaterials and a corresponding bulk form does therefore not exist. This
is for example the case with CNTs.
Nano form: This refers to a particulate form of a material with particle sizes/size distributions
that classifies them as nanoparticles (may differ between different definitions but typically <100
nm). In the context of this report nanoparticles are defined by their size with one or more external
dimensions between 1 and 100 nm.
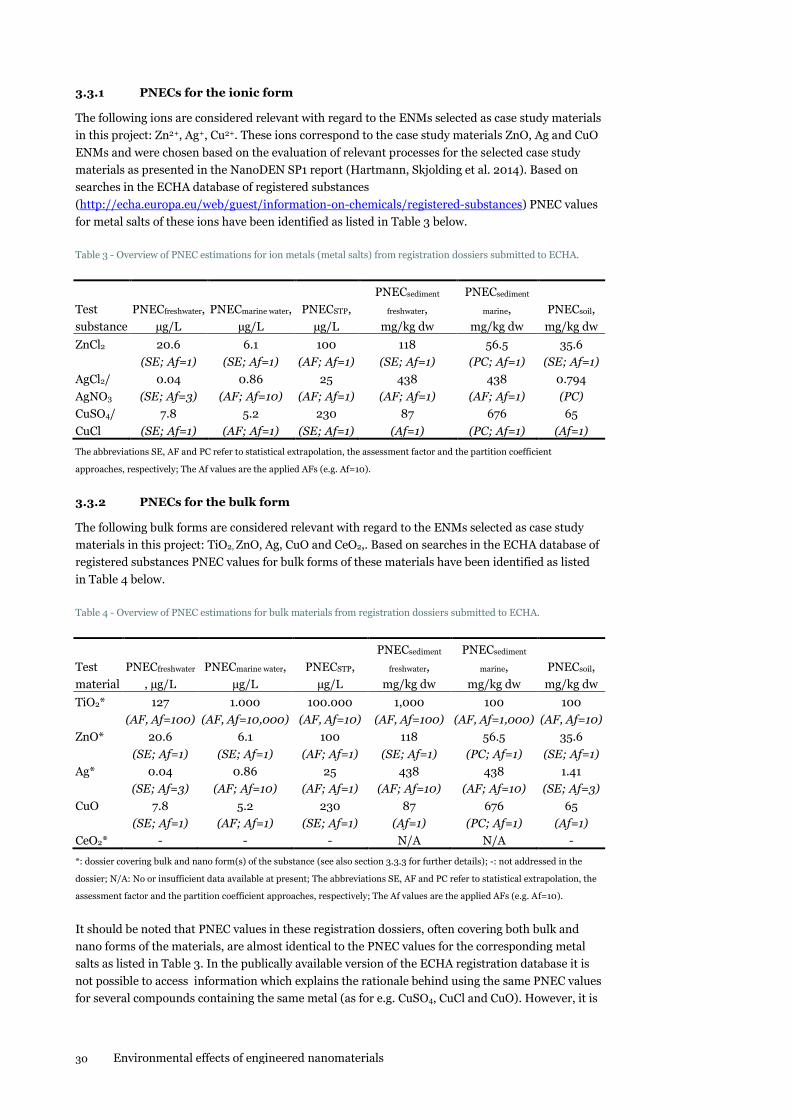
30 Environmental effects of engineered nanomaterials
3.3.1 PNECs for the ionic form
The following ions are considered relevant with regard to the ENMs selected as case study materials
in this project: Zn2+, Ag+, Cu2+. These ions correspond to the case study materials ZnO, Ag and CuO
ENMs and were chosen based on the evaluation of relevant processes for the selected case study
materials as presented in the NanoDEN SP1 report (Hartmann, Skjolding et al. 2014). Based on
searches in the ECHA database of registered substances
(http://echa.europa.eu/web/guest/information-on-chemicals/registered-substances) PNEC values
for metal salts of these ions have been identified as listed in Table 3 below.
Table 3 - Overview of PNEC estimations for ion metals (metal salts) from registration dossiers submitted to ECHA.
Test
substance
PNECfreshwater,
µg/L
PNECmarine water,
µg/L
PNECSTP,
µg/L
PNECsediment
freshwater,
mg/kg dw
PNECsediment
marine,
mg/kg dw
PNECsoil,
mg/kg dw
ZnCl2 20.6
(SE; Af=1)
6.1
(SE; Af=1)
100
(AF; Af=1)
118
(SE; Af=1)
56.5
(PC; Af=1)
35.6
(SE; Af=1)
AgCl2/
AgNO3
0.04
(SE; Af=3)
0.86
(AF; Af=10)
25
(AF; Af=1)
438
(AF; Af=1)
438
(AF; Af=1)
0.794
(PC)
CuSO4/
CuCl
7.8
(SE; Af=1)
5.2
(AF; Af=1)
230
(SE; Af=1)
87
(Af=1)
676
(PC; Af=1)
65
(Af=1)
The abbreviations SE, AF and PC refer to statistical extrapolation, the assessment factor and the partition coefficient
approaches, respectively; The Af values are the applied AFs (e.g. Af=10).
3.3.2 PNECs for the bulk form
The following bulk forms are considered relevant with regard to the ENMs selected as case study
materials in this project: TiO2, ZnO, Ag, CuO and CeO2,. Based on searches in the ECHA database of
registered substances PNEC values for bulk forms of these materials have been identified as listed
in Table 4 below.
Table 4 - Overview of PNEC estimations for bulk materials from registration dossiers submitted to ECHA.
Test
material
PNECfreshwater
, µg/L
PNECmarine water,
µg/L
PNECSTP,
µg/L
PNECsediment
freshwater,
mg/kg dw
PNECsediment
marine,
mg/kg dw
PNECsoil,
mg/kg dw
TiO2* 127
(AF, Af=100)
1.000
(AF, Af=10,000)
100.000
(AF, Af=10)
1,000
(AF, Af=100)
100
(AF, Af=1,000)
100
(AF, Af=10)
ZnO* 20.6
(SE; Af=1)
6.1
(SE; Af=1)
100
(AF; Af=1)
118
(SE; Af=1)
56.5
(PC; Af=1)
35.6
(SE; Af=1)
Ag* 0.04
(SE; Af=3)
0.86
(AF; Af=10)
25
(AF; Af=1)
438
(AF; Af=10)
438
(AF; Af=10)
1.41
(SE; Af=3)
CuO 7.8
(SE; Af=1)
5.2
(AF; Af=1)
230
(SE; Af=1)
87
(Af=1)
676
(PC; Af=1)
65
(Af=1)
CeO2* - - - N/A N/A -
*: dossier covering bulk and nano form(s) of the substance (see also section 3.3.3 for further details); -: not addressed in the
dossier; N/A: No or insufficient data available at present; The abbreviations SE, AF and PC refer to statistical extrapolation, the
assessment factor and the partition coefficient approaches, respectively; The Af values are the applied AFs (e.g. Af=10).
It should be noted that PNEC values in these registration dossiers, often covering both bulk and
nano forms of the materials, are almost identical to the PNEC values for the corresponding metal
salts as listed in Table 3. In the publically available version of the ECHA registration database it is
not possible to access information which explains the rationale behind using the same PNEC values
for several compounds containing the same metal (as for e.g. CuSO4, CuCl and CuO). However, it is
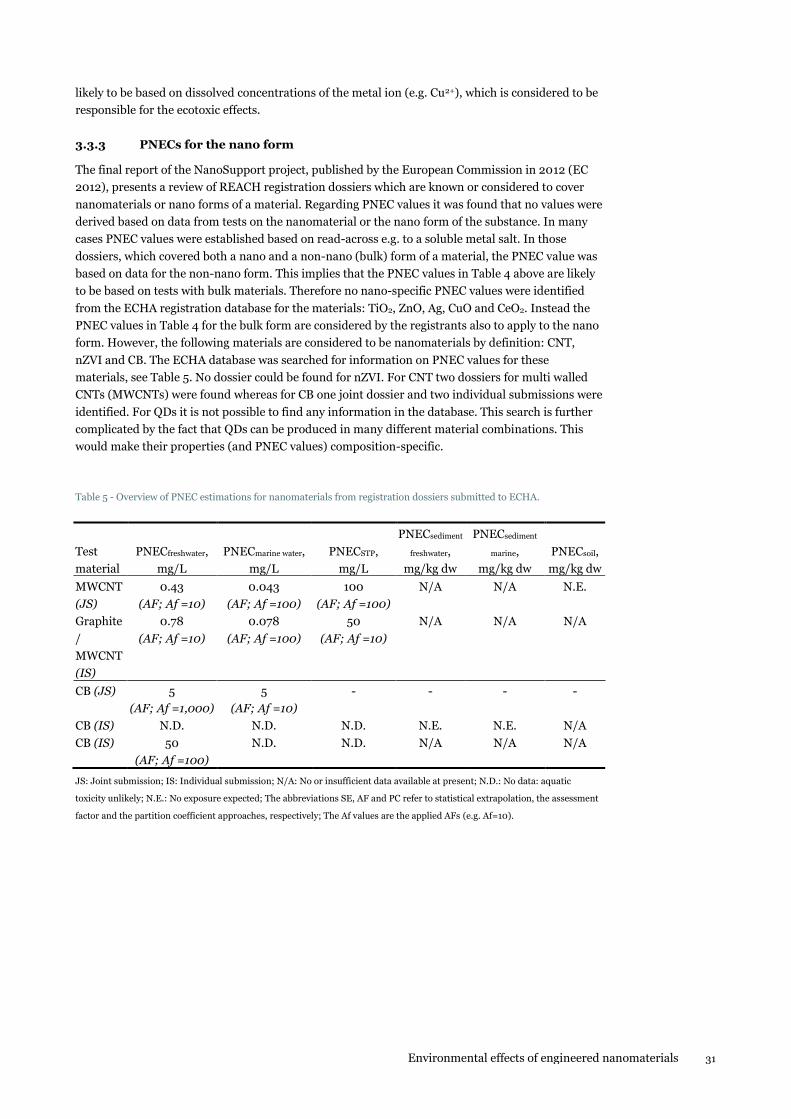
Environmental effects of engineered nanomaterials 31
likely to be based on dissolved concentrations of the metal ion (e.g. Cu2+), which is considered to be
responsible for the ecotoxic effects.
3.3.3 PNECs for the nano form
The final report of the NanoSupport project, published by the European Commission in 2012 (EC
2012), presents a review of REACH registration dossiers which are known or considered to cover
nanomaterials or nano forms of a material. Regarding PNEC values it was found that no values were
derived based on data from tests on the nanomaterial or the nano form of the substance. In many
cases PNEC values were established based on read-across e.g. to a soluble metal salt. In those
dossiers, which covered both a nano and a non-nano (bulk) form of a material, the PNEC value was
based on data for the non-nano form. This implies that the PNEC values in Table 4 above are likely
to be based on tests with bulk materials. Therefore no nano-specific PNEC values were identified
from the ECHA registration database for the materials: TiO2, ZnO, Ag, CuO and CeO2. Instead the
PNEC values in Table 4 for the bulk form are considered by the registrants also to apply to the nano
form. However, the following materials are considered to be nanomaterials by definition: CNT,
nZVI and CB. The ECHA database was searched for information on PNEC values for these
materials, see Table 5. No dossier could be found for nZVI. For CNT two dossiers for multi walled
CNTs (MWCNTs) were found whereas for CB one joint dossier and two individual submissions were
identified. For QDs it is not possible to find any information in the database. This search is further
complicated by the fact that QDs can be produced in many different material combinations. This
would make their properties (and PNEC values) composition-specific.
Table 5 - Overview of PNEC estimations for nanomaterials from registration dossiers submitted to ECHA.
Test
material
PNECfreshwater,
mg/L
PNECmarine water,
mg/L
PNECSTP,
mg/L
PNECsediment
freshwater,
mg/kg dw
PNECsediment
marine,
mg/kg dw
PNECsoil,
mg/kg dw
MWCNT
(JS)
0.43
(AF; Af =10)
0.043
(AF; Af =100)
100
(AF; Af =100)
N/A N/A N.E.
Graphite
/
MWCNT
(IS)
0.78
(AF; Af =10)
0.078
(AF; Af =100)
50
(AF; Af =10)
N/A N/A N/A
CB (JS)
5
(AF; Af =1,000)
5
(AF; Af =10)
- - - -
CB (IS) N.D. N.D. N.D. N.E. N.E. N/A
CB (IS) 50
(AF; Af =100)
N.D. N.D. N/A N/A N/A
JS: Joint submission; IS: Individual submission; N/A: No or insufficient data available at present; N.D.: No data: aquatic
toxicity unlikely; N.E.: No exposure expected; The abbreviations SE, AF and PC refer to statistical extrapolation, the assessment
factor and the partition coefficient approaches, respectively; The Af values are the applied AFs (e.g. Af=10).
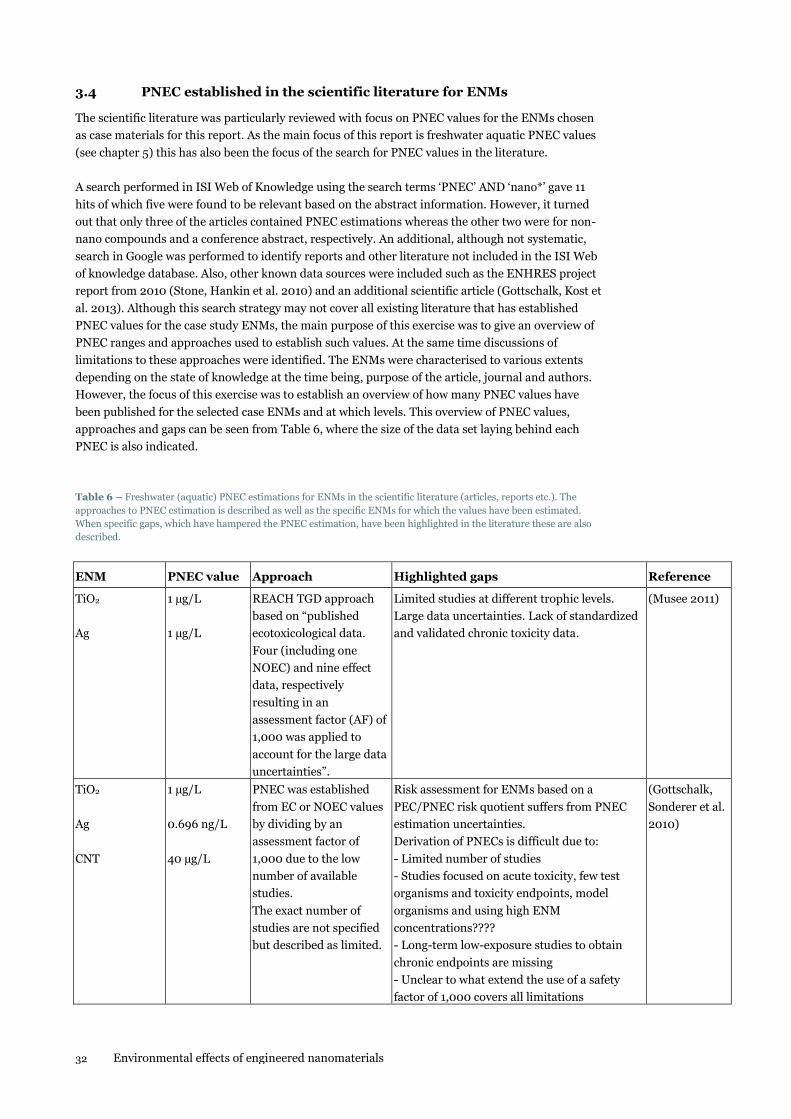
32 Environmental effects of engineered nanomaterials
3.4 PNEC established in the scientific literature for ENMs
The scientific literature was particularly reviewed with focus on PNEC values for the ENMs chosen
as case materials for this report. As the main focus of this report is freshwater aquatic PNEC values
(see chapter 5) this has also been the focus of the search for PNEC values in the literature.
A search performed in ISI Web of Knowledge using the search terms ‘PNEC’ AND ‘nano*’ gave 11
hits of which five were found to be relevant based on the abstract information. However, it turned
out that only three of the articles contained PNEC estimations whereas the other two were for non-
nano compounds and a conference abstract, respectively. An additional, although not systematic,
search in Google was performed to identify reports and other literature not included in the ISI Web
of knowledge database. Also, other known data sources were included such as the ENHRES project
report from 2010 (Stone, Hankin et al. 2010) and an additional scientific article (Gottschalk, Kost et
al. 2013). Although this search strategy may not cover all existing literature that has established
PNEC values for the case study ENMs, the main purpose of this exercise was to give an overview of
PNEC ranges and approaches used to establish such values. At the same time discussions of
limitations to these approaches were identified. The ENMs were characterised to various extents
depending on the state of knowledge at the time being, purpose of the article, journal and authors.
However, the focus of this exercise was to establish an overview of how many PNEC values have
been published for the selected case ENMs and at which levels. This overview of PNEC values,
approaches and gaps can be seen from Table 6, where the size of the data set laying behind each
PNEC is also indicated.
Table 6 – Freshwater (aquatic) PNEC estimations for ENMs in the scientific literature (articles, reports etc.). The
approaches to PNEC estimation is described as well as the specific ENMs for which the values have been estimated.
When specific gaps, which have hampered the PNEC estimation, have been highlighted in the literature these are also
described.
ENM PNEC value Approach Highlighted gaps Reference
TiO2
Ag
1 µg/L
1 µg/L
REACH TGD approach
based on “published
ecotoxicological data.
Four (including one
NOEC) and nine effect
data, respectively
resulting in an
assessment factor (AF) of
1,000 was applied to
account for the large data
uncertainties”.
Limited studies at different trophic levels.
Large data uncertainties. Lack of standardized
and validated chronic toxicity data.
(Musee 2011)
TiO2
Ag
CNT
1 µg/L
0.696 ng/L
40 µg/L
PNEC was established
from EC or NOEC values
by dividing by an
assessment factor of
1,000 due to the low
number of available
studies.
The exact number of
studies are not specified
but described as limited.
Risk assessment for ENMs based on a
PEC/PNEC risk quotient suffers from PNEC
estimation uncertainties.
Derivation of PNECs is difficult due to:
- Limited number of studies
- Studies focused on acute toxicity, few test
organisms and toxicity endpoints, model
organisms and using high ENM
concentrations????
- Long-term low-exposure studies to obtain
chronic endpoints are missing
- Unclear to what extend the use of a safety
factor of 1,000 covers all limitations
(Gottschalk,
Sonderer et al.
2010)
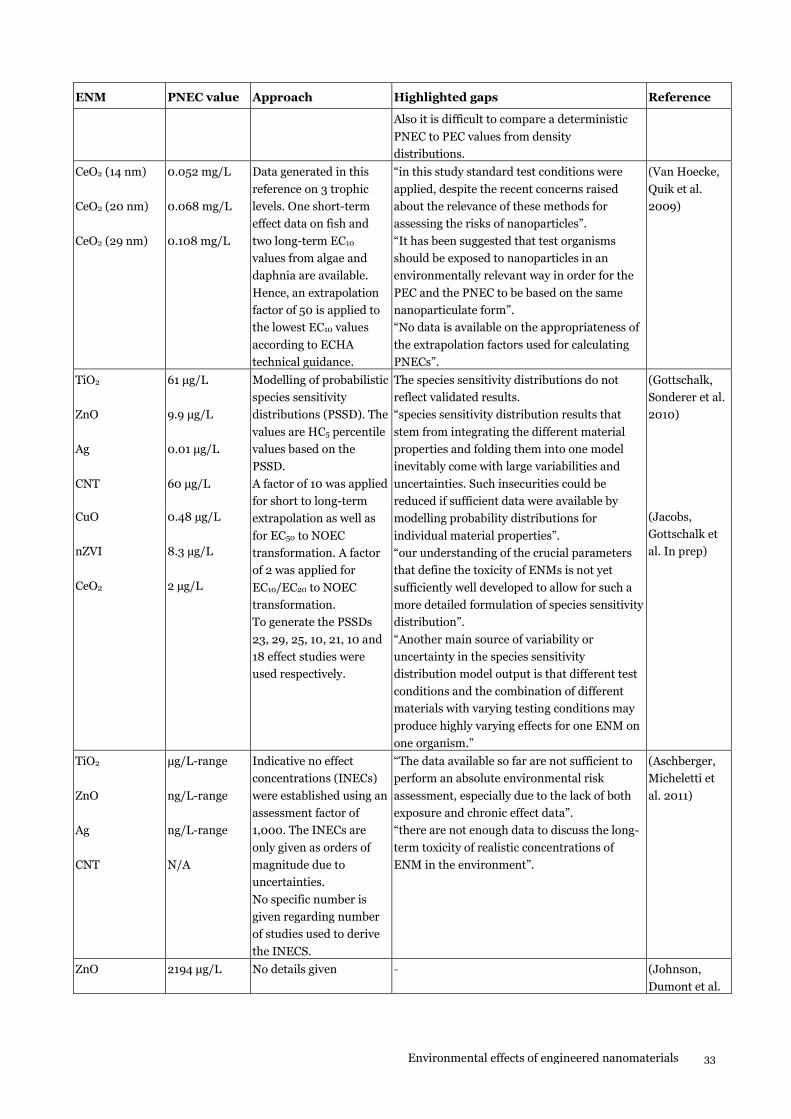
Environmental effects of engineered nanomaterials 33
ENM PNEC value Approach Highlighted gaps Reference
Also it is difficult to compare a deterministic
PNEC to PEC values from density
distributions.
CeO2 (14 nm)
CeO2 (20 nm)
CeO2 (29 nm)
0.052 mg/L
0.068 mg/L
0.108 mg/L
Data generated in this
reference on 3 trophic
levels. One short-term
effect data on fish and
two long-term EC10
values from algae and
daphnia are available.
Hence, an extrapolation
factor of 50 is applied to
the lowest EC10 values
according to ECHA
technical guidance.
“in this study standard test conditions were
applied, despite the recent concerns raised
about the relevance of these methods for
assessing the risks of nanoparticles”.
“It has been suggested that test organisms
should be exposed to nanoparticles in an
environmentally relevant way in order for the
PEC and the PNEC to be based on the same
nanoparticulate form”.
“No data is available on the appropriateness of
the extrapolation factors used for calculating
PNECs”.
(Van Hoecke,
Quik et al.
2009)
TiO2
ZnO
Ag
CNT
61 μg/L
9.9 μg/L
0.01 μg/L
60 μg/L
Modelling of probabilistic
species sensitivity
distributions (PSSD). The
values are HC5 percentile
values based on the
PSSD.
A factor of 10 was applied
for short to long-term
extrapolation as well as
for EC50 to NOEC
transformation. A factor
of 2 was applied for
EC10/EC20 to NOEC
transformation.
To generate the PSSDs
23, 29, 25, 10, 21, 10 and
18 effect studies were
used respectively.
The species sensitivity distributions do not
reflect validated results.
“species sensitivity distribution results that
stem from integrating the different material
properties and folding them into one model
inevitably come with large variabilities and
uncertainties. Such insecurities could be
reduced if sufficient data were available by
modelling probability distributions for
individual material properties”.
“our understanding of the crucial parameters
that define the toxicity of ENMs is not yet
sufficiently well developed to allow for such a
more detailed formulation of species sensitivity
distribution”.
“Another main source of variability or
uncertainty in the species sensitivity
distribution model output is that different test
conditions and the combination of different
materials with varying testing conditions may
produce highly varying effects for one ENM on
one organism.”
(Gottschalk,
Sonderer et al.
2010)
CuO
nZVI
CeO2
0.48 µg/L
8.3 µg/L
2 µg/L
(Jacobs,
Gottschalk et
al. In prep)
TiO2
ZnO
Ag
CNT
μg/L-range
ng/L-range
ng/L-range
N/A
Indicative no effect
concentrations (INECs)
were established using an
assessment factor of
1,000. The INECs are
only given as orders of
magnitude due to
uncertainties.
No specific number is
given regarding number
of studies used to derive
the INECS.
“The data available so far are not sufficient to
perform an absolute environmental risk
assessment, especially due to the lack of both
exposure and chronic effect data”.
“there are not enough data to discuss the long-
term toxicity of realistic concentrations of
ENM in the environment”.
(Aschberger,
Micheletti et
al. 2011)
ZnO
2194 μg/L
No details given - (Johnson,
Dumont et al.
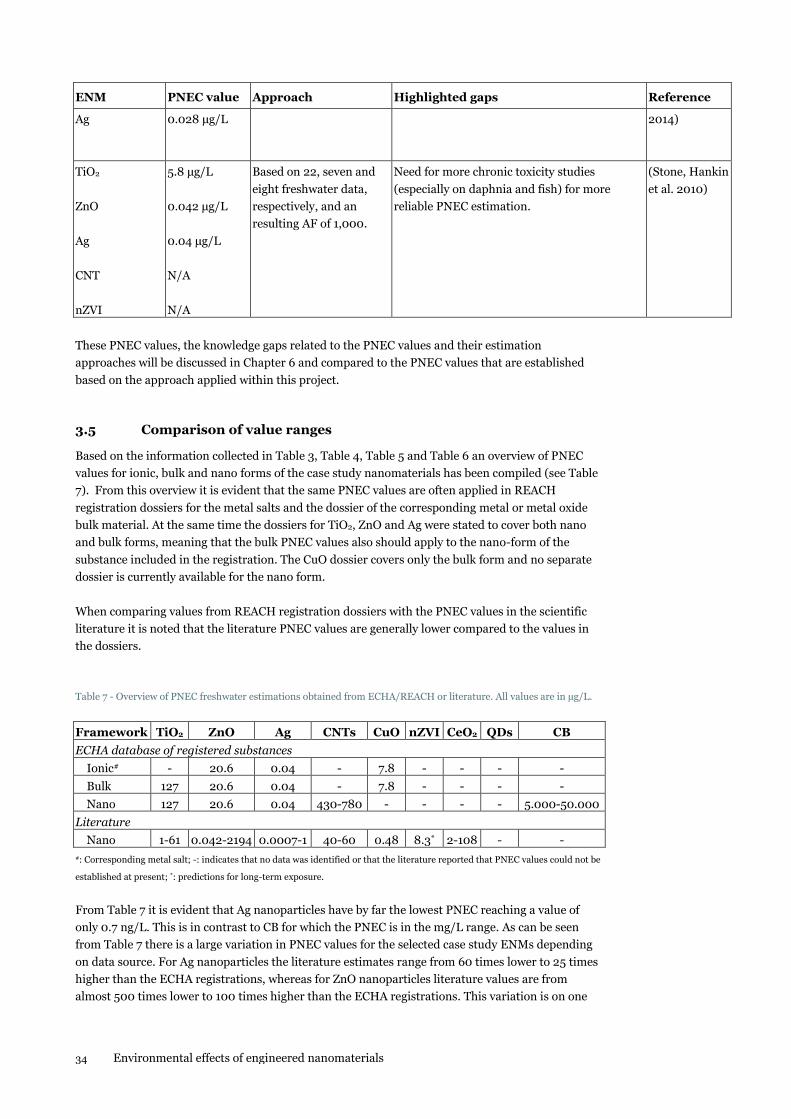
34 Environmental effects of engineered nanomaterials
ENM PNEC value Approach Highlighted gaps Reference
Ag
0.028 μg/L
2014)
TiO2
ZnO
Ag
CNT
nZVI
5.8 μg/L
0.042 μg/L
0.04 μg/L
N/A
N/A
Based on 22, seven and
eight freshwater data,
respectively, and an
resulting AF of 1,000.
Need for more chronic toxicity studies
(especially on daphnia and fish) for more
reliable PNEC estimation.
(Stone, Hankin
et al. 2010)
These PNEC values, the knowledge gaps related to the PNEC values and their estimation
approaches will be discussed in Chapter 6 and compared to the PNEC values that are established
based on the approach applied within this project.
3.5 Comparison of value ranges
Based on the information collected in Table 3, Table 4, Table 5 and Table 6 an overview of PNEC
values for ionic, bulk and nano forms of the case study nanomaterials has been compiled (see Table
7). From this overview it is evident that the same PNEC values are often applied in REACH
registration dossiers for the metal salts and the dossier of the corresponding metal or metal oxide
bulk material. At the same time the dossiers for TiO2, ZnO and Ag were stated to cover both nano
and bulk forms, meaning that the bulk PNEC values also should apply to the nano-form of the
substance included in the registration. The CuO dossier covers only the bulk form and no separate
dossier is currently available for the nano form.
When comparing values from REACH registration dossiers with the PNEC values in the scientific
literature it is noted that the literature PNEC values are generally lower compared to the values in
the dossiers.
Table 7 - Overview of PNEC freshwater estimations obtained from ECHA/REACH or literature. All values are in µg/L.
Framework TiO2 ZnO Ag CNTs CuO nZVI CeO2 QDs CB
ECHA database of registered substances
Ionic# - 20.6 0.04 - 7.8 - - - -
Bulk 127 20.6 0.04 - 7.8 - - - -
Nano 127 20.6 0.04 430-780 - - - - 5.000-50.000
Literature
Nano 1-61 0.042-2194 0.0007-1 40-60 0.48 8.3* 2-108 - -
#: Corresponding metal salt; -: indicates that no data was identified or that the literature reported that PNEC values could not be
established at present; *: predictions for long-term exposure.
From Table 7 it is evident that Ag nanoparticles have by far the lowest PNEC reaching a value of
only 0.7 ng/L. This is in contrast to CB for which the PNEC is in the mg/L range. As can be seen
from Table 7 there is a large variation in PNEC values for the selected case study ENMs depending
on data source. For Ag nanoparticles the literature estimates range from 60 times lower to 25 times
higher than the ECHA registrations, whereas for ZnO nanoparticles literature values are from
almost 500 times lower to 100 times higher than the ECHA registrations. This variation is on one
Environmental effects of engineered nanomaterials 35
hand due to some of the uncertainties and lack of data as highlighted above and thereby influenced
of the choice of assessment factors which can change the resulting PNEC value by orders of
magnitude.
On the other hand, the differences in the PNEC values for ENMs in Table 7 also reflect the
importance of data selection for deriving PNEC values. This crucial step in the effect assessment is
often difficult to evaluate and the literature review revealed an urgent need for a more transparent
data selection and assessment of data adequacy for regulatory purposes. Prior to the estimation of
PNEC values for ENMs is it therefore necessary to ensure that the data selected is indeed both
reliable and relevant for this purpose. Since no specific guidelines for data selection of effect data
for risk assessment purposes exist, it was found necessary to develop a set of evaluation criteria as
will be described in Chapter 4.
36 Environmental effects of engineered nanomaterials
4. A concept for evaluation of ecotoxicological data for ENMs
When evaluating available information on chemicals in the context of risk assessment under
REACH the following elements are included in the assessment of data quality: reliability, relevance
and adequacy. These terms have been defined by Klimisch, Andreae et al. (1997) as follows:
Reliability: Evaluating the inherent quality of a test report or publication relating to
preferably standardised methodology and the way the experimental procedure and results
are described to give evidence of the clarity and plausibility of the findings.
Relevance: Covering the extent to which data and tests are appropriate for a particular
hazard identification or risk characterisation.
Adequacy: Defining the usefulness of data for hazard/risk assessment purposes. Where
there is more than one study for each endpoint, the greatest weight is attached to the studies
that are the most relevant and reliable. For each endpoint, robust summaries need to be
prepared for the key studies.
It is common practice that an ecotoxicological test result is considered more valid for regulatory use
if it is obtained according to accepted and validated guidelines and even better if the laboratory
conduct the study according to Good Laboratory Practice (GLP). Such accepted and validated
guidelines could be international, e.g. ISO or OECD, or national e.g. DIN, ASTM or TNO, and they
exist by the dozen. It is scientifically and ethically sound and reasonable to establish and follow such
guidelines, as it will reduce costs and use of experimental organisms, thereby enabling different
regulatory bodies to trust and accept previously derived ecotoxicological effect data according to the
MAD principles. At the same time the use of standardised guidelines facilitates reproducibility of
the test and comparability across substances (Ågerstrand, Breitholtz et al. 2011).
Klimisch, Andreae et al. (1997) developed a systematic approach to evaluate ecotoxicological effect
data, with main emphasis on the extent to which the study followed guidelines and GLP. Today the
Klimisch score is routinely applied to ecotoxicological studies submitted in technical dossiers to
regulatory bodies by classifying them as reliable (K1-2) or not (K3-4). This has the purpose of
assisting the assessor in the risk assessment procedure especially in the case where several (and
potentially conflicting) data is available. The data relevance is subsequently assessed based on
expert judgement in light of e.g. applicability of the data for the purpose of the specific hazard
identification or risk assessment, environmental realism of testing strategy, consideration of test
substance properties in the test design and usefulness of information obtained from tests on non-
standard organisms. Based on reliability and relevance the study is then deemed adequate or not
adequate for the specific regulatory purpose.
Environmental effects of engineered nanomaterials 37
4.1 Guideline versus non-guideline test methodologies
The majority of current ecotoxicological test guidelines have been developed for testing of
traditional chemicals, with a focus on narcotic and polar narcotic chemicals, where the test set-up is
not expected to have critical influence on the speciation of the tested chemical. Reactive chemicals
and specifically acting chemicals require more attention. For pharmaceuticals, for example,
guideline testing may not be sufficiently sensitive and modified test systems (set-up as well as
organisms) can provide valuable additional information to the risk assessment process (Ågerstrand,
Breitholtz et al. 2011). Nevertheless, authorities still require pharmaceuticals tested according to
guideline test methods. Similarly it can be argued that ecotoxicity data on ENMs produced using
guideline tests may not be sufficiently sensitive. ENMs are known to behave very differently in
ecotoxicity test systems compared to soluble chemicals, for which the guidelines were intended.
However, nanoparticles do not dissolve in water; they form a suspension, agglomerate and/or
release dissolved chemical species. This is the case for well-known ENMs like ZnO-NP, CuO-NP,
and Ag-NP for which the relationship between the particulate and dissolved species of the metals
remain a discussion when results of ecotoxicity studies are evaluated.
All of the ENM transformation processes that may occur before and during ecotoxicity testing may
change the exposure in both qualitative and quantitative terms, see e.g. Hartmann, Skjolding et al.
(2014). ENMs may thus have properties that are much different from traditional chemicals. Hence
there is a risk of inducing test artefacts when applying these guidelines to ENMs. Currently
established guidelines derived for testing of traditional chemicals thus need adaptation or re-design
in order to make them suitable for testing ENMs. Work is ongoing within the OECD to develop
nano-specific guidance but until then regulatory testing will continue to rely on existing test
guidance. At present, however the use of guideline test methods, and thereby classification as K1
according to the Klimisch score, does not necessarily imply that the data is adequate for ERA of
ENMs.
4.2 Evaluating the adequacy of ecotoxicity studies for ENMs
For the purpose of this work, a method was developed for assigning the adequacy of
ecotoxicological studies of ENMs using a two-dimensional scoring system. A graphical illustration is
shown in Figure 2. The method was developed based on an approach for evaluation of ecotoxicity
data as developed and described by Moermond, Kase et al. (In prep). The first dimension is based
on the method suggested by Moermond, Kase et al. (In prep) to assign a score for data reliability
(Ri1-Ri4) but modified to include additional criteria for exposure characterisation in the test
system, resulting in a modified ‘nano-reliability’ score (nRi1-nRi4). The second dimension relates to
the relevance (Re1-Re4). The relevance scores and criteria are not considered to be different from
those of conventional chemicals as they do not refer to the inherent properties of the test material
or test system but rather address the data in the context of its use in e.g. risk assessment. We have
therefore adopted the relevance criteria as proposed by Moermond, Kase et al. (In prep). The
purpose was to develop a structured, transparent and reproducible approach to assist the expert
judgement needed to assess the adequacy of ecotoxicological studies of ENMs for regulatory use.
This approach aims at being applicable to evaluate both guideline and non-guideline studies. This
represents a significant deviation from the currently used Klimisch score approach which inherently
favours the use of guideline tests.
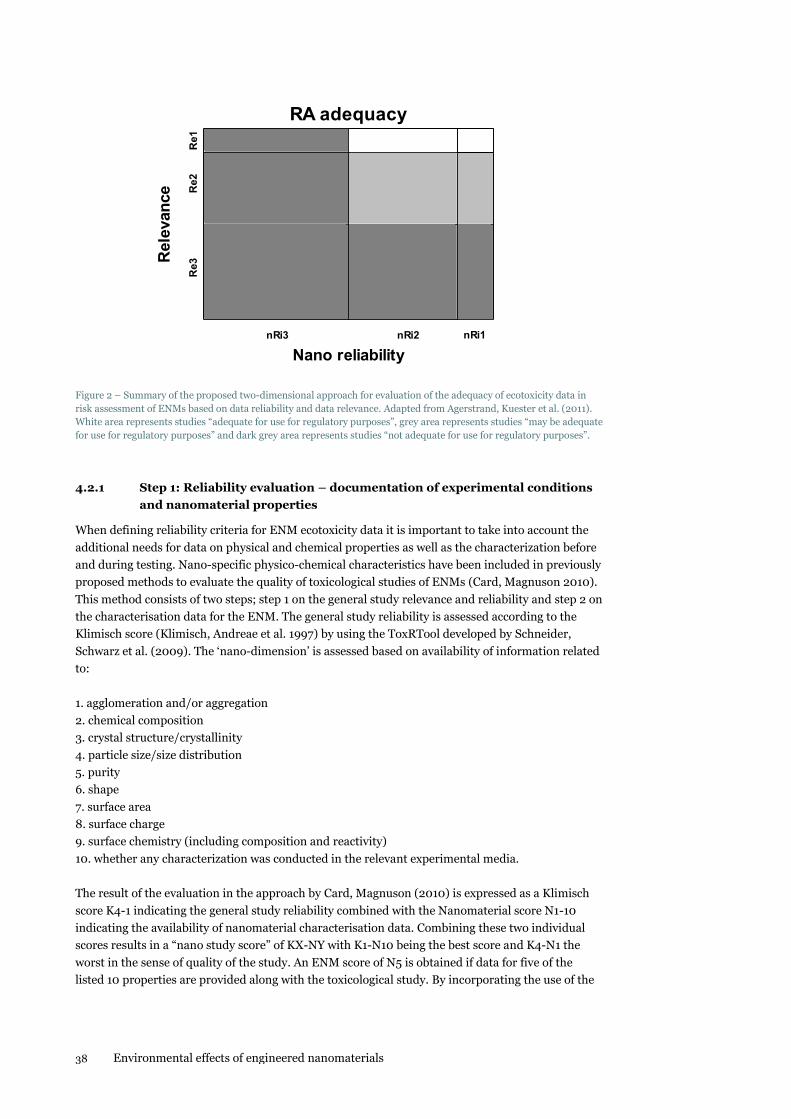
38 Environmental effects of engineered nanomaterials
RA adequacy
20
30
40
50
60
70
80
90
100
Re1
Re2
Re3
nRi1nRi2nRi3
Nano reliability
Rele
van
ce
Figure 2 – Summary of the proposed two-dimensional approach for evaluation of the adequacy of ecotoxicity data in
risk assessment of ENMs based on data reliability and data relevance. Adapted from Agerstrand, Kuester et al. (2011).
White area represents studies “adequate for use for regulatory purposes”, grey area represents studies “may be adequate
for use for regulatory purposes” and dark grey area represents studies “not adequate for use for regulatory purposes”.
4.2.1 Step 1: Reliability evaluation – documentation of experimental conditions
and nanomaterial properties
When defining reliability criteria for ENM ecotoxicity data it is important to take into account the
additional needs for data on physical and chemical properties as well as the characterization before
and during testing. Nano-specific physico-chemical characteristics have been included in previously
proposed methods to evaluate the quality of toxicological studies of ENMs (Card, Magnuson 2010).
This method consists of two steps; step 1 on the general study relevance and reliability and step 2 on
the characterisation data for the ENM. The general study reliability is assessed according to the
Klimisch score (Klimisch, Andreae et al. 1997) by using the ToxRTool developed by Schneider,
Schwarz et al. (2009). The ‘nano-dimension’ is assessed based on availability of information related
to:
1. agglomeration and/or aggregation
2. chemical composition
3. crystal structure/crystallinity
4. particle size/size distribution
5. purity
6. shape
7. surface area
8. surface charge
9. surface chemistry (including composition and reactivity)
10. whether any characterization was conducted in the relevant experimental media.
The result of the evaluation in the approach by Card, Magnuson (2010) is expressed as a Klimisch
score K4-1 indicating the general study reliability combined with the Nanomaterial score N1-10
indicating the availability of nanomaterial characterisation data. Combining these two individual
scores results in a “nano study score” of KX-NY with K1-N10 being the best score and K4-N1 the
worst in the sense of quality of the study. An ENM score of N5 is obtained if data for five of the
listed 10 properties are provided along with the toxicological study. By incorporating the use of the
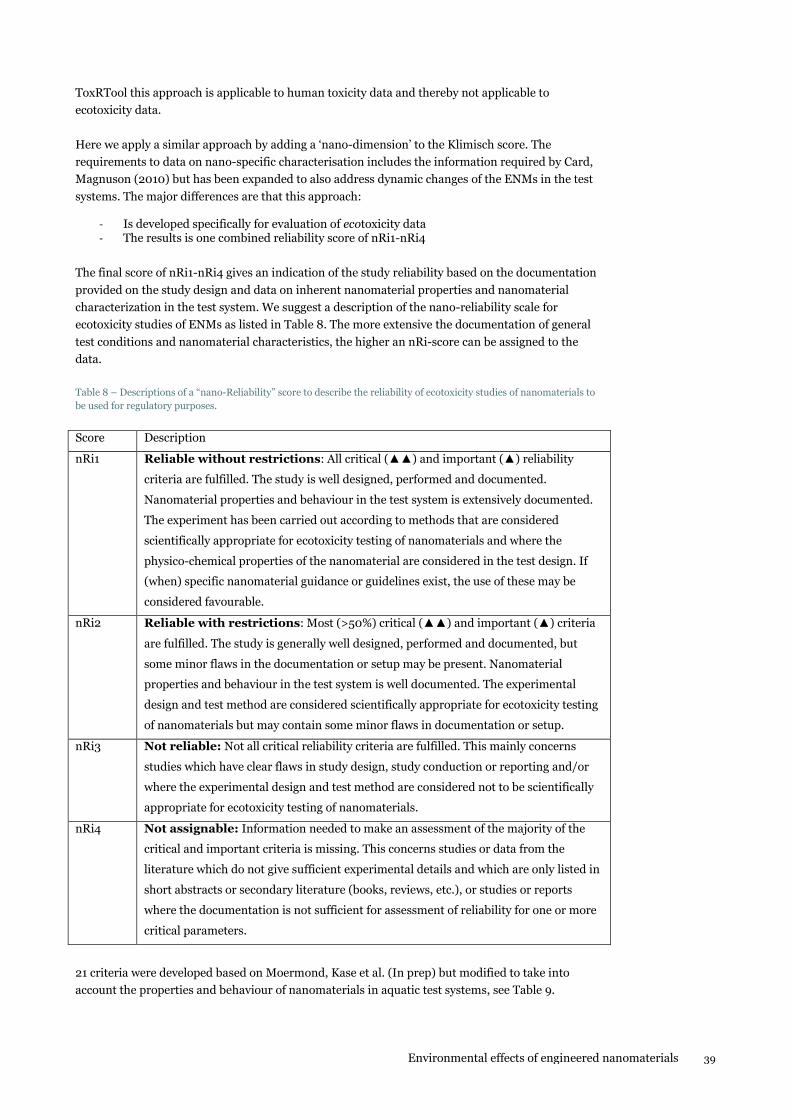
Environmental effects of engineered nanomaterials 39
ToxRTool this approach is applicable to human toxicity data and thereby not applicable to
ecotoxicity data.
Here we apply a similar approach by adding a ‘nano-dimension’ to the Klimisch score. The
requirements to data on nano-specific characterisation includes the information required by Card,
Magnuson (2010) but has been expanded to also address dynamic changes of the ENMs in the test
systems. The major differences are that this approach:
- Is developed specifically for evaluation of ecotoxicity data - The results is one combined reliability score of nRi1-nRi4
The final score of nRi1-nRi4 gives an indication of the study reliability based on the documentation
provided on the study design and data on inherent nanomaterial properties and nanomaterial
characterization in the test system. We suggest a description of the nano-reliability scale for
ecotoxicity studies of ENMs as listed in Table 8. The more extensive the documentation of general
test conditions and nanomaterial characteristics, the higher an nRi-score can be assigned to the
data.
Table 8 – Descriptions of a “nano-Reliability” score to describe the reliability of ecotoxicity studies of nanomaterials to
be used for regulatory purposes.
Score Description
nRi1 Reliable without restrictions: All critical (▲▲) and important (▲) reliability
criteria are fulfilled. The study is well designed, performed and documented.
Nanomaterial properties and behaviour in the test system is extensively documented.
The experiment has been carried out according to methods that are considered
scientifically appropriate for ecotoxicity testing of nanomaterials and where the
physico-chemical properties of the nanomaterial are considered in the test design. If
(when) specific nanomaterial guidance or guidelines exist, the use of these may be
considered favourable.
nRi2 Reliable with restrictions: Most (>50%) critical (▲▲) and important (▲) criteria
are fulfilled. The study is generally well designed, performed and documented, but
some minor flaws in the documentation or setup may be present. Nanomaterial
properties and behaviour in the test system is well documented. The experimental
design and test method are considered scientifically appropriate for ecotoxicity testing
of nanomaterials but may contain some minor flaws in documentation or setup.
nRi3 Not reliable: Not all critical reliability criteria are fulfilled. This mainly concerns
studies which have clear flaws in study design, study conduction or reporting and/or
where the experimental design and test method are considered not to be scientifically
appropriate for ecotoxicity testing of nanomaterials.
nRi4 Not assignable: Information needed to make an assessment of the majority of the
critical and important criteria is missing. This concerns studies or data from the
literature which do not give sufficient experimental details and which are only listed in
short abstracts or secondary literature (books, reviews, etc.), or studies or reports
where the documentation is not sufficient for assessment of reliability for one or more
critical parameters.
21 criteria were developed based on Moermond, Kase et al. (In prep) but modified to take into
account the properties and behaviour of nanomaterials in aquatic test systems, see Table 9.
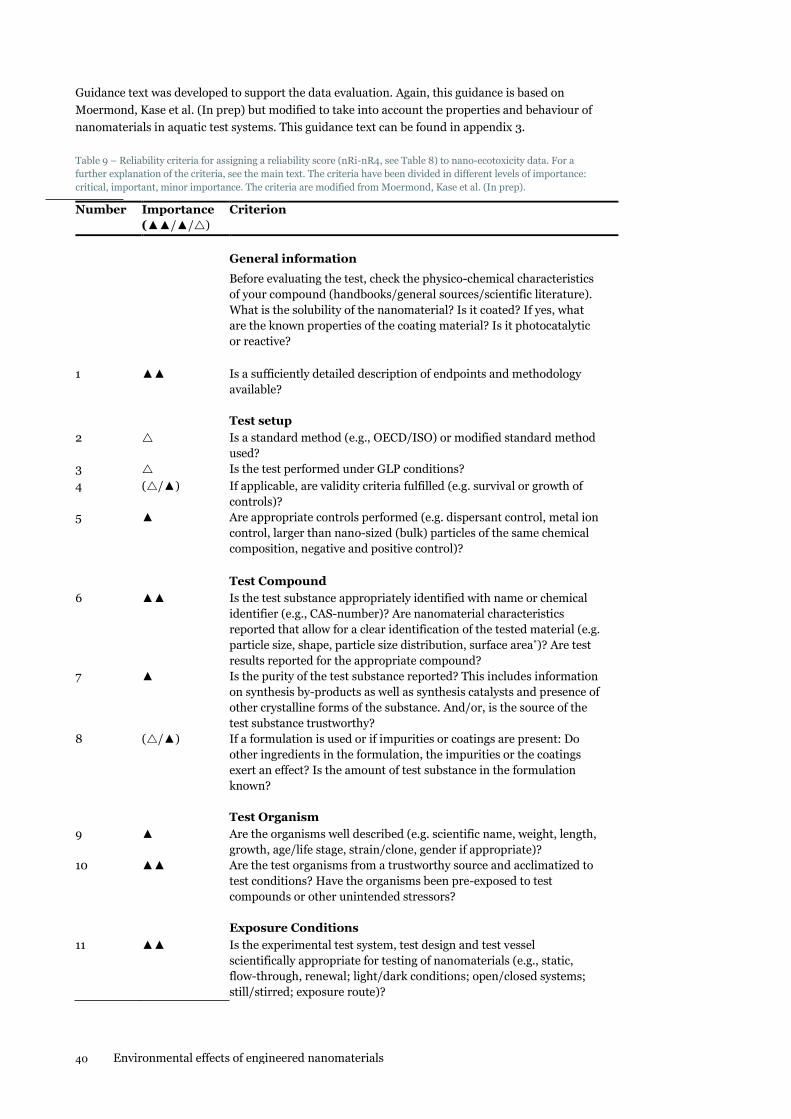
40 Environmental effects of engineered nanomaterials
Guidance text was developed to support the data evaluation. Again, this guidance is based on
Moermond, Kase et al. (In prep) but modified to take into account the properties and behaviour of
nanomaterials in aquatic test systems. This guidance text can be found in appendix 3.
Table 9 – Reliability criteria for assigning a reliability score (nRi-nR4, see Table 8) to nano-ecotoxicity data. For a
further explanation of the criteria, see the main text. The criteria have been divided in different levels of importance:
critical, important, minor importance. The criteria are modified from Moermond, Kase et al. (In prep).
Number Importance
(▲▲/▲/)
Criterion
General information
Before evaluating the test, check the physico-chemical characteristics
of your compound (handbooks/general sources/scientific literature).
What is the solubility of the nanomaterial? Is it coated? If yes, what
are the known properties of the coating material? Is it photocatalytic
or reactive?
1 ▲▲ Is a sufficiently detailed description of endpoints and methodology
available?
Test setup
2 Is a standard method (e.g., OECD/ISO) or modified standard method
used?
3 Is the test performed under GLP conditions?
4 (/▲) If applicable, are validity criteria fulfilled (e.g. survival or growth of
controls)?
5 ▲ Are appropriate controls performed (e.g. dispersant control, metal ion
control, larger than nano-sized (bulk) particles of the same chemical
composition, negative and positive control)?
Test Compound
6 ▲▲ Is the test substance appropriately identified with name or chemical
identifier (e.g., CAS-number)? Are nanomaterial characteristics
reported that allow for a clear identification of the tested material (e.g.
particle size, shape, particle size distribution, surface area*)? Are test
results reported for the appropriate compound?
7 ▲ Is the purity of the test substance reported? This includes information
on synthesis by-products as well as synthesis catalysts and presence of
other crystalline forms of the substance. And/or, is the source of the
test substance trustworthy?
8 (/▲) If a formulation is used or if impurities or coatings are present: Do
other ingredients in the formulation, the impurities or the coatings
exert an effect? Is the amount of test substance in the formulation
known?
Test Organism
9 ▲ Are the organisms well described (e.g. scientific name, weight, length,
growth, age/life stage, strain/clone, gender if appropriate)?
10 ▲▲ Are the test organisms from a trustworthy source and acclimatized to
test conditions? Have the organisms been pre-exposed to test
compounds or other unintended stressors?
Exposure Conditions
11 ▲▲ Is the experimental test system, test design and test vessel
scientifically appropriate for testing of nanomaterials (e.g., static,
flow-through, renewal; light/dark conditions; open/closed systems;
still/stirred; exposure route)?
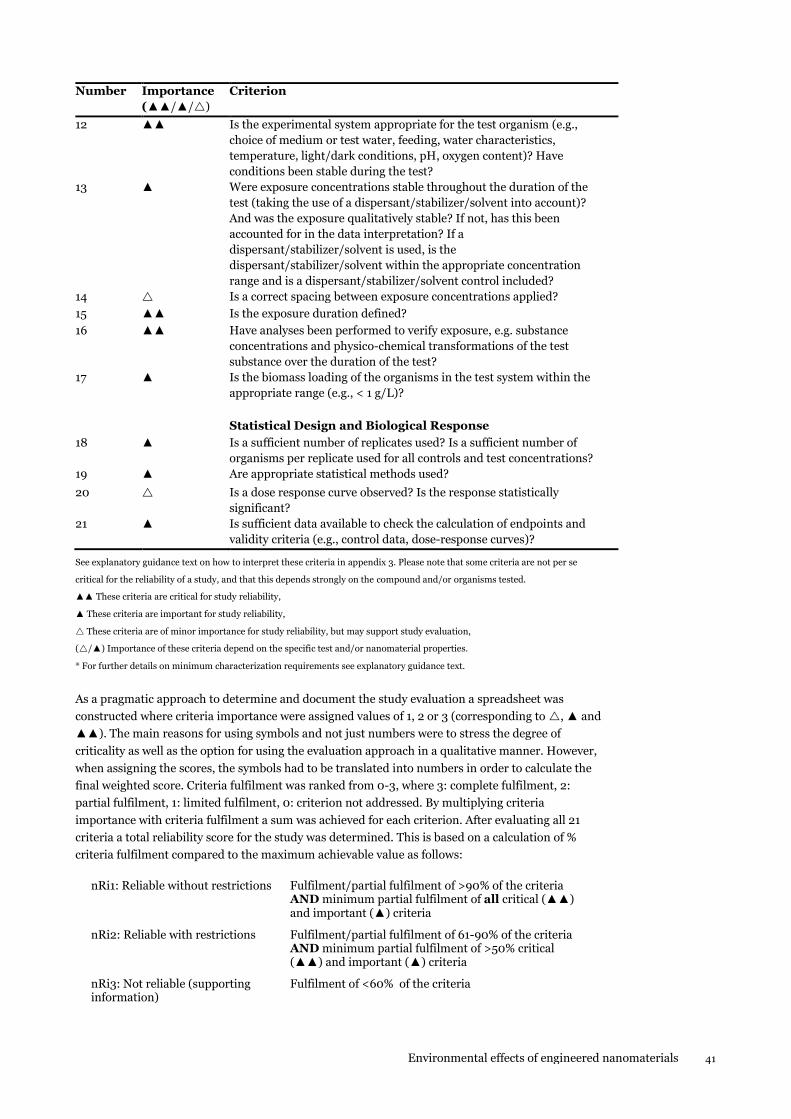
Environmental effects of engineered nanomaterials 41
Number Importance
(▲▲/▲/)
Criterion
12 ▲▲ Is the experimental system appropriate for the test organism (e.g.,
choice of medium or test water, feeding, water characteristics,
temperature, light/dark conditions, pH, oxygen content)? Have
conditions been stable during the test?
13 ▲ Were exposure concentrations stable throughout the duration of the
test (taking the use of a dispersant/stabilizer/solvent into account)?
And was the exposure qualitatively stable? If not, has this been
accounted for in the data interpretation? If a
dispersant/stabilizer/solvent is used, is the
dispersant/stabilizer/solvent within the appropriate concentration
range and is a dispersant/stabilizer/solvent control included?
14 Is a correct spacing between exposure concentrations applied?
15 ▲▲ Is the exposure duration defined?
16 ▲▲ Have analyses been performed to verify exposure, e.g. substance
concentrations and physico-chemical transformations of the test
substance over the duration of the test?
17 ▲ Is the biomass loading of the organisms in the test system within the
appropriate range (e.g., < 1 g/L)?
Statistical Design and Biological Response
18 ▲ Is a sufficient number of replicates used? Is a sufficient number of
organisms per replicate used for all controls and test concentrations?
19 ▲ Are appropriate statistical methods used?
20 Is a dose response curve observed? Is the response statistically
significant?
21 ▲ Is sufficient data available to check the calculation of endpoints and
validity criteria (e.g., control data, dose-response curves)?
See explanatory guidance text on how to interpret these criteria in appendix 3. Please note that some criteria are not per se
critical for the reliability of a study, and that this depends strongly on the compound and/or organisms tested.
▲▲ These criteria are critical for study reliability,
▲ These criteria are important for study reliability,
These criteria are of minor importance for study reliability, but may support study evaluation,
(/▲) Importance of these criteria depend on the specific test and/or nanomaterial properties.
* For further details on minimum characterization requirements see explanatory guidance text.
As a pragmatic approach to determine and document the study evaluation a spreadsheet was
constructed where criteria importance were assigned values of 1, 2 or 3 (corresponding to , ▲ and
▲▲). The main reasons for using symbols and not just numbers were to stress the degree of
criticality as well as the option for using the evaluation approach in a qualitative manner. However,
when assigning the scores, the symbols had to be translated into numbers in order to calculate the
final weighted score. Criteria fulfilment was ranked from 0-3, where 3: complete fulfilment, 2:
partial fulfilment, 1: limited fulfilment, 0: criterion not addressed. By multiplying criteria
importance with criteria fulfilment a sum was achieved for each criterion. After evaluating all 21
criteria a total reliability score for the study was determined. This is based on a calculation of %
criteria fulfilment compared to the maximum achievable value as follows:
nRi1: Reliable without restrictions Fulfilment/partial fulfilment of >90% of the criteria
AND minimum partial fulfilment of all critical (▲▲) and important (▲) criteria
nRi2: Reliable with restrictions Fulfilment/partial fulfilment of 61-90% of the criteria AND minimum partial fulfilment of >50% critical (▲▲) and important (▲) criteria
nRi3: Not reliable (supporting information)
Fulfilment of <60% of the criteria
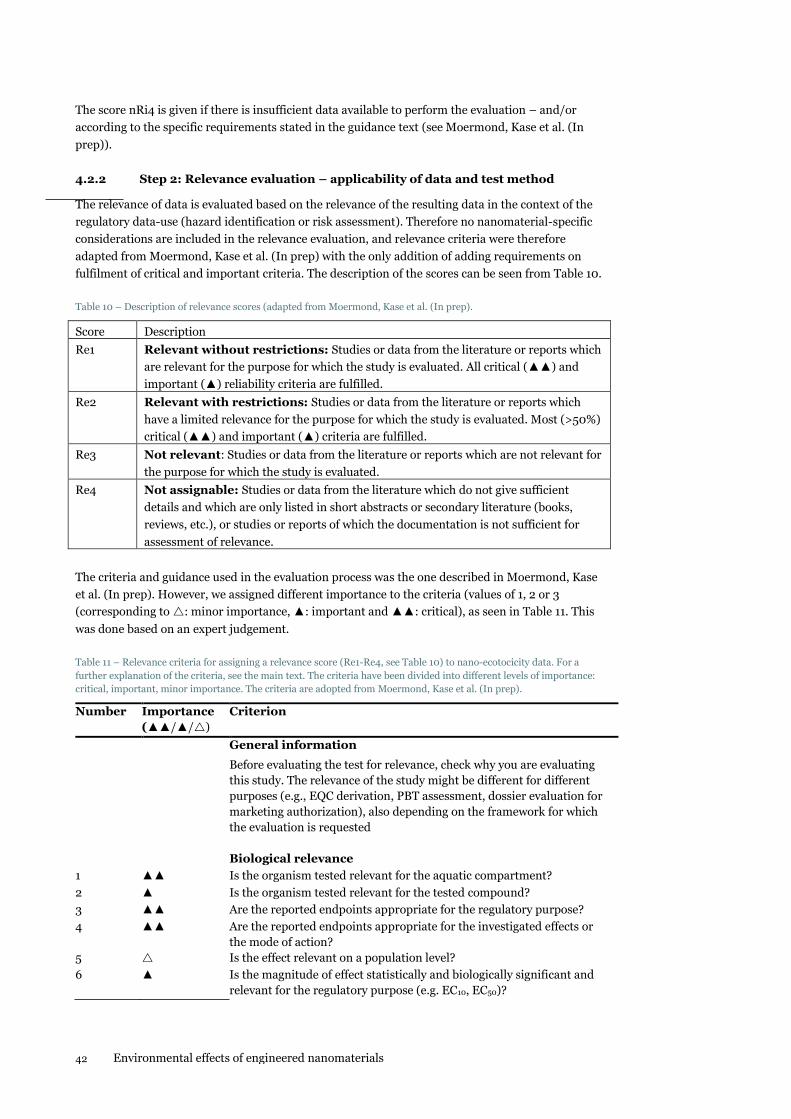
42 Environmental effects of engineered nanomaterials
The score nRi4 is given if there is insufficient data available to perform the evaluation – and/or
according to the specific requirements stated in the guidance text (see Moermond, Kase et al. (In
prep)).
4.2.2 Step 2: Relevance evaluation – applicability of data and test method
The relevance of data is evaluated based on the relevance of the resulting data in the context of the
regulatory data-use (hazard identification or risk assessment). Therefore no nanomaterial-specific
considerations are included in the relevance evaluation, and relevance criteria were therefore
adapted from Moermond, Kase et al. (In prep) with the only addition of adding requirements on
fulfilment of critical and important criteria. The description of the scores can be seen from Table 10.
Table 10 – Description of relevance scores (adapted from Moermond, Kase et al. (In prep).
Score Description
Re1 Relevant without restrictions: Studies or data from the literature or reports which
are relevant for the purpose for which the study is evaluated. All critical (▲▲) and
important (▲) reliability criteria are fulfilled.
Re2 Relevant with restrictions: Studies or data from the literature or reports which
have a limited relevance for the purpose for which the study is evaluated. Most (>50%)
critical (▲▲) and important (▲) criteria are fulfilled.
Re3 Not relevant: Studies or data from the literature or reports which are not relevant for
the purpose for which the study is evaluated.
Re4 Not assignable: Studies or data from the literature which do not give sufficient
details and which are only listed in short abstracts or secondary literature (books,
reviews, etc.), or studies or reports of which the documentation is not sufficient for
assessment of relevance.
The criteria and guidance used in the evaluation process was the one described in Moermond, Kase
et al. (In prep). However, we assigned different importance to the criteria (values of 1, 2 or 3
(corresponding to : minor importance, ▲: important and ▲▲: critical), as seen in Table 11. This
was done based on an expert judgement.
Table 11 – Relevance criteria for assigning a relevance score (Re1-Re4, see Table 10) to nano-ecotocicity data. For a
further explanation of the criteria, see the main text. The criteria have been divided into different levels of importance:
critical, important, minor importance. The criteria are adopted from Moermond, Kase et al. (In prep).
Number Importance
(▲▲/▲/)
Criterion
General information
Before evaluating the test for relevance, check why you are evaluating
this study. The relevance of the study might be different for different
purposes (e.g., EQC derivation, PBT assessment, dossier evaluation for
marketing authorization), also depending on the framework for which
the evaluation is requested
Biological relevance
1 ▲▲ Is the organism tested relevant for the aquatic compartment?
2 ▲ Is the organism tested relevant for the tested compound?
3 ▲▲ Are the reported endpoints appropriate for the regulatory purpose?
4 ▲▲ Are the reported endpoints appropriate for the investigated effects or
the mode of action?
5 Is the effect relevant on a population level?
6 ▲ Is the magnitude of effect statistically and biologically significant and
relevant for the regulatory purpose (e.g. EC10, EC50)?
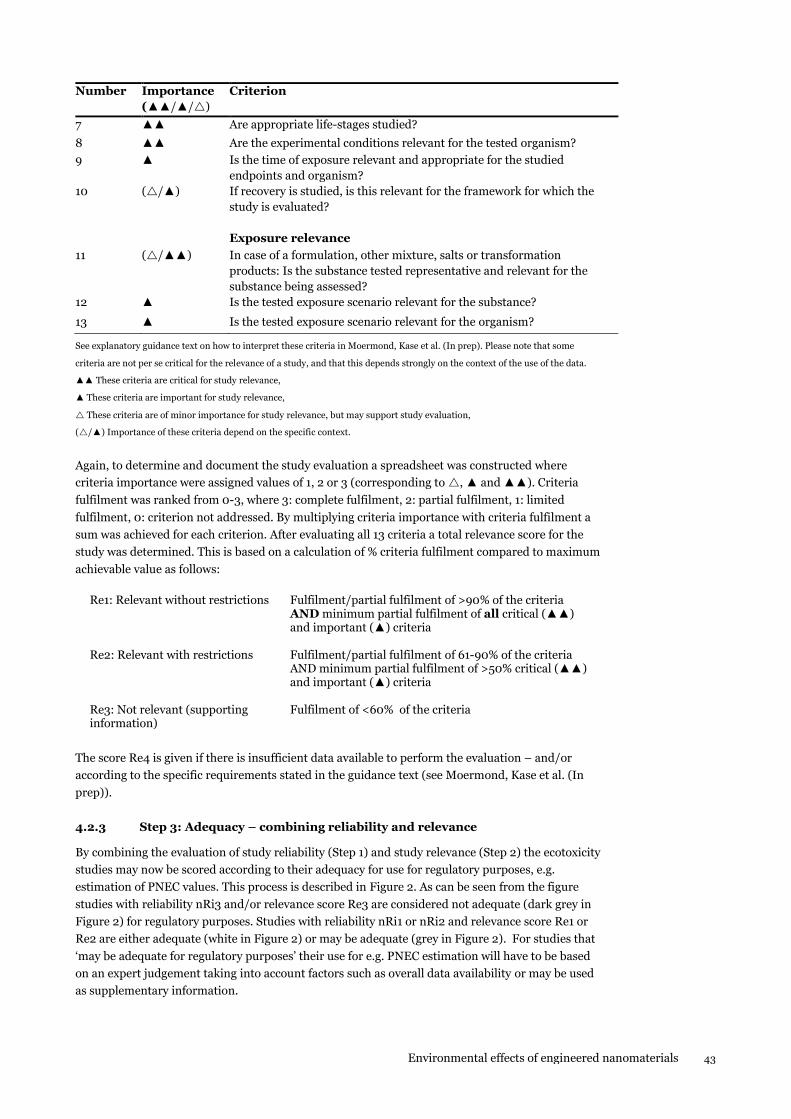
Environmental effects of engineered nanomaterials 43
Number Importance
(▲▲/▲/)
Criterion
7 ▲▲ Are appropriate life-stages studied?
8 ▲▲ Are the experimental conditions relevant for the tested organism?
9 ▲ Is the time of exposure relevant and appropriate for the studied
endpoints and organism?
10 (/▲) If recovery is studied, is this relevant for the framework for which the
study is evaluated?
Exposure relevance
11 (/▲▲) In case of a formulation, other mixture, salts or transformation
products: Is the substance tested representative and relevant for the
substance being assessed?
12 ▲ Is the tested exposure scenario relevant for the substance?
13 ▲ Is the tested exposure scenario relevant for the organism?
See explanatory guidance text on how to interpret these criteria in Moermond, Kase et al. (In prep). Please note that some
criteria are not per se critical for the relevance of a study, and that this depends strongly on the context of the use of the data.
▲▲ These criteria are critical for study relevance,
▲ These criteria are important for study relevance,
These criteria are of minor importance for study relevance, but may support study evaluation,
(/▲) Importance of these criteria depend on the specific context.
Again, to determine and document the study evaluation a spreadsheet was constructed where
criteria importance were assigned values of 1, 2 or 3 (corresponding to , ▲ and ▲▲). Criteria
fulfilment was ranked from 0-3, where 3: complete fulfilment, 2: partial fulfilment, 1: limited
fulfilment, 0: criterion not addressed. By multiplying criteria importance with criteria fulfilment a
sum was achieved for each criterion. After evaluating all 13 criteria a total relevance score for the
study was determined. This is based on a calculation of % criteria fulfilment compared to maximum
achievable value as follows:
Re1: Relevant without restrictions Fulfilment/partial fulfilment of >90% of the criteria
AND minimum partial fulfilment of all critical (▲▲) and important (▲) criteria
Re2: Relevant with restrictions Fulfilment/partial fulfilment of 61-90% of the criteria AND minimum partial fulfilment of >50% critical (▲▲) and important (▲) criteria
Re3: Not relevant (supporting information)
Fulfilment of <60% of the criteria
The score Re4 is given if there is insufficient data available to perform the evaluation – and/or
according to the specific requirements stated in the guidance text (see Moermond, Kase et al. (In
prep)).
4.2.3 Step 3: Adequacy – combining reliability and relevance
By combining the evaluation of study reliability (Step 1) and study relevance (Step 2) the ecotoxicity
studies may now be scored according to their adequacy for use for regulatory purposes, e.g.
estimation of PNEC values. This process is described in Figure 2. As can be seen from the figure
studies with reliability nRi3 and/or relevance score Re3 are considered not adequate (dark grey in
Figure 2) for regulatory purposes. Studies with reliability nRi1 or nRi2 and relevance score Re1 or
Re2 are either adequate (white in Figure 2) or may be adequate (grey in Figure 2). For studies that
‘may be adequate for regulatory purposes’ their use for e.g. PNEC estimation will have to be based
on an expert judgement taking into account factors such as overall data availability or may be used
as supplementary information.
44 Environmental effects of engineered nanomaterials
4.3 Recommendations and limitations for PNEC estimation for ENMs
As also highlighted by Som et al. (2012) the “quality of published data is crucial for the process of
risk assessment”. This is true for both conventional and alternative approaches to PNEC estimation
and risk characterisation.
In the former sections we have outlined the current methodologies for deriving PNEC values as well
as outlining alternative approaches. The various benefits and drawbacks of the different approaches
have been discussed. There has not been evidence for the need for developing a totally different
approach for deriving PNEC values, in other words, the current methods may work just as well as a
new concept. A general and underlying assumption is that solid and valid effect data for deriving
proper PNEC values are available. We have furthermore discussed the challenges and obvious
problems regarding the current framework for deriving PNEC values:
1) that effect studies are based on guidelines developed for soluble chemicals and therefore not
suitable for nanomaterials and
2) that effect studies are assessed for their risk assessment adequacy according to the Klimisch
score, which by nature favours studies conducted according to GLP and in accordance with
(current) guidelines.
Environmental effects of engineered nanomaterials 45
5. PNEC estimations for selected NMs
In this chapter PNEC estimations are provided for the nine selected ENMs. The first section gives a
brief recap on the PNEC estimation methodology and implications for ENMs. The following nine
sections present the ecotoxicological data, PNEC estimations as well as associated reservations and
GAP analyses for each of the individual ENMs. For each ENM a graph illustrates the
ecotoxicological studies’ risk assessment adequacies assessed according to the developed framework
presented in the preceding Chapter 4, see Figure 2. For each material a more detailed overview
table is provided in appendix 1 showing which organisms have been tested, the endpoint, the effect
concentration and the resulting risk assessment adequacy score. Finally, the last section gives an
overview of all the estimated PNEC values, both in a tabulate manner, as well as in lyrics.
5.1 Method for PNEC estimations for the selected ENMs and
implications thereof
PNEC estimations were established according to the REACH guidelines (see Chapter 2) using the
ecotoxicological studies assessed to be most adequate, according to the assessment framework
presented in Chapter 4.
The results of applying the developed framework are consistently and transparently assessed effect
studies for their risk assessment adequacy. The result contains both an assessment of the relevance
as well as the reliability of the study, seen in a nanomaterial perspective. This enables the selection
of the current most solid effect study suitable for PNEC estimation and following risk assessment.
It has to be noted that the PNEC estimations are based on the currently available hazard data
from the scientific literature. It can be expected that these evaluations may change in the future as
new data emerge and as test methods are improved and revised to better address the challenges
of testing ENMs.
Furthermore, that despite the good intentions of the applied AFs, they cannot correct for
improperly conducted effect studies, or effect studies conducted according to guidelines not suited
for nanomaterials. As long as the effect studies are not sufficiently reliable, this will have
implications on the derived PNEC value and must be taken into consideration in the subsequent
risk assessment.
PNEC estimations given in this Chapter are thus based on the assumptions that 1) the current test
methods are applicable to nanomaterials, and 2) that the current extrapolation methods are
valid for nanomaterials. Both of these assumptions are highly questionable (see Chapter 6). The
values should therefore be taken as indicative for the order of magnitude for PNEC given the
current regulatory recommendations for PNEC estimation and not be used as the definitive
protective concentration for the environment.
46 Environmental effects of engineered nanomaterials
5.2 Literature search strategy
In order to find scientific articles covering effect assessment of nanomaterials in relation to risk
assessment, a literature search strategy was developed. Each of the selected nanomaterials (TiO2,
ZnO, Ag, CNTs, CuO, nZVI, CeO2, QDs and CB) was combined with “tox*” and “nano*” and
“alga*/crustacean*/daphni*/fish*” in Web of Science and resulted in 1,208 hits in total (as of 25
October 2014), see Table 12Fejl! Henvisningskilde ikke fundet.. A range of these articles were
in fact replicates, as some articles were retrieved for the same ENM, but for different organisms, or
because a single article reported data for several ENMs and therefore were retrieved for several
ENMs. Across all searched nanomaterials and search strategies, there were 677 unique articles. By
reading through the abstract and extracting important information from the methods and materials
as well as the results sections of the articles, articles reporting some sort of median effect
concentration (IC50, LC50 and EC50), some sort of no or low effect concentration (NOEC, LOEC, EC10
or EC20), data on sub-acute, bioaccumulation, uptake, elimination or similar interesting
information were retrieved, resulting in 500 articles.
Of this selection of relevant articles a further focused selection was done for the purpose of
evaluating this focused selection according to the developed framework. As far as possible, proper
attention was paid to include all studies reporting long-term NOEC-values on the three trophic
levels of algae, daphnia and fish in respect of risk assessment of the aquatic environment. If no such
articles were retrieved, articles reporting short-term EC50-values were to the furthest extent
included in the assessment. Less attention was paid to articles reporting some exotic effect on e.g.
gene expression of immunotoxicity, however such studies have regularly been included in the
assessment for risk assessment adequacy, despite their relative less relevance for risk assessment.
This focused selection has resulted in articles being left out of the assessment, but to our best
knowledge this will not significantly change the final output on PNEC estimation.
Table 12 – Overview of the literature search where each nanomaterial was combined with Tox* AND Nano* AND
“alga*/crustacean*/daphni*/fish*” in Web of Science. Literature searches were performed till the end of October 2014.
Alga* Crustacean* Daphni* Fish* Total#
Titanium dioxide 58 11 164 98 257
Zinc oxide 21 9 53 24 77
Silver 76 14 128 98 262
Carbon nanotubes 46 7 110 66 181
Copper oxide§ 13 6 26 16 50
Iron (nZVI) 18 0 17 15 44
Cerium dioxide 3 2 10 4 13
Quantum dots 19 1 37 21 65
Carbon black 4 3 9 1 14
Sum 258 53 554 343 963
§: Copper oxide has been assessed instead of copper carbonate, as no ecotoxicological studies were found using the devised
search strategy; #: The number of articles given in the “total column” is less than the sum of the articles from the four organisms.
Similarly, summing up the number of articles from the “total column” is larger than the total retrieved articles. The reason for
this is that one article can appear for several organisms as well as several ENMs and will therefore be counted for more than one.
From the amount of retrieved literature, as shown in Table 12Fejl! Henvisningskilde ikke
fundet., some interesting observations can be done. As expected, the most studied ENMs are
silver, titanium dioxide and CNTs with around 200 articles for each ENM. In a middle group zinc
oxide, copper oxide, nZVI and quantum dots appear with around 60 articles each. Finally, the least
studied ENMs are cerium dioxide and carbon black.
Despite the anticipated vast literature on the application of biochar and soil amendments of some
sort of activated carbon compounds, it is interesting to see that only 14 articles were retrieved
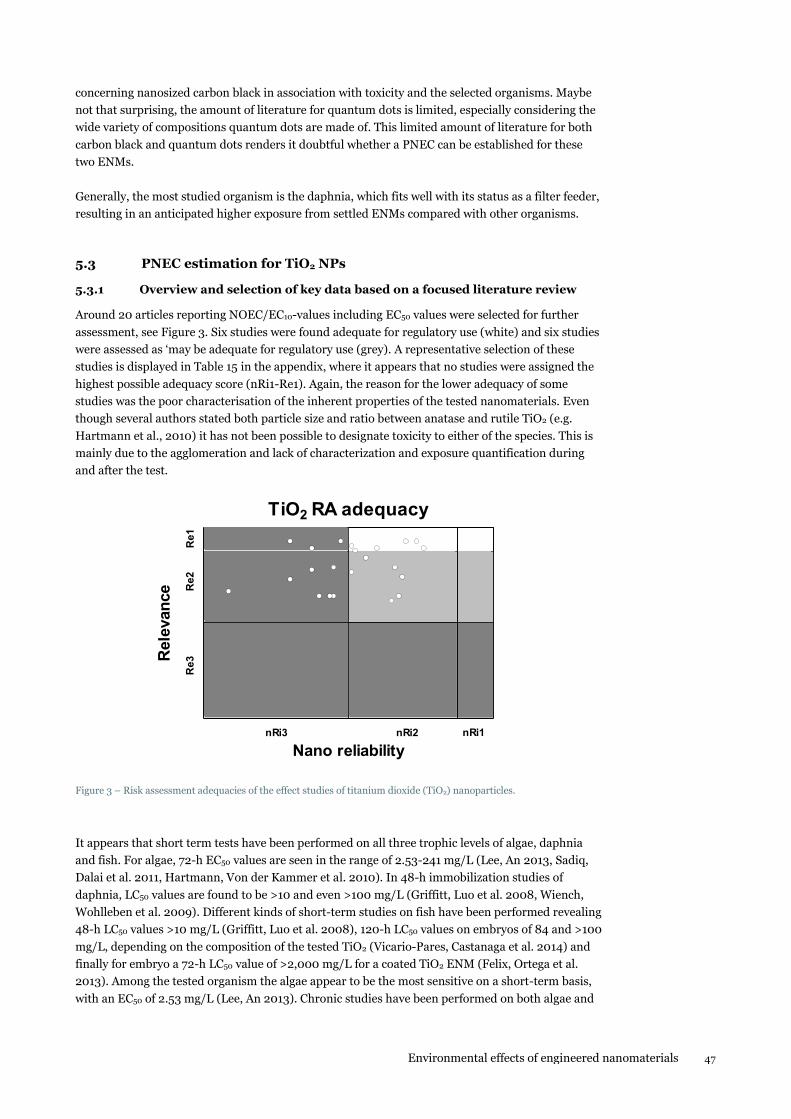
Environmental effects of engineered nanomaterials 47
concerning nanosized carbon black in association with toxicity and the selected organisms. Maybe
not that surprising, the amount of literature for quantum dots is limited, especially considering the
wide variety of compositions quantum dots are made of. This limited amount of literature for both
carbon black and quantum dots renders it doubtful whether a PNEC can be established for these
two ENMs.
Generally, the most studied organism is the daphnia, which fits well with its status as a filter feeder,
resulting in an anticipated higher exposure from settled ENMs compared with other organisms.
5.3 PNEC estimation for TiO2 NPs
5.3.1 Overview and selection of key data based on a focused literature review
Around 20 articles reporting NOEC/EC10-values including EC50 values were selected for further
assessment, see Figure 3. Six studies were found adequate for regulatory use (white) and six studies
were assessed as ‘may be adequate for regulatory use (grey). A representative selection of these
studies is displayed in Table 15 in the appendix, where it appears that no studies were assigned the
highest possible adequacy score (nRi1-Re1). Again, the reason for the lower adequacy of some
studies was the poor characterisation of the inherent properties of the tested nanomaterials. Even
though several authors stated both particle size and ratio between anatase and rutile TiO2 (e.g.
Hartmann et al., 2010) it has not been possible to designate toxicity to either of the species. This is
mainly due to the agglomeration and lack of characterization and exposure quantification during
and after the test.
TiO2 RA adequacy
20 30 40 50 60 70 80 90 10020
30
40
50
60
70
80
90
100
Nano reliability
Rele
van
ce
Re1
Re2
Re3
nRi1nRi2nRi3
Figure 3 – Risk assessment adequacies of the effect studies of titanium dioxide (TiO2) nanoparticles.
It appears that short term tests have been performed on all three trophic levels of algae, daphnia
and fish. For algae, 72-h EC50 values are seen in the range of 2.53-241 mg/L (Lee, An 2013, Sadiq,
Dalai et al. 2011, Hartmann, Von der Kammer et al. 2010). In 48-h immobilization studies of
daphnia, LC50 values are found to be >10 and even >100 mg/L (Griffitt, Luo et al. 2008, Wiench,
Wohlleben et al. 2009). Different kinds of short-term studies on fish have been performed revealing
48-h LC50 values >10 mg/L (Griffitt, Luo et al. 2008), 120-h LC50 values on embryos of 84 and >100
mg/L, depending on the composition of the tested TiO2 (Vicario-Pares, Castanaga et al. 2014) and
finally for embryo a 72-h LC50 value of >2,000 mg/L for a coated TiO2 ENM (Felix, Ortega et al.
2013). Among the tested organism the algae appear to be the most sensitive on a short-term basis,
with an EC50 of 2.53 mg/L (Lee, An 2013). Chronic studies have been performed on both algae and
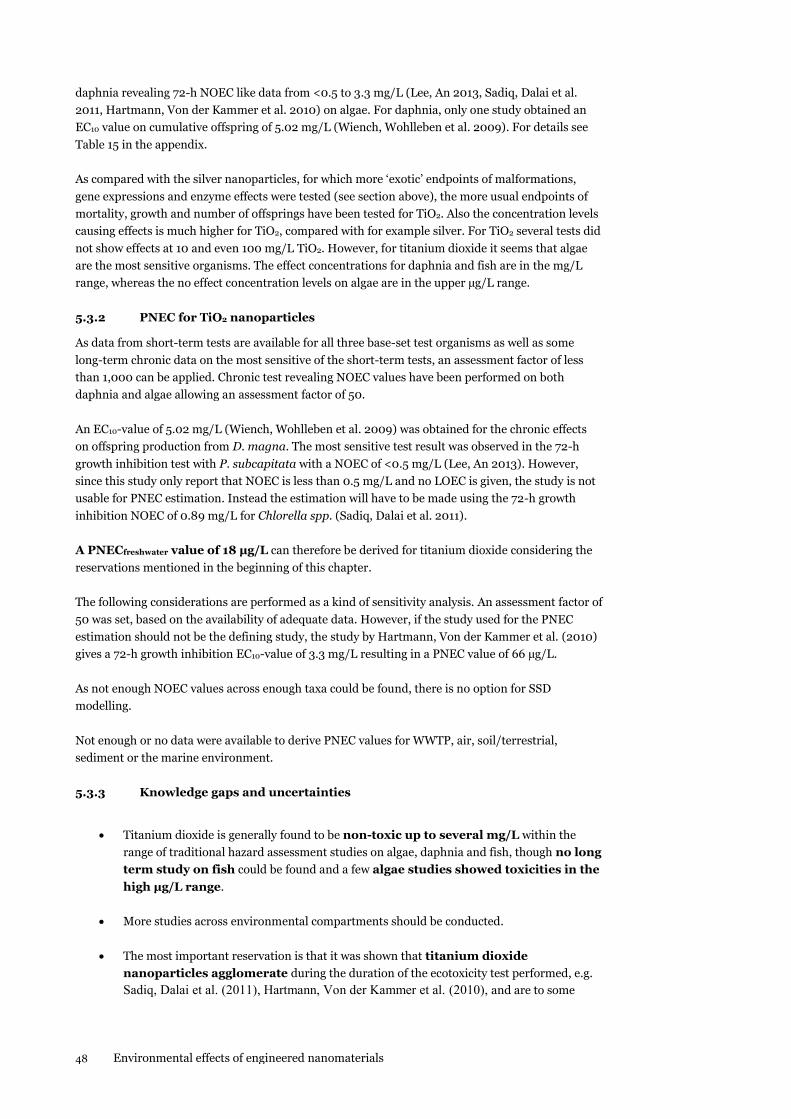
48 Environmental effects of engineered nanomaterials
daphnia revealing 72-h NOEC like data from <0.5 to 3.3 mg/L (Lee, An 2013, Sadiq, Dalai et al.
2011, Hartmann, Von der Kammer et al. 2010) on algae. For daphnia, only one study obtained an
EC10 value on cumulative offspring of 5.02 mg/L (Wiench, Wohlleben et al. 2009). For details see
Table 15 in the appendix.
As compared with the silver nanoparticles, for which more ‘exotic’ endpoints of malformations,
gene expressions and enzyme effects were tested (see section above), the more usual endpoints of
mortality, growth and number of offsprings have been tested for TiO2. Also the concentration levels
causing effects is much higher for TiO2, compared with for example silver. For TiO2 several tests did
not show effects at 10 and even 100 mg/L TiO2. However, for titanium dioxide it seems that algae
are the most sensitive organisms. The effect concentrations for daphnia and fish are in the mg/L
range, whereas the no effect concentration levels on algae are in the upper µg/L range.
5.3.2 PNEC for TiO2 nanoparticles
As data from short-term tests are available for all three base-set test organisms as well as some
long-term chronic data on the most sensitive of the short-term tests, an assessment factor of less
than 1,000 can be applied. Chronic test revealing NOEC values have been performed on both
daphnia and algae allowing an assessment factor of 50.
An EC10-value of 5.02 mg/L (Wiench, Wohlleben et al. 2009) was obtained for the chronic effects
on offspring production from D. magna. The most sensitive test result was observed in the 72-h
growth inhibition test with P. subcapitata with a NOEC of <0.5 mg/L (Lee, An 2013). However,
since this study only report that NOEC is less than 0.5 mg/L and no LOEC is given, the study is not
usable for PNEC estimation. Instead the estimation will have to be made using the 72-h growth
inhibition NOEC of 0.89 mg/L for Chlorella spp. (Sadiq, Dalai et al. 2011).
A PNECfreshwater value of 18 µg/L can therefore be derived for titanium dioxide considering the
reservations mentioned in the beginning of this chapter.
The following considerations are performed as a kind of sensitivity analysis. An assessment factor of
50 was set, based on the availability of adequate data. However, if the study used for the PNEC
estimation should not be the defining study, the study by Hartmann, Von der Kammer et al. (2010)
gives a 72-h growth inhibition EC10-value of 3.3 mg/L resulting in a PNEC value of 66 µg/L.
As not enough NOEC values across enough taxa could be found, there is no option for SSD
modelling.
Not enough or no data were available to derive PNEC values for WWTP, air, soil/terrestrial,
sediment or the marine environment.
5.3.3 Knowledge gaps and uncertainties
Titanium dioxide is generally found to be non-toxic up to several mg/L within the
range of traditional hazard assessment studies on algae, daphnia and fish, though no long
term study on fish could be found and a few algae studies showed toxicities in the
high µg/L range.
More studies across environmental compartments should be conducted.
The most important reservation is that it was shown that titanium dioxide
nanoparticles agglomerate during the duration of the ecotoxicity test performed, e.g.
Sadiq, Dalai et al. (2011), Hartmann, Von der Kammer et al. (2010), and are to some
Environmental effects of engineered nanomaterials 49
extent photolabile/photoreactive, thereby hampering the prerequisite of a steady
exposure during the duration of the test (Hartmann, Skjolding et al. 2014) for further
explanation.
The studies already performed were not all adequate for regulatory risk assessment, which
was mainly due to the general lack of material characterisation, especially
measurements of the dose metric during and at the end of the test, but in fact also for basic
data on inherent properties, e.g. for material identification and characterisation.
Mechanistic studies of the mode of action on the nanoparticle as well as environmental
fate processes are desired.
5.4 PNEC estimation for ZnO NPs
5.4.1 Overview and selection of key data based on a focused literature review
Of the retrieved articles for ZnO, 18 reported IC/LC/EC50 or NOEC/LOEC/EC10 data of mainly
acute, but also a few chronic, effects, relevant for regulatory purposes. No study obtained the most
adequate assessment of nRi1-Re1, but still five studies were found “adequate for risk assessment”
(white) and six studies were assessed as “may be adequate for risk assessment” (grey). The
remaining seven studies were found “not adequate for risk assessment” (dark grey), see Figure 4.
No studies followed GLP, but most studies were performed according to some OECD or ISO
standard, but the main reason for low reliability was the lack of characterization and especially the
lack of exposure quantification throughout the test duration.
ZnO RA adequacy
20 30 40 50 60 70 80 90 10020
30
40
50
60
70
80
90
100
Re1
Re2
Re3
nRi1nRi2nRi3
Nano reliability
Rele
van
ce
Figure 4 – Risk assessment adequacies of the environmental effect studies of zinc oxide (ZnO) nanoparticles.
Core ZnO nanoparticles, including a range of different coatings, were tested. The studies comprised
nominal particle diameters from 20-100 nm, if at all stated. A range of studies reported
agglomeration of the particles during the time course of the test. Table 16 in the appendix states the
nominal particle sizes, when reported in the articles. Despite some articles reported similar particle
sizes, it was not possible to ensure that identical particles were tested, as hardly any CAS#s were
reported. Nevertheless, in the following analysis and discussion of the results, it is anticipated that
identical materials were tested throughout the articles.
50 Environmental effects of engineered nanomaterials
Some articles not only reported effects for the nano-form, but also for the bulk-form and/or the
ionic Zn2+ form. In most cases the ionic form was more toxic and often the nano-form was at least
as toxic as the bulk-form.
The far majority of the studies were dealing with freshwater. Only Jarvis, Miller et al. (2013)
addressed two marine organisms (algae and daphnia), however their study was assessed to be “not
adequate for risk assessment” with the score nRi3-Re2 (dark grey). Two studies addressed soil
bacterial organisms; (Rousk, Ackermann et al. 2012) was assessed “not adequate for risk
assessment” (with some EC50 values for bacterial growth inhibition of >5 g ZnO per g soil). Pokhrel,
Silva et al. (2012) obtained the grey assessment (nRi2-Re2) and could be used as supporting
information for the risk assessment process. However, the inhibition of the enzyme β-galactosidase
endpoint is not directly applicable to risk assessment, as follows from the grey score, and an EC50
value of 80 mg/L were found for organic coated ZnO particles. One white study (Gladis, Eggert et al.
2010) (nRi2-Re1) was performed on surface-living algae, where ZnO was tested for its antifouling
properties with or without UV irradiation. After UV irradiation a chronic NOEC of 0.06 mg/cm2
was obtained.
For the freshwater compartment white studies (nRi2-Re1) covered short-term acute tests at all
three trophic levels of the base-set, with EC50 for P. subcapitata <0.5 mg/L (Lee, An 2013), LC50 for
D. magna of 1-100 mg/L (Wiench, Wohlleben et al. 2009) and LC50 for embryos of D. rerio of 1589
mg/L (Felix, Ortega et al. 2013). Additionally chronic studies of the algae and daphnia were
performed with a NOAEC for P. subcapitata <0.5 mg/L (Lee, An 2013) and a NOEC for D. magna
of 0.125 mg/L (Lopes, Ribeiro et al. 2014).
Additionally grey (nRi2-Re2) cell viability studies for the fish P. lucida and the protozoa T.
thermophilia were performed, revealing NOEC values of 2-25 mg/L (Luisa Fernandez-Cruz,
Lammel et al. 2013) and EC50 values of 4-8 mg/L (Mortimer, Kasemets et al. 2010), respectively.
5.4.2 PNEC for ZnO nanoparticles
As data from short-term tests are available for all three base-set test organisms as well as some
chronic data, an assessment factor of less than 1,000 can be applied. At the short-term acute level,
the algae is the most sensitive organism. As chronic NOEC data have been derived for both the algae
and the daphnia, an assessment factor of 50 can be applied to derive the PNEC value.
The reported growth inhibition NOEC value for P. subcapitata <0.5 mg/L (Lee, An 2013) and the
reproduction NOEC for D. magna is 0.125 mg/L (Lopes, Ribeiro et al. 2014).
A PNECfreshwater value of 2.5 µg/L can therefore be derived for zinc oxide nanoparticles
considering the reservations mentioned in the beginning of this chapter.
The following considerations are performed as a kind of sensitivity analysis. An assessment factor of
50 was set, based on the availability of adequate data. However, if the study used for the PNEC
estimation should not be the defining study, another study with an effect data only a factor of 4
higher would be used resulting in a PNEC value of 10 µg/L.
Not enough NOEC values from enough different taxa could be found and therefore the SSD
modelling cannot be applied.
Not enough or no data were available to derive PNEC values for WWTP, air, soil/terrestrial,
sediment or the marine environment.
Environmental effects of engineered nanomaterials 51
5.4.3 Knowledge gaps and uncertainties
More studies across environmental compartments should be conducted, as well as long-
term studies on fish. Toxicities were generally found in the low mg/L range, with a few
exceptions for daphnia, where toxicity was found in the high µg/L range. It was often
reported, that the ionic form of zinc was more toxic than the bulk- and the nano-form, but
a few times the nano-form was more toxic than the bulk-form, indicating specific nano
effects.
The most important reservation is that, despite all studies reported data for zinc oxide
nanoparticles, the individual particle size claimed or determined are not the same for
all assessed studies. Despite no big difference were observed based on particle size, this
difference most likely affects the effect exerted by the zinc oxide nanoparticles, if
maintained during exposure. Similarly, coatings may either enhance or prohibit
ecotoxicological effects, e.g. increased absorption or decreased release of ions.
Additional, zinc oxide nanoparticles were often shown to agglomerate during the test
performance, thus hampering the prerequisite of a steady exposure (Hartmann,
Skjolding et al. 2014).
The studies already performed were not all adequate for regulatory risk assessment, which
was mainly due to the general lack of material characterisation, especially
measurements of the dose metric during and at the end of the test, but in fact also for basic
data on inherent properties, e.g. for material identification and characterisation.
Mechanistic studies of the mode of action on the nanoparticle as well as environmental
fate processes are desired.
5.5 PNEC estimation for Ag NPs
5.5.1 Overview and selection of key data based on a focused literature review
No long term studies reporting chronic NOEC values were identified through our literature search,
however, a number of studies reported significant long-term effects on reproduction and/or growth
(Zhao, Wang 2011, Blinova, Niskanen et al. 2013, Pokhrel, Dubey 2012). As seen from Table 17 in
the appendix, no studies were assigned the highest possible adequacy score (nRi1-Re1). Only two
studies Georgantzopoulou, Balachandran et al. (2013) and Gaiser, Fernandes et al. (2012) (nRi2-
Re1) were found to be adequate for regulatory use (white), despite Gaiser, Fernandes et al. (2012)
did not have a conventional endpoint, but only reported 56% mortality at the tested concentration
of 100 µg/L. Three studies Griffitt, Luo et al. (2008), Navarro, Piccapietra et al. (2008) and Gaiser,
Fernandes et al. (2012) (nRi2-Re2) were assessed as ‘may be adequate for regulatory use’ (grey) and
the rest were found not to be regulatory adequate (dark grey), because of very limited
characterisation of the inherent properties of the studied nanomaterial resulting in an nRi3
classification of the reliability. Figure 5 illustrates how the risk assessment adequacies of the
different selected studies are distributed based on the undertaken assessment of the adequacy.
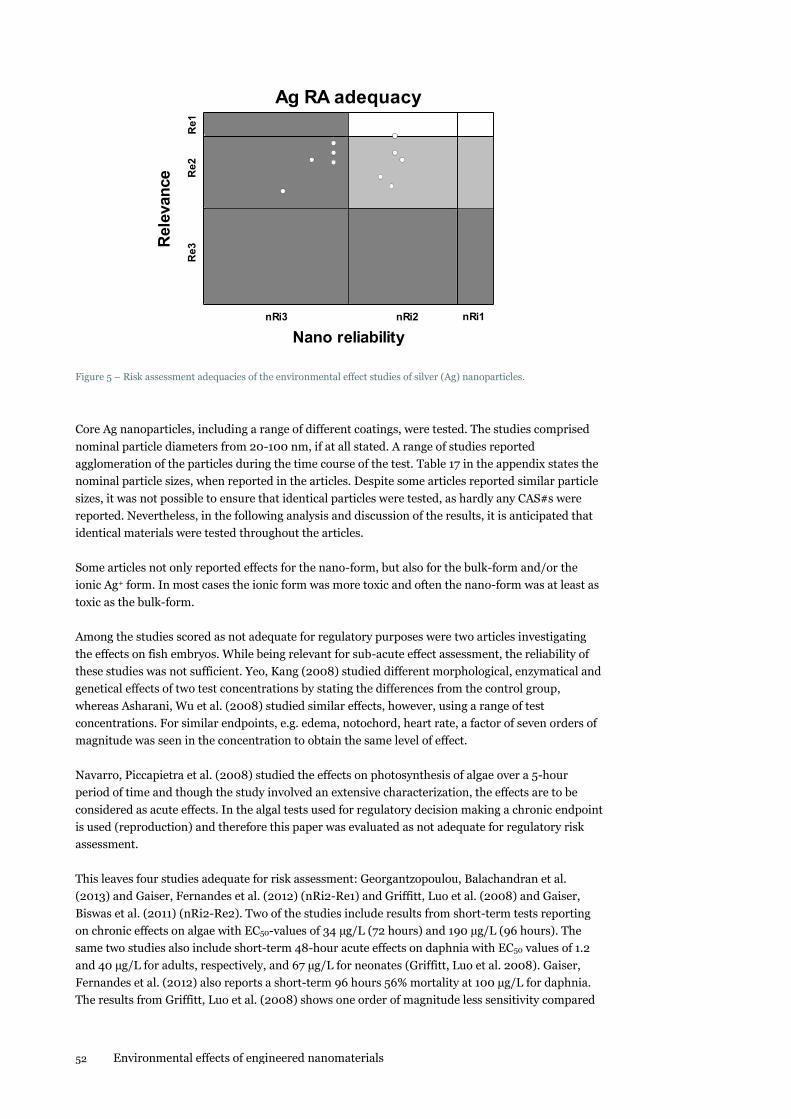
52 Environmental effects of engineered nanomaterials
Ag RA adequacy
20 30 40 50 60 70 80 90 10020
30
40
50
60
70
80
90
100
Re1
Re2
Re3
nRi1nRi2nRi3
Nano reliability
Rele
van
ce
Figure 5 – Risk assessment adequacies of the environmental effect studies of silver (Ag) nanoparticles.
Core Ag nanoparticles, including a range of different coatings, were tested. The studies comprised
nominal particle diameters from 20-100 nm, if at all stated. A range of studies reported
agglomeration of the particles during the time course of the test. Table 17 in the appendix states the
nominal particle sizes, when reported in the articles. Despite some articles reported similar particle
sizes, it was not possible to ensure that identical particles were tested, as hardly any CAS#s were
reported. Nevertheless, in the following analysis and discussion of the results, it is anticipated that
identical materials were tested throughout the articles.
Some articles not only reported effects for the nano-form, but also for the bulk-form and/or the
ionic Ag+ form. In most cases the ionic form was more toxic and often the nano-form was at least as
toxic as the bulk-form.
Among the studies scored as not adequate for regulatory purposes were two articles investigating
the effects on fish embryos. While being relevant for sub-acute effect assessment, the reliability of
these studies was not sufficient. Yeo, Kang (2008) studied different morphological, enzymatical and
genetical effects of two test concentrations by stating the differences from the control group,
whereas Asharani, Wu et al. (2008) studied similar effects, however, using a range of test
concentrations. For similar endpoints, e.g. edema, notochord, heart rate, a factor of seven orders of
magnitude was seen in the concentration to obtain the same level of effect.
Navarro, Piccapietra et al. (2008) studied the effects on photosynthesis of algae over a 5-hour
period of time and though the study involved an extensive characterization, the effects are to be
considered as acute effects. In the algal tests used for regulatory decision making a chronic endpoint
is used (reproduction) and therefore this paper was evaluated as not adequate for regulatory risk
assessment.
This leaves four studies adequate for risk assessment: Georgantzopoulou, Balachandran et al.
(2013) and Gaiser, Fernandes et al. (2012) (nRi2-Re1) and Griffitt, Luo et al. (2008) and Gaiser,
Biswas et al. (2011) (nRi2-Re2). Two of the studies include results from short-term tests reporting
on chronic effects on algae with EC50-values of 34 µg/L (72 hours) and 190 µg/L (96 hours). The
same two studies also include short-term 48-hour acute effects on daphnia with EC50 values of 1.2
and 40 µg/L for adults, respectively, and 67 µg/L for neonates (Griffitt, Luo et al. 2008). Gaiser,
Fernandes et al. (2012) also reports a short-term 96 hours 56% mortality at 100 µg/L for daphnia.
The results from Griffitt, Luo et al. (2008) shows one order of magnitude less sensitivity compared
Environmental effects of engineered nanomaterials 53
to the Georgantzopoulou, Balachandran et al. (2013) study and Gaiser, Fernandes et al. (2012) are
even two orders of magnitude less sensitive. Georgantzopoulou, Balachandran et al. (2013) also
studied the effects on bacteria with a luminescence EC50 of 420 µg/L and Griffitt, Luo et al. (2008)
studied the 48-hour mortality on fish with an LC50 of 7,070 µg/L for adults and 7,200 µg/L for
juveniles.
Gaiser, Biswas et al. (2011) studied the chronic survival of daphnia and reported 0-30% mortality at
1-50 µg/L, though no full dose response curve was shown and the effect was not dose dependent
(non-monotone). Along with the EC50 value, Georgantzopoulou, Balachandran et al. (2013) also
reported an EC10 value of 10 µg/L for the short-term chronic growth inhibition on algae.
5.5.2 PNEC estimation for Ag nanoparticles
Not only short-term data on each of the three base-set test organisms exists and, hence, an AF of
less than 1,000 can be applied. However, solid long-term NOEC values could only be found for
algae as the long-term studies on daphnia do not use adequate endpoints and the effect level is not
unambiguous. Nevertheless, long-term studies exist for both algae and daphnia, indicating that an
AF of 50 can be applied. The long-term EC0-30 values for the daphnia (D. magna) by Gaiser, Biswas
et al. (2011) are at the level of 1-50 µg/L. A few other studies support the finding of low or close to
no chronic effects around 1-5 µg/L for D. magna (Zhao, Wang 2011, Pokhrel, Dubey 2012) justifying
the lower AF. The short-term chronic EC10 value for the algae D. subspicatus is 10 µg/L. However,
the lowest effect value among the base-set test organisms originates from the Georgantzopoulou,
Balachandran et al. (2013) acute study on daphnia with an EC50-value of 1.2 µg/L. This means that
an AF of 100 must be applied resulting in a PNECfreshwater of 12 ng/L considering the reservations
mentioned in the beginning of this chapter.
The following considerations are performed as a kind of sensitivity analysis. If the long-term EC0-30
values of 1-50 µ/L for the daphnia (Gaiser, Biswas et al. 2011) are accepted along with the short-
term chronic EC10 value for algae of 10 µg/L, an AF of 50 can be applied resulting in a PNECfreshwater
of 20 ng/L. If the suggested study for PNEC estimation by Gaiser, Biswas et al. (2011) is not the
defining study, there are other studies with effects in the same range, e.g. Zhao, Wang (2011)
resulting in a PNECfreshwater of 100 ng/L instead. However, if the not traditional chronic endpoints
on daphnia are not accepted as adequate, an AF of 1,000 must be applied to the acute study on
daphnia with the EC50 value of 1.2 µg/L (Georgantzopoulou, Balachandran et al. 2013), resulting in
a PNECfreshwater value of 1.2 ng/L. Again, if the study by Georgantzopoulou, Balachandran et al.
(2013) used for the PNEC estimation should not be the defining study, an effect value one order of
magnitude higher would have been the defining value; 40 µg/L for daphnia by Griffitt, Luo et al.
(2008), resulting in a PNECfreshwater of 40 ng/L.
As not enough NOEC values across enough taxa could be found, there is no option for SSD
modelling.
Not enough or no data were available to derive PNEC values for WWTP, air, soil/terrestrial,
sediment or the marine environment.
5.5.3 Knowledge gaps and uncertainties
Mainly short-term ecotoxicity studies were found for nanosilver, emphasising the need
for more chronic studies in order to refine the hazard assessment, especially across
environmental compartments. Nevertheless, effects were found in the µg/L-range.
The most important reservation is that, despite all studies reported data for silver
nanoparticles, the individual particle size claimed or determined are not the same for
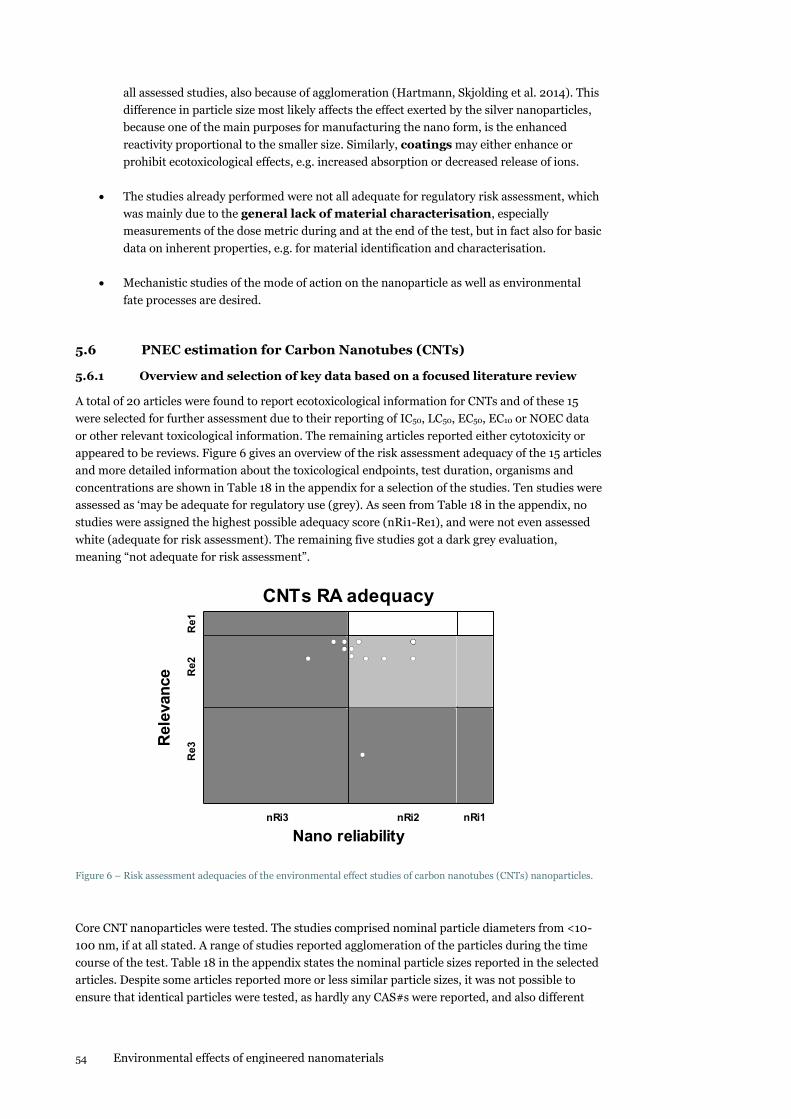
54 Environmental effects of engineered nanomaterials
all assessed studies, also because of agglomeration (Hartmann, Skjolding et al. 2014). This
difference in particle size most likely affects the effect exerted by the silver nanoparticles,
because one of the main purposes for manufacturing the nano form, is the enhanced
reactivity proportional to the smaller size. Similarly, coatings may either enhance or
prohibit ecotoxicological effects, e.g. increased absorption or decreased release of ions.
The studies already performed were not all adequate for regulatory risk assessment, which
was mainly due to the general lack of material characterisation, especially
measurements of the dose metric during and at the end of the test, but in fact also for basic
data on inherent properties, e.g. for material identification and characterisation.
Mechanistic studies of the mode of action on the nanoparticle as well as environmental
fate processes are desired.
5.6 PNEC estimation for Carbon Nanotubes (CNTs)
5.6.1 Overview and selection of key data based on a focused literature review
A total of 20 articles were found to report ecotoxicological information for CNTs and of these 15
were selected for further assessment due to their reporting of IC50, LC50, EC50, EC10 or NOEC data
or other relevant toxicological information. The remaining articles reported either cytotoxicity or
appeared to be reviews. Figure 6 gives an overview of the risk assessment adequacy of the 15 articles
and more detailed information about the toxicological endpoints, test duration, organisms and
concentrations are shown in Table 18 in the appendix for a selection of the studies. Ten studies were
assessed as ‘may be adequate for regulatory use (grey). As seen from Table 18 in the appendix, no
studies were assigned the highest possible adequacy score (nRi1-Re1), and were not even assessed
white (adequate for risk assessment). The remaining five studies got a dark grey evaluation,
meaning “not adequate for risk assessment”.
CNTs RA adequacy
20 30 40 50 60 70 80 90 10020
30
40
50
60
70
80
90
100
Nano reliability
Rele
van
ce
Re1
Re2
Re3
nRi1nRi2nRi3
Figure 6 – Risk assessment adequacies of the environmental effect studies of carbon nanotubes (CNTs) nanoparticles.
Core CNT nanoparticles were tested. The studies comprised nominal particle diameters from <10-
100 nm, if at all stated. A range of studies reported agglomeration of the particles during the time
course of the test. Table 18 in the appendix states the nominal particle sizes reported in the selected
articles. Despite some articles reported more or less similar particle sizes, it was not possible to
ensure that identical particles were tested, as hardly any CAS#s were reported, and also different
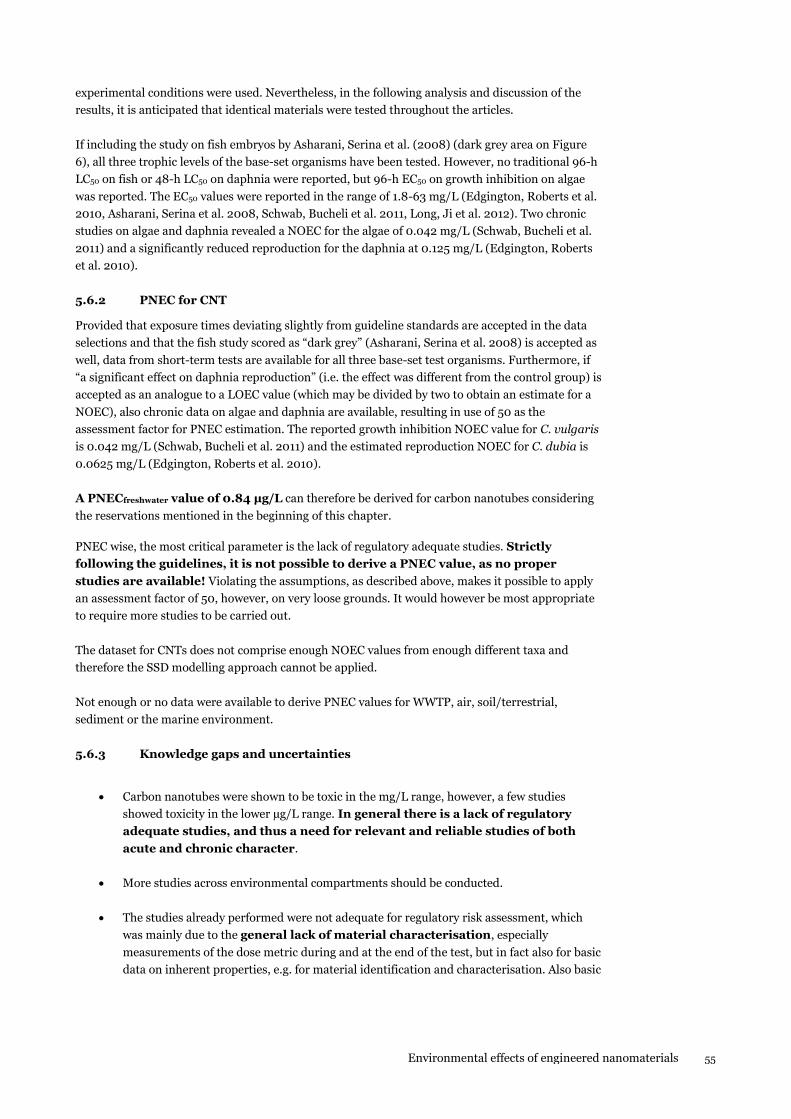
Environmental effects of engineered nanomaterials 55
experimental conditions were used. Nevertheless, in the following analysis and discussion of the
results, it is anticipated that identical materials were tested throughout the articles.
If including the study on fish embryos by Asharani, Serina et al. (2008) (dark grey area on Figure
6), all three trophic levels of the base-set organisms have been tested. However, no traditional 96-h
LC50 on fish or 48-h LC50 on daphnia were reported, but 96-h EC50 on growth inhibition on algae
was reported. The EC50 values were reported in the range of 1.8-63 mg/L (Edgington, Roberts et al.
2010, Asharani, Serina et al. 2008, Schwab, Bucheli et al. 2011, Long, Ji et al. 2012). Two chronic
studies on algae and daphnia revealed a NOEC for the algae of 0.042 mg/L (Schwab, Bucheli et al.
2011) and a significantly reduced reproduction for the daphnia at 0.125 mg/L (Edgington, Roberts
et al. 2010).
5.6.2 PNEC for CNT
Provided that exposure times deviating slightly from guideline standards are accepted in the data
selections and that the fish study scored as “dark grey” (Asharani, Serina et al. 2008) is accepted as
well, data from short-term tests are available for all three base-set test organisms. Furthermore, if
“a significant effect on daphnia reproduction” (i.e. the effect was different from the control group) is
accepted as an analogue to a LOEC value (which may be divided by two to obtain an estimate for a
NOEC), also chronic data on algae and daphnia are available, resulting in use of 50 as the
assessment factor for PNEC estimation. The reported growth inhibition NOEC value for C. vulgaris
is 0.042 mg/L (Schwab, Bucheli et al. 2011) and the estimated reproduction NOEC for C. dubia is
0.0625 mg/L (Edgington, Roberts et al. 2010).
A PNECfreshwater value of 0.84 µg/L can therefore be derived for carbon nanotubes considering
the reservations mentioned in the beginning of this chapter.
PNEC wise, the most critical parameter is the lack of regulatory adequate studies. Strictly
following the guidelines, it is not possible to derive a PNEC value, as no proper
studies are available! Violating the assumptions, as described above, makes it possible to apply
an assessment factor of 50, however, on very loose grounds. It would however be most appropriate
to require more studies to be carried out.
The dataset for CNTs does not comprise enough NOEC values from enough different taxa and
therefore the SSD modelling approach cannot be applied.
Not enough or no data were available to derive PNEC values for WWTP, air, soil/terrestrial,
sediment or the marine environment.
5.6.3 Knowledge gaps and uncertainties
Carbon nanotubes were shown to be toxic in the mg/L range, however, a few studies
showed toxicity in the lower µg/L range. In general there is a lack of regulatory
adequate studies, and thus a need for relevant and reliable studies of both
acute and chronic character.
More studies across environmental compartments should be conducted.
The studies already performed were not adequate for regulatory risk assessment, which
was mainly due to the general lack of material characterisation, especially
measurements of the dose metric during and at the end of the test, but in fact also for basic
data on inherent properties, e.g. for material identification and characterisation. Also basic
56 Environmental effects of engineered nanomaterials
test parameters like validity criteria and controls, as well as observation of dose-response
curves were lacking.
5.7 PNEC estimation for CuO NPs
5.7.1 Overview and selection of key data based on a focused literature review
Of the retrieved articles for CuO, 16 reported IC/LC/EC50 or NOEC/LOEC/EC10 data of mainly
acute, but also a few chronic, effects, relevant for regulatory purposes. As can be seen from Table 19
in the appendix, no study was assigned the highest possible adequacy score (nRi1-nRe1) and only
one study was found adequate for regulatory use (white) and nine studies were assessed as ‘may be
adequate for regulatory use’ (grey). The main reason that several of the studies have been assigned
with lower adequacy (grey) is the reliability of the studies. For most of the tests, the reliability is
affected by the fact that the tests are not conducted following a standardized method or that the
tests are not performed under GLP conditions as well as giving little or no characterization and
quantification data of the ENMs. Figure 7 illustrates how the risk assessment adequacies of the
different studies are based on the undertaken assessment of the adequacy.
CuO RA adequacy
20 30 40 50 60 70 80 90 10020
30
40
50
60
70
80
90
100
Nano reliability
Rele
van
ce
Re1
Re2
Re3
nRi1nRi2nRi3
Figure 7 – Risk assessment adequacies of the environmental effect studies of copper oxide (CuO) nanoparticles.
Short-term ecotoxicity tests have been conducted for all three trophic levels of algae, daphnia and
fish and based on these tests, daphnia are the most sensitive of the test organisms. Tests towards
algae showed a 72-h EC50 value of 150 mg/L for C. reinhardtii (Melegari, Perreault et al. 2013) and
a 96-h EC50 value of 0.54 mg/L for P. subcapitata (Griffitt, Luo et al. 2008). For daphnia the 48-h
LC50 ranged from 0.034-0.42 mg/L, dependent on organism, neonate/adult and ENM (Kennedy,
Melby et al. 2013, Griffitt, Luo et al. 2008, Rossetto, Vicentini et al. 2014). 48-h and 120-h acute
tests on the fish D. rerio (embryos, juveniles and adults) showed LC50 values in the range 0.71-1.56
mg/L (Griffitt, Weil et al. 2007, Griffitt, Luo et al. 2008), with one study >10 mg/L (Vicario-Pares,
Castanaga et al. 2014).
Chronic NOEC values have been published for both algae and daphnia, where daphnia also show
higher sensitivity than algae. A 72-h NOEC value of ≤100 mg/L was observed for C. reinhardtii
(Melegari, Perreault et al. 2013). However, based on EC50 values, P. subcapitata is more sensitive
than C. reinhardtii, but no NOEC value was obtained for this organism. The one study that was
assessed white (adequate for risk assessment) (Rossetto, Vicentini et al. 2014) (nRi2, Re1), studied
the long-term chronic effects on daphnia (D. magna) resulting in NOEC values of 0.06 mg/L
Environmental effects of engineered nanomaterials 57
(mortality and reproduction as endpoints) and <0.01 mg/L with growth as endpoint. The study also
included a 15-min acute test with bacteria (V. fischeri), resulting in an EC50-value of 7.79 mg/L (see
Table 19 in the appendix (Rossetto, Vicentini et al. 2014)).
In all of the reviewed studies where a metal salt (CuCl2 or CuSO4) has been included as a reference
for free ion toxicity, the metal salt showed greater toxicity compared with the ENM. In general, the
toxicity of Cu-compounds can be ranged in the following order: bulk CuO<CuO NP<Cu2+ based on
the results from the reviewed studies (Kasemets, Suppi et al. 2013, Blinova, Ivask et al. 2010,
Heinlaan, Ivask et al. 2008, Aruoja, Dubourguier et al. 2009, Mortimer, Kasemets et al. 2010,
Vicario-Pares, Castanaga et al. 2014, Rossetto, Vicentini et al. 2014). Griffitt, Luo et al. (2008) also
found that Cu2+ was more toxic than CuO nanoparticles, except for juvenile zebrafish, where the
LC50 for CuO nanoparticles was 2.5 times lower than for Cu2+.
All of the abovementioned studies have been conducted in artificial or natural freshwater. The
literature search resulted in only three studies where the test organism (all three studies have used
the deposit-feeding snail P. antipodarum) have been exposed through sediment (Pang, Selck et al.
2012, Pang, Selck et al. 2013, Ramskov, Selck et al. 2014). Exposure to different forms of Cu (e.g.
soluble Cu, nano-CuO, and micro-CuO) resulted in no or minimal mortality of the test organisms
(Ramskov, Selck et al. 2014, Pang, Selck et al. 2012). However, exposure to different forms of Cu
affected specific growth rate and feeding rates, and the effect on these two endpoints was
significantly enhanced for nano-CuO compared to aqueous Cu (Pang, Selck et al. 2012).
5.7.2 PNEC for CuO nanoparticles
As data from short-term tests are available for all three base-set test organisms as well as some
chronic data, an assessment factor of less than 1,000 can be applied. At the short-term acute level,
the daphnia is the most sensitive organism. As chronic NOEC data have been derived for both the
daphnia and algae, an assessment factor of 50 can be applied to derive the PNEC value. The
reported growth inhibition NOEC value for C. reinhardtii was ≤100 mg/L (Melegari, Perreault et al.
2013) and the mortality, reproduction and growth NOEC values for D. magna is 0.06, 0.06 and
<0.01 mg/L, respectively (Rossetto, Vicentini et al. 2014). However, the short-term LC50 value for C.
dubia of 0.034 mg/L (Kennedy, Melby et al. 2013) represents the lowest effect value, resulting in
the use of an AF of 100.
A PNECfreshwater value of 0.34 µg/L can therefore be derived for copper oxide considering the
reservations mentioned in the beginning of this chapter.
The following considerations are performed as a kind of sensitivity analysis. An assessment factor of
100 was set, based on the availability of adequate data. However, if the study used for the PNEC
estimation should not be the defining study, an assessment factor of 50 had to be applied on a
daphnia reproduction NOEC value (as this is now the lowest effect data) of 0.06 mg/L resulting in a
PNEC value of 1.2 µg/L.
Not enough NOEC values from enough different taxa could be found and therefore the SSD
modelling cannot be applied.
Not enough or no adequate data were available to derive PNEC values for WWTP, air,
soil/terrestrial, sediment or the marine environment.
5.7.3 Knowledge gaps and uncertainties
More studies across environmental compartments should be conducted, as well as long-
term studies on algae and fish. Toxicities were generally found in the µg/L range, with
more or less equal toxicity across the base-set trophic levels.
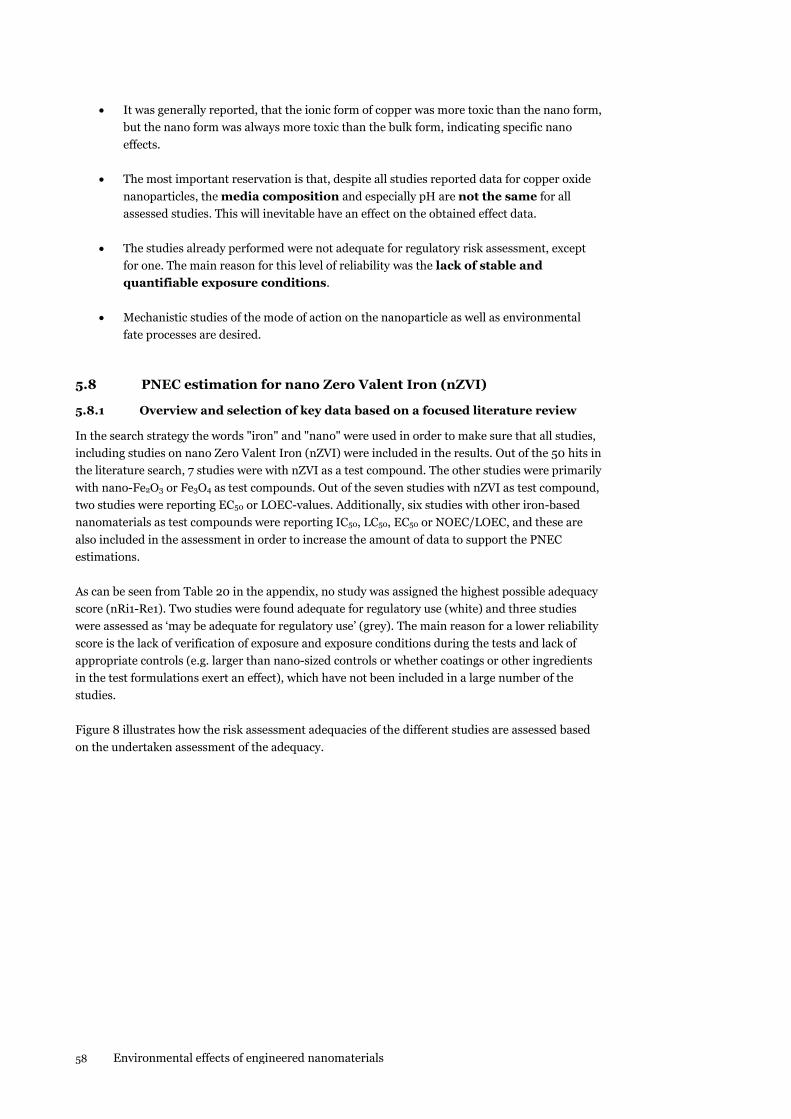
58 Environmental effects of engineered nanomaterials
It was generally reported, that the ionic form of copper was more toxic than the nano form,
but the nano form was always more toxic than the bulk form, indicating specific nano
effects.
The most important reservation is that, despite all studies reported data for copper oxide
nanoparticles, the media composition and especially pH are not the same for all
assessed studies. This will inevitable have an effect on the obtained effect data.
The studies already performed were not adequate for regulatory risk assessment, except
for one. The main reason for this level of reliability was the lack of stable and
quantifiable exposure conditions.
Mechanistic studies of the mode of action on the nanoparticle as well as environmental
fate processes are desired.
5.8 PNEC estimation for nano Zero Valent Iron (nZVI)
5.8.1 Overview and selection of key data based on a focused literature review
In the search strategy the words "iron" and "nano" were used in order to make sure that all studies,
including studies on nano Zero Valent Iron (nZVI) were included in the results. Out of the 50 hits in
the literature search, 7 studies were with nZVI as a test compound. The other studies were primarily
with nano-Fe2O3 or Fe3O4 as test compounds. Out of the seven studies with nZVI as test compound,
two studies were reporting EC50 or LOEC-values. Additionally, six studies with other iron-based
nanomaterials as test compounds were reporting IC50, LC50, EC50 or NOEC/LOEC, and these are
also included in the assessment in order to increase the amount of data to support the PNEC
estimations.
As can be seen from Table 20 in the appendix, no study was assigned the highest possible adequacy
score (nRi1-Re1). Two studies were found adequate for regulatory use (white) and three studies
were assessed as ‘may be adequate for regulatory use’ (grey). The main reason for a lower reliability
score is the lack of verification of exposure and exposure conditions during the tests and lack of
appropriate controls (e.g. larger than nano-sized controls or whether coatings or other ingredients
in the test formulations exert an effect), which have not been included in a large number of the
studies.
Figure 8 illustrates how the risk assessment adequacies of the different studies are assessed based
on the undertaken assessment of the adequacy.
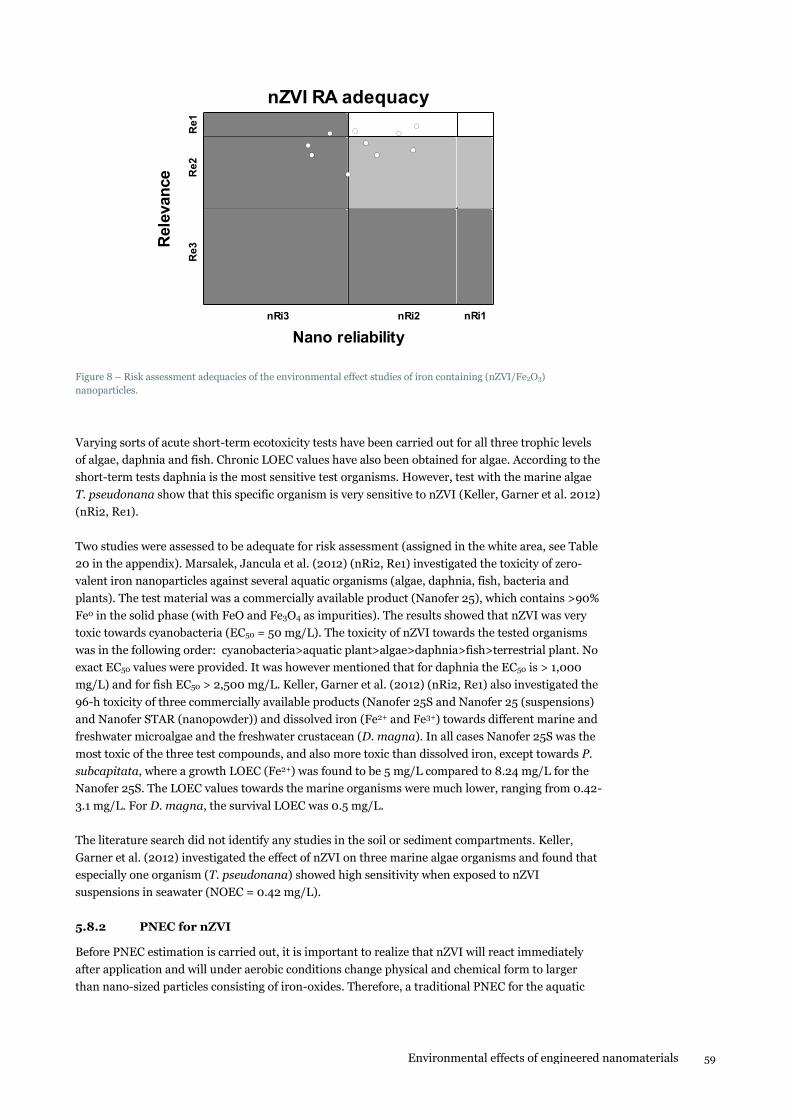
Environmental effects of engineered nanomaterials 59
nZVI RA adequacy
20 30 40 50 60 70 80 90 10020
30
40
50
60
70
80
90
100
Nano reliability
Rele
van
ce
Re1
Re2
Re3
nRi1nRi2nRi3
Figure 8 – Risk assessment adequacies of the environmental effect studies of iron containing (nZVI/Fe2O3)
nanoparticles.
Varying sorts of acute short-term ecotoxicity tests have been carried out for all three trophic levels
of algae, daphnia and fish. Chronic LOEC values have also been obtained for algae. According to the
short-term tests daphnia is the most sensitive test organisms. However, test with the marine algae
T. pseudonana show that this specific organism is very sensitive to nZVI (Keller, Garner et al. 2012)
(nRi2, Re1).
Two studies were assessed to be adequate for risk assessment (assigned in the white area, see Table
20 in the appendix). Marsalek, Jancula et al. (2012) (nRi2, Re1) investigated the toxicity of zero-
valent iron nanoparticles against several aquatic organisms (algae, daphnia, fish, bacteria and
plants). The test material was a commercially available product (Nanofer 25), which contains >90%
Fe0 in the solid phase (with FeO and Fe3O4 as impurities). The results showed that nZVI was very
toxic towards cyanobacteria (EC50 = 50 mg/L). The toxicity of nZVI towards the tested organisms
was in the following order: cyanobacteria>aquatic plant>algae>daphnia>fish>terrestrial plant. No
exact EC50 values were provided. It was however mentioned that for daphnia the EC50 is > 1,000
mg/L) and for fish EC50 > 2,500 mg/L. Keller, Garner et al. (2012) (nRi2, Re1) also investigated the
96-h toxicity of three commercially available products (Nanofer 25S and Nanofer 25 (suspensions)
and Nanofer STAR (nanopowder)) and dissolved iron (Fe2+ and Fe3+) towards different marine and
freshwater microalgae and the freshwater crustacean (D. magna). In all cases Nanofer 25S was the
most toxic of the three test compounds, and also more toxic than dissolved iron, except towards P.
subcapitata, where a growth LOEC (Fe2+) was found to be 5 mg/L compared to 8.24 mg/L for the
Nanofer 25S. The LOEC values towards the marine organisms were much lower, ranging from 0.42-
3.1 mg/L. For D. magna, the survival LOEC was 0.5 mg/L.
The literature search did not identify any studies in the soil or sediment compartments. Keller,
Garner et al. (2012) investigated the effect of nZVI on three marine algae organisms and found that
especially one organism (T. pseudonana) showed high sensitivity when exposed to nZVI
suspensions in seawater (NOEC = 0.42 mg/L).
5.8.2 PNEC for nZVI
Before PNEC estimation is carried out, it is important to realize that nZVI will react immediately
after application and will under aerobic conditions change physical and chemical form to larger
than nano-sized particles consisting of iron-oxides. Therefore, a traditional PNEC for the aquatic
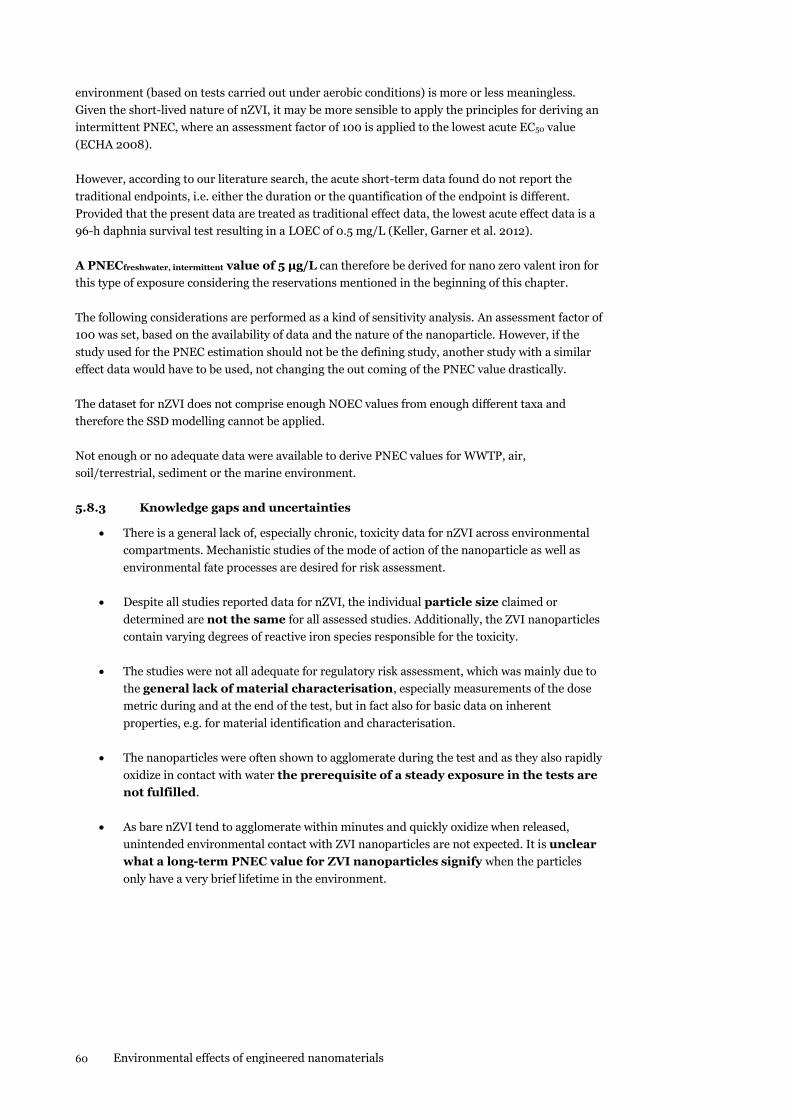
60 Environmental effects of engineered nanomaterials
environment (based on tests carried out under aerobic conditions) is more or less meaningless.
Given the short-lived nature of nZVI, it may be more sensible to apply the principles for deriving an
intermittent PNEC, where an assessment factor of 100 is applied to the lowest acute EC50 value
(ECHA 2008).
However, according to our literature search, the acute short-term data found do not report the
traditional endpoints, i.e. either the duration or the quantification of the endpoint is different.
Provided that the present data are treated as traditional effect data, the lowest acute effect data is a
96-h daphnia survival test resulting in a LOEC of 0.5 mg/L (Keller, Garner et al. 2012).
A PNECfreshwater, intermittent value of 5 µg/L can therefore be derived for nano zero valent iron for
this type of exposure considering the reservations mentioned in the beginning of this chapter.
The following considerations are performed as a kind of sensitivity analysis. An assessment factor of
100 was set, based on the availability of data and the nature of the nanoparticle. However, if the
study used for the PNEC estimation should not be the defining study, another study with a similar
effect data would have to be used, not changing the out coming of the PNEC value drastically.
The dataset for nZVI does not comprise enough NOEC values from enough different taxa and
therefore the SSD modelling cannot be applied.
Not enough or no adequate data were available to derive PNEC values for WWTP, air,
soil/terrestrial, sediment or the marine environment.
5.8.3 Knowledge gaps and uncertainties
There is a general lack of, especially chronic, toxicity data for nZVI across environmental
compartments. Mechanistic studies of the mode of action of the nanoparticle as well as
environmental fate processes are desired for risk assessment.
Despite all studies reported data for nZVI, the individual particle size claimed or
determined are not the same for all assessed studies. Additionally, the ZVI nanoparticles
contain varying degrees of reactive iron species responsible for the toxicity.
The studies were not all adequate for regulatory risk assessment, which was mainly due to
the general lack of material characterisation, especially measurements of the dose
metric during and at the end of the test, but in fact also for basic data on inherent
properties, e.g. for material identification and characterisation.
The nanoparticles were often shown to agglomerate during the test and as they also rapidly
oxidize in contact with water the prerequisite of a steady exposure in the tests are
not fulfilled.
As bare nZVI tend to agglomerate within minutes and quickly oxidize when released,
unintended environmental contact with ZVI nanoparticles are not expected. It is unclear
what a long-term PNEC value for ZVI nanoparticles signify when the particles
only have a very brief lifetime in the environment.
Environmental effects of engineered nanomaterials 61
5.9 PNEC estimation for CeO2 NPs
5.9.1 Overview and selection of key data based on a focused literature review
Of the 19 hits in the literature search, 16 studies have reported IC50, LC50, EC50 or NOEC/LOEC data
or other toxicological information. The risk assessment adequacy evaluation was performed as
described earlier, see Figure 9. As can be seen from Table 21 in the appendix, no study was assessed
with the highest grade for risk assessment adequacy, but two studies were found in the “white” area
and eight studies were found in the “grey” area. The main reason that most of the studies have been
assigned within the grey area is the reliability of the studies, which is greatly affected by a lack of
verification of exposure and exposure conditions during the tests, which have been general for most
of the assessed studies with CeO2 nanomaterials. Detailed information about the toxicological
endpoints, test duration, organisms and concentrations are shown in Table 21 in the appendix for a
selection of the studies.
CeO2 RA adequacy
20 30 40 50 60 70 80 90 10020
30
40
50
60
70
80
90
100
Nano reliability
Rele
van
ce
Re1
Re2
Re3
nRi1nRi2nRi3
Figure 9 – Risk assessment adequacies of the environmental effect studies of cerium dioxide (CeO2) nanoparticles.
Short-term ecotoxicity tests have been carried out for all three trophic levels of algae, daphnia and
fish. The resulting toxicity values are, however, very scattered. Chronic EC10/NOEC values have
been published for both daphnia and algae, with algae showing higher sensitivity than daphnia.
Two studies were assessed to be adequate for risk assessment (assigned white, see Table 21 in the
appendix). Felix, Ortega et al. (2013) investigated the toxic effect of CeO2 nanoparticles coated with
a polymer coating consisting of poly(acrylic acid) (PAA) towards zebrafish embryos on different
endpoints and found a LC50-value of > 2,000 mg/L (Felix, Ortega et al. 2013) (nRi2, Re2). This
corresponds well with the results from Van Hoecke, Quik et al. (2009) (nRi2, Re2), who found EC50
values for test with the same test organism of > 200 mg/L (i.e. the highest test concentration).
Gaiser, Fernandes et al. (2012) (nRi2, Re1) carried out acute and chronic exposures of D. magna,
and found no acute toxicity of CeO2 nanoparticles up to the highest tested concentration (10 mg/L).
Up until 10 mg/L no chronic toxicity was observed either, however, 100% mortality was found in
the 10 mg/L test concentration after 7 days exposure.
However, the results from Artells, Issartel et al. (2013) (nRi2, Re2) suggests high intra organism
sensitivity and implies that D. magna may not be the most sensitive organism of crustaceans as an
EC50-value of 0.26 mg/L was found for D. similis.
62 Environmental effects of engineered nanomaterials
Van Hoecke, Quik et al. (2009) (nRi2, Re2) performed acute and chronic tests on organisms at
three trophic levels and used these results to derive PNEC values of 0.052 mg/L, 0.068mg/L, and
0.108 mg/L for 14 nm, 20 nm, and 29 nm CeO2 nanoparticles, respectively. The PNEC values were
estimated by the AF approach using an AF of 50 as described in Table 6. However, as exposure
concentrations were not verified throughout the experiment, these results should be assessed with
some caution.
Of the 16 studies selected for review, seven studies investigated the toxicity of micro-sized CeO2 in
parallel with the tests with the nanoparticles and in all cases nano-CeO2 was found to be more toxic
than the micro-sized particles (Van Hoecke, Quik et al. 2009, Manier, Bado-Nilles et al. 2013,
Tomilina, Gremyachikh et al. 2011, Gaiser, Biswas et al. 2011, Gaiser, Fernandes et al. 2012, Rodea-
Palomares, Boltes et al. 2011, Rogers, Franklin et al. 2010). Several studies have also investigated
the dissolution from CeO2 nanoparticles and found that the particles were basically insoluble and
toxicity is thus not assumed to be caused by the dissolved fraction (Van Hoecke, Quik et al. 2009,
Felix, Ortega et al. 2013, Gaiser, Biswas et al. 2011, Manier, Bado-Nilles et al. 2013, Rogers, Franklin
et al. 2010). The toxicity of CeO2 nanoparticles towards aquatic organisms is therefore assumed to
be due to direct physical interaction between the particles and the organism, possible causing
membrane disruption (Manier, Bado-Nilles et al. 2013, Rogers, Franklin et al. 2010). The adhesion
of particles to both daphnia and algae have been confirmed in several studies (Gaiser, Biswas et al.
2011, Artells, Issartel et al. 2013, Manier, Bado-Nilles et al. 2013, Rodea-Palomares, Boltes et al.
2011, Rogers, Franklin et al. 2010).
With regards to sub-lethal effects Gaiser, Biswas et al. (2011) found a significant effect on moulting
in D. magna after 96 h exposure to 10 mg/L nano-CeO2 compared to the control. Significant effects
on animal growth at lowest test concentration (0.01 mg/L) and in the highest test concentration (10
mg/L) compared to control was also found. DNA damage (primarily DNA strand breaks) was
furthermore observed in D. magna and C. riparius after 96 hours exposure to 15 and 45 nm CeO2
particles (Lee, Kim et al. 2009).
The literature search only resulted in one study on terrestrial organisms, namely a test with the soil
organisms C. elegans (Roh, Park et al. 2010). The C. elegans tests were conducted in nematode
growth medium (NGM) agar and not in actual soil. The endpoints were growth, fertility, mortality
and stress-response gene expression. Most of the tested genes were not significantly changed by
CeO2 nanoparticle exposure, only the expression of cyp35a2 was increased compared to control.
The biological function of this gene in C. elegans is, however, still unknown. A 20% decrease in
survival rate compared to control was found for organisms exposed to 7 nm CeO2 particles, but not
for 45 nm particles. Also fertility was affected, as a 28 and 11% decrease in the number of eggs per
worm was found compared to control after exposure to 15 and 45 nm CeO2 particles, respectively.
No effect on animal growth was found (Roh, Park et al. 2010).
5.9.2 PNEC for CeO2 nanoparticles
As data from short-term tests are available for all three base-set test organisms as well as some
chronic data, an assessment factor of less than 1,000 can be applied. At the short-term level, the
daphnia is the most sensitive organism with an LC50 value of 0.26 mg/L (Artells, Issartel et al.
2013). As chronic NOEC data have been derived for both the algae and the daphnia, an assessment
factor of 50 can be applied to derive the PNEC value. The reported growth inhibition EC10 value for
P. subcapitata was 0.7 mg/L (Manier, Bado-Nilles et al. 2013) and the reproduction EC10 for D.
magna was 8.8 mg/L (Van Hoecke, Quik et al. 2009). The EC10-values are used as surrogates for
NOEC values.
Using the short-term EC10 value of 0.7 mg/L for algae a PNECfreshwater value of 14 µg/L is derived,
however, in this case, the tested daphnia organisms on the acute (D. similis) and the chronic (D.
magna) levels are not the same. As the organism tested at the acute level is much more sensitive
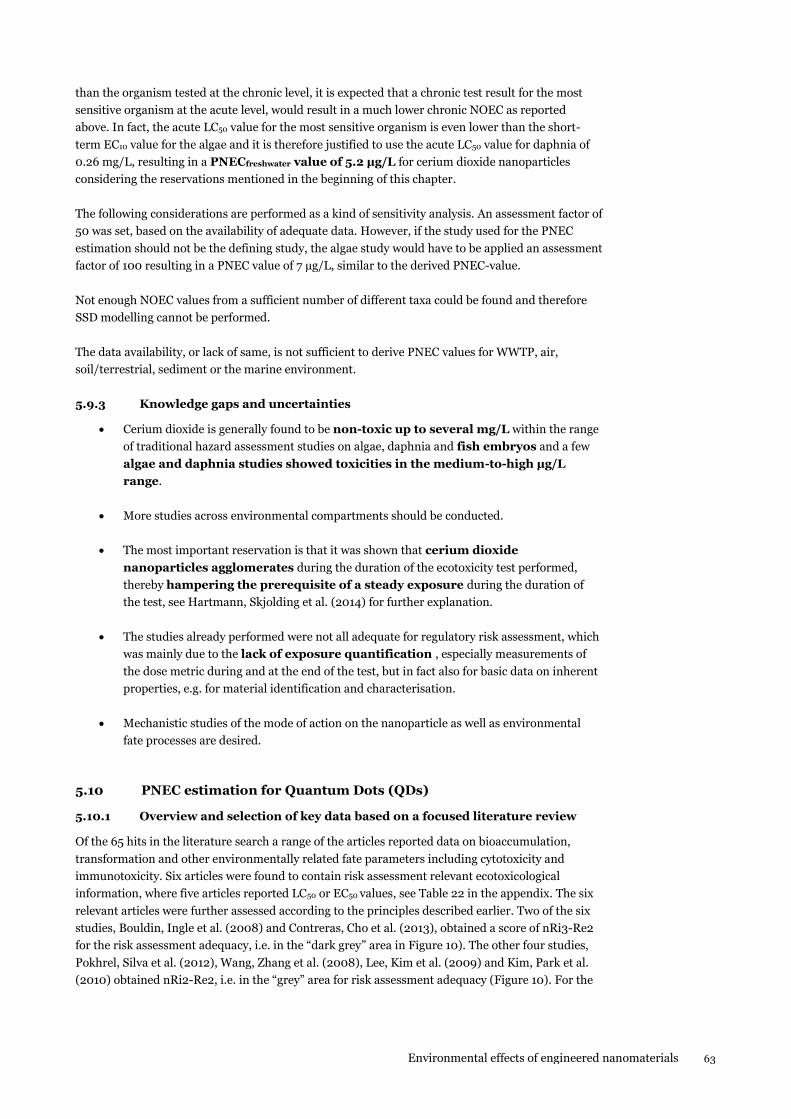
Environmental effects of engineered nanomaterials 63
than the organism tested at the chronic level, it is expected that a chronic test result for the most
sensitive organism at the acute level, would result in a much lower chronic NOEC as reported
above. In fact, the acute LC50 value for the most sensitive organism is even lower than the short-
term EC10 value for the algae and it is therefore justified to use the acute LC50 value for daphnia of
0.26 mg/L, resulting in a PNECfreshwater value of 5.2 µg/L for cerium dioxide nanoparticles
considering the reservations mentioned in the beginning of this chapter.
The following considerations are performed as a kind of sensitivity analysis. An assessment factor of
50 was set, based on the availability of adequate data. However, if the study used for the PNEC
estimation should not be the defining study, the algae study would have to be applied an assessment
factor of 100 resulting in a PNEC value of 7 µg/L, similar to the derived PNEC-value.
Not enough NOEC values from a sufficient number of different taxa could be found and therefore
SSD modelling cannot be performed.
The data availability, or lack of same, is not sufficient to derive PNEC values for WWTP, air,
soil/terrestrial, sediment or the marine environment.
5.9.3 Knowledge gaps and uncertainties
Cerium dioxide is generally found to be non-toxic up to several mg/L within the range
of traditional hazard assessment studies on algae, daphnia and fish embryos and a few
algae and daphnia studies showed toxicities in the medium-to-high µg/L
range.
More studies across environmental compartments should be conducted.
The most important reservation is that it was shown that cerium dioxide
nanoparticles agglomerates during the duration of the ecotoxicity test performed,
thereby hampering the prerequisite of a steady exposure during the duration of
the test, see Hartmann, Skjolding et al. (2014) for further explanation.
The studies already performed were not all adequate for regulatory risk assessment, which
was mainly due to the lack of exposure quantification , especially measurements of
the dose metric during and at the end of the test, but in fact also for basic data on inherent
properties, e.g. for material identification and characterisation.
Mechanistic studies of the mode of action on the nanoparticle as well as environmental
fate processes are desired.
5.10 PNEC estimation for Quantum Dots (QDs)
5.10.1 Overview and selection of key data based on a focused literature review
Of the 65 hits in the literature search a range of the articles reported data on bioaccumulation,
transformation and other environmentally related fate parameters including cytotoxicity and
immunotoxicity. Six articles were found to contain risk assessment relevant ecotoxicological
information, where five articles reported LC50 or EC50 values, see Table 22 in the appendix. The six
relevant articles were further assessed according to the principles described earlier. Two of the six
studies, Bouldin, Ingle et al. (2008) and Contreras, Cho et al. (2013), obtained a score of nRi3-Re2
for the risk assessment adequacy, i.e. in the “dark grey” area in Figure 10). The other four studies,
Pokhrel, Silva et al. (2012), Wang, Zhang et al. (2008), Lee, Kim et al. (2009) and Kim, Park et al.
(2010) obtained nRi2-Re2, i.e. in the “grey” area for risk assessment adequacy (Figure 10). For the
64 Environmental effects of engineered nanomaterials
aquatic compartment only algae and daphnia were studied and for the terrestrial compartment a
bacteria and a nematode were studied.
The relevance of the studies for risk assessment was generally high, except for the bacteria study
mainly due to a questionable relevance of the end point used. However, the reliability was generally
on a lower level (especially for the nematode study and one of the algae studies), where especially
identification and quantification of the nanoparticles and relevant controls and validity criteria
lacked. Figure 10 illustrates how the risk assessment adequacies of the different studies are based
on the undertaken assessment of the adequacy. Further details of the studies are found in Table 22
in the appendix.
QDs RA adequacy
20 30 40 50 60 70 80 90 10020
30
40
50
60
70
80
90
100
Nano reliability
Rele
van
ce
Re1
Re2
Re3
nRi1nRi2nRi3
Figure 10 – Risk assessment adequacies of the environmental effect studies of quantum dots (QDs) nanoparticles.
Based on the MetPLATETM bioassay, measuring the β-galactosidase inhibition of E. coli in the
terrestrial compartment, up to 100 mg/L of the octadecylamine coated Cd/Se-QD nanomaterial
tested only exerted a 34% inhibition (Pokhrel, Silva et al. 2012); Risk assessment adequacy score:
nRi2-Re2, grey).
For the freshwater compartment the study by Wang, Zhang et al. (2008) (Risk assessment adequacy
score: nRi2-Re2, grey) revealed a short-term EC50-value on the algae C. reinhardtii of 5 mg/L and a
significant effect from 0.1 mg/L towards stress response genes. The two other studies by Lee, Kim et
al. (2009) and Kim, Park et al. (2010), from the same research group, (risk assessment adequacy
score: nRi2-Re2, grey), both report on effects from irradiation activation of different coatings of the
Cd/Se-QDs on D. magna. The exposure level was quantified in terms of Cd2+ for comparison with a
Cd-salt, which in all cases were more toxic than the nanoparticles. Except for the
mercaptopropionic acid coating and white fluorescence irradiation giving an EC50-value larger than
2.5 mg/L, all 48-h EC50 mortalities ranged from 0.01-0.4 mg/L, dependent on coating and light
conditions, with irradiation by sunlight and gum arabicum coating as the most toxic (Lee, Kim et al.
2009). Sub-lethal effects were reported down to 0.003 mg/L for significant effects on mRNA.
No data were found for marine waters, sediment, WWTP or air.
5.10.2 PNEC for Quantum Dots
This limited dataset leaves no option for SSD modelling for QD nanoparticles. Given the very
limited data set, the low diversity of organisms tested (two algae organisms, two crustacean
Environmental effects of engineered nanomaterials 65
organisms, one nematode and a bacteria) one organism of crustaceans, molluscs, and insects) and
the regulatory adequacy of the studies, we find that it is not justifiable to apply the assessment
factor approach for PNEC derivation. Furthermore, the studies reported do not test the same
material and therefore the set of ecotoxicity data is even more limited than indicated above. Thus,
no PNEC can be estimated for QD nanoparticles at the present state-of-knowledge.
5.10.3 Knowledge gaps and uncertainties
QD nanoparticles are semiconducting nanocrystals. Due to their unique physical, chemical and
optical properties, they have a wide and increasing application range within the solar cell industry,
light-emitting devices and biological and medical imaging (Lee, Kim et al. 2009, Kim, Park et al.
2010). QDs are not unique nanoparticles in the sense that they constitute different core and core-
shell materials, e.g. CdSe, CdSe/ZnS and CdTe/CdS. Additionally they are mostly coated with a
variety of organic coatings, e.g. mercaptoproprionic acid, gum arabicum, octadecylamine. Because
of the increased application range, the likelihood of environmental releases is increasing, resulting
in an increased risk for the environment.
The ecotoxicity of QDs have not been extensively studied and the studies that have been conducted
have a medium reliability, mainly due to lack of exposure quantification but medium-high
relevance. Mainly studies on D. magna for different coatings and under different irradiation
conditions have been performed. All studied QDs are cadmium containing and since Cd is a highly
ecotoxic metal even a low degree of leaching of Cd from the QD may give rise to significant effects.
There is a general lack of studies, making it difficult to firmly assess the level of toxicity. More
studies are recommended both on a wider range of organisms (not even the base-set organisms
have been studied), but also with respect to the identification of the QD nanomaterial, e.g. surface
coating. This regards both acute as well as chronic studies and for different compartments, i.e. no
data on marine or sediment organisms were available. More studies are needed on the same
material in order to perform a proper PNEC-estimation.
5.11 PNEC estimation for Carbon Black (CB)
5.11.1 Overview and selection of key data based on a focused literature review
Of the 14 hits in the literature search six articles were found to contain relevant ecotoxicological
information. However, only two articles have reported LC50 or EC50 values Mesaric, Sepcic et al.
(2013) and Rodd, Creighton et al. (2014) and three reported sub-lethal effects Rodd, Creighton et al.
(2014, Canesi, Ciacci et al. (2008) and Liu, Vinson et al. (2009). The four relevant articles were
further assessed according to the principles described earlier (Chapter 4), see Table 23 in the
appendix. The two EC50/LC50-studies and one of the sub-lethal effect studies were performed on
marine organisms all reporting acute effects (Mesaric, Sepcic et al. 2013, Rodd, Creighton et al.
2014) and the remaining sub-lethal effect study was performed on a terrestrial organism reporting
chronic effects (Liu, Vinson et al. 2009). The studies by (Mesaric, Sepcic et al. 2013, Canesi, Ciacci
et al. 2008, Liu, Vinson et al. 2009) were assessed as nRi3-Re2, whereas the study by (Rodd,
Creighton et al. 2014) reporting LC50-values and effects on HSP70 for marine crustacean larvae (A.
franciscana) was the only study with an nRi3-Re1 score. However, all four studies were assessed
dark grey. All studies lacked nanomaterial characterization and exposure evaluation and this is the
main reason for the low regulatory reliability assessment. Figure 11 illustrates how the risk
assessment adequacies of the different studies are based on the undertaken assessment of the
adequacy. Further details of the studies are found in Table 23 in the appendix.
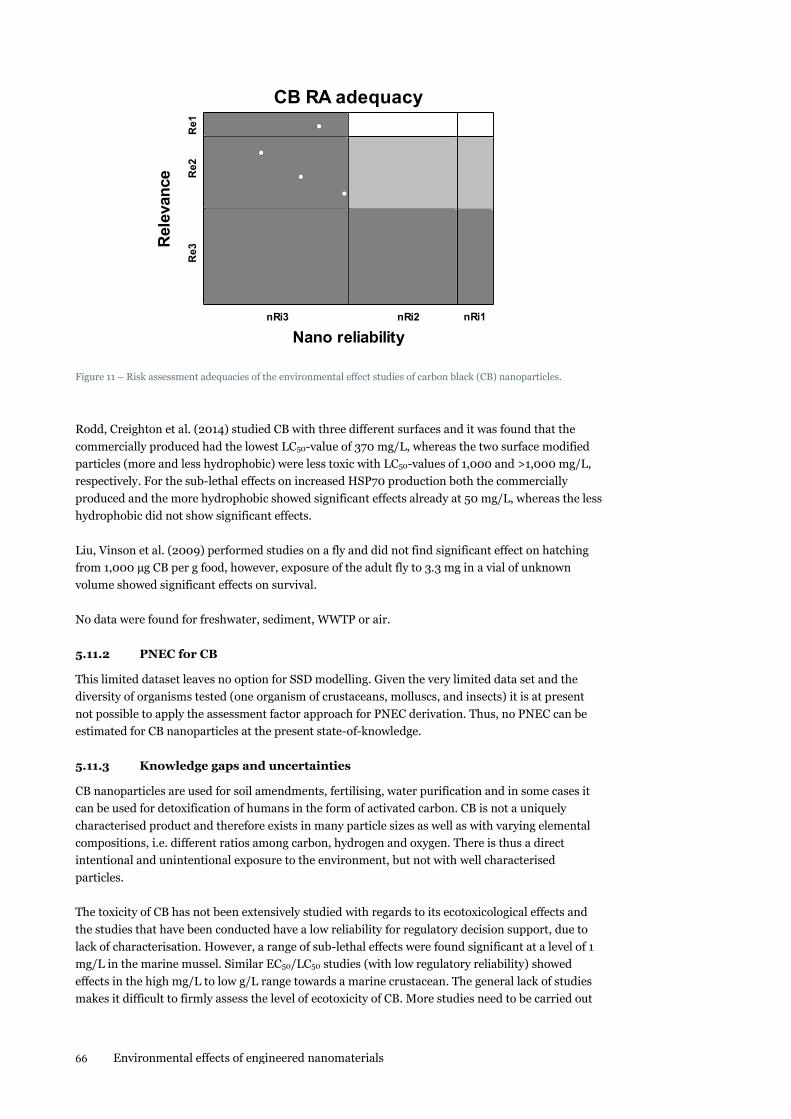
66 Environmental effects of engineered nanomaterials
CB RA adequacy
20 30 40 50 60 70 80 90 10020
30
40
50
60
70
80
90
100
Nano reliability
Rele
van
ce
Re1
Re2
Re3
nRi1nRi2nRi3
Figure 11 – Risk assessment adequacies of the environmental effect studies of carbon black (CB) nanoparticles.
Rodd, Creighton et al. (2014) studied CB with three different surfaces and it was found that the
commercially produced had the lowest LC50-value of 370 mg/L, whereas the two surface modified
particles (more and less hydrophobic) were less toxic with LC50-values of 1,000 and >1,000 mg/L,
respectively. For the sub-lethal effects on increased HSP70 production both the commercially
produced and the more hydrophobic showed significant effects already at 50 mg/L, whereas the less
hydrophobic did not show significant effects.
Liu, Vinson et al. (2009) performed studies on a fly and did not find significant effect on hatching
from 1,000 µg CB per g food, however, exposure of the adult fly to 3.3 mg in a vial of unknown
volume showed significant effects on survival.
No data were found for freshwater, sediment, WWTP or air.
5.11.2 PNEC for CB
This limited dataset leaves no option for SSD modelling. Given the very limited data set and the
diversity of organisms tested (one organism of crustaceans, molluscs, and insects) it is at present
not possible to apply the assessment factor approach for PNEC derivation. Thus, no PNEC can be
estimated for CB nanoparticles at the present state-of-knowledge.
5.11.3 Knowledge gaps and uncertainties
CB nanoparticles are used for soil amendments, fertilising, water purification and in some cases it
can be used for detoxification of humans in the form of activated carbon. CB is not a uniquely
characterised product and therefore exists in many particle sizes as well as with varying elemental
compositions, i.e. different ratios among carbon, hydrogen and oxygen. There is thus a direct
intentional and unintentional exposure to the environment, but not with well characterised
particles.
The toxicity of CB has not been extensively studied with regards to its ecotoxicological effects and
the studies that have been conducted have a low reliability for regulatory decision support, due to
lack of characterisation. However, a range of sub-lethal effects were found significant at a level of 1
mg/L in the marine mussel. Similar EC50/LC50 studies (with low regulatory reliability) showed
effects in the high mg/L to low g/L range towards a marine crustacean. The general lack of studies
makes it difficult to firmly assess the level of ecotoxicity of CB. More studies need to be carried out
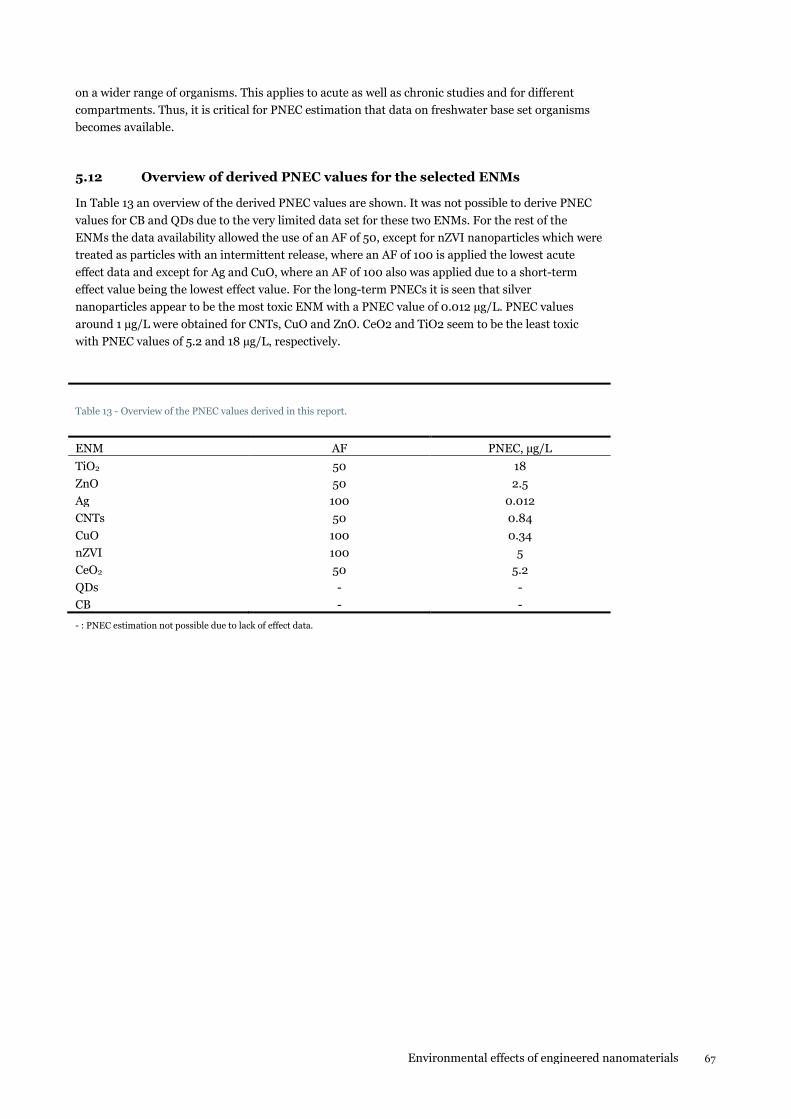
Environmental effects of engineered nanomaterials 67
on a wider range of organisms. This applies to acute as well as chronic studies and for different
compartments. Thus, it is critical for PNEC estimation that data on freshwater base set organisms
becomes available.
5.12 Overview of derived PNEC values for the selected ENMs
In Table 13 an overview of the derived PNEC values are shown. It was not possible to derive PNEC
values for CB and QDs due to the very limited data set for these two ENMs. For the rest of the
ENMs the data availability allowed the use of an AF of 50, except for nZVI nanoparticles which were
treated as particles with an intermittent release, where an AF of 100 is applied the lowest acute
effect data and except for Ag and CuO, where an AF of 100 also was applied due to a short-term
effect value being the lowest effect value. For the long-term PNECs it is seen that silver
nanoparticles appear to be the most toxic ENM with a PNEC value of 0.012 µg/L. PNEC values
around 1 µg/L were obtained for CNTs, CuO and ZnO. CeO2 and TiO2 seem to be the least toxic
with PNEC values of 5.2 and 18 µg/L, respectively.
Table 13 - Overview of the PNEC values derived in this report.
ENM AF PNEC, µg/L
TiO2 50 18
ZnO 50 2.5
Ag 100 0.012
CNTs 50 0.84
CuO 100 0.34
nZVI 100 5
CeO2 50 5.2
QDs - -
CB - -
- : PNEC estimation not possible due to lack of effect data.
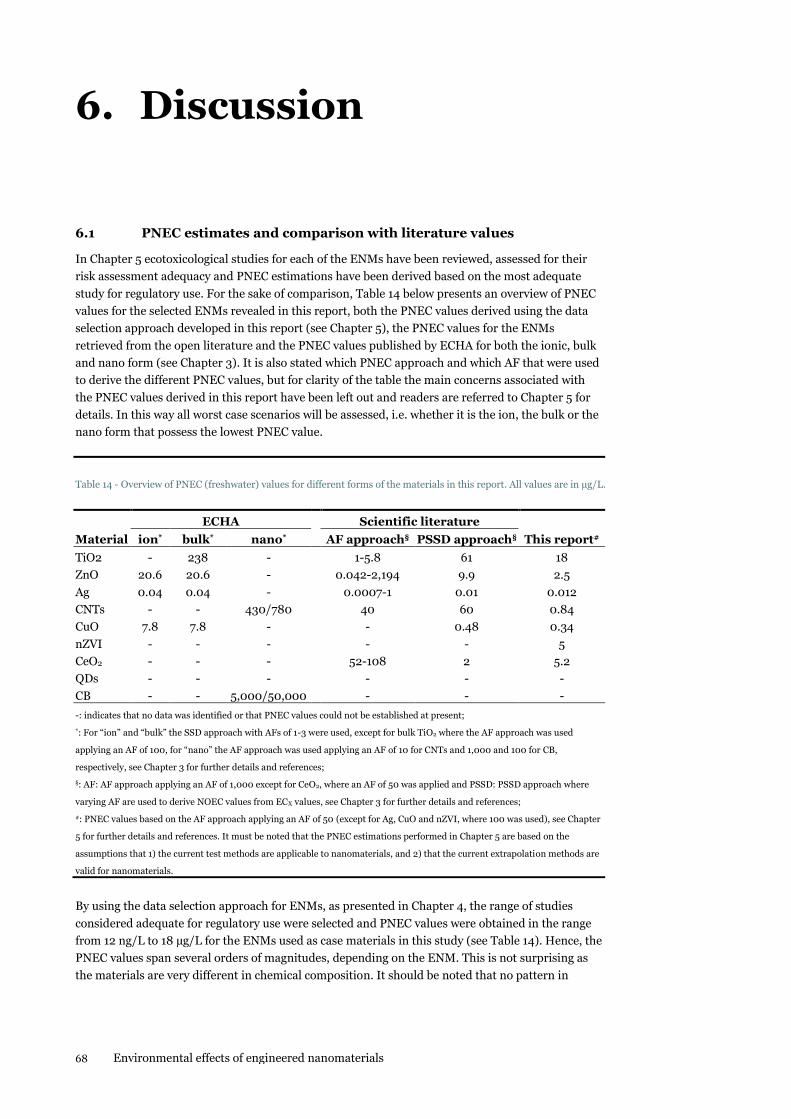
68 Environmental effects of engineered nanomaterials
6. Discussion
6.1 PNEC estimates and comparison with literature values
In Chapter 5 ecotoxicological studies for each of the ENMs have been reviewed, assessed for their
risk assessment adequacy and PNEC estimations have been derived based on the most adequate
study for regulatory use. For the sake of comparison, Table 14 below presents an overview of PNEC
values for the selected ENMs revealed in this report, both the PNEC values derived using the data
selection approach developed in this report (see Chapter 5), the PNEC values for the ENMs
retrieved from the open literature and the PNEC values published by ECHA for both the ionic, bulk
and nano form (see Chapter 3). It is also stated which PNEC approach and which AF that were used
to derive the different PNEC values, but for clarity of the table the main concerns associated with
the PNEC values derived in this report have been left out and readers are referred to Chapter 5 for
details. In this way all worst case scenarios will be assessed, i.e. whether it is the ion, the bulk or the
nano form that possess the lowest PNEC value.
Table 14 - Overview of PNEC (freshwater) values for different forms of the materials in this report. All values are in µg/L.
ECHA Scientific literature
Material ion* bulk* nano* AF approach§ PSSD approach§ This report#
TiO2 - 238 - 1-5.8 61 18
ZnO 20.6 20.6 - 0.042-2,194 9.9 2.5
Ag 0.04 0.04 - 0.0007-1 0.01 0.012
CNTs - - 430/780 40 60 0.84
CuO 7.8 7.8 - - 0.48 0.34
nZVI - - - - - 5
CeO2 - - - 52-108 2 5.2
QDs - - - - - -
CB - - 5,000/50,000 - - -
-: indicates that no data was identified or that PNEC values could not be established at present;
*: For “ion” and “bulk” the SSD approach with AFs of 1-3 were used, except for bulk TiO2 where the AF approach was used
applying an AF of 100, for “nano” the AF approach was used applying an AF of 10 for CNTs and 1,000 and 100 for CB,
respectively, see Chapter 3 for further details and references;
§: AF: AF approach applying an AF of 1,000 except for CeO2, where an AF of 50 was applied and PSSD: PSSD approach where
varying AF are used to derive NOEC values from ECX values, see Chapter 3 for further details and references;
#: PNEC values based on the AF approach applying an AF of 50 (except for Ag, CuO and nZVI, where 100 was used), see Chapter
5 for further details and references. It must be noted that the PNEC estimations performed in Chapter 5 are based on the
assumptions that 1) the current test methods are applicable to nanomaterials, and 2) that the current extrapolation methods are
valid for nanomaterials.
By using the data selection approach for ENMs, as presented in Chapter 4, the range of studies
considered adequate for regulatory use were selected and PNEC values were obtained in the range
from 12 ng/L to 18 µg/L for the ENMs used as case materials in this study (see Table 14). Hence, the
PNEC values span several orders of magnitudes, depending on the ENM. This is not surprising as
the materials are very different in chemical composition. It should be noted that no pattern in
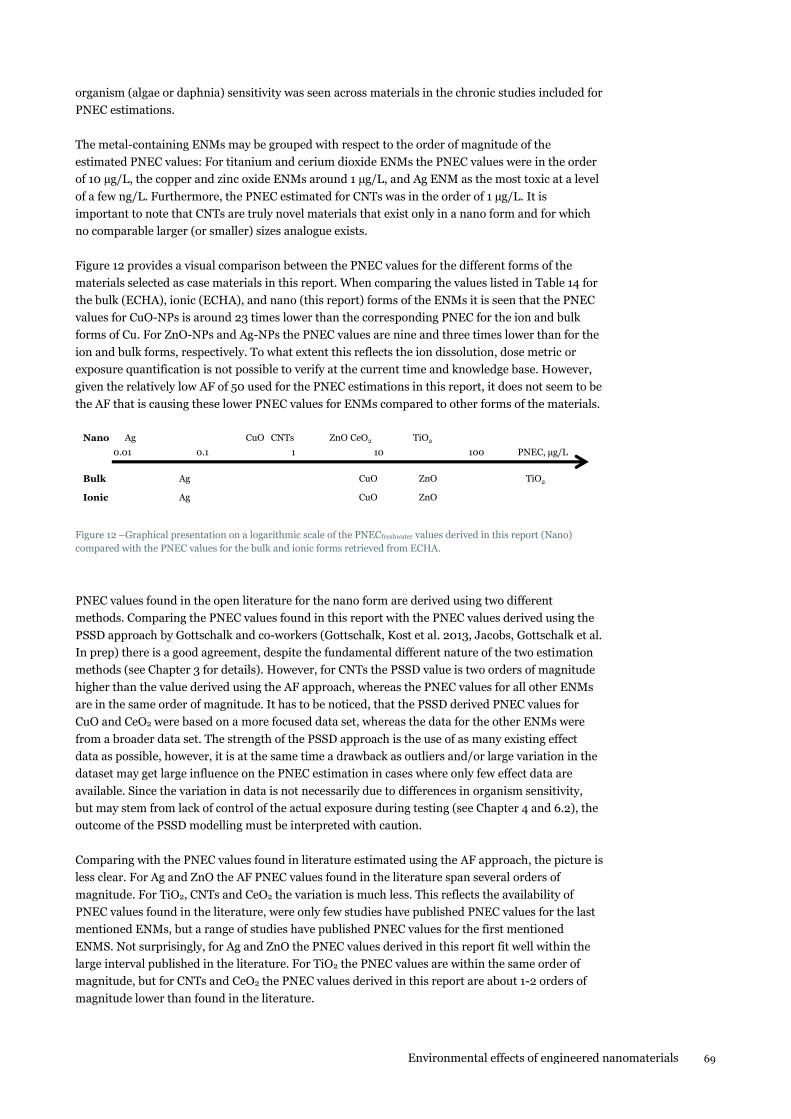
Environmental effects of engineered nanomaterials 69
organism (algae or daphnia) sensitivity was seen across materials in the chronic studies included for
PNEC estimations.
The metal-containing ENMs may be grouped with respect to the order of magnitude of the
estimated PNEC values: For titanium and cerium dioxide ENMs the PNEC values were in the order
of 10 µg/L, the copper and zinc oxide ENMs around 1 µg/L, and Ag ENM as the most toxic at a level
of a few ng/L. Furthermore, the PNEC estimated for CNTs was in the order of 1 µg/L. It is
important to note that CNTs are truly novel materials that exist only in a nano form and for which
no comparable larger (or smaller) sizes analogue exists.
Figure 12 provides a visual comparison between the PNEC values for the different forms of the
materials selected as case materials in this report. When comparing the values listed in Table 14 for
the bulk (ECHA), ionic (ECHA), and nano (this report) forms of the ENMs it is seen that the PNEC
values for CuO-NPs is around 23 times lower than the corresponding PNEC for the ion and bulk
forms of Cu. For ZnO-NPs and Ag-NPs the PNEC values are nine and three times lower than for the
ion and bulk forms, respectively. To what extent this reflects the ion dissolution, dose metric or
exposure quantification is not possible to verify at the current time and knowledge base. However,
given the relatively low AF of 50 used for the PNEC estimations in this report, it does not seem to be
the AF that is causing these lower PNEC values for ENMs compared to other forms of the materials.
Figure 12 –Graphical presentation on a logarithmic scale of the PNECfreshwater values derived in this report (Nano)
compared with the PNEC values for the bulk and ionic forms retrieved from ECHA.
PNEC values found in the open literature for the nano form are derived using two different
methods. Comparing the PNEC values found in this report with the PNEC values derived using the
PSSD approach by Gottschalk and co-workers (Gottschalk, Kost et al. 2013, Jacobs, Gottschalk et al.
In prep) there is a good agreement, despite the fundamental different nature of the two estimation
methods (see Chapter 3 for details). However, for CNTs the PSSD value is two orders of magnitude
higher than the value derived using the AF approach, whereas the PNEC values for all other ENMs
are in the same order of magnitude. It has to be noticed, that the PSSD derived PNEC values for
CuO and CeO2 were based on a more focused data set, whereas the data for the other ENMs were
from a broader data set. The strength of the PSSD approach is the use of as many existing effect
data as possible, however, it is at the same time a drawback as outliers and/or large variation in the
dataset may get large influence on the PNEC estimation in cases where only few effect data are
available. Since the variation in data is not necessarily due to differences in organism sensitivity,
but may stem from lack of control of the actual exposure during testing (see Chapter 4 and 6.2), the
outcome of the PSSD modelling must be interpreted with caution.
Comparing with the PNEC values found in literature estimated using the AF approach, the picture is
less clear. For Ag and ZnO the AF PNEC values found in the literature span several orders of
magnitude. For TiO2, CNTs and CeO2 the variation is much less. This reflects the availability of
PNEC values found in the literature, were only few studies have published PNEC values for the last
mentioned ENMs, but a range of studies have published PNEC values for the first mentioned
ENMS. Not surprisingly, for Ag and ZnO the PNEC values derived in this report fit well within the
large interval published in the literature. For TiO2 the PNEC values are within the same order of
magnitude, but for CNTs and CeO2 the PNEC values derived in this report are about 1-2 orders of
magnitude lower than found in the literature.
0.01 0.1 1 10 100 PNEC, µg/L
Nano Ag CNTsCuO ZnO TiO2CeO2
Ag
Ag
TiO2ZnO
ZnO
CuO
CuO
Bulk
Ionic
70 Environmental effects of engineered nanomaterials
While it is tempting to conclude that the lower PNEC values found for ENMs in this report
compared to ECHA registration is due to nano-specific effects, this is not supported by the findings
of the studies used to estimate the PNECs. Only in a few studies nano-specific effects were included
and found to be more sensitive endpoints compared to traditional endpoints for ecotoxicity tests.
In this report there has been a strong emphasis on data selection prior to PNEC estimation. The
approach developed and presented in Chapter 4 thus allows for inclusion of non-standardized tests
and endpoints provided that the relevance and reliability is sufficiently high taking a range of nano-
specific test concerns into account. This procedure provided a more transparent, criteria based,
selection of studies adequate for PNEC estimation and may have contributed significantly to the
lower PNEC values found in this report compared to ECHA registrations. Similar for the PNEC
values found in the literature, the PNEC values derived in this report most likely contribute to
narrowing the large interval for Ag and ZnO and substantiating the level for TiO2, CNTs and CeO2.
Finally, it should be emphasized that this report have established PNEC values for the nano forms
of CuO and nZVI, values which could neither be found in the open literature nor in ECHA
registrations.
6.2 Validity of current approaches for PNEC estimation to NMs
The current paradigm for PNEC derivation (using either the AF or the SSD approaches, as described
in Chapter 2), is that in principle these are suitable for evaluation of ENMs. Both approaches were
also considered to be applicable to ENMs by the RIPoN3 project (Aitken, Bassan et al. 2011). Hence
there is at present no nano-specific arguments included in the estimation methods for PNEC
estimation that would change the way assessment factors are selected or the way SSD estimations
are to be carried out.
It is, however important to note that the validity of the fundamental assumption, i.e. that PNECs
for ENMs can be estimated as though they were dissolved chemicals, has not been addressed.
Given the range of nano-specific concerns listed in the data selection criteria presented in Chapter 4
and elaborated on below in sections 6.2.1-6.2.3 below, it is at present not possible to claim that the
use of the current approaches ensure that organisms will be protected at concentrations below the
derived PNEC. In other words, specific circumstances related to ENMs, which differ from
conventional chemicals, could likely affect the validity of the approach for deriving PNEC in an
unpredictable manner (Baun, Hartmann et al. 2009).
6.2.1 Nanomaterial and experimental issues
The PNEC estimations are traditionally based on laboratory studies carried out under standardized
conditions with well-defined exposure conditions. However, the inherent properties of ENMs
present a range of challenges to this notion when toxicity tests are carried out. First of all, there are
currently no internationally established guidelines for proper test performance when ENMs are
studied in ecotoxicity tests. This holds true for the actual toxicity testing as well as for the crucial
handling of ENMs prior to testing. Thus, procedures for preparing stable suspensions of the ENMs
in a reproducible manner as well as for analysing the actual exposure (e.g. the size distributions,
state of agglomeration, and number of particles) before, during and after testing are not fully
developed (or even lacking). It is therefore in many cases not possible to verify if the observed effect
is a function of the applied nominal concentration, size, or number of particles. A testing strategy
that follows more or less blindly the established standard test set-ups for traditional chemicals to
ENMs potentially, results in questionable outcomes with respect to the reliability of the test
performance due to the interactions that the inherent properties of the ENMs may have under the
currently defined testing conditions.
Environmental effects of engineered nanomaterials 71
A number of transformation processes during testing may furthermore influence the effective
concentrations experience by the test organisms. Metal ENMs may undergo some degree of
dissolution, i.e. a certain fraction of the particulate state will go into solution and thereby alter the
properties (and concentrations) of the tested material (Hartmann, Skjolding et al. 2014). The ENMs
may furthermore undergo some degree of agglomeration, which is dependent on several factors like
ionic strength of the testing medium, choice of medium constituents, time, presence of test
organism (Hartmann, Skjolding et al. 2014). These transformations have furthermore been found to
be concentration dependent (Hartmann, Skjolding et al. 2014). These processes do also take place
in the natural environment, but may hamper interpretation of test results and hence data reliability
as the bioavailability of the tested material may be altered in a concentration- and time-dependent
manner induced by the testing conditions chosen for the supposedly controlled laboratory studies
(Sørensen, Baun In Press). It may be tempting to call for increasing the environmental realism of
standard tests, however this will most likely be at the expense of reproducibility and comparability
violating the fundamental prerequisite of constant exposure during standard exotoxicity testing.
These physico-chemical challenges mentioned above are not unique for ENMs, as e.g. dissolution
issues are well known for highly lipophilic or sparingly soluble chemicals, but the situation is
further complicated by a gradual transformation of the ENM-state (Sørensen, Baun In Press). On
the other hand, these phenomena are also encountered for “difficult substances” like fast degrading
or very lipophilic compounds. Rosenkrantz (2013) compared with degradable chemicals, where a
steady exposure concentration can be difficult to maintain throughout the exposure duration.
Parallels for ENMs may therefore be drawn to traditional chemicals and especially the “difficult
substances” for which specific guidelines for ecotoxicity testing exist (OECD 2000), but the
analytical chemical methods and instrumentations to accurately quantify the exposure
concentrations before, during, and after testing remains a major challenge when performing
ecotoxicity tests of ENMs.
There are potentially lessons to be learned from the risk assessment of metals, sparingly soluble
chemicals and pharmaceuticals that can be transferred to ENMs. For example it is known for metals
that their speciation is dependent on e.g. the water hardness. The environmental quality standards
(EQSs) have for some metals have therefore been set taking water hardness into account (EU
2008). Similarly, in risk assessment of strongly sorbing chemicals, their sorption coefficients may
be taking into account when calculating EQSs. pH is also well known to have an influence on the
speciation of metals as well as of organic acids and bases, where only the neutral fraction of the
compound is assumed to contribute to the overall toxicity (Rosenkrantz 2013, Trapp, Franco et al.
2010). Such approaches could be transferred to ENMs where speciation can be ‘translated’ into an
aggregation/agglomeration behaviour, which can influence their toxicity.
Furthermore, the dose metric applied represents a challenge to the current procedures for PNEC
estimation. In order to derive a relevant and reliable PNEC value for risk assessment, the
underlying ecotoxicological study needs to consider an appropriate dose metric for the studied
ENM. As mentioned in the Best Practice for REACH nano registrants (ECHA 2014) a single
measure of mass is not adequate for quantifying the exposure of ENMs. This requires further
studies of how to sufficiently quantify the exposure in ecotoxicological studies. Particle number or
specific surface area have been suggested as more appropriate dose-metrics (Van Hoecke, Quik et
al. 2009, Van Hoecke, De Schamphelaere et al. 2008, Arvidsson, Molander et al. 2011), but the
number of studies that have applied these metrics is so far much to few to draw any conclusions on
whether these novel metrics represent better alternatives to expressing the effective concentrations
compared to the traditional mass-based concentrations.
When comparing the reservations and gaps associated with the PNEC estimations for each ENM in
Chapter 5 with the description of ENM fate and behaviour in water in (Hartmann, Skjolding et al.
2014), it is possible to divide some of the ENMs in groups for which it is more or less the same
72 Environmental effects of engineered nanomaterials
concerns that are related to different materials:
For all ENMs aggregation and agglomeration is of very high importance, but especially for
TiO2 and CeO2 it is in practice difficult to maintain these particles in stable suspension.
Sedimentation of TiO2 and CeO2 ENMs are often reported and there is a risk of biological
endpoint being influenced by this behaviour. This may lead to physical effects on test
organisms, e.g. entrapment of daphnids in larger agglomerates causing immobilization.
For the Ag, ZnO, and CuO ENMs the possible dissolution in the test medium and release of
ionic metal is often used to explain the found toxicity. The dissolved metal ion is most
often found to be more toxic than the corresponding ENM, though exceptions have been
found. It is not trivial to quantify this dissolution under actual test conditions since the
dissolution depends on ENM properties like size, surface area and coating, as well as on
media composition (e.g. ionic strength and pH). Furthermore, the dissolution is time-
dependent and thus on-going from preparation of stock suspensions prior to testing and
throughout the test duration (Sørensen, Baun In Press).
6.2.2 Biological issues
With regard to the biological effect monitored and used for determination of PNEC, there is always
the question of whether the appropriate organisms and endpoints were studied. The traditional
approaches work well when it comes to narcotic acting chemicals, but has been shown to fail when
reactive or specifically acting chemicals like pesticides and pharmaceuticals are tested (Agerstrand,
Kuester et al. 2011). ENMs may have specific effects differing from traditional chemicals and it is at
present unknown whether the traditionally used test organisms are sensitive towards these effects.
Therefore other types of organisms, than the organisms in the traditional base-set, may be more
appropriate to study in a risk assessment context. However, the validity of such “novel” effects and
alternative endpoints in a regulatory context can at present not be evaluated and a continued
scrutiny of the open scientific literature is needed to make sure that the most sensitive organisms
are included in future PNEC estimations.
A further complication posed by ENMs is that they themselves may influence the analytical
methods used for quantifying effects. This has been shown for instance for estimations of growth
rates of algae in which the quantification methods were influenced by the presence of ENMs
(Hartmann, Skjolding et al. 2014) and with regards to physical effect due to high concentrations
applied in standard tests. This may give rise to biological effects encountered in laboratory studies
that will not occur at lower more environmentally realistic concentrations in tests or in nature
(Baun, Hartmann et al. 2009).
6.2.3 Risk assessment issues
The current use of extrapolation approaches from results obtained in laboratory studies to
protective concentrations in the environment relies on the basic toxicological notion that a higher
concentration will lead to higher effects. Or in other words: In standardized tests the effects
monitored should only be a function of the concentration since all other influencing factors are held
constant throughout the duration of the experiment. Furthermore, a standardized aquatic toxicity
test has a defined applicability range, as stated e.g. in the ISO 6341 test for immobilization of
Daphnia magna: “This method is applicable to: chemical substances which are soluble under the
conditions of the test, or can be maintained as a stable suspension or dispersion under the
conditions of the test” (ISO 2012). Thus, monotonous concentration-response curves and stable
suspensions during testing are required for the ecotoxicity data to be valid for risk assessment
purposes. When ENMs are tested in standard ecotoxicity tests these prerequisites are challenged
due to the fact that the particles will often aggregate or agglomerate as a consequence of the testing
media used, but also due to the increasing concentrations needed to establish concentration-
Environmental effects of engineered nanomaterials 73
response curves. Thus, a given concentration of small particles may have become larger particles
during incubation and under testing conditions. The overall concentration remains the same, but
the bioavailability of the particles may decrease and no effects will be observed at the end of the test
duration. This should be considered as an artefact created by the test design, and if the density of
particles were less, an effect may have been observed. For traditional chemicals comparable issues
like volatilisation, sorption and degradation have been sought solved by using e.g. closed bottles,
passive dosing or flow-through systems. However, similar techniques have not yet evolved for
ENMs. Furthermore, for soluble chemicals it is possible to quantify the volatilisation and other loss
processes and take this into account when expressing the test result. This is not possible to the same
extend for the transformation processes that ENMs undergo during testing. The links between
transformed states of the ENMs (e.g. dissolved or agglomerate forms) and biological effects are at
present unknown. But it is known that transformation influence the test results. For PNEC
estimation by application of an AF this constitutes a major problem for the validity of the
extrapolation from standardized tests, since environmental effects may occur at lower
concentrations than those used in the standardized tests. Thus, it is questionable whether the PNEC
established by application of an AF will indeed be protective.
6.3 Implications of the identified gaps for ENM Safety Assessment
From the identified literature studies listed in Table 6 in Chapter 3 and the gap analysis carried out
for each ENM in Chapter 5 a number of general gaps with respect to establishment of PNEC values
for nanomaterials can be identified:
1. Limited number of studies at different trophic levels: It is generally found that the
diversity of organisms tested is very low with respect to the trophic level. This had the
implication that for all of the ENMs only the application factor approach could be used for
PNEC estimation. While SSD determination may indeed be a preferred option for ENMs a
significant amount of additional studies are needed for all materials in order for the SSD to
provide valid estimates. The alternative approaches, e.g. estimation of PNEC by PSSD
remains to be validated.
2. Lack of studies from other environmental compartments than the aqueous compartment:
For all of the ENMs included in this report there is a pronounced lack of studies from other
environmental compartments than freshwater. This lack prevented PNEC estimations for
other environmental compartments and this constitutes a serious lack of data for further
CSA in the context of REACH. Here PNEC-values are required for e.g. wastewater
organisms, marine water, soils and sediments. For conventional chemicals there is an
option of extrapolating from freshwater tests to other compartments by the use of
partitioning coefficients. However, the behaviour of ENMs in complex matrices like sludge,
soils and sediments is not well-understood at present and the use of partitioning
coefficients for interpolation between compartments is not valid. Thus, this data gap can
only be closed by additional testing in the compartments at question.
3. Most studies focused on acute toxicity: The literature review of the nine ENMs selected as
case materials in this report shows that the vast majority of currently available ecotoxicity
data stem from short-term acute tests. These are required for classification and labelling
purposes and also to establish the base level for PNEC estimation. For the ENMs for which
it was possible to establish a PNEC value, results from chronic tests were available from
two different trophic levels only. In the AF approach this leads to a lowering of the AF from
1,000 to 50. However, typically no more than two long-term studies were available and it
may be questioned whether the uncertainty in the extrapolation from laboratory tests to
environmental protection values has decreased sufficiently to justify the lower AF. To
74 Environmental effects of engineered nanomaterials
obtain less uncertainty in the determination of PNEC in CSA more studies focussed at
chronic endpoints are needed.
4. Most studies focused on zooplankton: It was also shown, that overall the majority of effect
studies focused on testing daphnia (50%) in comparison to algae (20%) and fish (30%).
Acute studies were conducted on all three trophic levels, but hardly any chronic fish
studies were performed. The reason for this is possibly the high expenses associated with
longer term fish studies as well as other ethical standards concerning fish studies. For
algae obvious technical challenges exist in the sense of quantifying growth when using
counting techniques or shading of the light from the particles. In addition to this, daphnia
may be a target organism due to the filter feeding nature of this trophic level.
5. Testing of high ENM concentrations: As explained in detail in section 6.2.1 the often high
concentration and environmentally unrealistic concentrations used in standardized
ecotoxicity tests may influence the ENM behaviour and bioavailability in the test medium.
This may lead to false-negative results. Furthermore, at high particle concentrations
physical effects like organism entrapment leading to loss of mobility or shading leading to
reduced growth of algae may take place. These effects are not likely to occur at the lower
concentrations and should therefore be regarded as false-positive effects that are not valid
for PNEC estimation.
As highlighted by Som, Nowack et al. (2013) the “quality of published data is crucial for the process
of risk assessment”. This is true for both conventional and alternative approaches to PNEC
estimation and risk characterisation. A general and underlying assumption is that solid and valid
effect data must be used for deriving proper PNEC values. As shown through the literature review in
this report there are challenges and obvious problems regarding the current framework for deriving
PNEC values: 1) that effect studies are based on guidelines developed for soluble chemicals and
therefore not suitable for nanomaterials and 2) that effect studies are assessed for their risk
assessment adequacy according to the Klimisch score, which by nature favours studies conducted
according to GLP and in accordance with (current) guidelines.
Our specific recommendation for PNEC estimations of nanomaterials therefore involves a
transparent and consistent assessment of the adequacy of the given effect study for the purpose of
risk assessment. Such an assessment framework has therefore been developed and is described in
details in Chapter 4.
The results of applying the developed framework are consistently and transparently assessed effect
studies. The result contains both an assessment of the relevance as well as the reliability, seen in a
nanomaterial perspective, of the study. This enables the selection of the most solid effect study
suitable for risk assessment, i.e. PNEC estimation.
Regarding the estimation of PNEC values for nanomaterials the major gap is the lack of underlying
data adequate for risk assessment purposes. There is a general lack of reliable data, in the sense that
despite a wide range of data have been performed according to accepted international guidelines (or
modification thereof), they cannot be fully trusted to yield accurate and conservative estimates of
the toxicity of an ENM. This is highly influenced by varying exposure conditions during the
ecotoxicological testing, which constitute a violation of the underlying assumption of constant
exposure concentration during testing. Constant exposure concentrations, eventually leading to
constant organism concentrations and further to constant target location/organ concentrations, are
prerequisites for valid effect data (Mackay, McCarty et al. 2014).
It should be noted, that the applied assessment factors, cannot correct for improperly conducted
effect studies, or effect studies conducted according to guidelines not suited for nanomaterials. As
Environmental effects of engineered nanomaterials 75
long as the effects studies are not sufficiently reliable, this will have implications on the derived
PNEC value and must be taken into consideration in the subsequent risk assessment. There is thus
an urgent need for proper guidelines for ecotoxicological studies for nanomaterials, both regarding
the toxic mechanism as well as the influence of physico-chemical properties on the exposure
conditions.
76 Environmental effects of engineered nanomaterials
7. Conclusion
This report provides data on environmental effects of nine selected engineered nanomaterials
(ENMs) in the form of Predicted No-effect Concentration (PNEC) values. In the current regulatory
framework for safety assessment of chemicals and nanomaterials in EU it is assumed that PNEC
derivation using either the assessment factor (AF) or species sensitivity distribution approaches are
valid for deriving PNEC values for ENMs as well. Therefore, these approaches were applied to the
nine selected ENMs in this report.
A literature review did however reveal three alternative methods for PNEC estimation of ENMs.
One method providing indicative PNEC values establishing the order of magnitude of PNEC,
another is based on PNEC for dissolved metal ion applying an additional assessment factor of two
and the third used a probability modelling of a modified species sensitivity distribution applying a
range of AFs to obtain NOEC values. These alternative methods should be compared to the
traditional approaches in future studies, however this was not the aim of the present report.
The current approach to data selection for PNEC estimation was found to favour studies performed
according to GLP and following established guidelines developed for soluble chemicals. As non-GLP
and non-guideline studies tailor-made for effect studies of ENMs might give more reliable and
relevant results, a transparent risk assessment adequacy evaluation framework was developed
focusing on the reliability of the study in respect of ENM characterisation, quantification and study
set-up. This framework ensured the use of regulatory adequate effect studies for PNEC derivation.
It was found that the diversity in tested organisms as well as trophic levels was low. Furthermore,
hardly any chronic studies on fish were found. This has the consequence that it was not possible to
perform SSD modelling, and thus PNECs were estimated solely using the AF approach.
Most studies, acute as well as chronic, focused on effect towards freshwater crustaceans (especially
daphnia organisms), but in many cases also chronic studies on algae were found. For most of the
selected nanomaterials this resulted in the use of an AF of 50, except for Ag, CuO where an acute
study revealed a lower effect concentration resulting in the use of an AF of 100. In the acute studies
daphnia and algae were identified as the most sensitive of the tested organisms. If chronic fish
studies were available, this would lower the AF, but most likely only have low or no influence on the
PNEC value.
There is a pronounced lack of studies from other environmental compartments than freshwater. As
it is was found not to be scientifically valid to interpolate among compartments, PNEC for other
compartments than freshwater can only be established by additional testing in the compartments in
question. This includes tests with wastewater bacteria, soil organisms, pelagic marine organisms, as
well as sediment-living organisms in fresh and salt water.
The PNEC values presented in this report are in accordance with the present state-of-knowledge but
are based on the assumptions that 1) the current test methods are applicable to nanomaterials, and
2) that the current extrapolation methods are valid for nanomaterials. These assumptions remain to
be validated, especially when high concentrations are tested, as these may influence the ENM
behaviour and bioavailablility, probably resulting in false-negative results. The applied AFs are not
designed to cover uncertainties in the quantification of the exposure level (of ENMs). The values
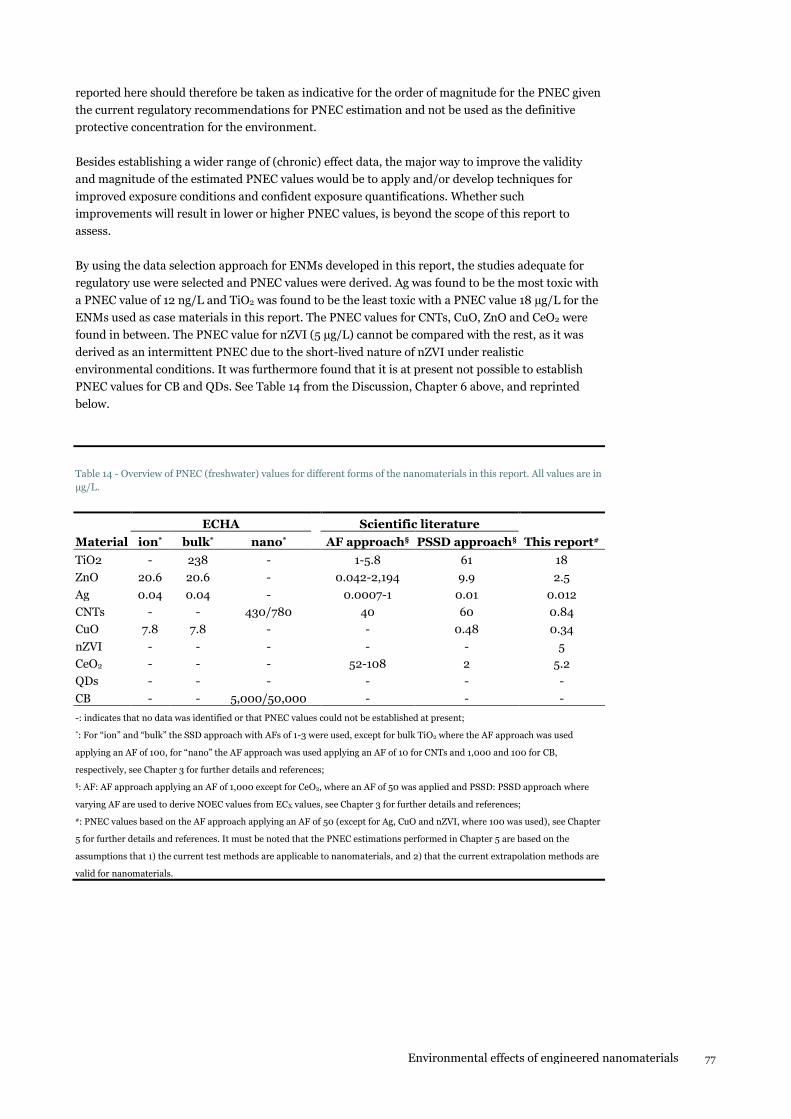
Environmental effects of engineered nanomaterials 77
reported here should therefore be taken as indicative for the order of magnitude for the PNEC given
the current regulatory recommendations for PNEC estimation and not be used as the definitive
protective concentration for the environment.
Besides establishing a wider range of (chronic) effect data, the major way to improve the validity
and magnitude of the estimated PNEC values would be to apply and/or develop techniques for
improved exposure conditions and confident exposure quantifications. Whether such
improvements will result in lower or higher PNEC values, is beyond the scope of this report to
assess.
By using the data selection approach for ENMs developed in this report, the studies adequate for
regulatory use were selected and PNEC values were derived. Ag was found to be the most toxic with
a PNEC value of 12 ng/L and TiO2 was found to be the least toxic with a PNEC value 18 µg/L for the
ENMs used as case materials in this report. The PNEC values for CNTs, CuO, ZnO and CeO2 were
found in between. The PNEC value for nZVI (5 µg/L) cannot be compared with the rest, as it was
derived as an intermittent PNEC due to the short-lived nature of nZVI under realistic
environmental conditions. It was furthermore found that it is at present not possible to establish
PNEC values for CB and QDs. See Table 14 from the Discussion, Chapter 6 above, and reprinted
below.
Table 14 - Overview of PNEC (freshwater) values for different forms of the nanomaterials in this report. All values are in
µg/L.
ECHA Scientific literature
Material ion* bulk* nano* AF approach§ PSSD approach§ This report#
TiO2 - 238 - 1-5.8 61 18
ZnO 20.6 20.6 - 0.042-2,194 9.9 2.5
Ag 0.04 0.04 - 0.0007-1 0.01 0.012
CNTs - - 430/780 40 60 0.84
CuO 7.8 7.8 - - 0.48 0.34
nZVI - - - - - 5
CeO2 - - - 52-108 2 5.2
QDs - - - - - -
CB - - 5,000/50,000 - - -
-: indicates that no data was identified or that PNEC values could not be established at present;
*: For “ion” and “bulk” the SSD approach with AFs of 1-3 were used, except for bulk TiO2 where the AF approach was used
applying an AF of 100, for “nano” the AF approach was used applying an AF of 10 for CNTs and 1,000 and 100 for CB,
respectively, see Chapter 3 for further details and references;
§: AF: AF approach applying an AF of 1,000 except for CeO2, where an AF of 50 was applied and PSSD: PSSD approach where
varying AF are used to derive NOEC values from ECX values, see Chapter 3 for further details and references;
#: PNEC values based on the AF approach applying an AF of 50 (except for Ag, CuO and nZVI, where 100 was used), see Chapter
5 for further details and references. It must be noted that the PNEC estimations performed in Chapter 5 are based on the
assumptions that 1) the current test methods are applicable to nanomaterials, and 2) that the current extrapolation methods are
valid for nanomaterials.
78 Environmental effects of engineered nanomaterials
8. References
ADAMS, L.K., LYON, D.Y., MCINTOSH, A. and ALVAREZ, P.J.J., 2006. Comparative toxicity of
nano-scale TiO2, SiO2 and ZnO water suspensions. Water Science and Technology, 54(11-12), pp.
327-334.
ÅGERSTRAND, M., BREITHOLTZ, M. and RUDÉN, C., 2011. Comparison of four different
methods for reliability evaluation of ecotoxicity data: a case study of non-standard test data used in
environmental risk assessment of pharmaceutical substances. Environmental Sciences Europe,
23(17), pp. 1-15.
AGERSTRAND, M., KUESTER, A., BACHMANN, J., BREITHOLTZ, M., EBERT, I.,
RECHENBERG, B. and RUDEN, C., 2011. Reporting and evaluation criteria as means towards a
transparent use of ecotoxicity data for environmental risk assessment of pharmaceuticals.
Environmental Pollution, 159(10), pp. 2487-2492.
AITKEN, R.A., BASSAN, A., FRIEDRICHS, S., HANKIN, S.M., HANSEN, S.F., HOLMQVIST, J.,
PETERS, S.A.K., POLAND, C.A. and TRAN, C.L., 2011. Specific Advice on Exposure Assessment and
Hazard/Risk Characterisation for Nanomaterials under REACH (RIP-oN 3). Final Project Report, ,
pp. 1-259.
ARTELLS, E., ISSARTEL, J., AUFFAN, M., BORSCHNECK, D., THILL, A., TELLA, M., BROUSSET,
L., ROSE, J., BOTTERO, J. and THIERY, A., 2013. Exposure to Cerium Dioxide Nanoparticles
Differently Affect Swimming Performance and Survival in Two Daphnid Species. Plos One, 8(8), pp.
e71260.
ARUOJA, V., DUBOURGUIER, H., KASEMETS, K. and KAHRU, A., 2009. Toxicity of nanoparticles
of CuO, ZnO and TiO2 to microalgae Pseudokirchneriella subcapitata. Science of the Total
Environment, 407(4), pp. 1461-1468.
ARVIDSSON, R., MOLANDER, S., SANDEN, B.A. and HASSELLOV, M., 2011. Challenges in
Exposure Modeling of Nanoparticles in Aquatic Environments. Human and Ecological Risk
Assessment, 17(1), pp. 245-262.
ASCHBERGER, K., MICHELETTI, C., SOKULL-KLUETTGEN, B. and CHRISTENSEN, F.M., 2011.
Analysis of currently available data for characterising the risk of engineered nanomaterials to the
environment and human health - Lessons learned from four case studies. Environment
international, 37(6), pp. 1143-1156.
ASHARANI, P.V., SERINA, N.G.B., NURMAWATI, M.H., WU, Y.L., GONG, Z. and
VALIYAVEETTIL, S., 2008. Impact of Multi-Walled Carbon Nanotubes on Aquatic Species. Journal
of Nanoscience and Nanotechnology, 8(7), pp. 3603-3609.
ASHARANI, P.V., WU, Y.L., GONG, Z. and VALIYAVEETTIL, S., 2008. Toxicity of silver
nanoparticles in zebrafish models. Nanotechnology, 19(25), pp. 255102.
Environmental effects of engineered nanomaterials 79
BACCHETTA, R., SANTO, N., FASCIO, U., MOSCHINI, E., FREDDI, S., CHIRICO, G., CAMATINI,
M. and MANTECCA, P., 2012. Nano-sized CuO, TiO2 and ZnO affect Xenopus laevis development.
Nanotoxicology, 6(4), pp. 381-398.
BAUMANN, J., KOESER, J., ARNDT, D. and FILSER, J., 2014. The coating makes the difference:
Acute effects of iron oxide nanoparticles on Daphnia magna. Science of the Total Environment,
484, pp. 176-184.
BAUN, A., HARTMANN, N.B., GRIEGER, K. and KUSK, K.O., 2008. Ecotoxicity of engineered
nanoparticles to aquatic invertebrates: a brief review and recommendations for future toxicity
testing. Ecotoxicology, 17(5), pp. 387-395.
BAUN, A., HARTMANN, N.B., GRIEGER, K.D. and HANSEN, S.F., 2009. Setting the limits for
engineered nanoparticles in European surface waters - are current approaches appropriate?
Journal of Environmental Monitoring, 11(10), pp. 1774-1781.
BLINOVA, I., IVASK, A., HEINLAAN, M., MORTIMER, M. and KAHRU, A., 2010. Ecotoxicity of
nanoparticles of CuO and ZnO in natural water. Environmental Pollution, 158(1), pp. 41-47.
BLINOVA, I., NISKANEN, J., KAJANKARI, P., KANARBIK, L., KAEKINEN, A., TENHU, H.,
PENTTINEN, O. and KAHRU, A., 2013. Toxicity of two types of silver nanoparticles to aquatic
crustaceans Daphnia magna and Thamnocephalus platyurus (vol 20, pg 3456, 2013).
Environmental Science and Pollution Research, 20(6), pp. 4293-4293.
BOULDIN, J.L., INGLE, T.M., SENGUPTA, A., ALEXANDER, R., HANNIGAN, R.E. and
BUCHANAN, R.A., 2008. Aqueous toxicity and food chain transfer of quantum Dots (TM) in
freshwater algae and Ceriodaphnia dubia. Environmental Toxicology and Chemistry, 27(9), pp.
1958-1963.
CANESI, L., CIACCI, C., BETTI, M., FABBRI, R., CANONICO, B., FANTINATI, A., MARCORNINI,
A. and POJANA, G., 2008. Immunotoxicity of carbon black nanoparticles to blue mussel
hemocytes. Environment international, 34(8), pp. 1114-1119.
CARD, J.W. and MAGNUSON, B.A., 2010. A Method to Assess the Quality of Studies That Examine
the Toxicity of Engineered Nanomaterials. International journal of toxicology, 29(4), pp. 402-410.
CHEN, D., ZHANG, D., YU, J.C. and CHAN, K.M., 2011. Effects of Cu2O nanoparticle and CuCl2 on
zebrafish larvae and a liver cell-line. Aquatic Toxicology, 105(3-4), pp. 344-354.
CHOI, O. and HU, Z., 2008. Size dependent and reactive oxygen species related nanosilver toxicity
to nitrifying bacteria. Environmental science & technology, 42(12), pp. 4583-4588.
CONTRERAS, E.Q., CHO, M., ZHU, H., PUPPALA, H.L., ESCALERA, G., ZHONG, W. and COLVIN,
V.L., 2013. Toxicity of Quantum Dots and Cadmium Salt to Caenorhabditis elegans after
Multigenerational Exposure. Environmental science & technology, 47(2), pp. 1148-1154.
DAS, P., XENOPOULOS, M.A. and METCALFE, C.D., 2013. Toxicity of Silver and Titanium Dioxide
Nanoparticle Suspensions to the Aquatic Invertebrate, Daphnia magna. Bulletin of environmental
contamination and toxicology, 91(1), pp. 76-82.
EC, 2012. NANO SUPPORT Project Scientific technical support on assessment of nanomaterials in
REACH registration dossiers and adequacy of available information. European Commission.
80 Environmental effects of engineered nanomaterials
ECHA, 2014. Human health and environmental exposure assessment and risk characterisation of
nanomaterials. Best practice for REACH registrants. European Chemicals Agency, pp. 1-12.
ECHA, 2011. Guidance on information requirements and chemical safety assessment Chapter R.4:
Evaluation of available information. European Chemicals Agency.
ECHA, 2008. Guidance on information requirements and chemical safety assessment. Chapter
R.10: Characterisation of dose [concentration]-response for environment. European Chemicals
Agency, pp. 1-65.
EDGINGTON, A.J., ROBERTS, A.P., TAYLOR, L.M., ALLOY, M.M., REPPERT, J., RAO, A.M.,
MAO, J. and KLAINE, S.J., 2010. The Influence of Natural Organic Matter on the Toxicity of
Multiwalled Carbon Nanotubes. Environmental Toxicology and Chemistry, 29(11), pp. 2511-2518.
EU, 2008. Directive 2008/556/EC of the European Parliament and of the Council of 16 December
2008 on envrionmental quality standards in the field of water policy. Official Journal of the
European Communities L348/84:1-14.
FAN, W., SHI, Z., YANG, X., CUI, M., WANG, X., ZHANG, D., LIU, H. and GUO, L., 2012.
Bioaccumulation and biomarker responses of cubic and octahedral Cu2O micro/nanocrystals in
Daphnia magna. Water research, 46(18), pp. 5981-5988.
FELIX, L.C., ORTEGA, V.A., EDE, J.D. and GOSS, G.G., 2013. Physicochemical Characteristics of
Polymer-Coated Metal-Oxide Nanoparticles and their Toxicological Effects on Zebrafish (Danio
rerio) Development. Environmental science & technology, 47(12), pp. 6589-6596.
GAISER, B.K., BISWAS, A., ROSENKRANZ, P., JEPSON, M.A., LEAD, J.R., STONE, V., TYLER,
C.R. and FERNANDES, T.F., 2011. Effects of silver and cerium dioxide micro- and nano-sized
particles on Daphnia magna. Journal of Environmental Monitoring, 13(5), pp. 1227-1235.
GAISER, B.K., FERNANDES, T.F., JEPSON, M.A., LEAD, J.R., TYLER, C.R., BAALOUSHA, M.,
BISWAS, A., BRITTON, G.J., COLE, P.A., JOHNSTON, B.D., JU-NAM, Y., ROSENKRANZ, P.,
SCOWN, T.M. and STONE, V., 2012. Interspecies comparisons on the uptake and toxicity of silver
and cerium dioxide nanoparticles. Environmental Toxicology and Chemistry, 31(1), pp. 144-154.
GARCIA, A., ESPINOSA, R., DELGADO, L., CASALS, E., GONZALEZ, E., PUNTES, V., BARATA, C.,
FONT, X. and SANCHEZ, A., 2011. Acute toxicity of cerium oxide, titanium oxide and iron oxide
nanoparticles using standardized tests. Desalination, 269(1-3), pp. 136-141.
GEORGANTZOPOULOU, A., BALACHANDRAN, Y.L., ROSENKRANZ, P., DUSINSKA, M.,
LANKOFF, A., WOJEWODZKA, M., KRUSZEWSKI, M., GUIGNARD, C., AUDINOT, J., GIRIJA, S.,
HOFFMANN, L. and GUTLEB, A.C., 2013. Ag nanoparticles: size- and surface-dependent effects on
model aquatic organisms and uptake evaluation with NanoSIMS. Nanotoxicology, 7(7), pp. 1168-
1178.
GLADIS, F., EGGERT, A., KARSTEN, U. and SCHUMANN, R., 2010. Prevention of biofilm growth
on man-made surfaces: evaluation of antialgal activity of two biocides and photocatalytic
nanoparticles. Biofouling, 26(1), pp. 89-101.
GOTTSCHALK, F., KOST, E. and NOWACK, B., 2013. Engineered nanomaterials in water and soils:
A risk quantification based on probabilistic exposure and effect modeling. Environmental
Toxicology and Chemistry, 32(6), pp. 1278-1287.
Environmental effects of engineered nanomaterials 81
GOTTSCHALK, F., SONDERER, T., SCHOLZ, R.W. and NOWACK, B., 2010. Possibilities and
Limitations of Modeling Environmental Exposure to Engineered Nanomaterials by Probabilistic
Material Flow Analysis. Environmental Toxicology and Chemistry, 29(5), pp. 1036-1048.
GRIEGER, K.D., BAUN, A. and OWEN, R., 2010. Redefining risk research priorities for
nanomaterials. Journal of Nanoparticle Research, 12(2), pp. 383-392.
GRIFFITT, R.J., LUO, J., GAO, J., BONZONGO, J. and BARBER, D.S., 2008. Effects of particle
composition and species on toxicity of metallic nanomaterials in aquatic organisms. Environmental
Toxicology and Chemistry, 27(9), pp. 1972-1978.
GRIFFITT, R.J., WEIL, R., HYNDMAN, K.A., DENSLOW, N.D., POWERS, K., TAYLOR, D. and
BARBER, D.S., 2007. Exposure to copper nanoparticles causes gill injury and acute lethality in
zebrafish (Danio rerio). Environmental science & technology, 41(23), pp. 8178-8186.
HARTMANN, N.B., LÜTZHØFT, H.-C.H., ÅGERSTRAND, M. and BAUN, A., In prep. A
transparent method to assess the regulatory adequacy of nanoecotoxicity studies.
HARTMANN, N.B., SKJOLDING, L.M., HANSEN, S.F., KJØLHOLT, J., GOTTSCHALK, F. and
BAUN, A., 2014. Environmental fate and behaviour of nanomaterials. Danish EPA, pp. 1-89.
HARTMANN, N.B., VON DER KAMMER, F., HOFMANN, T., BAALOUSHA, M., OTTOFUELLING,
S. and BAUN, A., 2010. Algal testing of titanium dioxide nanoparticles-Testing considerations,
inhibitory effects and modification of cadmium bioavailability. Toxicology, 269(2-3), pp. 190-197.
HARTMANN, N.B., ENGELBREKT, C., ZHANG, J., ULSTRUP, J., KUSK, K.O. and BAUN, A., 2013.
The challenges of testing metal and metal oxide nanoparticles in algal bioassays: titanium dioxide
and gold nanoparticles as case studies. Nanotoxicology, 7(6), pp. 1082-1094.
HASSELLOEV, M., READMAN, J.W., RANVILLE, J.F. and TIEDE, K., 2008. Nanoparticle analysis
and characterization methodologies in environmental risk assessment of engineered nanoparticles.
Ecotoxicology, 17(5), pp. 344-361.
HEINLAAN, M., IVASK, A., BLINOVA, I., DUBOURGUIER, H. and KAHRU, A., 2008. Toxicity of
nanosized and bulk ZnO, CuO and TiO2 to bacteria Vibrio fischeri and crustaceans Daphnia magna
and Thamnocephalus platyurus. Chemosphere, 71(7), pp. 1308-1316.
ISO, 2012. ISO 6341: Water quality — Determination of the inhibition of the mobility of Daphnia
magna Straus (Cladocera, Crustacea) — Acute toxicity test. International Organization for
Standardization.
JACOBS, R., GOTTSCHALK, F., LÜTZHØFT, H.-C.H., BAUN, A., LASSEN, C., KJØLHOLT, J.,
CHRISTENSEN, F. and NOWACK, B., In prep. Probabilistic species sensitivity distributions (pSSD)
for environmental risk assessment of some nanomaterials (nano-CeO2, nano-CuO and nano-Fe).
JARVIS, T.A., MILLER, R.J., LENIHAN, H.S. and BIELMYER, G.K., 2013. Toxicity of ZnO
nanoparticles to the copepod Acartia tonsa, exposed through a phytoplankton diet. Environmental
Toxicology and Chemistry, 32(6), pp. 1264-1269.
JOHNSON, A.C., DUMONT, E., KELLER, V. and WILLIAMS, R.J., 2014. Report on ENP risk
assessment in the different usage scenarios; this will include gap analysis, critical appraisal of
available hazard and exposure assessment methodologies and the identification of vulnerable
species and environmental compartments The NanoFate project, , pp. 1-3.
82 Environmental effects of engineered nanomaterials
KASEMETS, K., SUPPI, S., KUENNIS-BERES, K. and KAHRU, A., 2013. Toxicity of CuO
Nanoparticles to Yeast Saccharomyces cerevisiae BY4741 Wild-Type and Its Nine Isogenic Single-
Gene Deletion Mutants. Chemical research in toxicology, 26(3), pp. 356-367.
KELLER, A.A., GARNER, K., MILLER, R.J. and LENIHAN, H.S., 2012. Toxicity of Nano-Zero
Valent Iron to Freshwater and Marine Organisms. Plos One, 7(8), pp. e43983.
KENNEDY, A.J., MELBY, N.L., MOSER, R.D., BEDNAR, A.J., SON, S.F., LOUNDS, C.D., LAIRD,
J.G., NELLUMS, R.R., JOHNSON, D.R. and STEEVENS, J.A., 2013. Fate and Toxicity of CuO
Nanospheres and Nanorods used in Al/CuO Nanothermites Before and After Combustion.
Environmental science & technology, 47(19), pp. 11258-11267.
KIM, J., PARK, Y., YOON, T.H., YOON, C.S. and CHOI, K., 2010. Phototoxicity of CdSe/ZnSe
quantum dots with surface coatings of 3-mercaptopropionic acid or tri-n-octylphosphine
oxide/gum arabic in Daphnia magna under environmentally relevant UV-B light. Aquatic
Toxicology, 97(2), pp. 116-124.
KLIMISCH, H., ANDREAE, M. and TILLMANN, U., 1997. A systematic approach for evaluating the
quality of experimental toxicological and ecotoxicological data. Regulatory Toxicology and
Pharmacology, 25(1), pp. 1-5.
LEE, S., KIM, S. and CHOI, J., 2009. Genotoxicity and ecotoxicity assays using the freshwater
crustacean Daphnia magna and the larva of the aquatic midge Chironomus riparius to screen the
ecological risks of nanoparticle exposure. Environmental toxicology and pharmacology, 28(1), pp.
86-91.
LEE, W. and AN, Y., 2013. Effects of zinc oxide and titanium dioxide nanoparticles on green algae
under visible, UVA, and UVB irradiations: No evidence of enhanced algal toxicity under UV pre-
irradiation. Chemosphere, 91(4), pp. 536-544.
LI, K., CHEN, Y., ZHANG, W., PU, Z., JIANG, L. and CHEN, Y., 2012. Surface Interactions Affect
the Toxicity of Engineered Metal Oxide Nanoparticles toward Paramecium. Chemical research in
toxicology, 25(8), pp. 1675-1681.
LIU, X., VINSON, D., ABT, D., HURT, R.H. and RAND, D.M., 2009. Differential Toxicity of Carbon
Nanomaterials in Drosophila: Larval Dietary Uptake Is Benign, but Adult Exposure Causes
Locomotor Impairment and Mortality. Environmental science & technology, 43(16), pp. 6357-
6363.
LONG, Z., JI, J., YANG, K., LIN, D. and WU, F., 2012. Systematic and Quantitative Investigation of
the Mechanism of Carbon Nanotubes' Toxicity toward Algae. Environmental science & technology,
46(15), pp. 8458-8466.
LOPES, S., RIBEIRO, F., WOJNAROWICZ, J., LOJKOWSKI, W., JURKSCHAT, K., CROSSLEY, A.,
SOARES, A.M.V.M. and LOUREIRO, S., 2014. Zinc Oxide Nanoparticles Toxicity to Daphnia
Magna: Size-Dependent Effects and Dissolution. Environmental Toxicology and Chemistry, 33(1),
pp. 190-198.
LUISA FERNANDEZ-CRUZ, M., LAMMEL, T., CONNOLLY, M., CONDE, E., ISABEL BARRADO,
A., DERICK, S., PEREZ, Y., FERNANDEZ, M., FURGER, C. and MARIA NAVAS, J., 2013.
Comparative cytotoxicity induced by bulk and nanoparticulated ZnO in the fish and human
hepatoma cell lines PLHC-1 and Hep G2. Nanotoxicology, 7(5), pp. 935-952.
Environmental effects of engineered nanomaterials 83
MACKAY, D., MCCARTY, L.S. and ARNOT, J.A., 2014. Relationships between Exposure and Dose
in Aquatic Toxicity Tests for Organic Chemicals. Environmental Toxicology and Chemistry, 33(9),
pp. 2038-2046.
MANIER, N., BADO-NILLES, A., DELALAIN, P., AGUERRE-CHARIOL, O. and PANDARD, P.,
2013. Ecotoxicity of non-aged and aged CeO2 nanomaterials towards freshwater microalgae.
Environmental Pollution, 180, pp. 63-70.
MANUSADZIANAS, L., CAILLET, C., FACHETTI, L., GYLYTE, B., GRIGUTYTE, R.,
JURKONIENE, S., KARITONAS, R., SADAUSKAS, K., THOMAS, F., VITKUS, R. and FERARD, J.,
2012. Toxicity of copper oxide nanoparticle suspensions to aquatic biota. Environmental
Toxicology and Chemistry, 31(1), pp. 108-114.
MARKOVA, Z., NOVAK, P., KASLIK, J., PLACHTOVA, P., BRAZDOVA, M., JANCULA, D.,
SISKOVA, K.M., MACHALA, L., MARSALEK, B., ZBORIL, R. and VARMA, R., 2014. Iron(II,III)-
Polyphenol Complex Nanoparticles Derived from Green Tea with Remarkable Ecotoxicological
Impact. Acs Sustainable Chemistry & Engineering, 2(7), pp. 1674-1680.
MARSALEK, B., JANCULA, D., MARSALKOVA, E., MASHLAN, M., SAFAROVA, K., TUCEK, J. and
ZBORIL, R., 2012. Multimodal Action and Selective Toxicity of Zerovalent Iron Nanoparticles
against Cyanobacteria. Environmental science & technology, 46(4), pp. 2316-2323.
MELEGARI, S.P., PERREAULT, F., RIBEIRO COSTA, R.H., POPOVIC, R. and MATIAS, W.G.,
2013. Evaluation of toxicity and oxidative stress induced by copper oxide nanoparticles in the green
alga Chlamydomonas reinhardtii. Aquatic Toxicology, 142, pp. 431-440.
MESARIC, T., SEPCIC, K., PIAZZA, V., GAMBARDELLA, C., GARAVENTA, F., DROBNE, D. and
FAIMALI, M., 2013. Effects of nano carbon black and single-layer graphene oxide on settlement,
survival and swimming behaviour of Amphibalanus amphitrite larvae. Chemistry and Ecology,
29(7), pp. 643-652.
MOERMOND, C.T.A., KASE, R., KORKARIC, M. and ÅGERSTRAND, M., In prep. CRED - Criteria
for Reporting and Evaluating ecotoxicity Data. Part III. An improved method for reliability and
relevance evaluation.
MORTIMER, M., KASEMETS, K. and KAHRU, A., 2010. Toxicity of ZnO and CuO nanoparticles to
ciliated protozoa Tetrahymena thermophila. Toxicology, 269(2-3), pp. 182-189.
MUSEE, N., 2011. Simulated environmental risk estimation of engineered nanomaterials: A case of
cosmetics in Johannesburg City. Human & experimental toxicology, 30(9), pp. 1181-1195.
NAVARRO, E., PICCAPIETRA, F., WAGNER, B., MARCONI, F., KAEGI, R., ODZAK, N., SIGG, L.
and BEHRA, R., 2008. Toxicity of Silver Nanoparticles to Chlamydomonas reinhardtii.
Environmental science & technology, 42(23), pp. 8959-8964.
NOTTER, D.A., MITRANO, D.M. and NOWACK, B., 2014. Are Nanosized Or Dissolved Metals More
Toxic in the Environment? a Meta-Analysis. Environmental Toxicology and Chemistry, 33(12), pp.
2733-2739.
OBERDORSTER, G., OBERDORSTER, E. and OBERDORSTER, J., 2005. Nanotoxicology: An
emerging discipline evolving from studies of ultrafine particles. Environmental health perspectives,
113(7), pp. 823-839.
84 Environmental effects of engineered nanomaterials
OECD, 2014. Series on the Safety of Manufactured Nanomaterials No. 40 ECOTOXICOLOGY AND
ENVIRONMENTAL FATE OF MANUFACTURED NANOMATERIALS: TEST GUIDELINES Expert
Meeting Report. Organisation for Economic Co-operation and Development (OECD), Paris,
France.
OECD, 2010. Series on the Safety of Manufactured Nanomaterials No. 21 REPORT OF THE
WORKSHOP ON RISK ASSESSMENT OF MANUFACTURED NANOMATERIALS IN A
REGULATORY CONTEXT. Organisation for Economic Co-operation and Development (OECD),
Paris, France.
OECD, 2000. OECD SERIES ON TESTING AND ASSESSMENT Number 23 GUIDANCE
DOCUMENT ON AQUATIC TOXICITY TESTING OF DIFFICULT SUBSTANCES AND MIXTURES.
Organisation for Economic Co-operation and Development (OECD), Paris, France.
PANG, C., SELCK, H., BANTA, G.T., MISRA, S.K., BERHANU, D., DYBOWSKA, A., VALSAMI-
JONES, E. and FORBES, V.E., 2013. Bioaccumulation, toxicokinetics, and effects of copper from
sediment spiked with aqueous Cu, nano-CuO, or micro-CuO in the deposit-feeding snail,
Potamopyrgus antipodarum. Environmental Toxicology and Chemistry, 32(7), pp. 1561-1573.
PANG, C., SELCK, H., MISRA, S.K., BERHANU, D., DYBOWSKA, A., VALSAMI-JONES, E. and
FORBES, V.E., 2012. Effects of sediment-associated copper to the deposit-feeding snail,
Potamopyrgus antipodarum: A comparison of Cu added in aqueous form or as nano- and micro-
CuO particles. Aquatic Toxicology, 106, pp. 114-122.
POKHREL, L.R. and DUBEY, B., 2012. Potential Impact of Low-Concentration Silver Nanoparticles
on Predator-Prey Interactions between Predatory Dragonfly Nymphs and Daphnia magna as a Prey.
Environmental science & technology, 46(14), pp. 7755-7762.
POKHREL, L.R., SILVA, T., DUBEY, B., EL BADAWY, A.M., TOLAYMAT, T.M. and
SCHEUERMAN, P.R., 2012. Rapid screening of aquatic toxicity of several metal-based
nanoparticles using the MetPLATE (TM) bioassay. Science of the Total Environment, 426, pp. 414-
422.
PRADHAN, A., SEENA, S., PASCOAL, C. and CASSIO, F., 2012. Copper oxide nanoparticles can
induce toxicity to the freshwater shredder Allogamus ligonifer. Chemosphere, 89(9), pp. 1142-1150.
RAMSKOV, T., SELCK, H., BANTA, G., MISRA, S.K., BERHANU, D., VALSAMI-JONES, E. and
FORBES, V.E., 2014. Bioaccumulation and Effects of Different-Shaped Copper Oxide Nanoparticles
in the Deposit-Feeding Snail Potamopyrgus Antipodarum. Environmental Toxicology and
Chemistry, 33(9), pp. 1976-1987.
RECILLAS, S., GARCIA, A., GONZALEZ, E., CASALS, E., PUNTES, V., SANCHEZ, A. and FONT,
X., 2011. Use of CeO2, TiO2 and Fe3O4 nanoparticles for the removal of lead from water Toxicity of
nanoparticles and derived compounds. Desalination, 277(1-3), pp. 213-220.
RODD, A.L., CREIGHTON, M.A., VASLET, C.A., RENE RANGEL-MENDEZ, J., HURT, R.H. and
KANE, A.B., 2014. Effects of Surface-Engineered Nanoparticle-Based Dispersants for Marine Oil
Spills on the Model Organism Artemia franciscana. Environmental science & technology, 48(11),
pp. 6419-6427.
RODEA-PALOMARES, I., BOLTES, K., FERNANDEZ-PINAS, F., LEGANES, F., GARCIA-CALVO,
E., SANTIAGO, J. and ROSAL, R., 2011. Physicochemical Characterization and Ecotoxicological
Assessment of CeO2 Nanoparticles Using Two Aquatic Microorganisms. Toxicological Sciences,
119(1), pp. 135-145.
Environmental effects of engineered nanomaterials 85
ROGERS, N.J., FRANKLIN, N.M., APTE, S.C., BATLEY, G.E., ANGEL, B.M., LEAD, J.R. and
BAALOUSHA, M., 2010. Physico-chemical behaviour and algal toxicity of nanoparticulate CeO2 in
freshwater. Environmental Chemistry, 7(1), pp. 50-60.
ROH, J., PARK, Y., PARK, K. and CHOI, J., 2010. Ecotoxicological investigation of CeO2 and TiO2
nanoparticles on the soil nematode Caenorhabditis elegans using gene expression, growth, fertility,
and survival as endpoints. Environmental toxicology and pharmacology, 29(2), pp. 167-172.
ROSENKRANTZ, R.T., 2013. Influence of test conditions and exposure duration on the result of
ecotoxicological tests: Consequences for derivation of environmental quality standards. PhD thesis,
the Technical University of Denmark.
ROSSETTO, A.L.D.O.F., VICENTINI, D.S., COSTA, C.H., MELEGARI, S.P. and MATIAS, W.G.,
2014. Synthesis, characterization and toxicological evaluation of a core-shell copper
oxide/polyaniline nanocomposite. Chemosphere, 108, pp. 107-114.
ROUSK, J., ACKERMANN, K., CURLING, S.F. and JONES, D.L., 2012. Comparative Toxicity of
Nanoparticulate CuO and ZnO to Soil Bacterial Communities. Plos One, 7(3), pp. e34197.
ROYAL COMMISSION, 2008. Novel materials in the environment: the case of nanotechnology.
Royal Commission on Environmental Pollution.
SADIQ, I.M., DALAI, S., CHANDRASEKARAN, N. and MUKHERJEE, A., 2011. Ecotoxicity study of
titania (TiO2) NPs on two microalgae species: Scenedesmus sp and Chlorella sp. Ecotoxicology and
environmental safety, 74(5), pp. 1180-1187.
SCHNEIDER, K., SCHWARZ, M., BURKHOLDER, I., KOPP-SCHNEIDER, A., EDLER, L.,
KINSNER-OVASKAINEN, A., HARTUNG, T. and HOFFMANN, S., 2009. "ToxRTool", a new tool to
assess the reliability of toxicological data. Toxicology letters, 189(2), pp. 138-144.
SCHWAB, F., BUCHELI, T.D., LUKHELE, L.P., MAGREZ, A., NOWACK, B., SIGG, L. and
KNAUER, K., 2011. Are Carbon Nanotube Effects on Green Algae Caused by Shading and
Agglomeration? Environmental science & technology, 45(14), pp. 6136-6144.
SOM, C., NOWACK, B., KRUG, H.F. and WICK, P., 2013. Toward the Development of Decision
Supporting Tools That Can Be Used for Safe Production and Use of Nanomaterials. Accounts of
Chemical Research, 46(3), pp. 863-872.
SØRENSEN, S.N. and BAUN, A., In Press. Controlling silver nanoparticle exposure in algal toxicity
testing – a matter of timing. Nanotoxicology.
STONE, V., HANKIN, S., AITKEN, R., BAUN, A., CHRISTENSEN, F., FERNANDES, T., HANSEN,
S.F., HARTMANN, N.B., HUTCHISON, G., JOHNSTON, H., MICHELETTI, C., PETERS, S., ROSS,
B., SOKULL-KLÜTTGEN, B., STARK, D. and TRAN, L., 2010. Engineered nanoparticles: Review of
health and environmental safety. Final report of FP7 Coordination and Support Action.
TIEDE, K., HASSELLOV, M., BREITBARTH, E., CHAUDHRY, Q. and BOXALL, A.B.A., 2009.
Considerations for environmental fate and ecotoxicity testing to support environmental risk
assessments for engineered nanoparticles. Journal of Chromatography a, 1216(3), pp. 503-509.
TOMILINA, I.I., GREMYACHIKH, V.A., MYL'NIKOV, A.P. and KOMOV, V.T., 2011. Changes in
biological characteristics of freshwater heterotrophic flagellates and cladocerans under the effect of
metal oxide nano- and microparticles. Inland Water Biology, 4(4), pp. 475-483.
86 Environmental effects of engineered nanomaterials
TRAPP, S., FRANCO, A. and MACKAY, D., 2010. Activity-Based Concept for Transport and
Partitioning of Ionizing Organics. Environmental science & technology, 44(16), pp. 6123-6129.
VAN HOECKE, K., DE SCHAMPHELAERE, K.A.C., VAN DER MEEREN, P., LUCAS, S. and
JANSSEN, C.R., 2008. Ecotoxicity of silica nanoparticles to the green alga Pseudokirchneriella
subcapitata: Importance of surface area. Environmental Toxicology and Chemistry, 27(9), pp.
1948-1957.
VAN HOECKE, K., QUIK, J.T.K., MANKIEWICZ-BOCZEK, J., DE SCHAMPHELAERE, K.A.C.,
ELSAESSER, A., VAN DER MEEREN, P., BARNES, C., MCKERR, G., HOWARD, C.V., VAN DE
MEENT, D., RYDZYNSKI, K., DAWSON, K.A., SALVATI, A., LESNIAK, A., LYNCH, I.,
SILVERSMIT, G., DE SAMBER, B., VINCZE, L. and JANSSEN, C.R., 2009. Fate and Effects of
CeO2 Nanoparticles in Aquatic Ecotoxicity Tests. Environmental science & technology, 43(12), pp.
4537-4546.
VAN LEEUWEN, C.J. and VERMEIRE, T.G., 2007. Risk assessment of chemicals: An introduction.
Springer, second edition, pp. 1-686.
VELZEBOER, I., HENDRIKS, A.J., RAGAS, A.M.J. and VAN DE MEENT, D., 2008. Aquatic
ecotoxicity tests of some nanomaterials. Environmental Toxicology and Chemistry, 27(9), pp.
1942-1947.
VICARIO-PARES, U., CASTANAGA, L., MARIA LACAVE, J., ORON, M., REIP, P., BERHANU, D.,
VALSAMI-JONES, E., CAJARAVILLE, M.P. and ORBEA, A., 2014. Comparative toxicity of metal
oxide nanoparticles (CuO, ZnO and TiO2) to developing zebrafish embryos. Journal of
Nanoparticle Research, 16(8), pp. 2550.
WANG, J., ZHANG, X., CHEN, Y., SOMMERFELD, M. and HU, Q., 2008. Toxicity assessment of
manufactured nanomaterials using the unicellular green alga Chlamydomonas reinhardtii.
Chemosphere, 73(7), pp. 1121-1128.
WICKSON, F., HARTMANN, N.B., HJORTH, R., HANSEN, S.F., WYNNE, B. and BAUN, A., 2014.
Balancing scientific tensions. Nature Nanotechnology, 9(11), pp. 870-870.
WIENCH, K., WOHLLEBEN, W., HISGEN, V., RADKE, K., SALINAS, E., ZOK, S. and
LANDSIEDEL, R., 2009. Acute and chronic effects of nano- and non-nano-scale TiO2 and ZnO
particles on mobility and reproduction of the freshwater invertebrate Daphnia magna.
Chemosphere, 76(10), pp. 1356-1365.
YEO, M. and KANG, M., 2008. Effects of nanometer sized silver materials on biological toxicity
during zebrafish embryogenesis. Bulletin of the Korean Chemical Society, 29(6), pp. 1179-1184.
ZHAO, C. and WANG, W., 2011. Comparison of Acute and Chronic Toxicity of Silver Nanoparticles
and Silver Nitrate to Daphnia Magna. Environmental Toxicology and Chemistry, 30(4), pp. 885-
892.
ZHU, X., TIAN, S. and CAI, Z., 2012. Toxicity Assessment of Iron Oxide Nanoparticles in Zebrafish
(Danio rerio) Early Life Stages. Plos One, 7(9), pp. e46286.

Environmental effects of engineered nanomaterials 87
Appendices
Appendix 1: Detailed overview of effect studies and their risk assessment adequacies. .................... 88 Appendix 2: ECHA Part R.10: Table R.10-4 Assessment factor to derive a PNECaquatic. .................. 106 Appendix 3: Guidance text according to (Moermond, Kase et al. In prep) on criteria used to evaluate
reliability of an effect study on ENMs (referring to criteria numbers in Table 9). ........................... 107
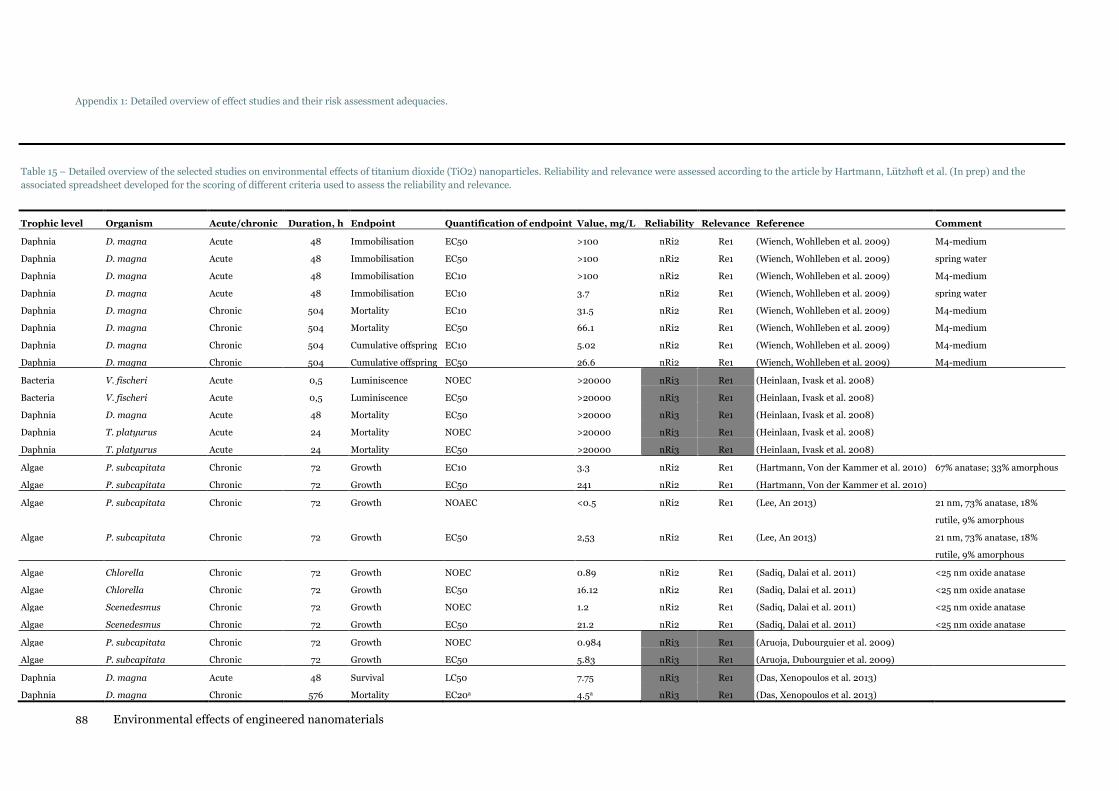
88 Environmental effects of engineered nanomaterials
Appendix 1: Detailed overview of effect studies and their risk assessment adequacies.
Table 15 – Detailed overview of the selected studies on environmental effects of titanium dioxide (TiO2) nanoparticles. Reliability and relevance were assessed according to the article by Hartmann, Lützhøft et al. (In prep) and the
associated spreadsheet developed for the scoring of different criteria used to assess the reliability and relevance.
Trophic level Organism Acute/chronic Duration, h Endpoint Quantification of endpoint Value, mg/L Reliability Relevance Reference Comment
Daphnia D. magna Acute 48 Immobilisation EC50 >100 nRi2 Re1 (Wiench, Wohlleben et al. 2009) M4-medium
Daphnia D. magna Acute 48 Immobilisation EC50 >100 nRi2 Re1 (Wiench, Wohlleben et al. 2009) spring water
Daphnia D. magna Acute 48 Immobilisation EC10 >100 nRi2 Re1 (Wiench, Wohlleben et al. 2009) M4-medium
Daphnia D. magna Acute 48 Immobilisation EC10 3.7 nRi2 Re1 (Wiench, Wohlleben et al. 2009) spring water
Daphnia D. magna Chronic 504 Mortality EC10 31.5 nRi2 Re1 (Wiench, Wohlleben et al. 2009) M4-medium
Daphnia D. magna Chronic 504 Mortality EC50 66.1 nRi2 Re1 (Wiench, Wohlleben et al. 2009) M4-medium
Daphnia D. magna Chronic 504 Cumulative offspring EC10 5.02 nRi2 Re1 (Wiench, Wohlleben et al. 2009) M4-medium
Daphnia D. magna Chronic 504 Cumulative offspring EC50 26.6 nRi2 Re1 (Wiench, Wohlleben et al. 2009) M4-medium
Bacteria V. fischeri Acute 0,5 Luminiscence NOEC >20000 nRi3 Re1 (Heinlaan, Ivask et al. 2008)
Bacteria V. fischeri Acute 0,5 Luminiscence EC50 >20000 nRi3 Re1 (Heinlaan, Ivask et al. 2008)
Daphnia D. magna Acute 48 Mortality EC50 >20000 nRi3 Re1 (Heinlaan, Ivask et al. 2008)
Daphnia T. platyurus Acute 24 Mortality NOEC >20000 nRi3 Re1 (Heinlaan, Ivask et al. 2008)
Daphnia T. platyurus Acute 24 Mortality EC50 >20000 nRi3 Re1 (Heinlaan, Ivask et al. 2008)
Algae P. subcapitata Chronic 72 Growth EC10 3.3 nRi2 Re1 (Hartmann, Von der Kammer et al. 2010) 67% anatase; 33% amorphous
Algae P. subcapitata Chronic 72 Growth EC50 241 nRi2 Re1 (Hartmann, Von der Kammer et al. 2010)
Algae P. subcapitata Chronic 72 Growth NOAEC <0.5 nRi2 Re1 (Lee, An 2013) 21 nm, 73% anatase, 18%
rutile, 9% amorphous
Algae P. subcapitata Chronic 72 Growth EC50 2,53 nRi2 Re1 (Lee, An 2013) 21 nm, 73% anatase, 18%
rutile, 9% amorphous
Algae Chlorella Chronic 72 Growth NOEC 0.89 nRi2 Re1 (Sadiq, Dalai et al. 2011) <25 nm oxide anatase
Algae Chlorella Chronic 72 Growth EC50 16.12 nRi2 Re1 (Sadiq, Dalai et al. 2011) <25 nm oxide anatase
Algae Scenedesmus Chronic 72 Growth NOEC 1.2 nRi2 Re1 (Sadiq, Dalai et al. 2011) <25 nm oxide anatase
Algae Scenedesmus Chronic 72 Growth EC50 21.2 nRi2 Re1 (Sadiq, Dalai et al. 2011) <25 nm oxide anatase
Algae P. subcapitata Chronic 72 Growth NOEC 0.984 nRi3 Re1 (Aruoja, Dubourguier et al. 2009)
Algae P. subcapitata Chronic 72 Growth EC50 5.83 nRi3 Re1 (Aruoja, Dubourguier et al. 2009)
Daphnia D. magna Acute 48 Survival LC50 7.75 nRi3 Re1 (Das, Xenopoulos et al. 2013)
Daphnia D. magna Chronic 576 Mortality EC20a 4.5a nRi3 Re1 (Das, Xenopoulos et al. 2013)
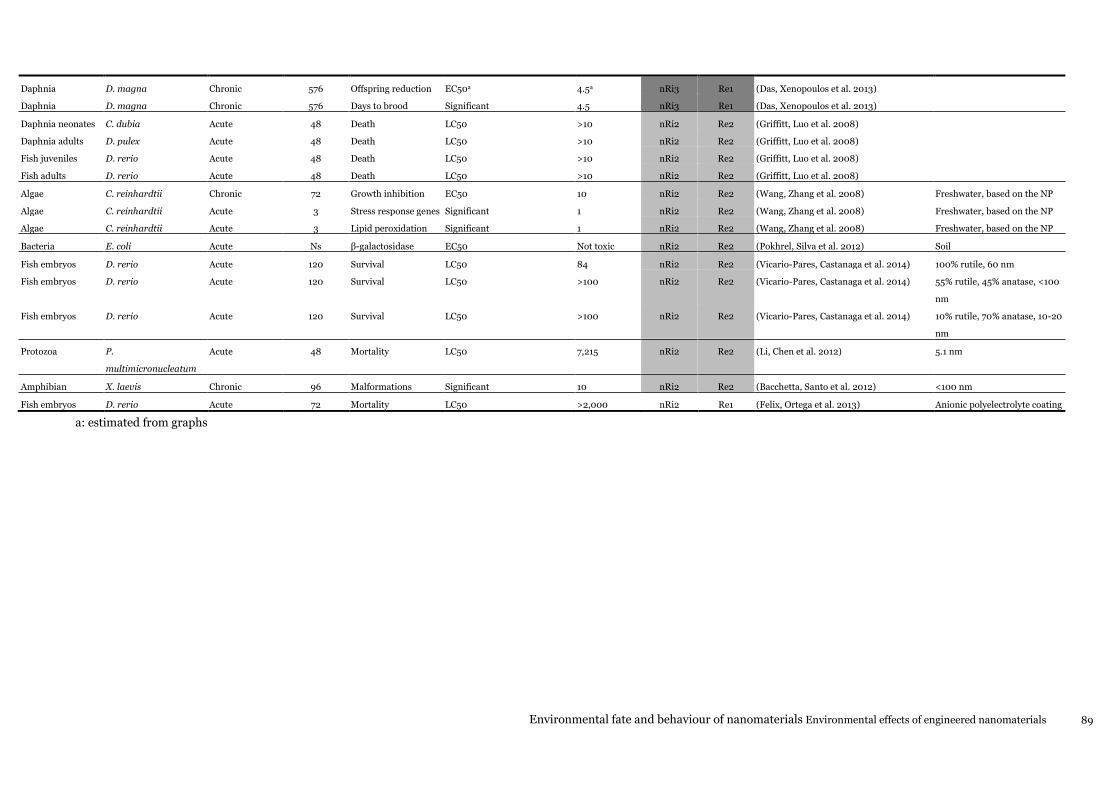
Environmental fate and behaviour of nanomaterials Environmental effects of engineered nanomaterials 89
Daphnia D. magna Chronic 576 Offspring reduction EC50a 4.5a nRi3 Re1 (Das, Xenopoulos et al. 2013)
Daphnia D. magna Chronic 576 Days to brood Significant 4.5 nRi3 Re1 (Das, Xenopoulos et al. 2013)
Daphnia neonates C. dubia Acute 48 Death LC50 >10 nRi2 Re2 (Griffitt, Luo et al. 2008)
Daphnia adults D. pulex Acute 48 Death LC50 >10 nRi2 Re2 (Griffitt, Luo et al. 2008)
Fish juveniles D. rerio Acute 48 Death LC50 >10 nRi2 Re2 (Griffitt, Luo et al. 2008)
Fish adults D. rerio Acute 48 Death LC50 >10 nRi2 Re2 (Griffitt, Luo et al. 2008)
Algae C. reinhardtii Chronic 72 Growth inhibition EC50 10 nRi2 Re2 (Wang, Zhang et al. 2008) Freshwater, based on the NP
Algae C. reinhardtii Acute 3 Stress response genes Significant 1 nRi2 Re2 (Wang, Zhang et al. 2008) Freshwater, based on the NP
Algae C. reinhardtii Acute 3 Lipid peroxidation Significant 1 nRi2 Re2 (Wang, Zhang et al. 2008) Freshwater, based on the NP
Bacteria E. coli Acute Ns β-galactosidase EC50 Not toxic nRi2 Re2 (Pokhrel, Silva et al. 2012) Soil
Fish embryos D. rerio Acute 120 Survival LC50 84 nRi2 Re2 (Vicario-Pares, Castanaga et al. 2014) 100% rutile, 60 nm
Fish embryos D. rerio Acute 120 Survival LC50 >100 nRi2 Re2 (Vicario-Pares, Castanaga et al. 2014) 55% rutile, 45% anatase, <100
nm
Fish embryos D. rerio Acute 120 Survival LC50 >100 nRi2 Re2 (Vicario-Pares, Castanaga et al. 2014) 10% rutile, 70% anatase, 10-20
nm
Protozoa P.
multimicronucleatum
Acute 48 Mortality LC50 7,215 nRi2 Re2 (Li, Chen et al. 2012) 5.1 nm
Amphibian X. laevis Chronic 96 Malformations Significant 10 nRi2 Re2 (Bacchetta, Santo et al. 2012) <100 nm
Fish embryos D. rerio Acute 72 Mortality LC50 >2,000 nRi2 Re1 (Felix, Ortega et al. 2013) Anionic polyelectrolyte coating
a: estimated from graphs
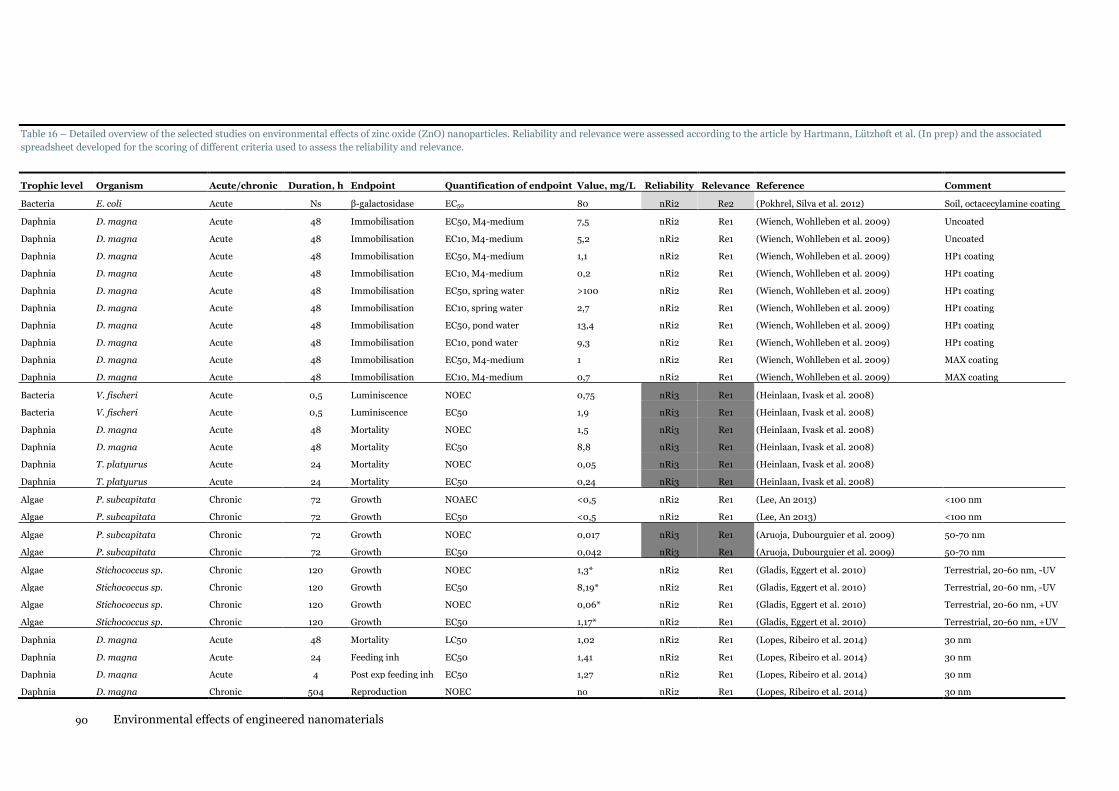
90 Environmental effects of engineered nanomaterials
Table 16 – Detailed overview of the selected studies on environmental effects of zinc oxide (ZnO) nanoparticles. Reliability and relevance were assessed according to the article by Hartmann, Lützhøft et al. (In prep) and the associated
spreadsheet developed for the scoring of different criteria used to assess the reliability and relevance.
Trophic level Organism Acute/chronic Duration, h Endpoint Quantification of endpoint Value, mg/L Reliability Relevance Reference Comment
Bacteria E. coli Acute Ns β-galactosidase EC50 80 nRi2 Re2 (Pokhrel, Silva et al. 2012) Soil, octacecylamine coating
Daphnia D. magna Acute 48 Immobilisation EC50, M4-medium 7,5 nRi2 Re1 (Wiench, Wohlleben et al. 2009) Uncoated
Daphnia D. magna Acute 48 Immobilisation EC10, M4-medium 5,2 nRi2 Re1 (Wiench, Wohlleben et al. 2009) Uncoated
Daphnia D. magna Acute 48 Immobilisation EC50, M4-medium 1,1 nRi2 Re1 (Wiench, Wohlleben et al. 2009) HP1 coating
Daphnia D. magna Acute 48 Immobilisation EC10, M4-medium 0,2 nRi2 Re1 (Wiench, Wohlleben et al. 2009) HP1 coating
Daphnia D. magna Acute 48 Immobilisation EC50, spring water >100 nRi2 Re1 (Wiench, Wohlleben et al. 2009) HP1 coating
Daphnia D. magna Acute 48 Immobilisation EC10, spring water 2,7 nRi2 Re1 (Wiench, Wohlleben et al. 2009) HP1 coating
Daphnia D. magna Acute 48 Immobilisation EC50, pond water 13,4 nRi2 Re1 (Wiench, Wohlleben et al. 2009) HP1 coating
Daphnia D. magna Acute 48 Immobilisation EC10, pond water 9,3 nRi2 Re1 (Wiench, Wohlleben et al. 2009) HP1 coating
Daphnia D. magna Acute 48 Immobilisation EC50, M4-medium 1 nRi2 Re1 (Wiench, Wohlleben et al. 2009) MAX coating
Daphnia D. magna Acute 48 Immobilisation EC10, M4-medium 0,7 nRi2 Re1 (Wiench, Wohlleben et al. 2009) MAX coating
Bacteria V. fischeri Acute 0,5 Luminiscence NOEC 0,75 nRi3 Re1 (Heinlaan, Ivask et al. 2008)
Bacteria V. fischeri Acute 0,5 Luminiscence EC50 1,9 nRi3 Re1 (Heinlaan, Ivask et al. 2008)
Daphnia D. magna Acute 48 Mortality NOEC 1,5 nRi3 Re1 (Heinlaan, Ivask et al. 2008)
Daphnia D. magna Acute 48 Mortality EC50 8,8 nRi3 Re1 (Heinlaan, Ivask et al. 2008)
Daphnia T. platyurus Acute 24 Mortality NOEC 0,05 nRi3 Re1 (Heinlaan, Ivask et al. 2008)
Daphnia T. platyurus Acute 24 Mortality EC50 0,24 nRi3 Re1 (Heinlaan, Ivask et al. 2008)
Algae P. subcapitata Chronic 72 Growth NOAEC <0,5 nRi2 Re1 (Lee, An 2013) <100 nm
Algae P. subcapitata Chronic 72 Growth EC50 <0,5 nRi2 Re1 (Lee, An 2013) <100 nm
Algae P. subcapitata Chronic 72 Growth NOEC 0,017 nRi3 Re1 (Aruoja, Dubourguier et al. 2009) 50-70 nm
Algae P. subcapitata Chronic 72 Growth EC50 0,042 nRi3 Re1 (Aruoja, Dubourguier et al. 2009) 50-70 nm
Algae Stichococcus sp. Chronic 120 Growth NOEC 1,3* nRi2 Re1 (Gladis, Eggert et al. 2010) Terrestrial, 20-60 nm, -UV
Algae Stichococcus sp. Chronic 120 Growth EC50 8,19* nRi2 Re1 (Gladis, Eggert et al. 2010) Terrestrial, 20-60 nm, -UV
Algae Stichococcus sp. Chronic 120 Growth NOEC 0,06* nRi2 Re1 (Gladis, Eggert et al. 2010) Terrestrial, 20-60 nm, +UV
Algae Stichococcus sp. Chronic 120 Growth EC50 1,17* nRi2 Re1 (Gladis, Eggert et al. 2010) Terrestrial, 20-60 nm, +UV
Daphnia D. magna Acute 48 Mortality LC50 1,02 nRi2 Re1 (Lopes, Ribeiro et al. 2014) 30 nm
Daphnia D. magna Acute 24 Feeding inh EC50 1,41 nRi2 Re1 (Lopes, Ribeiro et al. 2014) 30 nm
Daphnia D. magna Acute 4 Post exp feeding inh EC50 1,27 nRi2 Re1 (Lopes, Ribeiro et al. 2014) 30 nm
Daphnia D. magna Chronic 504 Reproduction NOEC no nRi2 Re1 (Lopes, Ribeiro et al. 2014) 30 nm
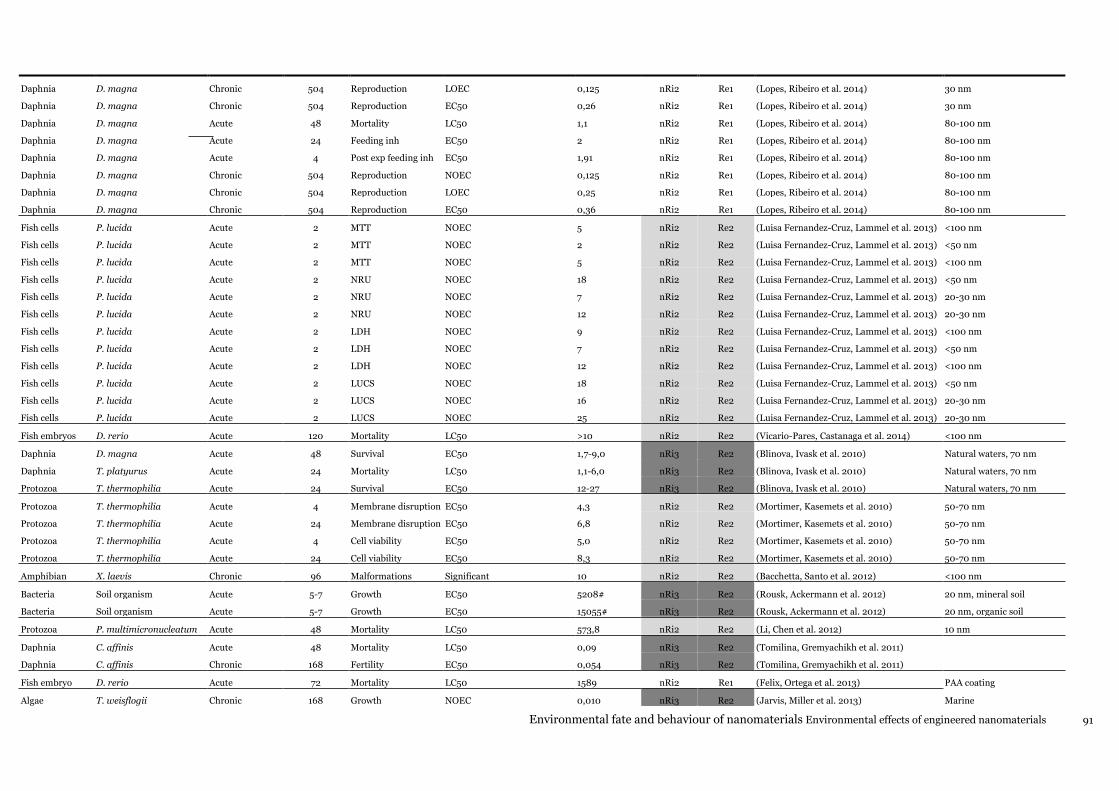
Environmental fate and behaviour of nanomaterials Environmental effects of engineered nanomaterials 91
Daphnia D. magna Chronic 504 Reproduction LOEC 0,125 nRi2 Re1 (Lopes, Ribeiro et al. 2014) 30 nm
Daphnia D. magna Chronic 504 Reproduction EC50 0,26 nRi2 Re1 (Lopes, Ribeiro et al. 2014) 30 nm
Daphnia D. magna Acute 48 Mortality LC50 1,1 nRi2 Re1 (Lopes, Ribeiro et al. 2014) 80-100 nm
Daphnia D. magna Acute 24 Feeding inh EC50 2 nRi2 Re1 (Lopes, Ribeiro et al. 2014) 80-100 nm
Daphnia D. magna Acute 4 Post exp feeding inh EC50 1,91 nRi2 Re1 (Lopes, Ribeiro et al. 2014) 80-100 nm
Daphnia D. magna Chronic 504 Reproduction NOEC 0,125 nRi2 Re1 (Lopes, Ribeiro et al. 2014) 80-100 nm
Daphnia D. magna Chronic 504 Reproduction LOEC 0,25 nRi2 Re1 (Lopes, Ribeiro et al. 2014) 80-100 nm
Daphnia D. magna Chronic 504 Reproduction EC50 0,36 nRi2 Re1 (Lopes, Ribeiro et al. 2014) 80-100 nm
Fish cells P. lucida Acute 2 MTT NOEC 5 nRi2 Re2 (Luisa Fernandez-Cruz, Lammel et al. 2013) <100 nm
Fish cells P. lucida Acute 2 MTT NOEC 2 nRi2 Re2 (Luisa Fernandez-Cruz, Lammel et al. 2013) <50 nm
Fish cells P. lucida Acute 2 MTT NOEC 5 nRi2 Re2 (Luisa Fernandez-Cruz, Lammel et al. 2013) <100 nm
Fish cells P. lucida Acute 2 NRU NOEC 18 nRi2 Re2 (Luisa Fernandez-Cruz, Lammel et al. 2013) <50 nm
Fish cells P. lucida Acute 2 NRU NOEC 7 nRi2 Re2 (Luisa Fernandez-Cruz, Lammel et al. 2013) 20-30 nm
Fish cells P. lucida Acute 2 NRU NOEC 12 nRi2 Re2 (Luisa Fernandez-Cruz, Lammel et al. 2013) 20-30 nm
Fish cells P. lucida Acute 2 LDH NOEC 9 nRi2 Re2 (Luisa Fernandez-Cruz, Lammel et al. 2013) <100 nm
Fish cells P. lucida Acute 2 LDH NOEC 7 nRi2 Re2 (Luisa Fernandez-Cruz, Lammel et al. 2013) <50 nm
Fish cells P. lucida Acute 2 LDH NOEC 12 nRi2 Re2 (Luisa Fernandez-Cruz, Lammel et al. 2013) <100 nm
Fish cells P. lucida Acute 2 LUCS NOEC 18 nRi2 Re2 (Luisa Fernandez-Cruz, Lammel et al. 2013) <50 nm
Fish cells P. lucida Acute 2 LUCS NOEC 16 nRi2 Re2 (Luisa Fernandez-Cruz, Lammel et al. 2013) 20-30 nm
Fish cells P. lucida Acute 2 LUCS NOEC 25 nRi2 Re2 (Luisa Fernandez-Cruz, Lammel et al. 2013) 20-30 nm
Fish embryos D. rerio Acute 120 Mortality LC50 >10 nRi2 Re2 (Vicario-Pares, Castanaga et al. 2014) <100 nm
Daphnia D. magna Acute 48 Survival EC50 1,7-9,0 nRi3 Re2 (Blinova, Ivask et al. 2010) Natural waters, 70 nm
Daphnia T. platyurus Acute 24 Mortality LC50 1,1-6,0 nRi3 Re2 (Blinova, Ivask et al. 2010) Natural waters, 70 nm
Protozoa T. thermophilia Acute 24 Survival EC50 12-27 nRi3 Re2 (Blinova, Ivask et al. 2010) Natural waters, 70 nm
Protozoa T. thermophilia Acute 4 Membrane disruption EC50 4,3 nRi2 Re2 (Mortimer, Kasemets et al. 2010) 50-70 nm
Protozoa T. thermophilia Acute 24 Membrane disruption EC50 6,8 nRi2 Re2 (Mortimer, Kasemets et al. 2010) 50-70 nm
Protozoa T. thermophilia Acute 4 Cell viability EC50 5,0 nRi2 Re2 (Mortimer, Kasemets et al. 2010) 50-70 nm
Protozoa T. thermophilia Acute 24 Cell viability EC50 8,3 nRi2 Re2 (Mortimer, Kasemets et al. 2010) 50-70 nm
Amphibian X. laevis Chronic 96 Malformations Significant 10 nRi2 Re2 (Bacchetta, Santo et al. 2012) <100 nm
Bacteria Soil organism Acute 5-7 Growth EC50 5208# nRi3 Re2 (Rousk, Ackermann et al. 2012) 20 nm, mineral soil
Bacteria Soil organism Acute 5-7 Growth EC50 15055# nRi3 Re2 (Rousk, Ackermann et al. 2012) 20 nm, organic soil
Protozoa P. multimicronucleatum Acute 48 Mortality LC50 573,8 nRi2 Re2 (Li, Chen et al. 2012) 10 nm
Daphnia C. affinis Acute 48 Mortality LC50 0,09 nRi3 Re2 (Tomilina, Gremyachikh et al. 2011)
Daphnia C. affinis Chronic 168 Fertility EC50 0,054 nRi3 Re2 (Tomilina, Gremyachikh et al. 2011)
Fish embryo D. rerio Acute 72 Mortality LC50 1589 nRi2 Re1 (Felix, Ortega et al. 2013) PAA coating
Algae T. weisflogii Chronic 168 Growth NOEC 0,010 nRi3 Re2 (Jarvis, Miller et al. 2013) Marine
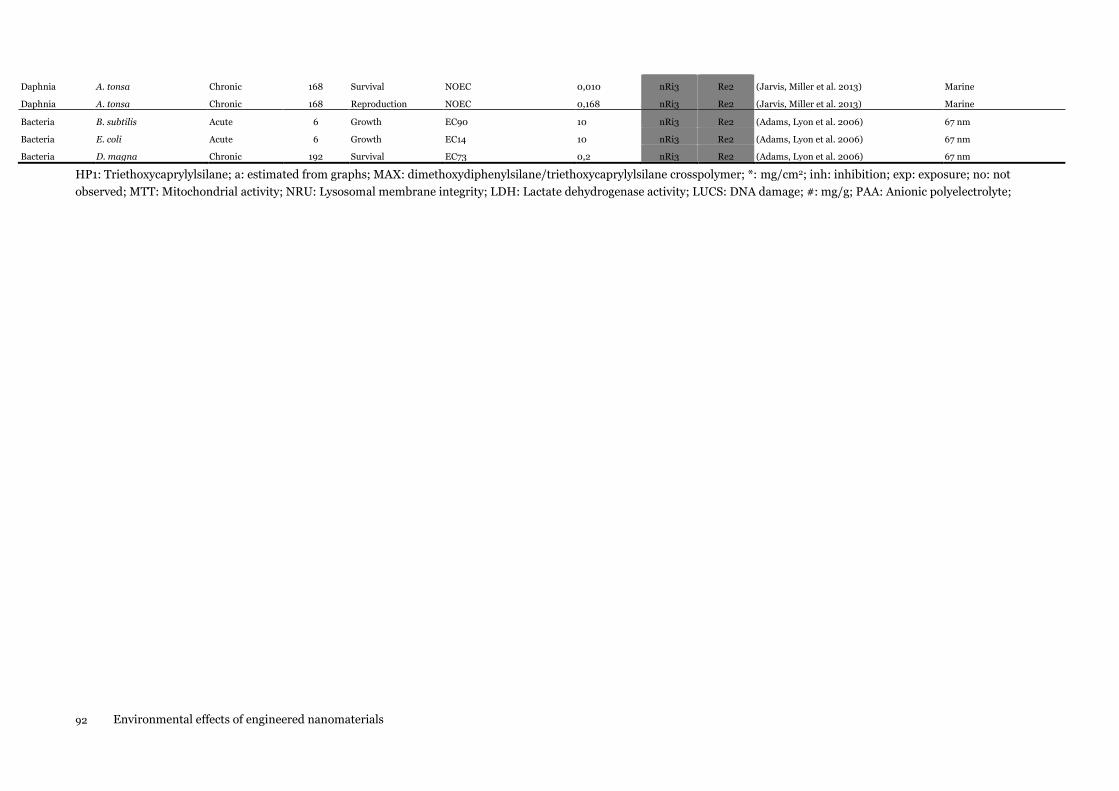
92 Environmental effects of engineered nanomaterials
Daphnia A. tonsa Chronic 168 Survival NOEC 0,010 nRi3 Re2 (Jarvis, Miller et al. 2013) Marine
Daphnia A. tonsa Chronic 168 Reproduction NOEC 0,168 nRi3 Re2 (Jarvis, Miller et al. 2013) Marine
Bacteria B. subtilis Acute 6 Growth EC90 10 nRi3 Re2 (Adams, Lyon et al. 2006) 67 nm
Bacteria E. coli Acute 6 Growth EC14 10 nRi3 Re2 (Adams, Lyon et al. 2006) 67 nm
Bacteria D. magna Chronic 192 Survival EC73 0,2 nRi3 Re2 (Adams, Lyon et al. 2006) 67 nm
HP1: Triethoxycaprylylsilane; a: estimated from graphs; MAX: dimethoxydiphenylsilane/triethoxycaprylylsilane crosspolymer; *: mg/cm2; inh: inhibition; exp: exposure; no: not
observed; MTT: Mitochondrial activity; NRU: Lysosomal membrane integrity; LDH: Lactate dehydrogenase activity; LUCS: DNA damage; #: mg/g; PAA: Anionic polyelectrolyte;
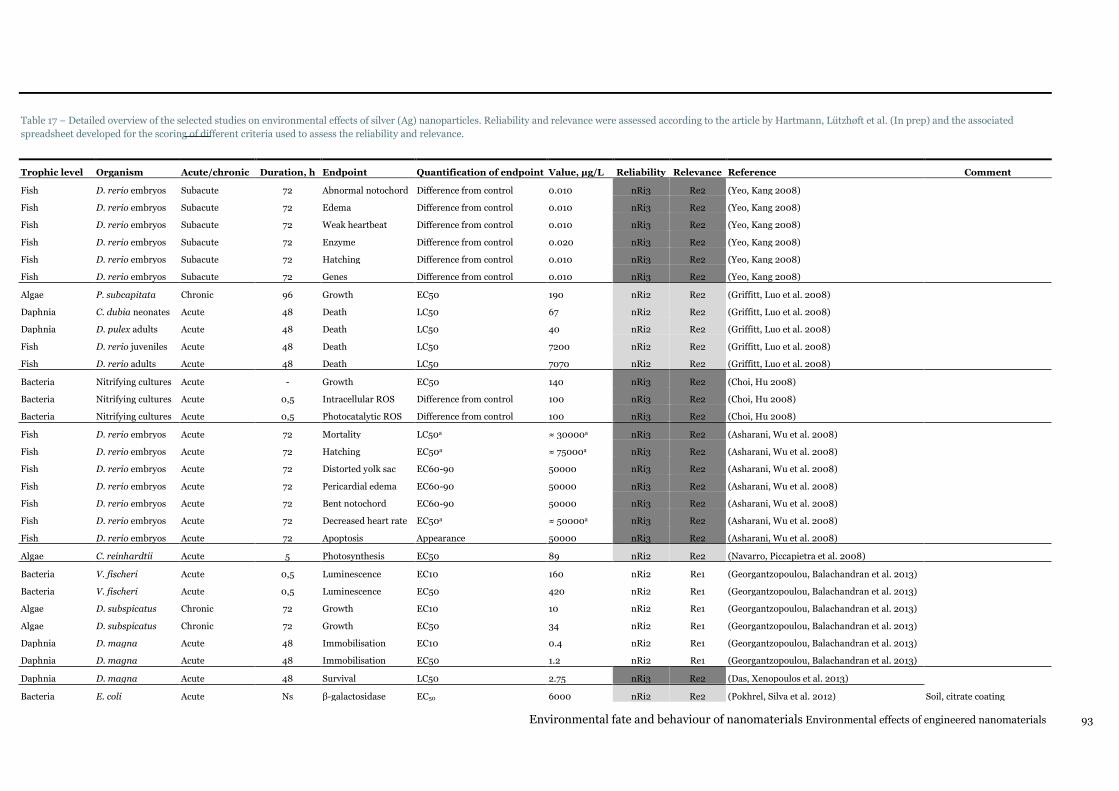
Environmental fate and behaviour of nanomaterials Environmental effects of engineered nanomaterials 93
Table 17 – Detailed overview of the selected studies on environmental effects of silver (Ag) nanoparticles. Reliability and relevance were assessed according to the article by Hartmann, Lützhøft et al. (In prep) and the associated
spreadsheet developed for the scoring of different criteria used to assess the reliability and relevance.
Trophic level Organism Acute/chronic Duration, h Endpoint Quantification of endpoint Value, µg/L Reliability Relevance Reference Comment
Fish D. rerio embryos Subacute 72 Abnormal notochord Difference from control 0.010 nRi3 Re2 (Yeo, Kang 2008)
Fish D. rerio embryos Subacute 72 Edema Difference from control 0.010 nRi3 Re2 (Yeo, Kang 2008)
Fish D. rerio embryos Subacute 72 Weak heartbeat Difference from control 0.010 nRi3 Re2 (Yeo, Kang 2008)
Fish D. rerio embryos Subacute 72 Enzyme Difference from control 0.020 nRi3 Re2 (Yeo, Kang 2008)
Fish D. rerio embryos Subacute 72 Hatching Difference from control 0.010 nRi3 Re2 (Yeo, Kang 2008)
Fish D. rerio embryos Subacute 72 Genes Difference from control 0.010 nRi3 Re2 (Yeo, Kang 2008)
Algae P. subcapitata Chronic 96 Growth EC50 190 nRi2 Re2 (Griffitt, Luo et al. 2008)
Daphnia C. dubia neonates Acute 48 Death LC50 67 nRi2 Re2 (Griffitt, Luo et al. 2008)
Daphnia D. pulex adults Acute 48 Death LC50 40 nRi2 Re2 (Griffitt, Luo et al. 2008)
Fish D. rerio juveniles Acute 48 Death LC50 7200 nRi2 Re2 (Griffitt, Luo et al. 2008)
Fish D. rerio adults Acute 48 Death LC50 7070 nRi2 Re2 (Griffitt, Luo et al. 2008)
Bacteria Nitrifying cultures Acute - Growth EC50 140 nRi3 Re2 (Choi, Hu 2008)
Bacteria Nitrifying cultures Acute 0,5 Intracellular ROS Difference from control 100 nRi3 Re2 (Choi, Hu 2008)
Bacteria Nitrifying cultures Acute 0,5 Photocatalytic ROS Difference from control 100 nRi3 Re2 (Choi, Hu 2008)
Fish D. rerio embryos Acute 72 Mortality LC50a ≈ 30000a nRi3 Re2 (Asharani, Wu et al. 2008)
Fish D. rerio embryos Acute 72 Hatching EC50a ≈ 75000a nRi3 Re2 (Asharani, Wu et al. 2008)
Fish D. rerio embryos Acute 72 Distorted yolk sac EC60-90 50000 nRi3 Re2 (Asharani, Wu et al. 2008)
Fish D. rerio embryos Acute 72 Pericardial edema EC60-90 50000 nRi3 Re2 (Asharani, Wu et al. 2008)
Fish D. rerio embryos Acute 72 Bent notochord EC60-90 50000 nRi3 Re2 (Asharani, Wu et al. 2008)
Fish D. rerio embryos Acute 72 Decreased heart rate EC50a ≈ 50000a nRi3 Re2 (Asharani, Wu et al. 2008)
Fish D. rerio embryos Acute 72 Apoptosis Appearance 50000 nRi3 Re2 (Asharani, Wu et al. 2008)
Algae C. reinhardtii Acute 5 Photosynthesis EC50 89 nRi2 Re2 (Navarro, Piccapietra et al. 2008)
Bacteria V. fischeri Acute 0,5 Luminescence EC10 160 nRi2 Re1 (Georgantzopoulou, Balachandran et al. 2013)
Bacteria V. fischeri Acute 0,5 Luminescence EC50 420 nRi2 Re1 (Georgantzopoulou, Balachandran et al. 2013)
Algae D. subspicatus Chronic 72 Growth EC10 10 nRi2 Re1 (Georgantzopoulou, Balachandran et al. 2013)
Algae D. subspicatus Chronic 72 Growth EC50 34 nRi2 Re1 (Georgantzopoulou, Balachandran et al. 2013)
Daphnia D. magna Acute 48 Immobilisation EC10 0.4 nRi2 Re1 (Georgantzopoulou, Balachandran et al. 2013)
Daphnia D. magna Acute 48 Immobilisation EC50 1.2 nRi2 Re1 (Georgantzopoulou, Balachandran et al. 2013)
Daphnia D. magna Acute 48 Survival LC50 2.75 nRi3 Re2 (Das, Xenopoulos et al. 2013)
Bacteria E. coli Acute Ns β-galactosidase EC50 6000 nRi2 Re2 (Pokhrel, Silva et al. 2012) Soil, citrate coating
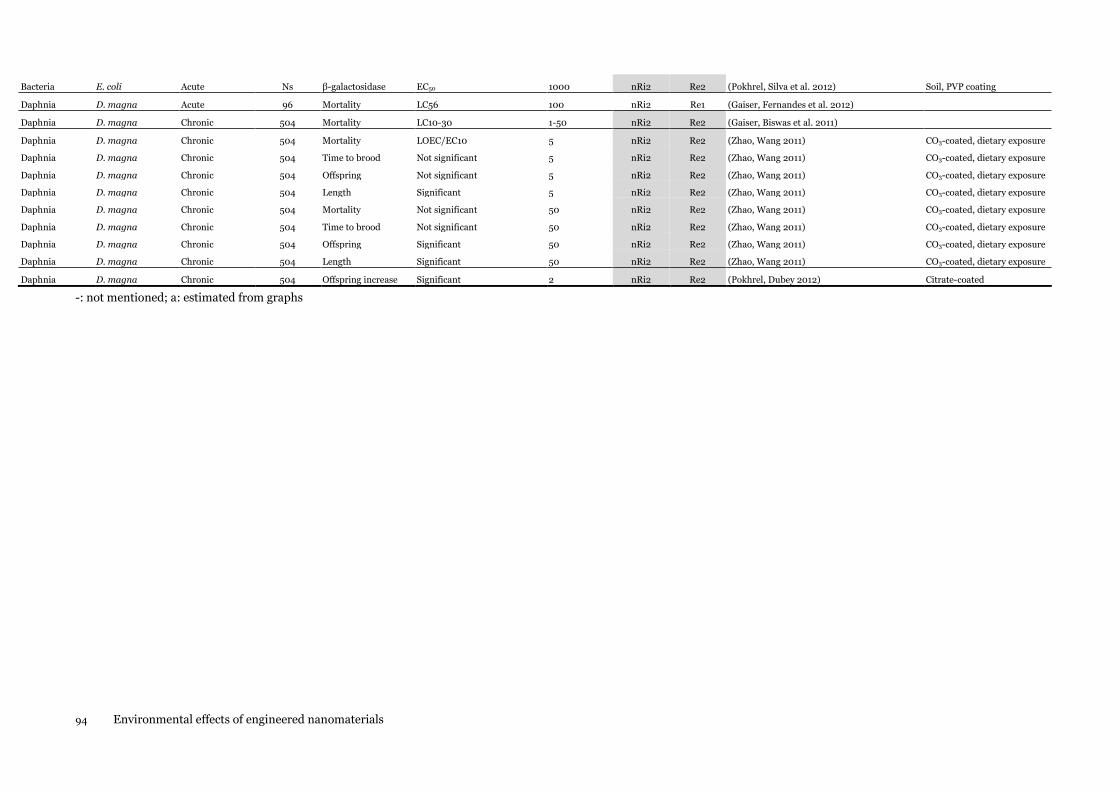
94 Environmental effects of engineered nanomaterials
Bacteria E. coli Acute Ns β-galactosidase EC50 1000 nRi2 Re2 (Pokhrel, Silva et al. 2012) Soil, PVP coating
Daphnia D. magna Acute 96 Mortality LC56 100 nRi2 Re1 (Gaiser, Fernandes et al. 2012)
Daphnia D. magna Chronic 504 Mortality LC10-30 1-50 nRi2 Re2 (Gaiser, Biswas et al. 2011)
Daphnia D. magna Chronic 504 Mortality LOEC/EC10 5 nRi2 Re2 (Zhao, Wang 2011) CO3-coated, dietary exposure
Daphnia D. magna Chronic 504 Time to brood Not significant 5 nRi2 Re2 (Zhao, Wang 2011) CO3-coated, dietary exposure
Daphnia D. magna Chronic 504 Offspring Not significant 5 nRi2 Re2 (Zhao, Wang 2011) CO3-coated, dietary exposure
Daphnia D. magna Chronic 504 Length Significant 5 nRi2 Re2 (Zhao, Wang 2011) CO3-coated, dietary exposure
Daphnia D. magna Chronic 504 Mortality Not significant 50 nRi2 Re2 (Zhao, Wang 2011) CO3-coated, dietary exposure
Daphnia D. magna Chronic 504 Time to brood Not significant 50 nRi2 Re2 (Zhao, Wang 2011) CO3-coated, dietary exposure
Daphnia D. magna Chronic 504 Offspring Significant 50 nRi2 Re2 (Zhao, Wang 2011) CO3-coated, dietary exposure
Daphnia D. magna Chronic 504 Length Significant 50 nRi2 Re2 (Zhao, Wang 2011) CO3-coated, dietary exposure
Daphnia D. magna Chronic 504 Offspring increase Significant 2 nRi2 Re2 (Pokhrel, Dubey 2012) Citrate-coated
-: not mentioned; a: estimated from graphs
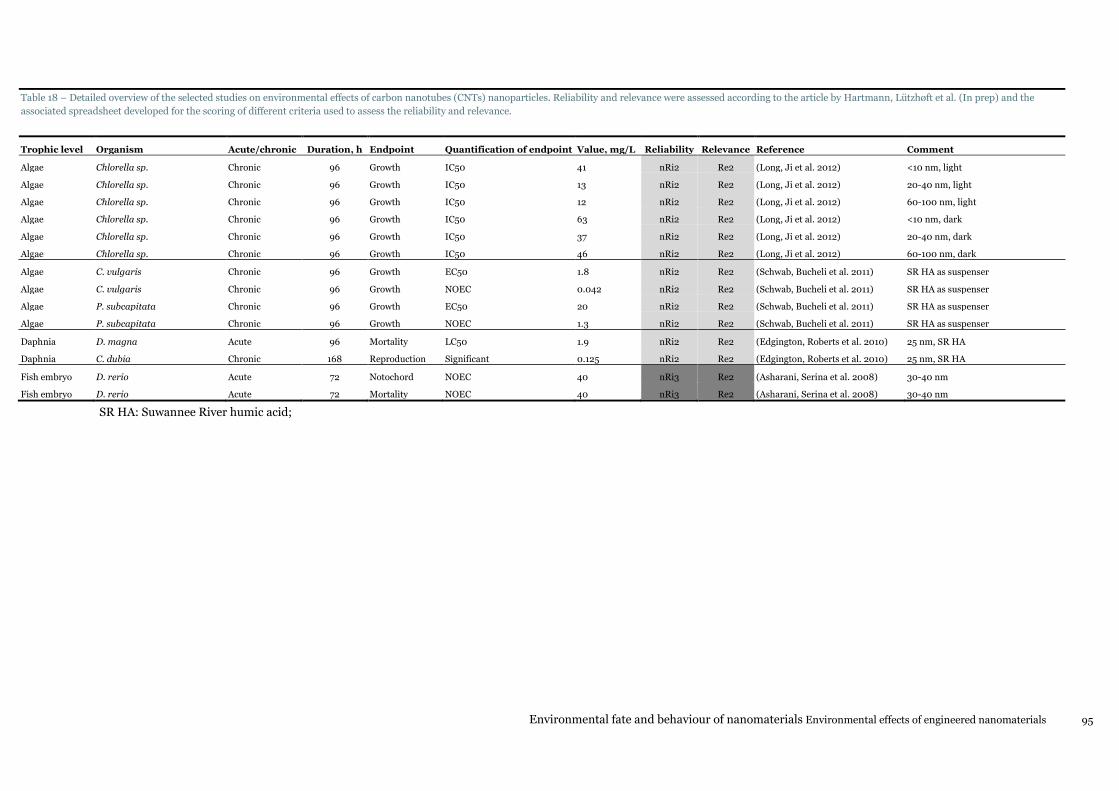
Environmental fate and behaviour of nanomaterials Environmental effects of engineered nanomaterials 95
Table 18 – Detailed overview of the selected studies on environmental effects of carbon nanotubes (CNTs) nanoparticles. Reliability and relevance were assessed according to the article by Hartmann, Lützhøft et al. (In prep) and the
associated spreadsheet developed for the scoring of different criteria used to assess the reliability and relevance.
Trophic level Organism Acute/chronic Duration, h Endpoint Quantification of endpoint Value, mg/L Reliability Relevance Reference Comment
Algae Chlorella sp. Chronic 96 Growth IC50 41 nRi2 Re2 (Long, Ji et al. 2012) <10 nm, light
Algae Chlorella sp. Chronic 96 Growth IC50 13 nRi2 Re2 (Long, Ji et al. 2012) 20-40 nm, light
Algae Chlorella sp. Chronic 96 Growth IC50 12 nRi2 Re2 (Long, Ji et al. 2012) 60-100 nm, light
Algae Chlorella sp. Chronic 96 Growth IC50 63 nRi2 Re2 (Long, Ji et al. 2012) <10 nm, dark
Algae Chlorella sp. Chronic 96 Growth IC50 37 nRi2 Re2 (Long, Ji et al. 2012) 20-40 nm, dark
Algae Chlorella sp. Chronic 96 Growth IC50 46 nRi2 Re2 (Long, Ji et al. 2012) 60-100 nm, dark
Algae C. vulgaris Chronic 96 Growth EC50 1.8 nRi2 Re2 (Schwab, Bucheli et al. 2011) SR HA as suspenser
Algae C. vulgaris Chronic 96 Growth NOEC 0.042 nRi2 Re2 (Schwab, Bucheli et al. 2011) SR HA as suspenser
Algae P. subcapitata Chronic 96 Growth EC50 20 nRi2 Re2 (Schwab, Bucheli et al. 2011) SR HA as suspenser
Algae P. subcapitata Chronic 96 Growth NOEC 1.3 nRi2 Re2 (Schwab, Bucheli et al. 2011) SR HA as suspenser
Daphnia D. magna Acute 96 Mortality LC50 1.9 nRi2 Re2 (Edgington, Roberts et al. 2010) 25 nm, SR HA
Daphnia C. dubia Chronic 168 Reproduction Significant 0.125 nRi2 Re2 (Edgington, Roberts et al. 2010) 25 nm, SR HA
Fish embryo D. rerio Acute 72 Notochord NOEC 40 nRi3 Re2 (Asharani, Serina et al. 2008) 30-40 nm
Fish embryo D. rerio Acute 72 Mortality NOEC 40 nRi3 Re2 (Asharani, Serina et al. 2008) 30-40 nm
SR HA: Suwannee River humic acid;

96 Environmental effects of engineered nanomaterials
Table 19 – Detailed overview of the selected studies on environmental effects of copper oxide (CuO) nanoparticles. Reliability and relevance were assessed according to the article by Hartmann, Lützhøft
et al. (In prep) and the associated spreadsheet developed for the scoring of different criteria used to assess the reliability and relevance.
Trophic level Organism Acute/ chronic Duration, h Endpoint Quantification of endpoint Value, mg/L Reliability Relevance Reference Comment
Daphnia C. dubia Acute 48 Survival LC50 0.0338 nRi2 Re2 (Kennedy, Melby et al. 2013) Nanospheres tested
Daphnia C. dubia Acute 48 Survival LC50 0.1149 nRi2 Re2 (Kennedy, Melby et al. 2013) Nanorods tested
Algae P. subcapitata Chronic 72 Growth EC50 0.710 nRi3 Re2 (Aruoja, Dubourguier et al. 2009)
Algae P. subcapitata Chronic 72 Growth NOEC 0.421 nRi3 Re2 (Aruoja, Dubourguier et al. 2009)
Bacteria V. fischeri Acute 0.5 Luminescence EC50 79 nRi3 Re2 (Heinlaan, Ivask et al. 2008)
Bacteria V. fischeri Acute 0.5 Luminescence NOEC 16 nRi3 Re2 (Heinlaan, Ivask et al. 2008)
Daphnia D. magna Acute 48 Mortality LC50 3.2 nRi3 Re2 (Heinlaan, Ivask et al. 2008)
Daphnia D. magna Acute 48 Mortality NOEC 0.5 nRi3 Re2 (Heinlaan, Ivask et al. 2008)
Daphnia T. platyurus Acute 24 Mortality LC50 2.1 nRi3 Re2 (Heinlaan, Ivask et al. 2008)
Daphnia T. platyurus Acute 24 Mortality NOEC 0.5 nRi3 Re2 (Heinlaan, Ivask et al. 2008)
Fish D. rerio Acute 48 Survival LC50 1.56 nRi2 Re2 (Griffitt, Weil et al. 2007)
Algae N. obtusa Chronic 192 Mortality LC50 2.8 nRi3 Re2 (Manusadzianas, Caillet et al. 2012) Sonicated suspensions
Algae Chlorella Acute 0.5 Photosynthesis IC50 47 nRi3 Re2 (Manusadzianas, Caillet et al. 2012) Sonicated suspensions
Daphnia T. platyurus Acute 24 Mortality LC50 8.5 nRi3 Re2 (Manusadzianas, Caillet et al. 2012) Sonicated suspensions
Rotifers B. calyciflorus Acute 24 Mortality LC50 0.39 nRi3 Re2 (Manusadzianas, Caillet et al. 2012) Sonicated suspensions
Algae N. obtusa Chronic 192 Mortality LC50 4.3 nRi3 Re2 (Manusadzianas, Caillet et al. 2012) Non-sonicated suspensions
Algae Chlorella Acute 0.5 Fluorescence IC50 57 nRi3 Re2 (Manusadzianas, Caillet et al. 2012) Non-sonicated suspensions
Daphnia T. platyurus Acute 24 Mortality LC50 9.3 nRi3 Re2 (Manusadzianas, Caillet et al. 2012) Non-sonicated suspensions
Rotifers B. calyciflorus Acute 24 Mortality LC50 0.24 nRi3 Re2 (Manusadzianas, Caillet et al. 2012) Non-sonicated suspensions
Daphnia C. dubia neonates Acute 48 Mortality LC50 0.419 nRi2 Re2 (Griffitt, Luo et al. 2008)
Daphnia D. pulex adult Acute 48 Mortality LC50 0.06 nRi2 Re2 (Griffitt, Luo et al. 2008)
Fish D. rerio adult Acute 48 Mortality LC50 0.94 nRi2 Re2 (Griffitt, Luo et al. 2008)
Fish D. rerio juvenile Acute 48 Mortality LC50 0.71 nRi2 Re2 (Griffitt, Luo et al. 2008)
Algae P. subcapitata Chronic 96 Growth LC50 0.54 nRi2 Re2 (Griffitt, Luo et al. 2008)
Algae C. reinhardtii Chronic 72 Growth EC50 150.45 nRi2 Re2 (Melegari, Perreault et al. 2013)
Algae C. reinhardtii Chronic 72 Growth NOEC ≤100 nRi2 Re2 (Melegari, Perreault et al. 2013)
Fish embryos D. rerio Acute 120 Survival LC50 >10 nRi2 Re2 (Vicario-Pares, Castanaga et al.
2014)
Daphnia D. magna Acute 48 Immobility EC50 0.32 nRi2 Re1 (Rossetto, Vicentini et al. 2014)
Daphnia D. magna Chronic 504 Longevity NOEC 0.06 nRi2 Re1 (Rossetto, Vicentini et al. 2014)
Daphnia D. magna Chronic 504 Growth NOEC <0.01 nRi2 Re1 (Rossetto, Vicentini et al. 2014)
Daphnia D. magna Chronic 504 Reproduction NOEC 0.06 nRi2 Re1 (Rossetto, Vicentini et al. 2014)
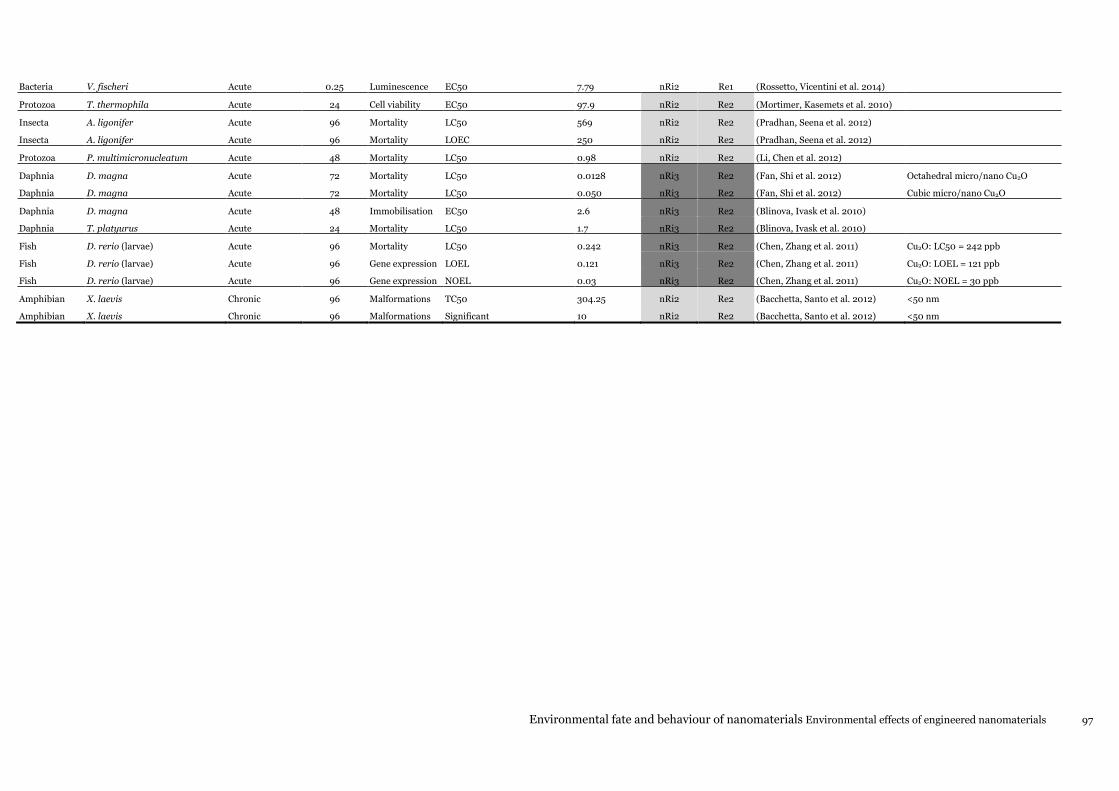
Environmental fate and behaviour of nanomaterials Environmental effects of engineered nanomaterials 97
Bacteria V. fischeri Acute 0.25 Luminescence EC50 7.79 nRi2 Re1 (Rossetto, Vicentini et al. 2014)
Protozoa T. thermophila Acute 24 Cell viability EC50 97.9 nRi2 Re2 (Mortimer, Kasemets et al. 2010)
Insecta A. ligonifer Acute 96 Mortality LC50 569 nRi2 Re2 (Pradhan, Seena et al. 2012)
Insecta A. ligonifer Acute 96 Mortality LOEC 250 nRi2 Re2 (Pradhan, Seena et al. 2012)
Protozoa P. multimicronucleatum Acute 48 Mortality LC50 0.98 nRi2 Re2 (Li, Chen et al. 2012)
Daphnia D. magna Acute 72 Mortality LC50 0.0128 nRi3 Re2 (Fan, Shi et al. 2012) Octahedral micro/nano Cu2O
Daphnia D. magna Acute 72 Mortality LC50 0.050 nRi3 Re2 (Fan, Shi et al. 2012) Cubic micro/nano Cu2O
Daphnia D. magna Acute 48 Immobilisation EC50 2.6 nRi3 Re2 (Blinova, Ivask et al. 2010)
Daphnia T. platyurus Acute 24 Mortality LC50 1.7 nRi3 Re2 (Blinova, Ivask et al. 2010)
Fish D. rerio (larvae) Acute 96 Mortality LC50 0.242 nRi3 Re2 (Chen, Zhang et al. 2011) Cu2O: LC50 = 242 ppb
Fish D. rerio (larvae) Acute 96 Gene expression LOEL 0.121 nRi3 Re2 (Chen, Zhang et al. 2011) Cu2O: LOEL = 121 ppb
Fish D. rerio (larvae) Acute 96 Gene expression NOEL 0.03 nRi3 Re2 (Chen, Zhang et al. 2011) Cu2O: NOEL = 30 ppb
Amphibian X. laevis Chronic 96 Malformations TC50 304.25 nRi2 Re2 (Bacchetta, Santo et al. 2012) <50 nm
Amphibian X. laevis Chronic 96 Malformations Significant 10 nRi2 Re2 (Bacchetta, Santo et al. 2012) <50 nm
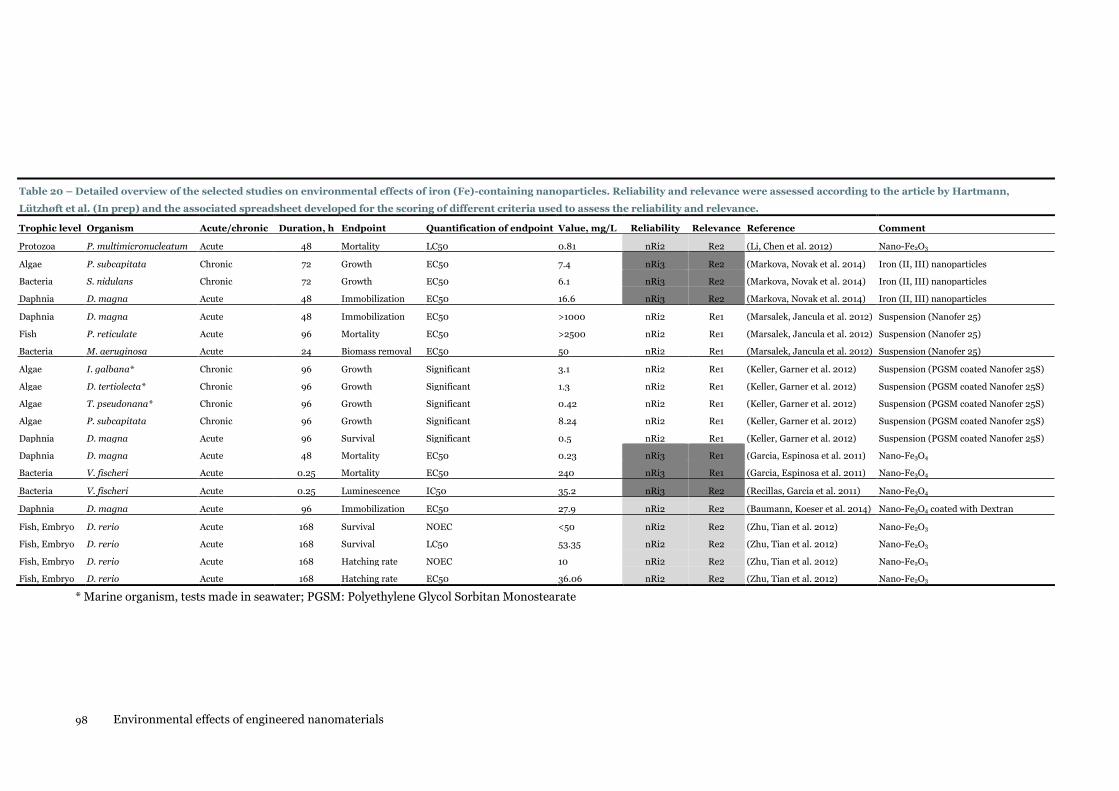
98 Environmental effects of engineered nanomaterials
Table 20 – Detailed overview of the selected studies on environmental effects of iron (Fe)-containing nanoparticles. Reliability and relevance were assessed according to the article by Hartmann,
Lützhøft et al. (In prep) and the associated spreadsheet developed for the scoring of different criteria used to assess the reliability and relevance.
Trophic level Organism Acute/chronic Duration, h Endpoint Quantification of endpoint Value, mg/L Reliability Relevance Reference Comment
Protozoa P. multimicronucleatum Acute 48 Mortality LC50 0.81 nRi2 Re2 (Li, Chen et al. 2012) Nano-Fe2O3
Algae P. subcapitata Chronic 72 Growth EC50 7.4 nRi3 Re2 (Markova, Novak et al. 2014) Iron (II, III) nanoparticles
Bacteria S. nidulans Chronic 72 Growth EC50 6.1 nRi3 Re2 (Markova, Novak et al. 2014) Iron (II, III) nanoparticles
Daphnia D. magna Acute 48 Immobilization EC50 16.6 nRi3 Re2 (Markova, Novak et al. 2014) Iron (II, III) nanoparticles
Daphnia D. magna Acute 48 Immobilization EC50 >1000 nRi2 Re1 (Marsalek, Jancula et al. 2012) Suspension (Nanofer 25)
Fish P. reticulate Acute 96 Mortality EC50 >2500 nRi2 Re1 (Marsalek, Jancula et al. 2012) Suspension (Nanofer 25)
Bacteria M. aeruginosa Acute 24 Biomass removal EC50 50 nRi2 Re1 (Marsalek, Jancula et al. 2012) Suspension (Nanofer 25)
Algae I. galbana* Chronic 96 Growth Significant 3.1 nRi2 Re1 (Keller, Garner et al. 2012) Suspension (PGSM coated Nanofer 25S)
Algae D. tertiolecta* Chronic 96 Growth Significant 1.3 nRi2 Re1 (Keller, Garner et al. 2012) Suspension (PGSM coated Nanofer 25S)
Algae T. pseudonana* Chronic 96 Growth Significant 0.42 nRi2 Re1 (Keller, Garner et al. 2012) Suspension (PGSM coated Nanofer 25S)
Algae P. subcapitata Chronic 96 Growth Significant 8.24 nRi2 Re1 (Keller, Garner et al. 2012) Suspension (PGSM coated Nanofer 25S)
Daphnia D. magna Acute 96 Survival Significant 0.5 nRi2 Re1 (Keller, Garner et al. 2012) Suspension (PGSM coated Nanofer 25S)
Daphnia D. magna Acute 48 Mortality EC50 0.23 nRi3 Re1 (Garcia, Espinosa et al. 2011) Nano-Fe3O4
Bacteria V. fischeri Acute 0.25 Mortality EC50 240 nRi3 Re1 (Garcia, Espinosa et al. 2011) Nano-Fe3O4
Bacteria V. fischeri Acute 0.25 Luminescence IC50 35.2 nRi3 Re2 (Recillas, Garcia et al. 2011) Nano-Fe3O4
Daphnia D. magna Acute 96 Immobilization EC50 27.9 nRi2 Re2 (Baumann, Koeser et al. 2014) Nano-Fe3O4 coated with Dextran
Fish, Embryo D. rerio Acute 168 Survival NOEC <50 nRi2 Re2 (Zhu, Tian et al. 2012) Nano-Fe2O3
Fish, Embryo D. rerio Acute 168 Survival LC50 53.35 nRi2 Re2 (Zhu, Tian et al. 2012) Nano-Fe2O3
Fish, Embryo D. rerio Acute 168 Hatching rate NOEC 10 nRi2 Re2 (Zhu, Tian et al. 2012) Nano-Fe2O3
Fish, Embryo D. rerio Acute 168 Hatching rate EC50 36.06 nRi2 Re2 (Zhu, Tian et al. 2012) Nano-Fe2O3
* Marine organism, tests made in seawater; PGSM: Polyethylene Glycol Sorbitan Monostearate
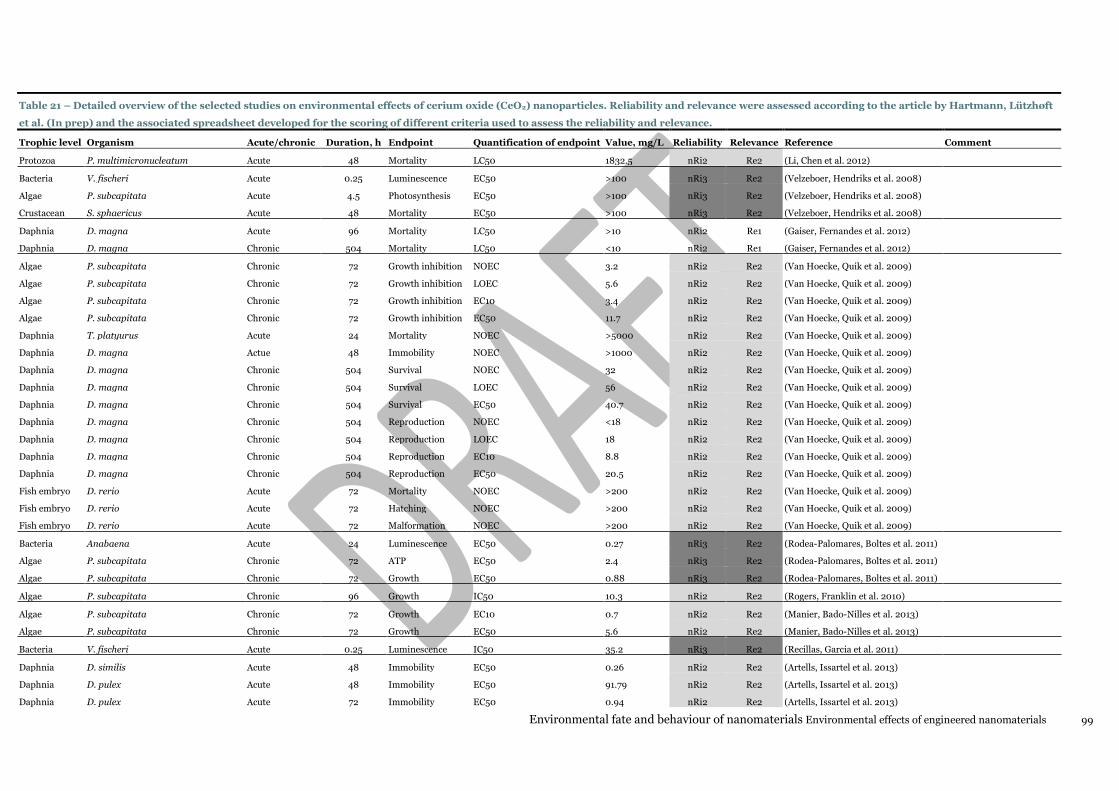
Environmental fate and behaviour of nanomaterials Environmental effects of engineered nanomaterials 99
Table 21 – Detailed overview of the selected studies on environmental effects of cerium oxide (CeO2) nanoparticles. Reliability and relevance were assessed according to the article by Hartmann, Lützhøft
et al. (In prep) and the associated spreadsheet developed for the scoring of different criteria used to assess the reliability and relevance.
Trophic level Organism Acute/chronic Duration, h Endpoint Quantification of endpoint Value, mg/L Reliability Relevance Reference Comment
Protozoa P. multimicronucleatum Acute 48 Mortality LC50 1832.5 nRi2 Re2 (Li, Chen et al. 2012)
Bacteria V. fischeri Acute 0.25 Luminescence EC50 >100 nRi3 Re2 (Velzeboer, Hendriks et al. 2008)
Algae P. subcapitata Acute 4.5 Photosynthesis EC50 >100 nRi3 Re2 (Velzeboer, Hendriks et al. 2008)
Crustacean S. sphaericus Acute 48 Mortality EC50 >100 nRi3 Re2 (Velzeboer, Hendriks et al. 2008)
Daphnia D. magna Acute 96 Mortality LC50 >10 nRi2 Re1 (Gaiser, Fernandes et al. 2012)
Daphnia D. magna Chronic 504 Mortality LC50 <10 nRi2 Re1 (Gaiser, Fernandes et al. 2012)
Algae P. subcapitata Chronic 72 Growth inhibition NOEC 3.2 nRi2 Re2 (Van Hoecke, Quik et al. 2009)
Algae P. subcapitata Chronic 72 Growth inhibition LOEC 5.6 nRi2 Re2 (Van Hoecke, Quik et al. 2009)
Algae P. subcapitata Chronic 72 Growth inhibition EC10 3.4 nRi2 Re2 (Van Hoecke, Quik et al. 2009)
Algae P. subcapitata Chronic 72 Growth inhibition EC50 11.7 nRi2 Re2 (Van Hoecke, Quik et al. 2009)
Daphnia T. platyurus Acute 24 Mortality NOEC >5000 nRi2 Re2 (Van Hoecke, Quik et al. 2009)
Daphnia D. magna Actue 48 Immobility NOEC >1000 nRi2 Re2 (Van Hoecke, Quik et al. 2009)
Daphnia D. magna Chronic 504 Survival NOEC 32 nRi2 Re2 (Van Hoecke, Quik et al. 2009)
Daphnia D. magna Chronic 504 Survival LOEC 56 nRi2 Re2 (Van Hoecke, Quik et al. 2009)
Daphnia D. magna Chronic 504 Survival EC50 40.7 nRi2 Re2 (Van Hoecke, Quik et al. 2009)
Daphnia D. magna Chronic 504 Reproduction NOEC <18 nRi2 Re2 (Van Hoecke, Quik et al. 2009)
Daphnia D. magna Chronic 504 Reproduction LOEC 18 nRi2 Re2 (Van Hoecke, Quik et al. 2009)
Daphnia D. magna Chronic 504 Reproduction EC10 8.8 nRi2 Re2 (Van Hoecke, Quik et al. 2009)
Daphnia D. magna Chronic 504 Reproduction EC50 20.5 nRi2 Re2 (Van Hoecke, Quik et al. 2009)
Fish embryo D. rerio Acute 72 Mortality NOEC >200 nRi2 Re2 (Van Hoecke, Quik et al. 2009)
Fish embryo D. rerio Acute 72 Hatching NOEC >200 nRi2 Re2 (Van Hoecke, Quik et al. 2009)
Fish embryo D. rerio Acute 72 Malformation NOEC >200 nRi2 Re2 (Van Hoecke, Quik et al. 2009)
Bacteria Anabaena Acute 24 Luminescence EC50 0.27 nRi3 Re2 (Rodea-Palomares, Boltes et al. 2011)
Algae P. subcapitata Chronic 72 ATP EC50 2.4 nRi3 Re2 (Rodea-Palomares, Boltes et al. 2011)
Algae P. subcapitata Chronic 72 Growth EC50 0.88 nRi3 Re2 (Rodea-Palomares, Boltes et al. 2011)
Algae P. subcapitata Chronic 96 Growth IC50 10.3 nRi2 Re2 (Rogers, Franklin et al. 2010)
Algae P. subcapitata Chronic 72 Growth EC10 0.7 nRi2 Re2 (Manier, Bado-Nilles et al. 2013)
Algae P. subcapitata Chronic 72 Growth EC50 5.6 nRi2 Re2 (Manier, Bado-Nilles et al. 2013)
Bacteria V. fischeri Acute 0.25 Luminescence IC50 35.2 nRi3 Re2 (Recillas, Garcia et al. 2011)
Daphnia D. similis Acute 48 Immobility EC50 0.26 nRi2 Re2 (Artells, Issartel et al. 2013)
Daphnia D. pulex Acute 48 Immobility EC50 91.79 nRi2 Re2 (Artells, Issartel et al. 2013)
Daphnia D. pulex Acute 72 Immobility EC50 0.94 nRi2 Re2 (Artells, Issartel et al. 2013)
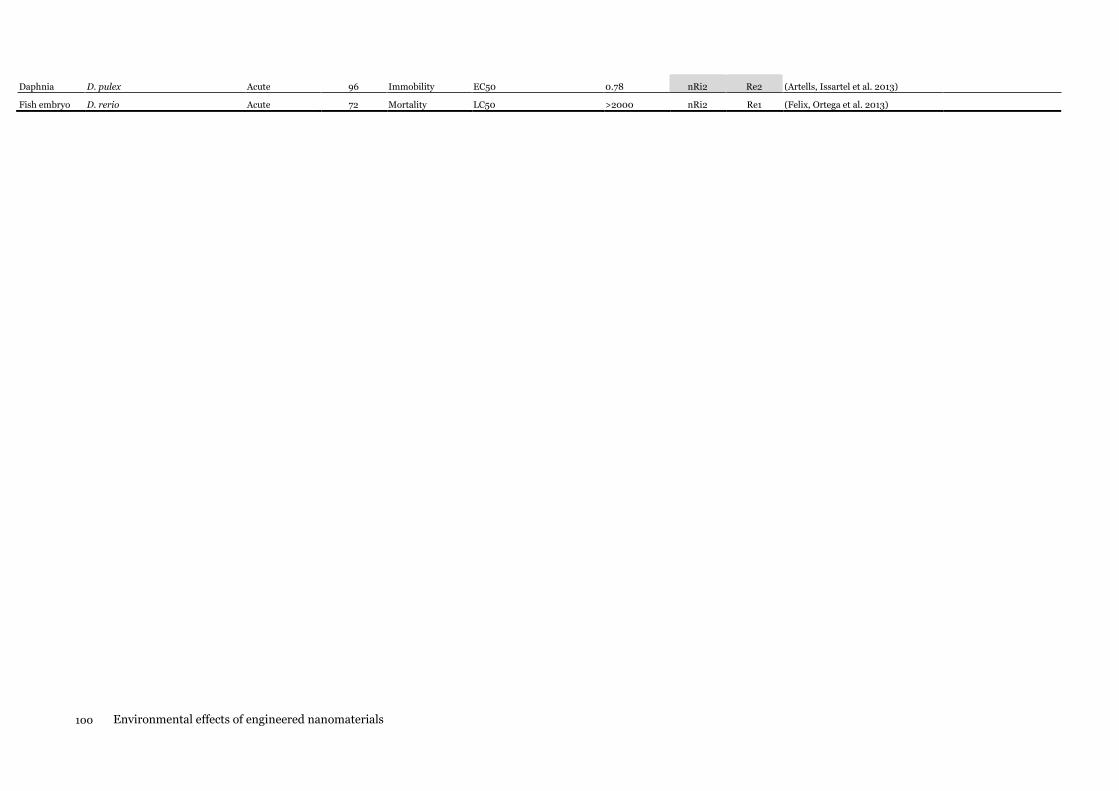
100 Environmental effects of engineered nanomaterials
Daphnia D. pulex Acute 96 Immobility EC50 0.78 nRi2 Re2 (Artells, Issartel et al. 2013)
Fish embryo D. rerio Acute 72 Mortality LC50 >2000 nRi2 Re1 (Felix, Ortega et al. 2013)

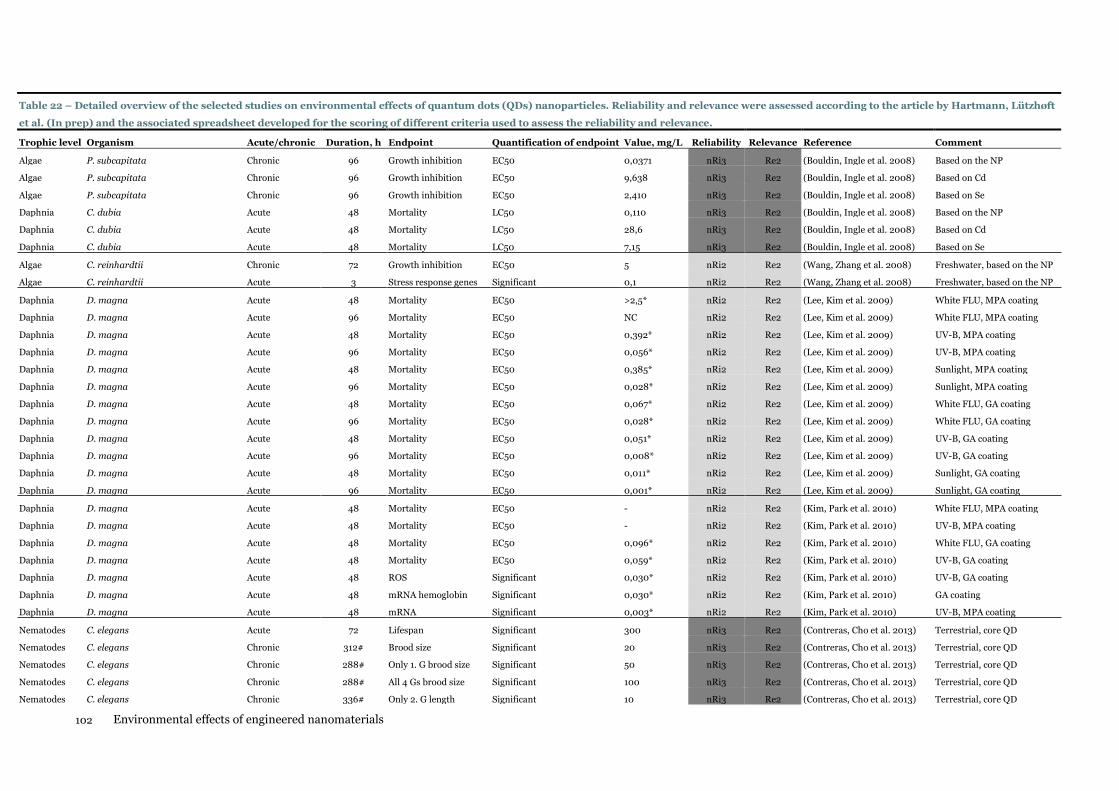
102 Environmental effects of engineered nanomaterials
Table 22 – Detailed overview of the selected studies on environmental effects of quantum dots (QDs) nanoparticles. Reliability and relevance were assessed according to the article by Hartmann, Lützhøft
et al. (In prep) and the associated spreadsheet developed for the scoring of different criteria used to assess the reliability and relevance.
Trophic level Organism Acute/chronic Duration, h Endpoint Quantification of endpoint Value, mg/L Reliability Relevance Reference Comment
Algae P. subcapitata Chronic 96 Growth inhibition EC50 0,0371 nRi3 Re2 (Bouldin, Ingle et al. 2008) Based on the NP
Algae P. subcapitata Chronic 96 Growth inhibition EC50 9,638 nRi3 Re2 (Bouldin, Ingle et al. 2008) Based on Cd
Algae P. subcapitata Chronic 96 Growth inhibition EC50 2,410 nRi3 Re2 (Bouldin, Ingle et al. 2008) Based on Se
Daphnia C. dubia Acute 48 Mortality LC50 0,110 nRi3 Re2 (Bouldin, Ingle et al. 2008) Based on the NP
Daphnia C. dubia Acute 48 Mortality LC50 28,6 nRi3 Re2 (Bouldin, Ingle et al. 2008) Based on Cd
Daphnia C. dubia Acute 48 Mortality LC50 7,15 nRi3 Re2 (Bouldin, Ingle et al. 2008) Based on Se
Algae C. reinhardtii Chronic 72 Growth inhibition EC50 5 nRi2 Re2 (Wang, Zhang et al. 2008) Freshwater, based on the NP
Algae C. reinhardtii Acute 3 Stress response genes Significant 0,1 nRi2 Re2 (Wang, Zhang et al. 2008) Freshwater, based on the NP
Daphnia D. magna Acute 48 Mortality EC50 >2,5* nRi2 Re2 (Lee, Kim et al. 2009) White FLU, MPA coating
Daphnia D. magna Acute 96 Mortality EC50 NC nRi2 Re2 (Lee, Kim et al. 2009) White FLU, MPA coating
Daphnia D. magna Acute 48 Mortality EC50 0,392* nRi2 Re2 (Lee, Kim et al. 2009) UV-B, MPA coating
Daphnia D. magna Acute 96 Mortality EC50 0,056* nRi2 Re2 (Lee, Kim et al. 2009) UV-B, MPA coating
Daphnia D. magna Acute 48 Mortality EC50 0,385* nRi2 Re2 (Lee, Kim et al. 2009) Sunlight, MPA coating
Daphnia D. magna Acute 96 Mortality EC50 0,028* nRi2 Re2 (Lee, Kim et al. 2009) Sunlight, MPA coating
Daphnia D. magna Acute 48 Mortality EC50 0,067* nRi2 Re2 (Lee, Kim et al. 2009) White FLU, GA coating
Daphnia D. magna Acute 96 Mortality EC50 0,028* nRi2 Re2 (Lee, Kim et al. 2009) White FLU, GA coating
Daphnia D. magna Acute 48 Mortality EC50 0,051* nRi2 Re2 (Lee, Kim et al. 2009) UV-B, GA coating
Daphnia D. magna Acute 96 Mortality EC50 0,008* nRi2 Re2 (Lee, Kim et al. 2009) UV-B, GA coating
Daphnia D. magna Acute 48 Mortality EC50 0,011* nRi2 Re2 (Lee, Kim et al. 2009) Sunlight, GA coating
Daphnia D. magna Acute 96 Mortality EC50 0,001* nRi2 Re2 (Lee, Kim et al. 2009) Sunlight, GA coating
Daphnia D. magna Acute 48 Mortality EC50 - nRi2 Re2 (Kim, Park et al. 2010) White FLU, MPA coating
Daphnia D. magna Acute 48 Mortality EC50 - nRi2 Re2 (Kim, Park et al. 2010) UV-B, MPA coating
Daphnia D. magna Acute 48 Mortality EC50 0,096* nRi2 Re2 (Kim, Park et al. 2010) White FLU, GA coating
Daphnia D. magna Acute 48 Mortality EC50 0,059* nRi2 Re2 (Kim, Park et al. 2010) UV-B, GA coating
Daphnia D. magna Acute 48 ROS Significant 0,030* nRi2 Re2 (Kim, Park et al. 2010) UV-B, GA coating
Daphnia D. magna Acute 48 mRNA hemoglobin Significant 0,030* nRi2 Re2 (Kim, Park et al. 2010) GA coating
Daphnia D. magna Acute 48 mRNA Significant 0,003* nRi2 Re2 (Kim, Park et al. 2010) UV-B, MPA coating
Nematodes C. elegans Acute 72 Lifespan Significant 300 nRi3 Re2 (Contreras, Cho et al. 2013) Terrestrial, core QD
Nematodes C. elegans Chronic 312# Brood size Significant 20 nRi3 Re2 (Contreras, Cho et al. 2013) Terrestrial, core QD
Nematodes C. elegans Chronic 288# Only 1. G brood size Significant 50 nRi3 Re2 (Contreras, Cho et al. 2013) Terrestrial, core QD
Nematodes C. elegans Chronic 288# All 4 Gs brood size Significant 100 nRi3 Re2 (Contreras, Cho et al. 2013) Terrestrial, core QD
Nematodes C. elegans Chronic 336# Only 2. G length Significant 10 nRi3 Re2 (Contreras, Cho et al. 2013) Terrestrial, core QD
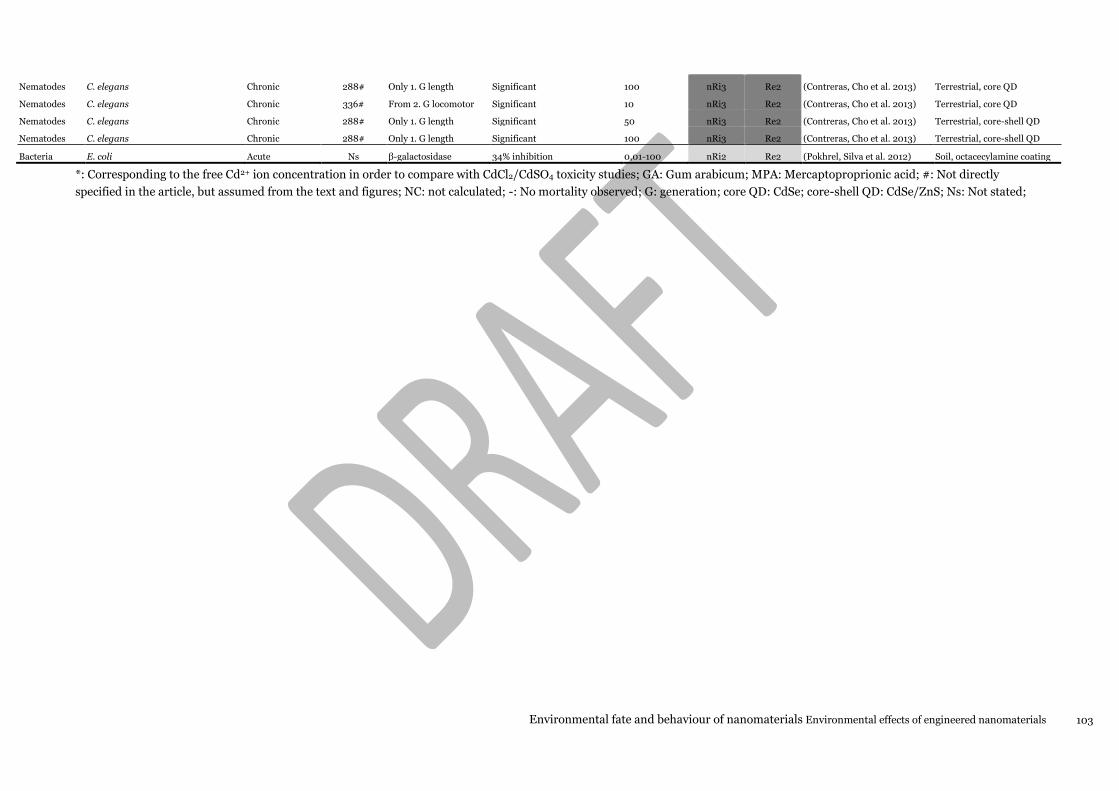
Environmental fate and behaviour of nanomaterials Environmental effects of engineered nanomaterials 103
Nematodes C. elegans Chronic 288# Only 1. G length Significant 100 nRi3 Re2 (Contreras, Cho et al. 2013) Terrestrial, core QD
Nematodes C. elegans Chronic 336# From 2. G locomotor Significant 10 nRi3 Re2 (Contreras, Cho et al. 2013) Terrestrial, core QD
Nematodes C. elegans Chronic 288# Only 1. G length Significant 50 nRi3 Re2 (Contreras, Cho et al. 2013) Terrestrial, core-shell QD
Nematodes C. elegans Chronic 288# Only 1. G length Significant 100 nRi3 Re2 (Contreras, Cho et al. 2013) Terrestrial, core-shell QD
Bacteria E. coli Acute Ns β-galactosidase 34% inhibition 0,01-100 nRi2 Re2 (Pokhrel, Silva et al. 2012) Soil, octacecylamine coating
*: Corresponding to the free Cd2+ ion concentration in order to compare with CdCl2/CdSO4 toxicity studies; GA: Gum arabicum; MPA: Mercaptoproprionic acid; #: Not directly
specified in the article, but assumed from the text and figures; NC: not calculated; -: No mortality observed; G: generation; core QD: CdSe; core-shell QD: CdSe/ZnS; Ns: Not stated;
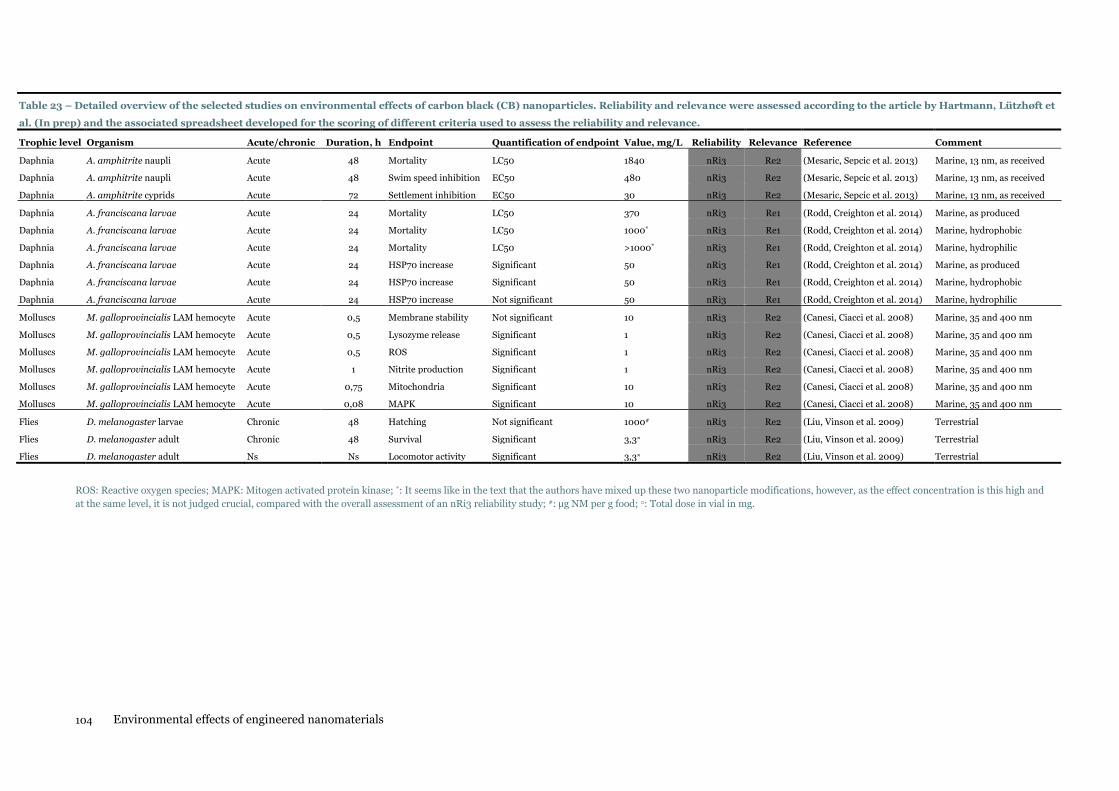
104 Environmental effects of engineered nanomaterials
Table 23 – Detailed overview of the selected studies on environmental effects of carbon black (CB) nanoparticles. Reliability and relevance were assessed according to the article by Hartmann, Lützhøft et
al. (In prep) and the associated spreadsheet developed for the scoring of different criteria used to assess the reliability and relevance.
Trophic level Organism Acute/chronic Duration, h Endpoint Quantification of endpoint Value, mg/L Reliability Relevance Reference Comment
Daphnia A. amphitrite naupli Acute 48 Mortality LC50 1840 nRi3 Re2 (Mesaric, Sepcic et al. 2013) Marine, 13 nm, as received
Daphnia A. amphitrite naupli Acute 48 Swim speed inhibition EC50 480 nRi3 Re2 (Mesaric, Sepcic et al. 2013) Marine, 13 nm, as received
Daphnia A. amphitrite cyprids Acute 72 Settlement inhibition EC50 30 nRi3 Re2 (Mesaric, Sepcic et al. 2013) Marine, 13 nm, as received
Daphnia A. franciscana larvae Acute 24 Mortality LC50 370 nRi3 Re1 (Rodd, Creighton et al. 2014) Marine, as produced
Daphnia A. franciscana larvae Acute 24 Mortality LC50 1000* nRi3 Re1 (Rodd, Creighton et al. 2014) Marine, hydrophobic
Daphnia A. franciscana larvae Acute 24 Mortality LC50 >1000* nRi3 Re1 (Rodd, Creighton et al. 2014) Marine, hydrophilic
Daphnia A. franciscana larvae Acute 24 HSP70 increase Significant 50 nRi3 Re1 (Rodd, Creighton et al. 2014) Marine, as produced
Daphnia A. franciscana larvae Acute 24 HSP70 increase Significant 50 nRi3 Re1 (Rodd, Creighton et al. 2014) Marine, hydrophobic
Daphnia A. franciscana larvae Acute 24 HSP70 increase Not significant 50 nRi3 Re1 (Rodd, Creighton et al. 2014) Marine, hydrophilic
Molluscs M. galloprovincialis LAM hemocyte Acute 0,5 Membrane stability Not significant 10 nRi3 Re2 (Canesi, Ciacci et al. 2008) Marine, 35 and 400 nm
Molluscs M. galloprovincialis LAM hemocyte Acute 0,5 Lysozyme release Significant 1 nRi3 Re2 (Canesi, Ciacci et al. 2008) Marine, 35 and 400 nm
Molluscs M. galloprovincialis LAM hemocyte Acute 0,5 ROS Significant 1 nRi3 Re2 (Canesi, Ciacci et al. 2008) Marine, 35 and 400 nm
Molluscs M. galloprovincialis LAM hemocyte Acute 1 Nitrite production Significant 1 nRi3 Re2 (Canesi, Ciacci et al. 2008) Marine, 35 and 400 nm
Molluscs M. galloprovincialis LAM hemocyte Acute 0,75 Mitochondria Significant 10 nRi3 Re2 (Canesi, Ciacci et al. 2008) Marine, 35 and 400 nm
Molluscs M. galloprovincialis LAM hemocyte Acute 0,08 MAPK Significant 10 nRi3 Re2 (Canesi, Ciacci et al. 2008) Marine, 35 and 400 nm
Flies D. melanogaster larvae Chronic 48 Hatching Not significant 1000# nRi3 Re2 (Liu, Vinson et al. 2009) Terrestrial
Flies D. melanogaster adult Chronic 48 Survival Significant 3,3¤ nRi3 Re2 (Liu, Vinson et al. 2009) Terrestrial
Flies D. melanogaster adult Ns Ns Locomotor activity Significant 3,3¤ nRi3 Re2 (Liu, Vinson et al. 2009) Terrestrial
ROS: Reactive oxygen species; MAPK: Mitogen activated protein kinase; *: It seems like in the text that the authors have mixed up these two nanoparticle modifications, however, as the effect concentration is this high and
at the same level, it is not judged crucial, compared with the overall assessment of an nRi3 reliability study; #: µg NM per g food; ¤: Total dose in vial in mg.

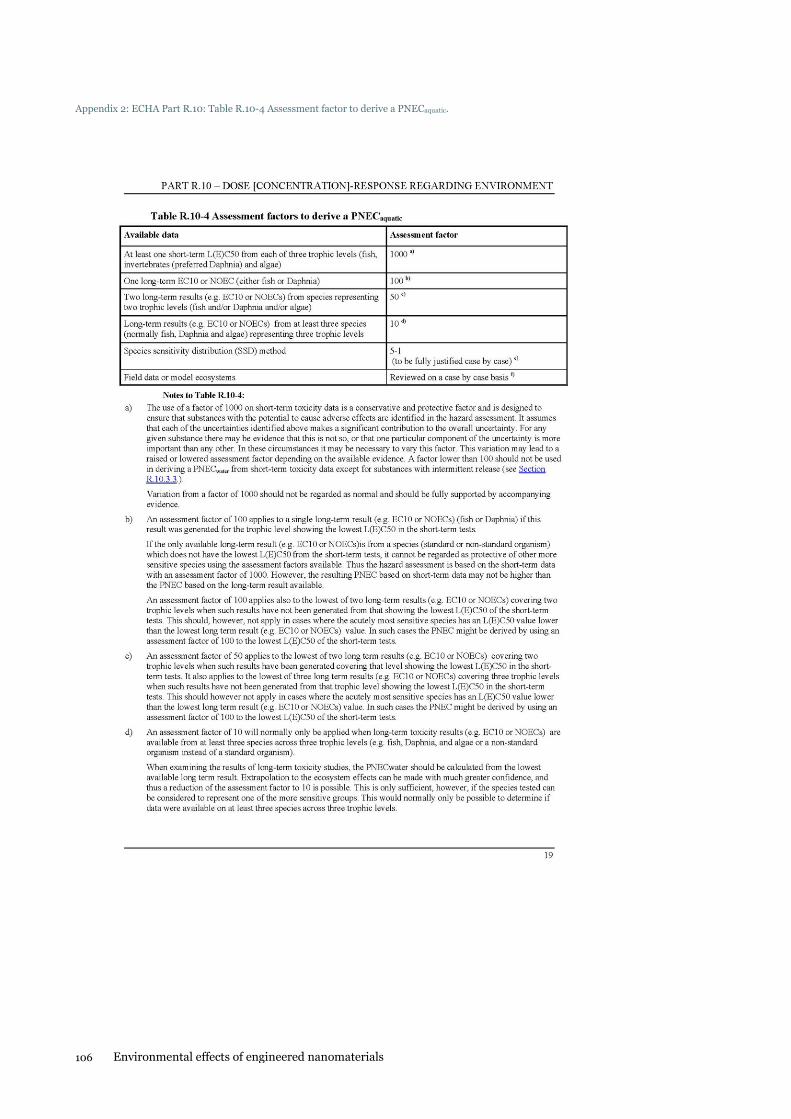
106 Environmental effects of engineered nanomaterials
Appendix 2: ECHA Part R.10: Table R.10-4 Assessment factor to derive a PNECaquatic.
Environmental fate and behaviour of nanomaterials Environmental effects of engineered nanomaterials 107
Appendix 3: Guidance text according to (Moermond, Kase et al. In prep) on criteria used to evaluate reliability of an
effect study on ENMs (referring to criteria numbers in Table 9).
Physico-chemical parameters – As for chemicals in general, knowledge on physico-chemical
parameters of the nanomaterial are required to enable a correct evaluation of the test reliability. In
contrast to conventional chemicals, however, it is generally not possible to obtain this information
from chemical handbooks as a CAS number and/or the chemical composition is not sufficient to
describe and identify the nanomaterial. For example many physico-chemical parameters will
depend on factors such as particle size or coating material. This information should be given in the
study documentation.
Before evaluating the test, check the physico-chemical characteristics of the nanomaterial. Check
the core chemical composition, primary particle size, surface chemistry (coating material,
functionalization etc. if used). Other important information include solubility of the nanomaterial
(check if the nanomaterial is likely to undergo dissolution and if the dissolved species have a known
ecotoxicological effect). If the nanomaterial is coated and/or stabilised, what are the known
properties of the coating material? Is it photocatalytic or reactive? What is the
agglomeration/aggregation state of the particles? What is the specific surface area? If the
reported information on physicochemical properties of the nanomaterial is
considered to be insufficient to evaluate the reliability, the study should be given the
score nRi4.
1 - Consider if a sufficiently detailed description of endpoints and methodology is available? (▲▲)
It should be evaluated if the study methodology and endpoints are generally described in a clear
and transparent manner. For ecotoxicity data in general (see also (Moermond, Kase et al. In prep)),
and nano-ecotoxicity data in particular, it is not sufficient to state that a certain guideline has been
followed. The specific details of the test methodology should be provided in the study. At present
there are no specific OECD test guidelines available for ecotoxicity testing of nanomaterials and the
current guideline methodologies are therefore often (at least to some extend) adapted to
nanomaterial testing especially with respect to preparation of test suspensions. Due to the great
variety of nanomaterial properties it is highly unlikely that a completely harmonised guideline for
nanomaterial dispersion will ever become available covering all types of nanomaterials. This implies
that some degree of case-by-case methodologies will be the reality, emphasising the need for clear
and transparent reporting. For example, when testing nanomaterials even little changes to the
sample preparation and test methodology can have a great impact on the nanomaterial behaviour in
the test system and resulting effects. It is important to know exactly how the stock dispersion was
made (including e.g. nanomaterial concentration, sonication time, sonication energy, volume and
material of suspension vessel, pre-wetting steps, addition of dispersants etc.) as this will directly
influence the characteristics of the stock suspension and hence the subsequent exposure conditions.
If the description of the study is not sufficiently detailed to evaluate reliability, the
study should be assigned nRi4.
2 - Is a standard method (e.g., OECD, ISO) or modified standard used? (Δ)
As for conventional chemicals the use of standard methods is not in itself a guarantee for study
reliability. It may ensure better and more complete documentation but does not per se ensure e.g.
an appropriate study design or correct interpretation of test results (Moermond, Kase et al. In
prep). Unless specific standard methods have been developed explicitly for nanomaterials, the use
of standard methods may on the contrary result in lower reliability. This is due to the fact that
current guidelines are developed mainly for soluble chemicals and do not take into account the
particulate nature of nanomaterials. Non-standard tests – or modified guideline tests – may
therefore be equally or more reliable compared to standard guideline studies. A well-considered
modification of a standard method is preferred over uncritically applying a standard method that
does not account for the nano-specific physical chemical properties. The use of standard
guidelines is therefore not considered to be a critical criterion for reliability per se.
108 Environmental effects of engineered nanomaterials
3 - Is the test performed under GLP conditions? (-)
As for standard guidelines, GLP helps to ensure reproducibility and transparency but is not in itself
a guarantee for reliability. The use of GLP is therefore not considered to be a critical
criterion for reliability.
4 - If applicable, are validity criteria fulfilled (e.g. control survival, growth)? (Δ/▲)
This criterion applies equally to conventional chemicals and nanomaterials. Such criteria especially
apply to studies that follow guidelines or modified guidelines containing requirements regarding
validity criteria. However, any study where a smaller or larger part of the control organisms die
during test performance may constitute a test set-up problem, leading to a test artefact. If the
guidelines have been modified then the original validity criteria may not be relevant or possible to
achieve. In these cases expert judgement is required. For a detailed description see
(Moermond, Kase et al. In prep).
5 - Are appropriate controls performed (e.g. dispersant control, metal ion control, negative and
positive control)? (▲)
For conventional chemicals it is common to use solvents to dissolve poorly soluble compounds. For
nanomaterials it is not feasible and/or relevant to dissolve the particles. Instead the aim is rather to
achieve a stable and homogeneous suspension. For example, when testing silver nanoparticles, the
aim is not to dissolve the particles into ions and ion complexes but rather to test silver in its nano-
particulate form. Stable and homogeneous dispersions can sometimes be achieved by adding a
dispersant or a stabiliser to the media. This could be a substance that adsorbs to the surface of the
particle and causes electrostatic or steric stabilisation. It is important to include dispersant controls
to ensure that this substance does not in itself cause toxic effects. If a dispersant has been used,
but no information is provided regarding its ecotoxicity, the study is considered not
to be reliable (nRi3).
Some nanomaterials will dissolve over time. This is for example the case for silver and zinc
nanoparticles. Other materials are more inert (e.g. TiO2). For nanomaterials that release metal ions
it is important that the study also addresses the metal ion contribution to the observed toxicity. This
is often done by including metal ion controls and monitoring the ion release from the nanomaterial.
The key in data interpretation is then to evaluate the particle as well as the ion contributions to the
observed ecotoxicological effects. There are also other ways of addressing this issue such as
biomarkers etc. Expert judgement is therefore needed to evaluate if the study is lacking critical
information regarding metal ion controls.
A negative control refers to test samples in pure media without the presence of nanomaterials,
dispersants etc. Mortality in the negative controls may indicate some problems with the
study reliability and result in a lower reliability score (nRi2 or nRi3) subject to expert
judgement. Positive controls are not considered critical to the reliability of a study.
6 - Is the test substance identified with name or CAS-number? Are nanomaterial characteristics
reported that allow for a clear identification of the tested material (e.g. particle size, shape,
particle size distribution, surface area)? Are test results reported for the appropriate compound?
(▲▲)
Contrary to conventional chemicals it is not sufficient to specify name or CAS-number for
nanomaterials as they may cover a wide range of nanomaterials with chemical composition as the
only common denominator. Nanomaterials should not only be identified from their chemical
composition but also from other physico-chemical properties such as primary particle sizes, shape,
crystal structure (relevant for e.g. TiO2), presence of coatings etc. Hence, information should be
available that clearly and unambiguously identifies the nanomaterial for which the ecotoxicity data
has been established. The detail of this information should make it possible to compare the specific
Environmental fate and behaviour of nanomaterials Environmental effects of engineered nanomaterials 109
tested substance with the substance for which e.g. the risk assessment is to be performed. The
following parameters are considered to be the minimum characterization requirements that will
allow for unambiguous substance identification:
- core chemical composition,
- purity,
- primary particle size (measured),
- shape,
- crystal structure (if relevant),
- radiolabelled (if used),
- surface chemistry (coating material, functionalization etc. if used).
If the information is insufficient (generic and e.g. reporting only the chemical
composition) the study is considered not to be reliable (nRi3).
7 - Is the purity of the test substance reported? This includes information on synthesis by-products
as well as synthesis catalysts and presence of other crystalline forms of the substance. And/or, is
the source of the test substance trustworthy? (▲)
As for conventional chemicals it is important that tested nanomaterials are of high purity and that
toxic effects attributed to impurities are accounted for. For nanomaterials impurities may be formed
as a result of synthesis. For example carbon nanotubes (CNTs) may contain metal impurities that
will contribute to the overall toxicity. Also, different crystalline forms of the substance may be
formed during the synthesis resulting in an untended fraction of another crystalline form. This is
for example the case for TiO2 where the anatase form may contain fractions of rutile and amorphous
particles. If, based on expert judgement, it is evaluated that the tested nanomaterial is
likely to contain impurities, but this is not reported in the study report, the reliability
of the study should be lowered.
8 - If a formulation is used or if impurities or coatings are present: Do other ingredients in the
formulation, the impurities or the coatings exert an effect? Is the amount of test substance in the
formulation known? (Δ/▲)
When impurities are reported or known to be present, or if the nanomaterial is coated (for example
to stabilise it in a dispersion), the potential negative (or positive) effects of the impurities and/or
coating should be addressed. This should clarify if the observed effects can be partly or fully
attributed to the impurities and/or the coating material. If such information is not provided
then the reliability of the study should be lowered. For uncoated nanomaterials with a
high purity this is however not a critical criteria.
9 - Are the organisms well described (e.g. scientific name, sex, weight, length, growth, age/life
stage, strain/clone, gender if appropriate)? (▲)
This criterion does not differ from conventional chemicals. For a detailed description see
(Moermond, Kase et al. In prep).
10 - Are the test organisms from a trustworthy source and acclimatized to test conditions? Have
the organisms been pre-exposed to test compound or other unintended stressors? (▲▲)
This criterion does not differ from conventional chemicals. For a detailed description see
(Moermond, Kase et al. In prep). Pre-exposure of the organism to other stressors obviously lowers
the study reliability. It should be ensured that the organisms are fit prior to nanomaterial exposure.
11 - Is the experimental test system, test design and test vessel scientifically appropriate for testing
of nanomaterials (e.g., static, flow-through, renewal; light/dark conditions; open/closed systems;
still/stirred; exposure route)? (▲▲)
As for conventional chemicals the experimental system should be appropriate for the test substance
in terms of e.g. vessel materials and use of methods that prevent loss of the test substance from the
110 Environmental effects of engineered nanomaterials
system (see (Moermond, Kase et al. In prep)). For nanomaterials it is often observed that the
concentration in the water phase will decrease significantly during the test due to particle
aggregation/agglomeration and subsequent settling in the test vials. Discussions are ongoing, e.g.
within the OECD WPMN and an OECD Expert Group whether this has to be accepted for
nanomaterials, whether a higher loss should be acceptable, whether the dispersions have to be
stabilised or whether non-guideline aquatic test systems are more appropriate. However, so far
there is no clear consensus on this matter and the appropriateness of the applied methods
with regards to testing of nanomaterials will have to be evaluated based on expert
judgement. If the method is considered not being appropriate the study should be
given reliability nRi3.
12- Is the experimental system appropriate for the test organism; e.g., choice of medium or test
water, feeding, water characteristics, temperature, light/dark conditions, pH, oxygen content?
Have conditions been stable during the test? (▲▲)
This criterion does not differ from conventional chemicals. For a detailed description see
(Moermond, Kase et al. In prep).
13 – Were exposure concentrations stable throughout the duration of the test (taking the use of a
dispersant/stabilizer/solvent into account)? And was the exposure stable in qualitatively terms? If
not, has this been accounted for in the data interpretation? If a dispersant/stabilizer/solvent is
used, is the dispersant/stabilizer/solvent within the appropriate range and is a
dispersant/stabilizer/solvent control included? (▲)
Achieving a stable nanomaterial test suspension is a challenging task as nanomaterials tend to
agglomerate and sediment in test media. This process is affected by factors such as media
composition, ionic strength, and pH. The introduction of a test organism is known to further
destabilise the test suspension, leading to unstable exposure conditions during the tests. In addition
to quantitative (concentration) changes, exposure may also change qualitatively due to
nanomaterial transformation processes. This makes it very important to monitor nanomaterial
properties (e.g. agglomeration, dissolution, and degradation), settling behaviour and water phase
concentrations during aquatic tests. For conventional chemicals the OECD operates with validity
criteria of max 20% loss of the test substance during a test. If the test concentration varies more
than ±20% over the duration of the test this excludes the use of initial concentrations as a measure
of exposure. Instead concentrations should be based on measurements throughout the test.
Discussions are ongoing if such criteria are relevant for tests with nanomaterials (Kennedy et al.,
2015). Nonetheless it is important that exposure concentrations are monitored throughout the
duration of the test and that its impact on observed effects is discussed. If a
dispersant/stabiliser/solvent has been used to achieve a stable dispersion the potential positive or
adverse effects of this substance on the overall ecotoxicity should be addressed. If such
information is not provided then the reliability of the study should be lowered
14 - Is a correct spacing between exposure concentrations applied? (Δ)
Exposure concentrations can be controversial when it comes to nanomaterials. Firstly there may be
a correlation between nanomaterial concentration and agglomeration behaviour, meaning that
exposure changes qualitatively along the dose-axis in a dose-response curve. Secondly, it has been
suggested that concentration may not (alone) be sufficient as a dose-descriptor and other dose-
metrics (such as surface area) have been proposed. It may therefore be very challenging to even
define a ‘correct spacing’ between exposure concentrations. This criterion is therefore
considered not to be critical for the reliability of ecotoxicity studies of nanomaterials.
Expert judgement should however be applied to ensure that the exposure concentrations are chosen
in a reasonable manner.
15 - Is the exposure duration defined? (▲▲)
Environmental fate and behaviour of nanomaterials Environmental effects of engineered nanomaterials 111
This criteria does not differ from conventional chemicals. For a detailed description see
(Moermond, Kase et al. In prep).
16 - Have analyses been performed to verify exposure, e.g. substance concentrations and physico-
chemical transformations of the test substance over the duration of the test? (▲▲)
This criterion is linked to criterion 13 above. As mentioned it is important to monitor nanomaterial
exposure over the duration of the test: not only quantitatively but also qualitatively. Important
papameters to monitor over the duration of the test include:
- agglomeration state
- particle size distribution
- surface charge/zeta potential
- ion release
Preferably this information should be available for all tested concentrations and measured at
regular intervals.
17 - Is the biomass loading of the organisms in the test system within the appropriate range (< 1
g/L)? (▲)
For nanomaterials physical ‘overload’ phenomena are sometimes observed and it is thus important
to evaluate if the effects on the biomass is caused by test artefacts. This requires an expert
evaluation of the nanomaterial loading possibly combined with images of the biomass in the test
system. For algal growth inhibition tests shading effects may be relevant. If there is a clear
indication of test artefacts caused by a high nanomaterial loading then this with negatively impact
reliability.
18 – Is a sufficient number of replicates used? Is a sufficient number of organisms per replicate
used for all controls and test concentrations? (▲)
This criteria does not differ from conventional chemicals. For a detailed description see
(Moermond, Kase et al. In prep).
19 - Are appropriate statistical methods used? (▲)
This criterion does not differ from conventional chemicals. For a detailed description see
(Moermond, Kase et al. In prep).
20 - Is a dose response curve observed? Is the response statistically significant? (-)
See explanation to criterion 14. There may be inherent characteristics on the nanomaterial test
system which impedes the establishment of dose response curves. This criterion is therefore
considered not to be critical for the reliability of ecotoxicity studies of nanomaterials.
Expert judgement should however be applied to evaluate the test results and the statistical
significance of the observed response.
21 - Is sufficient data available to check the calculation of endpoints and validity criteria (e.g.,
control data, dose-response curves)?
This may refer for example to the access to raw data. It is important to be able to verify the data
presented. However, full access to all raw data is not essential.
Strandgade 29
DK - 1401 København K
Tlf.: (+45) 72 54 40 00
www. mst.dk
A risk assessment tool for contaminated sites in low-permeability fractured media
This report presents ecotoxicological data and Predicted No-Effect Concentrations (PNECs) for nine
selected nanomaterials which are considered to be environmentally relevant due to high usage or how
they are used. These data will together with data from other reports/projects be used in an overall
assessment of the environmental risk of nanomaterials in Denmark.
The nine investigated nanomaterials are: Titanium Dioxide, Zinc Oxide, Silver, Carbon Nanotubes,
Copper Oxide, Nano Zero Valent Iron, Cerium Dioxide, Quantum Dots and Carbon Black.
To support the assessment of the data found in the peer reviewed scientific literature, the current project
has developed a scoring system that evaluates the liability and relevance of the data in relation to
nanomaterials.
Nærværende rapport præsenterer økotoksikologiske data og Predicted No-Effect Concentrations
(PNECs) for ni udvalgte nanomaterialer, som forventes at være miljømæssigt relevante ud fra viden om
forbrugsmængder eller hvordan de anvendes. Disse data skal sammen med data fra andre
rapporter/projekter bidrage til en samlet vurdering af nanomaterialers miljørisiko i Danmark.
De 9 undersøgte nanomaterialer er: Sølv, Titaniumdioxid, Zinkoxid, Kulstofnanorør, Kobberoksid,
Nanojern i oxidationstrin nul, Ceriumdioxid, Carbon black samt Kvantepunkter.
Som en del af arbejdet med at finde data i litteraturen, er der i dette projekt udviklet et point-system til
evaluering af data pålidelighed og relevans i forhold til nanomaterialer.