environmental engineering lab manual
TRANSCRIPT
ENVIRONMENTAL ENGINEERING LAB MANUAL
Department of Civil Engineering B.V. Raju Institute of Technology, Narsapur
LIST OF EXPERIMENTS
1. Determination of pH and Turbidity.
2. Determination of Conductivity and Total Dissolved Solids
(Organic and inorganic).
3. Determination of Alkalinity / Acidity.
4. Determination of Chlorides.
5. Determination of Iron.
6. Determination of Dissolved Oxygen.
7. Determination of Nitrates.
8. Determination of Optimum dose of Coagulant.
9. Determination of Chlorine Demand.
10. Determination of Total Phosphorous.
11. Determination of B.O.D.
12. Determination of C.O.D.
13. Presumptive Coli-form Test.
NOTE: At least 8 of the above experiments are to be conducted
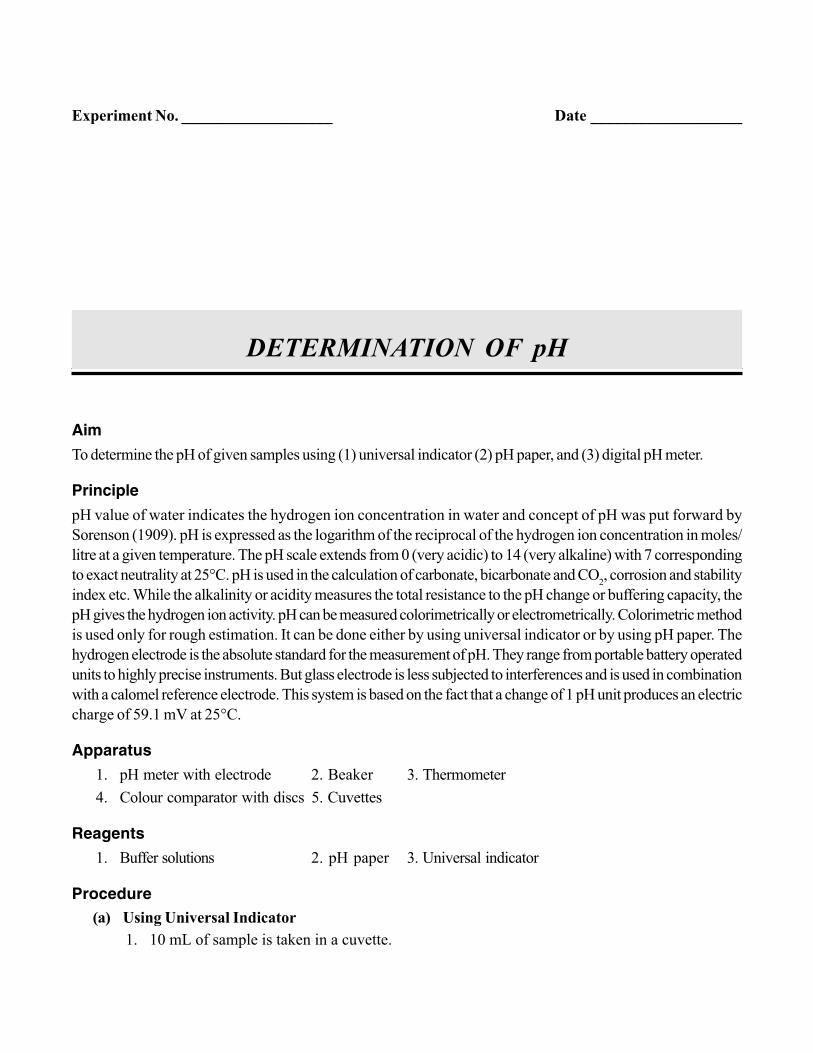
Aim
To determine the pH of given samples using (1) universal indicator (2) pH paper, and (3) digital pH meter.
Principle
pH value of water indicates the hydrogen ion concentration in water and concept of pH was put forward by
Sorenson (1909). pH is expressed as the logarithm of the reciprocal of the hydrogen ion concentration in moles/
litre at a given temperature. The pH scale extends from 0 (very acidic) to 14 (very alkaline) with 7 corresponding
to exact neutrality at 25°C. pH is used in the calculation of carbonate, bicarbonate and CO2, corrosion and stability
index etc. While the alkalinity or acidity measures the total resistance to the pH change or buffering capacity, the
pH gives the hydrogen ion activity. pH can be measured colorimetrically or electrometrically. Colorimetric method
is used only for rough estimation. It can be done either by using universal indicator or by using pH paper. The
hydrogen electrode is the absolute standard for the measurement of pH. They range from portable battery operated
units to highly precise instruments. But glass electrode is less subjected to interferences and is used in combination
with a calomel reference electrode. This system is based on the fact that a change of 1 pH unit produces an electric
charge of 59.1 mV at 25°C.
Apparatus
1. pH meter with electrode 2. Beaker 3. Thermometer
4. Colour comparator with discs 5. Cuvettes
Reagents
1. Buffer solutions 2. pH paper 3. Universal indicator
Procedure
(a) Using Universal Indicator
1. 10 mL of sample is taken in a cuvette.
DETERMINATION OF pH
Experiment No. ___________________ Date ___________________
32 A Comprehensive Laboratory Manual for Environmental Science and Engineering
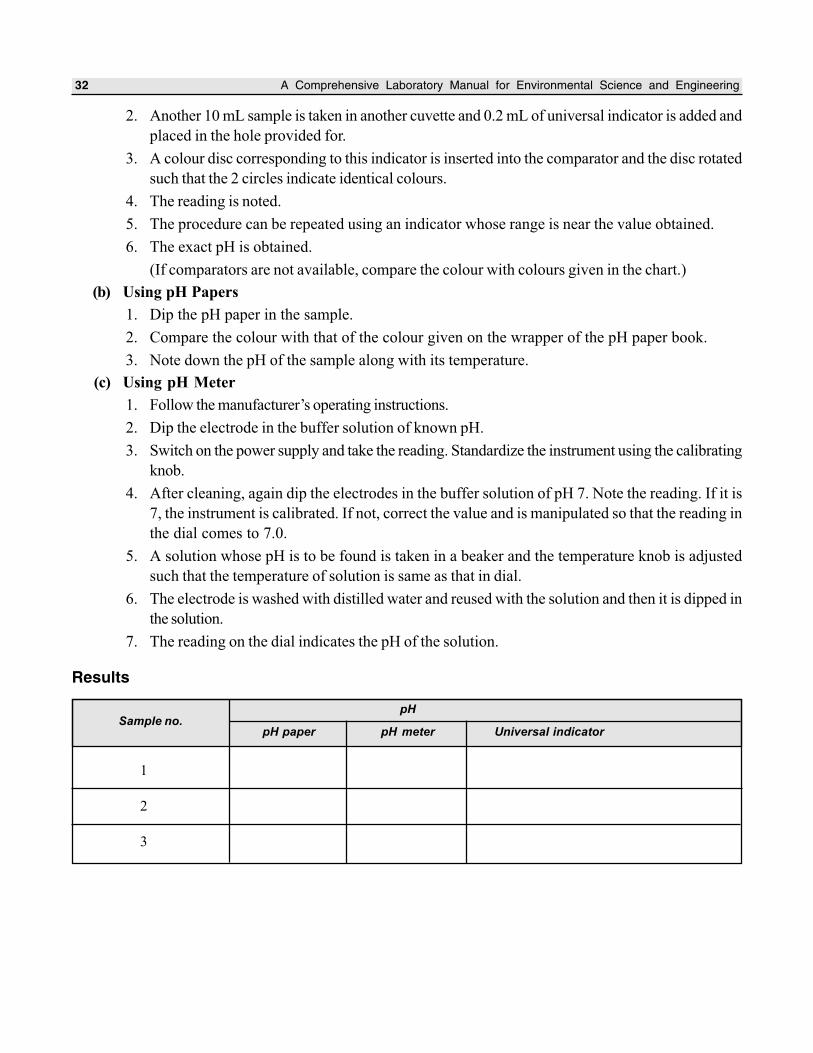
2. Another 10 mL sample is taken in another cuvette and 0.2 mL of universal indicator is added and
placed in the hole provided for.
3. A colour disc corresponding to this indicator is inserted into the comparator and the disc rotated
such that the 2 circles indicate identical colours.
4. The reading is noted.
5. The procedure can be repeated using an indicator whose range is near the value obtained.
6. The exact pH is obtained.
(If comparators are not available, compare the colour with colours given in the chart.)
(b) Using pH Papers
1. Dip the pH paper in the sample.
2. Compare the colour with that of the colour given on the wrapper of the pH paper book.
3. Note down the pH of the sample along with its temperature.
(c) Using pH Meter
1. Follow the manufacturer’s operating instructions.
2. Dip the electrode in the buffer solution of known pH.
3. Switch on the power supply and take the reading. Standardize the instrument using the calibrating
knob.
4. After cleaning, again dip the electrodes in the buffer solution of pH 7. Note the reading. If it is
7, the instrument is calibrated. If not, correct the value and is manipulated so that the reading in
the dial comes to 7.0.
5. A solution whose pH is to be found is taken in a beaker and the temperature knob is adjusted
such that the temperature of solution is same as that in dial.
6. The electrode is washed with distilled water and reused with the solution and then it is dipped in
the solution.
7. The reading on the dial indicates the pH of the solution.
Results
pH
pH paper pH meter Universal indicator
1
2
3
Sample no.
Determination of pH 33
Discussion
Questions
1. Discuss the relationship between (a) pH and hydrogen ion concentration (b) pH and hydroxide ion
concentration?
2. A decrease in pH of 1 unit represents how much of an increase in hydrogen ion concentration?
3. Why is it necessary to maintain the pH of water nearly 7?
4. What is a buffer solution? Give examples.
Aim
To determine the turbidity of the given sample using Nephelometer in NTU.
Principle
The method presented below is based on a comparison of the intensity of light scattered by the sample in specific
conditions with the intensity of light scattered by standard reference suspension under the same condition. The
higher the intensity of scattered lights, higher the turbidity. Formazine polymer, which has gained acceptance as the
turbidity standard reference suspension is used as a reference turbidity standard suspension for water. It is easy to
prepare and is more reproducible in its lights scattering properties than the clay or turbid natural water standards
previously used. The turbidity of a given concentration of formazine has an approximate turbidity of 100 NTU,
when measured on candle turbidity meter. Nephelometric turbidity units based on formazine preparation will have
approximate units derived from Jackson candle turbidimeter but will not be identical to them.
Apparatus
Nephelometer with accessories
Reagents
(i) Turbidity free distilled water (for setting zero).
(ii) Formazine turbidity concentrate (hydrazine sulphate + hexamine).
(iii) Formazine standard (for setting 100 of the instrument).
Preparation of Turbidity Free Distilled Water
Pass distilled water through a membrane filter having a precision pore size of less than 10 microns (Whatman filter
No. 42). Rinse collecting flask atleast twice with such filtered water and discard the next 200 mL. Use this filtered
water for setting zero of the instrument.
TURBIDITY
Experiment No. ___________________ Date ___________________
16 A Comprehensive Laboratory Manual for Environmental Science and Engineering
Preparation of Formazine Turbidity Concentrate
(a) Solution I
Weigh accurately 5 g of ‘Anal–R’ quality hydrazine sulphate (NH2)
2H
2SO
4 into a 500 mL volumetric
flask and add distilled water to make up to the mark. Leave the mixture to stand for 4 hours.
(b) Solution II
Weigh accurately 50g of ‘Anal–R’ quality hexamethylene tetramine (CH2)
6N
4 (hexamine) into a 500 mL
volumetric flask and add distilled water to make up to the mark.
Mix equal volume of solution I and II to form formazine turbidity concentrate. Allow it to stand in a
closed container at 25°C to 30°C for 48 hours to produce insoluble white turbidity corresponding to
4000 NTU.
Note: Once prepared, formazine turbidity concentrate (which corresponds to 10000 ppm SiO2) is stable for 2 to 3 months.
Preparation of Formazine Standard
Dilute 25mL of the formazine turbidity concentrate to 1 litre with turbidity free distilled water to obtain 250 ppm or
100 NTU for setting ‘100’ of the instrument.
Note: Formazine standard 100 NTU should be prepared weekly.
Procedure
(1) Switch the instrument on.
(2) Open the lid of the sample compartment.
(3) Insert a test tube filled with distilled water into the sample compartment. Close the lid.
(4) Adjust ‘SET 0’ control to get ‘0’ displayed on the read out.
(5) Open the lid. Replace the test tube filled with distilled water with a test tube filled with formazine standard.
Close the lid.
(6) Adjust the ‘SET 100’ control to get ‘100’ displayed on the read out.
(7) Repeat the above operation to get consistent values of 0 to 100 within 1% to 2%.
Measurement of turbidity less than 100 NTU
1. Thoroughly shake the sample.
2. Wait until air bubbles disappear and pour the sample into the nephelometer tube.
3. Read the turbidity directly from the instrument.
Measurement of turbidity above 100 NTU
Dilute the sample with one or more volume of turbidity free distilled water until the turbidity fall below 100 NTU.
NTU of sample = A(B + C)
C
where,
A = NTU found in diluted sample
B = volume of dilution water in mL
C = sample volume taken for dilution in mL
Turbidity 17
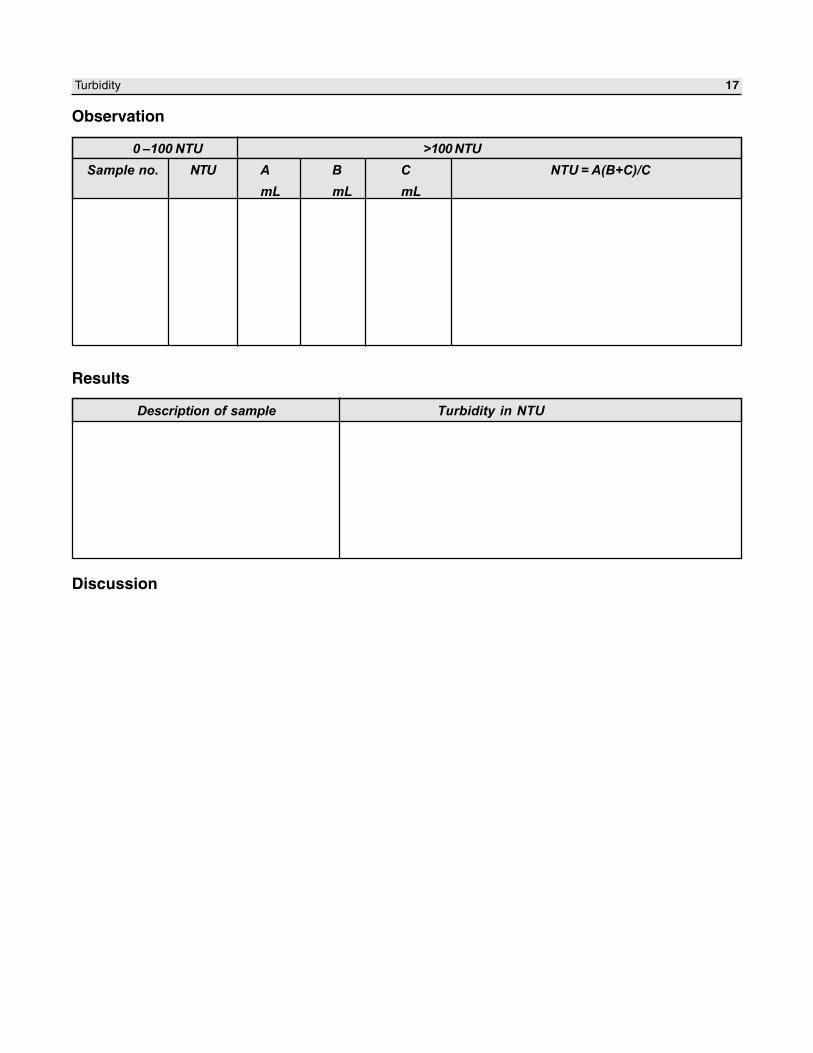
Observation
0 –100 NTU >100 NTU
Sample no. NTU A B C NTU = A(B+C)/C
mL mL mL
Results
Description of sample Turbidity in NTU
Discussion
18 A Comprehensive Laboratory Manual for Environmental Science and Engineering
Questions
1. Where do you find the adverse effects of turbidity in environmental engineering? Mention two instances.
2. Discuss the significance of determination of turbidity in sanitary engineering.
3. Discuss the nature of materials causing turbidity in
(a) River water during flash flood
(b) Polluted river water
(c) Domestic wastewater
4. What is the standard unit of turbidity?
5. What are NTU and JTU?
Aim
The aim of the experiments is to determine the following types of solids in the given sample(s):
(a) Total solids
(b) Total (inorganic) fixed solids
(c) Total volatile (organic) solids
(d) Total dissolved solids
(e) Dissolved fixed (inorganic) solids
(f) Dissolved volatile (organic) solids
(g) Total suspended solids
(h) Suspended fixed (inorganic) solids
(i) Suspended volatile (organic) solids
(j) Settleable solids
Principle
‘Total solids’ is the term applied to the material left in the vessel after evaporation of a sample of water/waste water
and its subsequent drying in an oven at a definite temperature. Total solids include “total suspended solids” the
portion of total solids retained by a filter and “total dissolved solids” the portion that passes through the filter. Fixed
solids is the residue remaining after ignition for 1 hour at 550°C. The solid portion that is volatilised during ignition
is called volatile solids. It will be mostly organic matter. Waters that are low in organic matter and total mineral
content and are intended for human consumption may be examined under 103–105°C or 179–181°C. But water
containing considerable organic matter or those with pH over 9.0 should be dried at 179–181°C. In any case, the
report should indicate the drying temperature.
The sample is filtered and the filtrate evaporate in a weighed dish on a steam bath, the residue left after
evaporation is dried to constant weight in an oven at either 103–105°C or 179–181°C. The increase in weight
over that of the empty dish represents total dissolved solids and includes all materials, liquid or solid, in solution or
otherwise, which passes through the filter and not volatilised during the drying process.
DETERMINATION OF SOLIDS
Experiment No. ___________________ Date ___________________
8 A Comprehensive Laboratory Manual for Environmental Science and Engineering
The difference between the total solids and the total dissolved solids will give the total suspended solids. The
dishes with the residue retained after completion of the tests for total solids and total dissolved solids are subjected
to heat for 1 hour in a muffle furnace held at 550°C. The increase in weight over that of the ignited empty vessel
represents fixed solids in each instance.
The difference between the total dissolved/total suspended solids and the corresponding fixed solids will give
volatile solids in each instance. All the quantities should be expressed in mg/L. Settleable matter in surface and
saline waters as well as domestic and industrial wastes may be determined and reported on a volume basis as
millilitre per litre.
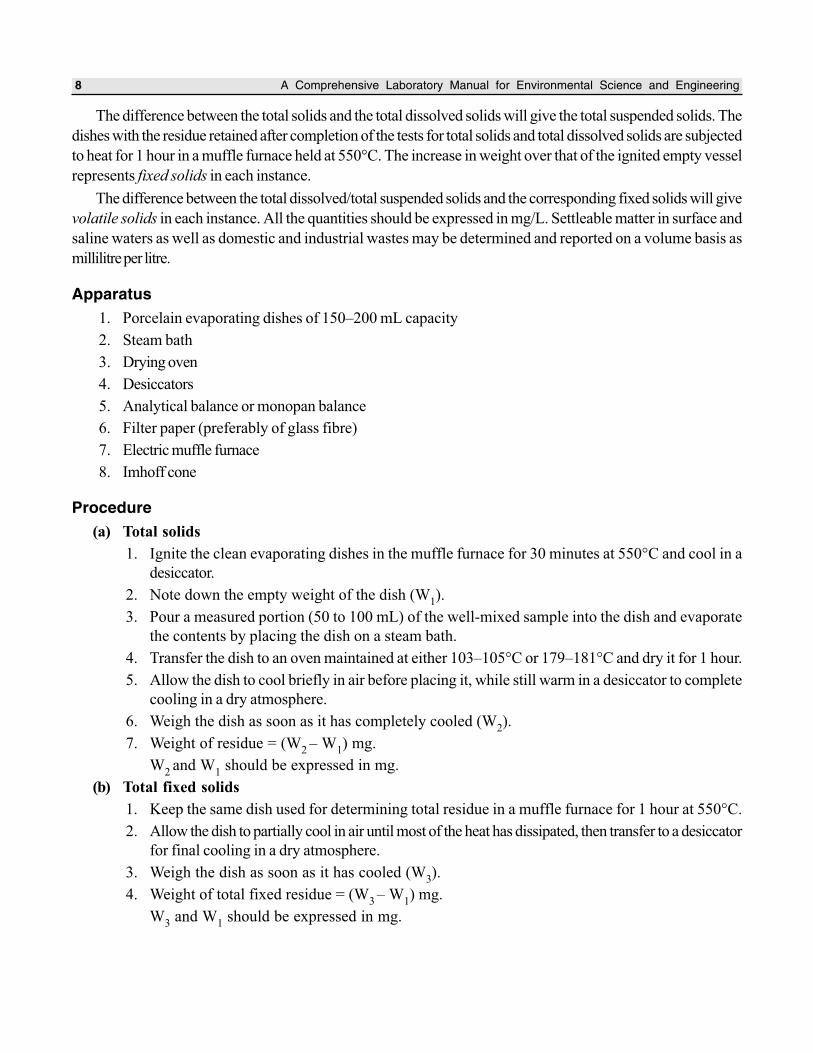
Apparatus
1. Porcelain evaporating dishes of 150–200 mL capacity
2. Steam bath
3. Drying oven
4. Desiccators
5. Analytical balance or monopan balance
6. Filter paper (preferably of glass fibre)
7. Electric muffle furnace
8. Imhoff cone
Procedure
(a) Total solids
1. Ignite the clean evaporating dishes in the muffle furnace for 30 minutes at 550°C and cool in a
desiccator.
2. Note down the empty weight of the dish (W1).
3. Pour a measured portion (50 to 100 mL) of the well-mixed sample into the dish and evaporate
the contents by placing the dish on a steam bath.
4. Transfer the dish to an oven maintained at either 103–105°C or 179–181°C and dry it for 1 hour.
5. Allow the dish to cool briefly in air before placing it, while still warm in a desiccator to complete
cooling in a dry atmosphere.
6. Weigh the dish as soon as it has completely cooled (W2).
7. Weight of residue = (W2 – W
1) mg.
W2 and W
1 should be expressed in mg.
(b) Total fixed solids
1. Keep the same dish used for determining total residue in a muffle furnace for 1 hour at 550°C.
2. Allow the dish to partially cool in air until most of the heat has dissipated, then transfer to a desiccator
for final cooling in a dry atmosphere.
3. Weigh the dish as soon as it has cooled (W3).
4. Weight of total fixed residue = (W3 – W
1) mg.
W3 and W
1 should be expressed in mg.
Determination of Solids 9
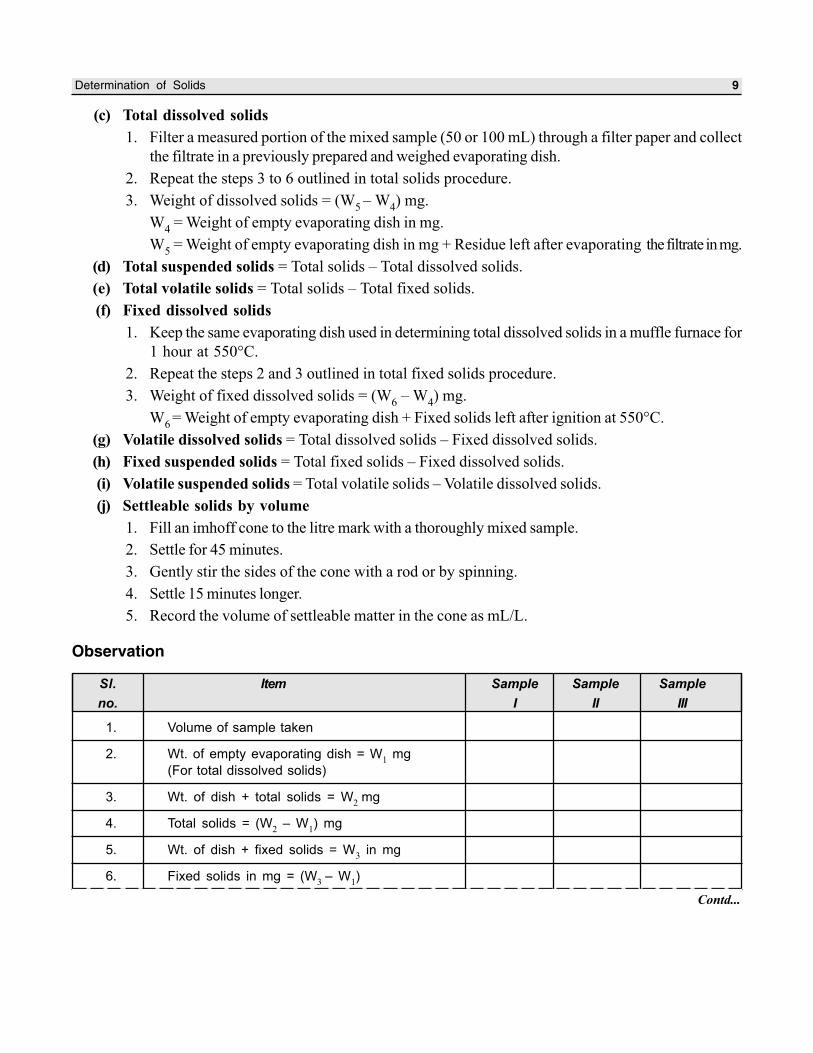
(c) Total dissolved solids
1. Filter a measured portion of the mixed sample (50 or 100 mL) through a filter paper and collect
the filtrate in a previously prepared and weighed evaporating dish.
2. Repeat the steps 3 to 6 outlined in total solids procedure.
3. Weight of dissolved solids = (W5 – W
4) mg.
W4 = Weight of empty evaporating dish in mg.
W5 = Weight of empty evaporating dish in mg + Residue left after evaporating the filtrate in mg.
(d) Total suspended solids = Total solids – Total dissolved solids.
(e) Total volatile solids = Total solids – Total fixed solids.
(f) Fixed dissolved solids
1. Keep the same evaporating dish used in determining total dissolved solids in a muffle furnace for
1 hour at 550°C.
2. Repeat the steps 2 and 3 outlined in total fixed solids procedure.
3. Weight of fixed dissolved solids = (W6 – W
4) mg.
W6 = Weight of empty evaporating dish + Fixed solids left after ignition at 550°C.
(g) Volatile dissolved solids = Total dissolved solids – Fixed dissolved solids.
(h) Fixed suspended solids = Total fixed solids – Fixed dissolved solids.
(i) Volatile suspended solids = Total volatile solids – Volatile dissolved solids.
(j) Settleable solids by volume
1. Fill an imhoff cone to the litre mark with a thoroughly mixed sample.
2. Settle for 45 minutes.
3. Gently stir the sides of the cone with a rod or by spinning.
4. Settle 15 minutes longer.
5. Record the volume of settleable matter in the cone as mL/L.
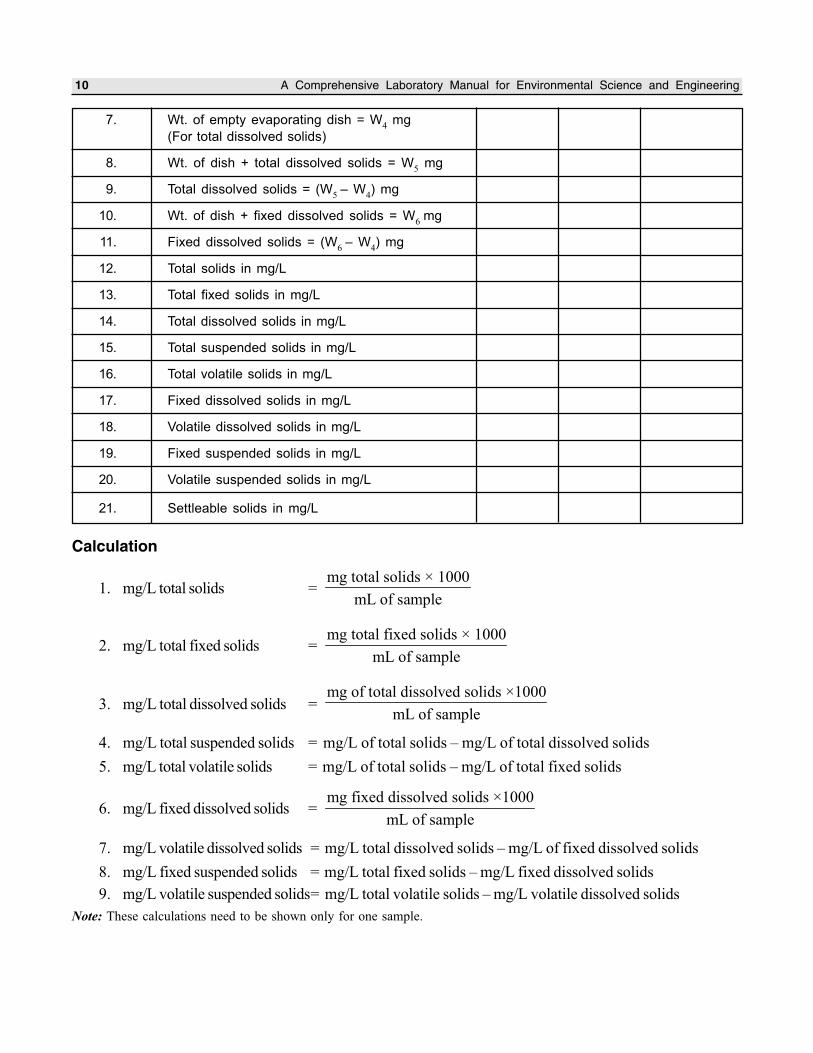
Observation
Sl. Item Sample Sample Sample
no. I II III
1. Volume of sample taken
2. Wt. of empty evaporating dish = W1 mg
(For total dissolved solids)
3. Wt. of dish + total solids = W2 mg
4. Total solids = (W2 – W
1) mg
5. Wt. of dish + fixed solids = W3 in mg
6. Fixed solids in mg = (W3 – W
1)
Contd...
10 A Comprehensive Laboratory Manual for Environmental Science and Engineering
7. Wt. of empty evaporating dish = W4 mg
(For total dissolved solids)
8. Wt. of dish + total dissolved solids = W5 mg
9. Total dissolved solids = (W5 – W
4) mg
10. Wt. of dish + fixed dissolved solids = W6 mg
11. Fixed dissolved solids = (W6 – W
4) mg
12. Total solids in mg/L
13. Total fixed solids in mg/L
14. Total dissolved solids in mg/L
15. Total suspended solids in mg/L
16. Total volatile solids in mg/L
17. Fixed dissolved solids in mg/L
18. Volatile dissolved solids in mg/L
19. Fixed suspended solids in mg/L
20. Volatile suspended solids in mg/L
21. Settleable solids in mg/L
Calculation
1. mg/L total solids = mg total solids × 1000
mL of sample
2. mg/L total fixed solids = mg total fixed solids × 1000
mL of sample
3. mg/L total dissolved solids = mg of total dissolved solids ×1000
mL of sample
4. mg/L total suspended solids = mg/L of total solids – mg/L of total dissolved solids
5. mg/L total volatile solids = mg/L of total solids – mg/L of total fixed solids
6. mg/L fixed dissolved solids = mg fixed dissolved solids ×1000
mL of sample
7. mg/L volatile dissolved solids = mg/L total dissolved solids – mg/L of fixed dissolved solids
8. mg/L fixed suspended solids = mg/L total fixed solids – mg/L fixed dissolved solids
9. mg/L volatile suspended solids= mg/L total volatile solids – mg/L volatile dissolved solids
Note: These calculations need to be shown only for one sample.
Determination of Solids 11
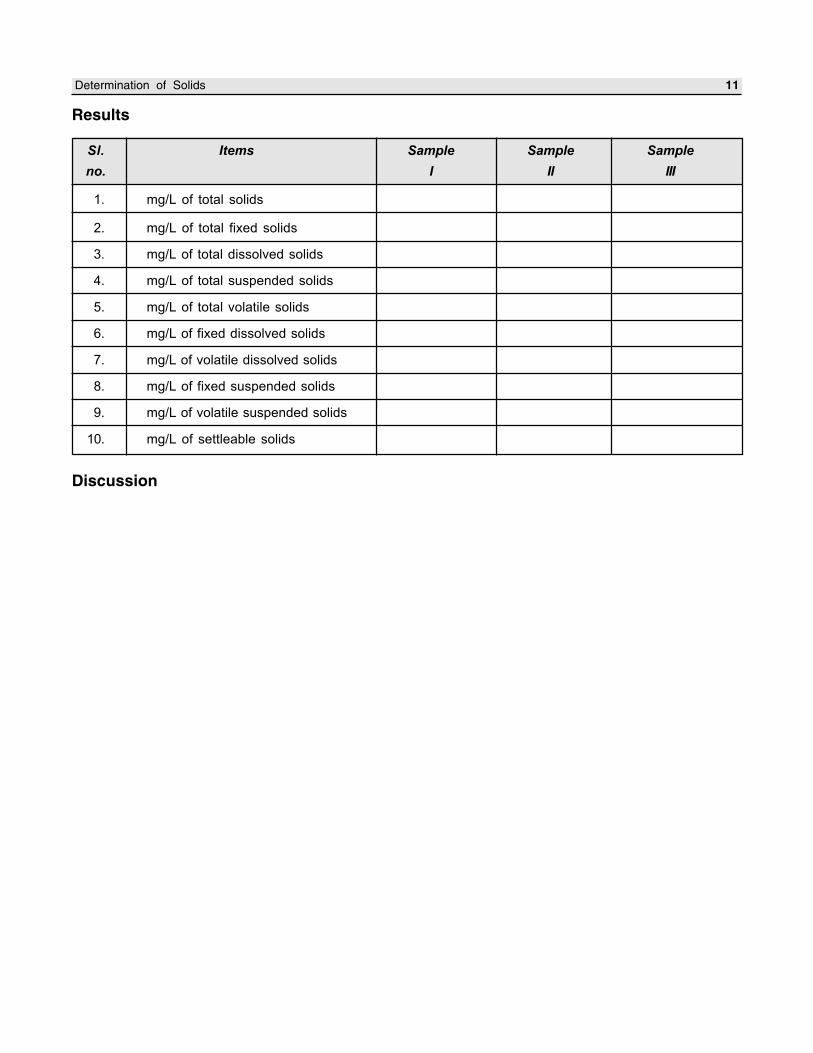
Results
Sl. Items Sample Sample Sample
no. I II III
1. mg/L of total solids
2. mg/L of total fixed solids
3. mg/L of total dissolved solids
4. mg/L of total suspended solids
5. mg/L of total volatile solids
6. mg/L of fixed dissolved solids
7. mg/L of volatile dissolved solids
8. mg/L of fixed suspended solids
9. mg/L of volatile suspended solids
10. mg/L of settleable solids
Discussion
12 A Comprehensive Laboratory Manual for Environmental Science and Engineering
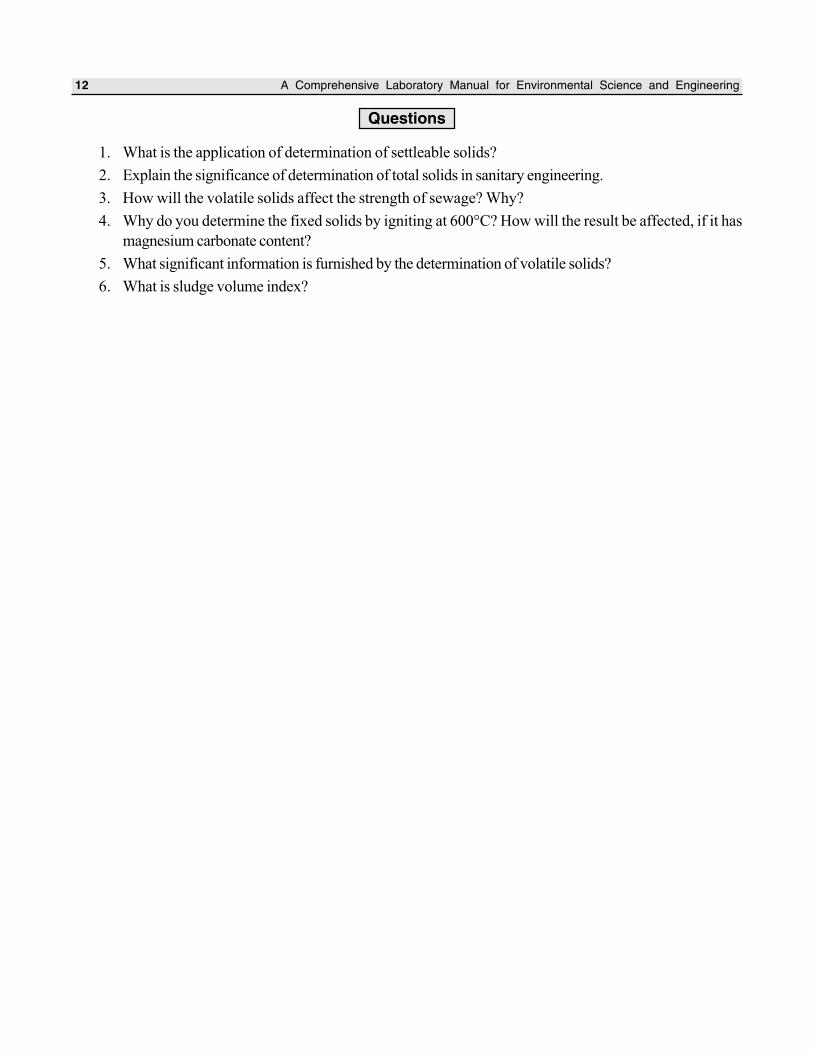
Questions
1. What is the application of determination of settleable solids?
2. Explain the significance of determination of total solids in sanitary engineering.
3. How will the volatile solids affect the strength of sewage? Why?
4. Why do you determine the fixed solids by igniting at 600°C? How will the result be affected, if it has
magnesium carbonate content?
5. What significant information is furnished by the determination of volatile solids?
6. What is sludge volume index?
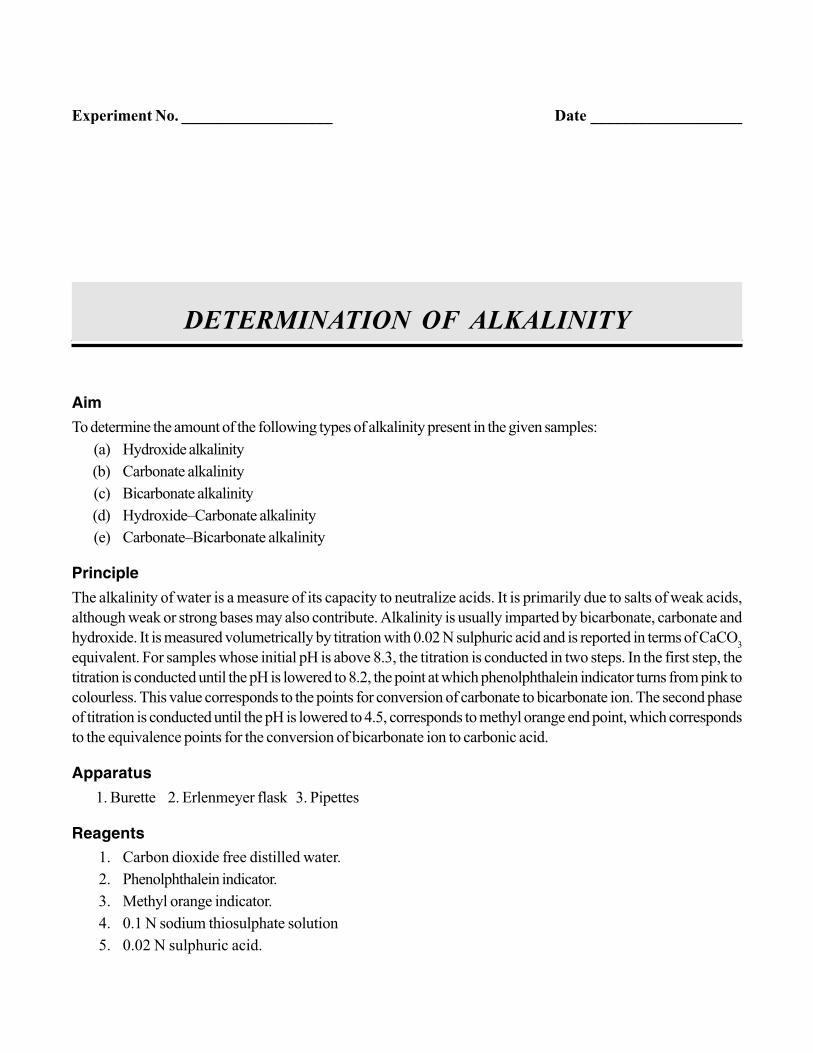
Aim
To determine the amount of the following types of alkalinity present in the given samples:
(a) Hydroxide alkalinity
(b) Carbonate alkalinity
(c) Bicarbonate alkalinity
(d) Hydroxide–Carbonate alkalinity
(e) Carbonate–Bicarbonate alkalinity
Principle
The alkalinity of water is a measure of its capacity to neutralize acids. It is primarily due to salts of weak acids,
although weak or strong bases may also contribute. Alkalinity is usually imparted by bicarbonate, carbonate and
hydroxide. It is measured volumetrically by titration with 0.02 N sulphuric acid and is reported in terms of CaCO3
equivalent. For samples whose initial pH is above 8.3, the titration is conducted in two steps. In the first step, the
titration is conducted until the pH is lowered to 8.2, the point at which phenolphthalein indicator turns from pink to
colourless. This value corresponds to the points for conversion of carbonate to bicarbonate ion. The second phase
of titration is conducted until the pH is lowered to 4.5, corresponds to methyl orange end point, which corresponds
to the equivalence points for the conversion of bicarbonate ion to carbonic acid.
Apparatus
1. Burette 2. Erlenmeyer flask 3. Pipettes
Reagents
1. Carbon dioxide free distilled water.
2. Phenolphthalein indicator.
3. Methyl orange indicator.
4. 0.1 N sodium thiosulphate solution
5. 0.02 N sulphuric acid.
DETERMINATION OF ALKALINITY
Experiment No. ___________________ Date ___________________
22 A Comprehensive Laboratory Manual for Environmental Science and Engineering
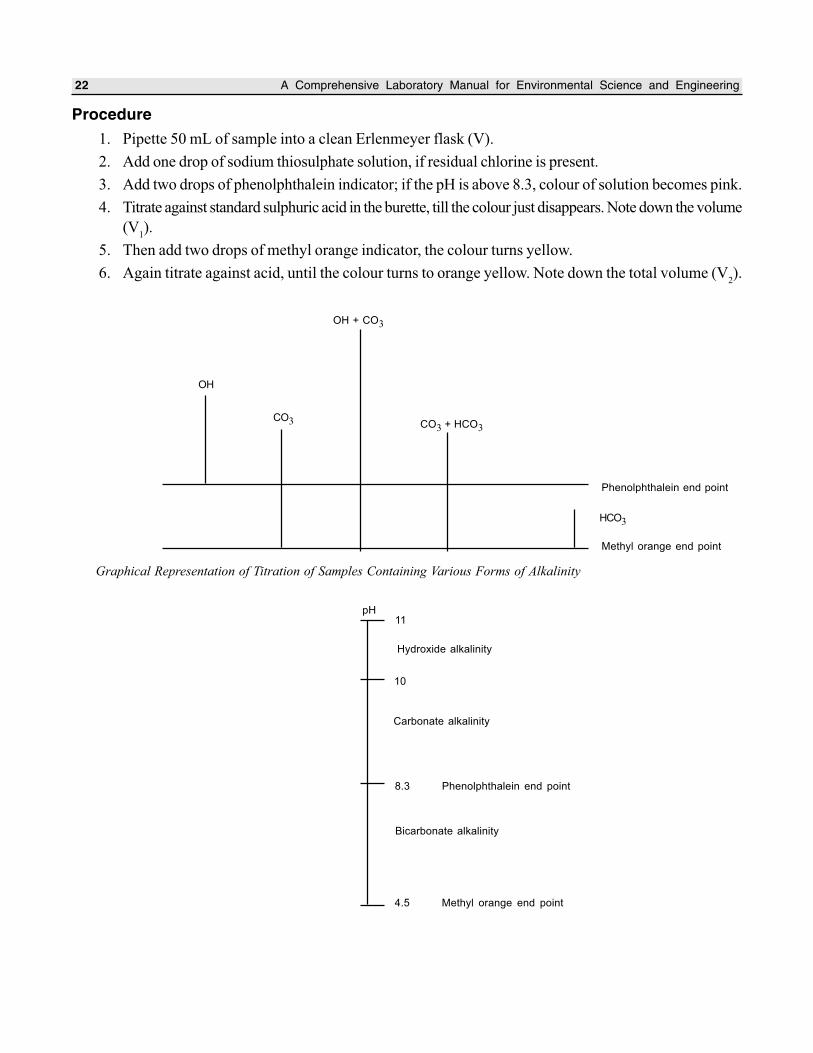
Procedure
1. Pipette 50 mL of sample into a clean Erlenmeyer flask (V).
2. Add one drop of sodium thiosulphate solution, if residual chlorine is present.
3. Add two drops of phenolphthalein indicator; if the pH is above 8.3, colour of solution becomes pink.
4. Titrate against standard sulphuric acid in the burette, till the colour just disappears. Note down the volume
(V1).
5. Then add two drops of methyl orange indicator, the colour turns yellow.
6. Again titrate against acid, until the colour turns to orange yellow. Note down the total volume (V2).
Graphical Representation of Titration of Samples Containing Various Forms of Alkalinity
10
Carbonate alkalinity
Bicarbonate alkalinity
OH + CO3
OH
CO3 CO3 + HCO3
Phenolphthalein end point
Methyl orange end point
HCO3
4.5 Methyl orange end point
8.3 Phenolphthalein end point
pH 11
Hydroxide alkalinity
Determination of Alkalinity 23
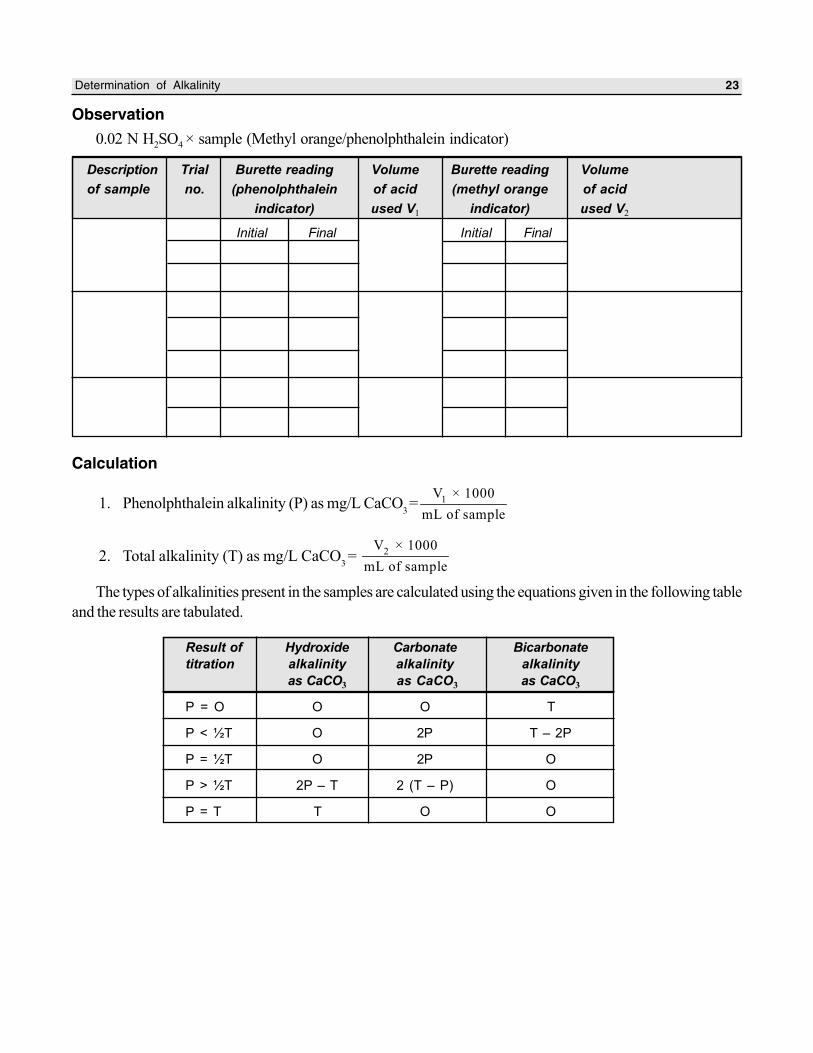
Observation
0.02 N H2SO4 × sample (Methyl orange/phenolphthalein indicator)
Description Trial Burette reading Volume Burette reading Volume
of sample no. (phenolphthalein of acid (methyl orange of acid
indicator) used V1 indicator) used V2
Initial Final Initial Final
Calculation
1. Phenolphthalein alkalinity (P) as mg/L CaCO3 = 1
V × 1000
mL of sample
2. Total alkalinity (T) as mg/L CaCO3 = 2
V × 1000
mL of sample
The types of alkalinities present in the samples are calculated using the equations given in the following table
and the results are tabulated.
Result of Hydroxide Carbonate Bicarbonate
titration alkalinity alkalinity alkalinity
as CaCO3 as CaCO3 as CaCO3
P = O O O T
P < ½T O 2P T – 2P
P = ½T O 2P O
P > ½T 2P – T 2 (T – P) O
P = T T O O
24 A Comprehensive Laboratory Manual for Environmental Science and Engineering
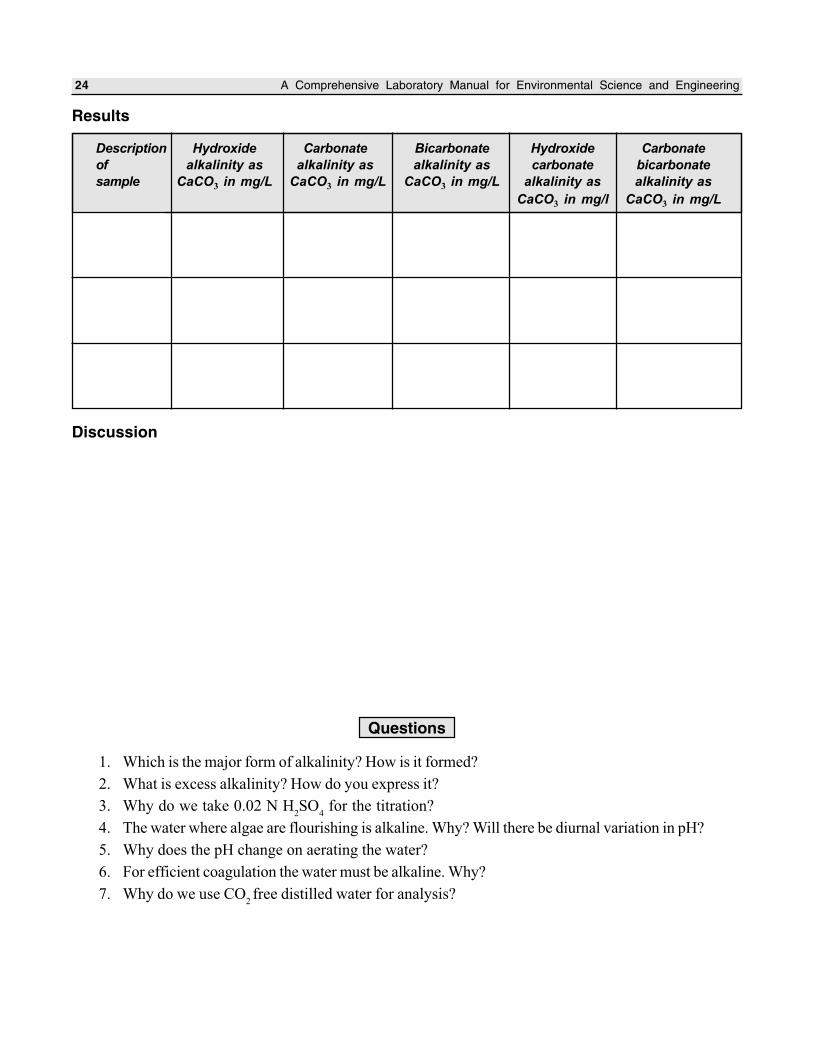
Results
Description Hydroxide Carbonate Bicarbonate Hydroxide Carbonate
of alkalinity as alkalinity as alkalinity as carbonate bicarbonate
sample CaCO3 in mg/L CaCO3 in mg/L CaCO3 in mg/L alkalinity as alkalinity as
CaCO3 in mg/l CaCO3 in mg/L
Discussion
Questions
1. Which is the major form of alkalinity? How is it formed?
2. What is excess alkalinity? How do you express it?
3. Why do we take 0.02 N H2SO
4 for the titration?
4. The water where algae are flourishing is alkaline. Why? Will there be diurnal variation in pH?
5. Why does the pH change on aerating the water?
6. For efficient coagulation the water must be alkaline. Why?
7. Why do we use CO2 free distilled water for analysis?
Aim
To determine the acidity of the given sample of water.
Principle
Acidity of water is its quantitative capacity to neutralise a strong base to a designated pH. Strong minerals acids,
weak acids such as carbonic and acetic and hydrolysing salts such as ferric and aluminium sulphates may contribute
to the measured acidity. According to the method of determination, acidity is important because acid contributes to
corrosiveness and influences certain chemical and biological processes. It is the measure of the amount of base
required to neutralise a given sample to the specific pH.
Hydrogen ions present in a sample as a result of dissociation or hydrolysis of solutes are neutralised by titration
with standard alkali. The acidity thus depends upon the end point pH or indicator used. Dissolved CO2 is usually
the major acidity component of unpolluted surface water. In the sample, containing only carbon dioxide-bicarbonate-
carbonate, titration to pH 8.3 at 25°C corresponds to stoichiometric neutralisation of carbonic acid to carbonate.
Since the colour change of phenolphthalein indicator is close to pH 8.3, this value is accepted as a standard end
point for the titration of total acidity. For more complex mixture or buffered solution fixed end point of pH 3.7 and
pH 8.3 are used. Thus, for standard determination of acidity of wastewater and natural water, methyl orange
acidity (pH 3.7) and phenolphthalein acidity (pH 8.3) are used.
Thus, in determining the acidity of the sample the volumes of standard alkali required to bring about colour
change at pH 8.3 and at pH 3.7 are determined.
Apparatus
1. Burette 2. Pipette
3. Erlenmeyer flasks 4. Indicator solutions
Reagents
1. CO2 free water
2. Standard NaOH solution 0.02 N
DETERMINATION OF ACIDITY OF WATER
Experiment No. ___________________ Date ___________________
118 A Comprehensive Laboratory Manual for Environmental Science and Engineering
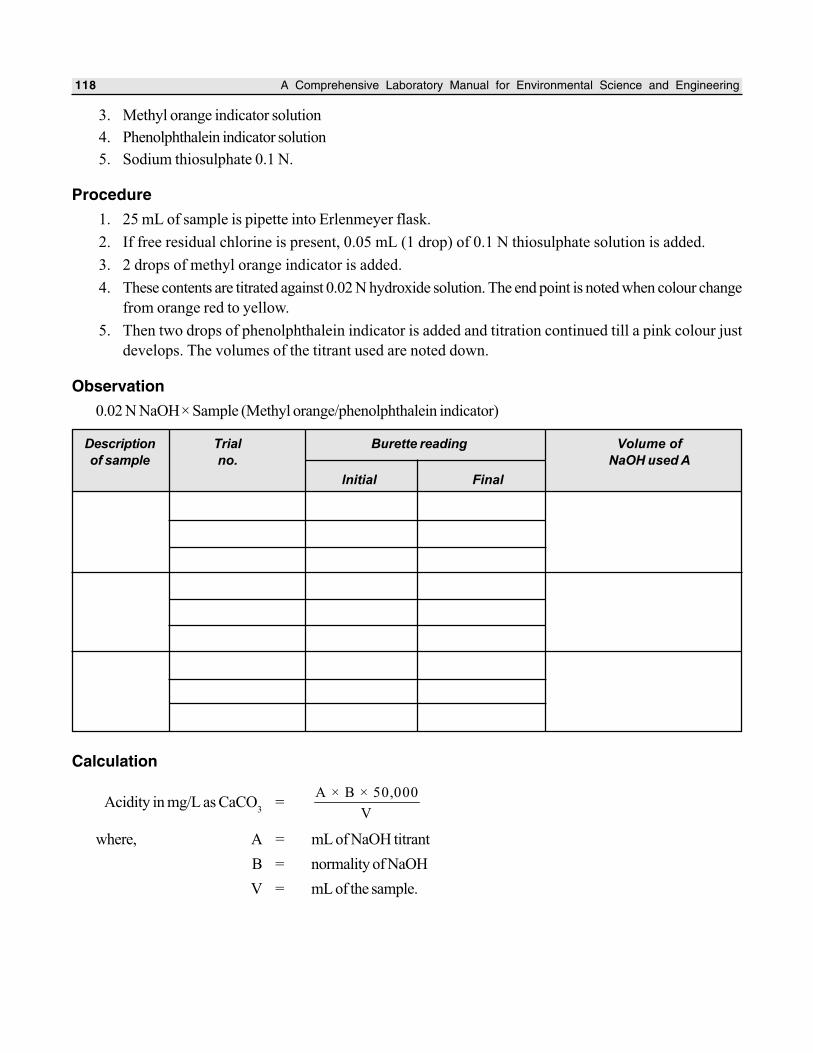
3. Methyl orange indicator solution
4. Phenolphthalein indicator solution
5. Sodium thiosulphate 0.1 N.
Procedure
1. 25 mL of sample is pipette into Erlenmeyer flask.
2. If free residual chlorine is present, 0.05 mL (1 drop) of 0.1 N thiosulphate solution is added.
3. 2 drops of methyl orange indicator is added.
4. These contents are titrated against 0.02 N hydroxide solution. The end point is noted when colour change
from orange red to yellow.
5. Then two drops of phenolphthalein indicator is added and titration continued till a pink colour just
develops. The volumes of the titrant used are noted down.
Observation
0.02 N NaOH × Sample (Methyl orange/phenolphthalein indicator)
Calculation
Acidity in mg/L as CaCO3
=A × B × 50,000
V
where, A = mL of NaOH titrant
B = normality of NaOH
V = mL of the sample.
Description Trial Burette reading Volume of
of sample no. NaOH used A
lnitial Final
Determination of Acidity of Water 119
Results
Discussion
Questions
1. Discuss the source and nature of acidity.
2. Discuss the significance of carbon dioxide and mineral acidity.
3. Can the pH of a water sample be calculated from a knowledge of its acidity? Why?
4. Can the carbon dioxide content of a wastewater sample known to contain significant concentrations
of acetic acid be determined by the titration procedure? Why?
Sample no. Acidity in mg/L as CaCO3
Aim
To determine the amount of chloride (in the form of Cl–) present in the given water sample by Mohr’s method.
Principle
If water containing chlorides is titrated with silver nitrate solution, chlorides are precipitated as white silver chloride.
Potassium chromate is used as indicator, which supplies chromate ions. As the concentration of chloride ions
approaches extinction, silver ion concentration increases to a level at which reddish brown precipitate of silver
chromate is formed indicating the end point.
Apparatus
1. Burette
2. Pipettes
3. Erlenmeyer flasks
4. Measuring cylinder
Reagents
1. Chloride free distilled water.
2. Standard silver nitrate solution (0.0141N)
3. Potassium chromate indicator.
4. Acid or alkali for adjusting pH.
Procedure
1. Take 50mL of sample (V) and dilute to 100mL.
2. If the sample is coloured add 3mL of aluminium hydroxide, shake well; allow to settle, filter, wash and
collect filtrate.
3. Sample is brought to pH 7–8 by adding acid or alkali as required.
4. Add 1mL of indicator (Potassium chromate).
DETERMINATION OF CHLORIDE
Experiment No. ___________________ Date ___________________
36 A Comprehensive Laboratory Manual for Environmental Science and Engineering
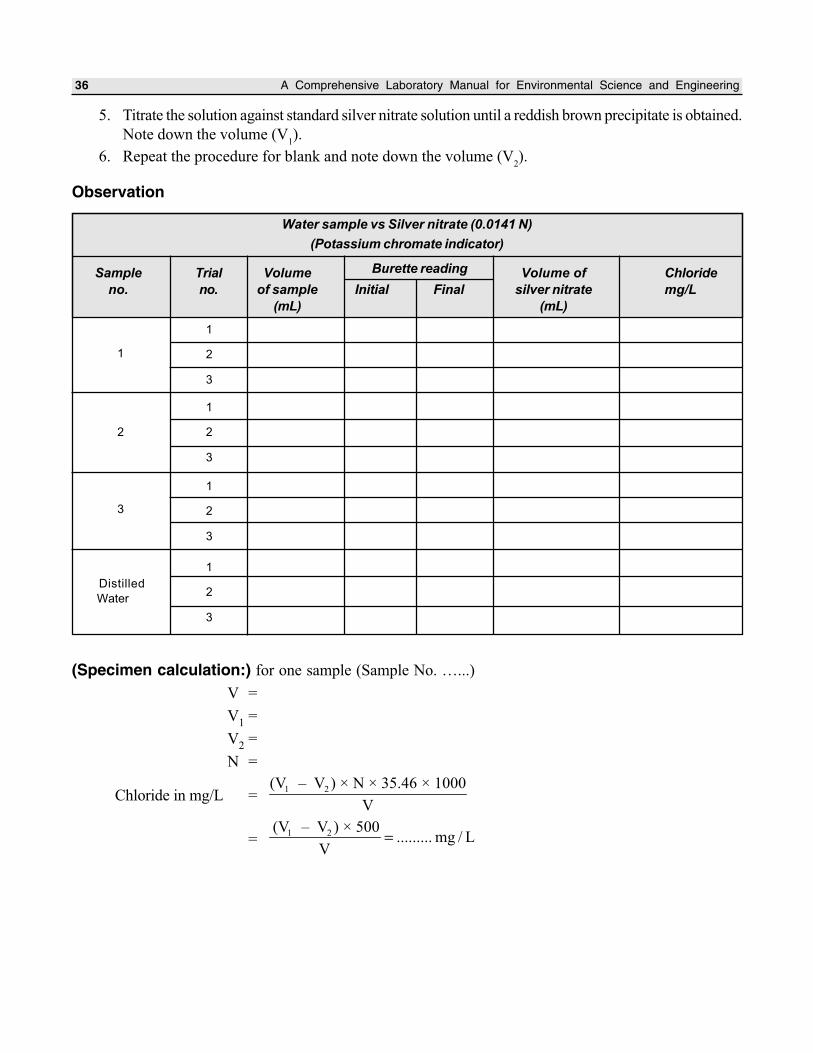
5. Titrate the solution against standard silver nitrate solution until a reddish brown precipitate is obtained.
Note down the volume (V1).
6. Repeat the procedure for blank and note down the volume (V2).
Observation
Water sample vs Silver nitrate (0.0141 N)
(Potassium chromate indicator)
Sample Trial Volume Volume of Chloride
no. no. of sample Initial Final silver nitrate mg/L
(mL) (mL)
(Specimen calculation:) for one sample (Sample No. …...)
V =
V1
=
V2
=
N =
Chloride in mg/L =1 2(V – V ) × N × 35.46 × 1000
V
=1 2(V – V ) × 500
......... mg / LV
=
1
2
3
1
2
3
1
2
3
1
2
3
1
2
3
Distilled
Water
Burette reading
Determination of Chloride 37
Results
Description of sample Chloride concentration in mg/L
Discussion
Questions
1. Explain the significance of high chloride in water.
2. What are the sources of chloride in water?
3. Explain the need for blank correction.
4. Why must be the sample pH neither high nor low?
5. Why the normality of silver nitrate solution is taken as zero?
6. Would the analytical result by Mohr’s method for chlorides be higher, lower, or the same as the true
value if an excess indicator were accidentally added to the sample? Why?
7. What are the methods of determination of chlorides?
8. Why do the water has lower content of salt than sewage?
A. DETERMINATION OF IRON
Aim
To determine the quantity of iron present in the given sample of water.
Principle
Iron is usually present in natural water and is not objectionable, if concentration is less than 0.3 ppm. It may be in
true solution in colloidal state that may be peptized by organic matter, in the inorganic and organic iron complexes,
or in relatively coarse suspended particles. It may be either ferrous or ferric, suspended or filterable. Iron exists in
soils and minerals mainly as insoluble ferric oxide and iron sulphide (pyrite). It occurs in some areas, also as ferrous
carbonate (siderite), which is very slightly soluble.
The phenanthroline method is the preferred standard procedure for the measurement of iron in water except
when phosphate or heavy metal interferences are present. The method depends upon the fact that 1,
10-phenanthroline combine with Fe++ to form an orange-red complex. Its colour conforms to Beer’s law and is
readily measured by visual or photometric comparison. Small concentration of iron can be most satisfactorily
determined by colorimetric analysis. It is also based on Beer’s law. By measuring the intensities of transmitted and
incident light through a coloured solution and knowing its optical density or transmission, we can prepare a calibration
curve and subsequent concentration can be read.
Phenanthroline Method
Apparatus
1. Colorimetric equipment; one of the following is required:
(a) Spectrophotometer, for use at 510 nm, providing a light path of 1 cm or longer.
(b) Nessler tubes, matched, 100 mL, tall form.
2. Glassware like conical flasks, pipettes and glass beads.
DETERMINATION OF IRON AND MANGANESE
Experiment No. ___________________ Date ___________________
40 A Comprehensive Laboratory Manual for Environmental Science and Engineering
Reagents
1. Hydrochloric acid 2. Hydroxylamine solution
3. Ammonium acetate buffer solution 4. Sodium acetate solution
5. Phenanthroline solution 6. Stock iron solution
7. Standard iron solution (1 mL = 10 µg Fe)
Procedure
1. Pipette 10, 20, 30 and 50 mL. Standard iron solution into 100 mL conical flasks.
2. Add 1 mL hydroxylamine solution and 1 mL sodium acetate solution to each flask.
3. Dilute each to about 75 mL with distilled water.
4. Add 10 mL phenanthroline solution to each flask.
5. Make up the contents of each flask exactly to 100mL by adding distilled water and left stand for 10
minutes.
6. Take 50 mL distilled water in another conical flask.
7. Repeat steps 2 to 5 described above.
8. Measure the absorbance of each solution in a spectrophotometer at 508 nm against the reference blank
prepared by treating distilled water as described in steps 6 and 7. Prepare a calibration graph taking
meter reading on y-axis and concentration of iron on x-axis.
9. For visual comparison, pour the solution in 100 mL tall form Nessler tubes and keep them in a stand.
10. Mix the sample thoroughly and measure 50 mL into a conical flask.
11. Add 2 mL conc. hydrochloric acid (HCl) and 1mL hydroxylamine solution. Add a few glass beads and
heat to boiling. To ensure dissolution of all the iron, continue boiling until the volume is reduced to 15
to 20 mL.
12. Cool the flask to room temperature and transfer the solution to a 100 mL Nessler tube.
13. Add 10 mL ammonium acetate buffer solution and 2 mL phenanthroline solution and dilute to the 100
mL mark with distilled water.
14. Mix thoroughly and allow at least 10 to 15 minutes for maximum colour development.
15. Measure the absorbance of the solution in a 1cm cell in a spectrophotometer at 508 nm.
16. Read off the conc. of iron (mg Fe) from the calibration graph for the corresponding meter reading.
17. For visual comparison, match the colour of the sample with that of the standard prepared in steps 1
to 7 above.
18. The matching colour standard will give the concentration of iron in the sample (µg Fe).
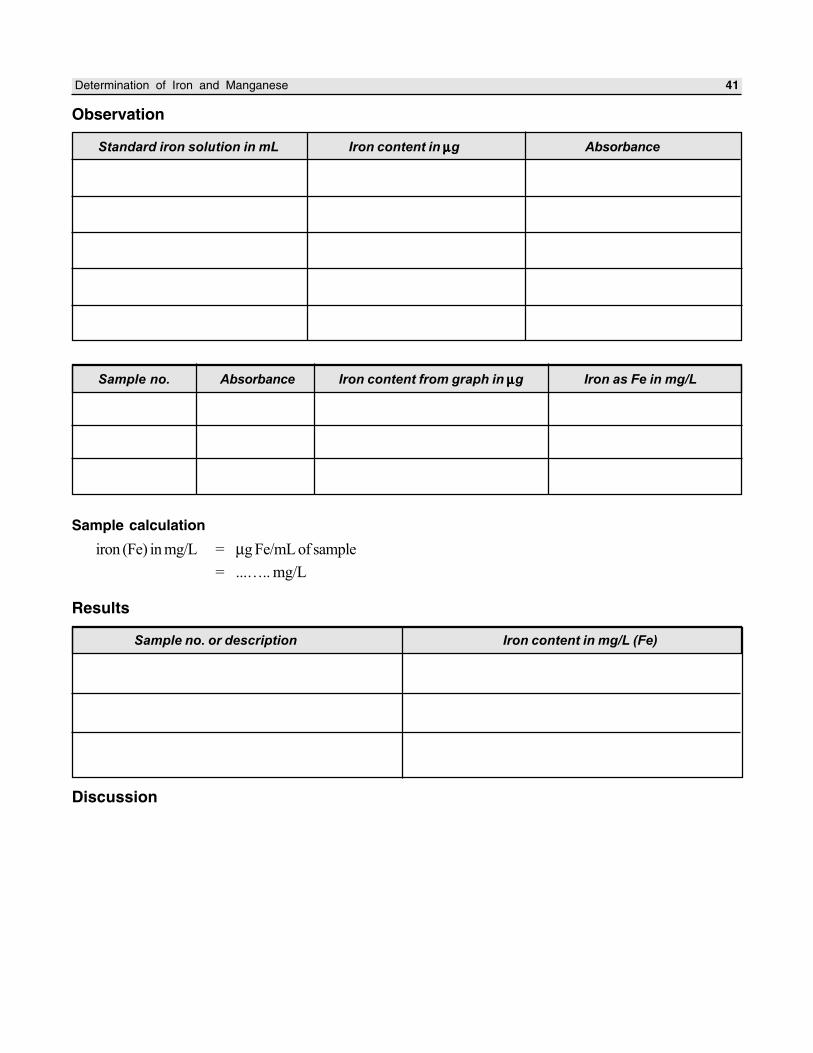
Determination of Iron and Manganese 41
Observation
Standard iron solution in mL Iron content in µµµµµg Absorbance
Sample calculation
iron (Fe) in mg/L = µg Fe/mL of sample
= ...….. mg/L
Results
Sample no. or description Iron content in mg/L (Fe)
Discussion
Sample no. Absorbance Iron content from graph in µµµµµg Iron as Fe in mg/L
42 A Comprehensive Laboratory Manual for Environmental Science and Engineering
B. DETERMINATION OF MANGANESE
Aim
To determine the quantity of manganese present in the given sample.
Principle
Manganese exists in the soil principally as manganese dioxide, which is very insoluble in water containing carbon
dioxide. Under anaerobic conditions, the manganese in the dioxide form is reduced from an oxidation state of IV
to II and solution occurs. The manganese in ground water is of divalent form. It may be present in trivalent or
quadrivalent form also.
The concentration of manganese seldom exceeds a few mg/L. So colorimetric methods are applicable. The
methods are (1) persulphate method, and (2) periodate method. Both methods depend upon oxidation of manganese
from its lower oxidation state to VII where it forms the highly coloured permanganate ion. The colour produced is
directly proportional to the concentration of manganese present over a considerable range of concentration in
accordance with Beer’s law. So it can be measured by eye or photometric means. Provisions must be made to
overcome the influence of chlorides. Manganese can also be determined by atomic absorption spectrophotometry.
Persulphate method is suitable because pretreatment of samples is not required. Chloride concentration is reduced
by using mercuric sulphate. Persulphate oxidises manganese to permanganate in the presence of silver nitrate as
catalyst. The colour intensity is observed at a wavelength of 525 nm in a spectrophotometer.
Periodate method is used when concentrations are below 0.1 mg/L. To obtain complete oxidation of small
amounts of manganese, silver nitrate is added and the heating time is increased.
Apparatus
1. Colorimetric equipment: one of the following is required:
(a) Spectrophotometer, for use at 252 nm, providing a light path of 1 cm or longer.
(b) Nessler tubes, matcheds, 100 mL tall form.
2. Glassware like conical flasks, measuring cylinder and pipette.
Reagents
1. Special reagent 2. Ammonium persulphate
3. Standard manganese solution 4. Hydrogen peroxide 30%.
Procedure
1. Take 50 mL of the sample in a conical flask. Add 50 mL distilled water to it.
2. Pipette 1, 2, 3, 4, and 8 mL of standard manganese solution to different flasks, and dilute each to
100 mL using distilled water.
3. Add 5 mL special reagent to all the flasks.
4. Concentrate the solutions in all the flasks to about 90 mL boiling.
5. Add 1g ammonium persulphate to all the flasks, bring to boiling and boil for 1 minute.
6. Remove all the flasks from the heat source and let stand for 1 minute.
Determination of Iron and Manganese 43
7. Then cool the flasks under the tap water.
8. Dilute the contents in all the flasks to 100 mL with distilled water and mix. Pour the contents into 100 mL
Nessler tubes.
9. Match the colour of the sample with that of the colour standards. Note down the concentration of Mn
in µg.
10. If the spectrophotometer is used, one distilled water blank has to be prepared along with the colour
standards.
11. Measure the absorbance of each solution in a 1cm cell at 525 nm against the reference blank prepared
by treating distilled water.
12. Prepare the calibration graph taking meter reading along y-axis and concentration of manganese (in µg)
in colour standards on x-axis.
13. Keep the sample in the spectrophotometer and note down the meter reading.
14. Read off from the graph, the corresponding concentration of manganese in µg.
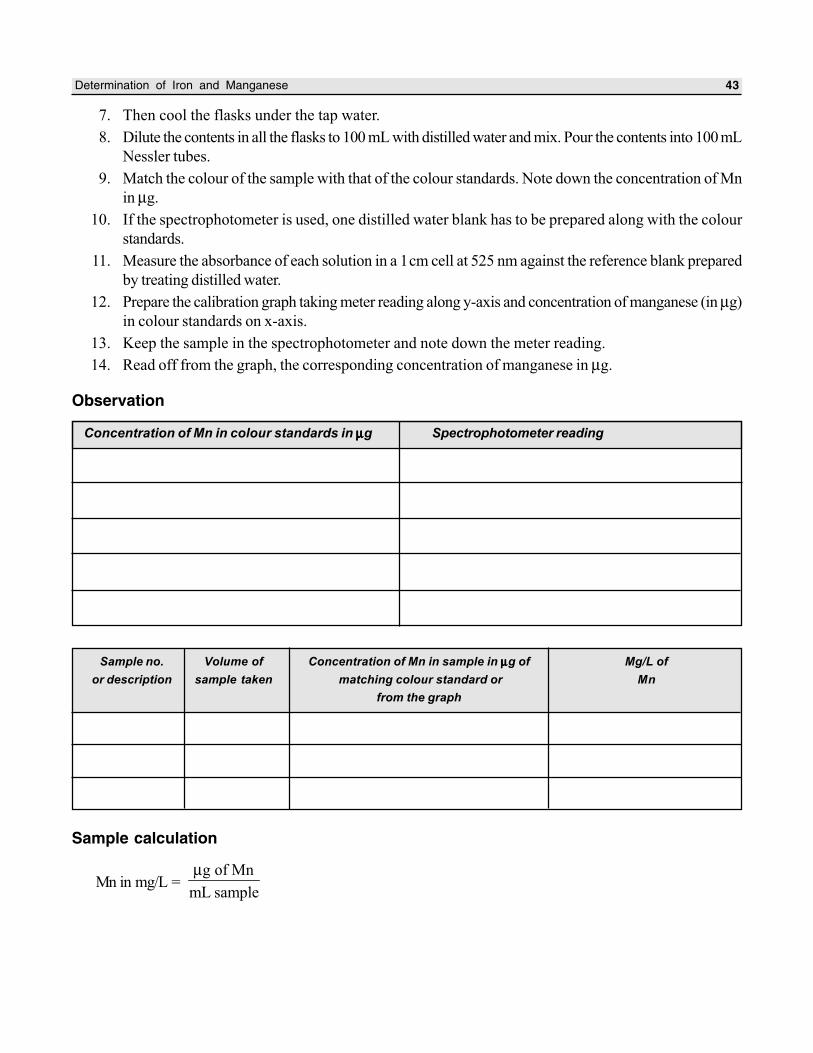
Observation
Concentration of Mn in colour standards in µµµµµg Spectrophotometer reading
Sample calculation
Mn in mg/L =g of Mn
mL sample
µ
Sample no. Volume of Concentration of Mn in sample in µµµµµg of Mg/L of
or description sample taken matching colour standard or Mn
from the graph
44 A Comprehensive Laboratory Manual for Environmental Science and Engineering
Results
Discussion
Sample no. or description Concentration of Mn in mg/L
Questions
1. How are the iron and manganese removed from water?
2. Explain the significance of Fe and Mn in environmental engineering.
3. In what oxidation state must the manganese be for colorimetric measurement?
Aim
The aim of the experiment is to determine the quantity of dissolved oxygen present in the given sample(s) by using
modified Winkler’s (Azide modification) method.
Principle
Dissolved Oxygen (D.O.) levels in natural and wastewaters are dependent on the physical, chemical and biochemical
activities prevailing in the water body. The analysis of D.O. is a key test in water pollution control activities and
waste treatment process control.
Improved by various techniques and equipment and aided by instrumentation, the Winkler
(or iodometric) test remains the most precise and reliable titrimetric procedure for D.O. analysis. The test is based
on the addition of divalent manganese solution, followed by strong alkali to the water sample in a glass-stoppered
bottle. D.O. present in the sample rapidly oxidises in equivalent amount of the dispersed divalent manganous
hydroxide precipitate to hydroxides of higher valency states. In the presence of iodide ions and upon acidification,
the oxidised manganese reverts to the divalent state, with the liberation of iodine equivalent to the original D.O.
content in the sample. The iodine is then titrated with a standard solution of thiosulphate.
Apparatus
1. 300 mL capacity bottle with stopper
2. Burette
3. Pipettes, etc.
Reagents
1. Manganous sulphate solution (MnSO4.4H
2O)
2. Alkali-iodide azide reagent
3. Conc. sulphuric acid (36 N)
4. Starch indicator
5. Standard sodium thiosulphate solution (0.025N)
6. Standard potassium dichromate solution (0.025N)
DETERMINATION OF DISSOLVED OXYGEN
Experiment No. ___________________ Date ___________________
60 A Comprehensive Laboratory Manual for Environmental Science and Engineering
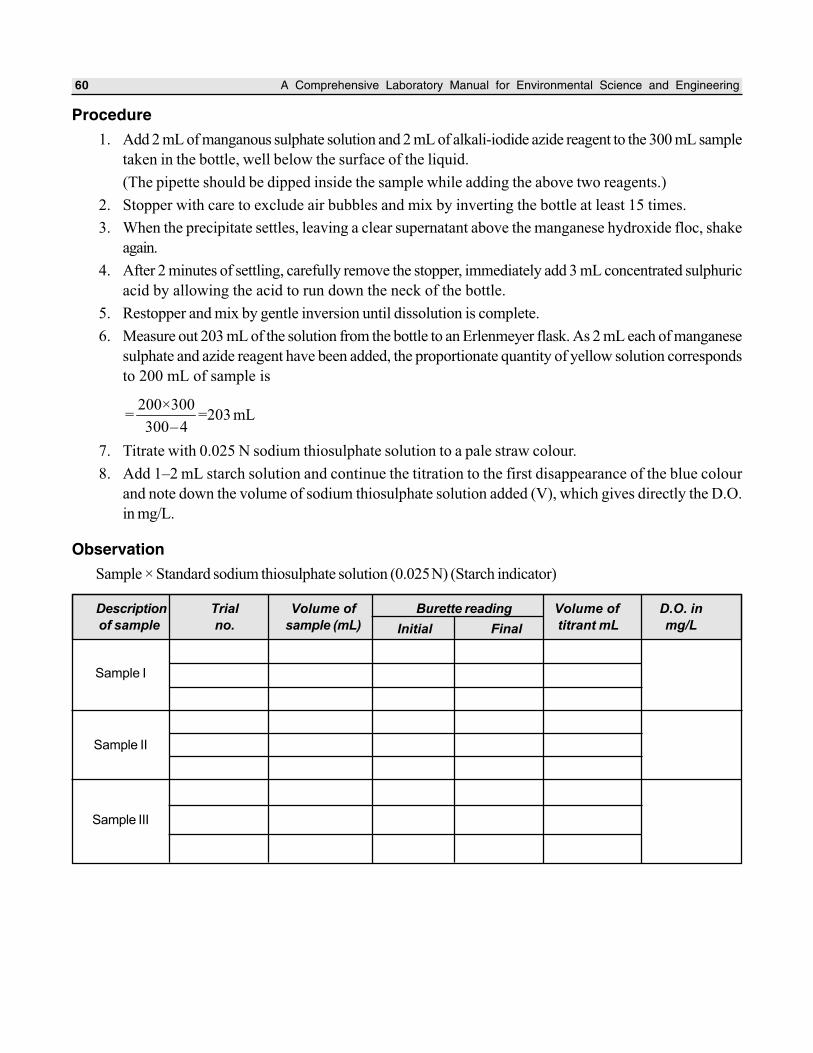
Procedure
1. Add 2 mL of manganous sulphate solution and 2 mL of alkali-iodide azide reagent to the 300 mL sample
taken in the bottle, well below the surface of the liquid.
(The pipette should be dipped inside the sample while adding the above two reagents.)
2. Stopper with care to exclude air bubbles and mix by inverting the bottle at least 15 times.
3. When the precipitate settles, leaving a clear supernatant above the manganese hydroxide floc, shake
again.
4. After 2 minutes of settling, carefully remove the stopper, immediately add 3 mL concentrated sulphuric
acid by allowing the acid to run down the neck of the bottle.
5. Restopper and mix by gentle inversion until dissolution is complete.
6. Measure out 203 mL of the solution from the bottle to an Erlenmeyer flask. As 2 mL each of manganese
sulphate and azide reagent have been added, the proportionate quantity of yellow solution corresponds
to 200 mL of sample is
200×300= =203 mL
300–4
7. Titrate with 0.025 N sodium thiosulphate solution to a pale straw colour.
8. Add 1–2 mL starch solution and continue the titration to the first disappearance of the blue colour
and note down the volume of sodium thiosulphate solution added (V), which gives directly the D.O.
in mg/L.
Observation
Sample × Standard sodium thiosulphate solution (0.025N) (Starch indicator)
Description Trial Volume of Burette reading Volume of D.O. in
of sample no. sample (mL) titrant mL mg/LInitial Final
Sample I
Sample II
Sample III
Determination of Dissolved Oxygen 61
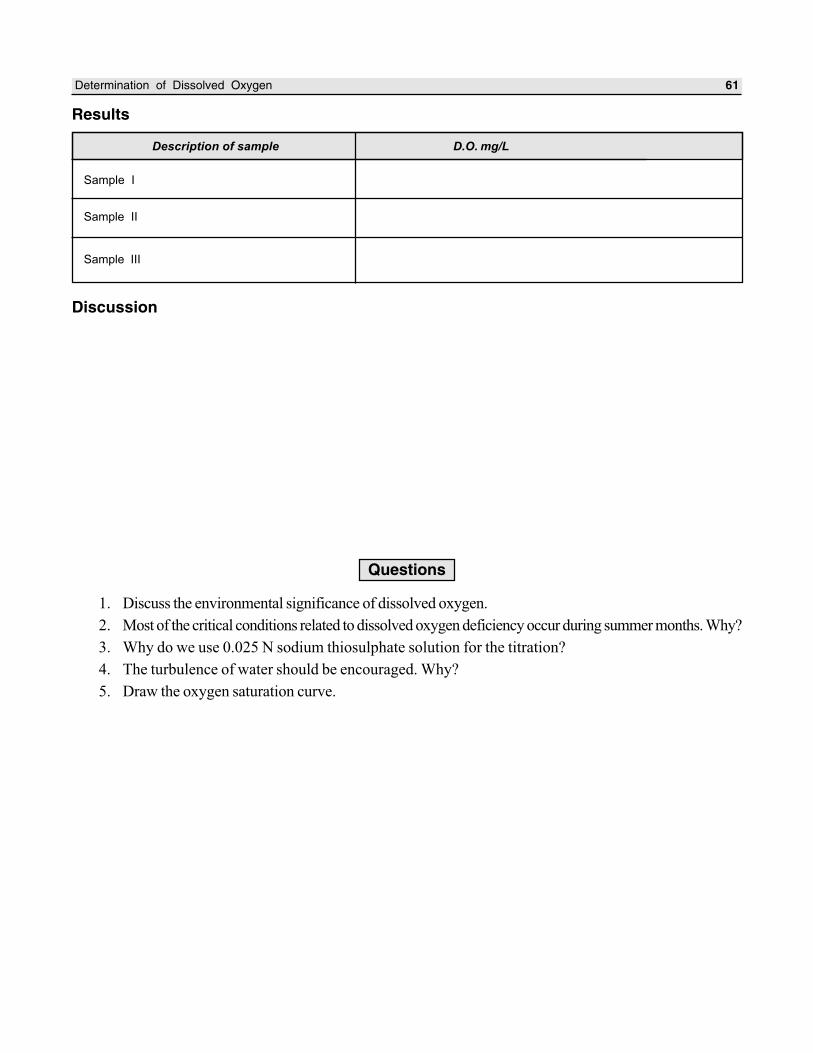
Results
Discussion
Questions
1. Discuss the environmental significance of dissolved oxygen.
2. Most of the critical conditions related to dissolved oxygen deficiency occur during summer months. Why?
3. Why do we use 0.025 N sodium thiosulphate solution for the titration?
4. The turbulence of water should be encouraged. Why?
5. Draw the oxygen saturation curve.
Description of sample D.O. mg/L
Sample I
Sample II
Sample III
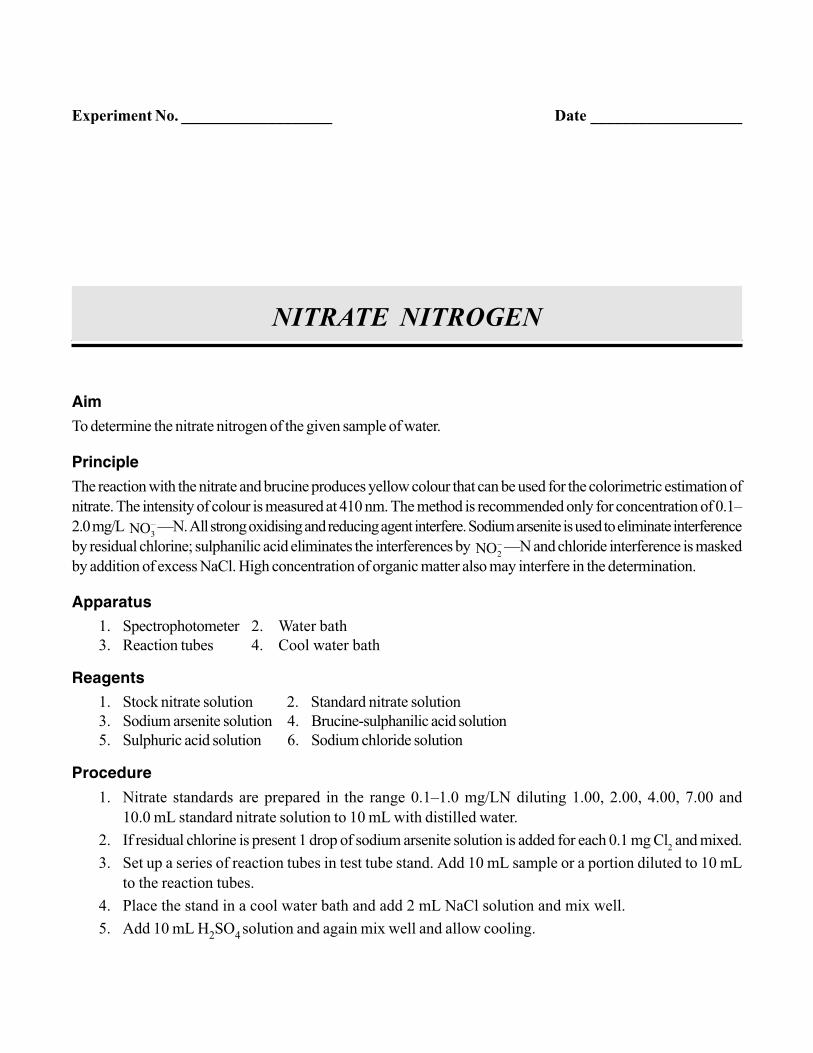
Aim
To determine the nitrate nitrogen of the given sample of water.
Principle
The reaction with the nitrate and brucine produces yellow colour that can be used for the colorimetric estimation of
nitrate. The intensity of colour is measured at 410 nm. The method is recommended only for concentration of 0.1–
2.0 mg/L –
3NO —N. All strong oxidising and reducing agent interfere. Sodium arsenite is used to eliminate interference
by residual chlorine; sulphanilic acid eliminates the interferences by –
2NO —N and chloride interference is masked
by addition of excess NaCl. High concentration of organic matter also may interfere in the determination.
Apparatus
1. Spectrophotometer 2. Water bath
3. Reaction tubes 4. Cool water bath
Reagents
1. Stock nitrate solution 2. Standard nitrate solution
3. Sodium arsenite solution 4. Brucine-sulphanilic acid solution
5. Sulphuric acid solution 6. Sodium chloride solution
Procedure
1. Nitrate standards are prepared in the range 0.1–1.0 mg/LN diluting 1.00, 2.00, 4.00, 7.00 and
10.0 mL standard nitrate solution to 10 mL with distilled water.
2. If residual chlorine is present 1 drop of sodium arsenite solution is added for each 0.1 mg Cl2 and mixed.
3. Set up a series of reaction tubes in test tube stand. Add 10 mL sample or a portion diluted to 10 mL
to the reaction tubes.
4. Place the stand in a cool water bath and add 2 mL NaCl solution and mix well.
5. Add 10 mL H2SO
4 solution and again mix well and allow cooling.
NITRATE NITROGEN
Experiment No. ___________________ Date ___________________
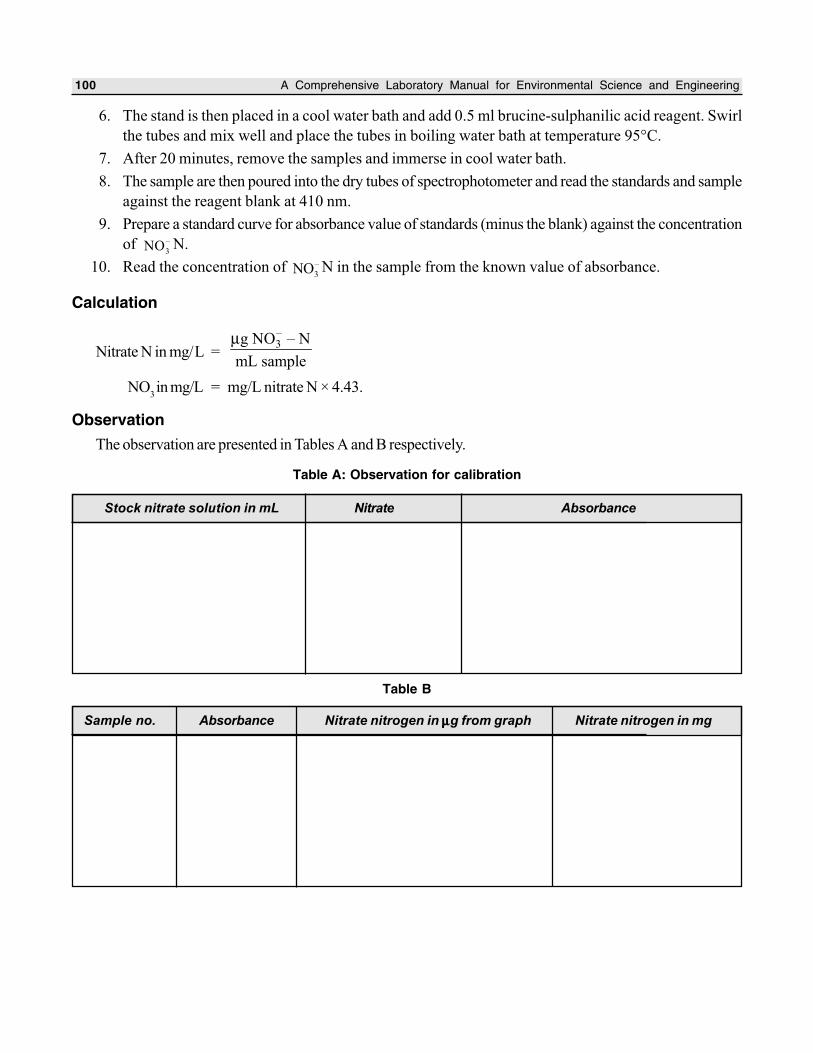
100 A Comprehensive Laboratory Manual for Environmental Science and Engineering
6. The stand is then placed in a cool water bath and add 0.5 ml brucine-sulphanilic acid reagent. Swirl
the tubes and mix well and place the tubes in boiling water bath at temperature 95°C.
7. After 20 minutes, remove the samples and immerse in cool water bath.
8. The sample are then poured into the dry tubes of spectrophotometer and read the standards and sample
against the reagent blank at 410 nm.
9. Prepare a standard curve for absorbance value of standards (minus the blank) against the concentration
of –
3NO N.
10. Read the concentration of –
3NO N in the sample from the known value of absorbance.
Calculation
Nitrate N in mg/L =
–3g NO – N
mL sample
µ
NO3 in mg/L = mg/L nitrate N × 4.43.
Observation
The observation are presented in Tables A and B respectively.
Table A: Observation for calibration
Table B
Stock nitrate solution in mL Nitrate Absorbance
Sample no. Absorbance Nitrate nitrogen in µµµµµg from graph Nitrate nitrogen in mg
Nitrate Nitrogen 101
Results
Discussion
Questions
1. In what forms does nitrogen normally occur in natural waters?
2. Discuss the significance of nitrate nitrogen analysis in water pollution control.
3. Differentiate between nitrite nitrogen and nitrate nitrogen.
4. Discuss the application of nitrate nitrogen data.
5. What are the various methods available for the determination of nitrate nitrogen?
Sample no. or description Nitrate nitrogen in mg/L
Aim
To determine the optimum coagulant dosage for clarifying the given sample of water by using alum as the coagulant
and performing the jar test experiment.
Principle
Coagulants are used in water treatment plants
(i) to remove natural suspended and colloidal matter,
(ii) to remove material which do not settle in plain sedimentation, and
(iii) to assist in filtration.
Alum [Al2(SO
4)3. 18H
2O] is the most widely used coagulant. When alum solution is added to water, the
molecules dissociate to yield 2–
4SO and Al3+. The +ve species combine with negatively charged colloidal to neutralise
part of the charge on the colloidal particle. Thus, agglomeration takes place. Coagulation is a quite complex
phenomenon and the coagulant should be distributed uniformly throughout the solution. A flash mix accomplishes
this.
Jar test is simple device used to determine this optimum coagulant dose required. The jar test, device consists
of a number of stirrers (4 to 6) provided with paddles. The paddles can be rotated with varying speed with the help
of a motor and regulator. Samples will be taken in jars or beakers and varying dose of coagulant will be added
simultaneously to all the jars. The paddles will be rotated at 100 rpm for 1 minute and at 40 rpm for 20 to 30
minutes, corresponding to the flash mixing and slow mixing in the flocculator of the treatment plant. After 30
minutes settling, supernatant will be taken carefully from all the jars to measure turbidity. The dose, which gives the
least turbidity, is taken as the optimum coagulant dose.
Apparatus
1. Jar test apparatus 2. Glass beakers
3. Pipette 4. Nephelometer
5. pH meter
JAR TEST FOR DETERMINING OPTIMUM
COAGULANT DOSAGE
Experiment No. ___________________ Date ___________________
56 A Comprehensive Laboratory Manual for Environmental Science and Engineering
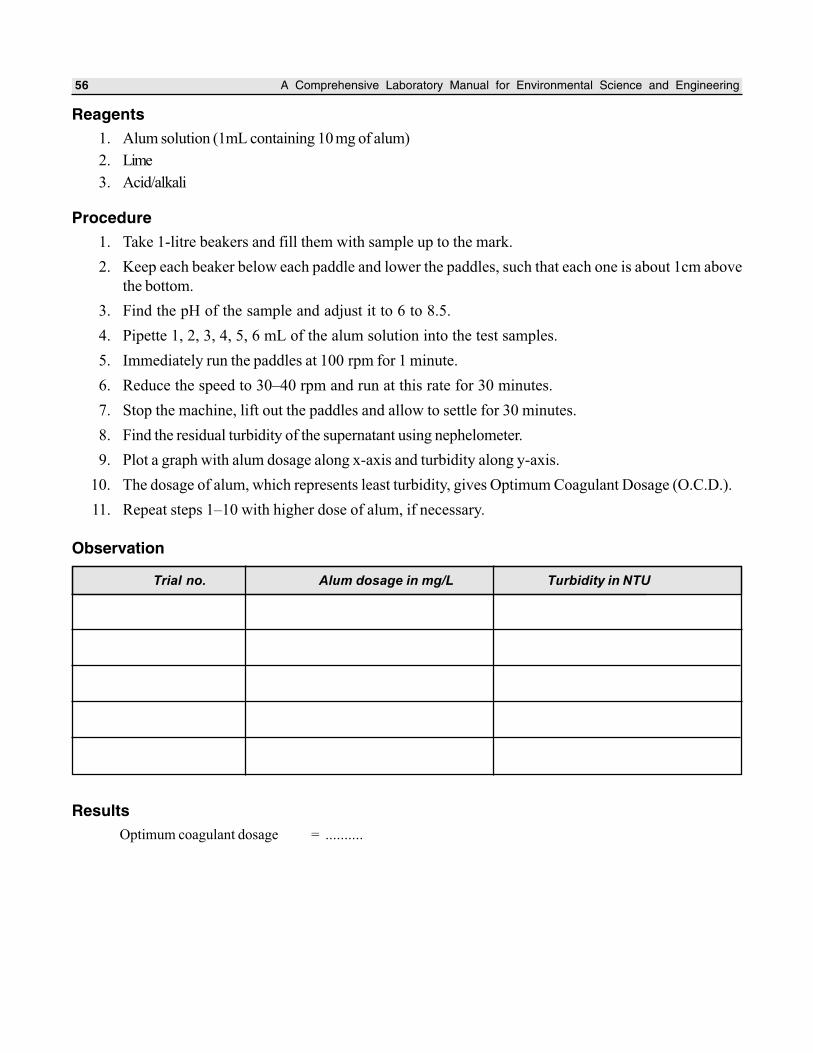
Reagents
1. Alum solution (1mL containing 10 mg of alum)
2. Lime
3. Acid/alkali
Procedure
1. Take 1-litre beakers and fill them with sample up to the mark.
2. Keep each beaker below each paddle and lower the paddles, such that each one is about 1cm above
the bottom.
3. Find the pH of the sample and adjust it to 6 to 8.5.
4. Pipette 1, 2, 3, 4, 5, 6 mL of the alum solution into the test samples.
5. Immediately run the paddles at 100 rpm for 1 minute.
6. Reduce the speed to 30–40 rpm and run at this rate for 30 minutes.
7. Stop the machine, lift out the paddles and allow to settle for 30 minutes.
8. Find the residual turbidity of the supernatant using nephelometer.
9. Plot a graph with alum dosage along x-axis and turbidity along y-axis.
10. The dosage of alum, which represents least turbidity, gives Optimum Coagulant Dosage (O.C.D.).
11. Repeat steps 1–10 with higher dose of alum, if necessary.
Observation
Trial no. Alum dosage in mg/L Turbidity in NTU
Results
Optimum coagulant dosage = ..........
Jar Test for Determining Optimum Coagulant Dosage 57
Discussion
Questions
1. Why is alum preferred to other coagulants?
2. What is the difference between coagulation and flocculation?
3. What are coagulant aids?
4. Write the significance of pH in coagulation using alum.
5. What factors affect the sedimentation of a discrete particle setting in a quiescent liquid?
Aim
To determine the amount of B.O.D. exerted by the given sample(s).
Principle
The Biochemical Oxygen Demand (B.O.D.) of sewage or of polluted water is the amount of oxygen required for
the biological decomposition of dissolved organic matter to occur under aerobic condition and at the standardised
time and temperature. Usually, the time is taken as 5 days and the temperature 20°C as per the global standard.
The B.O.D. test is among the most important method in sanitary analysis to determine the polluting power, or
strength of sewage, industrial wastes or polluted water. It serves as a measure of the amount of clean diluting water
required for the successful disposal of sewage by dilution. The test has its widest application in measuring waste
loading to treatment plants and in evaluating the efficiency of such treatment systems.
The test consists in taking the given sample in suitable concentrations in dilute water in B.O.D. bottles. Two
bottles are taken for each concentration and three concentrations are used for each sample. One set of bottles is
incubated in a B.O.D. incubator for 5 days at 20°C; the dissolved oxygen (initial) content (D1) in the other set of
bottles will be determined immediately. At the end of 5 days, the dissolved oxygen content (D2) in the incubated set
of bottles is determined.
Then, mg/L B.O.D. = 1 2(D – D )
P
where, P = decimal fraction of sample used.
D1
= dissolved oxygen of diluted sample (mg/L), immediately after preparation.
D2
= dissolved oxygen of diluted sample (mg/L), at the end of 5 days incubation.
Among the three values of B.O.D. obtained for a sample select that dilution showing the residual dissolved
oxygen of at least 1 mg/L and a depletion of at least 2 mg/L. If two or more dilutions are showing the same
condition then select the B.O.D. value obtained by that dilution in which the maximum dissolved oxygen depletion
is obtained.
DETERMINATION OF B.O.D. OF
WASTEWATER SAMPLE
Experiment No. ___________________ Date ___________________
64 A Comprehensive Laboratory Manual for Environmental Science and Engineering
Apparatus
1. B.O.D. bottles 300mL capacity
2. B.O.D. incubator
3. Burette
4. Pipette
5. Air compressor
6. Measuring cylinder etc.
Reagents
1. Distilled water
2. Phosphate buffer solution
3. Magnesium sulphate solution
4. Calcium chloride solution
5. Ferric chloride solution
6. Acid and alkali solution
7. Seeding
8. Sodium sulphite solution
9. Reagents required for the determination of D.O.
Procedure
1. Place the desired volume of distilled water in a 5 litre flask (usually about 3 litres of distilled water will
be needed for each sample).
2. Add 1mL each of phosphate buffer, magnesium sulphate solution, calcium chloride solution and ferric
chloride solution for every litre of distilled water.
3. Seed the sample with 1–2 mL of settled domestic sewage.
4. Saturate the dilution water in the flask by aerating with a supply of clean compressed air for at least
30 minutes.
5. Highly alkaline or acidic samples should be neutralised to pH 7.
6. Destroy the chlorine residual in the sample by keeping the sample exposed to air for
1 to 2 hours or by adding a few mL of sodium sulphite solution.
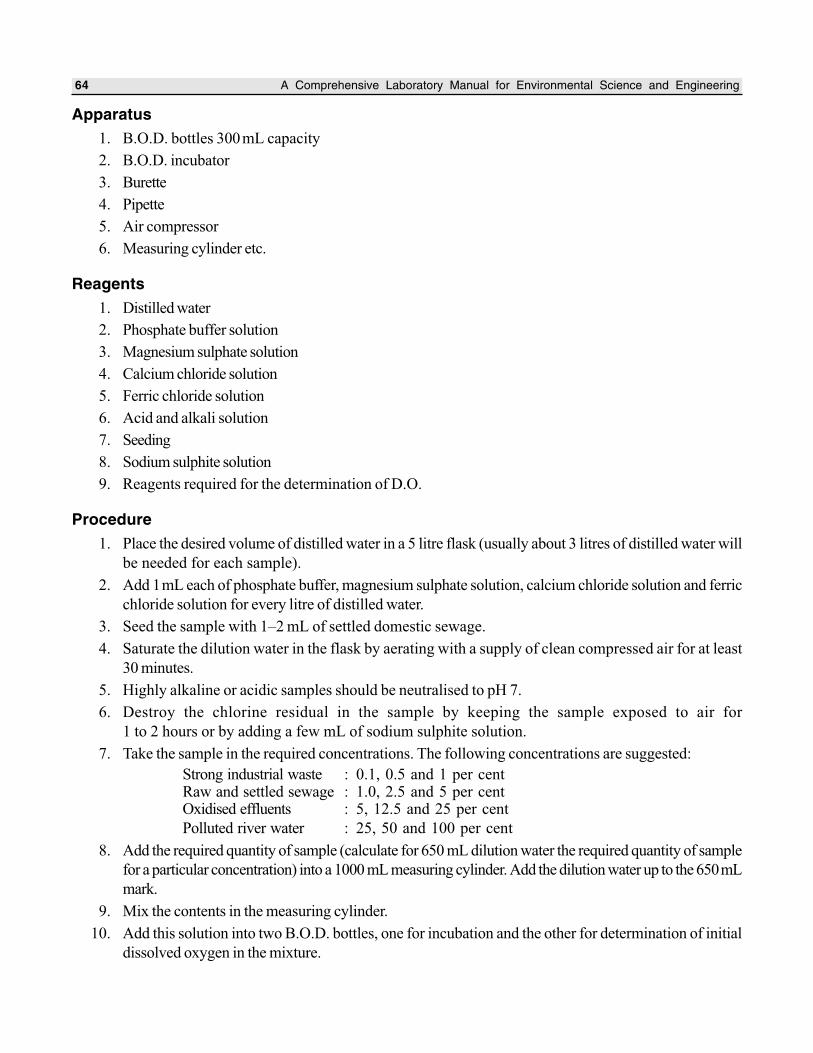
7. Take the sample in the required concentrations. The following concentrations are suggested:
Strong industrial waste : 0.1, 0.5 and 1 per centRaw and settled sewage : 1.0, 2.5 and 5 per centOxidised effluents : 5, 12.5 and 25 per cent
Polluted river water : 25, 50 and 100 per cent
8. Add the required quantity of sample (calculate for 650 mL dilution water the required quantity of sample
for a particular concentration) into a 1000 mL measuring cylinder. Add the dilution water up to the 650mL
mark.
9. Mix the contents in the measuring cylinder.
10. Add this solution into two B.O.D. bottles, one for incubation and the other for determination of initial
dissolved oxygen in the mixture.
Determination of B.O.D. of Wastewater Sample 65
11. Prepare in the same manner for other concentrations and for all the other samples.
12. Lastly fill the dilution water alone into two B.O.D. bottles. Keep one for incubation and the other for
determination of initial dissolved oxygen.
13. Place the set of bottles to be incubated in a B.O.D. incubator for 5 days at 20°C. Care should be
taken to maintain the water seal over the bottles throughout the period of incubation.
14. Determine the initial dissolved oxygen contents in the other set of bottles and note down the results.
15. Determine the dissolved oxygen content in the incubated bottles at the end of
5 days and note down the results.
16. Calculate the B.O.D. of the given sample.
Note: The procedure for determining the dissolved oxygen content is same as described in the experiment under “Determination
of dissolved oxygen”.
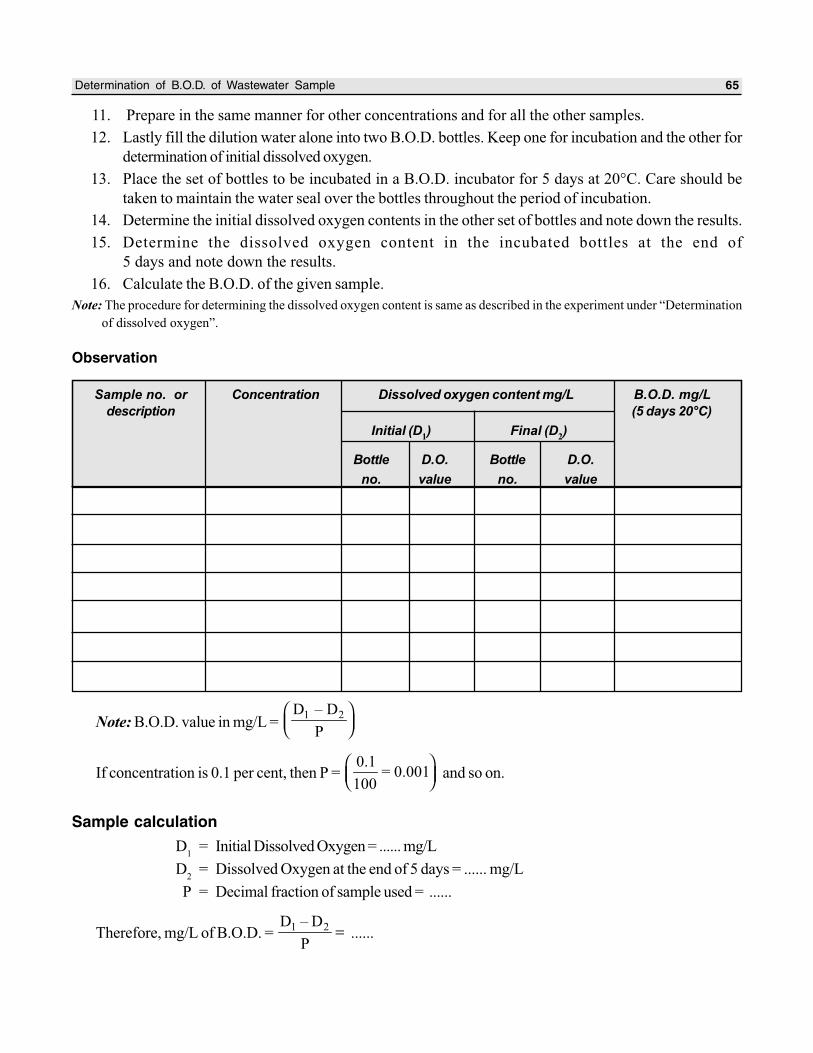
Observation
Note: B.O.D. value in mg/L = 1 2D – D
P
If concentration is 0.1 per cent, then P = 0.1
= 0.001100
and so on.
Sample calculation
D1
= Initial Dissolved Oxygen = ...... mg/L
D2
= Dissolved Oxygen at the end of 5 days = ...... mg/L
P = Decimal fraction of sample used = ......
Therefore, mg/L of B.O.D. = 1 2D – D
P= ......
Sample no. or Concentration Dissolved oxygen content mg/L B.O.D. mg/L
description (5 days 20°C)
Initial (D1) Final (D
2)
Bottle D.O. Bottle D.O.
no. value no. value
66 A Comprehensive Laboratory Manual for Environmental Science and Engineering
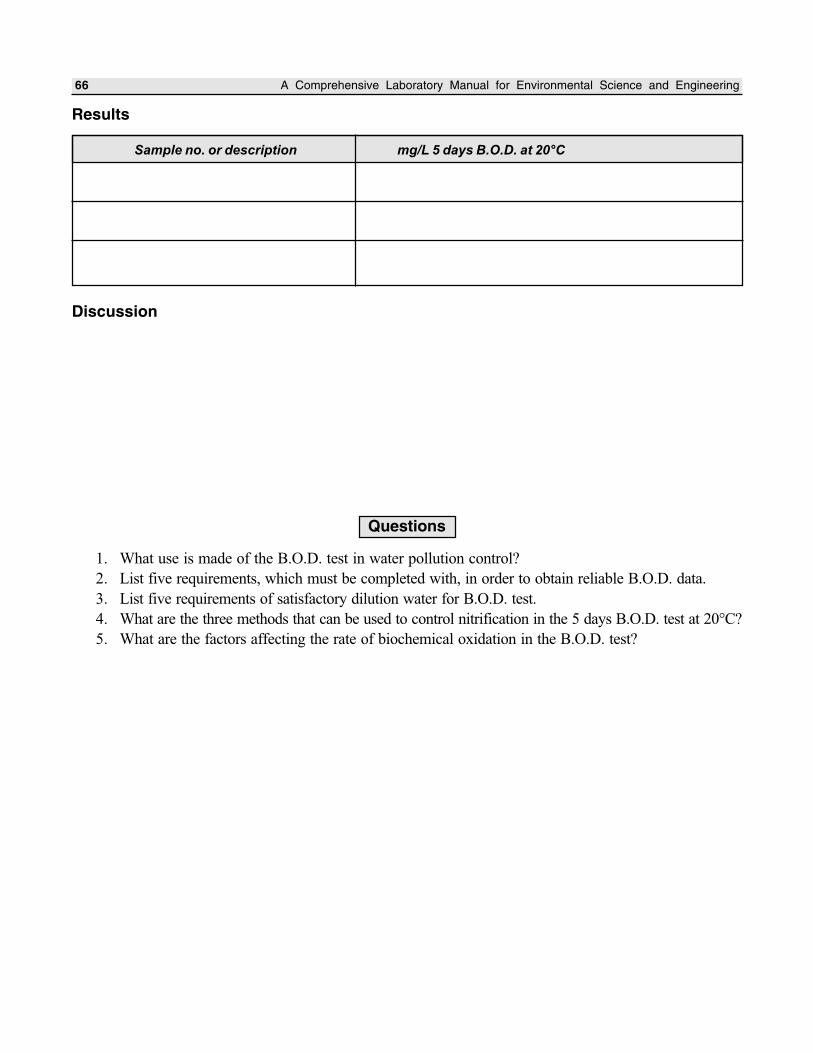
Results
Discussion
Questions
1. What use is made of the B.O.D. test in water pollution control?
2. List five requirements, which must be completed with, in order to obtain reliable B.O.D. data.
3. List five requirements of satisfactory dilution water for B.O.D. test.
4. What are the three methods that can be used to control nitrification in the 5 days B.O.D. test at 20°C?
5. What are the factors affecting the rate of biochemical oxidation in the B.O.D. test?
Sample no. or description mg/L 5 days B.O.D. at 20°C
Aim
To determine the Chemical Oxygen Demand (C.O.D.) for given sample.
Principle
Potassium dichromate is a powerful oxidising agent in acidic medium and is obtained in high state of purity.
The reaction involved is:
CnH
aO
b + cCr
2O
72– + 8cH+ = nCO
2 +
����
� H
2O + 2cCr3+
where, c = 2/3n + a/6 – b/3
C.O.D. results are reported in terms of mg of oxygen. N/8 or 0.125 N solution of oxidising agent is used in the
determination. Normality double the strength is used. This allows the use of larger samples. Thus, each ml of
0.25 N solution dichromate is equivalent to 2 mg of oxygen. An excess of oxidising agent is added, the excess is
determined by another reducing agent such as ferrous ammonium sulphate. An indicator ferroin is used in titrating
the excess dichromate against ferrous ammonium sulphate. Blanks are used also treated and titrated to get the
correct value of C.O.D.
Apparatus
1. Reflux apparatus 2. Burettes 3. Pipettes
Reagents
1. Standard potassium dichromate solution 0.25 N.
2. Sulphuric acid reagent.
3. Standard ferrous ammonium sulphate.
4. Ferroin indicator solution.
5. Mercuric sulphate.
6. Sulphuric acid crystals.
DETERMINATION OF C.O.D. IN WATER
Experiment No. ___________________ Date ___________________
122 A Comprehensive Laboratory Manual for Environmental Science and Engineering
Procedure
1. Place 50.0 mL of sample in a 500 mL refluxing flask.
2. Add 1g mercuric sulphate and a few glass beads.
3. Add sulphuric acid to dissolve the mercuric sulphate and cool.
4. Add 25.0 ml 0.25 N potassium dichromate solution and mix well.
5. Attach the flask to the condenser and start the cooling water.
6. Add the remaining acid reagent (70 mL) through the open end of condenser and mix well.
7. Apply heat and reflux for 5 hours.
8. Cool and wash down the condenser with distilled water.
9. Dilute the mixture to about twice its volume and cool to room temperature.
10. Titrate the excess dichromate with standard ferrous ammonium sulphate using ferroin indicator (2 to 3
drops).
11. The colour change from blue green to reddish indicates the end point.
12. Reflux in the same manner a blank consisting of distilled water of equal volume as that of the sample.
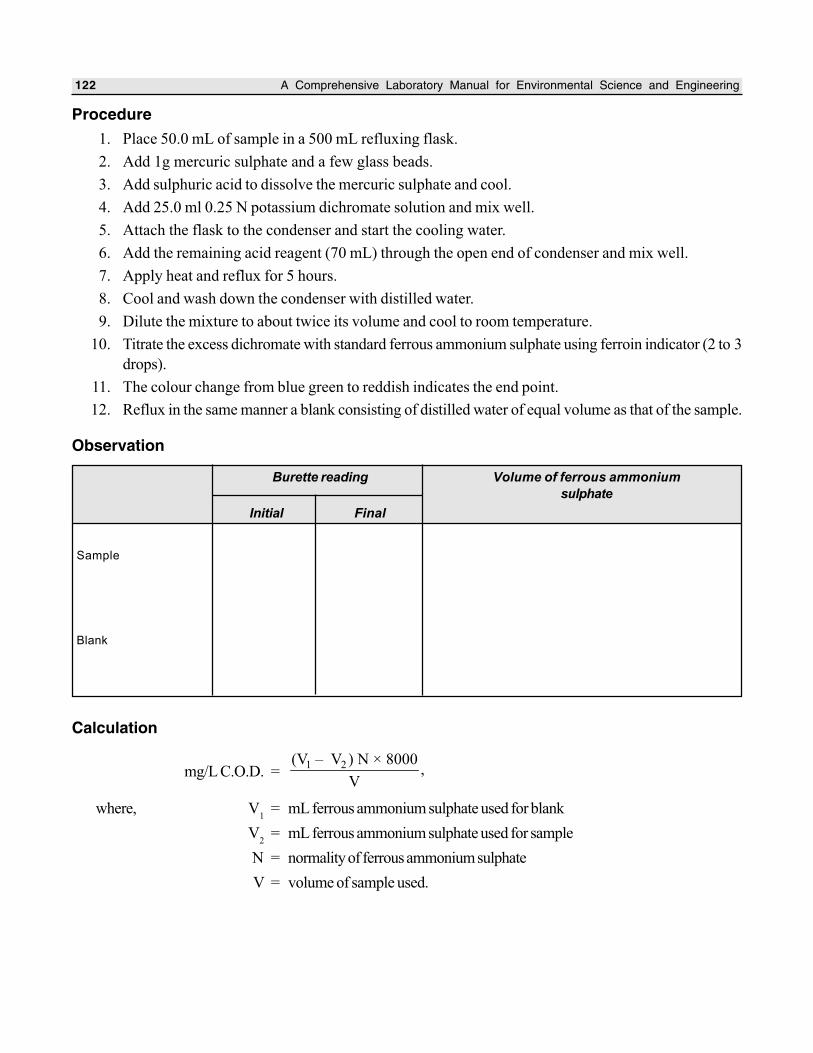
Observation
Calculation
mg/L C.O.D. =1 2(V – V ) N × 8000
,V
where, V1
= mL ferrous ammonium sulphate used for blank
V2
= mL ferrous ammonium sulphate used for sample
N = normality of ferrous ammonium sulphate
V = volume of sample used.
Burette reading Volume of ferrous ammonium
sulphate
Initial Final
Sample
Blank
Determination of C.O.D. In Water 123
Results
Discussion
Questions
1. Differentiate between B.O.D. and C.O.D.
2. Discuss the application of C.O.D. analysis in environmental engineering practice.
3. What are the interferences during C.O.D. test? How this can be eliminated?
4. Why ferroin is used as indicator in the C.O.D. test?
5. Why 0.25 N standard dichromate solution is used in the test?
Sample no. C.O.D. in mg/L
Aim
To find the Most Probable Number (MPN) of bacterial density by E.coli test.
Principle
Coliform group comprises of all the aerobic, facultative and anaerobic gram-negative non-spore forming rod
shaped bacteria that ferment lactose with gas formation within 48 hours at 35°C. The standard test for this group
may be carried out either by multiple tube fermentation technique or by membrane filter technique. The E.coli test
by multiple tube fermentation technique consists of 3 phases – presumptive, confirmed and completed.
Escherichia coli (E.coli) for the purpose of sanitary examination of water, is defined as a gram-negative, non-
spore forming rod which is capable of fermenting lactose with the production of acid and gas at 35°C in less than
48 hours, which produces indole peptone water containing tryptophan, which is incapable of utilising sodium
citrate as its sole source of carbon, which is incapable of producing acetyl methyl carbinol, and which gives a
positive methyl red test. The results are expressed in terms of MPN (Most Probable Number), which is based on
certain probability formulae. The estimate may give a value greater than the actual number of coliform present. The
accuracy of any single test depends on the number of tubes fermented. This method helps in describing the sanitary
quality of water.
The safety of the water is generally judged from the knowledge of sanitary condition and mentioned by the
number of samples yielding positive or negative results. If more than 95% should yield negative results, the safety
is usually assured. The scheme of the MPN test is given as follows:
Apparatus
1. Fermentation tubes 2. Petri dishes
3. Autoclave 4. Incubator
5. Test tubes 6. Pipettes
7. Measuring jars 8. Inoculating equipments
9. Media preparation utensils etc.
TEST FOR COLIFORMS IN WATER
Experiment No. ___________________ Date ___________________
84 A Comprehensive Laboratory Manual for Environmental Science and Engineering
Reagents
1. Lactose broth 2. Lauryl tryptose broth
3. Brilliant green lactose bile broth 4. Endo agar
5. Eosin methylene blue agar etc.
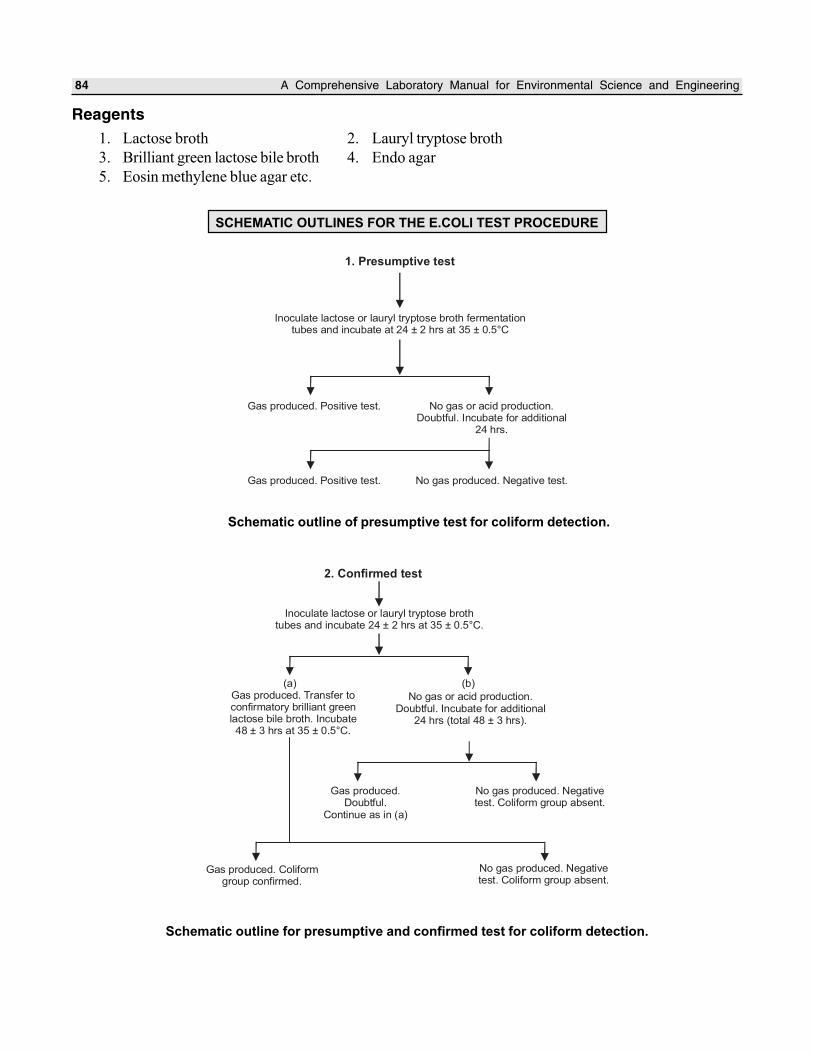
SCHEMATIC OUTLINES FOR THE E.COLI TEST PROCEDURE
1. Presumptive test
Inoculate lactose or lauryl tryptose broth fermentation tubes and incubate at 24 ± 2 hrs at 35 0.5°C±
Gas produced. Positive test. No gas or acid production. Doubtful. Incubate for additional
24 hrs.
Gas produced. Positive test. No gas produced. Negative test.
Schematic outline of presumptive test for coliform detection.
2. Confirmed test
Inoculate lactose or lauryl tryptose brothtubes and incubate 24 ± 2 hrs at 35 ± 0.5°C.
Gas produced. Transfer toconfirmatory brilliant greenlactose bile broth. Incubate48 ± 3 hrs at 35 ± 0.5°C.
No gas or acid production.Doubtful. Incubate for additional
24 hrs (total 48 ± 3 hrs).
Gas produced.Doubtful.
Continue as in (a)
No gas produced. Negativetest. Coliform group absent.
(a) (b)
Gas produced. Coliformgroup confirmed.
No gas produced. Negativetest. Coliform group absent.
Schematic outline for presumptive and confirmed test for coliform detection.
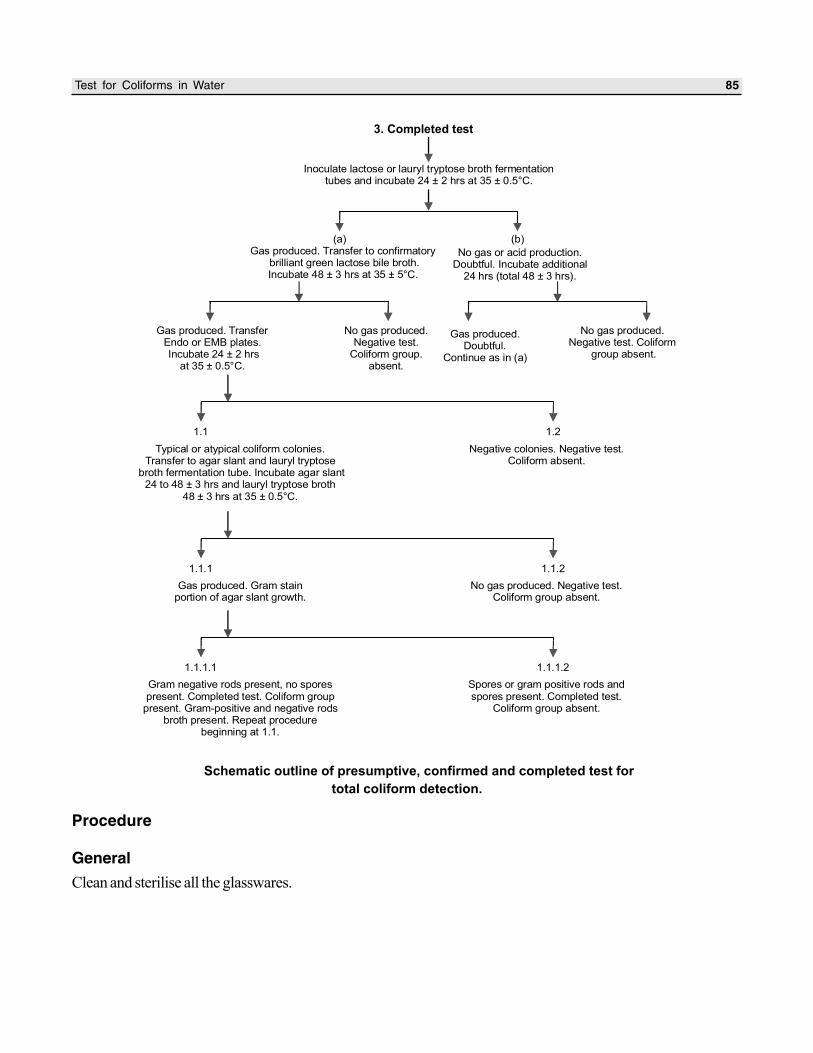
Test for Coliforms in Water 85
3. Completed test
Inoculate lactose or lauryl tryptose broth fermentation tubes and incubate 24 ± 2 hrs at 35 ± 0.5°C.
Gas produced. ransfer to brilliant green lactose bile broth.Incubate 48 ± 3 hrs at 35 ± 5°C.
T confirmatory No gas or acid production.Doubtful. Incubate additional
24 hrs (total 48 ± 3 hrs).
(a) (b)
Gas produced. TransferEndo or EMB plates. Incubate 24 ± 2 hrs
at 35 ± 0.5°C.
No gas produced.Negative test.
Coliform group.absent.
Gas produced.Doubtful.
Continue as in (a)
No gas produced.Negative test.
group absentColiform
.
Typical or atypical coliform colonies.Transfer to agar slant and lauryl tryptose
broth fermentation tube. Incubate agar slant 24 to 48 ± 3 hrs and lauryl tryptose broth
48 ± 3 hrs at 35 ± 0.5°C.
Negative colonies. Negative test.Coliform absent.
1.1 1.2
Gas produced. Gram stainportion of agar slant growth.
No gas produced. Negative test.Coliform group absent.
1.1.1 1.1.2
Gram negative rods present, no sporespresent. Completed test. Coliform group
present. Gram-positive and negative rodsbroth present. Repeat procedure
beginning at 1.1.
Spores or gram positive rods and spores present. Completed test.
Coliform group absent.
1.1.1.1 1.1.1.2
Schematic outline of presumptive, confirmed and completed test for
total coliform detection.
Procedure
General
Clean and sterilise all the glasswares.
86 A Comprehensive Laboratory Manual for Environmental Science and Engineering
Presumptive Test
1. Inoculate a series of fermentation tubes with appropriate graduated quantities (multiples and sub-multiples
of 10) of the water to be tested. The concentration of nutritive ingredients in the mixture of the medium
should conform to the specifications. The partitions of the water sample used for inoculating lactose or
lauryl tryptose broth fermentation tubes will vary in size and number with the character of the water
under examination. Usually, decimal multiples and sub-multiples of 1mL of the sample are selected.
Inoculate 10 mL portion of each water sample provided into different one of the three large tubes
containing 10 mL of lactose or lauryl tryptose broth which has been prepared with twice the normal
concentration of constituent to allow for dilution. Inoculate 1.0 mL and 0.1 mL of water into small tubes
(two sets of three each) of single strength lactose or lauryl tryptose broth.
2. Incubate the inoculated fermentation tubes at 35±0.5°C. At the end of 24±2 hrs shake each tube gently
and examine and if no gas is formed, repeat this test at the end of 48±3 hrs.
3. Record the presence or absence of gas formation at each examination of the tubes. Formation within
48±3 hrs of gas in any amount in the inverted fermentation tubes constitutes a positive presumptive test.
Active fermentation may be shown by the continued appearance of small bubbles of gas throughout
the medium outside the inner vial in the fermentation tubes. Presumptive test without confirmation should
not be used routinely except in the analysis of heavily polluted water, sewage or other waste, which
are not suitable for drinking purpose.
Confirmed Test
1. Lactose or lauryl tryptose broth may be used for primary fermentation in presumptive test to avoid false
positive results.
2. Brilliant green lactose bile broth fermentation tubes are used in confirmed test.
3. Submit all primary fermentation tubes showing any amount of gas at the end of 24 hrs incubation to
the confirmed test.
4. Gently shake primary fermentation tube showing gas formation and with a sterile metal loop, transfer
one loop full of medium to a fermentation tube containing brilliant green lactose bile broth.
5. Incubate the inoculated brilliant green lactose bile broth tube for 48±3 hrs at 35±0.5°C.
6. The formation of gas in any amount in the inverted vial of the brilliant green lactose bile broth fermentation
tube at any time within 48±3 hrs constitutes a positive confirmed test.
7. If no gas is formed, it is a negative confirmed test and E.coli is absent.
Completed Test
Completed test is the next step following the confirmed test. It is applied to the brilliant green lactose bile broth
fermentation tubes showing gas in the confirmed test.
1. Streak one or more endo or Eosin Methylene Blue (EMB) agar plates (taken in Petri dishes) from each
tube of brilliant green lactose bile broth showing gas.
2. While streaking it is essential to ensure the presence of some discrete colonies separated by at least
0.5 cm from one another.
3. Insert the end of the streaking needle into the liquid in the tube to a depth of 5 mm.
Test for Coliforms in Water 87
4. Streak the plate by bringing only the curved section of the needle in contact with the agar surface so
that the latter will not be scratched or torn.
5. Incubate the Petri dishes (inverted) at 35 ± 0.5°C for 24 ± 2 hrs.
6. The colonies developing on endo or eosin methylene blue agar may be typical (unnucleated, with or
without metallic sheen) atypical (opaque, unnucleated, mucoid, pink after incubation for 24 hrs) or
negative (all others).
7. From each of these plates fish out one or two colonies and transfer to lauryl tryptose broth fermentation
tubes and to nutrient agar slants.
8. Incubate the secondary broth tubes and agar slants at 35 ± 0.5°C for 24 ± 2 hrs or 48 ± 3 hrs and
if gas is not produced in 24 hrs gram stained preparation from these agar slant cultures are made.
9. The gas formation in the secondary lauryl tryptose broth tubes and the demonstration of gram-negative
non-spore forming rod shaped bacteria in agar culture may be considered a satisfactory positive
completed test.
10. If after 48 ± 3 hrs gas is produced in the secondary fermentation tubes and no spore of gram positive
rod are found on the slant, the test may be considered as positive completed test and this demonstrates
the presence of coliform organisms.
Differentiation of E. coli and A. aerogenes on eosin or EMB agar can be done by referring the following table.
Differentiation of E.coli and A. aerogenes on eosin or EMB agar
Characteristic Escherichia coli Aerobactor aerogenes
Size Well isolated colonies are 2–3 mm in Well isolated colonies, are larger than
diameter. those of E. coli usually 4–6 mm in
diameter.
Confluence Neighbouring colonies show little Neighbouring colonies run together
tendency to run together. quickly.
Elevation Colonies are slightly raised, surface Colonies are considerably raised and
is flat or slightly concave, rarely convex. marked by convex, occasionally centre
drops precipitedly.
Appearance by Dark, almost black centre that Centres are deep brown not as dark as
transmitted light extend across more than three fourths those of E. coli and smaller in proportion
of the diameter of the colony, internal to the rest of the colony. Striated internal
structure of central dark portion is structure is often observed in young
difficult to discern. colonies.
Appearance by Colonies are dark, button like, often Much lighter than E. coli, metallic sheen
reflected light concentrically ringed with a greenish is not observed except in a depressed
metallic sheen. center.
Gram Staining
Reagents
1. Ammonium oxalate-crystal violet (Hucker’s)
2. Lugol’s solution
88 A Comprehensive Laboratory Manual for Environmental Science and Engineering
3. Counter stain
4. Acetone alcohol.
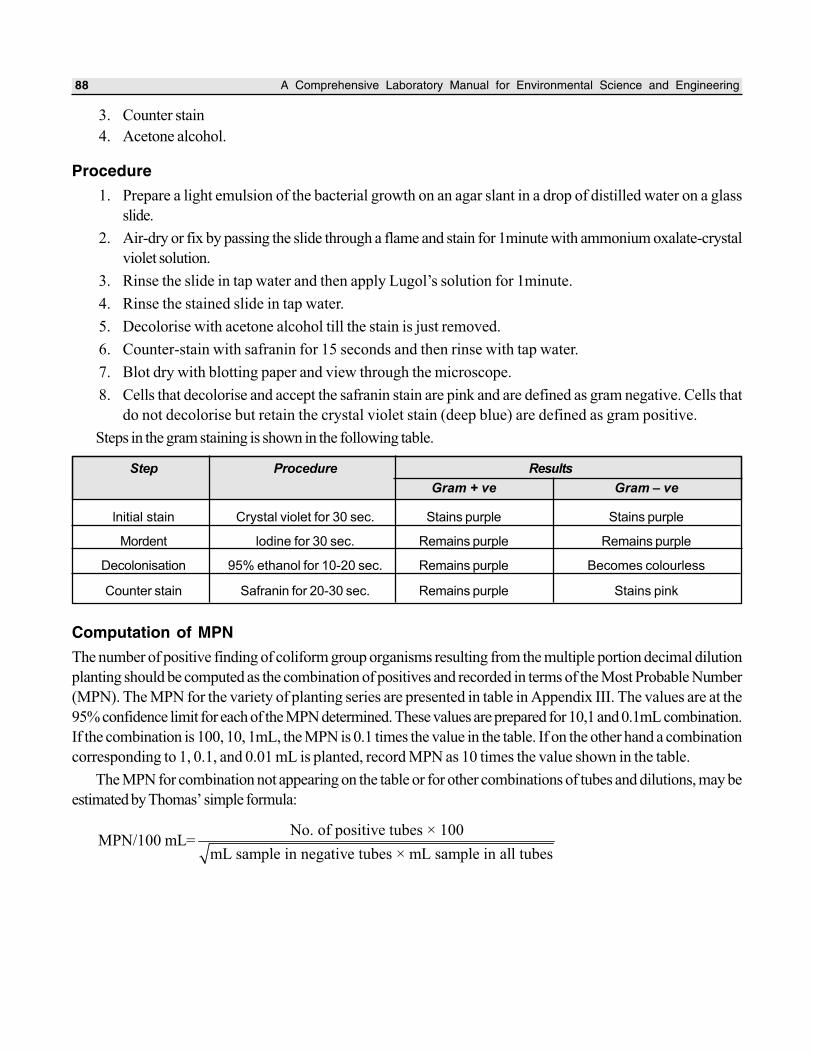
Procedure
1. Prepare a light emulsion of the bacterial growth on an agar slant in a drop of distilled water on a glass
slide.
2. Air-dry or fix by passing the slide through a flame and stain for 1minute with ammonium oxalate-crystal
violet solution.
3. Rinse the slide in tap water and then apply Lugol’s solution for 1minute.
4. Rinse the stained slide in tap water.
5. Decolorise with acetone alcohol till the stain is just removed.
6. Counter-stain with safranin for 15 seconds and then rinse with tap water.
7. Blot dry with blotting paper and view through the microscope.
8. Cells that decolorise and accept the safranin stain are pink and are defined as gram negative. Cells that
do not decolorise but retain the crystal violet stain (deep blue) are defined as gram positive.
Steps in the gram staining is shown in the following table.
Step Procedure Results
Gram + ve Gram – ve
lnitial stain Crystal violet for 30 sec. Stains purple Stains purple
Mordent lodine for 30 sec. Remains purple Remains purple
Decolonisation 95% ethanol for 10-20 sec. Remains purple Becomes colourless
Counter stain Safranin for 20-30 sec. Remains purple Stains pink
Computation of MPN
The number of positive finding of coliform group organisms resulting from the multiple portion decimal dilution
planting should be computed as the combination of positives and recorded in terms of the Most Probable Number
(MPN). The MPN for the variety of planting series are presented in table in Appendix III. The values are at the
95% confidence limit for each of the MPN determined. These values are prepared for 10,1 and 0.1mL combination.
If the combination is 100, 10, 1mL, the MPN is 0.1 times the value in the table. If on the other hand a combination
corresponding to 1, 0.1, and 0.01 mL is planted, record MPN as 10 times the value shown in the table.
The MPN for combination not appearing on the table or for other combinations of tubes and dilutions, may be
estimated by Thomas’ simple formula:
No. of positive tubes × 100MPN/100 mL=
mL sample in negative tubes × mL sample in all tubes
Test for Coliforms in Water 89
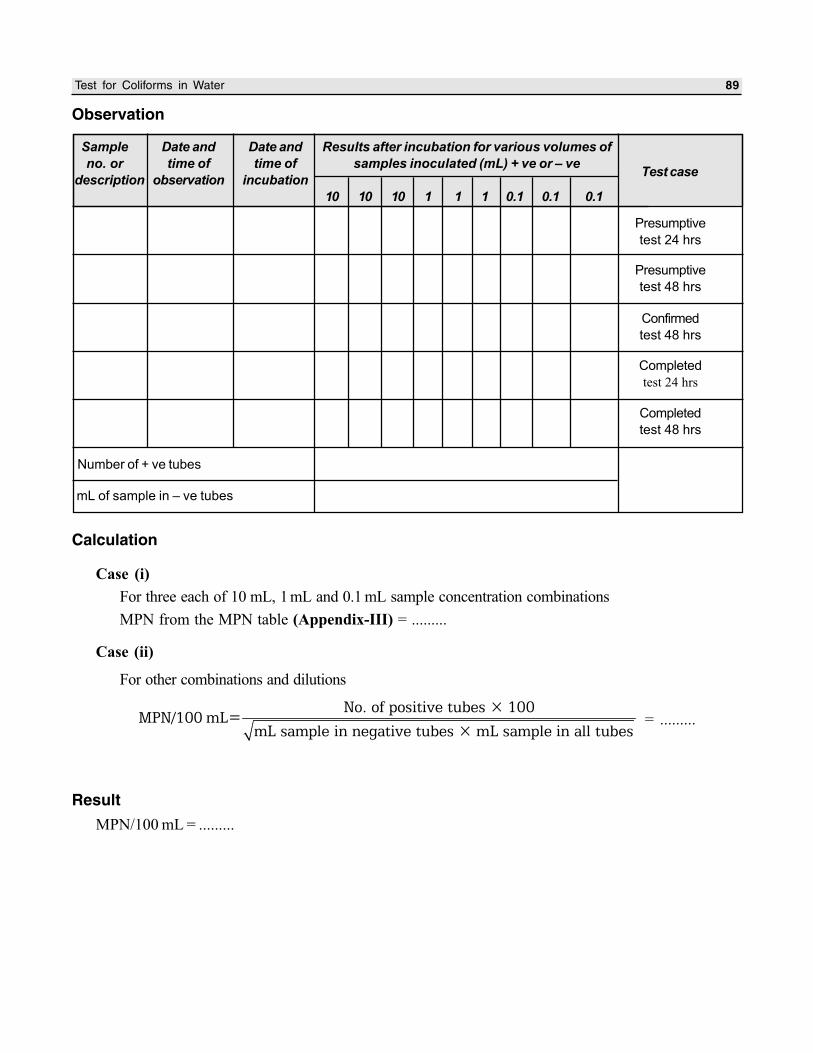
Observation
Sample Date and Date and Results after incubation for various volumes of
no. or time of time of samples inoculated (mL) + ve or – ve
description observation incubation
10 10 10 1 1 1 0.1 0.1 0.1
Calculation
Case (i)
For three each of 10 mL, 1 mL and 0.1 mL sample concentration combinations
MPN from the MPN table (Appendix-III) = .........
Case (ii)
For other combinations and dilutions
���������������������������
������� �������������������������������������������������������
= .........
Result
MPN/100 mL = .........
Test case
Presumptive
test 24 hrs
Presumptive
test 48 hrs
Confirmed
test 48 hrs
Completed
test 24 hrs
Completed
test 48 hrs
Number of + ve tubes
mL of sample in – ve tubes
90 A Comprehensive Laboratory Manual for Environmental Science and Engineering
Discussion
Questions
1. What are E.coli? Are they harmful to human beings? Why is their presence tested in the waters to be
supplied for domestic consumption?
2. What is coliform index?
3. Define MPN.