environmental flow response and socio-economic monitoring
TRANSCRIPT

Environmental flow response and socio-economic monitoring
Far West NSW - progress report 2011

�Canberra
� Sydney
�Menindee
� Walgett
� Dubbo
�Bourke
�Cobar
�
Broken Hill
Far
We
st N
SW
Publisher NSW Department of Primary Industries, Office of Water.
Level 18, 227 Elizabeth Street GPO Box 3889 Sydney NSW 2001
T 02 8281 7777 F 02 8281 7799
[email protected] www.water.nsw.gov.au
The NSW Office of Water manages the policy and regulatory frameworks for the state’s surface water and groundwater resources, to provide a secure and sustainable water supply for all users. It also supports water utilities in the provision of water and sewerage services throughout New South Wales.
Environmental flow response and socio-economic monitoring Far West NSW - progress report 2011
March 2012
ISBN 978 0 7313 3523 7
© State of New South Wales through the Department of Trade and Investment, Regional Infrastructure and Services, 2012
This material may be reproduced in whole or in part for educational and non-commercial use, providing the meaning is unchanged and its source, publisher and authorship are clearly and correctly acknowledged.
Disclaimer: While every reasonable effort has been made to ensure that this document is correct at the time of publication, the State of New South Wales, its agents and employees, disclaim any and all liability to any person in respect of anything or the consequences of anything done or omitted to be done in reliance upon the whole or any part of this document.
NOW 12_054
What is the purpose of this report? ��������������������������������������������������������������������������������������������������� 4
Why do we need to monitor plans? ���������������������������������������������������������������������������������������������������� 4
What water sharing plans are currently in place? ����������������������������������������������������������������������������� 7
What other water sharing arrangements have been developed in the Far West? ����������������������������� 7
What has influenced the water sharing plans’ operations in 2010-11 ���������������������������������������������� 12
Groundwater - water availability ������������������������������������������������������������������������������������������������������������� 12
What environmental issues are addressed by the water sharing plans? ������������������������������������������ 12
Unregulated rivers water sharing plans �������������������������������������������������������������������������������������������������� 12
Groundwater water sharing plans ���������������������������������������������������������������������������������������������������������� 13
What ecological monitoring is occurring? ����������������������������������������������������������������������������������������� 15
Unregulated rivers water sharing plans ��������������������������������������������������������������������������������������������������� 15
Groundwater water sharing plans ���������������������������������������������������������������������������������������������������������� 19
Which plan provisions are we monitoring? ���������������������������������������������������������������������������������������� 25
Unregulated rivers water sharing plans �������������������������������������������������������������������������������������������������� 25
Groundwater water sharing plans ���������������������������������������������������������������������������������������������������������� 25
What has the ecological monitoring told us so far? �������������������������������������������������������������������������� 28
Unregulated rivers water sharing plan ���������������������������������������������������������������������������������������������������� 28
Groundwater water sharing plans ���������������������������������������������������������������������������������������������������������� 28
Socio-economic monitoring ��������������������������������������������������������������������������������������������������������������� 30
What ecological monitoring is planned for 2011-12? ������������������������������������������������������������������������� 33
Unregulated rivers water sharing plans �������������������������������������������������������������������������������������������������� 33
Groundwater water sharing plans ���������������������������������������������������������������������������������������������������������� 33
What socio-economic monitoring is planned for 2011-12? ��������������������������������������������������������������� 33
What’s planned for future water sharing plans? ������������������������������������������������������������������������������� 33
Future priority needs for ecological monitoring and evaluation activities in the Far West ��������������� 33
Want more information? �������������������������������������������������������������������������������������������������������������������� 34
References ����������������������������������������������������������������������������������������������������������������������������������������� 34
cont
ents
4
the Far West NSW
IntroductionWhat is thE purposE of this rEport?
This report provides an update
on the monitoring and evaluation
activities undertaken in 2010-11 to
assess the ecological and socio-
economic performance of water
sharing plans adopted in the Far
West region of NSW. It provides an
interim assessment of outcomes
of the investigations and identifies
priority needs for future monitoring
and evaluation activities.
Why do WE nEEd to monitor plans?
Water sharing plans provide water
to meet environmental and socio-
economic needs, and spells out the
rules governing access to water.
The Far West region contains a
number of important environmental
assets, and in some valleys supports
a valuable irrigation industry,
although grazing predominates.
Important environmental assets
include the Barwon-Darling River
system, which incorporates
the rivers of the lower Balonne
catchment and those of the NSW-
Queensland Intersecting Streams.
The Far West region is larger than
Victoria and Tasmania combined.
It includes an exceptionally large
number of important wetlands, three
of which are Ramsar listed (namely,
Narran Lake Nature Reserve, Paroo
River Wetlands and Lake Pinaroo),
and 49 others included on the
Directory of Nationally Important
Wetlands (www.environment.gov.au).
The four catchment basins that drain
from southern Queensland into NSW
are represented within the region:
the rivers of the lower Balonne
(which includes the Narran, Culgoa,
Bokhara and Birrie rivers), the
Warrego, Cuttaburra Creek and the
Paroo River. Further west, beyond
Wanaaring, and only occasionally
flowing, is the Bulloo River, with its
vast ‘overflow’ terminal lakes, which
sporadically provide major feeding
and breeding habitat for waterbirds.
Other terminal catchments, the
Cobham Lakes, Lake Bancannia
and tributaries of Lake Frome and
Lake Eyre, lie further west. The
region also includes the Barwon-
Darling River system which, although
not formally regulated, has flows
that are generally affected by
storages and water extraction on
its major tributaries in both NSW
and Queensland.
It is important to know whether
water sharing plans, where they
have been implemented within
the Far West, are meeting their
environmental objectives so that
their effectiveness can be reviewed
at the end of their 10-year period of
operation. The information collected
will be used to make informed
decisions on how the plans might
be improved when they are
renewed. To achieve this, the
NSW Office of Water undertakes
ecological and socio-economic
monitoring and evaluation activities
focused on specific clauses and
performance indicators within
the plans.
Figure 1 shows field work
being undertaken to assess
riparian vegetation response to
environmental flows.

Environmental flow response and socio-economic monitoring | Far West NSW - progress report 2011
5
Figure 1Monitoring vegetation response to flows on the Darling River.Im
age
cour
tesy
of T
racy
Ful
ford

6
the Far West NSW
Darling
River
Darling Rive
r
Barwon River
Bogan River
Macquarie River
Castlereagh River
Namoi River
Macintyr
e River
Narran
River
Bokhara
River
Culgoa
River
War
rego
Rive
r
Paro
o Ri
ver
Cobar
Broken HillNymagee
Canbelego
Brewarrina
Lightning Ridge
MungindiBarringunHungerford
Collarenebri
Tilba
Wanaaring
White Cliffs
Tibooburra
Wilcannia
Ivanhoe
Menindee
Louth
Bourke Walgett
Figure 2 Water Sharing Plan for the NSW Great Artesian Basin Groundwater Sources and location of monitoring sites in the Far West.
0 110 220 330 440
kilometres
LegendNSW Great Artesian Basin Groundwater Source
Key sites
Stage One - DataLogger
Stage One - Priority 1
Stage One - Telemetry
Environmental flow response and socio-economic monitoring | Far West NSW - progress report 2011
7
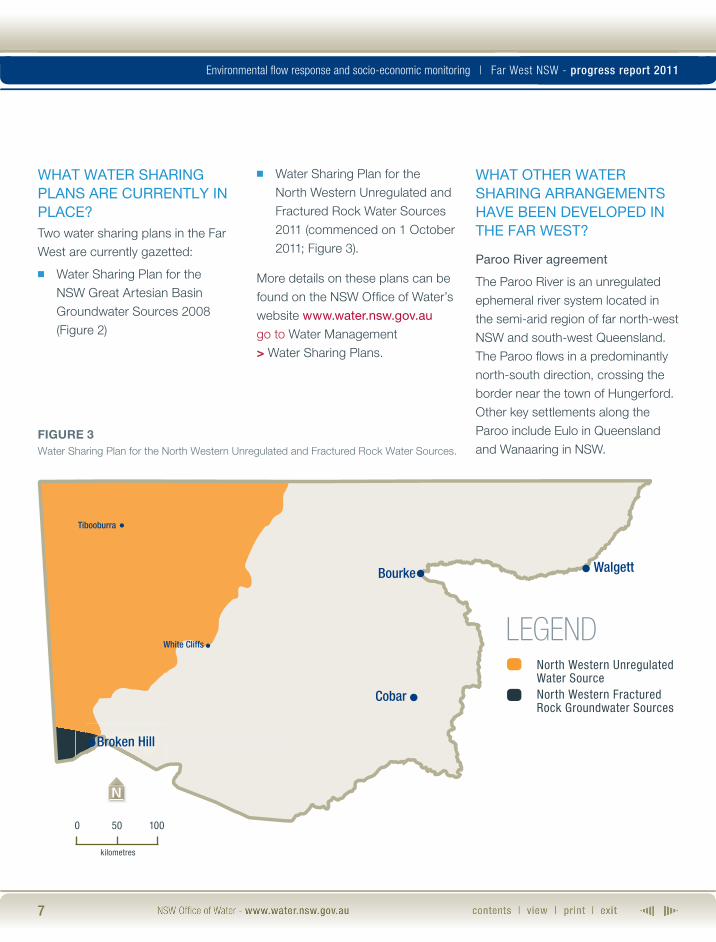
What WatEr sharing plans arE currEntly in placE?Two water sharing plans in the Far
West are currently gazetted:
■■ Water Sharing Plan for the
NSW Great Artesian Basin
Groundwater Sources 2008
(Figure 2)
■■ Water Sharing Plan for the
North Western Unregulated and
Fractured Rock Water Sources
2011 (commenced on 1 October
2011; Figure 3).
More details on these plans can be
found on the NSW Office of Water’s
website www.water.nsw.gov.au
go to Water Management
> Water Sharing Plans.
What othEr WatEr sharing arrangEmEnts havE bEEn dEvElopEd in thE far WEst?
paroo river agreement
The Paroo River is an unregulated
ephemeral river system located in
the semi-arid region of far north-west
NSW and south-west Queensland.
The Paroo flows in a predominantly
north-south direction, crossing the
border near the town of Hungerford.
Other key settlements along the
Paroo include Eulo in Queensland
and Wanaaring in NSW.
Cobar
Broken Hill
White Cliffs
Tibooburra
Bourke Walgett
North Western Unregulated Water Source North Western Fractured Rock Groundwater Sources
Legend
0 50 100
Figure 3 Water Sharing Plan for the North Western Unregulated and Fractured Rock Water Sources.
kilometres
NSW Great Artesian Basin Groundwater Source
Key sites
Stage One - DataLogger
Stage One - Priority 1
Stage One - Telemetry

8
the Far West NSW
Flows in the Paroo are episodic, and ‘permanent’ waterholes provide important refugia for fish and other aquatic species during periods of low flow. Water from the Paroo River reaches the Darling River upstream of Wilcannia only during infrequent major floods such as those of 1990 and 2010. More often, flows terminate in the floodplains and wetlands south of Wanaaring. High flows in the Warrego River also contribute to the Paroo through Cuttaburra Creek, which connects the two systems.
The Paroo catchment contains ecological and environmental assets of national and international importance. It also contains areas of high economic, social, heritage and cultural values. A cooperative partnership between NSW and Queensland is required to ensure the sustainable management of these important areas and the overall health of the Paroo River system.
On 18 July 2003, the Intergovernmental Agreement
for the Paroo River between
New South Wales and Queensland was signed by the premiers of both states. The Agreement established a joint recognition by community, government and other stakeholders of the significance of the water resources in maintaining the unique character of the Paroo
River catchment.
The Agreement highlights the ecological diversity, economic importance and spiritual values of the system. It recognises the unique character of the Paroo River and ensures that it will continue to provide spiritual connection, ecological diversity and integrity, and economic sustenance for future generations. More specifically, its purpose is to guide the development and implementation of water-related natural resource policies and strategies that may affect the quantity or quality of water in the Paroo River. In doing so, the Agreement aims to avoid adverse cross-border impacts on flow patterns and other water management issues.
The objectives of the Agreement are to:
(a) provide a means for the parties to come together in good faith
(b) define a process and context for raising and addressing water and related natural resource management issues
(c) provide an emphasis for the Paroo River catchment under the Border Catchments Memorandum of Understanding and the Murray-Darling Basin Agreement
(d) provide for a cooperative approach between community, industry, other stakeholders and all levels of government in the sustainable management of the Agreement area
(g) encourage, promote and support management that reflects the Agreement’s vision
(h) encourage and promote research and monitoring to support informed decision making in the Paroo River catchment
(i) provide for the review and, as necessary, revision of the Agreement
(j) raise general public awareness of the special biodiversity and heritage values of the Paroo River catchment.
The Agreement will be superseded by the Murray-Darling Basin Plan when it is approved.
interim north West unregulated flow plan
In February 1992, a draft interim plan for the management of unregulated flows in the north west of NSW was released for public comment. Its primary objective was to better manage unregulated flows in an effort to achieve a better health of the Barwon-Darling River without

Environmental flow response and socio-economic monitoring | Far West NSW - progress report 2011
9
severely impacting on water users. It establishes:
■■ target flows at key locations along the Barwon-Darling River and sets priorities for river health and riparian flows
■■ a framework for sharing unregulated flows between irrigators and for better management of extractions
■■ improved monitoring and research programs.
Environmental flow operational targetsOff-allocation pumping and B and C Class licence operation will not be permitted unless riparian flow targets are met. The targets at each location vary depending on inflows from contributing tributaries downstream of Mungindi. If no inflows from tributaries downstream of Mungindi exist the environmental
flow operational targets will be:
The water sharing plans for
the Namoi, Gwydir and Border
Rivers regulated rivers all contain
provisions that enable the Interim
North West Unregulated Flow
Plan to be amended, although
any such amendment must ‘in the
Minister’s opinion, not substantially
alter the long-term average volume
of water that can be taken under
supplementary water access
licences in the Gwydir/Namoi/
Border rivers Regulated River
Water Sources.’
To enhance management of flow
events in the Barwon-Darling Rivers,
improved modelling capabilities
are required that can better predict
flood peak discharge from estimated
tributary flows at key locations within
the system. Integrated Quality and
Quantity Model (IQQM) modelling
is required to evaluate the potential
for tributary end of system flows,
as specified in the gazetted water
sharing plans within each of the
contributing valleys, to provide
more frequent low flows which may
maintain instream pool refugia and
increase security of access to riparian
flows within the Barwon-Darling.
Algal suppression
Blooms of blue-green algae
(cyanobacteria) can cause major
problems in terms of water quality
for domestic and stock water
users along the length of the
Barwon-Darling and can also
affect town water supplies for
centres such as Walgett,
Bourke and Wilcannia.
Algal blooms can most often
occur were instream flow is
reduced, particularly during the
summer months, to a point where
thermal stratification results, thus
producing conditions suitable for
the rapid growth of cyanobacteria.
Where possible, it is critical that
stream flow is maintained such that
the risk of cyanobacterial blooms
is reduced.
Access to unregulated flows will be
managed to achieve a flow of
at least 2,000 megalitres per day
for 5 days at Wilcannia between
October and April inclusive unless
a flow of at least this size has
occurred within three preceding
months within the October to
April period.
B and C Class licences may
have restriction to off-allocation
flows if it is assessed that normal
pumping will reduce flows below
the targets, and restriction of
pumping in the tributaries before
three months of algal suppression
locatioN taRgetS
megalitReS peR day
Mungindi 850Collarenebri 760Walgett 700Brewarrina 550Bourke 390Louth 280Wilcannia 150
the Far West NSW
10
flows at Wilcannia may be necessary
to allow for travel time to the
target locations.
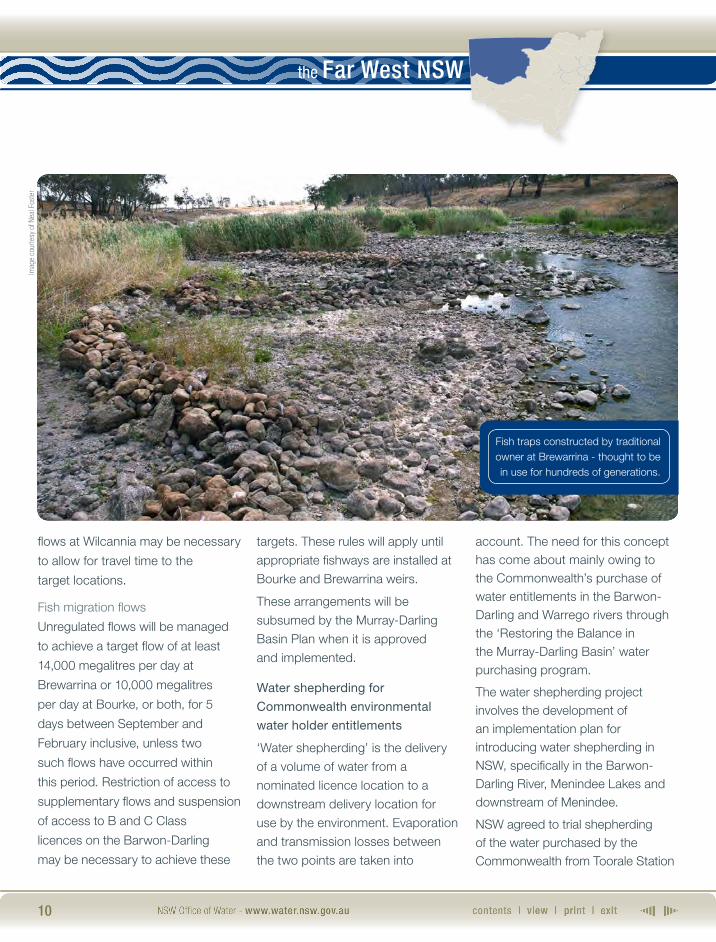
Fish migration flows
Unregulated flows will be managed
to achieve a target flow of at least
14,000 megalitres per day at
Brewarrina or 10,000 megalitres
per day at Bourke, or both, for 5
days between September and
February inclusive, unless two
such flows have occurred within
this period. Restriction of access to
supplementary flows and suspension
of access to B and C Class
licences on the Barwon-Darling
may be necessary to achieve these
targets. These rules will apply until
appropriate fishways are installed at
Bourke and Brewarrina weirs.
These arrangements will be
subsumed by the Murray-Darling
Basin Plan when it is approved
and implemented.
Water shepherding for
commonwealth environmental
water holder entitlements
‘Water shepherding’ is the delivery
of a volume of water from a
nominated licence location to a
downstream delivery location for
use by the environment. Evaporation
and transmission losses between
the two points are taken into
account. The need for this concept has come about mainly owing to the Commonwealth’s purchase of water entitlements in the Barwon-Darling and Warrego rivers through the ‘Restoring the Balance in the Murray-Darling Basin’ water purchasing program.
The water shepherding project involves the development of an implementation plan for introducing water shepherding in NSW, specifically in the Barwon-Darling River, Menindee Lakes and downstream of Menindee.
NSW agreed to trial shepherding of the water purchased by the Commonwealth from Toorale Station
Imag
e co
urte
sy o
f nea
l Fos
ter
Fish traps constructed by traditional owner at Brewarrina - thought to be in use for hundreds of generations.

Environmental flow response and socio-economic monitoring | Far West NSW - progress report 2011
11
(on the junction of the Warrego and Darling rivers), on the basis that the trial would not set any precedents for water shepherding in the future. NSW conducted three trials to shepherd water from the Barwon-Darling through Menindee Lakes to the Lower Darling and Murray rivers. These trials considered transmission and evaporation losses when calculating volumes that could be made available for environmental purposes at the downstream locations. The trials were conducted when flow events in the Barwon-Darling triggered the access conditions of the Toorale licence:
■■ In March 2009, 11,400 megalitres
was shepherded from Toorale
Station, providing 5,976 megalitres
for environmental use in the
River Murray
■■ In the summer of 2009-10, 38,000
megalitres was shepherded from
Toorale Station, delivering 30,400
megalitres to the Menindee Lakes
■■ In September 2010, 6,580
megalitres was shepherded
from Toorale Station, releasing
6,580 megalitres into the Great
Darling Anabranch.
The Water Shepherding Taskforce
agreed to investigate an end-of-
system accounting method that is
structured around a licensing and
dealing framework. The method
establishes a mechanism to
shepherd water to the end of the
Barwon-Darling system and for the
volume reaching the end of system
to be accounted for and potentially
recognised downstream.
The NSW Water Shepherding
Taskforce is now further developing
the end-of-system method to take into
account legal and licensing issues,
accounting, water delivery, modelling
and monitoring, trading, interstate
water sharing arrangements, cap
management and the treatment of
overbank flows. It is also considering
how water shepherded from
Queensland and tributaries flowing
into the Barwon-Darling Rivers could
be accommodated.
For further information on the ‘Restoring the Balance in the Murray–Darling Basin’ water purchasing program, see
Imag
e co
urte
sy o
f nea
l Fos
ter

12
the Far West NSW
available water determinationsWhat has influEncEd thE WatEr sharing plans’ opErations in 2010-11
groundwater - water availability
NSW Great Artesian Basin Groundwater Sources
Only three out of five NSW Great Artesian Basin Groundwater Sources underlie the Far West catchment. The entire Warrego and Central Groundwater Sources and the western part of the Surat Groundwater Source fall into the Far West catchment. The extraction of groundwater in the NSW Great Artesian Basin Groundwater Sources is managed sustainably and equitably through the announcement of available water determinations for each category of licences at the beginning of the water year. In the two water years since the announcement of the plan in July 2008, the available water determination remained the same for all NSW Great Artesian Basin
Groundwater Sources. The level of
extraction from the aquifer access
licences from all three Great Artesian
Basin groundwater sources under
the Far West catchment was well
below the long-term average annual
extraction limit. As provided under
the Water Management Act 2000,
thirty percent of water savings (1,200
megalitres) made under the Cap
and Pipe the Bores Program (Great
Artesian Basin Sustainable Initiative)
since 1999 in the Surat, Warrego
and Central groundwater sources
was released to the public through
controlled allocation in 2009-10.
In the Surat, Warrego and Central
groundwater sources, local water
utility, domestic and stock users
have been allowed to access 100
per cent of their share component.
For the share components of aquifer
access licences authorized to extract
from these groundwater sources,
available water determination is set
at 1 megalitre per share unit.
What EnvironmEntal issuEs arE addrEssEd by thE WatEr sharing plans?
unregulated rivers water
sharing plans
The Water Sharing Plan for the
North Western Unregulated and
Fractured Rock applies to all
of the unregulated streams within
the North Western Water Source,
which include:
■■ Bulloo River Overflow
■■ Coopers Creek and Lake Eyre
■■ Lake Bancannia
■■ Lake Frome.
These systems are characterised
as being highly ephemeral due to
the low rainfall received within their
catchments. This means that it is
important to protect the instream
pools, lagoons and other water
bodies that may be critical for
the survival of both aquatic and
12

Environmental flow response and socio-economic monitoring | Far West NSW - progress report 2011
13
terrestrial organisms. Many of these features provide key feeding and nesting habitat for colonially nesting waterbirds and migratory bird species. Figure 4 illustrates a key migratory bird habitat which is also listed under the Ramsar Convention. Provisions within the plan are also included to protect culturally significant areas.
groundwater water sharing plans
NSW Great Artesian Basin Groundwater Water Sources
The Water Sharing Plan for the Great Artesian Basin Groundwater Sources requires that water be allocated for the fundamental health of a water source and its dependent ecosystems as a
first priority. Of 37 geothermal springs identified as high-priority groundwater-dependent ecosystems which need a high level of protection in the plan, 35 lie in the Far West catchment. The plan also recognises (though not mentioned explicitly) that the upward leakage and refused recharge from the Great Artesian Basin Groundwater Sources contribute base flows to water courses. To protect the geothermal springs and water courses, the plan sets distance rules for granting work approvals. Figure 5 illustrates artesian mound springs occurring at Peery Lake on the lower Paroo River
In the Surat, Warrego and Central groundwater sources, the plan
reserves the volume of water
required to maintain 1990 pressure
levels, minus increased extraction
from 1990 until the end of June
2008, plus water savings made
under the Cap and Pipe the Bores
Program between 1990 and 1999,
plus 70 per cent of water savings
made under that program since
1999 for the environment (that
is, to maintain the health of the
groundwater sources).
North Western Fractured Rock Water SourceThe Water Sharing Plan for the North Western Fractured Rock Water Source provides for the protection of groundwater-dependent ecosystems (GDEs), particularly through access to shallow alluvial groundwater systems and water
Figure 4The Ramsar-listed Lake Pinaroo, in the far north west of the plan area, is important for waterbirds.
Imag
e co
urte
sy o
f nea
l Fos
ter

14
the Far West NSW
stored in rock fractures. Surface expressions of groundwater from fractured rock systems in this arid region are key refugia for aquatic organisms and critical water sources for terrestrial animals. In the past, these sources of water were often critical for the survival of the indigenous inhabitants of the area.
The plan provides protection for the Tarrawingee and Corona Springs, in the Adelaide Fold Belt, and the Mutawintji and Torrowangee Karst systems through the application of long-term average annual extraction limits and limiting activities that may cause aquifer interference. Other provisions are designed to minimise
interference between neighbouring works, to protect culturally significant works, and to ensure that any further works are located away from contaminated areas.
For more details on the water sharing plans, visit www.water.nsw.gov.au go to Water Management > Water Sharing Plans > Plans commenced
Figure 5Great Artesian Basin mound springs at Peery Lake.
Imag
e co
urte
sy o
f nea
l Fos
ter

Environmental flow response and socio-economic monitoring | Far West NSW - progress report 2011
15
What Ecological monitoring is occurring?
unregulated rivers water sharing plans
Water Sharing Plan for the North Western Unregulated Water Sources
A study investigating the physical condition and hydrological status of key pool refugia in the NSW-Queensland intersecting streams will provide information necessary for adequate monitoring and evaluation of the performance of the water sharing plan for these river systems. The study involves aerial assessment and interrogation of satellite imagery with follow up ground-truthing and assessment of environmental attributes. Key pool refugia are being assessed for geomorphology and for ecological/habitat condition.
Stage 1, which involves aerial surveying and mapping of remnant pool refugia, was completed in December 2009, before the floods. Analysis of video and photographic records is in progress.
Key pools within each river are being assessed, and instrumentation to measure water levels and temperature profiles in pools is
being installed. Water quality data are being collected to supplement the Intersecting Streams Water Quality Program, funded through the Border Rivers Commission.
The study will improve our understanding of the physical condition of the pool refugia within the Paroo, Warrego, Moonie, Culgoa, Narran, Bokhara and Birrie Rivers and inform the development of water sharing principles for the water sharing plan. It will also provide a better understanding of:
■■ the broad ecological values of these rivers and wetlands
■■ key environmental assets within the river systems
■■ the specific flow regime requirements to maintain connectivity or refuge value within these systems
■■ the location of and potential impact of anthropogenic changes to the character of the river channel (such as weirs and artificial barriers).
Water Sharing Plan for the Barwon-Darling Water Source (in preparation)
Wetlands and instream values
The flooding of many floodplain
wetland features such as flood-runners, warrumbools and ox-bows has been identified as being necessary for the stimulation and growth of many aquatic and terrestrial plants and animals.
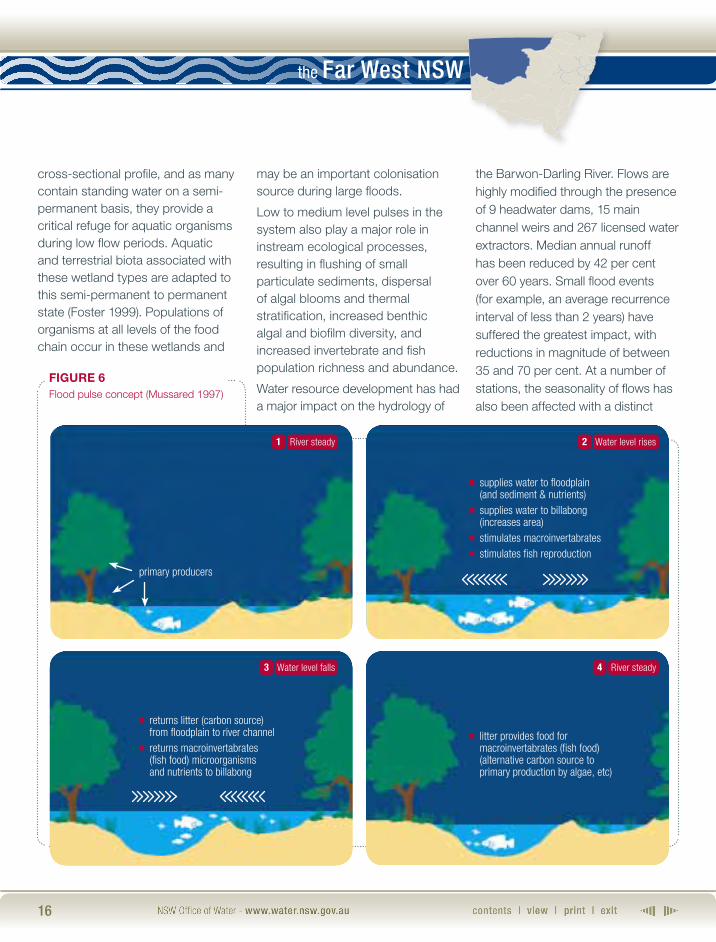
Particularly important for the riverine ecology are the in-channel structures such as terraces or benches, on which debris or detritus is deposited during low flow periods. This material may include leaf litter and the remains of insects. When floods occur and these areas are inundated, the organic material, in addition to being an in situ food source for many aquatic organisms, may also be transported from the bench to be recycled within the river-floodplain system (Figure 6). These benches are more frequently inundated than similar higher level instream features owing to their location lower down the cross-sectional profile of the river channel, and therefore provide an important role in the cycling of carbon and nutrients.
Ox-bows, warrumbools and billabongs are also important in the provision of habitat, breeding areas and food. These features tend to be located higher up the stream
ecological monitoring
16
the Far West NSW
cross-sectional profile, and as many contain standing water on a semi-permanent basis, they provide a critical refuge for aquatic organisms during low flow periods. Aquatic and terrestrial biota associated with these wetland types are adapted to this semi-permanent to permanent state (Foster 1999). Populations of organisms at all levels of the food chain occur in these wetlands and
may be an important colonisation source during large floods.
Low to medium level pulses in the system also play a major role in instream ecological processes, resulting in flushing of small particulate sediments, dispersal of algal blooms and thermal stratification, increased benthic algal and biofilm diversity, and increased invertebrate and fish population richness and abundance.
Water resource development has had a major impact on the hydrology of
the Barwon-Darling River. Flows are highly modified through the presence of 9 headwater dams, 15 main channel weirs and 267 licensed water extractors. Median annual runoff has been reduced by 42 per cent over 60 years. Small flood events (for example, an average recurrence interval of less than 2 years) have suffered the greatest impact, with reductions in magnitude of between 35 and 70 per cent. At a number of stations, the seasonality of flows has also been affected with a distinct
Figure 6Flood pulse concept (Mussared 1997)
River steady1 Water level rises2
Water level falls3 River steady4
primary producers
n supplies water to floodplain(and sediment & nutrients)
n supplies water to billabong(increases area)
n stimulates macroinvertabratesn stimulates fish reproduction
n returns litter (carbon source) from floodplain to river channel
n returns macroinvertabrates (fish food) microorganisms and nutrients to billabong
n litter provides food for macroinvertabrates (fish food) (alternative carbon source to primary production by algae, etc)

Environmental flow response and socio-economic monitoring | Far West NSW - progress report 2011
17
shift in seasonal flow peaks relating to irrigation diversions. Overall, flows show a marked increase in predictability and consistency.
As a result of these changes, wetted channel habitat for native fish has been reduced (Boys et al., 2005), the frequency and duration of inundation of instream benches and terraces has changed (Brennan et al., 2002), and hydrological connectivity with floodplain wetlands has been significantly altered, potentially affecting the ecological functions in these features.
The IQQM (Integrated Quality and Quantity Model) has analysed the period of rainfall records from 1897 to the present to enable the assessment of the impact of changes to river hydrology as a result of irrigation development or access conditions.
Figures 7a, 7b and 7c compares the hydrological character modelled for the Barwon-Darling at Bourke, Brewarrina and Wilcannia and demonstrate the impact of irrigation development in the Barwon-Darling and its tributaries (Namoi, Gwydir and Border Rivers, etc) on the frequency of achieving key flow thresholds identified for those sites within the Barwon-Darling.
Bourke NAT Bourke DEV BrewarrinaNAT
BrewarrinaDEV
WilcanniaNAT
WilcanniaDEV
0
50,000
100,000
150,000
200,000
250,000
Bourke NAT
10,000ML/day threshold
14,000ML/day threshold
2,000ML/day threshold
Bourke DEV BrewarrinaNAT
BrewarrinaDEV
WilcanniaNAT
WilcanniaDEV
0
50
100
150
200
250
300
Bourke NAT
10,000ML/day threshold
14,000ML/day threshold
2,000ML/day threshold
10,000ML/day threshold
14,000ML/day threshold
2,000ML/day threshold
Bourke DEV BrewarrinaNAT
BrewarrinaDEV
WilcanniaNAT
WilcanniaDEV
0
2,000
4,000
6,000
8,000
10,000
12,000
14,000
16,000
Bourke NAT
10,000ML/day threshold
14,000ML/day threshold
2,000ML/day threshold
Bourke DEV Brewarrina Brewarrina Wilcannia Wilcannia
0
2,000
4,000
6,000
8,000
10,000
12,000
14,000
16,000
Bourke NAT Bourke DEV BrewarrinaNAT
BrewarrinaDEV
WilcanniaNAT
WilcanniaDEV
0
50,000
100,000
150,000
200,000
250,000
Bourke NAT
10,000ML/day threshold
14,000ML/day threshold
2,000ML/day threshold
Bourke DEV BrewarrinaNAT
BrewarrinaDEV
WilcanniaNAT
WilcanniaDEV
0
50
100
150
200
250
300
10,000ML/day threshold
14,000ML/day threshold
2,000ML/day threshold
NAT DEV NAT DEV
Eve
nts
Day
s
Figure 7a Number of events exceeding nominated flow thresholds at Bourke, Brewarrina and Wilcannia over the period from 1897 to 2008.
Figure 7b Total duration (days) of events exceeding nominated flow thresholds at Bourke, Brewarrina and Wilcannia over the period from 1897 to 2008.
Figure 7c Total volume (in Gigalitres) of events exceeding nominated flow thresholds at Bourke, Brewarrina and Wilcannia over the period from 1897 to 2008.
NOTeNAT No development in tributaries and
no development in Barwon-Darling.
DeV Tributary Inflows and Barwon-Darling irrigation at 1993-94 CAP Development and Access Conditions.
Gig
alitr
es
Bourke NAT Bourke DEV BrewarrinaNAT
BrewarrinaDEV
WilcanniaNAT
WilcanniaDEV
0
50,000
100,000
150,000
200,000
250,000
10,000ML/day threshold
14,000ML/day threshold
2,000ML/day threshold
Bourke NAT
10,000ML/day threshold
14,000ML/day threshold
2,000ML/day threshold
Bourke DEV BrewarrinaNAT
BrewarrinaDEV
WilcanniaNAT
WilcanniaDEV
0
50
100
150
200
250
300
Bourke NAT
10,000ML/day threshold
14,000ML/day threshold
2,000ML/day threshold
Bourke DEV BrewarrinaNAT
BrewarrinaDEV
WilcanniaNAT
WilcanniaDEV
0
2,000
4,000
6,000
8,000
10,000
12,000
14,000
16,000

18
the Far West NSW
Critical discharge required for thermal destratification of weir pools
Weir pools and natural waterholes (Figure 8) within the Barwon-Darling River are frequently affected by planktonic blooms of the toxic filamentous cyanobacterium Anabaena circinalis (Mitrovic and Gordon, 1998). Blooms of this and other species of blue-green algae can significantly impact on town water supplies and stock water quality through the release of toxins and of taste and odour compounds, potentially affecting more than 250 licensed urban and rural extractors within the Barwon-Darling system (Figure 9).
In an attempt to better understand the relationship between stream discharge, stream velocity and the incidence of cyanobacterial blooms (greater than 15,000 cells per millilitre), Mitrovic and Gordon (1998) used a hydrological model, IQQM, to assess the effectiveness of the environmental water provisions in suppressing bloom development.
River Styles® projectThe NSW Office of Water, in conjunction with the Western Catchment Management Authority (WCMA), engaged consultants to undertake a River Styles® assessment of all named streamlines in the WCMA area. The aim of this project was to assess and map the geomorphic character of streams
Figure 8The Darling River near Tilpa.
Figure 9Blue-green algal bloom on the Darling River.
Image courtesy of neal Foster
Image courtesy of neal Foster
Environmental flow response and socio-economic monitoring | Far West NSW - progress report 2011
19
utilising the River Styles® method, that occur across the WCMA area and the geomorphic condition, fragility, recovery potential and refugia potential of waterways. The data will improve our understanding of the physical processes that determine the structure and character of waterways and will guide the selection of monitoring sites to allow the comparison and identification of particular stream types that are essential for maintaining ecological function across the flow regime. See Figure 10 for examples of River Styles® mapping.
groundwater water sharing plans
NSW Great Artesian Basin Groundwater Sources
Over 500 flowing bores in the NSW Great Artesian Basin Groundwater Sources have been monitored for pressure, flow, temperature and groundwater quality over the last 100 years. Monitoring was discontinued in many bores as they were plugged, became sub-artesian or became unsuitable owing to the poor condition of the bore head. At present, 60 bores are being monitored at least once every 2 years. As part of the federally funded basin-wide monitoring of the health of Great Artesian Basin aquifers, 29 of these bores are being monitored for pressure, flow, temperature and water quality once a year. Twelve
of these bores are being fitted with telemetered data loggers to monitor pressure, flow, temperature and water quality in real time.
North Western Fractured Rock Water Source
This water source is not currently being monitored.
Mapping of groundwater-dependent ecosystems
Two major projects are associated with identification of groundwater-dependent ecosystems (GDEs) in the Far West of NSW:
1. Stage 1 mapping of high-priority GDEs for the Macro and other water sharing plan processes using a preliminary desktop study of geological maps, vegetation and land use maps, and information from any prior studies. So far only the mound springs within the region have been identified (Figure 11).
2. Mapping of terrestrial vegetation communities across NSW using satellite imagery and MODIS (Moderate Resolution Imaging Spectroradiometer) data to identify vegetation that uses groundwater. This project is expected to be completed by mid 2012. Follow-up field survey work is needed to establish the extent of natural values, the condition of these sites and their level of groundwater dependency.
The NSW Office of Water and the Office of Environment and Heritage have developed draft risk assessment guidelines for groundwater-dependent ecosystems for identifying and valuing GDEs and their associated aquifers. The guidelines allow potential and actual impacts of proposed activities on GDEs to be assessed, and provide a method for developing management strategies for aquifers and identified GDEs. The process for identifying and valuing GDEs involves two stages:
stage 1 Identification of high-ecological-value assets and high-priority GDEs within the aquifer or groundwater source. This is a desktop approach that lists:
■■ areas of known or potential GDEs that have been identified as having high conservation value under legislative or other assessment programs
■■ obligate or entirely dependent ecosystems and species.
stage 2 Valuation of GDE and aquifer or groundwater source ecology. This involves a detailed ecological assessment based on criteria adapted from Dunn (2000), and covers:
■■ GDE environment (surface and subsurface)
■■ rarity of the dependent biota or physical features
■■ diversity
■■ special features.

20
the Far West NSW
Figure 10a River Styles® mapping of the Far West.
0 25 50 100
kilometres
LegendCVS Floodplain pockets, gravel
CVS Floodplain pockets, sand
CVS Gorge
CVS Headwater
LUV CC Anabranching
LUV CC Anabranching, gravel
LUV CC Anastomosing
LUV CC Channelised fill
LUV CC Low sinuosity, fine grained
LUV CC Low sinuosity, sand
LUV CC Meandering, fine grained
LUV CC Wandering, gravel
LUV CC Wandering, sand
LUV DC Variable lake delta
PCVS Bedrock controlled, gravel
PCVS Bedrock controlled, sand
PCVS Dune controlled, anabranching
PCVS Planform controlled, anabranching
PCVS Planform controlled, low sinuosity, fine grain
PCVS Planform controlled, low sinuos
PCVS Planform controlled, wandering
SMG Dune controlled, chain of ponds
SMG Dune controlled, floodout
SMG floodout
SMG Valley fill, fine grained
SMG Valley fill, sand
Water storage dam of weir pool
This map is to be used as a general guide for regional and local scale natural resource planning and management only, not for the assessment of specific sites which can only be assessed by investigation specific to those sites. The field information contained on this map may not be verified or complete.
This map is published by the NSW Office of Water. While every reasonable effort has been made to ensure the accuracy of the information contained in the map, you should satisfy yourself as to the accuracy of the information before relying on it.
The State of New South Wales, its agents and employees, disclaim any and all liability to any person in respect of anything or the consequences of anything done or omitted to be done in reliance upon the whole or any part of this map.
Data sources: NSW Office of Water

Environmental flow response and socio-economic monitoring | Far West NSW - progress report 2011
21
Figure 10b River Styles® Geomorphic Condition of the Far West.
Figure 10c River Styles® Recovery Potential of the Far West.
0 25 50 100
kilometres
LegendGood
Moderate
Poor
None
LegendConservation
Strategic
Rapid recovery
High recovery potential
Moderate recovery potential
Low recovery potential
None
These maps are to be used as a general guide for regional and local scale natural resource planning and management only, not for the assessment of specific sites which can only be assessed by investigation specific to those sites. The field information contained on These maps may not be verified or complete.
These maps are published by the NSW Office of Water. While every reasonable effort has been made to ensure the accuracy of the information contained in the map, you should satisfy yourself as to the accuracy of the information before relying on it.
The State of New South Wales, its agents and employees, disclaim any and all liability to any person in respect of anything or the consequences of anything done or omitted to be done in reliance upon the whole or any part of these maps.
Data sources: NSW Office of Water

22
the Far West NSW
0 25 50 75 100
kilometres
Figure 11 Map of identified groundwater-dependant ecosystems in Far West region of NSW
stage 2 has two steps:
Step 1: Identification of the ecological value of individual GDEs within a groundwater sourceThis step involves a rapid identification of high-ecological-value assets and is a broad-scale assessment that aims to identify
whether an aquifer has any environmental assets that have been identified through other legislated conservation processes or programs as having important conservation significance; that is, they have high ecological value and should be classed as high-priority GDEs. This
allows for the protection of GDEs of known high conservation value via the protection of the water source.
Step 2: Identification of the ecological value of the aquifer or groundwater sourceThis step involves a desktop exercise assembling all known
LegendGeothermal spring

Environmental flow response and socio-economic monitoring | Far West NSW - progress report 2011
23
records of communities, species and
areas of high ecological value within
an aquifer or groundwater source.
It includes interrogating known
databases, GIS records and other
studies, followed by the identification
of the high-priority GDEs.
identification of high-priority
gdEs within the aquifer or
groundwater source
A high-priority GDE has high
ecological value. This means natural
or near-natural condition, health
and integrity, or that fulfils any of the
criteria in stage 1 and/or is assessed
as such. High-priority GDEs include
any of the following:
(a) Groundwater-dependent
communities in which a slight to
moderate change in groundwater
discharge or water tables would
result in a substantial change
in their distribution, species
composition or health. This
includes all ecosystems that are
identified and acknowledged
as being entirely (or obligately)
dependent on groundwater for
their survival. These ecosystems
include all karst, springs, mound
spring and subterranean aquifer
ecosystems and some wetlands,
including hanging swamps
(b) Those ecosystems that have
already been identified as
important by other environmental
agencies or within existing
legislation or international
agreements: that is, those
GDEs that are partly or wholly
located within a state or federal
reserve system (for example, a
national park) or a recognised
high conservation area, such
as a subcatchment identified as
having high conservation value
(for example, stressed rivers,
high-value vegetation, State
Environmental Planning Policy 14
- Coastal Wetlands,
or those listed on the Directory
of Important Wetlands in
Australia (DIWA))
(c) Any natural groundwater-
dependent system that is habitat
for any endemic, relictual, rare
or endangered fauna or flora
populations or communities as
listed under the NSW Threatened
Species Act 1995, the NSW
Fisheries Management Act
1994 or the Commonwealth
Environment Protection and
Biodiversity Conservation
Act 1999, or identified by
an acknowledged expert
taxonomist or ecologist.
Acknowledging the presence of
these ecological assets is the first
step in assigning an ecological
value to a groundwater source and
individual GDEs and in developing an
appropriate strategy to manage the
risk from both land use and water
management impacts. Bioregional
and catchment-scale issues, such as
reservation status or whether there
are recognised and listed rare or
threatened species or communities,
are also important. The area and
number of GDE subtypes and the
relative condition of those GDEs in
the landscape and bioregion place
the threat to the biota in a regional
context. Consideration of these
issues can assist in determining the
role that the aquifer plays in relation
to the maintenance and protection
of biodiversity within any legislated
assets and within the region as
a whole. In addition, there may
be particular species or features
present that are considered to
make an additional contribution to
an aquifer’s biodiversity value. This
is of particular relevance to many
of the small, isolated relict GDE
communities characteristic of the
arid environment of the Far West
region. Although the risk assessment
guidelines for groundwater-
dependent ecosystems will continue
to be developed and applied, at this
stage no on-ground monitoring of
the ecological attributes is planned
for 2011-12.

24
the Far West NSW
The NSW Office of Water and the Office of Environment and Heritage have developed draft risk assessment guidelines for groundwater-dependent ecosystems.
Imag
e co
urte
sy o
f Nea
l Fos
ter
Environmental flow response and socio-economic monitoring | Far West NSW - progress report 2011
25
Which plan provisions arE WE monitoring?
unregulated rivers water
sharing plans
Water Sharing Plan for the North
Western Unregulated and Fractured
Rock Water Sources
clause 8: objectives
The objectives of the plan are to:
(a) protect, preserve, maintain
and enhance the important
river-flow-dependent and high-
priority groundwater-dependent
ecosystems of these water
sources
(b) protect, preserve, maintain and
enhance the Aboriginal, cultural
and heritage values of these
water sources
(c) contribute to the maintenance
of water quality
(d) provide recognition of the
connectivity between surface
water and groundwater
(e) adaptively manage these water
sources
(f) contribute to the environmental
and other public benefit
outcomes identified under the
Water Access Entitlements
and Planning Framework in the
Intergovernmental Agreement
on a National Water Initiative
(2004) (the NWI).
Under the NWI, water that is
provided by NSW to meet agreed
environmental and other public
benefit outcomes is to:
(i) be given statutory recognition
and have at least the same
degree of security as water
access entitlements for
consumptive use and be fully
accounted for
(ii) be defined as the water
management arrangements
required to meet the outcomes
sought, including water provided
on a rules basis or held as a
water access entitlement
(iii) if held as a water access
entitlement, may be made
available to be traded (where
physically possible) on the
temporary market, when
not required to meet the
environmental and other public
benefit outcomes sought, and
provided such trading is not in
conflict with these outcomes.
clause 10: performance indicators
The performance of the plan is assessed against changes in:
(a) low flows
(b) moderate to high flows
(c) or maintenance of, the ecological value of key water sources and their dependent ecosystems
(d) the economic benefits derived from water extraction and use.
groundwater water sharing plans
Water Sharing Plan for the NSW Great Artesian Basin Groundwater Sources
clause 9: objectives
The objectives of the plan are to:
(a) improve pressures and flows in the artesian portion of the groundwater sources through efficient water use, and to achieve sustainable extraction in their recharge areas
(b) protect, maintain and, where possible, restore priority environmental assets
(c) maintain and enhance cultural and heritage values affected by the use of water from the groundwater sources
plan provisions being monitored

26
the Far West NSW
(d) enhance groundwater use for
community benefit
(e) adaptively manage these
groundwater sources
(f) protect groundwater quality.
clause 11: performance indicators
The performance of the plan is
assessed against:
(a) change in groundwater
extraction volume relative to the
long-term total average annual
extraction limit
(b) change in groundwater levels
and pressures
(c) change in groundwater levels
and pressures adjacent
to identified groundwater-
dependent ecosystems
(d) change in groundwater quality
(e) change in economic benefits
derived from groundwater
extraction and use
(f) the total length of bore drains
replaced by efficient water
distribution methods.
Water Sharing Plan for the North
Western Unregulated and Fractured
Rock Water Sources
clause 8: objectives
The objectives of the plan are to:
(a) protect, preserve, maintain
and enhance the important
river-flow-dependent and high-
priority groundwater-dependent
ecosystems of these water
sources
(b) protect, preserve, maintain and
enhance the Aboriginal, cultural
and heritage values of these
water sources
(c) contribute to the maintenance
of water quality
(d) provide recognition of the
connectivity between surface
water and groundwater
(e) adaptively manage these
water sources
(f) contribute to the environmental
and other public benefit
outcomes identified under the
Water Access Entitlements
and Planning Framework in the
Intergovernmental Agreement on
a National Water Initiative (2004).
clause 10: performance indicators
The performance of the plan is
assessed against changes in:
(a) surface water and groundwater
extraction relative to the
long-term average annual
extraction limit
(b) or maintenance of, the ecological
value of key water sources and
their dependent ecosystems
(c) economic benefits derived from
water extraction and use.
clause 15: Establishment and maintenance of planned environmental water
(1) Planned environmental water in these water sources is established as follows:
(a) The physical presence of water:
(i) in the North Western Water Source that results from the access rules specified in Division 2 of Part 8 of the plan that set flow rates or flow levels below which the taking of water is not permitted
(ii) in the Kanmantoo Fold Belt North Western Groundwater Source equal to 40 per cent of the long-term average annual rainfall recharge in areas that are not high environmental value areas (estimated to be 46,550 megalitres per year) and 100 per cent of the long-term average annual rainfall recharge in high environmental value areas (estimated to be 5,145 megalitres per year) at the start of this plan
(iii) equal to 40 per cent of the long-term average annual rainfall recharge to the Adelaide Fold Belt North Western Groundwater Source (estimated to be 50,635 megalitres per year)

Environmental flow response and socio-economic monitoring | Far West NSW - progress report 2011
27
(iv) equal to 100 per cent of
the annual recharge to the
Lachlan Fold Belt North
Western Groundwater Source
(v) within the groundwater
storage of these fractured
rock groundwater sources
over the long term.
(b) The long-term average annual
commitment of water in:
(i) the North Western Water
Source that results from the
application of the available
water determination rules
as specified in Division 2 of
Part 6, the water allocation
management rules as
specified in Division 1 of
Part 8, and the resulting
long-term average annual
extraction limit as specified
in Division 1 of Part 6
(ii) the Kanmantoo Fold Belt
North Western Groundwater
Source equal to 40 per cent
of the long-term average
annual rainfall recharge
(iii) the Adelaide Fold Belt North
Western Groundwater Source
equal to 40 per cent of the
long-term average annual
rainfall recharge
(iv) the Lachlan Fold Belt North
Western Groundwater Source
equal to 100 per cent of the
annual recharge
(v) these fractured rock
groundwater sources equal
to the volume of water within
the groundwater storage over
the long term.
(c) The water remaining after water
has been taken pursuant to
basic landholder rights and
access licences in these water
sources, in accordance with the
rules specified in Part 6 and
Part 8 of the plan.
(2) The planned environmental water
established under 15(1)(a) above
is maintained in:
(a) the North Western Water Source
by the rules specified in Division
2 of Part 8 of the plan
(b) these fractured rock groundwater
sources by the rules specified in
Part 6 and Part 8 of the plan.
(3) The planned environmental water
established under 15(1)(b) is
maintained in:
(a) the North Western Water
Source by the available water
determination rules as specified
in Division 2 of Part 6, the water
allocation account management
rules as specified in Division 1
of Part 8, and the resulting long-
term average annual extraction
limit as specified in Division 1
of Part 6
(b) these fractured rock groundwater
sources by the rules in
Part 6 which limit the water
available for extraction under
access licences.
(4) The planned environmental
water established under
15(1)(c) is maintained in these
water sources by the rules
specified in Part 6 and Part 8
of the plan to ensure that water
will remain in these water
sources over the long term by
maintaining compliance with
the long-term average annual
extraction limit. The rules in
Part 6 provide for a reduction in
available water determinations
when the long-term average
annual extraction limit is
assessed to have
been exceeded.
Brolgas feeding on the Darling River floodplain.
Image courtesy of neal Foster

28
the Far West NSW
What has thE Ecological monitoring told us so far?
unregulated rivers water sharing plan
Water Sharing Plan for the Barwon-Darling Water Sources (yet to be gazetted)
protection of flows to reduce the incidence of blue-green algal blooms in weir pools
Research by Mitrovic and Gordon (1998) in a number of weir pools in the Barwon-Darling identified the minimum discharges at which persistent thermal stratification and blooms do not occur. The ‘critical’ discharges at Bourke and Wilcannia were estimated from previous studies (Oliver et al. 2000; Mitrovic et al. 2003) and from Anabaena cell counts and discharge data over 1992–2003 (Department of Infrastructure, Planning and Natural Resources, unpublished data). Insufficient data were available for Brewarrina; the few blooms recorded there coincided with very low discharges (less than 50 megalitres per day) that probably were well below the critical discharge.
Model runs using the IQQM were performed:
■■ with environmental water provisions
■■ with extraction but with no environmental water provisions
■■ without extraction (that is, ‘natural’ discharge).
Study sites were selected to
represent the upper (Brewarrina),
mid (Bourke) and lower (Wilcannia)
sections of the Barwon-Darling
River. At each site, cross-sectional
profiles were derived, and wetted
area was calculated for river heights
equivalent to the critical discharges
at Bourke and Wilcannia.
Table 1 shows the critical discharges
and corresponding flow velocities
required to suppress persistent
thermal stratification and Anabaena
circinalis growth.
Mitrovic et al’s modelling implies that
the environmental water provisions
in place since mid 2000 are not yet
likely to have had much effect on the
frequency of blooms of A. circinalis.
However, modelling of their potential
impact, had they been in place from
1990 to 2000, indicates that they
could have reduced the frequency
by up to a third at some sites. It
thus appears that the environmental
water provisions could decrease
bloom frequency appreciably
over the longer term. Mitrovic et
al. (1998) suggest maintenance of
flow velocities above 0.04 metres
per second from 15 October to 15
March of each year to minimise the
frequency and intensity of blooms.
groundwater water sharing plans
NSW Great Artesian Basin Groundwater Sources
All except two high-priority
geothermal springs identified for
protection in the Great Artesian
Basin Groundwater Sources are
located in the Far West catchment.
The analysis of flows shows that
95 free-flowing (uncontrolled) bores
in this catchment have significant
impact on the protected geothermal
springs. The number of impacting
TAble 1 Critical discharges and corresponding velocities to suppress persistent stratification and Anabaena circinalis growth, and wetted cross-sectional areas at the critical discharges, at three sites in the Barwon–Darling River (Mitrovic et al. 1998).
Sitecritical
discharge (ml d-1)
critical velocity (mean ± Sd) (ms-1)
cross-sectional area‡ (mean ± Sd) (m2)
Barwon River at Brewarrina 510* 0.030 ± 0.003† 196± 23Darling River at Bourke 450 0.030 ± 0.004 175± 21Darling River at Wilcannia 350 0.031± 0.004 132± 20
* Estimated from cross-sectional area and critical velocity† Estimated from critical velocity at other sites‡n = 15
Ml d-1 = megalitres per dayms -1 = metres per secondm2 = square metres

Environmental flow response and socio-economic monitoring | Far West NSW - progress report 2011
29
bores is estimated as 9 in the
Central, 58 in the Warrego and 28
in the Surat groundwater sources in
this catchment.
The monitoring also shows that the
pressure head in the Great Artesian
Basin Groundwater Sources in
the Far West catchment rose by
between 1 and 6 metres in the last
10 years. Noticeable rise in pressure
in the artesian aquifer in the Warrego
and Surat groundwater sources
near areas where many free-flowing
bores were plugged under the
Cap and Pipe the Bores Program.
However, no significant increase
in pressure was observed in the
Central Groundwater Source. The
reasons for this observation may
be a lack of long-term monitoring
information, discontinuity of
monitoring of bores owing to gas
in the water, and a low number of
bores plugged, capped and piped in
this groundwater source.
links to other projects
The statewide groundwater
monitoring network in the NSW
Great Artesian Basin Groundwater
Sources is linked to the federally
funded Great Artesian Basin
Monitoring Network. Twenty-nine
bores of the statewide monitoring
network are being used for
monitoring of the Great Artesian
Basin. Data obtained from this
monitoring will be used to evaluate
the effectiveness of the water
sharing plans through changes in
pressure within the aquifer.
The NSW Macro Plan process is
expected to have plans in place
for all groundwater sources in the
Far West by mid 2012. The plans
for each groundwater source will
contain long-term average annual
extraction limits and rules that will
allow only acceptable impacts
on users and the environment.
Groundwater sources that are
highly connected to the rivers
will include cease-to-pump criteria.
For more details visit the NSW Office of Water’s website www.water.nsw.gov.au
Image courtesy of neal Foster

the Far West NSW
30
Socio-economic monitoringIn 2005, the NSW Office of Water
began a statewide project to monitor
changes in the NSW irrigation
industry following the introduction of
water sharing plans. The project is
designed to:
■■ monitor key social and economic
changes at the farm and regional
levels arising from water sharing
plans
■■ provide data for the NSW Office
of Water’s review and evaluation
of water sharing plans
■■ provide data for the Natural
Resources Commission’s
review of water sharing plans
■■ provide a benchmark for
other economic and social
monitoring exercises in natural
resource management.
The project was developed
after extensive consultation
with stakeholders, including the
NSW Irrigators’ Council and the
Primary Industries and Economic
Development Standing Committee
of the NSW Natural Resources
Advisory Council.
The project reports on changes in
a number of identified social and
economic indicators. The data are
collected primarily in a 20-minute
telephone survey of irrigators
who responded to an invitation
to participate. A sample size of
approximately 10 per cent of the
eligible irrigators is targeted for
each survey. Additional customised
data from the Australian Bureau of
Statistics’ agricultural census are
also used.
The first of the surveys, in 2006,
targeted irrigators in areas where
the first 31 water sharing plans were
implemented in July 2004. These
plans covered all major regulated
rivers in NSW, and represented
approximately 80 per cent of the
extractive water use in NSW. The
2006 survey collected baseline
data reflecting the socio-economic
conditions of farms in these areas.
For reporting purposes, the results
of the irrigator surveys are tabulated
by catchment management authority
(CMA) area. The Far West data are
reported for the Western CMA area.
No water sharing plans were
gazetted in the Far West in 2004, so
no data were collected in this area in
the 2006 survey.
In 2009, the companion baseline
survey targeted irrigators in areas
where water sharing plans were
implemented after 2004 or are
about to be implemented. This
survey covered irrigators whose
water sources are predominantly
unregulated rivers or major inland
groundwater systems.
The combined 2006 and 2009
survey data provide a complete
statewide baseline data set for use
in the socio-economic indicator
reporting of plan performance.
The 2009 survey included six water
sharing plan areas in the Far West:
■■ NSW Great Artesian Basin
Groundwater Sources (plan
gazetted 2008)
■■ North Western Unregulated and
Fractured Rock Water Sources
■■ Barwon-Darling Unregulated
and Alluvial Water Sources
■■ Intersecting Streams Unregulated
and Alluvial Water Sources
■■ Murray-Darling Basin Fractured
Rock Groundwater Sources
■■ Murray-Darling Basin Porous
Rock Groundwater Sources.
In the Western CMA area there were

Environmental flow response and socio-economic monitoring | Far West NSW - progress report 2011
31
278 irrigators with an entitlement
of 215,600 megalitres. The 2009
survey obtained responses from
26 irrigators with entitlements of
38,366 megalitres.
The 2009 survey results showed:
■■ The median irrigation farm size in
the Western CMA area was 4,215
hectares, with a 25th to 75th
percentile range of 487 to 10,422
hectares. The statewide median
was 90 hectares (percentile
range 30 to 409 hectares)
■■ Centre pivot and lateral-move
irrigation systems were used
on 63 percent of irrigated land
in the Western CMA area and
compares this to statewide
results (Figure 12)
■■ Figure 13 shows the irrigators’
responses to the statement
‘The water sharing plan has
made or will make my water
rights more secure’
■■ Irrigators derived 12 per cent
of total farm income from
irrigated crops and pastures.
The statewide average was
30 per cent
■■ 27 per cent of irrigators had
used their water entitlement as
security for a loan. The statewide
average was 17 per cent
■■ 69 per cent of irrigators employed non-family members on farm. The statewide average was 45 per cent
■■ Full-time employment of family and non-family members per irrigation farm was 3.5 equivalent full-time (EFT) positions. The statewide
average was 2.1 EFT positions
Figure 12 2009 survey results showing proportion of irrigation systems used by respondents in the 2009 survey in the Western CMA area and statewide
Source: 2009 Irrigators survey.
Centre pivot or lateral move
Flood or furrow
Drip system
Spray or sprinkle2009 SURVey ReSULTS
Irrigation system for Western CMA area
2009 SURVey ReSULTS Irrigation system by area
for New South Wales
Figure 13 2009 Survey responses to the statement ‘The water sharing plan has made or will make my water rights more secure.’
0
10
20
30
40
strongly agree
agree neither disagree strongly disagree
Western CMA
Statewide (weighted) results
0%
10%
20%
30%
40%
50%
strongly agree
agree neither disagree strongly disagree
0
10
20
30
40
50
strongly agree
agree neither disagree strongly disagree
0%
10%
20%
30%
40%
50%
strongly agree
agree neither disagree strongly disagree
0
10
20
30
40
50
strongly agree
agree neither disagree strongly disagree
Per
cent
age
of r
espo
nden
ts
Source: 2009 Irrigators survey.

32
the Far West NSW
■■ The ratio of water entitlement
to EFT employee was 409
megalitres per EFT employee.
The statewide ratio was 136
megalitres per EFT employee
■■ Figure 14 shows the water
users’ responses to the
statement ‘The water sharing
plan has made or will make a
lot of difference to water use in
this catchment.’
Detailed reports of the 2006 and
2009 surveys are available at the
NSW Office of Water web site
www.water.nsw.gov.au
Figure 14 2009 Survey responses to the statement ‘The water sharing plan has made or will make a lot of difference to water use in this catchment.’
0
10
20
30
40
50
strongly agree
agree neither disagree strongly disagree
Western CMA
Statewide (weighted) results
0%
10%
20%
30%
40%
50%
strongly agree
agree neither disagree strongly disagree
0
10
20
30
40
50
strongly agree
agree neither disagree strongly disagree
0%
10%
20%
30%
40%
50%
strongly agree
agree neither disagree strongly disagree
0
10
20
30
40
50
strongly agree
agree neither disagree strongly disagree
Source: 2009 Irrigators survey.
Per
cent
age
of r
espo
nden
ts
For more details visit the NSW Office of Water’s website www.water.nsw.gov.au
Image courtesy of neal Foster

Environmental flow response and socio-economic monitoring | Far West NSW - progress report 2011
33
What Ecological monitoring is plannEd for 2011-12?
unregulated rivers water
sharing plans
The NSW Office of Water continues
to monitor a range of water quality
parameters within streams of the
Far West including the Barwon-
Darling, Narran, Bokhara, Birrie,
Warrego and Paroo rivers under
the statewide and Intersecting
Streams water quality programs.
Ongoing monitoring of instream pool
hydrology and ecology will provide
valuable information to better explain
the environmental water need of
these systems and so inform the
development and review of water
sharing plans.
groundwater water sharing plans
The NSW Office of Water continues
to monitor water usage, wastage,
savings, pressure, flow, temperature
and quality in the Great Artesian
Basin Groundwater Sources.
What socio-Economic monitoring is plannEd for 2011-12?The third of the planned series of irrigator surveys was undertaken in 2010, targeting the water users surveyed in 2006. The results will be compared against the benchmark surveys, and will be used to report against the water sharing plans’ performance reporting requirements. The report on the 2010 survey will be released in 2011.
To assist in the socio-economic assessment of changes at the water sharing plan level, the NSW Office of Water will be purchasing from Australian Bureau of Statistics customised agricultural census data, reported by water sharing plan water source areas.
What’s plannEd for futurE WatEr sharing plans?Four additional water sharing plans covering the Far West are currently being developed for the:
■■ Barwon-Darling Unregulated and Alluvial Water Sources
■■ Intersecting Streams Unregulated and Alluvial Water Sources
■■ Murray-Darling Basin Fractured Rock Groundwater Sources
■■ Murray-Darling Basin Porous Rock Groundwater Sources.
futurE priority nEEds for Ecological monitoring and Evaluation activitiEs in thE far WEstIn accordance with the Macro Water Sharing Plans - the approach for unregulated rivers. Report to assist community consultation, 2nd Edition (DWE 2009; available at www.water.nsw.gov.au), high-priority water sources are identified as being at high risk to instream environmental value by water extraction.
During the development of the Water Sharing Plan for the Intersecting Streams Unregulated and Alluvial Water, no water sources were identified as potentially high-priority water sources. However, this may change as a result of further consideration by the Regional Panel covering this plan area.
monitoring plans for 2011-12

34
the Far West NSW
Want morE information?Further information on water sharing plans and socio-economic
assessment is available at www.water.nsw.gov.au
go to Water Management > Monitoring.
rEfErEncEsBoys, CA, Esslemont, G & Thoms, M 2005, Fish habitat assessment and protection in the Barwon Darling River. Report to the Department of Agriculture, Fisheries and Forestry, Australia. NSW Department of Primary Industries, Port Stephens.
Brennan, S, O’Brien, M, Thoms, M & Maher, S 2002, The physical character and flow criteria for wetlands along the Barwon Darling River, Report to the Department of Land and Water Conservation. CRC for Freshwater Ecology, Canberra.
Dunn, H 2000, ‘Identifying and protecting rivers of high ecological value’, Occasional Paper No. 01/00. Land and Water Resources Research and Development Corporation, Canberra.
Foster, N 1999, A preliminary assessment of the commence to fill requirements of wetlands of the Lower Namoi Valley. NSW Department of Land and Water Conservation, Tamworth.
Mitrovic, SM & Gordon, A 1998, Barwon-Darling Riverwatch. Algae and Water Quality Report 1992-1997. Department of Land and Water Conservation, Sydney.
Mussared, D 1997, Living on Floodplains. CRC for Freshwater Ecology and Murray-Darling Basin Commission, Canberra.
Image courtesy of neal Foster