environmental funding by european foundations … · environmental funding by european foundations...
TRANSCRIPT

NOVEMBER 2013 VOLUME 2
ENVIRONMENTALFUNDING BY EUROPEAN FOUNDATIONS

AUTHORS:
Jon Cracknell, Goldsmith Family Philanthropy
Marilena Vrana, EFC
Petros Theodorou, EFC
The European Environmental Funders Group (EEFG)
is a thematic network of the European Foundation
Centre: www.efc.be/environment
Date of publication: November 2013
Copyright © European Foundation Centre
All rights reserved. No part of this publication may be
reproduced, stored in or introduced into a retrieval
system without the prior permission of the copyright
owners.
This publication was made possible with generous
support from Fondazione Cariplo, MAVA Foundation,
Oak Foundation and Stiftung Mercator.
The authors and the EFC would like to thank all funders
who provided insights and data for this project.
A special thanks to Jock Martin and Cathy Maguire
at the European Environment Agency in Copenhagen
who also provided valuable advice and guidance.
This publication is printed on 100% wood-free,
chlorine-free paper using vegetable-based inks. →
European Foundation Centre, AISBL
Philanthropy House, rue Royale, 94
1000 Brussels, Belgium
t +32.2.512.8938 [email protected] www.efc.be
ACKNOWLEDGEMENTS

3
EN
VIR
ON
MEN
TAL
FUN
DIN
G B
Y E
URO
PEA
N F
OU
NDA
TIO
NS
Setting the context ...........................................................................................................................................................................4
Executive summary ..........................................................................................................................................................................5
Methodology ......................................................................................................................................................................................7
Total philanthropic funding ............................................................................................................................................................8
Thematic focus ..................................................................................................................................................................................9
Geographical distribution of grants........................................................................................................................................... 13
Global resource security .............................................................................................................................................................. 21
Issues for foundations to consider ............................................................................................................................................ 23
Forward momentum ...................................................................................................................................................................... 24
Annex I: Foundations covered in the mapping ........................................................................................................................ 25
Annex II: Environmental funding – Thematic issues taxonomy .......................................................................................... 26
Annex III: Data on environmental concern and action across EU Member States ......................................................... 28
Annex IV: Additional resources .................................................................................................................................................. 31
CONTENTS

by Connie Hedegaard, European Commissioner
for Climate Action
Today Europe is facing three crises simultaneously.
Firstly, we are still suffering an economic and fiscal
hangover from the global financial crisis that started in
2008. Secondly, because of the economic downturn we
have a social and jobs crisis, with record unemployment
in the Eurozone. And thirdly, we face a crisis caused by
the impact a growing world population is having on the
global environment – not least the climate system. This
third crisis is also a resources crisis. According to the
UN, also due to population growth by 2030 the world
will need at least 30% more water, 45% more energy
and 50% more food. Yet climate change and the
environment’s natural limits are more likely to constrain
the supply of these resources than expand them.
We have to address these three crises together. And
there are clear synergies to be exploited by tackling
them in a coherent way. Investing in a resource-
efficient, low-carbon society is a huge opportunity to
generate green growth and jobs while modernising our
economy and stimulating innovation.
We are already seeing the employment benefits of
Europe’s climate and energy targets for 2020. In
the space of five years, our renewables sector has
already created 300,000 additional jobs. And fully
implementing all the energy efficiency measures
available to us today has the potential to create or
preserve two million jobs in construction and other
sectors across Europe.
SETTING THE CONTEXT
Building a low-carbon society is not only an environmental
necessity but an economic one too. Last year the EU’s
import bill for fuel and electricity reached €546 billion,
equivalent to the combined GDP of Finland, Hungary,
Portugal and Slovakia. By starting to decarbonise
our economies now we could cut our greenhouse gas
emissions 80% by the middle of the century, halve
our energy import bill, and reduce overall energy
consumption by a third. With the transition to a low-
carbon economy likely to cost around €270 billion a year
in extra investment up to 2050, it’s clear the bulk will
have to come from private business. But I see two areas
where philanthropic funding can make a real difference.
First, in funding think-tanks and political research
organisations that can help make policy more effective
by introducing new ideas and proposals into the
public debate. The European Climate Foundation and
the Mercator Research Institute on Global Commons
and Climate Change are two such examples. We need
more of them.
Secondly, there is a clear role for philanthropy in filling
gaps in scientific and technological research. The Bill
and Melinda Gates Foundation is doing this in the area
of health. It would be great to see more initiatives
funding scientific research into potential climate-related
solutions that may have been overlooked by other
finance providers. By showing how things stand today,
this report provides a useful basis for philanthropic
donors to look at where to direct their future funding.
Lastly, I would also like to see more philanthropic
funding for communication and awareness-raising
initiatives. Inspiring people, and particularly the young,
to take action in their everyday lives is a vital part of
the fight against climate change.
5
EN
VIR
ON
MEN
TAL
FUN
DIN
G B
Y E
URO
PEA
N F
OU
NDA
TIO
NS
This report represents the most comprehensive study
to date into the support for environmental initiatives
provided by European foundations. It builds on earlier
reports by the European Foundation Centre, significantly
expanding the number of foundations being studied, and
the total value of environmental grants being coded.1
The long term goal is to establish as detailed a picture as
possible of the state of European independent funding
for environmental issues with a view to raising the
profile of environmental funders, better supporting their
information needs in this field, improving coordination,
and providing analysis that informs discussion of
effectiveness in environmental grantmaking.
The report features a detailed analysis of the
environmental grants of 62 European public benefit
foundations, as compared to 27 in the previous edition.
These 62 foundations include many of Europe’s largest
providers of philanthropic grants for environmental
initiatives, although there are undoubtedly additional
foundations that could be included in a report of this
kind. It should be noted that only foundations that
have a defined environmental programme or mission
were contacted for this project. The report focuses
on the 2011 calendar year as this is the latest year for
which comprehensive grants data could be obtained
for all 62 foundations.
KEY FINDINGS:
• In 2011 the 62 foundations covered in the study
provided 1,956 environmental grants, amounting
to €417.7 million. Whilst the amount dedicated to
environmental grants looks like a significant amount
of money at first sight, in reality it only represents a
small share of total European philanthropic giving,
which is estimated to be between €83 billion and
€150 billion per year.
• Comparisonof thegrantsmadeby23 foundations
that have featured in both editions of this research
shows a significant growth in the volume of
EXECUTIVE SUMMARY
grants being made in recent years, with the total
environmental grant-making of these 23 foundations
having climbed from €165.1 million to €287.7 million,
an increase of 74.1%.
• The thematic issue category receiving the most
funding was ‘Biodiversity & species preservation’,
accounting for 24.2% of grants by value. When this
is combined with ‘Terrestrial ecosystems & land use’
(12.3%) these two ‘natural environment’ categories
together account for more than a third of the value
of all grants given (€152.5 million).
• Philanthropic funding for tackling climate change
represents 26.3% of all grants made by value
(€110 million) when grants for work on 'Energy'
and 'Transport' are added to those for 'Climate &
atmosphere'. The value of philanthropic funding
directed towards other ‘systemic’ drivers of
environmental damage, such as consumption,
finance, or trade policy, remains very low. It appears
that environmental funders in Europe continue to
have little appetite for grappling with such issues,
even though they threaten to undermine progress
made on other topics.
• Lookingatthegeographicaldistributionofthegrants
being made, 82.6% of the total funding went to
organisations headquartered in Europe, and 10.6%
to organisations based in North America. However,
under 70% of the total funding directly benefitted
initiatives in either Europe or North America and
significant amounts of funding were re-directed
to other parts of the world. What is striking is that
just over 10% of the grants by value were directed
to organisations based in the US where there is a
domestic environmental philanthropy sector making
an estimated $2.8 billion of grants per year.2
• Looking at the EU country level, grants from
European foundations remain very unevenly
1 Marilena Vrana & Jon Cracknell, "Environmental Funding by European Foundations: A Snapshot", European Foundation Centre, September 2011.
2 Environmental Grantmakers Association, "Tracking The Field, Volume 4: Analyzing Trends in Environmental Grantmaking", EGA, New York, September 2013.

distributed. Aggregated data on public concern and
willingness to act on environmental issues reveals
that nine Central and Eastern European countries
are among the 12 Member States scoring below
the EU average. The 62 foundations whose grants
are analysed in this report provide little support to
initiatives in these countries. It could be argued that
European funders ought to play a more proactive
role in helping to build up environmental awareness
and civil society capacity across the whole of the
EU, so as to help raise the overall ambition level of
policymaking, with benefits for the country in which
they are based.
• Given that more than 80% of European
environmental legislation is developed at EU level,
it remains striking that less than 4% of the grants in
the study were explicitly directed towards advancing
European policies. It would appear that European
environmental foundations are missing important
opportunities to try and shape the agenda within the
EU institutions.
• Looking at environmental philanthropy on the
other side of the Atlantic, there are similarities but
also important differences. Average grant sizes
are almost three times larger in Europe than in
the US. Thematically, while ‘Biodiversity & species
preservation’ receives the largest share of grants
by value in Europe, in the US the top thematic
category is ‘Energy’, accounting for 18.3% of grant
dollars. When ‘Energy’ is combined with ‘Climate &
atmosphere’ and ‘Transport’ the comparative figures
are broadly similar on both sides of the Atlantic,
but in the US the emphasis lies more with work on
‘Energy’ and in Europe with work relating to ‘Climate
& atmosphere’. Systemic issues like ‘Consumption &
waste’, or ‘Trade & finance’ are largely ignored by
trusts and foundations in both Europe and the US.
• Comparingthegeographicaldistributionofgrants,it
appears that US foundations direct a larger share of
their grants towards projects on their own continent
(77.2%) than European foundations do (65.1%).
An exchange of philanthropic resources between
the two continents is also evident but European
foundations direct more funds to the US (€17million)
than vice versa (€5.5 million towards Europe).
• Environmental initiatives inNorthAmerica receive
191 times as much philanthropic support (on a per
capita basis) as those in Asia. Support to European
initiatives is 39 times greater (per capita) than for
those in Asia.
It is hoped that this second research report will inspire
and encourage more funders to share their data and
contribute to developing a more complete picture of the
state of environmental funding by European foundations.
More data and analysis of this kind is unlikely to make
environmental funders less effective, indeed it might well
be a catalyst for more targeted and strategic giving.
7
EN
VIR
ON
MEN
TAL
FUN
DIN
G B
Y E
URO
PEA
N F
OU
NDA
TIO
NS
This publication was compiled by gathering grants level
data from a select group of public benefit foundations
from EU and European Free Trade Association (EFTA)
countries. A list of 170 foundations that appear to be
active in environmental issues was developed through
desktop research and in consultation with Donors and
Foundations Network in Europe (DAFNE) members.
Funders were contacted by email with a request to
submit their most recent, complete list of grants for
one fiscal year, in the language and currency in which
it was available. This data provided by foundations
was complemented by grants lists for English &
Welsh foundations sourced from annual reports
on the Charity Commission’s website. Foundations
were included in the analysis if they made more than
£250,000 (€288,175) in environmental grants in 2011,
although this condition was relaxed for foundations
based in Central and Eastern Europe.3 The complete
list of foundations is available in Annex I.
The grants analysed were made in 2011. Some
foundations use accounting periods based on the
calendar year, while others, particularly in the UK,
tend to straddle the calendar year. Grants from UK
foundations using the UK’s standard 2011/12 financial
year (April 2011 – March 2012) have been aggregated
together with calendar year 2011 grants from
continental foundations.
METHODOLOGY
Gathering grants-level data from foundations at the
European level represents a huge challenge, for a
number of reasons:
• Grants-level data arenot easily available, as there
are few mandatory public reporting requirements
across Europe. While many foundations now publish
detailed annual financial statements on their
websites, complete grants lists are still rare.
• Mostdata is availableonly in theofficial language
of the country in which a foundation is registered;
this represents both a translation and conceptual
challenge.
• There is tremendous diversity of legal and
organisational forms of public benefit foundations
across Europe, due to different cultural, historical
and legal traditions.4 This makes it difficult to identify
and engage the relevant actors.
• There is no clear consensus among European
foundations, or even the foundations within a
single country, on what constitutes ‘environmental
funding’. For example, a foundation that defines
itself as focusing on research might not consider
itself to be an environmental funder, even if some of
its grants would qualify for inclusion in this report.
3 Annual average exchange rates have been used to convert currencies throughout the report, with the annual average relating to the financial period in question.
4 The EFC defines public benefit foundations as purpose-driven, asset-based, independent and separately constituted non-profit entities: http://www.efc.be/programmes_services/resources/Documents/EFS_brochure_2012_FINAL.pdf

The 62 foundations that are the focus of this report made
1,964 environmental grants in 2011, amounting to €433.4
million. After taking into account a number of instances
of re-granting, the remaining 1,956 grants amount to
a total of €417.7 million.5 The number of grants being
analysed in this report has more than doubled compared
to the previous research (1,956 compared to 791) as
has the total value of grants (€417.7 million compared
to €181.5 million). The breakdown in expenditure across
thematic issues and geographies that are provided below
are therefore based on a stronger data-set than those
provided in the previous report, but they are still not
completely comprehensive since there is no definitive
list of all the environmental foundations in Europe, and
there are without doubt additional foundations that
could have been included in this research. Readers are
encouraged to treat this report as another stepping stone
towards a comprehensive understanding of European
environmental philanthropy.
Whilst €417.7 million may look like a lot of money at
first sight, in reality it represents a small share of total
TOTAL PHILANTHROPIC FUNDING
5 Grants made to other foundations in the group of 62 and subsequently re-granted were removed from the total used for analysis.
6 "Feasibility Study on a European Foundation Statute", 2009, http://ec.europa.eu/internal_market/company/docs/eufoundation/feasibilitystudy_en.pdf
7 ACRI, Associazione di Fondazioni e di Casse di Risparmio Spa, "Diciassettesimo Rapporto Sulle Fondazioni Di Origine Bancaria", 2011.
KEY FINDINGS:•62 foundations• 1,956 grants•€417.7 million granted for
environmental work•Averagegrantsize:€213,526•Mediangrantsize:€28,818
European foundation giving, which is estimated to be
at least €83 billion per year, and possibly as much as
€150 billion per year.6
In the previous report it was estimated that environmental
grants represented just 16% of the total grantmaking of
the foundations being studied. In the UK, environmental
grants represent less than 3% of total charitable trust
giving, in Italy they are estimated to account for 2.5% of
total philanthropy7, and in the US it is estimated that they
are just under 6% of total foundation giving.8
The average grant size for the 1,956 grants reviewed
was €213,526 (a little lower than in the previous report,
where it stood at €229,404), but the median grant size
was just €28,818 (considerably lower than in the previous
report where it was €50,085). It is clear that some of the
foundations added to the data-set in this edition are making
large numbers of relatively small grants.
A small number of large grants account for a significant
share of the total expenditure, with the 10 largest grants
accounting for 31.4% of the money given, down from
40% in previous report. This pattern is not an unusual
one when analysing the funds provided by a set of trusts
and foundations. Grant sizes ranged from more than
€28.5 million down to just €58, and the total value of
environmental grants made by the 62 foundations also
varied hugely.
Additionally, average grant sizes for each foundation
showed significant variation, from €3.9 million to
just €3,273. The average grant size for 36 of the
62 foundations was under €100,000, with half of the
foundations in the study having an average grant size
of less than €63,000.
8 Environmental Grantmakers Association, "Tracking the Field, Volume 3: Exploring Environmental Grantmaking", New York: Environmental Grantmakers Association, 2012.
9 ‘Trade & finance’ has been left out of this comparison because the average grant size in that category was distorted by the one very large grant referred to in the text.

9
EN
VIR
ON
MEN
TAL
FUN
DIN
G B
Y E
URO
PEA
N F
OU
NDA
TIO
NS
No. of Average % of all No. of Thematic Issue grants Value in € grant in € grants foundations
Biodiversity & species 383 100,951,662 263,581 24.2 39
Climate & atmosphere 125 59,656,154 477,249 14.3 25
Terrestrial ecosystems 207 51,500,392 248,794 12.3 37
Coastal & marine 108 38,390,901 355,471 9.2 22
Energy 365 32,697,224 89,581 7.8 40
Fresh water 54 26,117,148 483,651 6.3 19
Trade & finance 29 25,784,002 889,104 6.2 12
Multi-issue work 151 20,707,073 137,133 5.0 36
Agriculture & food 261 19,959,886 76,475 4.8 26
Transport 54 17,620,291 326,302 4.2 17
Sustainable communities 166 11,703,391 70,502 2.8 24
Toxics & pollution 20 6,303,440 315,172 1.5 11
Consumption & waste 33 6,265,616 189,867 1.5 20
TOTALS 1,956 417,657,180 n/a 100.0 n/a
As in the previous report, the programmatic priorities
of the 62 foundations were explored by coding the
1,956 grants into 13 thematic issue categories. Annex II
of this report provides descriptions of the categories,
which were developed in 2008 in a collaborative
process involving environmental grantmaking
networks in Australia, Canada, the US and the UK,
in addition to the EFC. Table 1 shows how grants are
distributed across the categories.
In a change from the previous edition of this research,
the category receiving the most funding is now
‘Biodiversity & species preservation’, accounting for
24.2% of grants by value. When this is combined with
‘Terrestrial ecosystems & land use’ these two ‘natural
environment’ categories together account for more
than a third of all grants given by value.
‘Climate & atmosphere’ has climbed from fourth place in
the previous report to second this time. Together with
‘Energy’, and ‘Transport’ it accounts for 26.3% of all
grants made. This is a rough indication of the proportion
of funding available to tackling climate change.
The small sums of money directed to what might be
termed ‘systemic drivers’ of environmental damage,
THEMATIC FOCUS
TABLE 1: ENVIRONMENTAL GRANTS BROKEN DOWN BY THEMATIC ISSUE CATEGORY
such as consumption, finance, and trade policy remain
striking. The ‘Trade & finance’ figures in the table
below were massively boosted by one very large grant
that supports local economic development projects.
This masks the fact that in relative terms very little
funding is being directed towards work on trade policy
and financial flows. Meanwhile the ‘Consumption &
waste’ category remains stuck at the bottom of the
table, as in the previous report, receiving just 1.5% of
grants by value. Foundations in Europe continue to
have little appetite for grappling with such systemic
issues, even though they threaten to undermine all
the other work being supported. Foundations are well-
placed to help accelerate progress in tackling these
challenges, given their ability to fund innovation and
to take risks, but doing so will require them to move
out of their current ‘comfort zones’.
The average grant sizes in Table 1 vary considerably from
one category to the next, ranging from €483,651 in the
‘Fresh water’ category down to €70,502 in ‘Sustainable
communities’.9 Indeed ‘Sustainable communities’,
‘Agriculture & food’ and ‘Energy’ are all characterised
by receiving relatively large numbers of grants, but
with average grant sizes comfortably below €100,000.

TABLE 2: COMPARISON OF ENVIRONMENTAL GRANT-MAKING BY 23 FOUNDATIONS, 2008/09 TO 2011
This reflects the fact that these issues are an important
focus for what might be termed ‘domestically focused’
foundations, those that only fund within the country in
which they are located, and which tend to support lots
of relatively small and localised projects. By contrast
categories such as ‘Climate & atmosphere’, ‘Coastal
& marine’, and ‘Transport’ tend to be supported by
foundations with a much more international outlook, and
who are more concerned about changing policy but appear
to be less interested in demonstrating good practice on
the ground. Both types of activity are of course needed
in order to move the environmental agenda forwards,
but the understanding of what constitutes ‘effective’
environmental grant-making will be very different within
these different types of foundations.
HOW HAS EUROPEAN ENVIRONMENTAL
PHILANTHROPY CHANGED IN RECENT YEARS?
A total of 23 foundations provided grants-level data
for both editions of this report, which means that
their environmental grant-making can be compared
from 2008/09 to 2011. Because of a methodological
change in the way that grants from UK trusts and
foundations are used in this research the comparison
covers two financial years for non-UK foundations,
and three financial years for UK foundations within
the group of 23.
As the table below shows, there has been a significant
growth in the volume of grants being made by the
23 foundations in recent years, with their total
environmental grant-making having increased from
€165.1 million to €287.7 million, an increase of 74.1%,
while the number of grants increased from 733 to 889.
A total of 18 out of the 23 foundations increased their
environmental grant-making between 2008/09 and
2011, in one case ten-fold, and in another by a multiple of
six. Five other foundations more than doubled the value
of the grants they are making to environmental causes.
This growth in activity is to be greatly welcomed, given
the scale of the environmental challenges that societies
around the world are facing.
Table 2 also shows some important changes in
thematic breakdowns for the aggregated grants of
the 23 foundations. Expenditure on ‘Trade & finance’
is distorted by the one very large grant mentioned
previously. Aside from this, the thematic issue
2008/09 2011
Value % of all No. of Value % of all No. of Thematic Issue in € grants grants in € grants grants
Biodiversity & species 24,495,326 14.8 109 68,188,926 23.7 123
Climate & atmosphere 22,466,023 13.6 103 46,777,656 16.3 78
Coastal & marine 19,807,891 12.0 47 32,868,580 11.4 60
Trade & finance 1,666,072 1.0 17 24,660,944 8.6 14
Terrestrial ecosystems 27,385,648 16.6 104 24,730,522 8.6 73
Energy 10,558,531 6.4 82 23,120,268 8.0 223
Transport 3,887,361 2.4 22 17,411,661 6.1 38
Multi-issue work 28,809,937 17.5 52 17,637,062 6.1 59
Agriculture & food 12,768,058 7.7 111 16,872,039 5.9 120
Sustainable communities 3,245,520 2.0 38 5,031,621 1.7 58
Toxics & pollution 5,156,690 3.1 20 4,793,551 1.7 10
Fresh water 4,555,893 2.8 23 4,320,671 1.5 23
Consumption & waste 253,402 0.2 5 1,304,754 0.5 10
TOTALS 165,056,352 100 733 287,718,254 100 889

11
EN
VIR
ON
MEN
TAL
FUN
DIN
G B
Y E
URO
PEA
N F
OU
NDA
TIO
NS
categories that have gained the most in percentage
terms are ‘Biodiversity & species preservation’,
‘Transport’, ‘Climate & atmosphere’ and ‘Energy’. The
fact that the total value of grants made to a given
thematic issue has increased (or decreased) does not
necessarily mean that foundations have been changing
the mix of thematic issues within their grant portfolios.
It may simply reflect the fact that a foundation that
is active on a given thematic issue has increased its
overall level of environmental grantmaking. The
changes to the percentage breakdowns across the 13
thematic categories are nonetheless important, and
they are captured visually in Chart 1 above.
COMPARISON OF U.S. AND EUROPEAN
ENVIRONMENTAL PHILANTHROPY –
THEMATIC ISSUES
The publication of the fourth volume of "Tracking the
Field" by the US Environmental Grantmakers Association
(EGA) makes it possible to compare European
environmental philanthropy with the grants made by
the 200+ foundations that are members of EGA.10 In
2011 EGA member foundations made environmental
grants worth $1.13 billion (€813.4 million), accounting for
approximately 40% of US environmental philanthropy,
the total value of which is estimated to be $2.8 billion
per year. Table 3 (overleaf) compares grants from EGA
members to those from the 62 foundations that are the
focus of this report.
The table reveals important differences in
environmental philanthropy on the two sides of the
Atlantic. While ‘Biodiversity & species preservation’
received the greatest share of grants by value from
the European foundations (24.2%) in the US the top
thematic category is ‘Energy’, which accounts for 18.3%
of grants by value. The other ‘natural environment’
categories in the table receive broadly similar or
increased shares of support from US foundations,
with ‘Terrestrial ecosystems & land use’ accounting
CHART 1: ANNUAL PERCENTAGE OF ENVIRONMENTAL GRANTS FOR VARIOUS THEMATIC ISSUES, 2008/09 (LIGHT BLUE) VERSUS 2011 (DARK BLUE)
10 Environmental Grantmakers Association, "Tracking The Field, Volume 4: Analyzing Trends in Environmental Grantmaking", EGA, New York, September 2013.
Biodiversity & species
Climate & atmosphere
Coastal & marine
Trade & finance
Terrestrial ecosystems
Energy
Transport
Multi-issue work
Agriculture & food
Sustainable communities
Toxics & pollution
Fresh water
Consumption & waste5% 10% 15% 20%

TABLE 3: COMPARISON OF THEMATIC ISSUE FOCUS FOR EUROPEAN AND AMERICAN ENVIRONMENTAL FOUNDATIONS
for approximately 12% of grants on both sides of the
Atlantic, and US funders spending relatively more on
both ‘Coastal & marine’ ecosystems and on ‘Fresh
water’ than their European counterparts.
When ‘Energy’ is combined with ‘Climate &
atmosphere’ and ‘Transport’ the comparative figures
are 26.3% for Europe, and 29.6% in the US. These
are broadly similar, but in the US the emphasis lies
more with work on ‘Energy’ and in Europe with work
relating to ‘Climate & atmosphere’.
As with the European foundations, there appears to
be little appetite on the part of US foundations for
grappling with systemic issues like ‘Consumption &
waste’ or ‘Trade & finance’. These overarching issues
are largely ignored by trusts and foundations.
Finally, in terms of grant sizes, average grant sizes are
clearly larger in Europe (at €213,526) than amongst
members of the US EGA (€75,152). There were more
than five times as many grants made by the US
foundations as those in Europe, and this contributes
to the lower average grant size. In practice some of
the largest US foundations make grants that would
definitely be considered large by European standards,
but there are also many US foundations making
relatively small grants.
EUROPE – GROUP OF 62 FOUNDATIONS U.S. EGA
No. of Value % of all No. of Value % of all Thematic Issue11 grants in € grants grants in € grants
Biodiversity & species 383 100,951,662 24.2 1,650 116,617,157 14.3
Climate & atmosphere 125 59,656,154 14.3 575 71,829,767 8.8
Terrestrial ecosystems 207 51,500,392 12.3 1,764 97,488,776 12.0
Coastal & marine 108 38,390,901 9.2 682 90,083,459 11.1
Energy 365 32,697,224 7.8 1,137 149,015,899 18.3
Fresh water 54 26,117,148 6.3 1,213 74,596,392 9.2
Trade & finance 29 25,784,002 6.2 52 3,517,130 0.4
Multi-issue work 151 20,707,073 5 985 56,504,379 6.9
Agriculture & food 261 19,959,886 4.8 880 51,947,069 6.4
Transport 54 17,620,291 4.2 214 20,597,026 2.5
Sustainable communities 166 11,703,391 2.8 478 30,929,799 3.8
Toxics & pollution 20 6,303,440 1.5 304 11,155,767 1.4
Consumption & waste 33 6,265,616 1.5 181 7,497,726 0.9
Environmental health n/a n/a n/a 267 14,855,595 1.8
Indigenous populations n/a n/a n/a 172 7,526,278 0.9
Environmental justice n/a n/a n/a 253 6,546,626 0.8
Population n/a n/a n/a 16 2,666,096 0.3
TOTALS 1,956 417,657,180 100.0 10,823 813,374,940 100.0
11 The EGA had added a number of thematic categories to the 13 that are shared by environmental grantmaking networks in different parts of the world, meaning that US grants are distributed across a larger number of categories than those in Europe.

13
EN
VIR
ON
MEN
TAL
FUN
DIN
G B
Y E
URO
PEA
N F
OU
NDA
TIO
NS
Two different analyses of the geographical
distribution of the grants from the 62 foundations
are provided in this section, the first according
to the location of the grantee organisation, the
second according to where the funds are ultimately
spent. This methodology recognises that grantee
organisations are often based in one place but
aim to affect outcomes in another. For instance,
an EU-based group in the business of protecting
elephants may re-grant some of its revenues to
partner organisations in Kenya; or a Brussels-based
think-tank may direct its energies to influencing
international climate negotiations.
GEOGRAPHICAL DISTRIBUTION OF GRANTS
TABLE 4: GEOGRAPHICAL DISTRIBUTION OF GRANTS MEASURED BY LOCATION OF GRANTEE OFFICES, FOR THE TOP 20 COUNTRIES RECEIVING GRANTS
LOCATION OF GRANTEE ORGANISATION
Grants were coded according to the country where
the grantee organisation is located, so a grant to
Greenpeace International, for example, would be
recorded as a grant to the Netherlands, since the
organisation is headquartered in Amsterdam.
The 1,956 grants from the 62 foundations were
distributed to grantee organisations in 63 different
countries. Table 4 shows the 20 countries receiving
the most funding. The bulk of the funding remains
concentrated in a small number of countries, with the
top three countries, Netherlands, UK, and US, accounting
Country in No. of fdns. % of total Rank in which grantee No. of Value granting to envt. top 20 in Rank is based grants in € country grants 1st edition
1 Netherlands 80 115,462,836 9 27.7 1
2 United Kingdom 823 77,800,293 44 18.6 2
3 United States 77 42,638,714 15 10.2 3
4 Spain 142 33,913,436 9 8.1 Not in top 20
5 Germany 55 26,914,595 7 6.4 7
6 Switzerland 70 22,793,299 9 5.5 13
7 France 86 19,884,709 8 4.8 6
8 Italy 274 19,214,163 8 4.6 4
9 Denmark 45 18,988,144 4 4.6 Not in top 20
10 South Africa 14 8,306,535 11 2.0 8
11 Belgium 66 6,457,774 13 1.6 9
12 Brazil 2 2,948,261 2 0.7 16
13 Belize 9 2,786,628 1 0.7 14
14 Tanzania 1 2,767,605 1 0.7 Not in top 20
15 India 15 2,608,801 5 0.6 12
16 Kenya 22 1,947,793 6 0.5 18
17 Canada 6 1,774,076 5 0.4 10
18 Hong Kong 1 1,267,970 1 0.3 Not in top 20
19 Poland 20 1,129,136 3 0.3 19
20 Austria 3 705,412 1 0.2 Not in top 20
TOTALS 1,811 409,178,079 n/a 98.2 n/a

increasing the share of grants being directed towards
environmental organisations that are located in Europe,
from 76% in the previous report to more than 82% in
this edition. The share going to grantees located in both
North America and Africa has fallen as a consequence.
The fact that a grant is going to an organisation whose
office is based in a particular country or region does
not mean, however, that the activities being funded are
necessarily taking place within that country or region.
LOCATION OF END BENEFICIARY
While it is interesting to explore the geographical
distribution of grants based on the locations of
grantees, it is clear that many environmental
initiatives take place in an international context,
and that the end beneficiaries may not be located
in the same place as the organisation receiving the
funding. With this in mind all the grants in the data-
CHART 2: GEOGRAPHICAL DISTRIBUTION OF GRANTS AT THE CONTINENTAL LEVEL, MEASURED BY LOCATION OF GRANTEE OFFICES
Latin America:€12.6m (3.0%)
Africa:€9.9m (2.4%)
Asia:€5.1m (1.2%)
Oceania:€0.7m (0.2%)
North America:€44.4m (10.6%)
Europe:€345.1m (82.6%)
for more than 56% of the grants by value, and the top
five (adding Spain and Germany) accounting for 71%. As
noted earlier, just over 10% of the grants by value were
directed to organisations based in the US.
The distribution of grants shown in Table 4 is of
course influenced by the composition of the sample
of 62 foundations covered in this report. However
the significant improvement in coverage of the grants
market in this report has not led to a big change in
the countries listed in Table 4, with 15 of the top 20
countries having also featured in the previous edition
of this research. This suggests that the countries
with organisations receiving philanthropic grants for
environmental work are relatively stable.
The inclusion of a wider range of foundations in this
second edition of the research has had the effect of
15
EN
VIR
ON
MEN
TAL
FUN
DIN
G B
Y E
URO
PEA
N F
OU
NDA
TIO
NS
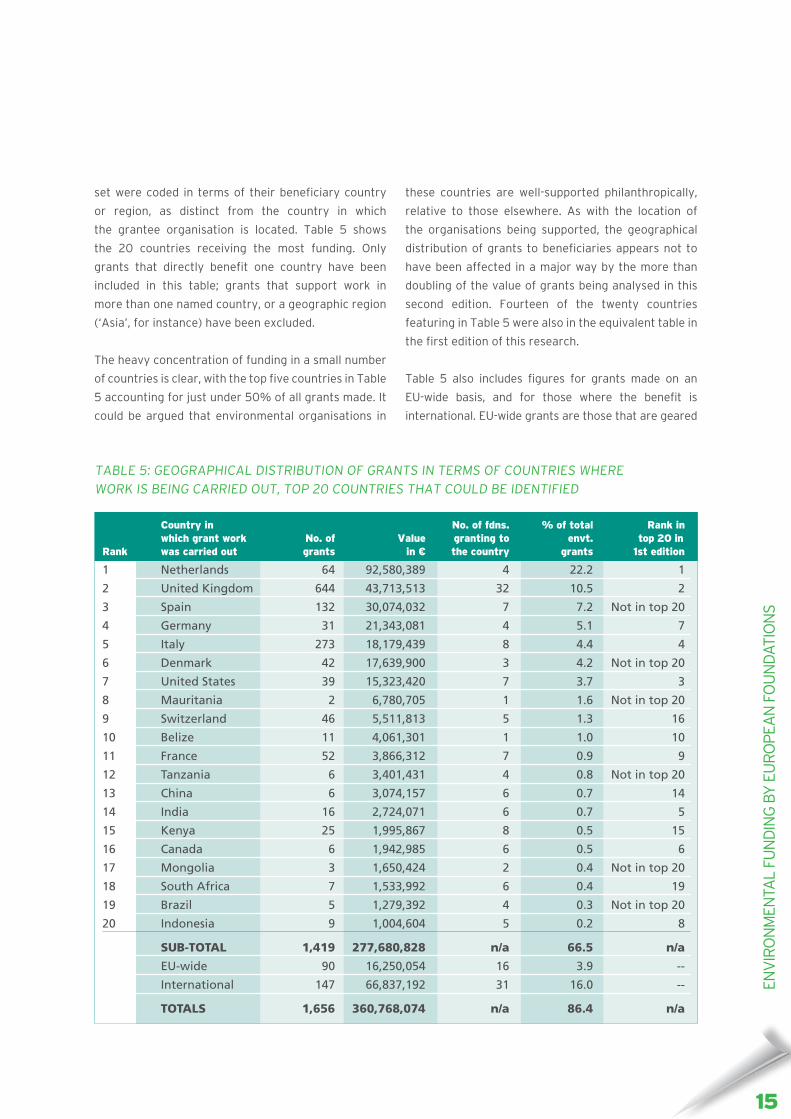
set were coded in terms of their beneficiary country
or region, as distinct from the country in which
the grantee organisation is located. Table 5 shows
the 20 countries receiving the most funding. Only
grants that directly benefit one country have been
included in this table; grants that support work in
more than one named country, or a geographic region
(‘Asia’, for instance) have been excluded.
The heavy concentration of funding in a small number
of countries is clear, with the top five countries in Table
5 accounting for just under 50% of all grants made. It
could be argued that environmental organisations in
these countries are well-supported philanthropically,
relative to those elsewhere. As with the location of
the organisations being supported, the geographical
distribution of grants to beneficiaries appears not to
have been affected in a major way by the more than
doubling of the value of grants being analysed in this
second edition. Fourteen of the twenty countries
featuring in Table 5 were also in the equivalent table in
the first edition of this research.
Table 5 also includes figures for grants made on an
EU-wide basis, and for those where the benefit is
international. EU-wide grants are those that are geared
TABLE 5: GEOGRAPHICAL DISTRIBUTION OF GRANTS IN TERMS OF COUNTRIES WHERE WORK IS BEING CARRIED OUT, TOP 20 COUNTRIES THAT COULD BE IDENTIFIED
Country in No. of fdns. % of total Rank in which grant work No. of Value granting to envt. top 20 in Rank was carried out grants in € the country grants 1st edition
1 Netherlands 64 92,580,389 4 22.2 1
2 United Kingdom 644 43,713,513 32 10.5 2
3 Spain 132 30,074,032 7 7.2 Not in top 20
4 Germany 31 21,343,081 4 5.1 7
5 Italy 273 18,179,439 8 4.4 4
6 Denmark 42 17,639,900 3 4.2 Not in top 20
7 United States 39 15,323,420 7 3.7 3
8 Mauritania 2 6,780,705 1 1.6 Not in top 20
9 Switzerland 46 5,511,813 5 1.3 16
10 Belize 11 4,061,301 1 1.0 10
11 France 52 3,866,312 7 0.9 9
12 Tanzania 6 3,401,431 4 0.8 Not in top 20
13 China 6 3,074,157 6 0.7 14
14 India 16 2,724,071 6 0.7 5
15 Kenya 25 1,995,867 8 0.5 15
16 Canada 6 1,942,985 6 0.5 6
17 Mongolia 3 1,650,424 2 0.4 Not in top 20
18 South Africa 7 1,533,992 6 0.4 19
19 Brazil 5 1,279,392 4 0.3 Not in top 20
20 Indonesia 9 1,004,604 5 0.2 8
SUB-TOTAL 1,419 277,680,828 n/a 66.5 n/a
EU-wide 90 16,250,054 16 3.9 --
International 147 66,837,192 31 16.0 --
TOTALS 1,656 360,768,074 n/a 86.4 n/a

towards EU legislation and policies, such as the Common
Agricultural Policy, or to supporting civil society capacity
across multiple EU countries. A total of 90 grants worth
€16.3 million were made in support of this kind of work.
These figures have grown in absolute terms (reflecting
the increased number of grants analysed for this
report), yet EU-wide grants only account for 3.9% of
all grants made by the 62 foundations, marginally less
than in the previous edition of this research. Given that
at least 80% of European environmental legislation is
framed at the European Union level, it would appear
that European environmental foundations are missing
important opportunities to try and shape the agenda,
and thereby influence both national and international
environmental policy-making.
The increase in the number of foundations covered
by this second report makes it possible to look in
more detail at the extent to which foundations fund
domestically or internationally.
It is clear that the 62 foundations covered in the research
tend to be either ‘domestic’ funders, or ‘international’
funders and that relatively few foundations do a blend
of both domestic and international funding.
Twenty six of the sixty two foundations (42%) direct
more than 80% of their grants to projects in the
countries in which they are located, with 18 foundations
only funding projects in their home country. A further
five foundations were making more than 75% of their
grants to organisations in their home country. At the
other end of the scale are 21 foundations (34%) that
directed less than 20% of their grants to organisations
in the country where they are located, including 11 for
whom less than 1% of their grants supported domestic
activity.12 The internationally oriented funders tend to
be making large grants, with the average grant size
for the 20 foundations that are most internationally-
focused standing at €393,529, compared to €280,798
for the 20 most domestically-focused foundations.
In the fourth edition of the UK counterpart to this
report, "Where the Green Grants Went", a distinction
was made between ‘gift-giving’, ‘thematic’ and
‘advocate’ funders.13 The latter are more focused on
social and political change, and tend to have a more
business-focused approach to philanthropy, staff
with high levels of issue expertise, younger trustees
and donors, and a more ‘hands-on’ and directive
approach towards their grantees. They are also more
internationally-oriented, judging from the analysis
carried out for this report, whereas domestically-
focused funders tend to adopt more of a ‘gift-giving’
or ‘thematic’ approach.
Chart 3 shows the distribution of grants at the
continental level, measured in terms of where end
beneficiaries are located. In the cases in which grants
benefit a wide range of countries, and/or there is no
specific information on how international funds are
being deployed, then the category ‘international’ has
been used, alongside the five continents.
While organisations in Europe and North America
received more than 93% of grants as judged by where
grantee organisations are located (Chart 2), in practice
this funding is often directed to international work,
and less than 70% of the total grants given directly
benefit initiatives in either European countries or
North America. The shares of Africa, Asia, and Latin
America are all higher than those shown in Chart 2 and
to these can be added the 16.1% of grants that support
general ‘international’ work. This covers projects
with global reach, such as conservation work carried
out in a variety of countries, or attempts to influence
international environmental policy.
The share of grants directed towards work within Europe
has increased from 48% in the first edition of this research
to more than 65% as shown in Chart 3. This is a result of
foundations with European-focused grants programmes
having being added to the underlying data-set.
12 The authors recognise that some foundations are constrained in this regard by their mandates or national laws.
13 Jon Cracknell, Heather Godwin & Harriet Williams, "Where the Green Grants Went 4: patterns of UK funding for environmental and conservation work", London: Environmental Funders Network, November 2009, pp. 10-11.

17
EN
VIR
ON
MEN
TAL
FUN
DIN
G B
Y E
URO
PEA
N F
OU
NDA
TIO
NS
CHART 3: GEOGRAPHICAL DISTRIBUTION OF GRANTS AT THE CONTINENTAL LEVEL, MEASURED BY WHERE THE END BENEFICIARY IS LOCATED
Latin America:€22.4m (5.4%)
Africa:€27.6m (6.6%)
International:€67.1m (16.1%)
Asia:€10.8m (2.6%)
Oceania:€0.7m (0.2%)
North America:€17.0m (4.1%)
Europe:€272m (65.1%)
COMPARISON OF U.S. AND EUROPEAN
ENVIRONMENTAL PHILANTHROPY –
GEOGRAPHICAL DISTRIBUTION
Earlier in the report a comparison was made between
the distribution of grants by US and European
foundations to different thematic issues. In this section
comparison is made of the geographic distribution at a
continental level.
The share of grants made by EGA members that
support international work, outside the US, has been
falling in recent years, from 35% in 2009 to 32% in
2010, and then to just 25% in 2011.14
As Table 6 (overleaf) shows, US foundations direct a
larger share of their grants towards supporting projects
on their own continent (North America = 77.2%) than
European foundations do (Europe = 65.1%). Canada and
Mexico account for just 2.4% of the grants from EGA
members, meaning that the remainder of the North
America figure is accounted for projects in the US itself.
It is also clear from Table 6 that there is a net transfer
of philanthropic resources for environmental work from
Europe to North America, at least in terms of the grants
made by the 62 European foundations and by members
of the EGA. Grants from the European foundations to
14 Environmental Grantmakers Association, "Tracking The Field, Volume 4: Analyzing Trends in Environmental Grantmaking", EGA, New York, September 2013.

15 N.B. the figure quoted in the Grants per capita column is not euros per capita of environmental grants, but euros per capita multiplied by 100, so as to make the figures more easily comparable. To arrive at a euros per capita figure the numbers in this column need to be divided by 100, giving a figure of 1.84 euros per capita for North America, 0.37 for Europe, and so on.
TABLE 6: COMPARISON OF GEOGRAPHICAL FOCUS FOR EUROPEAN AND AMERICAN ENVIRONMENTAL FOUNDATIONS
North America amounted to €17 million, while those
from US EGA members to Europe amounted to just €5.5
million. Even allowing for the fact that some Canadian
and/or Mexican foundations may be supporting
environmental initiatives in Europe it seems likely there
is a net transfer of more than €10 million.
The two columns to the right of the table give
combined figures for the European and US EGA grants,
and then a ‘grants per capita measure’. This has been
calculated by dividing the value of the grants to each
continent by the population of that continent, and then
multiplying the result by 100.15 The disparity in the
distribution of grants from European and US funders
is striking. Grants to initiatives in North America are
191 times greater on a per capita basis than those to
Asia, while grants to European initiatives are nearly
39 times greater than those to Asia. These figures are
somewhat preliminary, and readers are encouraged
not to focus too much on the specific numbers, but
rather on the difference in scale.
THE DISTRIBUTION OF GRANTS WITHIN THE EU
The previous report highlighted the marked differences
between countries within Europe with respect to
population size and per capita income, environmental
performance (measured using various indices),
environmental values, and public understanding
of climate change. As Table 7 illustrates, grants
from European foundations remain very unevenly
distributed across the EU, despite the fact that the
EU environmental policy is made via processes that
involve all of the Member States. It could be argued that
European funders ought to play a more proactive role
in helping to build up environmental awareness and civil
society capacity across the whole of the EU, so as to
help raise the overall ambition level of policymaking,
with benefits for the country in which they are based.16
Table 7 shows the value and number of environmental
grants from the 62 foundations that supported activity in
each of the 28 EU Member States, along with the share
of overall EU population represented by each country. As
EUROPE - 62 FOUNDATIONS U.S. EGA EUROPE & U.S. COMBINED
Grants No. of Value % of all No. of Value % of all Total value of per capita Continent grants in € grants grants in € grants grants in € measure15
Africa 134 27,640,662 6.6 339 21,782,338 2.7 49,423,000 4.68
Asia 67 10,793,057 2.6 638 29,770,866 3.7 40,563,923 0.96
Europe 1507 272,029,678 65.1 74 5,525,342 0.7 277,555,020 37.44
Latin America 50 22,391,760 5.4 401 32,636,112 4.0 55,027,872 9.13
North America 44 16,978,229 4.1 8,702 628,061,687 77.2 645,039,916 184.55
Oceania 1 664,458 0.2 58 5,915,006 0.7 6,579,464 17.67
International 153 67,159,336 16.1 611 89,683,589 11.0 156,842,924 n/a
TOTALS 1,956 417,657,180 100 10,823 813,374,940 100 1,231,032,120 n/a
16 The authors recognise that some foundations are constrained in this regard by their mandates or national laws.
19
EN
VIR
ON
MEN
TAL
FUN
DIN
G B
Y E
URO
PEA
N F
OU
NDA
TIO
NS
17 N.B. the figure quoted in column 5 is not euros per capita of environmental grants, but euros per capita multiplied by 100, so as to make the figures more easily comparable.
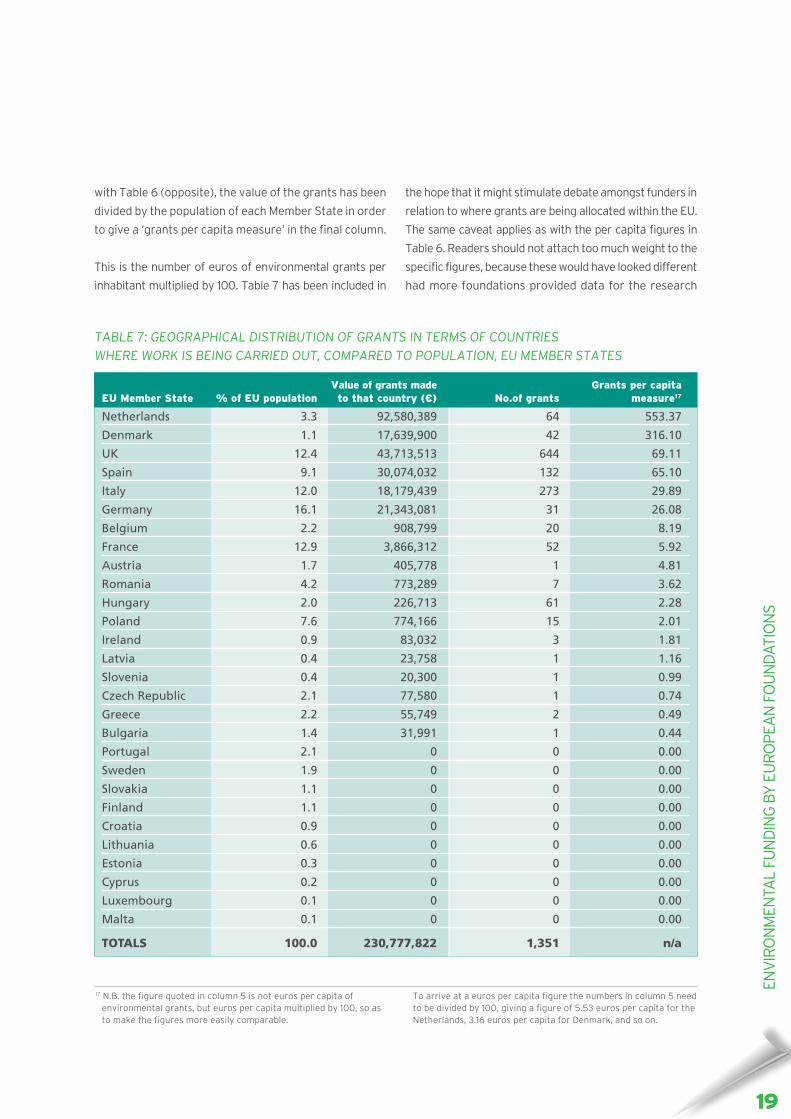
TABLE 7: GEOGRAPHICAL DISTRIBUTION OF GRANTS IN TERMS OF COUNTRIES WHERE WORK IS BEING CARRIED OUT, COMPARED TO POPULATION, EU MEMBER STATES
with Table 6 (opposite), the value of the grants has been
divided by the population of each Member State in order
to give a ‘grants per capita measure’ in the final column.
This is the number of euros of environmental grants per
inhabitant multiplied by 100. Table 7 has been included in
the hope that it might stimulate debate amongst funders in
relation to where grants are being allocated within the EU.
The same caveat applies as with the per capita figures in
Table 6. Readers should not attach too much weight to the
specific figures, because these would have looked different
had more foundations provided data for the research
To arrive at a euros per capita figure the numbers in column 5 need to be divided by 100, giving a figure of 5.53 euros per capita for the Netherlands, 3.16 euros per capita for Denmark, and so on.
Value of grants made Grants per capita EU Member State % of EU population to that country (€) No.of grants measure17
Netherlands 3.3 92,580,389 64 553.37
Denmark 1.1 17,639,900 42 316.10
UK 12.4 43,713,513 644 69.11
Spain 9.1 30,074,032 132 65.10
Italy 12.0 18,179,439 273 29.89
Germany 16.1 21,343,081 31 26.08
Belgium 2.2 908,799 20 8.19
France 12.9 3,866,312 52 5.92
Austria 1.7 405,778 1 4.81
Romania 4.2 773,289 7 3.62
Hungary 2.0 226,713 61 2.28
Poland 7.6 774,166 15 2.01
Ireland 0.9 83,032 3 1.81
Latvia 0.4 23,758 1 1.16
Slovenia 0.4 20,300 1 0.99
Czech Republic 2.1 77,580 1 0.74
Greece 2.2 55,749 2 0.49
Bulgaria 1.4 31,991 1 0.44
Portugal 2.1 0 0 0.00
Sweden 1.9 0 0 0.00
Slovakia 1.1 0 0 0.00
Finland 1.1 0 0 0.00
Croatia 0.9 0 0 0.00
Lithuania 0.6 0 0 0.00
Estonia 0.3 0 0 0.00
Cyprus 0.2 0 0 0.00
Luxembourg 0.1 0 0 0.00
Malta 0.1 0 0 0.00
TOTALS 100.0 230,777,822 1,351 n/a

process, and in particular if those foundations had been
active in countries that currently show low volumes of ‘grants
per capita.’ What would not have changed is the overall
pattern of philanthropic resources for environmental work
being heavily concentrated in a limited number of EU Member
States, with the rest of the countries receiving virtually no
support. Fourteen of the 28 countries in the table (Slovenia
downwards) did not even receive one euro cent per capita
of environmental grants from the foundations considered.
The European Commission carries out regular surveys
of public opinion on environmental issues, through its
"Eurobarometer" series of reports. Over the last three
years a wide range of questions have been posed to
members of the public across the EU. Twenty four of
these questions were selected in order to explore both
levels of environmental concern and awareness, and
also the willingness of individuals to take action on
environmental issues (details are provided in Annex
III). The aggregated responses are shown in Table 8.
The average score for the 24 questions across the 27
EU Member States featured in Table 8 was 46%. Of the
12 Member States scoring less than the average nine are
Central and Eastern European countries which joined the
EU in either 2004 or 2007. In general, little philanthropic
funding seems to be directed towards activity in these
Member States (as shown in Table 7). This is also true for
Ireland, which ranks 21st. Italy and Spain are, however,
anomalies, in that both have relatively high levels of
environmental philanthropy and yet this does not seem
to have translated into strong environmental awareness
or a particular willingness to take action.
It is not surprising that levels of environmental awareness
and concern are lower in many of the new EU Member
States. These are countries which tend to have lower per
capita income than those in Western Europe and which
did not have so much opportunity to develop non-profit
environmental organisations and related civil society
structures until the fall of the Berlin Wall in 1989. There
would appear to be both an opportunity and a need for
European environmental foundations to help strengthen
environmental civil society in these countries so as to
close the gap with the more long-established Member
States of the EU.
TABLE 8: AGGREGATED SCORES OF EU MEMBER STATES IN RELATION TO ENVIRONMENTAL AWARENESS AND ACTION 18
Rank Country Avg. score (%) Rank Country Avg. score (%)
1 Slovenia 51.5 15 Greece 46.6
2 Denmark 51.5 16 Bulgaria 45.5
3 Austria 50.3 17 Italy 44.8
4 Malta 49.7 18 Latvia 44.4
5 Belgium 49.1 19 Poland 44.3
6 Cyprus 49.1 20 Spain 43.3
7 Luxembourg 49.0 21 Ireland 43.2
8= Finland 48.3 22 Lithuania 43.1
8= Sweden 48.3 23 Slovakia 42.5
10 Germany 47.5 24 Hungary 41.8
11 United Kingdom 47.3 25 Czech Republic 41.8
12 Portugal 47.3 26 Estonia 41.1
13 France 46.9 27 Romania 37.9
14 Netherlands 46.7
18 Croatia is not included in this table due to a lack of data for many of the questions.
21
EN
VIR
ON
MEN
TAL
FUN
DIN
G B
Y E
URO
PEA
N F
OU
NDA
TIO
NS
19 Bernice Lee et al., "Resources Futures", Chatham House: London, December 2012.
In addition to thinking about opportunities for
strengthening environmental movements across
Europe, the ongoing shift in financial and geopolitical
power towards countries in the Southern and Eastern
hemispheres deserves consideration. Leading UK
think-tank the Royal Institute of International Affairs
(Chatham House) recently published a major report on
resource security over the coming decades, drawing
on a database that tracks the value of trade in 1,200
different natural resources, and that contains over
12 million data points.19 The report proposes the idea
of an R30 group of countries (similar to the G20),
based on calculations of a country’s current position
in the production, consumption and trade in resources.
The R30 list aims to identify systemically important
producers, consumers, exporters and importers of
natural resources. Table 9 overleaf shows the R30
countries along with the value of grants being made
to each country by the 62 European foundations
covered in this research.
GLOBAL RESOURCE SECURITY
Seven of the countries that Chatham House proposes as
candidates for the R30 group received no grants from the 62
foundations. A further seven received less than €200,000.
Just 94 grants were directed to non-European R30 countries,
and the US accounted for 39 of these. In addition, much of
the funding being directed to these countries is focused
on work that doesn’t directly relate to issues of resource
security, such as species-based conservation, for example.
Of course it can be argued that it is not the responsibility of
European-based philanthropic organisations to help bolster
civil society capacity and/or political ambition around
the world. It is only natural for European foundations to
prioritise grantmaking within Europe. Having said this, the
importance in global decision-making of non-European
members of the R30 group looks certain to increase over
the coming years. Philanthropic capital can be flexible,
nimble and creative, and as such has the potential to
help accelerate change in countries where domestic
philanthropy is at an earlier stage of development.
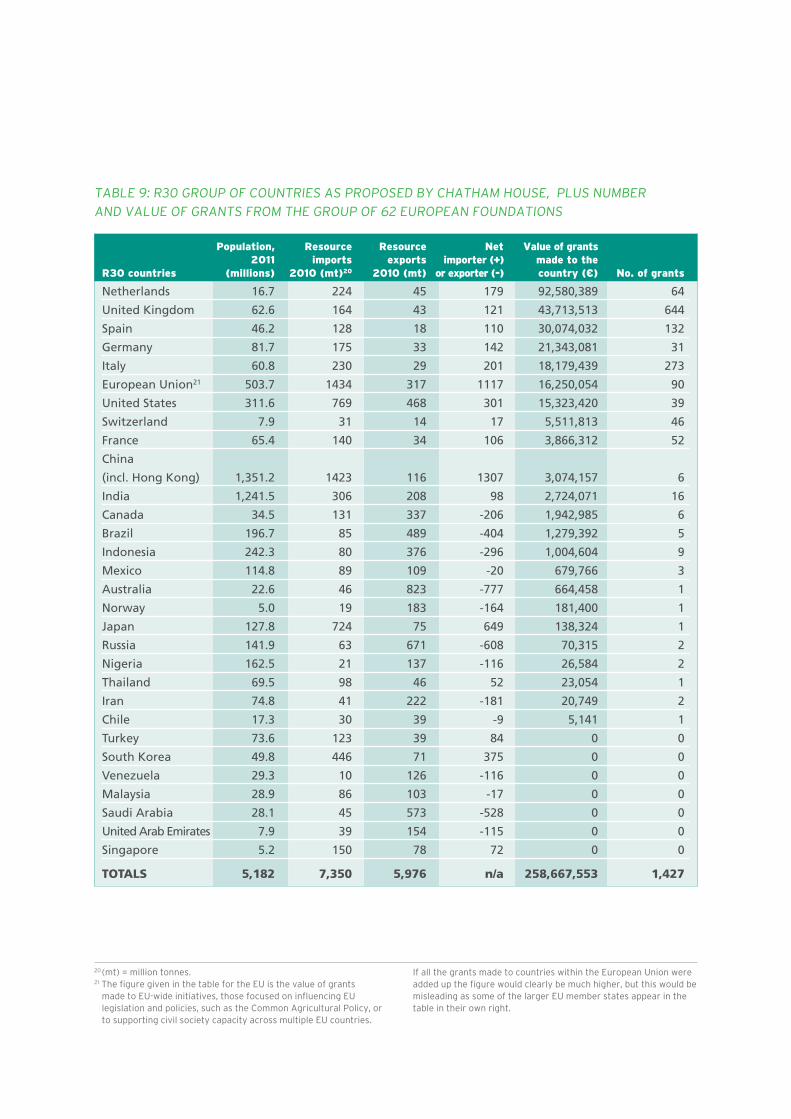
TABLE 9: R30 GROUP OF COUNTRIES AS PROPOSED BY CHATHAM HOUSE, PLUS NUMBERAND VALUE OF GRANTS FROM THE GROUP OF 62 EUROPEAN FOUNDATIONS
Population, Resource Resource Net Value of grants 2011 imports exports importer (+) made to the R30 countries (millions) 2010 (mt)20 2010 (mt) or exporter (-) country (€) No. of grants
Netherlands 16.7 224 45 179 92,580,389 64
United Kingdom 62.6 164 43 121 43,713,513 644
Spain 46.2 128 18 110 30,074,032 132
Germany 81.7 175 33 142 21,343,081 31
Italy 60.8 230 29 201 18,179,439 273
European Union21 503.7 1434 317 1117 16,250,054 90
United States 311.6 769 468 301 15,323,420 39
Switzerland 7.9 31 14 17 5,511,813 46
France 65.4 140 34 106 3,866,312 52
China
(incl. Hong Kong) 1,351.2 1423 116 1307 3,074,157 6
India 1,241.5 306 208 98 2,724,071 16
Canada 34.5 131 337 -206 1,942,985 6
Brazil 196.7 85 489 -404 1,279,392 5
Indonesia 242.3 80 376 -296 1,004,604 9
Mexico 114.8 89 109 -20 679,766 3
Australia 22.6 46 823 -777 664,458 1
Norway 5.0 19 183 -164 181,400 1
Japan 127.8 724 75 649 138,324 1
Russia 141.9 63 671 -608 70,315 2
Nigeria 162.5 21 137 -116 26,584 2
Thailand 69.5 98 46 52 23,054 1
Iran 74.8 41 222 -181 20,749 2
Chile 17.3 30 39 -9 5,141 1
Turkey 73.6 123 39 84 0 0
South Korea 49.8 446 71 375 0 0
Venezuela 29.3 10 126 -116 0 0
Malaysia 28.9 86 103 -17 0 0
Saudi Arabia 28.1 45 573 -528 0 0
United Arab Emirates 7.9 39 154 -115 0 0
Singapore 5.2 150 78 72 0 0
TOTALS 5,182 7,350 5,976 n/a 258,667,553 1,427
20 (mt) = million tonnes.21 The figure given in the table for the EU is the value of grants
made to EU-wide initiatives, those focused on influencing EU legislation and policies, such as the Common Agricultural Policy, or to supporting civil society capacity across multiple EU countries.
If all the grants made to countries within the European Union were added up the figure would clearly be much higher, but this would be misleading as some of the larger EU member states appear in the table in their own right.

23
EN
VIR
ON
MEN
TAL
FUN
DIN
G B
Y E
URO
PEA
N F
OU
NDA
TIO
NS
ISSUES FOR FOUNDATIONS TO CONSIDER
SYSTEMIC CHALLENGES
It is clear from the analysis of grants and thematic
issues that both European and US foundations have
little appetite for grappling with systemic drivers of
environmental damage, such as over-consumption, or the
preoccupation of policymakers with economic growth.
These are difficult issues to tackle, where metrics for
measuring progress are often hard to come by. Work
on these topics often lacks the tangible outcomes that
many grantmakers desire. Yet it is difficult to see how
it will be possible for societies to start living within their
environmental means (on ecological interest rather than
capital) without engaging in this conversation. Should
European foundations come together in a collaborative
manner that embraces these challenges?
DISRUPTIVE CHANGE
Philanthropic capital has particular qualities relative
to other forms of income for civil society. At its best
it can support innovation, be responsive to changing
circumstances, provide continuity, take risks, be
ambitious (in terms of social and political change), and
provide independence to grantee organisations. This
makes it ideal as a source of funding for disruptive
change, whether in social norms, corporate practice,
or government policy. Funding from governments and
corporations (two of the other main sources of income
for civil society environmental organisations) can rarely
be used for this. How can European foundations maximise
their effectiveness as change agents in relation to the
environmental agenda?
WHERE IN THE WORLD?
This report has placed a strong emphasis on the geographical
distribution of grants from environmental philanthropy, both
within Europe, and internationally. It is clear that some
European environmental foundations are constrained in
their ability to fund outside the country in which they are
located, and the attractions of funding domestically are
abundantly clear, not least the ability to keep in touch
with grantees and see the outcomes of projects first-hand.
At the same time the world is changing, and geo-political
power is shifting eastwards and southwards. How should
European foundations respond? How can philanthropy be
best deployed to oil the wheels of civil society in the world’s
emerging markets, whilst at the same time supporting the
development of local philanthropy in these countries?
EUROPEAN AMBITION
The European Union has played an important role in
setting global environmental standards, both formally and
informally. With more than 500 million inhabitants the EU
is an important market for companies around the world.
At least 80% of the domestic environmental legislation
applied in each EU Member State is framed within the
EU institutions. Yet the 62 European foundations whose
grants are analysed in this report seem to have little
interest in working on a pan-European basis, with less
than 4% of their grants supporting pan-European work.
How can European foundations begin to collaborate
more in the future so as to raise the bar for European
environmental policy, directly benefitting not just their
home country but also the EU and beyond?
EXPANDING COVERAGE
The coverage of European environmental philanthropy
in this report is considerably more comprehensive than
in the previous edition, with the number of grants being
coded having more than doubled, and the number of
grants being coded having more than doubled, along with
their value. The hope is that future editions will become
more comprehensive still. To this end the EEFG strongly
encourages readers of this report to recommend additional
foundations that they think ought to be included in future
editions. The EEFG would also like to reiterate its request
to foundations that have not yet been involved in the
research to share their grants data, so that an increasingly
comprehensive resource for the field can be compiled.
DEMAND SIDE MAPPING
The emphasis in this report and in similar publications in the
United Kingdom, United States, Canada and Australia has
been on mapping the ‘supply side’ of the grants market; the
grants coming from foundations engaged in environmental
philanthropy. While this is important, it is also vital that
funders work collaboratively to try and map the ‘demand
side’ of the market, and to understand the capacity of civil
society organisations working on environmental issues in
FORWARD MOMENTUM
different countries around the world. For example, how
many environmental organisations are there in each
Member State of the European Union? How many staff
and how much income do they have? What are the main
sources of their income? What issues and approaches
do they prioritise? Furthermore, what is the relationship
between the availability of resources for environmental
organisations and the quality of environmental policy in
a given country?
ENGAGING DIRECTLY WITH POLICY-MAKING?
Should European environmental foundations come
together to engage directly with EU policymakers
and other stakeholders in relation to the areas of
environmental policy that most interest them? What
other opportunities are there for collaboration around
specific thematic issues? How can funders best take
advantage of being part of a network?
The EEFG provides a venue for these discussions and
more. The network accepts feedback and suggestions
from readers of this report either in respect to the
questions raised within, or in the form of additional
suggestions for the work of the network.

25
EN
VIR
ON
MEN
TAL
FUN
DIN
G B
Y E
URO
PEA
N F
OU
NDA
TIO
NS
ANNEX I: FOUNDATIONS COVERED IN THE MAPPING
Adessium Foundation (Netherlands)Agropolis Fondation (France)Anonymous foundation (Switzerland)Arcadia Fund (UK)Ashden Trust (UK)Calouste Gulbenkian Foundation (UK branch)Children’s Investment Fund Foundation (UK)City Bridge Trust (UK)David Shepherd Wildlife Foundation (UK)Dutch Postcode Lottery (Netherlands)Ernest Cook Trust (UK)Ernest Kleinwort Charitable Trust (UK)Esmée Fairbairn Foundation (UK)European Climate Foundation (Netherlands)Fundación Biodiversidad (Spain)Fondation BNP Paribas (France)Fondation Charles Léopold Mayer pour le progrès de l’Homme (Switzerland)Fondation Ensemble (France)Fondation Lombard Odier (Switzerland)Fondation pour une terre humaine (Switzerland)Fondazione Cariplo (Italy)Fondazione Cassa dei Risparmi di Forli (Italy)Fondazione Cassa di Bolzano (Italy)Fondazione Cassa di Risparmio di Cuneo (Italy)Fondazione Cassa di Risparmio di Padova e Rovigo (Italy)Garfield Weston Foundation (UK)Gatsby Charitable Foundation (UK)Grantscape (UK)HDH Wills 1965 Charitable Trust (UK)Hungarian Environmental Partnership Foundation (Hungary)JJ Charitable Trust (UK)
JMG Foundation (Switzerland)John Ellerman Foundation (UK)Joseph Rowntree Charitable Trust (UK)King Baudouin Foundation (Belgium)Kirby Laing Foundation (UK)"La Caixa" Foundation (Spain)Man Group Charitable Trust (UK)Mark Leonard Trust (UK)Mava Foundation (Switzerland)Mitsubishi Corporation Fund for Europe & Africa (UK)Monument Trust (UK)Network for Social Change (UK)Oak Foundation (Switzerland)People’s Trust for Endangered Species (UK)Realdania (Denmark)Robert Bosch Stiftung (Germany)Rufford Foundation (UK)Shell Foundation (UK)Sigrid Rausing Trust (UK)Sophie and Karl Binding Stiftung (Switzerland)Stichting Fonds 1818 (Netherlands)Stiftung Mercator (Germany)Tellus Mater Foundation (UK)Tubney Charitable Trust (UK)Tudor Trust (UK)Underwood Trust (UK)Velux Foundation (Denmark)Veolia Environmental Trust (UK)Villum Foundation (Denmark)Waterloo Foundation (UK)Whitley Animal Protection Trust (UK)

These ‘thematic issue’ categories were developed in
consultation with the Australian, Canadian, UK, and
American networks of environmental grant-makers,
in order to promote comparability in analyses of
environmental funding patterns. The taxonomy features
13 main thematic categories, each described and further
clarified through a list of keywords and concepts. Feedback
from readers on these categorisations would be welcome.
Agriculture and food:
Includes support for organic and other forms of
sustainable farming; training and research to help
farmers in developing countries; campaigns relating
to the control of the food chain; initiatives opposed
to factory farming; horticultural organisations and
projects; education on agriculture for children and
adults (e.g. city farms); opposition to the use of
genetically modified crops and food irradiation; work on
food safety and on the genetic diversity of agriculture
(including seed banks); and soil conservation.
Biodiversity and species preservation:
Covers work that protects particular species, be they
plant or animal, vertebrate or invertebrate. Included
within this is support for botanic gardens and arboretums;
academic research on botany and zoology; the protection
of birds and their habitats; funding for marine wildlife
such as whales, dolphins and sharks; projects that aim to
protect endangered species such as rhinos and elephants;
and defence of globally important biodiversity hotspots,
including the use of refuges, reserves and other habitat
conservation projects; and wildlife trusts.
Climate and atmosphere:
Includes support for work targeted mainly towards climate
change and some work directed towards the issues of
ozone depletion, acid rain, air pollution and local air
quality.
Coastal and marine ecosystems:
Includes support for work on fisheries; aquaculture;
coastal lands and estuaries; marine protected areas;
and marine pollution (such as marine dumping).
ANNEX II: ENVIRONMENTAL FUNDING: THEMATIC ISSUES TAXONOMY
Consumption and waste:
Includes support for work directed at reducing consumption
levels; initiatives that look to re-define economic growth;
projects on waste reduction, sustainable design and
sustainable production; recycling and composting
schemes; and all aspects of waste disposal, including
incinerators and landfills.
Energy:
Covers work for alternative and renewable energy sources;
energy efficiency and conservation; work around fossil
fuels; hydroelectric schemes; the oil and gas industries;
and nuclear power.
Fresh water:
Includes support for all work relating to lakes and
rivers; canals and other inland water systems; issues of
groundwater contamination and water conservation; and
projects relating to wetlands.
Multi-issue work:
Covers grants which are hard to allocate to specific
categories, generally because the grant takes the
form of core funding to an organisation that works
on a range of different issues, or because the grant
supports environmental media titles or environmental
education projects covering a wide range of issues. In
addition, some grants provided to generalist re-granting
organisations are captured in this category, as it is not
possible to tell which issues will be supported when the
funds are re-granted.
Sustainable communities:
Includes support for urban green-spaces and parks;
community gardens; built environment projects; and
community-based sustainability work.
Terrestrial ecosystems and land use:
Includes support for land purchases and stewardship;
national or regional parks; landscape restoration and
landscape scale conservation efforts; tree planting,
forestry, and work directed to stopping de-forestation;
and the impacts of mining.

27
EN
VIR
ON
MEN
TAL
FUN
DIN
G B
Y E
URO
PEA
N F
OU
NDA
TIO
NS
Toxics and pollution:
Covers all the main categories of toxics impacting on
the environment and human health: hazardous waste;
heavy metals; pesticides; herbicides; radioactive wastes;
persistent organic pollutants; household chemicals; other
industrial pollutants; and noise pollution.
Trade and finance:
Includes support for work on corporate-led globalisation
and international trade policy; efforts to reform public
financial institutions (such as the World Bank, International
Monetary Fund, and Export Credit Agencies); similar
work directed at the lending policies of private banks;
initiatives around the reduction of developing country
debt; and local economic development projects and
economic re-localisation.
Transport:
Includes support for work on all aspects of transportation,
including public transport systems; transport planning;
policy on aviation; freight; road-building; shipping;
alternatives to car use plus initiatives like car pools and
car clubs; the promotion of cycling and walking; and work
on vehicle fuel economy.

Six different "Eurobarometer" surveys from 2011 – 2013 were
used in order to explore levels of awareness and concern
about environmental issues along with the willingness of
members of the public to take action. Twelve questions
were selected with respect to awareness and concern, and
12 with respect to pro-environmental action. The percentage
scores for each Member State were then added together
ANNEX III: DATA ON ENVIRONMENTAL CONCERN AND ACTION ACROSS EU MEMBER STATES
and divided by 24 in order to produce an average across the
set of questions. Questions were selected in order to try and
cover different aspects of the environmental agenda, and
where possible priority was given to questions that involved
some trade-off or effort on the part of the respondent. The
24 questions are listed in the table below sorted by the
"Eurobarometer" publication that they featured in.
Eurobarometer publications
Questions and answers on environmental action
Questions and answers on environmental awareness/concern
European
Commission,
"Climate change",
Brussels, Special
Eurobarometer 372,
October 2011
Question: Which of the following do you
consider to be the single most serious
problem facing the world as a whole?
Answer: Climate change.
Question: Which of the following do you
consider to be the single most serious
problem facing the world? Any others?
Answer: Climate change.
[The two questions above are linked]
Question: Have you personally taken any
action to fight climate change in the past
six months?
Answer: Yes.
Question: In your opinion, who within the EU
is responsible for tackling climate change?
Answer: You personally.
Question: Which of the following actions
have you taken, if any?
Answer: You avoid taking short-haul
flights whenever possible.
European
Commission,
"Attitudes of
European citizens
towards the
environment",
Brussels, Special
Eurobarometer 365,
August 2011.
Question: When people talk about “the
environment” which of the following do
you think of first? And then?
Answer: Using up natural resources.
Question: When people talk about “the
environment” which of the following do
you think of first? And then?
Answer: The state of the environment our
children will inherit.
[The two questions above are linked]
Question: Which of the following ways of
evaluating progress in (our country) do
you think is the best? National progress
should be evaluated based…
Answer: Mostly on social and
environmental criteria.
Question: As an individual you can play a
role in protecting the environment in (our
country)
Answer: Agree.
Question: Please tell me whether you
totally agree, tend to agree, tend to
disagree or totally disagree with the
following statement: you are ready to buy
environmentally friendly products even if
they cost a little bit more.
Answer: Agree.
Question: In your opinion, which of these
should be the top three priorities for
(nationality) citizens in their daily life to
protect the environment?
Answer: Use public transport as much as
possible instead of using your own car.

29
EN
VIR
ON
MEN
TAL
FUN
DIN
G B
Y E
URO
PEA
N F
OU
NDA
TIO
NS
Eurobarometer publications
Questions and answers on environmental action
Questions and answers on environmental awareness/concern
Question: In general do you consider
that you are very well, fairly well, fairly
badly or very badly informed about
environmental issues?
Answer: Very well + fairly well informed.
Question: In your opinion, which of these
should be the top three priorities for
(nationality) citizens in their daily life to
protect the environment?
Answer: Replace your car with a more
energy efficient one, even if it is smaller or
more expensive.
Question: Thinking about the budget of
public authorities in (our country) which of
the following statements comes closest to
your view? Public authorities should favour…
Answer: Environmentally friendly
procurement over simple cost
considerations.
European
Commission,
"Attitudes of
Europeans towards
resource efficiency",
Brussels, Flash
Eurobarometer 316,
March 2011.
Question: Do you think that your
household is producing too much waste
or not?
Answer: Yes.
Question: Would you buy the following
products second-hand?
Answer: Percentage of those who
mention at least one of the listed products.
Question: Would you buy products made
of recycled materials?
Answer: Yes.
European
Commission,
"Europeans’ attitudes
towards food
security, food quality
and the countryside",
Brussels, Special
Eurobarometer 389,
July 2012.
Question: Which of the logos on this card
are you aware of?
Answer: Organic farming.
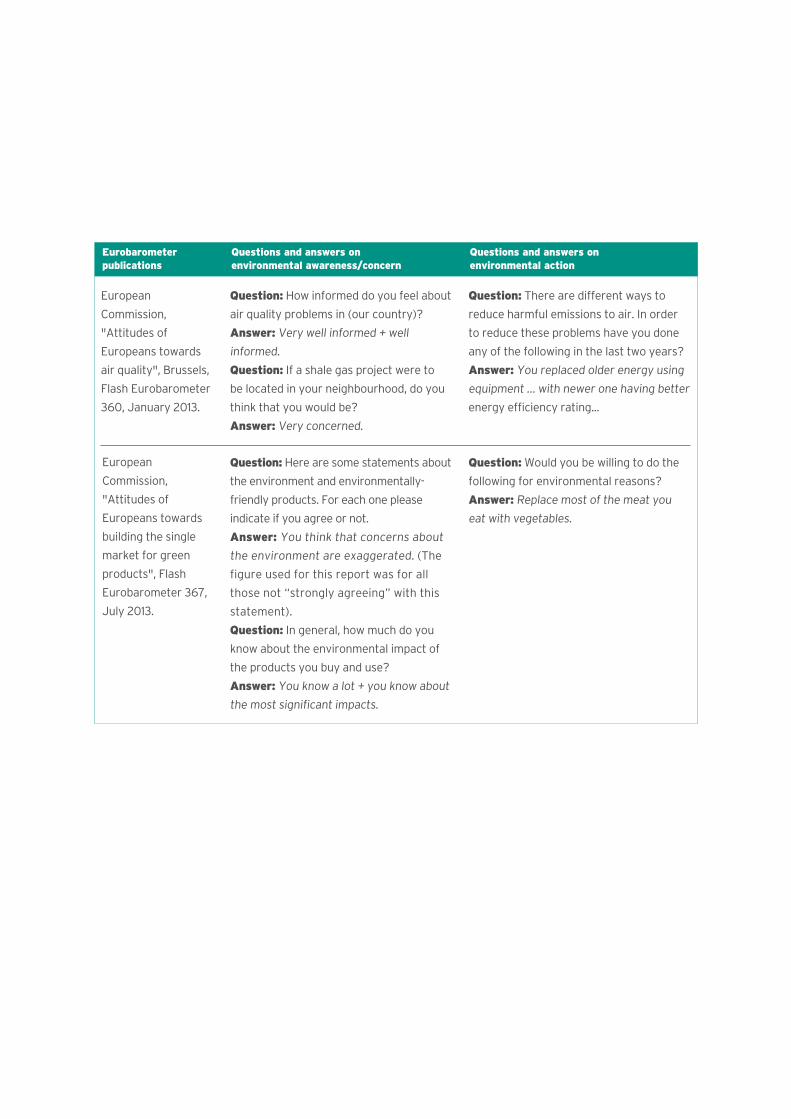
European
Commission,
"Attitudes of
Europeans towards
building the single
market for green
products", Flash
Eurobarometer 367,
July 2013.
Question: Here are some statements about
the environment and environmentally-
friendly products. For each one please
indicate if you agree or not.
Answer: You think that concerns about
the environment are exaggerated. (The
figure used for this report was for all
those not “strongly agreeing” with this
statement).
Question: In general, how much do you
know about the environmental impact of
the products you buy and use?
Answer: You know a lot + you know about
the most significant impacts.
Question: Would you be willing to do the
following for environmental reasons?
Answer: Replace most of the meat you
eat with vegetables.
European
Commission,
"Attitudes of
Europeans towards
air quality", Brussels,
Flash Eurobarometer
360, January 2013.
Question: How informed do you feel about
air quality problems in (our country)?
Answer: Very well informed + well
informed.
Question: If a shale gas project were to
be located in your neighbourhood, do you
think that you would be?
Answer: Very concerned.
Question: There are different ways to
reduce harmful emissions to air. In order
to reduce these problems have you done
any of the following in the last two years?
Answer: You replaced older energy using
equipment … with newer one having better
energy efficiency rating...
Eurobarometer publications
Questions and answers on environmental action
Questions and answers on environmental awareness/concern
31
EN
VIR
ON
MEN
TAL
FUN
DIN
G B
Y E
URO
PEA
N F
OU
NDA
TIO
NS
This report sits alongside similar research into
environmental funding patterns such as:
• "TrackingtheField"reportsproducedbytheUS
Environmental Grantmakers Association (EGA),22
• "WheretheGreenGrantsWent"reportsproduced
by the UK Environmental Funders Network (EFN),23
• "AProfileofEnvironmentalGrantmakingin
Canada" produced by the Canadian Environmental
Grantmakers Network (CEGN),24
• "GreenPhilanthropy"fromtheAustralian
Environmental Grantmakers Network (AEGN),25
• "GreenGrantsinNZ",commissionedbytwoNew
Zealandbasedenvironmentalfoundations.26
ANNEX IV: ADDITIONAL RESOURCES
OTHER ENVIRONMENTAL FUNDERS NETWORKS
AND WORKING GROUPS IN THE WORLD
Australian Environmental Grantmakers Network
(Australia)
www.aegn.org.au
Bundesverband Deutscher Stiftungen, Working Group
on Environment, Nature and Health (Germany)
www.stiftungen.org
Canadian Environmental Grantmakers Network
(Canada)
www.cegn.org
Centre Français des Fondations, Working Group on
Environment (France)
www.centre-francais-fondations.org
EFC European Environmental Funders Group
www.efc.be/environment
Environmental Funders Network (UK)
www.greenfunders.org
Environmental Grantmakers Association (US)
www.ega.org
Latin American and the Caribbean Network of
Environmental Funds (RedLAC)
www.redlac.org
22 See for instance, Environmental Grantmakers Association, "Tracking The Field, Volume 4: Analyzing Trends in Environmental Grantmaking", EGA, New York, September 2013.
23 See for instance, "Where the Green Grants Went, Volume 5: Patterns of UK Funding for Environmental and Conservation Work", EFN, January 2012
24 Canadian Environmental Grantmakers Network, "A Profile of Environmental Grantmaking in Canada: 2007 National Overview, summary report", CEGN, Toronto, March 2010.
25 Australian Environmental Grantmakers Network, "Green Philanthropy 2009", AEGN, Melbourne, October 2009.
26 SaintsInformationLimited,"GreenGrantsinNZ",areportfortheHikurangi Foundation and ASB Community Trust.
European Foundation Centre, AISBL | Philanthropy House | rue Royale 94 | 1000 Brussels, Belgium t +32.2.512.8938 | [email protected] | www.efc.beTh
is p
ublic
atio
n is
pri
nted
on
100
% w
ood-
free
, chl
orin
e-fr
ee p
aper
usi
ng v
eget
able
-bas
ed in
ks.
ABOUT THE EFC
The European Foundation Centre, founded in 1989, is
an international membership association representing
public benefit foundations and corporate funders
active in philanthropy in Europe and beyond. The
Centre develops and pursues activities in line with its
four key objectives: creating an enabling legal and fiscal
environment; documenting the foundation landscape;
building the capacity of foundation professionals; and
promoting collaboration, both among foundations and
between foundations and other actors. Emphasizing
transparency and best practice, all members sign
up to and uphold the European Foundation Centre
Principles of Good Practice.
ABOUT THE EFC THEMATIC NETWORKS
The EFC Thematic Networks are platforms for
foundations to build strategic relationships, share
experiences, learn from peers and collaborate.
ABOUT THE EEFG
Established in 2010, the European Environmental
Funders Group is an EFC Thematic Network that
provides a platform for funders across Europe active
in the fields of environment, sustainable development
and climate change. It serves as a hub for knowledge
exchange and promotes collaboration amongst funders.
To date more than 80 foundations have been involved
in EEFG activities.