environmental health - association santé … · email addresses: arz: [email protected] ; aa:...
TRANSCRIPT
This Provisional PDF corresponds to the article as it appeared upon acceptance. Fully formattedPDF and full text (HTML) versions will be made available soon.
Self-reported chemicals exposure, beliefs about disease causation, and risk ofbreast cancer in the Cape Cod Breast Cancer and Environment Study: a
case-control study
Environmental Health 2010, 9:40 doi:10.1186/1476-069X-9-40
Ami R. Zota ([email protected])Ann Aschengrau ([email protected])
Ruthann A. Rudel ([email protected])Julia GREEN Brody ([email protected])
ISSN 1476-069X
Article type Research
Submission date 4 February 2010
Acceptance date 20 July 2010
Publication date 20 July 2010
Article URL http://www.ehjournal.net/content/9/1/40
This peer-reviewed article was published immediately upon acceptance. It can be downloaded,printed and distributed freely for any purposes (see copyright notice below).
Articles in Environmental Health are listed in PubMed and archived at PubMed Central.
For information about publishing your research in Environmental Health or any BioMed Centraljournal, go to
http://www.ehjournal.net/info/instructions/
For information about other BioMed Central publications go to
http://www.biomedcentral.com/
Environmental Health
© 2010 Zota et al. , licensee BioMed Central Ltd.This is an open access article distributed under the terms of the Creative Commons Attribution License (http://creativecommons.org/licenses/by/2.0),
which permits unrestricted use, distribution, and reproduction in any medium, provided the original work is properly cited.

Self-reported chemicals exposure, beliefs about disease
causation, and risk of breast cancer in the Cape Cod Breast
Cancer and Environment Study: a case-control study
Ami R. Zota,1 Ann Aschengrau,
2 Ruthann A. Rudel,
1 Julia Green Brody
1*
1Silent Spring Institute, 29 Crafts Street, Newton, MA 02458, USA
2Department of Epidemiology, Boston University School of Public Health, Talbot 3E, 715 Albany
Street, Boston, MA 02118, USA
*Corresponding author
Email addresses: ARZ: [email protected]; AA: [email protected]; RAR: [email protected];
JGB: [email protected]

Abstract
Background
Household cleaning and pesticide products may contribute to breast cancer because many
contain endocrine disrupting chemicals or mammary gland carcinogens. This population-based case-
control study investigated whether use of household cleaners and pesticides increases breast cancer
risk.
Methods
Participants were 787 Cape Cod, Massachusetts, women diagnosed with breast cancer between
1988 and 1995 and 721 controls. Telephone interviews asked about product use, beliefs about breast
cancer etiology, and established and suspected breast cancer risk factors. To evaluate potential recall
bias, we stratified product-use odds ratios by beliefs about whether chemicals and pollutants contribute
to breast cancer; we compared these results with odds ratios for family history (which are less subject
to recall bias) stratified by beliefs about heredity.
Results
Breast cancer risk increased two-fold in the highest compared with lowest quartile of self-
reported combined cleaning product use (Adjusted OR = 2.1, 95% CI: 1.4, 3.3) and combined air
freshener use (Adjusted OR=1.9, 95% CI: 1.2, 3.0). Little association was observed with pesticide use.
In stratified analyses, cleaning products odds ratios were more elevated among participants who
believed pollutants contribute “a lot” to breast cancer and moved towards the null among the other
participants. In comparison, the odds ratio for breast cancer and family history was markedly higher
among women who believed that heredity contributes “a lot” (OR = 2.6, 95% CI: 1.9, 3.6) and not
elevated among others (OR = 0.7, 95% CI: 0.5, 1.1).

Conclusions
Results of this study suggest that cleaning product use contributes to increased breast cancer
risk. However, results also highlight the difficulty of distinguishing in retrospective self-report studies
between valid associations and the influence of recall bias. Recall bias may influence higher odds
ratios for product use among participants who believed that chemicals and pollutants contribute to
breast cancer. Alternatively, the influence of experience on beliefs is another explanation, illustrated
by the protective odds ratio for family history among women who do not believe heredity contributes
“a lot.” Because exposure to chemicals from household cleaning products is a biologically plausible
cause of breast cancer and avoidable, associations reported here should be further examined
prospectively.

Background
Pesticides, household cleaners, and air fresheners are of interest in breast cancer research
because many contain ingredients that are mammary gland carcinogens in animals [1] or endocrine
disrupting compounds (EDCs), including compounds that affect growth of estrogen-sensitive human
breast cancer cells [2] or affect mammary gland development [3]. Mammary gland tumors have been
observed in animal studies of pesticides such as dichlorvos, captafol, and sulfallate; methylene chloride
(in some fabric cleaners); nitrobenzene (soaps, polishes); and perfluorinated compounds (stain-
resistant, waterproof coatings) [1, 4, 5]. Phthalates, alkylphenols, parabens, triclosan, and polycyclic
musks used as surfactants, solvents, preservatives, antimicrobials, and fragrances have shown weak
estrogenic or anti-androgenic effects in both in vitro and in vivo tests [4-16]. Pesticides identified as
EDCs include dichlorodiphenyl trichloroethane (DDT), chlordane, methoxychlor, atrazine, lindane
(lice control), vinclozolin and benomyl (fungicides), and several current use insecticides such as
cypermethin [6-13]. When given early in life, atrazine, nonylphenol, perfluorinated compounds, and
the plastics monomer bisphenol A influence rat mammary gland development in a way that may affect
tumor susceptibility [14-18]. These chemicals are widely used and many have been detected in blood
and urine from a representative sample of the US population; concentrations vary over several orders
of magnitude [19-26]. In household air and dust and women’s urine tested in the Cape Cod Breast
Cancer and Environment Study, we detected an average of 26 EDCs per home, including 27 pesticides
and a variety of estrogenic phenols from household cleaners [27]. Taken together, the laboratory
studies of biological activity and evidence of widespread human exposure suggest that use of products
containing mammary gland carcinogens or EDCs may contribute to breast cancer in humans.
No epidemiological studies we know of have reported on the relationship between cleaning product
use and breast cancer, and previous breast cancer studies of pesticides have been largely limited to
organochlorine compounds [28]. Organochlorine studies have been mostly null, but interpretation is

limited because proxies of exposure were measured in blood taken years after the compounds were
banned in the US, often in older women and after diagnosis [29]. In a study that avoids these
limitations by using archived blood collected from young women in 1959 to 1967, Cohn et al. [30]
reported five-fold higher breast cancer risk among women who had the highest residues of DDT and
were exposed before they were 14 years old. In addition, the Long Island Breast Cancer Study found
30% higher breast cancer risk among women who reported the highest home pesticide use [31]. Self-
reported product use, such as the Long Island measures, has the potential to represent exposure over
many years to a wide range of compounds; although retrospective reports may be biased by differential
reporting accuracy between cases and controls [32].
To investigate the relationship between use of cleaning and pesticide products and risk of breast
cancer, while considering possible recall bias, we conducted a case-control study of breast cancer and
self-reported product use on Cape Cod, Massachusetts, in which we also measured beliefs about breast
cancer causation, a possible source of recall bias. Cape Cod is a coastal peninsula where breast cancer
incidence has been elevated. Annual female breast cancer incidence in 2002 – 2006 was 151.0 per
100,000 (95% CI 142.6 - 159.8) [33]. The pattern of higher incidence in Cape Cod towns than
elsewhere in Massachusetts dates to the initiation of the state cancer registry in 1982 [34]. In the
Collaborative Breast Cancer Study, risk was elevated among Cape Cod women compared with other
Massachusetts participants after controlling for breast cancer risk factors [35]. In the Cape Cod Breast
Cancer and Environment Study case-control study, longer years of residence on Cape Cod was
associated with higher risk after controlling for established breast cancer risk factors [36].
Methods
Study population
Details of the Cape Cod Study have been described previously [37]. Briefly, we conducted a
case-control study of invasive breast cancer occurring on Cape Cod in 1988-1995. Cases were female
permanent residents of Cape Cod for at least six months before a breast cancer diagnosis reported to
the Massachusetts Cancer Registry (MCR). Controls were female permanent Cape Cod residents
during the same years, had resided there at least six months, and were frequency matched to cases on
decade of birth and vital status. Controls under 65 years of age were selected using random digit
dialing; controls over 65 years of age were randomly selected from the Centers for Medicare and
Medicaid Services (CMS).
The Cape Cod Study expands on a study of breast cancer and tetrachloroethylene (PCE) in
drinking water [38]. Cases diagnosed in 1988-1993 in eight towns and their controls were interviewed
in 1997-1998 in the PCE study. Cases diagnosed in 1994-1995 in those eight towns and in 1988-1995
in the remaining seven towns and their controls were interviewed in 1999-2000. Among 1,578 eligible
living and deceased cases identified by MCR, 1,165 women (74%) or their proxies participated, 228
(14%) could not be located or contacted, and 185 (12%) refused to participate. Among 1,503 eligible
controls, 1,016 (68%) participated.
For the present analysis, we excluded 368 cases and 287 controls who were interviewed by
proxy, and 10 cases and eight controls who were missing data for one or more key analytic variables.
Given that most women for whom we obtained proxy interviews were deceased, excluded women
were older, and, consistent with being older, they were less educated. Within the included or excluded
groups, cases and controls did not differ demographically, suggesting no selection bias. Exclusions
left 787 cases and 721 controls for pesticide analyses. Cleaning product questions were asked only in
1999-2000 interviews, resulting in 413 cases and 403 controls for whom these data were available.

We obtained permission to use confidential data from MCR, CMS, and hospitals where cases were
diagnosed. The Boston University Institutional Review Board and Massachusetts Department of
Public Health Human Research Review Committee approved the study protocol. Participants were
asked for informed consent at the outset of interviews.
Interviews
Trained telephone interviewers administered a structured questionnaire on established and
hypothesized breast cancer risk factors including family history of breast cancer, menstrual and
reproductive history, height, weight, alcohol and tobacco use, physical activity, pharmaceutical
hormone use, and education. Information on residential cleaning product and pesticide use was
obtained. Participants in 1999-2000 interviews were asked about five categories of cleaning products,
including solid and spray air fresheners, surface cleaners, oven cleaners, and mold/mildew products.
All participants were asked about use of 10 categories of pesticides in and around their homes,
including insecticides, lawn care, herbicides, lice control, insect repellents, and pest control on pets.
The 1999-2000 interviews asked about mothballs and treatments for termites and carpenter ants.
Participants were first asked if the product was ever used in their home. Participants were then asked
to estimate frequency of use using predefined categories. To exclude exposures after diagnosis or
index year, participants were asked to report the first and last years of use for pesticides, and use before
their diagnosis or index year for cleaning products. At the end of the interview, participants were
asked about their beliefs about four factors that may contribute to breast cancer: heredity, diet,
chemicals and pollutants in the air or water, and a woman’s reproductive or breastfeeding history.
Participants were asked whether each contributes to breast cancer “a lot, a little, or not at all.” “Don’t
know” responses were coded. Interview questions can be viewed at http://silentspring.org/cape-cod-
breast-cancer-and-environment-study-survey-instruments.

Statistical analysis
Unconditional logistic regression was used to calculate odds ratios (ORs) and 95% confidence
intervals (CIs). The following “core” matching variables and potential confounders were included in
adjusted odds ratio analyses based on a priori consideration of the research design and well-established
breast cancer risk factors: age at diagnosis or index year, education, family history of breast cancer in a
first degree female relative, breast cancer diagnosis prior to the current diagnosis or index year, and
age at first live or still birth (≥ 30 years of age or nulliparous vs. <30 years of age). Pesticide analyses
were adjusted for study (PCE or Cape study). Missing values for family history for 45 (3%)
participants were imputed as “no.” The percent missing information on family history did not differ
between cases and controls. The following potential confounders were evaluated: mammography use,
medical radiation, lactation, hormone replacement therapy, oral contraceptive use, diethylstilbestrol
exposure, body mass index, smoking, alcohol consumption, teen and adult physical activity, race,
marital status, and religion. None of these variables changed the “core”-adjusted odds ratio estimates
by ≥ 10%, so they were not included in final models.
We evaluated ever vs. never use and categorical variables reflecting frequency of use. “Never
users” of each product type formed the reference group. If a participant reported ever using a product
but the frequency was missing, frequency was imputed as the median for that product. To aggregate
“like” exposures, three variables were constructed by summing frequency of use for two types of air
fresheners, five types of cleaning products, and eight types of pesticides. Aggregated scores were
divided into quartiles based on the distribution of controls. The lowest quartile constituted the
reference group. Tests for trends were conducted by modeling ordinal terms for categories of product
use or quartiles in the multivariate model.
Because participants’ awareness of a hypothesis may bias exposure reporting [39], we
evaluated differences in beliefs about disease causation between cases and controls using the chi

square test. We evaluated differences in product-use odds ratios by beliefs about whether
chemicals/pollutants contribute to breast cancer by 1) including an interaction term for beliefs and
product use in the final model and 2) stratifying by beliefs. Beliefs were dichotomized as those who
said chemicals/pollutants contribute to breast cancer “a lot” versus “a little,” “not at all,” or “don’t
know.”
Weiss [40] notes that recall bias is not the only explanation for differences in odds ratios by
knowledge or attitudes about a hypothesis; so to aid interpretation of product use results, we conducted
a comparison analysis of differences in family history odds ratios by beliefs about whether heredity
contributes “a lot” to breast cancer. This comparison is useful, because the accuracy of self-reported
family history can be compared with medical records, and the relationship between family history and
breast cancer is well-established independent of self-reports. As a sensitivity analysis, we also
examined un-stratified and stratified family history odds ratios excluding those subjects who were
missing information on family history.
All analyses were conducted in SAS version 9.1 (SAS Institute, Cary, NC). Figures were
constructed in R software 2.6.1, (R Foundation for Statistical Computing, Vienna, Austria). Statistical
significance was defined by a (two-sided) P-value of 0.05 or lower.
Results
Study participants were predominantly white (98%), 60-80 years of age (60%) with high school
or higher education (94 %); more cases (25%) than controls (19%) reported a family history of breast
cancer. Characteristics of participants are shown in Table 1. Participants in this analysis of product
use were demographically similar to characteristics previously reported for all cases and controls,
except for being younger and more educated, due to exclusion of proxy interviews [37].
Products use
Breast cancer risk increased approximately two-fold in the highest compared with lowest
quartile of combined cleaning product use (OR = 2.1, 95% CI: 1.4, 3.3) and combined air freshener use
(OR=1.9, 95% CI: 1.2, 3.0) (Table 2). Ever use of air freshener spray (OR=1.2, 95% CI: 0.9, 1.8),
solid air freshener (OR=1.7, 95% CI: 1.2, 2.3) or mold/mildew control (OR=1.7, 95% CI: 1.2, 2.3) was
associated with higher risk, with evidence of positive dose response and significant P trend for solid air
freshener and mold/mildew control with bleach. Surface and oven cleaners were not associated with
breast cancer risk.
Combined use of pesticide products was not associated with risk of breast cancer (Table 3).
Odds ratios for individual pesticide types were null or slightly and nonsignificantly elevated, with the
exception of insect repellent use (OR = 1.5, 95% CI; 1.0, 2.3 for most frequent insecticide use
compared with never use; P trend = 0.05).
Differences by beliefs about disease causation
Cases and controls differed significantly in beliefs about the role of heredity and of chemicals
and pollutants in breast cancer (Table 4). Among controls, 66% said heredity contributes “a lot”
compared with 42% of cases (P < 0.01); 57% of controls and 60% of cases said “chemicals and
pollutants in the air or water” contribute “a lot” (P < 0.05).
In stratified analyses, odds ratios for cleaning products were consistently elevated within the
group who said chemicals/pollutants contribute “a lot” to breast cancer, but associations moved
towards the null in the other participants (Table 5). For example, the odds ratio for the highest quartile
of combined cleaning product use was 3.2 (95% CI: 1.8, 5.9) among women who believed
chemicals/pollutants contribute “a lot”’ compared to 1.2 (95% CI: 0.6, 2.6) among others. The
interaction was not statistically significant (P = 0.25). (However, the interaction term does not detect
departures from additivity.)

Similarly, odds ratios for pesticides were higher among participants who believed that
chemicals/pollutants contribute “a lot” to breast cancer. For example, the odds ratio for most frequent
insect repellent use was 2.0 (95% CI; 1.1, 3.4) in this belief group compared with 0.8 (95% CI; 0.4,
1.6) among others. Pesticide odds ratios stratified by beliefs are shown in Table 6.
In addition, a similar pattern was observed in the odds ratios for family history of breast cancer
stratified by beliefs about heredity as a cause. The odds ratio for breast cancer and family history was
markedly higher among women who believed that heredity contributes “a lot” (OR = 2.6, 95% CI: 1.9,
3.6) and not elevated among others (OR = 0.7, 95% CI: 0.5, 1.1, interaction term P < 0.01). The
parallel pattern of results for both cleaning products and family history when stratified by relevant
beliefs is shown in Figure 1. (For all participants, the odds ratio for family history was 1.4 (95% CI:
1.1, 1.9)). The un-stratified and stratified effect estimates for family history of breast cancer in
adjusted models remain virtually unchanged after removing subjects with imputed values for family
history.
Discussion
Women with the highest combined cleaning product use had two-fold increased breast cancer
risk compared to those with the lowest reported use. Use of air fresheners and products for mold and
mildew control were associated with increased risk. To our knowledge, this is the first published
report on cleaning product use and risk of breast cancer.
Some common ingredients of air fresheners and products for mold and mildew have been
identified as EDCs or carcinogens, supporting the biological plausibility of the elevated odds ratios we
observed [1, 15, 41-51]. EDCs such as synthetic musks and phthalates are commonly used in air
fresheners [19, 25-27, 43, 48, 52-54] and antimicrobials, phthalates, and alkylphenolic surfactants are
often in mold and mildew products [19, 22-24, 26, 27, 41, 42, 44, 47, 49, 55]. In addition, air
fresheners may contain: terpenes, which can react with background ozone to form formaldehyde, a

human carcinogen [50]; benzene and styrene [51], which are animal mammary gland carcinogens [1];
and other chemicals whose mechanisms of action are not understood [56]. Although exposure levels
may be low and EDCs are typically less potent than endogenous hormones, limited knowledge of
product formulations, exposure levels, and the biological activity and toxicity of chemical constituents
alone and in combination make it difficult to assess risks associated with product use. Additionally,
the products we assessed may be proxies for other products that we did not include, and mold/mildew
products may be proxies for exposure to mycotoxins, some of which are EDCs [2, 57-59].
Our results do not corroborate the findings of a Long Island, NY, case-control study [31]. The
Long Island study found increased breast cancer risk associated with self-reported overall pesticide use
and use of lawn and garden pesticides, but we did not. Neither study found associations for nuisance
pest control (roaches, ants, etc.). While we observed increased risk with frequent use of insect
repellent, the Long Island study did not. Differences between the studies may be due to differences in
pesticide practices in the two regions, greater statistical power in the Long Island study, or differences
in the survey instruments. Phthalates and permethrins, which are in some insect repellants, have been
identified as EDCs [10, 13, 46, 60].
Using interviews to assess product-related exposures, as we did in this study, has several
advantages. It is inexpensive, noninvasive, and integrates exposures over many years and to
frequently-occurring chemical mixtures. Currently available biological measures cannot achieve these
important characteristics.
However, self-reported exposures are subject to multiple sources of error resulting in
misclassification. Our questions were cognitively demanding in that they asked participants to report
behaviors occurring months to years before. Responses failed to capture use by others, including
residues from before the participant moved into the residence; exposures specific to critical periods
such as adolescence; exposures outside the home; or all products that contain the chemicals of interest.
Although we asked about the first and most recent years of pesticide use, we considered the quality of

these data inadequate to evaluate effects of duration of use. Much of the error resulting from
limitations in exposure measurement is likely nondifferential, biasing odds ratios toward the null.
Self-reports are also vulnerable to bias from differential recall between cases and controls. Women
diagnosed with breast cancer may have searched their history for explanations, priming greater recall
of product use than for controls. Werler [39], among others, hypothesizes that this type of bias occurs
when cases are aware of the study hypothesis, resulting in higher exposure reporting and,
consequently, an elevated odds ratio. We empirically investigated this possibility by stratifying odds
ratios by beliefs about breast cancer causes, and, consistent with Werler’s hypothesis, we observed
higher odds ratios for product use among women who believe chemicals and pollution contribute “a
lot” to breast cancer than among others.
However, the family history odds ratios stratified by beliefs suggest another interpretation. The
much higher family history odds ratios for women who said heredity contributes “a lot” is unlikely to
be primarily due to recall bias, given that self-reporting of first degree family members with breast
cancer is generally accurate [61-66]. Previous research indicates that over-reporting of first degree
breast cancer family history is negligible [63, 65, 66] and that some under-reporting by controls in
comparison with cases is likely to occur (and could bias odds ratios), but this effect is unlikely to be
substantial [64-66] More likely, our results are primarily driven by cases who formed their belief that
heredity does not contribute “a lot” after their own diagnosis, based on their own lack of relatives with
breast cancer. Our data support this idea: 36% of cases with no family history said heredity contributes
“a lot” to breast cancer compared with 61% of cases who did have a family history (Table 7). In this
situation, an odds ratio for women who do not think heredity contributes “a lot” over-represents cases
with no family history, lowering the effect estimate. Thus, our results support Weiss’s argument [40]
that limiting estimates to a subgroup based on beliefs about disease causation may introduce error.
Among the group who do not believe heredity contributes “a lot” to breast cancer, the odds ratio of 0.7
(95% CI: 0.5, 1.1) contrasts sharply with the pooled odds ratio of 2.1 (95% CI: 2.0, 2.2) for first degree
family history of breast cancer from previous studies [67]. Generally, Weiss argues, effect estimates
based on one belief or knowledge subgroup lack precision and may underestimate the true effect, since
they are limited to smaller numbers and not representative of the study population [40].
The divergent odds ratios in the stratified analysis for family history, which is not likely
affected much by recall bias, warns us that the elevated odds ratios for cleaning products should not be
too quickly dismissed as resulting from recall bias, since an alternative interpretation is that women’s
beliefs about disease causation result from their experience. Women who have been intensive product
users and are then diagnosed with breast cancer may form the belief that chemicals influenced their
risk, or they may be sensitized to news media stories about associations between chemicals and disease
and form beliefs from this experience. Social scientists have studied the phenomenon of health beliefs
formed from experience in a variety of settings, including the emergence of beliefs about
environmental causation among breast cancer activists [68].
Furthermore, the substantial underestimate of risk for family history among women who said
heredity does not contribute “a lot” cautions us against limiting product use analyses to a non-belief
subgroup as a strategy for dealing with possible recall bias. In addition, the findings of elevated risk
for some cleaning products and not others lends evidence that recall bias may not account for elevated
risks, even if it contributes in part, since bias would be expected to similarly influence reporting for all
the products.
Studies that rely on questionnaire data can sometimes assess the validity of self-reported data
against another metric, such as chemical concentrations in relevant exposure media. For example, Colt
et al. [69] found significant associations between self-reports of type of pest treated and concentrations
of specific pesticides in house dust. We collected air, dust, and urine measurements for 120 homes and
their residents, but comparison of these data with self-reports was not conducted for several reasons.
The number of homes is small, the one-time environmental measurements may not correspond well
with product use over years, measurements capture sources other than home product use, and our self-
reports cover past residences as well as the sampled homes. Our ambiguous self-report findings point
to the value of thoughtfully incorporating environmental chemical measurements into prospective
cohort studies such as the National Children’s Study and the Sister Study.
Overall strengths of our study are the population-based design with case identification from the
MCR, extensive interviews allowing evaluation of possible confounding by established and
hypothesized breast cancer risk factors, and assessment of exposures that extend years before diagnosis
and encompass chemicals in use during the past 30 years as well as the more-studied banned
organochlorines. Limitations include loss of information due to deaths of women with less treatable
cancers. Also, we lack a truly unexposed reference group, limiting contrast in levels of exposure. The
self-reported product use exposures have potential for differential and nondifferential error. We did
not have adequate numbers to separately evaluate effects in younger women, though some other
studies suggest that environmental pollutants may have greater influence on premenopausal disease
[28].
To our knowledge, this is the first epidemiological study to suggest an association between
cleaning product use, in particular air fresheners and products for mold and mildew control, and
elevated breast cancer risk. This association is biologically plausible based on ingredients of these
products, such as musks, antimicrobials, and phthalates [1-27, 41-49, 70-73], and these reported
exposures may be proxies for other un-assessed causative exposures. The modest association and
possibility of recall bias make interpretation tentative. Given widespread exposure to cleaning
products and scented products, follow-up study is important. Prospective designs, which avoid
differential recall, can be helpful. The difficulty of obtaining human evidence on environmental
chemicals and breast cancer in the short-term means we must rely more on laboratory evidence as a
basis for public health policies to control exposure.
Conclusions
Laboratory studies have found that many chemicals in home-use pesticides and household
cleaning products are mammary gland carcinogens in rodents, influence the proliferation of estrogen-
sensitive cells, or affect mammary gland development following prenatal exposure. These findings
suggest effects of pesticide and cleaning product use on breast cancer risk, so we undertook a case-
control study of breast cancer and self-reported product use. We found increased breast cancer risk
among women reporting the highest use of cleaning products and air fresheners. We found little
association with home pesticide use. The self-reported product use measures we used have the
advantage of integrating exposure over many years to chemical mixtures. However, these measures
remain incomplete, likely resulting in nondifferential misclassification, and they are open to recall bias.
Investigators sometimes try to avoid the influence of recall bias by limiting analyses to participants
who do not subscribe to the study hypothesis, but our results show this may not be a good strategy,
given that in our study it would obscure the well-established association between family history and
breast cancer risk. In order to avoid possible recall bias, we recommend further study of cleaning
products and breast cancer using prospective self-reports and measurements in environmental and
biological media.
Abbreviations
CI, confidence interval; CMS, Centers for Medicare and Medicaid Services; EDCs, endocrine-
disrupting compounds; OR, odds ratio; MCR, Massachusetts Cancer Registry; PCE,
tetrachloroethylene; Ref, reference; Adj OR, adjusted odds ratio; NY, New York; US, United States.
Competing interests
The authors have no competing interests.

Authors' contributions
ARZ conducted the statistical analyses and led drafting of the manuscript. AA designed and
oversaw the PCE Study; contributed to the design, data collection, and epidemiological analysis of the
Cape Cod Study; and collaborated on editorial issues. RAR contributed to the design, data collection,
and analysis of the Cape Cod Study, particularly with respect to the toxicologic characteristics of
exposures, and collaborated in drafting the manuscript. JGB led the design, implementation, and
analysis of the Cape Cod Study and collaborated in drafting the manuscript; she conceptualized the
comparative analysis of product use and family history odds ratios stratified by beliefs as a strategy for
understanding possible response bias. All authors read and approved the final manuscript.
Acknowledgements
Dr. Nancy Maxwell contributed to drafting the cleaning products questionnaire. Dr. Wendy
McKelvey conducted early statistical analyses and contributed to our thinking about possible recall
bias. Laura Perovich assisted in data analysis and manuscript preparation. This work was supported
by an appropriation of the Massachusetts legislature administered by the Massachusetts Department of
Public Health; the Susan S. Bailis Breast Cancer Research Fund at Silent Spring Institute; and US
Centers for Disease Control and Prevention grants R01 DP000218-01 and 1H75EH000377-01.
References 1. Rudel RA, Attfield KR, Schifano J, Brody JG: Chemicals causing mammary gland tumors
in animals signal new directions for epidemiology, chemicals testing, and risk assessment
for breast cancer prevention. Cancer 2007, 109:2635-2666.
2. Soto AM, Sonnenschein C, Chung KL, Fernandez MF, Olea N, Serrano FO: The E-SCREEN
assay as a tool to identify estrogens: an update on estrogenic environmental pollutants. Environ Health Perspect 1995, 103 Suppl 7:113-122.
3. Fenton SE: Endocrine-disrupting compounds and mammary gland development: early
exposure and later life consequences. Endocrinology 2006, 147:S18-24.
4. Sibinski LJ: Two year oral (diet) toxicity/carcinogenicity study of fluorochemical FC-143
in rats. In 3M Company/Riker Exp No 0281CR0012: 3M Company/Riker; 1987.
5. National Toxicology Program: Abstracts of NTP long-term cancer studies. Research
Triangle Park, NC: National Institute of Environmental Health Sciences; 2007.

6. Uzumcu M, Kuhn PE, Marano JE, Armenti AE, Passantino L: Early postnatal methoxychlor
exposure inhibits folliculogenesis and stimulates anti-Mullerian hormone production in
the rat ovary. J Endocrinol 2006, 191:549-558.
7. Morinaga H, Yanase T, Nomura M, Okabe T, Goto K, Harada N, Nawata H: A benzimidazole
fungicide, benomyl, and its metabolite, carbendazim, induce aromatase activity in a
human ovarian granulose-like tumor cell line (KGN). Endocrinology 2004, 145:1860-1869.
8. Maranghi F, Rescia M, Macri C, Di Consiglio E, De Angelis G, Testai E, Farini D, De Felici
M, Lorenzetti S, Mantovani A: Lindane may modulate the female reproductive
development through the interaction with ER-beta: an in vivo-in vitro approach. Chem
Biol Interact 2007, 169:1-14.
9. Liu P, Song XX, Yuan WH, Wen WH, Wu XN, Li J, Chen XM: Effects of cypermethrin and
methyl parathion mixtures on hormone levels and immune functions in Wistar rats. Archives of Toxicology 2006, 80:449-457.
10. Jin Y, Chen R, Sun L, Wang W, Zhou L, Liu W, Fu Z: Enantioselective induction of
estrogen-responsive gene expression by permethrin enantiomers in embryo-larval
zebrafish. Chemosphere 2009, 74:1238-1244.
11. Gwinn MR, Whipkey DL, Tennant LB, Weston A: Differential gene expression in normal
human mammary epithelial cells treated with malathion monitored by DNA microarrays. Environ Health Perspect 2005, 113:1046-1051.
12. Cupp AS, Skinner MK: Actions of the endocrine disruptor methoxychlor and its estrogenic
metabolite on in vitro embryonic rat seminiferous cord formation and perinatal testis
growth. Reprod Toxicol 2001, 15:317-326.
13. Chen HY, Xiao JG, Hu G, Zhou JW, Xiao H, Wang XR: Estrogenicity of organophosphorus
and pyrethroid pesticides. Journal of Toxicology and Environmental Health-Part A 2002,
65:1419-1435.
14. Enoch RR, Stanko JP, Greiner SN, Youngblood GL, Rayner JL, Fenton SE: Mammary gland
development as a sensitive end point after acute prenatal exposure to an atrazine
metabolite mixture in female Long-Evans rats. Environ Health Perspect 2007, 115:541-547.
15. Moon HJ, Han SY, Shin JH, Kang IH, Kim TS, Hong JH, Kim SH, Fenton SE: Gestational
exposure to nonylphenol causes precocious mammary gland development in female rat
offspring. J Reprod Dev 2007, 53:333-344.
16. Vorderstrasse BA, Fenton SE, Bohn AA, Cundiff JA, Lawrence BP: A novel effect of dioxin:
exposure during pregnancy severely impairs mammary gland differentiation. Toxicol Sci
2004, 78:248-257.
17. White SS, Kato K, Jia LT, Basden BJ, Calafat AM, Hines EP, Stanko JP, Wolf CJ, Abbott BD,
Fenton SE: Effects of perfluorooctanoic acid on mouse mammary gland development and
differentiation resulting from cross-foster and restricted gestational exposures. Reprod
Toxicol 2009, 27:289-298.
18. Vandenberg LN, Maffini MV, Schaeberle CM, Ucci AA, Sonnenschein C, Rubin BS, Soto
AM: Perinatal exposure to the xenoestrogen bisphenol-A induces mammary intraductal
hyperplasias in adult CD-1 mice. Reprod Toxicol 2008, 26:210-219.
19. Centers for Disease Control and Prevention: Third national report on human exposure to
environmental chemicals. National Center for Environmental Health, Division of Laboratory
Science 2005.
20. Calafat AM, Kuklenyik Z, Reidy JA, Caudill SP, Tully JS, Needham LL: Serum
concentrations of 11 polyfluoroalkyl compounds in the u.s. population: data from the
national health and nutrition examination survey (NHANES). Environ Sci Technol 2007,
41:2237-2242.

21. Calafat AM, Wong LY, Ye X, Reidy JA, Needham LL: Concentrations of the sunscreen
agent benzophenone-3 in residents of the United States: National Health and Nutrition
Examination Survey 2003--2004. Environ Health Perspect 2008, 116:893-897.
22. Calafat AM, Ye X, Wong LY, Reidy JA, Needham LL: Urinary concentrations of triclosan
in the U.S. population: 2003-2004. Environ Health Perspect 2008, 116:303-307.
23. Calafat AM, Ye X, Wong LY, Reidy JA, Needham LL: Exposure of the U.S. population to
bisphenol A and 4-tertiary-octylphenol: 2003-2004. Environ Health Perspect 2008, 116:39-
44.
24. Calafat AM, Kuklenyik Z, Reidy JA, Caudill SP, Ekong J, Needham LL: Urinary
concentrations of bisphenol A and 4-nonylphenol in a human reference population. Environ Health Perspect 2005, 113:391-395.
25. Kuklenyik Z, Bryant XA, Needham LL, Calafat AM: SPE/SPME-GC/MS approach for
measuring musk compounds in serum and breast milk. J Chromatogr B Analyt Technol
Biomed Life Sci 2007, 858:177-183.
26. Silva MJ, Barr DB, Reidy JA, Malek NA, Hodge CC, Caudill SP, Brock JW, Needham LL,
Calafat AM: Urinary levels of seven phthalate metabolites in the U.S. population from the
National Health and Nutrition Examination Survey (NHANES) 1999-2000. Environ Health
Perspect 2004, 112:331-338.
27. Rudel RA, Camann DE, Spengler JD, Korn LR, Brody JG: Phthalates, alkylphenols,
pesticides, polybrominated diphenyl ethers, and other endocrine-disrupting compounds in
indoor air and dust. Environmental Science & Technology 2003, 37:4543-4553.
28. Brody JG, Moysich KB, Humblet O, Attfield KR, Beehler GP, Rudel RA: Environmental
pollutants and breast cancer: epidemiologic studies. Cancer 2007, 109:2667-2711.
29. Snedeker SM: Pesticides and breast cancer risk: A review of DDT, DDE, and Dieldrin.
Environmental Health Perspectives 2001, 109:35-47.
30. Cohn BA, Wolff MS, Cirillo PM, Sholtz RI: DDT and Breast Cancer in Young Women:
New Data on the Significance of Age at Exposure. Environmental Health Perspectives 2007,
115:1406-1414.
31. Teitelbaum SL, Gammon MD, Britton JA, Neugut AI, Levin B, Stellman SD: Reported
residential pesticide use and breast cancer risk on Long Island, New York. American
Journal of Epidemiology 2007, 165:643-651.
32. Coughlin SS: Recall bias in epidemiologic studies. J Clin Epidemiol 1990, 43:87-91.
33. State Cancer Profiles
[http://statecancerprofiles.cancer.gov/map/scpMapDataTable.php?25&001&055&00&2&1&0
&1&6&0]
34. Cape Cod Breast Cancer and the Environment Atlas
[http://library.silentspring.org/atlas/breastcancer/index.asp]
35. Silent Spring Institute: Cape Cod Breast Cancer and Environment Study: Final Report.
Newton, MA; 1997.
36. McKelvey W, Brody JG, Aschengrau A, Swartz CH: Association between residence on Cape
Cod, Massachusetts, and breast cancer. Ann Epidemiol 2004, 14:89-94.
37. Brody JG, Aschengrau A, McKelvey W, Rudel RA, Swartz CH, Kennedy T: Breast cancer
risk and historical exposure to pesticides from wide-area applications assessed with GIS. Environ Health Perspect 2004, 112:889-897.
38. Aschengrau A, Rogers S, Ozonoff D: Perchloroethylene-contaminated drinking water and
the risk of breast cancer: additional results from Cape Cod, Massachusetts, USA. Environmental Health Perspectives 2003, 111:167-173.
39. Werler MM, Shapiro S, Mitchell AA: Periconceptional folic acid exposure and risk of
occurrent neural tube defects. Jama 1993, 269:1257-1261.

40. Weiss NS: Should we consider a subject's knowledge of the etiologic hypothesis in the
analysis of case-control studies? Am J Epidemiol 1994, 139:247-249.
41. Ahn KC, Zhao B, Chen J, Cherednichenko G, Sanmarti E, Denison MS, Lasley B, Pessah IN,
Kultz D, Chang DP, et al: In vitro biologic activities of the antimicrobials triclocarban, its
analogs, and triclosan in bioassay screens: receptor-based bioassay screens. Environ
Health Perspect 2008, 116:1203-1210.
42. Bonefeld-Jorgensen EC, Long M, Hofmeister MV, Vinggaard AM: Endocrine-disrupting
potential of bisphenol A, bisphenol A dimethacrylate, 4-n-nonylphenol, and 4-n-
octylphenol in vitro: new data and a brief review. Environmental Health Perspectives 2007,
115 Suppl 1:69-76.
43. Duty SM, Ackerman RM, Calafat AM, Hauser R: Personal care product use predicts
urinary concentrations of some phthalate monoesters. Environmental Health
Perspectectives 2005, 113:1530-1535.
44. Gee RH, Charles A, Taylor N, Darbre PD: Oestrogenic and androgenic activity of triclosan
in breast cancer cells. J Appl Toxicol 2008, 28:78-91.
45. Hauser R, Meeker JD, Duty S, Silva MJ, Calafat AM: Altered semen quality in relation to
urinary concentrations of phthalate monoester and oxidative metabolites. Epidemiology
2006, 17:682-691.
46. Howdeshell KL, Wilson VS, Furr J, Lambright CR, Rider CV, Blystone CR, Hotchkiss AK,
Gray LE, Jr.: A mixture of five phthalate esters inhibits fetal testicular testosterone
production in the sprague-dawley rat in a cumulative, dose-additive manner. Toxicol Sci
2008, 105:153-165.
47. Kumar V, Chakraborty A, Kural MR, Roy P: Alteration of testicular steroidogenesis and
histopathology of reproductive system in male rats treated with triclosan. Reprod Toxicol
2009, 27:177-185.
48. Schreurs RH, Sonneveld E, Jansen JH, Seinen W, van der Burg B: Interaction of polycyclic
musks and UV filters with the estrogen receptor (ER), androgen receptor (AR), and
progesterone receptor (PR) in reporter gene bioassays. Toxicol Sci 2005, 83:264-272.
49. Zorrilla LM, Gibson EK, Jeffay SC, Crofton KM, Setzer WR, Cooper RL, Stoker TE: The
effects of triclosan on puberty and thyroid hormones in male Wistar rats. Toxicol Sci
2009, 107:56-64.
50. Nazaroff WW, Weschler CJ: Cleaning products and air fresheners: exposure to primary
and secondary air pollutants. Atmospheric Environment 2004, 38:2841-2865.
51. Torfs R, Brouwere KD, Spruyt M, Goelen E, Nickmilder M, Bernard A: Exposure and Risk
Assessment of Air Fresheners. pp. 2008/IMS/R/2222: Flemish Institute for Technological
Research NV (VITO); 2008:2008/IMS/R/2222.
52. Reiner JL, Kannan K: A survey of polycyclic musks in selected household commodities
from the United States. Chemosphere 2006, 62:867-873.
53. Reiner JL, Wong CM, Arcaro KF, Kannan K: Synthetic musk fragrances in human milk
from the United States. Environmental Science & Technology 2007, 41:3815-3820.
54. van der Burg B, Schreurs R, van der Linden S, Seinen W, Brouwer A, Sonneveld E: Endocrine
effects of polycyclic musks: do we smell a rat? International Journal of Andrology 2008,
31:188-193.
55. Rudel RA, Perovich LJ: Endocrine disrupting chemicals in indoor and outdoor air.
Atmospheric Environment 2009, 43:170-181.
56. Steinemann AC: Fragranced consumer products and undisclosed ingredients.
Environmental Impact Assessment Review 2009, 29:32-38.
57. Nielsen KF: Mycotoxin production by indoor molds. Fungal Genetics and Biology 2003,
39:103-117.
58. Pestka JJ, Yike I, Dearborn DG, Ward MDW, Harkema JR: Stachybotrys chartarum,
trichothecene mycotoxins, and damp building-related illness: New insights into a public
health enigma. Toxicological Sciences 2008, 104:4-26.
59. Tiemann U, Tomek W, Schneider F, Muller M, Pohland R, Vanselow J: The mycotoxins
alternariol and alternariol methyl ether negatively affect progesterone synthesis in
porcine granulosa cells in vitro. Toxicology Letters 2009, 186:139-145.
60. Brown M, Hebert AA: Insect repellents: an overview. J Am Acad Dermatol 1997, 36:243-
249.
61. Chang ET, Smedby KE, Hjalgrim H, Glimelius B, Adami HO: Reliability of self-reported
family history of cancer in a large case-control study of lymphoma. J Natl Cancer Inst
2006, 98:61-68.
62. Ziogas A, Anton-Culver H: Validation of family history data in cancer family registries. Am
J Prev Med 2003, 24:190-198.
63. Parent ME, Ghadirian P, Lacroix A, Perret C: Accuracy of Reports of Familial Breast-
Cancer in a Case-Control Series. Epidemiology 1995, 6:184-186.
64. Floderus B, Barlow L, Mack TM: Recall bias in subjective reports of familial cancer.
Epidemiology (Cambridge, Mass 1990, 1:318-321.
65. Murff HJ, Spigel DR, Syngal S: Does this patient have a family history of cancer? An
evidence-based analysis of the accuracy of family cancer history. JAMA 2004, 292:1480-
1489.
66. Parikh-Patel A, Allen M, Wright WE: Validation of self-reported cancers in the California
Teachers Study. American journal of epidemiology 2003, 157:539-545.
67. Pharoah PD, Day NE, Duffy S, Easton DF, Ponder BA: Family history and the risk of breast
cancer: a systematic review and meta-analysis. Int J Cancer 1997, 71:800-809.
68. Brown P: Toxic exposures: contested illnesses and the environmental health movement. New
York: Columbia University Press; 2007.
69. Colt JS, Lubin J, Camann D, Davis S, Cerhan J, Severson RK, Cozen W, Hartge P:
Comparison of pesticide levels in carpet dust and self-reported pest treatment practices in
four US sites. J Expo Anal Environ Epidemiol 2004, 14:74-83.
70. Kang KS, Che JH, Ryu DY, Kim TW, Li GX, Lee YS: Decreased sperm number and motile
activity on the F1 offspring maternally exposed to butyl p-hydroxybenzoic acid (butyl
paraben). The Journal of Veterinary Medical Science 2002, 64:227-235.
71. Rastogi SC, Schouten A, de Kruijf N, Weijland JW: Contents of methyl-, ethyl-, propyl-,
butyl- and benzylparaben in cosmetic products. Contact dermatitis 1995, 32:28-30.
72. Routledge EJ, Parker J, Odum J, Ashby J, Sumpter JP: Some alkyl hydroxy benzoate
preservatives (parabens) are estrogenic. Toxicology and Applied Pharmacology 1998,
153:12-19.
73. Shen HY, Jiang HL, Mao HL, Pan G, Zhou L, Cao YF: Simultaneous determination of seven
phthalates and four parabens in cosmetic products using HPLC-DAD and GC-MS
methods. Journal of Separation Science 2007, 30:48-54.
Figures
Figure 1 Cleaning product use, family history, and risk of breast cancer, stratified by beliefs
about causation
Adjusted odds ratios are shown for breast cancer and A) combined cleaning product use stratified by beliefs about environmental chemicals and breast cancer and B) family history of breast cancer stratified by beliefs about heredity and breast cancer, among participants living in Cape Cod, Massachusetts, 1988-1995. Odds ratios are adjusted for age, previous breast cancer diagnosis, age at first birth, and education; additionally, Figure 1A is adjusted for family history of breast cancer and Figure 1B is adjusted for study.

Tables Table 1 Characteristics of Cape Cod Breast Cancer and Environment Study participants with
completed pesticide use self-reports
Cases (N=787)
Controls (N=721)
Characteristic N % N %
Age at diagnosis or index year <50 128 16 149 21
50-59 115 15 129 18 60-69 277 35 226 31 70-79 221 28 184 26 ≥ 80 46 6 33 5
Education
< High school graduate 36 5 48 7 High school graduate 241 31 226 31 1-3 years college/vocational school 253 32 230 32 College graduate 144 18 122 17 Graduate work/degree 113 14 95 13
Family history of breast cancer
Yes 196 25 135 19 No 591 75 586 81
Prior history of breast cancer
Yes 48 6 46 6 No 739 94 675 94
Age at first live or stillbirth
<20 171 22 122 17 20-29 104 13 80 11 >=30 458 58 456 63 Nulliparous 54 7 63 9
Menopause status at diagnosis or index year Pre-menopause 144 19 194 28 Post-menopause 615 81 505 72
Data for 27 cases and 18 controls were missing for the “Family history of breast cancer” characteristic. Date for 28 cases and 22 controls were missing for the “Menopause status at diagnosis or index year” characteristic.
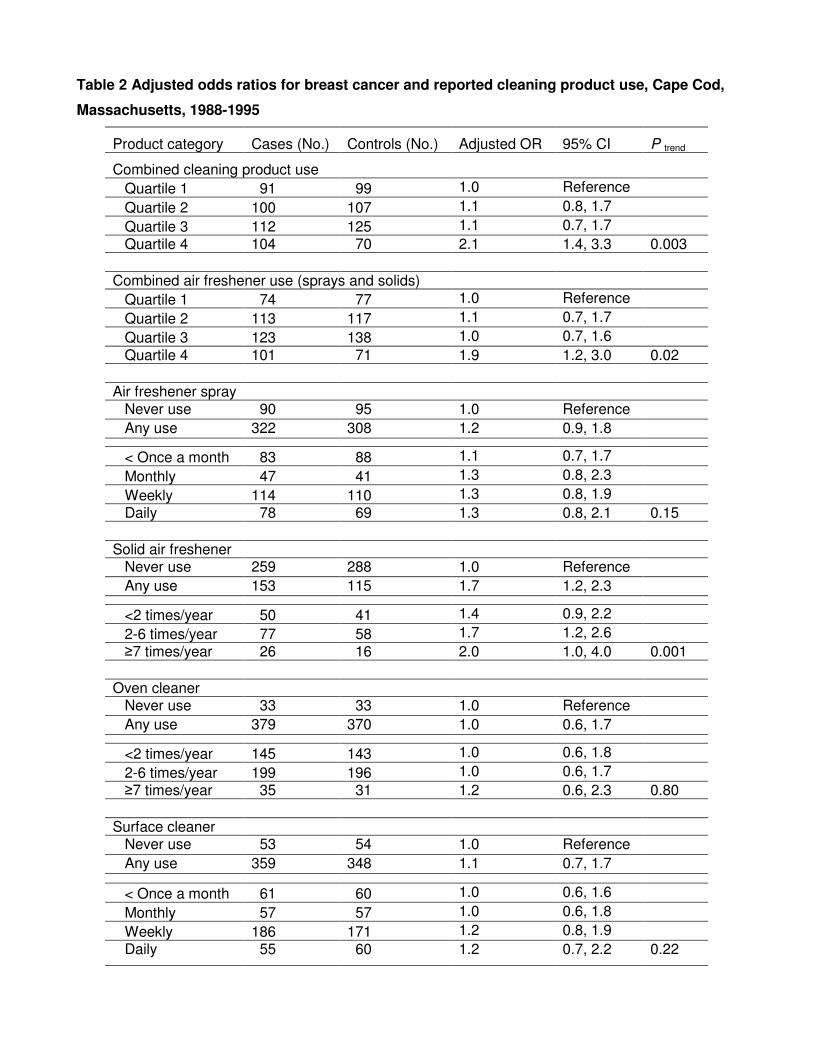
Table 2 Adjusted odds ratios for breast cancer and reported cleaning product use, Cape Cod,
Massachusetts, 1988-1995
Product category Cases (No.) Controls (No.) Adjusted OR 95% CI P trend
Combined cleaning product use Quartile 1 91 99 1.0 Reference
Quartile 2 100 107 1.1 0.8, 1.7
Quartile 3 112 125 1.1 0.7, 1.7 Quartile 4 104 70 2.1 1.4, 3.3 0.003
Combined air freshener use (sprays and solids) Quartile 1 74 77 1.0 Reference
Quartile 2 113 117 1.1 0.7, 1.7
Quartile 3 123 138 1.0 0.7, 1.6 Quartile 4 101 71 1.9 1.2, 3.0 0.02
Air freshener spray Never use 90 95 1.0 Reference Any use 322 308 1.2 0.9, 1.8
< Once a month 83 88 1.1 0.7, 1.7
Monthly 47 41 1.3 0.8, 2.3
Weekly 114 110 1.3 0.8, 1.9 Daily 78 69 1.3 0.8, 2.1 0.15
Solid air freshener Never use 259 288 1.0 Reference Any use 153 115 1.7 1.2, 2.3 <2 times/year 50 41 1.4 0.9, 2.2
2-6 times/year 77 58 1.7 1.2, 2.6 ≥7 times/year 26 16 2.0 1.0, 4.0 0.001
Oven cleaner Never use 33 33 1.0 Reference Any use 379 370 1.0 0.6, 1.7 <2 times/year 145 143 1.0 0.6, 1.8
2-6 times/year 199 196 1.0 0.6, 1.7 ≥7 times/year 35 31 1.2 0.6, 2.3 0.80
Surface cleaner Never use 53 54 1.0 Reference Any use 359 348 1.1 0.7, 1.7
< Once a month 61 60 1.0 0.6, 1.6
Monthly 57 57 1.0 0.6, 1.8
Weekly 186 171 1.2 0.8, 1.9 Daily 55 60 1.2 0.7, 2.2 0.22

Mold/mildew control Never use 296 322 1.0 Reference Any use 114 81 1.7 1.2, 2.3
Mold/mildew control with bleach Never use 320 334 1.0 Reference Any use 90 68 1.5 1.0, 2.1 < Once a month 47 38 1.2 0.8, 2.0
Monthly 14 11 1.5 0.7, 3.5 ≥ Weekly 29 19 2.0 1.1, 3.8 0.02
Odds ratios are adjusted for age at diagnosis/reference year, birth decade (six categories), previous breast cancer diagnosis, family history of breast cancer, age at first live or still birth (<30, ≥30/nulliparous), education (five categories). ”Combined cleaning product use” combines frequency of use across five product categories: air freshener spray, solid air freshener, oven cleaner, surface cleaner, and mold/mildew control with bleach.

Table 3 Adjusted odds ratios for breast cancer and residential pesticide use, Cape Cod,
Massachusetts, 1988-1995
Product category Cases (no.)
Controls (no.)
Adjusted OR (95% CI) P trend
Combined pesticide use Quartile 1 173 152 1.0 Reference
Quartile 2 110 99 1.0 0.7, 1.5
Quartile 3 169 143 1.1 0.8, 1.5 Quartile 4 153 126 1.1 0.8, 1.6 0.52
Insect or bug control Never use 161 151 1.0 Reference Any use 569 514 1.1 0.9, 1.4
Once or twice 161 155 1.0 0.7, 1.4
3-10 times 203 188 1.1 0.8, 1.5 > 10 times 205 171 1.2 0.8, 1.6 0.21
Termite or carpenter ant control Never use 293 265 1.0 Reference Any use 165 161 0.9 0.6,1.2 Once or twice 105 85 1.0 0.7,1.5
3-10 times 35 49 0.6 0.4,1.0 > 10 times 25 27 0.8 0.4,1.4 0.11
Mosquito control Never use 314 312 1.0 Reference Any use 91 87 1.0 0.7, 1.5 Once or twice 15 18 0.9 0.5. 1.9
3-10 times 35 31 1.1 0.7, 1.9 > 10 times 41 38 1.0 0.6, 1.7 0.79
Mothball control Never use 73 91 1.0 Reference Any use 340 312 1.2 0.8, 1.7 < 5 times 92 90 1.2 0.8, 1.9
5-10 times 62 73 0.9 0.6, 1.5 > 10 times 186 149 1.3 0.9, 1.9 0.29

Lawn care
Never use 316 286 1.0 Reference Any use 408 343 1.1 0.9, 1.3
Once or twice 43 35 1.2 0.7, 1.9
3-20 times 174 136 1.2 0.9, 1.6 > 20 times 191 172 1.0 0.7, 1.3 0.88
Outdoor and indoor plant care Never use 407 359 1.0 Reference Any use 334 300 1.0 0.8, 1.2
Once or twice 33 26 1.1 0.6, 1.8
3-20 times 158 146 1.0 0.7, 1.3 > 20 times 143 128 1.0 0.7, 1.3 0.71
Insect repellent Never use 286 271 1.0 Reference
Any use 482 428 1.2 0.9, 1.5 Rarely 283 263 1.1 0.9, 1.5
Sometimes 133 115 1.2 0.9, 1.7 Often/Very often 66 50 1.5 1.0, 2.3 0.05
Lice control
Never use 692 626 1.0 Reference
Any use 89 83 1.2 0.8, 1.6
Flea collar for pets
No 257 238 1.0 Reference
Yes 529 482 1.2 0.9, 1.5
Flea control for pets
Never use 465 395 1.0 Reference
Any use 294 286 1.0 0.8, 1.2 Once or twice 43 41 0.9 0.6, 1.5
3-10 times 101 109 0.9 0.6, 1.2 > 10 times 150 136 1.1 0.8, 1.4 0.95
Odds ratios are adjusted for age at diagnosis/reference year, birth decade (six categories), previous breast cancer diagnosis, family history of breast cancer, age at first live or still birth (<30, ≥30/nulliparous), education (five categories), study (Cape, PCE). ”Combined pesticide use” product category includes frequency data for: insect or bug control, lawn care, outdoor and indoor plant care, insect repellent, flea control on pets. Product use for termite or carpenter ant control, mosquito control, and mothball control not included because they were only assessed in study participants from the 1999-2000 interviews.

Table 4 Beliefs about the causes of breast cancer by case status, Cape Cod, Massachusetts,
1988-1995
Cases Controls
How much does … contribute to breast cancer? No. % No. %
Heredity A lot 331 42 474 66 **
A little 295 37 163 23
Not at all 99 13 36 5 Don’t know 62 8 48 7
Diet A lot 217 28 205 28
A little 327 42 294 41
Not at all 160 20 125 17 Don’t know 83 11 97 13
Chemicals and pollutants in the air or water A lot 476 60 412 57 * A little
188 24 203 28 Not at all 53 7 31 4
Don’t know 70 9 75 10
Women’s reproductive or breast feeding history A lot 67 9 70 10
A little 262 33 261 36
Not at all 245 31 225 31 Don’t know 213 27 165 23
Percentages may not add to 100% because of rounding. Two-sided P value calculated using chi square test; * indicates P<0.05 and ** indicates P<0.001.

Table 5 Adjusted odds ratios for breast cancer and cleaning product use stratified by disease
causation beliefs
Beliefs about environmental chemicals/pollutants and breast cancer
Contributes “a lot” Does not contribute “a lot”
Product category Cases (no.)
Controls (no.)
Adj. OR
95% CI P trend Cases (no.)
Controls (no.)
Adj. OR
95% CI P trend
Combined cleaning product use
Quartile 1 39 55 1.0 Ref. 52 44 1.0 Ref.
Quartile 2) 58 69 1.4 0.8, 2.4 42 38 0.9 0.5, 1.8
Quartile 3 71 74 1.6 0.9, 2.8 41 51 0.8 0.4, 1.4
Quartile 4 77 47 3.2 1.8, 5.9 0.0001 27 23 1.2 0.6, 2.6 0.96
Combined air freshener use (sprays and solids)
Quartile 1 34 43 1.0 Ref. 40 34 1.0 Ref.
Quartile 2 67 71 1.3 0.7, 2.4 46 46 0.9 0.5, 1.7
Quartile 3 76 86 1.3 0.7, 2.2 47 52 0.8 0.4, 1.6
Quartile 4 69 46 2.4 1.3, 4.5 0.01 32 25 1.4 0.7, 3.0 0.53
Air freshener spray
Never use 44 50 1.0 Ref. 46 45 1.0 Ref.
Any use 203 196 1.3 0.8, 2.1 119 112 1.2 0.7, 2.0
< Once a month 50 57 1.1 0.6, 2.0 33 31 1.1 0.6, 2.2
Monthly 32 32 1.2 0.6, 2.3 15 9 1.9 0.7, 5.0
Weekly 71 62 1.5 0.8, 2.6 43 48 1.0 0.6, 2.0
Daily 50 45 1.4 0.8, 2.7 0.12 28 24 1.2 0.6, 2.6 0.66
Solid air freshener
Never use 144 174 1.0 Ref. 115 114 1.0 Ref.
Any use 102 72 1.9 1.3, 2.9 51 43 1.4 0.8, 2.3 <2/year 27 28 1.3 0.7, 2.3 23 13 1.9 0.9, 4.1
2-6/year 58 32 2.6 1.6, 4.4 19 26 0.9 0.4, 1.8
≥7/year 17 12 1.7 0.8, 3.9 0.0007 9 4 2.8 0.8, 10.2 0.31
Oven cleaner
Never use 11 19 1.0 Ref. 22 14 1.0 Ref.
Any use 236 227 1.8 0.8, 4.0 143 143 0.6 0.3, 1.2 <2/year 96 86 2.0 0.9, 4.6 49 57 0.4 0.1, 1.3
2-6/year 112 121 1.5 0.6, 34 87 75 0.7 0.3, 1.5
≥7/year 28 20 2.4 0.9, 6.5 0.58 7 11 0.4 0.1, 1.3 0.73
Surface cleaner
Never use 29 36 1.0 Ref. 24 18 1.0 Ref.
Any use 218 209 1.5 0.9,2.7 141 139 0.7 0.4,1.5
< Once a month 23 30 0.9 0.4, 1.9 38 30 0.9 0.4, 2.0
Monthly 39 36 1.5 0.7, 3.1 18 21 0.6 0.2, 1.4
Weekly 120 103 1.7 1.0, 3.0 66 68 0.7 0.3, 1.5
Daily 36 40 1.7 0.8, 3.6 0.02 19 20 0.8 0.3, 2.1 0.45

Mold/mildew control
Never use 166 197 1.0 Ref. 130 125 1.0 Ref.
Any use 80 49 2.1 1.4, 3.3 34 32 1.1 0.6, 2.0
Mold/mildew control with bleach
Never use 179 202 1.0 Ref. 141 132 1.0 Ref.
Any use 67 44 1.8 1.2, 2.9 23 24 1.0 0.5, 2.0 < Once a month 33 25 1.4 0.8, 2.5 14 13 1.1 0.5, 2.4
Monthly 10 7 1.8 0.6, 5.1 4 4 1.1 0.3, 4.7
≥ Weekly 24 12 3.2 1.4, 7.1 0.002 5 7 0.8 0.2, 2.7 0.83
Odds ratios are adjusted for age at diagnosis/reference year, birth decade (six categories), previous breast cancer diagnosis, family history of breast cancer, age at first live or still birth (<30, ≥30/nulliparous), education (five categories). “Combined cleaning product use” product category combines frequency of use across five product categories: air freshener spray, solid air freshener, oven cleaner, surface cleaner, and mold/mildew control with bleach.

Table 6 Adjusted odds ratios for breast cancer and residential pesticide use stratified by disease
causation beliefs
Beliefs about environmental chemicals/pollutants and breast cancer
Contributes “a lot” Does not contribute “a lot”
Product category Cases (no.)
Controls (no.)
Adj. OR
95% CI P trend Cases (no.)
Controls (no.)
Adj. OR
95% CI P trend
Combined pesticide use
Quartile 1 91 87 1.0 Ref. 82 65 1.0 Ref.
Quartile 2 66 47 1.5 0.9, 2.5 44 52 0.7 0.4, 1.1
Quartile 3 104 89 1.2 0.8, 1.9 65 54 1.0 0.6, 1.7
Quartile 4 106 75 1.5 1.0, 2.4 0.16 47 51 0.7 0.4, 1.3 0.53
Insect or bug control
Never use 81 78 1.0 Ref. 80 73 1.0 Ref.
Any use 367 305 1.2 0.9, 1.8 202 209 0.9 0.6, 1.3
Once or twice 105 90 1.1 0.7, 1.8 56 65 0.8 0.5, 1.3
3-10 times 130 117 1.1 0.8, 1.7 73 71 1.0 0.6, 1.6
> 10 times 132 98 1.4 0.9, 2.1 0.12 73 73 0.9 0.6, 1.4 0.86
Termites / carpenter ants
Never use 161 146 1.0 Ref 132 119 1.0 Ref
Any use 112 102 1.0 0.7, 1.4 53 59 0.7 0.4, 1.1 Once or twice 68 54 1.1 0.7, 1.7 37 31 1.0 0.5, 1.7
3-10 times 28 30 0.9 0.5, 1.6 7 19 0.2 0.1, 0.6
> 10 times 16 18 0.8 0.4, 1.7 0.55 9 9 0.7 0.3, 2.1 0.06
Mosquito control
Never use 176 186 1.0 Ref. 138 126 1.0 Ref.
Any use 65 58 1.1 0.7, 1.7 26 29 0.8 0.4, 1.4 Once or twice 10 11 1.2 0.7, 2.2 5 7 0.7 0.2, 2.3
3-10 times 23 22 1.1 0.6, 2.1 12 9 1.2 0.5, 3.2
> 10 times 32 25 1.2 0.7, 2.2 0.47 9 13 0.5 0.2, 1.4 0.33
Mothball control
Never use 40 56 1.0 Ref. 33 35 1.0 Ref.
Any use 207 190 1.3 0.8, 2.1 133 122 1.0 0.6,1.8 < 5 times 50 55 1.2 0.7, 2.1 42 35 1.3 0.7, 2.7
5-10 times 40 53 1.0 0.5, 1.8 22 20 0.9 0.4, 2.0
> 10 times 117 82 1.6 1.0, 2.8 0.06 69 67 0.9 0.5, 1.7 0.41
Lawn care
Never use 190 169 1.0 Ref. 126 117 1.0 Ref.
Any use 250 196 1.1 0.8,1.5 158 147 1.1 0.8,1.5
Once or twice 24 21 1.0 0.5, 2.0 19 14 1.4 0.7, 3.0
3-20 times 115 83 1.2 0.8, 1.7 59 53 1.1 0.7, 1.8
> 20 times 111 92 1.0 0.7, 1.5 0.58 80 80 1.0 0.6, 1.5 0.98

Outdoor and indoor plant care
Never use 235 198 1.0 Ref. 172 161 1.0 Ref.
Any use 214 173 1.0 0.8, 1.4 120 127 0.8 0.6, 1.2 Once or twice 18 12 1.2 0.5, 2.6 15 14 0.9 0.4, 2.0
3-20 times 104 86 1.0 0.7, 1.5 54 60 0.8 0.5, 1.2
> 20 times 92 75 1.0 0.7, 1.4 0.99 51 53 0.9 0.5, 1.4 0.39
Insect repellent
Never use 153 134 1.0 Ref. 133 137 1.0 Ref.
Any use 312 261 1.2 0.9, 1.6 170 167 1.2 0.8, 1.7
Rarely 179 149 1.2 0.8, 1.6 104 114 1.1 0.7, 1.6
Sometimes 85 85 1.0 0.6, 1.5 48 30 1.9 1.1, 3.4
Often/Very often 48 27 2.0 1.1, 3.4 0.12 18 23 0.8 0.4, 1.6 0.45
Lice control
Never use 414 344 1.0 Ref. 278 282 1.0 Ref.
Any use 59 58 1.1 0.7, 1.7 30 25 1.4 0.8, 2.5
Flea collar for pets
No 132 122 1.0 Ref. 125 116 1.0 Ref.
Yes 344 290 1.3 0.9, 1.8 185 192 1.0 0.7, 1.4
Flea control for pets
Never use 256 214 1.0 Ref. 209 181 1.0 Ref.
Any use 196 177 1.1 0.8, 1.4 98 109 0.8 0.5,1.1
Once or twice 23 23 0.9 0.5, 1.6 20 18 1.0 0.5, 2.1
3-10 times 63 74 0.8 0.5, 1.2 38 35 0.9 0.6, 1.6
> 10 times 110 80 1.4 0.9, 2.0 0.27 40 56 0.6 0.4, 1.0 0.07
Odds ratios are adjusted for age at diagnosis/reference year, birth decade (six categories), previous breast cancer diagnosis, family history of breast cancer, age at first live or still birth (<30, ≥30/nulliparous), education (five categories), study (Cape, PCE). ”Combined pesticide use” product category includes frequency data for: insect or bug control, lawn care, outdoor and indoor plant care, insect repellent, flea control on pets. Product use for termite or carpenter ant control, mosquito control, and mothball control not included because they were only assessed in study participants from the 1999-2000 interviews.

Table 7 Beliefs about heredity as a cause of breast cancer by family history and case status
Cases Controls
Family history of breast cancer Family history of breast cancer
Yes No Yes No
Belief N % N % N % N %
Yes 120 61 211 36 83 61 391 67 Heredity contributes “a lot” to breast cancer
No 76 39 380 64 52 39 195 33

Figure 1