environmental impact analysis of alternative pallet
TRANSCRIPT

Rochester Institute of Technology Rochester Institute of Technology
RIT Scholar Works RIT Scholar Works
Theses
4-1-2011
Environmental impact analysis of alternative pallet management Environmental impact analysis of alternative pallet management
systems systems
Ainoa Mazeika Bilbao
Follow this and additional works at: https://scholarworks.rit.edu/theses
Recommended Citation Recommended Citation Mazeika Bilbao, Ainoa, "Environmental impact analysis of alternative pallet management systems" (2011). Thesis. Rochester Institute of Technology. Accessed from
This Thesis is brought to you for free and open access by RIT Scholar Works. It has been accepted for inclusion in Theses by an authorized administrator of RIT Scholar Works. For more information, please contact [email protected].

..
Rochester Institute of Technology
EENNVVIIRROONNMMEENNTTAALL IIMMPPAACCTT AANNAALLYYSSIISS OOFF AALLTTEERRNNAATTIIVVEE
PPAALLLLEETT MMAANNAAGGEEMMEENNTT SSYYSSTTEEMMSS
Thesis
submitted in partial fulfillment of the
requirements for the degree of
Master of Science in Sustainable Engineering
in the
Department of Industrial & Systems Engineering
Kate Gleason College of Engineering
by
Ainoa Mazeika Bilbao
April, 2011

DEPARTMENT OF INDUSTRIAL AND SYSTEMS ENGINEERING
KATE GLEASON COLLEGE OF ENGINEERING
ROCHESTER INSTITUTE OF TECHNOLOGY
ROCHESTER, NEW YORK
CERTIFICATE OF APPROVAL
MASTER OF SCIENCE DEGREE THESIS
The M.S. Degree Thesis of Ainoa Mazeika Bilbao
has been examined and approved by the
thesis committee as satisfactory for the
thesis requirement for the
Master of Science degree.
Approved by:
____________________________________
Dr. Andres L. Carrano (Chair of Committee)
____________________________________
Dr. Brian K. Thorn
____________________________________
Dr. Mike Hewitt

Committee Members
iii
CCOOMMMMIITTTTEEEE MMEEMMBBEERRSS
Andres L. Carrano, Ph.D.
Chair of Committee
Associate Professor, Industrial and Systems Engineering Department
Rochester Institute of Technology
Brian K. Thorn, Ph.D.
Associate Professor, Industrial and Systems Engineering Department
Rochester Institute of Technology
Mike Hewitt, Ph.D.
Assistant Professor, Industrial and Systems Engineering Department
Rochester Institute of Technology

Dedication
iv
II DDEEDDIICCAATTEE TTHHIISS WWOORRKK
TTOO MMYY PPAARREENNTTSS KKAARRLL AANNDD MMAAIITTEE
FFOORR TTHHEEIIRR UUNNCCOONNDDIITTIIOONNAALL LLOOVVEE AANNDD SSUUPPPPOORRTT,,
FFOORR BBEEIINNGG AANN EEXXAAMMPPLLEE TTOO FFOOLLLLOOWW
AANNDD GGUUIIDDIINNGG MMEE TTHHRROOUUGGHH MMYY PPEERRSSOONNAALL AANNDD PPRROOFFEESSSSIIOONNAALL CCAARREEEERR..
TTOO MMYY BBRROOTTHHEERRSS AANNDDOONNII AANNDD UUNNAAII
FFOORR CCOONNTTIINNUUOOUUSSLLYY FFUULLFFIILLLLIINNGG MMYY HHEEAARRTT WWIITTHH LLOOVVEE,, HHAAPPPPIINNEESSSS
AANNDD SSTTRREENNGGTTHH TTOO PPUURRSSUUEE MMYY GGOOAALLSS..
Acknowledgments
v
AACCKKNNOOWWLLEEDDGGEEMMEENNTTSS
The success of this study would not have been possible without the contribution and leadership given by
numerous people including my family, advisors, friends, colleagues, and various organizations.
I acknowledge my main advisor Dr. Andres Carrano, who since the beginning of my research helped me
to focus and direct my studies. He continuously provided me with meaningful support and guidance.
Because of his engagement and passion about supply chain and sustainability subjects, I had the
opportunity to learn, elevate my enthusiasm, and successfully complete my research.
I would like to express my gratitude to Dr. Mike Hewitt for his significant support during the
development of my work. His knowledge and experience in operations research helped me to effectively
develop a mathematical programming model. He was always available, gave me the guidance and
confidence to learn, and continuously provided valuable suggestions.
I am thankful for Dr. Brian Thorn‟s critical opinion and valuable advice. His knowledge in sustainability
and environmental issues was great support for my work and fueled my interest and passion.
On the other hand, my thanks to Brad Berfield and Tim Murphy for the opportunity to learn about
products‟ supply chain and pallet management. Moreover, I would like to thank the following people
who provided meaningful information and dedicated their time to discuss pallets and other issues: Chris
Merta, Ed Brindley, Edgar Deomano, Hillary Femal, Candice Herndon, Don Matre, Mike Schmitt, Michael
Tebay, Daniel Rozelle, Thomas Kausch, and James Winebrake.
Words are short to express my deep sense of gratitude to Janel for his patience and support, giving me
the strength to successfully accomplish my research, to my dear friends Ashley, Mauricio, and Jeff for
their knowledge, opinions, support, availability, and friendship, and to all my other friends for their love
and support.

Disclaimer
vi
Disclaimer
The models developed in this thesis could only be analyzed by invoking the very specific structural and
contextual assumptions that are described in the body of the work. The findings that arise from the study
of these models and the conclusions that are developed from these findings are, by extension, also
heavily dependent upon the assumptions invoked. Extrapolation of these findings to environments where
the modeling assumptions do not hold will likely yield unsupportable results, and is not encouraged.

Abstract
vii
AABBSSTTRRAACCTT
Pallets, the most common unit-load platform, allow the transportation of goods in an efficient and
reliable way. Every year, 700 million new pallets are manufactured and become part of the
approximately 2 billion pallets that are in circulation in the U.S. The total life-cycle environmental impact
of pallets depends on materials, manufacturing, handling processes, and the disposal practice (end-of-
life). Plastic pallets can be lighter and might last longer but their manufacturing processes are energy
intensive and could contribute significantly to greenhouse gas (GHG) emissions. On the other hand,
wooden pallets can be cheaper and easily repaired but present a shorter life. The ability to control the
end-of-life of the pallets and the associated environmental impacts of each scenario allows pallet pooling
service companies to provide logistics arrangements that are attractive to those companies seeking to
better manage their carbon footprint. The appropriate choice of pallet type (i.e. material, durability, etc.)
and management structure (e.g. cost, lease vs. buy, etc.) may lead to a more sustainable logistics
operation. The purpose of this study is to provide a model that would determine the impact of pallet
materials, manufacturing, distribution, and take back operations on an environmental performance
metric (such as carbon dioxide emissions) as well as cost. Mixed integer programming (a minimum cost
multi-commodity network flow problem) is used to design the system that determines the mix of pallets
(type, quantity, and pallet management system) for product distribution that balances overall
environmental impacts and costs according to companies‟ needs. Such a tool would aid in decision
making at the logistics and distribution levels. Results from a case study of a large grocery
distributor/retailer in the Northeast is presented.

Table of Contents
viii
TTAABBLLEE OOFF CCOONNTTEENNTTSS
Introduction ........................................................................................................................................................................ 1
Chapter I – Background Information ............................................................................................................................ 5
1.1 Pallet Industry ................................................................................................................................................... 5
1.1.1 Pallet Design ................................................................................................................................................. 6
1.1.2 Pallet Materials............................................................................................................................................. 7
1.1.3 Pallet Manufacturing and End-of-Life Scenarios ................................................................................... 9
1.1.4 Embodied Energy, Sanitation and Sterilization ................................................................................... 11
1.2 Sustainable Development ............................................................................................................................ 13
1.3 Life-Cycle Assessment.................................................................................................................................. 17
1.4 Pallet Management ........................................................................................................................................ 20
Chapter II – Literature Review .................................................................................................................................... 23
2.1 Pallet Life Cycle Stages ................................................................................................................................. 23
2.2 Life-Cycle Assessment.................................................................................................................................. 26
2.3 Multi-Objective Optimization ..................................................................................................................... 29
2.4 Problem Statement ....................................................................................................................................... 31
Chapter III – Methodology ........................................................................................................................................... 33
3.1 Pallet Network - A Proposed Model ........................................................................................................ 34
3.2 Detailed Model ............................................................................................................................................... 36
3.3 Modeling Approach ....................................................................................................................................... 39
3.3.1 Model Assumptions and Research Limitations .................................................................................. 40
3.3.2 Abbreviations ............................................................................................................................................. 42
3.3.3 Model Time Representation ................................................................................................................... 42
3.3.4 Pallet Lifespan ............................................................................................................................................ 44
3.3.5 Pallet Costs ................................................................................................................................................ 45
3.3.6 Nomenclature ............................................................................................................................................ 46
3.3.7 Objective Functions Coefficient Descriptions ................................................................................... 47
3.3.8 Decision Variables .................................................................................................................................... 49
3.3.9 Model Logic ................................................................................................................................................ 49
3.4 Mathematical Programming Model ............................................................................................................ 53
3.5 Input Data Collection ................................................................................................................................... 58

Table of Contents
ix
Chapter IV – Validation ................................................................................................................................................. 63
4.1 Assumptions .......................................................................................................................................................... 63
4.2 Validation ................................................................................................................................................................ 66
Chapter V – Case Study/Results and Analysis .......................................................................................................... 84
5.1 Case Study Grocery Distributor/Retailer ............................................................................................... 84
5.1.1 Modeling Pallet Lifespan .......................................................................................................................... 86
5.2 Results and Analysis ...................................................................................................................................... 88
5.2.1 What is the Tradeoff between Environmental Impacts and Costs? ............................................. 89
5.2.2 Which mix of Pallet Management Systems Minimizes the Environmental Impacts and Cost
under different time frames? .................................................................................................................................... 90
5.2.3 How much do pallet Weight and Purchase/Leasing Cost affect the Pallet Management
System used? How much does this affect the system costs and its environmental impacts? ................... 92
5.2.4 How much do pallet Weight and the CO2 footprint from Material primary production affect
the Pallet Management System used? How much does this affect the system costs and its
environmental burden? .............................................................................................................................................. 96
5.2.5 Does Demand affect the preferred Pallet Management System? ............................................... 100
5.2.6 Does Transportation affect the preferred Pallet Management System? ................................... 102
5.2.7 How can new Regulations on pallet End-Of-Life Scenarios influence the system carbon
footprint? 105
Conclusions and Future Work .................................................................................................................................. 107
References ...................................................................................................................................................................... 112
Appendices ..................................................................................................................................................................... 119
A. Validation and Case Study Input data ......................................................................................................... 120
B. Detailed Multi-Objective Optimization Model in AMPL, time horizon: 6 months .......................... 123
C. Case Study Grocery Distributor/Retailer (Demand and Distances)................................................... 134
D. Results ............................................................................................................................................................... 138
1. Minimizing system environmental impacts subject to minimum system cost ....................................... 138
2. Tradeoff between system costs and environmental costs ......................................................................... 138
3. Analysis of Factors: Pallet Weight and Pallet Purchase/Leasing Cost ..................................................... 139
4. Analysis of Factors: Pallet Weight and CO2 footprint from Material, primary production............... 143
5. Analysis of Factor: Demand .............................................................................................................................. 144
6. Analysis of Factor: Transportation .................................................................................................................. 145
7. Pallets End-of-Life alternatives Analysis ......................................................................................................... 147

List of Figures
x
LLIISSTT OOFF FFIIGGUURREESS
Figure 1. Type of pallet according to its structure (http://www.gmpallet.com) ................................................. 6
Figure 2. An example of a network of physical flow of pallets ............................................................................. 34
Figure 3. Pallet supply chain network applied to multiple facilities ...................................................................... 36
Figure 4. Life-cycle network of pallets ........................................................................................................................ 37
Figure 5. Time representation for nodes in set N ................................................................................................... 43
Figure 6. Pallet failure fraction ...................................................................................................................................... 45
Figure 7. Pallet flow with end-of-life reuse ................................................................................................................ 50
Figure 8. Environmental impact per end-of-life scenario per pound of material per pallet type.................. 62
Figure 9. Statement 3 Part A – CO2 footprint analysis for material and manufacture phases of pallet type
4 ........................................................................................................................................................................................... 70
Figure 10. Statement 3 – Part B - Pallet fraction used when the CO2 footprint from plastic primary
production and plastic pallet manufacture equal the CO2 footprint from wood primary production and
wood pallet manufacture ............................................................................................................................................... 72
Figure 11. Eco-Audit per pallet type (80 cycles) ...................................................................................................... 76
Figure 12. Statement 1 - Part A – Percentage of new pallets manufactured for different pallet type 1
purchase costs and for pallet type 1 selling price = $2/pallet (Time horizon: 5 years) .................................. 80
Figure 13. Statement 1 - Part B - Percentage of new pallets manufactured for different pallet type 1
purchase costs and for pallet type 1 selling price = $0/pallet (Time horizon: 1 year) .................................... 80
Figure 14. Statement 2 – Percentage of new pallets manufactured for different pallet type 4 leasing costs
(Time horizon: 1 year) .................................................................................................................................................... 81
Figure 15. Statement 3 – New pallets manufactured when all 4 pallet types have the same
purchase/leasing cost ($5/pallet) .................................................................................................................................. 82
Figure 16. Pallets life-cycle network applied to the case study ............................................................................ 85
Figure 17. Physical failure fraction representation per pallet ................................................................................ 88
Figure 18. Tradeoff between system environmental impacts and costs (Time horizon: 1 year).................. 89
Figure 19. Pallet use per pallet type when minimizing environmental impacts subject to minimum cost .. 90
Figure 20. Pallet use per pallet type when minimizing system environmental impacts allowing costs to
increase by 25 percent the minimum cost ................................................................................................................ 91
Figure 21. Levels for weight and purchase/leasing cost factors included in analysis ........................................ 92
Figure 22. Levels of factors weight and material CO2 footprint per pallet type included in analysis .......... 97
Figure 23. Levels for factor demand ......................................................................................................................... 100
Figure 24. Levels for factor distance ........................................................................................................................ 103
Figure 25. Eco-Audit when minimizing system cost subject to minimum environmental impacts for
different distances per cycle (Time horizon: 6 months) ..................................................................................... 103
Figure 26. Cost breakdown when minimizing system cost subject to minimum environmental impacts for
different distances per cycle (Time horizon: 6 months) ..................................................................................... 104
Figure 27. Levels for factor pallet end-of-life scenarios ....................................................................................... 105
Figure 28. Number of new pallets manufactured per pallet type when minimizing system environmental
impacts subject to minimum cost ............................................................................................................................. 138
Figure 29. Tradeoff between environmental impacts and costs (Time horizon: 6 months) ....................... 138

List of Tables
xi
LLIISSTT OOFF TTAABBLLEESS
Table 1. Pallet costs per trip in various materials (Raballan & Aldaz-Carroll, 2005) ........................................ 9
Table 2. Abbreviations used to identify each node set N ...................................................................................... 42
Table 3. Carbon dioxide footprint from material primary production .............................................................. 58
Table 4. Carbon dioxide footprint from pallet manufacture ................................................................................. 59
Table 5. Carbon dioxide footprint per material disposed ..................................................................................... 62
Table 6. General management characteristics per pallet type .............................................................................. 64
Table 7. Environmental base scenario - Number of pallets required to satisfy demand when minimizing
environmental impacts (Time horizon: 6 months) .................................................................................................. 67
Table 8. Environmental base scenario - Number of pallets required to satisfy demand when minimizing
environmental impacts (Time horizon: 1 year) ........................................................................................................ 67
Table 9. Statement 1 – Analysis of CO2 footprint from plastic production ...................................................... 68
Table 10. Statement 2 – Analysis of CO2 footprint from plastic pallet manufacture ...................................... 69
Table 11. CO2 footprint from material and manufacture life-cycle stages per pallet type ............................ 69
Table 12. Statement 4 – Analysis of pallet type 3 failure fraction ........................................................................ 73
Table 13. Statement 5 – Only pallets type 2 and type 3 in the system .............................................................. 73
Table 14. Statement 6 – Analysis of pallet type in pre-inventory ........................................................................ 75
Table 15. Pallet costs associated to each pallet management system (or pallet type) .................................... 78
Table 16. Cost base scenario - Number of pallets used when minimizing system cost (Time horizon: 6
months) .............................................................................................................................................................................. 79
Table 17. Cost base scenario - Number of pallets used when minimizing system cost (Time horizon: 1
year) .................................................................................................................................................................................... 79
Table 18. Statement 4 – Pallets types manufactured when wooden pallet issue costs increases ................ 83
Table 19. Weekly pallet demand at distribution centers (Dc) ............................................................................. 86
Table 20. Weekly pallet demand at retailers (Db) .................................................................................................. 86
Table 21. Pallets end-of-life percentages per pallet type ........................................................................................ 86
Table 22. 3 scenarios from total 64 combinations .................................................................................................. 94
Table 23. Minimizing environmental impacts subject to minimum system cost (Time horizon: 2 years) .. 94
Table 24. Minimizing environmental impacts when cost can increase to 20 percent the minimum cost
(Time horizon: 2 years) .................................................................................................................................................. 94
Table 25. Minimizing system cost subject to minimum environmental impacts (Time horizon: 2 years) .. 95
Table 26. Minimizing system cost when environmental impacts can increase to 20 percent the minimum
environmental impact (Time horizon: 2 years) ........................................................................................................ 95
Table 27. Costs modified per pallet type for this analysis ..................................................................................... 96
Table 28. Results when minimizing system cost subject to minimum environmental impacts
(Time horizon: 2 years) .................................................................................................................................................. 98
Table 29. Results when minimizing system cost allowing environmental impacts to increase by 5 percent
(α=5%) (Time horizon: 2 years) ................................................................................................................................... 99
Table 30. Low demand - Costs per pallet type under nominal values ............................................................. 101
Table 31. High demand - Costs per pallet type under nominal values ............................................................ 101
Table 32. Low demand - Costs modified from nominal values per pallet type ............................................. 102
Table 33. High demand - Costs modified from nominal values per pallet type ............................................. 102

List of Tables
xii
Table 34. Results comparison base scenario vs. regulation scenario when minimizing system cost subject
to environmental impacts (Time horizon: 6 months and 2 years) .................................................................... 106
Table 35. End-of-life scenarios base scenario vs. regulation scenario when minimizing system cost subject
to environmental impacts (Time horizon: 6 months) .......................................................................................... 106
Table 36. Carbon dioxide footprint from material primary production per pallet type ............................. 120
Table 37. Carbon dioxide footprint from pallet manufacture per pallet type ............................................... 120
Table 38. Carbon dioxide footprint from transportation per pallet type ....................................................... 121
Table 39. Carbon dioxide footprint from end-of-life life-cycle stage per pallet type ................................... 122
Table 40. Pallet demand at the 8 distribution centers (specific for validation and case study) ................. 134
Table 41. Pallet demand at the 75 retailers (specific for validation and case study) .................................... 135
Table 42. Percentage of pallet demand from each distribution center to each retailer .............................. 136
Table 43. Distances (in miles) between distributor's facilities (specific for validation and case study) ... 137
Table 44. 64 combinations for factors analysis (factors: Pallet Weight and Purchase/Leasing Cost) ....... 139
Table 45. 64 combinations results (Time horizon: 6 months) ........................................................................... 140
Table 46. 64 combinations results (Time horizon: 2 years) ............................................................................... 141
Table 47. Minimizing environmental impacts subject to minimum system cost (Time horizon: 6 months)
........................................................................................................................................................................................... 142
Table 48. Minimizing environmental impacts allowing costs to increase by 20 percent the minimum cost
(Time horizon: 6 months) ........................................................................................................................................... 142
Table 49. Minimizing system cost subject to minimum environmental impacts (Time horizon: 6 months)
........................................................................................................................................................................................... 142
Table 50. Minimizing system cost allowing environmental impacts to increase by 20 percent the
minimum environmental cost (Time horizon: 6 months) ................................................................................... 142
Table 51. 9 combinations for factors analysis (factors: Pallet Weight and CO2 footprint from material
production) .................................................................................................................................................................... 143
Table 52. 9 combinations results when minimizing system cost subject to minimum environmental
impacts (Time horizon: 6 months) ......................................................................................................... 143
Table 53. 9 combinations results when minimizing system cost subject to environmental impacts for α=5
percent (Time horizon: 6 months) ........................................................................................................................... 143
Table 54. Low demand at DCs .................................................................................................................................. 144
Table 55. Low demand at RETs ................................................................................................................................. 144
Table 56. High demand at DCs ................................................................................................................................. 144
Table 57. High demand at RETs ................................................................................................................................ 144
Table 58. Distance traveled within distributor‟s facilities (on average 30 miles) .......................................... 145
Table 59. Distance traveled within distributor‟s facilities (on average 3,000 miles)..................................... 146
Table 60. End-of-life alternatives base scenario vs. regulation scenario when minimizing system cost
subject to environmental impacts (Time horizon: 2 years) ................................................................................ 147

Introduction
1
IINNTTRROODDUUCCTTIIOONN
Supply chains are growing more and more complex. This is due to many factors, including the expansion
of global markets and product SKUs (stock-keeping units), an increased variety of shipping and
distribution modes, and rising expectations from customers, particularly with respect to service levels
and delivery times. At the same time, companies are striving to make their supply chains more efficient
and more sustainable. For example, Walmart in the U.K. makes continuously improvements in their
fleets to reduce their energy and carbon footprint. Asquith and Dairies (ASDA) (subsidiary of Walmart)
delivered more than 40 million more cases/containers in 2009 than in 2008 while eliminating almost 9
million miles. Their fleet efficiency improvement from 2005 to 2009 allowed them to avoid emitting
more than 81,000 metric tons of CO2 in 2009. In addition, other efforts of product distributor‟s are
focused on being supplied 100 percent by renewable energies while installing solar panel power projects
and purchasing electricity generated by renewable sources, and in eliminating waste from stores by
improving their recycling and waste redirection efforts (Walmart, 2010).
One way to make a company‟s supply chain more competitive and sustainable is to evaluate their
shipping and distribution operations. Pallets, being the most common unit load platform for handling and
storing goods, are a critical component of these operations. Because many pallets are used when
producing and distributing large quantities, the environmental impacts associated with the use of a single
pallet are greatly multiplied.
Pallets, the most common unit-load platform, allow the transportation of goods in an efficient, reliable,
and seamless way. It is estimated that 80 percent of U.S. trade is carried on pallets (Raballan & Aldaz-
Carroll, 2005). Every year, 700 million new pallets are manufactured and become part of the large pool
(roughly 2 billion) of pallets that are in circulation in the U.S. (Grande, 2008). In the European Union

Introduction
2
some 280 million pallets are in circulation every year. Many of these pallets are used only a few times
and end up meeting one of the end-of-life scenarios (e.g. landfill, municipal incineration, or downcycling)
while others are repaired and reused many times. As companies set goals to become more sustainable, a
thorough understanding of the environmental impacts of their operations becomes critical.
The life-cycle environmental impact of pallets depends on materials, manufacturing, handling processes,
and the disposal practice (end-of-life). The embodied energies1 for the raw materials generally used to
make pallets vary. High-density polyethylene (HDPE) has an embodied energy of 8320 to 9200 kcal/lb.,
while the embodied energy of hardwood oak ranges from 780 to 862 kcal/lb. The subsequent processing
of the raw materials to fashion them into pallets also consumes energy and, therefore, adds to the
embodied energy of the finished pallets. Plastic pallets might be lighter and last longer, but their
manufacturing processes are energy intensive and perhaps contribute significantly to greenhouse gas
(GHG) emissions. On the other hand, wood pallets are cheaper and easily repaired but present a
shorter life.
Once a pallet has been used for the distribution of consumer products they may experience different
end-of-life scenarios. The scenarios include reuse, remanufacture (repair in pallets context), materials
recycling, incineration, and landfilling. A high percentage of damaged wooden pallets are repaired; while
others are recycled. Recycling of wood from pallets is really a downcycling step. The material is chipped
and ground to produce either landscape mulch or animal bedding, which allows for waste reduction and
adds another lifecycle to the materials. Other disposal scenarios for wooden pallets include landfilling or
incineration depending on the local practices and regulations. When plastic pallets get damaged, they are
shredded and the resulting plastic is recycled to make either new pallets or other plastic products. The
structural metal components usually found in plastic pallets are also recycled. Typically, plastic pallets are
1 The embodied energy of a material is the energy required to produce a unit of that material from its raw material ores and
feedstocks. Embodied energy is usually described in terms of energy content per unit weight (eg. kcal/lb or MJ/kg) (CES, 2010)

Introduction
3
not repaired. All these scenarios and practices offset or produce different levels of GHG emissions and
will consequently impact the environment.
Product transportation also negatively impacts the environment. The Department of Transportation
(BTS, 2009) estimates that transportation represents roughly 10 percent of the U.S. gross domestic
product, or approximately $1.4 trillion. In 2006, there were 8.8 million trucks that traveled
approximately 263 billion miles. Freight, in its many forms, accounts for 470 million metric tons of
carbon dioxide equivalent annually (7.8 percent of total U.S. CO2 emissions), and it contributes about 50
percent of NOx emissions and 40 percent of particulate matter emissions from transportation sources
(EPA, 2006; FHA, 2010). Truck freight accounts for 70 percent of all these emissions. Pallets are
indirectly responsible for a share of the emissions that are generated as the pallets and their cargo move
through the supply chain. Primary freight transportation methods (ship, rail, air, and truck) are all fossil
fuel based, and heavier pallets will require more fuel to transport them than lighter pallets. In addition to
the product shipping operation, the pallet take back logistics produces CO2, SOx, NOx, and particular
matter emissions. Therefore, pallet management systems may dramatically affect the environmental
impacts arising from the operation of product transportation and delivery systems.
The ability to control the end-of-life of the pallets and the associated environmental impacts of each
scenario allows pallet pooling service companies to provide logistics arrangements that are attractive to
companies seeking to manage their carbon footprint. However, the complexities of today‟s supply chains
and the breadth of environmental impacts pose a challenge to those seeking to engage in sustainable
practices. The challenges will lie on selecting the appropriate pallet type (i.e. material, durability, etc.)
and management structure (e.g. cost, lease vs. buy, etc.) while keeping other aspects in consideration
(e.g. toxicity, etc.).
This research addresses the two attributes of a pallet that determine much of its cost and environmental
impact: (i) how it is managed and, (ii) what it is made of. A proposed method for choosing these

Introduction
4
attributes in a way that balances the tradeoffs between cost and an environmental performance metric
such as carbon dioxide emissions is explained in detail. Such a tool can aid in decision making at the
logistics and distribution level, which will determine the optimal mix of pallets (quantity, material, and
pallet management system) to be delivered among facilities, in order to reduce the use of resources,
transportation and thus, fuel emissions. Consequently, this will create a better management of resources
and material flow system while cutting down the cost of logistics.
Mathematical programming is used to design the system that yields the lowest levels of environmental
impacts (such as CO2 emissions) resulting from pallet materials, manufacturing, distribution, and take
back operations, while reducing costs.
A case study from a large grocery distributor/retailer in the Northeast is presented. Pallet providers
supply pallets to consumer product manufacturers to transport their products through product
distributor‟s facilities. The grocery distributor/retailer owns 8 distribution centers, 75 stores, and a
single return center.

Chapter I – Background Information
5
CCHHAAPPTTEERR II
BBAACCKKGGRROOUUNNDD IINNFFOORRMMAATTIIOONN
This chapter provides information on pallet designs, materials, manufacturing processes, sustainable
development, life cycle assessment, and pallet management.
1.1 PALLET INDUSTRY
Pallets are rigid horizontal platforms for unit load formation that are easily portable by special material
handling equipment. They serve for storing, stacking, handling, and transporting goods as a unit load
(http://www.mhia.org/industrygroups/rpcpa). A unit load describes “a single item, a number of items, or
a bulk material, that is arranged and restrained so that the load can be stored, picked up, and moved
between two locations as a single mass” (White & Hamner, 2005). Pallets allow reducing handling costs
and avoid the use of other more expensive devices to lift products.
Different materials are used for the production of pallets, such as wood, corrugated cardboard, plastic,
metal, and hybrid composites. In the U.S. an estimated 500 million new pallets were produced in 2006,
from which approximately 441 million were made of wood. Other materials, such as plastics (8.3
million) are usually used to conform with sanitary regulations in the grocery industry; while metals (1.1
million) are used in closed-loop material systems for their durability (Bush & Araman, 2009; White,
2004). They all present different characteristics with respect to cost, durability, weight, sanitization and
decontamination, load rating, stackability, and tolerance for abuse.

Chapter I – Background Information
6
1.1.1 PALLET DESIGN
Pallets may be either reusable (also called nonexpendable or multi-use) or expendable (single-use, one-
way or limit-use). Reusable pallets are built for strength and durability, and are designed for prolonged
use. These types of pallets are made of metal, plastic, or wood (mainly hardwood). Reusable wood
pallets are often made from thicker, more durable wood and are frequently purchased for warehouse or
factory use. Expendable pallets are generally used in shipping and transportation when the shipper does
not expect to have the pallets returned. Expendable wood pallets are generally built from lighter, less
expensive wood, as low grade softwood, and are designed for a limited number of uses (McKeever et
al., 1982).
With respect to its design, pallets can be categorized as stringer pallets or block pallets (refer to Figure
1). Stringer pallets use a frame of three parallel pieces called stringers. The deckboards are then placed at
right angles to the stringers to create the loading platform. The deckboards comprise the top and
bottom exterior of a pallet. The term bottom deck is usually used for the arrangement of deckboards
that make up the lower, load-bearing surface of the pallet. When a pallet has both, the upper and lower
deckboards, it is called a reversible or double faced pallet; if it only has the upper deck it is known as non-
reversible or single faced pallet. Block pallets are typically stronger than stringer pallets. Block pallets utilize
both parallel and perpendicular stringers to better facilitate efficient handling. A stringerboard is a
component of a pallet that is a solid board placed between the deckboard and the block and extending
the full length of a block pallet.
(a) Stringer Pallet (b) Block Pallet
Figure 1. Type of pallet according to its structure (http://www.gmpallet.com)
Chapter I – Background Information
7
Pallets can be “two-way entry” or “four-way entry” pallets, allowing two or four sides‟ insertion of forks.
Pallets have different names depending on the construction of the decks and stringers. A flush pallet is a
pallet constructed in such a manner that there are no overhangs and the decks, both top and bottom, fit
„flush‟ with the stringers on all sides. A single wing pallet is a pallet whose top deckboards extend beyond
the edges of the stringers and whose bottom deckboards are flush. A double wing pallet is a pallet
constructed in such a way as to have the top deck extending out from opposite sides
(http://www.wikimheda.org). The reusable stringer pallet is the most used in the U.S., representing 41.9
percent of total pallet production for 2006 (Bush & Araman, 2009).
Approximately 2 billion pallets are in use at any moment in the U.S. (NWPCA, 1999). Most of those
pallets are designed to meet the specific performance requirements of the customer. There are more
than 400 different pallet sizes. In 1976, the Grocery Pallet Council and Canadian Pallet Council
introduced the first pallet standard, now called the Grocery Manufacturers Association or “GMA”
specification. The standard footprint, 48 inches long (stringer length) and 40 inches wide (deckboard
length) (known as 48x40) was developed to improve the supply chain operations while reducing the
costs associated with multiple pallet specifications (Ray, 2007 presented in (IFCO, 2009)). This pallet is
usually 5 inches high. Today, the GMA pallet size is the most common standard size in the U.S., which
accounts for approximately 26.9 percent of all new wood pallets produced in the U.S. (Bush & Araman,
2009). In Europe the most widely used pallet size is 1200x800mm2 (called Euro pallet) and in Asia the
1100x1100mm2 (Buehlmann et al., 2009).
1.1.2 PALLET MATERIALS
Wooden pallets are made of either softwood (spruce, pine, douglas-fir, among other species) or
hardwood (oak, maple, or mixed hardwoods); with the Oak species group being the predominant one

Chapter I – Background Information
8
within hardwoods (22.4 percent) and the Southern Pine species group within the softwoods (7.1
percent) (Bush & Araman, 2009). Wooden pallets can be cheap and easily reparable. A high percentage
is made of lumber that is left over from buildings materials and furniture (NWPCA, 2008). Depending
on their structure they can last from 4 to 30 trips, assuming 8 handlings per trip, which gives an
estimated service life of 0.5 to 1.5 years (Brindley, 2010). A wood pallet can greatly vary in weight
depending on the type of wood and structure used. Typically they range between 40 and 90 pounds per
pallet (E. Deomano, personal communication, July 15, 2009).
Plastic pallets are mainly made of polyethylene, either new HDPE (high-density polyethylene) or recycled
PET (polyethylene terephthalate) (PCRS, 2000; White, 2004). They are usually stackable and durable,
lasting between 60 and 250 trips (Brindley, 2010; Pearson, 2009). They resist weathering, chemicals, and
corrosion, and can weigh between 12 and 75 pounds a pallet depending on their structure and
manufacturing process (Grande, 2008). A plastic pallet‟s life service varies from 5 to 10 years, or
sometimes even longer, depending on the handling systems used along their useful life.
Metal pallets are strong and the most durable. They are used for heavy loads and loads moved by abrupt
logistic systems. They are bug free and sanitary. Materials for metal pallets manufacture include carbon
steel, stainless steel, and aluminum. Carbon steel offers high durability at the lowest cost, although it is
susceptible to rusting. Stainless steel advantage is that it does not require a paint coating. Aluminum is
extremely lightweight in relation to its strength; it is an inert material that is not combustible and poses
no health risks. Metal pallets can weigh between 40 and 160 pounds a pallet and their service life varies
from 9 to 15 years. Stainless steel and aluminum pallets are the most expensive pallets. They can cost
from 2 to 3 times more than pallets made of wood, plastic, and even carbon steel.
The typical wood pallet is manufactured by first cutting the lumber (softwood or hardwood) to length,
and then ripping the short lumber into pallet parts; stringers are notched and assembled using nailing
machines. New wood pallets are built from the downfall that is left over from producing building

Chapter I – Background Information
9
materials and furniture; rarely are trees cut down to make pallets (National Solid Waste Management
Association presented in (IFCO, 2009)).
The tradeoff between cost and durability of pallets greatly influences the choice of pallet material. In one
report by the World Bank (Raballan & Aldaz-Carroll, 2005), the costs per trip (one pickup/drop-off
cycle with significant travel in between) were summarized for a few materials:
Table 1. Pallet costs per trip in various materials (Raballan & Aldaz-Carroll, 2005)
Although the analysis presented in Table 1 is based on assumptions, the deductions are nonetheless the
same: softwood pallets can be inexpensive but only last a few trips and may not be worth repairing,
whereas plastic pallets can last a long time but their cost is significantly higher; while the cost and
durability of hardwood pallets fall in between that of softwood and plastic (but they are typically
repaired).
1.1.3 PALLET MANUFACTURING AND END-OF-LIFE SCENARIOS
The manufacturing process for plastic pallets is typically more energy intensive than for wood pallets.
The production of a common 48x40 plastic pallet can consume up to 8 times more raw material, and up
to 5 times more energy to source, process and manufacture, than a comparable reusable wood pallet
(Lacefield, 2008). Injection molding and thermoforming are the dominant processing methods for
manufacturing plastic pallets; other include structural foam molding, rotomolding, and compression
Hardwood Softwood Plastic
Cost (new) $9.00 $6.00 $60.00
Cost (rebuilt) $6.00 N/A N/A
Estimated life 25 trips 2 trips 100 trips
Cost per trip $0.36 $3.00 $0.60

Chapter I – Background Information
10
molding (Grande, 2008). Each of the five main processes used to make pallets has its own advantages in
terms of productivity, performance, and end-use application. For the process of injection molding, plastic
gets injected, under pressure, into a closed cavity mold, and then the material is cooled to ensure that it
maintains the exact shape of the mold. This process produces a solid wall, solid core part. These pallets
weigh approximately 40 pounds. Thermoforming can be single sheet or twin sheet. In single sheet
thermoforming, a sheet of plastic is heated and then drawn by vacuum over a mold. In twin sheet
thermoforming, two sheets of plastic are heated and drawn by vacuum over separate molds and then
fused together through pressure to form a structural double walled part. Pallets made by thermoforming
are impact resistant and have an average weight of 20 and 30 pounds; they are commonly used in the
grocery industry and in distribution services. In structural foam molding plastic and nitrogen gas are
injected into a closed cavity mold, which gets cooled to create the exact shape of the mold. The
combined use of these materials creates a cellular core that forms a solid skin. These pallets weigh 40
pounds on average and have superior static load capacity for racking, distribution, and stacking. They are
commonly used in the automotive industry. Rotomolding is typically used for large, custom, heavy-duty
pallets for conveyor systems, food processing, and warehouse storage. It offers low-cost tooling but
cycle times are longer. Compression molding has emerged as an attractive method that can handle the
variable processing characteristics of recycled resins. Other manufacturing processes are blow molding
and profile extrusion (PCRS, 2003; White, 2004; http://plasticpallet.com).
Some wooden pallets are repaired when damaged. A damaged pallet is disassembled and broken parts
are removed. Broken components are replaced. Severely damaged pallets are ground up for mulch,
shredded for animal bedding, furnished for fiber-based products, or used as energy fuel. Stringers can be
repaired using metal connector plates (NWPCA, 2008).
When plastic pallets get damaged, they get ground down (recycled), and the resulting plastic is reused to
make new pallets or used for other applications. The attrition rate of plastic pallets is considered to be
very low; for example, only 0.003 percent of a total of 2 million pallets handled by iGPS (Intelligent

Chapter I – Background Information
11
Global Pooling Systems) in 2008, which only represents 60 pallets, got damaged and required recycling
(Lacefield, 2008).
1.1.4 EMBODIED ENERGY, SANITATION AND STERILIZATION
The embodied energy of a material is the energy required to produce a unit of that material from its
raw material ores and feedstocks. Embodied energy is usually described in terms of energy content per
unit weight (eg. kcal/lb or MJ/kg). This metric is useful in distinguishing materials that can be synthesized
without the investment of large amounts of energy (e.g. the embodied energy of cast iron ranges from
1.78-1.97 kcal/lb) from those that are very energy intensive (e.g. the embodied energy of platinum is
about 12,400,000 kcal/lb) (CES, 2010).
The embodied energies for the raw materials generally used to make pallets vary. High-density
polyethylene (HDPE) has an embodied energy of 8320 to 9200 kcal/lb., while the embodied energy of
oak (a hardwood used to make durable wood pallets) ranges from 780 to 862 kcal/lb. The subsequent
processing of the raw materials to fashion them into pallets also consumes energy and therefore adds to
the embodied energy of the finished pallets. Processing HDPE pellets into pallets will require an energy
intensive polymer injection molding process (665-735 kcal/lb) or other thermoforming operation (e.g.
polymer extrusion 262-289 kcal/lb), while transforming oak boards merely requires simple cutting and
assembly which can be done without the investment of much new energy (51.5-56.9 kcal/lb). The
material recycling energy is approximately 2880-3190 kcal/lb for HDPE. Both wood and plastic can be
combusted for energy recovery with the net heat of combustion being 4760-5010 kcal/lb for HDPE and
2140-2310 kcal/lb for oak (CES, 2010).
Pallets made of raw, untreated wood are required to comply with ISPM 15, which is an International
Standard for Phytosanitary Measure imposed by the International Plant Protection Convention (IPPC,

Chapter I – Background Information
12
2009)2 that addresses the treatment of wooden pallets used to ship products between countries for
them to get incapable of being a carrier of invasive species of insects and plant diseases. Pallets get
treated by either of the following means under the supervision of an approved agency: heat treatment,
or chemical fumigation. Pallets made of non-wood materials such as steel, aluminum, plastic, or
engineered wood products, such as plywood, oriented strand board, or cardboard do not need IPPC
approval (http://www.atafreight.com).
During heat treatment, wooden pallets are heat treated until the core temperature of the pallet reaches
a minimum temperature of 56 °C (132.8 °F) for at least 30 minutes. During fumigation, pallets may be
treated with methyl bromide according to a schedule that achieves a specified minimum concentration-
time product (CT) over 24 hours at temperatures and final residual concentrations as specified. Note
that there may be important environmental impacts to consider with either approach (heat treatment
and fumigation). Certainly, energy will be required to elevate the temperature of pallets to 56 °C (133
°F) for those pallets that undergo heat treatment, and will therefore increase the embodied energy of
pallets so treated. Increasing the embodied energy of pallets is not the only environmental impact that
can arise from sanitation measures. ISPM sanctions fumigation with methyl bromide as a sanitary
measure. When used as a fumigant, methyl bromide gas is injected into a chamber or under a tarp
containing the material to be sterilized. About 80 percent to 95 percent of the methyl bromide used for
a typical treatment eventually enters the atmosphere (EPA, 2010; MBAO, 2010). Methyl bromide is
known to be an ozone depleting material with an ozone depleting potential in the range between 0.2 and
0.5 (EPA, 2010). Furthermore, methyl bromide is a toxic material. According to the U.S. EPA (2010),
“exposure to high concentrations of it can result in central nervous system and respiratory system
failure, as well as specific and severe deleterious actions on the lungs, eyes, and skin. Exposure to high
concentrations has resulted in a number of human deaths”.
2 The IPPC is an international treaty to secure action to prevent the spread and introduction of pests of plants and plant
products, and to promote appropriate measures for their control. It is governed by the Commission on Phytosanitary Measures
(CPM) which adopts International Standards for Phytosanitary Measures (ISPMs) (IPPC, 2009).

Chapter I – Background Information
13
On the other hand, some plastic pallets are treated with flame retardants, especially deca-bromine,
which is a chemical fire retardant commonly added to the petroleum-based polymer pallets in order to
raise ignition temperature, reduce rate of burning, and reduce time to smoke generation to be
equivalent or better than standard wooden pallets (NWPCA, 2009). There have been warnings about
the dangers of using pallets treated with deca-bromine in the hydrocooling process for fruits and
vegetables as well as raised concerns about the potential carcinogenic effect of deca-bromine (Brindley,
2009).
1.2 SUSTAINABLE DEVELOPMENT
Sustainable development is one of the most fundamental challenges confronting humanity. While
everybody agrees about the need for sustainable development, the term still suffers from difficulties
because there is no commonly accepted definition.
The notion of progress as something that is possible endlessly into the future was first challenged in
1972 in a report called The Limits to Growth, published by the Club of Rome, an international association
of scientists, business executives, public officials, and scholars. The report challenged the idea of
progress that compares the present with the past, and considers the future an endless possibility for
further growth and improvement; on the argument that it failed to acknowledge the obvious truth that
resources are finite, and hence growth dependent on resources cannot be endless (Meadows et al.,
1972).
The World Conservation Strategy3 was aimed at policy-makers, development practitioners, and
conservationists. It defined conservation in human terms as “the management of human use of the
3 The World Conservation Strategy is a document published in 1980 and prepared by the International Union for Conservation
of Nature and Natural Resources (IUCN) (currently the World Conservation Union) with the cooperation of the World
Wildlife Fund (WWF) and the United Nations Environment Programme (UNEP), which explains the contribution of living

Chapter I – Background Information
14
biosphere so that it may yield the greatest sustainable benefit to present generations while maintaining
its potential to meet the needs and aspirations of future generations”. Development was defined as “the
modification of the biosphere and the application of human, financial, living and, non-living resources to
satisfy human needs and improve the quality of human life. For development to be sustainable it must
take account of the social and ecological factors as well as the economic ones” (IUCN-UNEP-WWF,
1980). These definitions got close to the concept of sustainable development.
However it was the World Commission on Environment and Development that brought the idea of
sustainable development into broader discussion; although it was not until the United Nations (UN)
Conference for Environment and Development (or also known as Earth Summit) in Rio de Janeiro in
1992 that the concept was discussed in a global public policy debate. Our Common Future, the book of
the UN World Commission on Environment and Development, also known as the Brundtland Report,
defined sustainable development as the “development that meets the needs of the present generation without
compromising the ability of future generations to meet their own needs”. This concept implies that there are
limits on environmental resources and the ability of the biosphere to absorb human activities. These
limits are seen to have roots in technological inadequacies and inequitable social organization. Thus,
sustainable development must entail a process of change in which the exploitation of resources, the
direction of investments, the orientation of technological development, and institutional change are
made consistent with future as well as present needs (World Commission on Environment and
Development, 1987).
The overall driver used to begin the discussion of technological change, though phrased mathematically,
is largely a conceptual expression of what factors create environmental impact in the first place. This
equation represents environmental impact (I), as the product of three variables, (i) population (P),
(ii) affluence (A), and (iii) technology (T), known as the Master Equation or IPAT Equation. This equation,
resource conservation to human survival and to sustainable development, identifying the priority conservation issues and the
main requirements for dealing with them and proposing ways for effectively achieving the Strategy‟s aim (WCS).

Chapter I – Background Information
15
along with the modern environmental movement, was born around 1970. Although the IPAT equation
was once used to determine which single variable was the most damaging to the environment. an
industrial ecology view reversed this usage, recognizing that increases in population and affluence can, in
many cases, be balanced by improvements to the environment offered by technological systems
(Chertow, 2001).
Corporations and organizations have started to measure their success through traditional economic
factors and social and environmental values. In this evolution, some have categorized sustainability into
three primary components often referred to as the triple bottom line: economic, social and environmental
components (also known by people, planet, and profit). Triple bottom line attempts to describe the social
and environmental impact of an organization's activities, in a measurable way, to its economic
performance in order to show improvement or to make evaluation more in depth (Dictionary of
Sustainable Management, 2009).
Walmart announced in 2005 three environmental goals: to be supplied 100 percent by renewable
energy, to create zero waste, and to sell products that sustain resources and the environment. Walmart
has been continuously focused on efforts to improve the efficiency and lower the greenhouse gas
(GHG) emissions of their stores (Walmart, 2010).
Johnson & Johnson increased its use of rail to transport freight within the U.S. and between the U.S. and
Canada by approximately 24 percent in 2009, equivalent to removing more than 6,800 trucks from the
highways. This reduced congestion, decreased the risk of driver-related accidents and saved more than
630,000 gallons of diesel fuel, eliminating approximately 6,800 tons of CO2 emissions - a 28 percent
reduction in emissions for these shipments since 2008. Further, their investments in renewable energy
reduced CO2 emissions from their worldwide facilities by 15.9 percent in 2009 compared to 1990 (J&J,
2010).

Chapter I – Background Information
16
In addition, Procter & Gamble uses a life cycle assessment approach to focus their sustainable
innovations on areas where they will have the most meaningful environmental improvement. For
example, innovative designs avoided the use of 312,000 metric tons of packaging material since 2007,
allowing saving 735 metric tons of paper per year, 368 fewer truck trips, and 80 percent reduction in ink
usage. Their efforts in operations have allowed a percentage reduction per unit production of 50
percent in energy usage, 53 percent in CO2 emissions, 55 percent in waste disposal, and 55 percent of
water usage since July 2002. P&G is focused on improving the logistics stage of the supply chain by
implementing changes to the rate, route, mode, and method of transportation. Their long term
operational end-points are to power their plants with 100 percent renewable energy, emitting no CO2
or toxic emissions, using 100 percent renewable or recycled materials for all products and packaging,
and having cero consumer and manufacturing waste go to landfills (P&G, 2010).
Similarly, a growing number of firms have begun to develop the next generation of clean technologies to
drive future economic growth. BP and Shell are ramping up investments in solar, wind, and other
renewable technologies that might ultimately replace their core petroleum business. In the automotive
sector, Toyota and Honda, have already entered the market with hybrid power systems in their vehicles,
which dramatically increase fuel efficiency. Firms such as Cargill and Dow are exploring the development
of biologically based polymers to enable renewable feedstock, such as corn, to replace petrochemical
inputs in the manufacturing of plastic (Hart, 2007).
All companies‟ efforts on taking social responsibility will help reduce resource consumption, waste,
water use, and toxic emissions, which will allow conserving the environment, while increasing their
economic performance.
Furthermore, sustainability is increasingly discussed by policy makers, the popular press, and journals in
various technical fields. First considerations of sustainability can be traced back to decades of years ago,

Chapter I – Background Information
17
although research literature shows that an increased interest on the term and the environment has been
found since the 1990s and has quickly increased since then (Linton, Klassen, & Jayaraman, 2007).
Sustainability has become a wide ranging concept that can be applied to a large range of fields. Achieving
a global commitment to live within sustainable limits will require a major collective effort. The
development of new technologies and individual consciousness will be important factors to accomplish
sustainable development.
1.3 LIFE-CYCLE ASSESSMENT
The idea of a life-cycle has its roots in the biological sciences. Living organisms are born; they develop,
mature, grow old, and ultimately, die. The way the organism develops and behaves along its life stages
depend on its interaction with the environment. A similar path is followed by manufactured products.
Natural resources are processed to give materials. These are manufactured into products that are
distributed and used. Products have a useful life, at the end of which they are discarded. Energy and
materials are consumed at each stage, releasing greenhouse gases (GHG), and depleting natural
resources. Product life-cycle stages (or phases) are: material extraction, manufacture, use,
transportation, and disposal.
The study of resource consumption, emissions, and their impacts is called life-cycle assessment (LCA)
(Ashby, 2009). In other words, LCA is a technique used to evaluate the environmental aspects and
potential environmental impacts throughout a product‟s life-cycle from raw material acquisition through
production, use, end-of-life treatment and disposal (SETAC, 1991). LCA is applied by: compiling an
inventory of relevant energy and material inputs and environmental releases, evaluating the potential
environmental impacts associated with identified inputs and releases, and interpreting the results to
evaluate and implement opportunities to affect environmental improvements (EPAa, 2011).

Chapter I – Background Information
18
Graedel and Allenby (2003) define LCA as “an objective process to evaluate the environmental burdens
associated with a product, process, or activity… and to evaluate and implement opportunities to effect
environmental improvements”. It implies that everyone in the whole chain of a product's life cycle, from
cradle to grave, has a responsibility and a role to play, taking into account all the relevant impacts on the
economy, the environment, and the society. In addition, it allows a more sustainable direction by
applying cleaner process and product options.
The Society for Environmental Toxicology and Chemistry (SETAC, 1991) published “A Technical
Framework for Life-cycle Assessments”, the first attempt at an international LCA standard. It explicitly
outlined the components of contemporary LCA: goal definition, inventory assessment, impact
assessment, and improvement analysis. In the late 1990s, the International Organization for
Standardization (http://www.iso.org) released the ISO 14040 series on LCA as an adjunct to the ISO
14000 Environmental Management Standards.
The technique of LCA is still evolving. Energy has been commonly used to evaluate the impact of
materials, processes, and activities. Energy has the merit that can be measured with relatively precision,
and with appropriate precautions, and can be used as a proxy to measure the CO2 footprint4 (Ashby,
2009).
The definition of end-of-life refers to the point in time when the product no longer satisfies the initial
purchaser or first user (Rose, Ishii, & Stevels, 2002). A product is at its end-of-life when it is at the end
of its economic or physical life. It is either returned to the original manufacturer because of legal
product take-back obligations or returned to another company for value-added recovery (Brito &
Dekker, 2002). End-of-life scenarios (Kumar & Putnam, 2008) include reuse, remanufacture, recycle,
incineration (combustion for heat recovery), and disposal to a landfill; reuse being the most preferred
method of source reduction (EPAb, 2011).
4 The CO2 footprint is the associated release of CO2 into the atmosphere, in kg of CO2/kg, of the sum of all contributions per
unit mass of materials extraction, manufacture, transport, use, and disposal (Ashby, 2009).
Chapter I – Background Information
19
For pallets, the following end-of-life scenarios are possible (C. Merta, personal communication, July 15,
2009):
Reuse: refers to using core pallets without making any changes (applicable to all type of pallets).
Remanufacture (repair in pallet context): bringing damaged parts back to a functional condition,
or replacing severely damaged parts with new ones (applicable only to wooden pallets).
Recycling: taking component materials and processing them into the same material, or other
useful material (known as downcycle) (applicable to plastic and metal pallets). Recycling of wood
from pallets is always a downcycling step. It refers to grounding, and chipping pallets to produce
landscape mulch or animal bedding; and furnishing for fiber-based products.
Incineration: refers to destroying the pallet components by burning them for heat recovery or
energy fuel (only applicable to wooden pallets).
Disposal to a landfill: refers to disposing pallets by burying and covering them (applicable to all
type of pallets).
While downcycling wooden pallets allows waste reduction and good use of materials, it requires the
investment of additional energy to mulch the wood and transport it to the place where it will be used,
which adds to the energy embodied in a wooden pallet. When plastic pallets get damaged, their material
is recycled to be reused to make new pallets or used for other applications. Greenhouse gas (GHG)
emissions are therefore offset by the avoided fossil fuel use for raw material acquisition.
Pallet combustion and landfilling uses energy for transporting and managing the waste, and produces
GHGs to varying degrees. However, landfilling pallet material offers an opportunity to recover energy
since the anaerobic decomposition of wood generates methane gas that can be captured by modern
landfill systems. Because HDPE does not decompose in landfills there is no opportunity to recover
energy from HDPE pallets that are landfilled. In addition, some of the energy released during combustion
can be harnessed and used to power other processes, which results in offset GHG emissions from

Chapter I – Background Information
20
avoided fossil fuel use. On the other hand, combusting pallets that have been treated with methyl
bromide will liberate toxic and irritating chemicals (Cheremisinoff, 1999).
One of the main issues with shipping products on a pallet is recovering the pallet after delivery. It is very
costly, and when shipping significant distances the cost of recovery is more than that of the pallet. This
results in the abandonment of pallets, or in the case of single-use pallets, the disposal of the pallet. Most
developed countries have created various types of pallet rental and management systems to prevent
such outcomes.
In general, the end-of-life alternatives such as reuse, remanufacture, and recycling may lead to more
sustainable solutions. Otherwise, incineration, when not for heat recovery, releases toxics to the
environment. In addition, disposal to landfills refers losing materials that probably are still useful, while it
contributes to emissions and toxics released into the earth.
1.4 PALLET MANAGEMENT
Pallets are commonly used to ship products from consumer product manufacturers to product
distributors and/or retailers. Pallets are produced in many sizes depending on the product
manufacturers‟ needs or specifications. Because they take up storage space, empty pallets must be
returned or disposed of. This may seem like an insignificant problem for large retailers but one needs to
remember that every product on the shelf in a retail store was most likely transported on a pallet. Pallet
costs can run into millions of dollars for product distributors (Dana, 2010).
An option is to outsource pallet management to a logistical service company. By placing pallet
management responsibilities in the hands of pallet experts, time, labor, and waste could be avoided.

Chapter I – Background Information
21
The acceptance of third-party management systems in the U.S. pallet industry started at the end of the
1990s. These organizations manage their clients‟ pallet needs, lowering their handling problems related
to sorting, cleaning, repairing, and disposal. Third-party pallet management, also known as pallet pooling,
has increased in the past decade due to increases in material cost, environmental concerns, and the
globalization of markets.
Pallet pooling can involve two types of reusable pallet logistics: leased pools and buy/sell programs.
Companies can lease pallets to users who use them in a closed-loop environment, which facilitates
recovery. After use, pallets are transported to one of the third-party‟s depot centers for storage until
they can be redeployed to another customer elsewhere in the country, or if they are damaged to get
repaired. In a buy/sell program pallets are sold to customers, transported with product through the
supply chain and then repurchased by a local pallet management facility prior to being repaired and
reused, or recycled (Bejune et al., 2002a; IFCO, 2009).
Various companies offer the service of pallet pooling. Commonwealth Handling Equipment Pooling (CHEP) is
the global leader in wood pallet pooling services serving many of the world‟s largest companies. CHEP
manufactures, collects, and repairs approximately 320 million pallets and containers from service centers
placed in 75 countries, helping manufacturers transport their products to distributors and retailers
(http://www.chep.com). In the U.S. this company handles approximately 80 million GMA wood block
pallets, representing approximately 40 percent of the wood pallet market. The other 60 percent is
represented by almost three thousand smaller pallet manufacturers, repair, and recycling centers (C.
Herndon, personal communication, July 31, 2009). CHEP handles pallet and container supply chain
logistics for customers in the consumer goods, meat, home improvement, beverage, raw materials,
petro-chemical, and automotive industries. Its pallets are known to be colored blue.

Chapter I – Background Information
22
PECO Pallet manufactures and offers to the grocery manufacturers and distributors of North America
wood stringer and block pallets. Their pallets are known to be colored red, and represent
approximately 1 percent of the white wood pallet industry in the U.S. (http://www.pecopallet.com).
IFCO Systems is an international logistics service provider with more than 210 locations worldwide. It
operates a pool of more than 96 million RPCs (Reusable Plastic Containers) globally, which are used
primarily to transport fresh products from producers to leading grocery retailers
(http://www.ifcosystems.com). In the U.S., IFCO Systems provides a national network of pallet
management services, including sorting, repair, and reissue (none are manufactured by the company).
IFCO Systems is the market leader in this industry segment (L. Cochran, personal communication, July
31, 2009).
Intelligent Global Pooling Systems (iGPS) is a plastic pallet manufacture and service pooling company that
handles approximately 2 million pallets in the U.S. They are known to be black or gray, because of their
material recycled content (http://www.igps.net). Ongweoweh Corp is a pallet management company which
repairs, collects, and manages approximately 2 million wood, plastic, and metal pallets in the U.S.
(http://www.ongweoweh.com). As these companies, many other third-party pallet providers help in the
management of pallets in the country.
Pallet pooling providers have become interested in the environmental impacts associated with the
management of their clients‟ pallets. Product manufactures are highly focused in implementing
sustainable effective supply chains, which has incentivized pallet pooling companies implementing
sustainable logistic systems to stay competitive in the market. The way pallets are managed along the
entire supply chain can make a notable difference on the environmental impacts arising from pallet
operation practices.

Chapter II - Literature Review
23
CCHHAAPPTTEERR IIII
LLIITTEERRAATTUURREE RREEVVIIEEWW
The following chapter discusses the literature reviewed for the present research. The areas of study
include: pallet life cycle stages, life-cycle assessments, pallet management, and multi-objective
optimization.
2.1 PALLET LIFE CYCLE STAGES
Pallets play an important role for transportation of goods. Solid wood pallets account for an estimated
90 to 95 percent of all pallets in the U.S. (NWPCA, 2000). Wooden pallets are responsible for 2
percent of all Municipal Solid Waste (MSW) and over 3 percent of all Construction and Demolition
Waste (C&D) landfilled in the United States (Bush, Corr, & Araman, 2001; McKeever, 1999) regardless
the fact that technologies and markets exist that allow pallets to be reused, recycled, or converted into
other products (Buehlmann et al., 2009). Companies have given high importance to pallet end-of-life
scenarios. In fact, the industrial recycling of pallets emerged in the 1960s. Bush, Reddy, and Araman
(1996) show in their study that various factors have contributed to the growth of pallet recycling by the
industry: an increased awareness of the environment, the economic benefits of repairing and reusing
wooden pallets and decreasing products handling costs, and the significant increase of disposal costs.
Studies have been developed that analyze the different pallet end-of-life scenarios (Gasol et al., 2008;
Corbiere-Nicollier et al., 2001; Bejune et al., 2002b; Buehlmann et al., 2009; Bush & Araman, 2008,
2009).

Chapter II - Literature Review
24
Gasol et al. (2008) assess the environmental impact of current management systems of wooden pallets.
They compare the benefits and drawbacks of high and low reuse rates as waste prevention strategy to
recycling. The study concludes that reuse, combined with recycling as final disposal, instead of
incineration and landfill, will reduce the waste generated and the demand for natural resources.
Furthermore, an assessment of biofibres replacing glass fibres as reinforcement in plastic pallets was
performed by Corbiere-Nicollier et al. (2001). Since polypropylene (PP) is hardly biodegradable,
incineration is preferred over landfills at the end of pallets useful life-cycle. Although PP incineration
produces toxic heavy metals emissions (such as cadmium), it contributes to energy production. Landfills
were not studied in detail, although since they occupy large surface areas it was concluded that they
would be unfavorable. Pallet recycling avoids emissions due to pallet disposal and reduces emissions
during product manufacturing. Moreover, the Buehlmann et al. (2009) report gives background
information that supported the decision of the state of North Carolina to enact legislation to ban pallet
landfilling, beginning in 2009.
Araman et al. (1998) show that it can be environmental friendly to apply wood pallet recovery, repair,
and recycling. Doing so will reduce forest resource demands and waste in landfills. The total demand of
pallets for 1995 was 560 million pallets, from which 411 million were new and 149 million
recovered/repaired; which means that 1 out of 4 wood pallets purchased in 1995 was a
recovered/repaired pallet. Nevertheless 223.6 million pallets entered the Construction & Demolition
(C&D) and the Municipal Solid Waste (MSW) landfills (Araman et al., 1998).
Wood pallet production has increased from 411 million units in 1995 to 441 million units in 2006. Pallet
manufacturers used 63.6 percent (by volume) hardwood and 36.4 percent softwood material in 2006.
From 1995 to 2006, it was estimated that the number of pallets recovered by the pallet industry
increased from 171 million to 321 million. Recovered wood material utilized by the pallet industry
increased as a percentage of the total among those years, suggesting that recovered wood materials are

Chapter II - Literature Review
25
primarily satisfying any new demand for wood materials created by the pallet industry. Of all uses of
recovered pallets, repaired pallets which get reused or sold increased from approximately 41 million
pallets in 1992 to 370 million in 2006. It was estimated that 1.5 million recovered pallets were sent to
landfills in 1992 and 1 million in 2006. In 1995 this represented 0.9 percent of the total recovered pallets
compared to 0.25 percent in 2006. The number of pallets that were ground or chipped for landscape
mulch production increased from 3.4 million in 1995 to 23 million in 2006 (Bejune et al., 2002b; Bush &
Araman, 2008, 2009).
The environmental impacts of pallet end-of-life scenarios have been analyzed for wood and plastic
pallets. Gasol et al. (2008) defined two reuse rates scenarios for industrial wooden pallets: high-reuse
pallets and low-reuse pallets. The assessment shows that the high-reuse intensity pallets reduce the
energy, wood consumption, and environmental impacts such as ozone depletion, acidification, and
eutrophication, but not the global warming potential. The highest impact stages are transport, raw
material extraction and manufacturing. Their study does not consider other raw materials such as
plastics and/or metals.
The performance of plastic and wood pallets was studied comparing environmental considerations by
Singh and Walker (1995). The study showed that the twin sheet thermo-formed HDPE plastic pallets
had the best environmental performance followed by the structural foam HDPE pallets and the
presswood pallets. Corbiere-Nicollier et al. (2001) illustrated a reduction in energy consumption and
other environmental impacts with the substitution of glass fibre production by natural fibre production
for plastic pallets. Their research states that transport pallets reinforced with China reed fibre prove to
be ecologically advantageous if they have a minimal lifetime of 3 years compared with the 5-year lifetime
of the conventional plastic pallet. Considering the entire life cycle, the polypropylene production process
and the transport cause the highest environmental impacts among all life cycle stages.

Chapter II - Literature Review
26
The Timber Packaging and Pallet Confederation (TIMCON, 2008) claims that due to rising industry
pressures and costs, timber remains the most sustainable material in the world for storage, transport,
and movement of goods, as the production and processing of new timber pallets is highly energy-
efficient, with a low carbon footprint.
Materials for pallets manufacturing play an important role in the end-of-life decision. Lacefield (2008)
suggests that for years the pallet industry has argued which material has been the best choice. For many
years companies analyzed their materials from a cost-effectiveness perspective. Today they are
concerned with their sustainable performance.
2.2 LIFE-CYCLE ASSESSMENT
Life-cycle Assessment (LCA) has its roots in the 1960s, when scientists concerned about the rapid
depletion of fossil fuels developed LCA as an approach to understand the impacts of energy
consumption. Years later, global-modeling studies predicted the effects of the world‟s changing
population on the demand for finite raw materials and energy resource supplies (Meadows et al., 1972).
Various studies were conducted by the Midwest Research Institute (Hunt, 1974; Sheehan et al., 1998),
and later by the consulting firm Franklin Associates Ltd. (Brindley, 2010; Hunt, Franklin, & Hunt, 1996;
Hunt, Sellers, & Franklin, 1992; Saouter & Hoof, 2002), mostly for the private sector. A study for the
Coca Cola Company had as an objective to determine which type of beverage container had the lowest
carbon releases to the environment and the fewest demands for raw materials and energy (Franklin
Associates, 1991).
In the 1970s, the U.S. Environmental Protection Agency (EPA) refined the LCA methodology, creating
an approach known as Resource and Environmental Profile Analyses (REPA). Driven by the oil crisis of

Chapter II - Literature Review
27
1973, approximately 15 REPAs were performed between 1970 and 1975. Through this period a
protocol for conducting these studies was developed (Hunt et al., 1992).
In the late 1970s and early 1980s, environmental concerns shifted to issues of hazardous waste
management. As a result, life-cycle logic was incorporated into the emerging method of risk
management, which was used to develop environmental protection standards (Stilwell et al., 1991). In
1990, a life-cycle assessment was completed comparing disposable diapers to washable cloth diapers.
Disposable diapers show to consume less energy and water than reusable diapers; however, create
more post-consumer waste (World Resources Institute, 1994). A similar study was conducted for the
Council for Solid Waste Solutions, which compared the energy and environmental impacts of paper to
that of plastic grocery bags. The study concludes that plastic bags are better in terms of environmental
impacts compared to paper bags (Council for Solid Waste Solutions, 1990).
Today approximately 90 percent of pallets are made of timber (http://www.epal-pallets.org). However,
plastic pallets are expected to become a serious competitor to wooden pallets. The Netherlands
Packaging and Pallet Industry Association conducted a study for Commonwealth Handling Equipment
Pooling (CHEP), the global leader in pallet and container pooling services. The life-cycle assessment
(LCA) tool was used to compare the environmental impacts of wood pallets and plastic pallets (50
percent recycled plastic and 50 percent new HDPE), when used multiple times. The results of the
analysis show that, because the impacts of manufacture and use phases for plastic pallets are much
higher, wood pallets are more environmental friendly than plastic pallets. They also conducted a LCA to
evaluate single-use wood pallets versus multi-use wood pallets (per handling cycle), and concluded that
multi-use wood pallets are preferred for the environment over single-use wood pallets (CHEP, 2008;
Hamner & White, 2007).
Conversely, an independent LCA was conducted by iGPS (Intelligent Global Pooling Systems), a plastic
pallet pooler, to examine the environmental impacts of three types of pallets commonly used: the

Chapter II - Literature Review
28
pooled multi-use wood pallet, the single-use wood pallet and iGPS's pooled all-plastic pallet. The analysis
found that iGPS's all-plastic pallet had significantly less environmental impact than both the pooled
multiple-use wood pallet and single-use wood pallet (iGPS, 2008).
CHEP‟s LCA conducted in 2007 did not cover pooled plastic pallets because they were not widely
available. CHEP‟s 2009 LCA results released in March 2010 showed some improvements of whitewood
pallets compared to both pooled wood and plastic, although the results pointed to pooled wood
(especially CHEP pallets) as the most environmentally preferable and sustainable option. The assessment
was conducted by Franklin Associates, a leading consultant group specializing in life-cycle inventory
analysis and solid waste management. According to CHEP‟s 2009 study, a CHEP pallet generates 48
percent less solid waste, consumes 23 percent less total energy, and generates 14 percent less GHG
than a pooled plastic pallet. Compared with limited use white wood pallets, CHEP pallets generates 50
percent less solid waste, consumes 19 percent less total energy, and generates 5 percent less GHG
(Brindley, 2010).
Dr. Mark White, former director of the Center for Unit Load Design at Virginia Tech, envisions the idea
of the convergence of all aspects of the supply chain to reduce waste, cut costs, improve efficiencies, and
benefit the environment. He states that LCA is a measuring tool that does not objectively compare raw
material renewability. This is a reason why in some studies wood pallets appear to be the most
environmental friendly, while other sources state that plastic pallets are. Dr. White is quoted in Brindley
(2007) as “it will depend very often on how the pallet is being used as to whether the impact is greater.
Other issues like how often the pallet is reused become a factor”.

Chapter II - Literature Review
29
2.3 MULTI-OBJECTIVE OPTIMIZATION
A linear programming problem may be defined as the problem of maximizing or minimizing a linear
function subject to linear constraints. The constraints may be equalities or inequalities. Linear
programming is used as a mathematical optimization technique for organizing or allocating resources
(Ferguson, 1995). If the unknown variables are all required to be integers, then the problem is called an
integer programming problem; however, if only some of the unknown variables are required to be
integers, then the problem is called a mixed integer programming problem. Industries that use
mathematical programming models include transportation, energy, distribution, telecommunications, and
manufacturing. It has proved useful in modeling diverse types of problems in planning, routing,
scheduling, assignment, and design.
The problem of systematically and simultaneously optimizing a collection of objective functions is called
multi-objective optimization. These types of problems do not have a unique solution that
simultaneously minimizes, or maximizes, each objective. Quantifying how much better one solution is
compared to many others, is the goal when setting up and solving a multi-objective optimization
problem (Marler & Arora, 2004). The pareto frontier marks the reachable outcomes under a best
response behavior. The value of the tradeoff rate informs the decision maker concerning the exchange
between the objective values if one moves along the pareto frontier.
The epsilon-constraint method is one of the techniques used for solving multi-objective problems. It solves
single objective problems obtained by transforming all but one of the objectives into a constraint
(Bérubé, Gendreau, & Potvin, 2009). In general, with objectives f1, f2,…, fm, the epsilon-Constraint method
repeatedly solves optimization problems of the form (assuming minimization of all objective functions):
where 1,2,….,m and S is the feasible region.

Chapter II - Literature Review
30
Let P1(2) represent the problem where the objective function f1 is minimized subject to the minimum
value when f2 is minimized ensuring that f2(x)=2, and z1(2) is the value of the optimal solution to this
problem. Then, to generate a set of solutions, each with a potentially different tradeoff between both
objective functions, the algorithm below is executed.
Multi-objective optimization models have been used for a large field of applications, including
engineering, finance, supply chain, product, and process design, among others. Sabri and Beamon (2000)
developed an integrated multi-objective supply chain model that incorporates production, delivery, and
demand uncertainty to design efficient, effective, and flexible supply chain systems. Further, Mahnam et
al. (2009) developed a multi-objective inventory model including total cost and fill rate for an assembly
supply chain network under different uncertainties. Uncertainty results from customer‟s demand
variability or unreliability in external suppliers.
Moreover, research has considered both forward and reverse logistics operations, establishing a new
multi-objective optimization model of logistics facility layout. The objectives of this optimization model
were to minimize the total costs of the forward and reverse logistic process while maximizing
customers' satisfaction degree (Wang et al., 2008). Likewise, multi-objective optimization has been used
for transportation issues. Ma (2010) developed a model which not only optimizes traffic signal timing but
also lane allocation at signalized intersections networks.
Chapter II - Literature Review
31
Sustainability considerations are starting to be addressed in enterprise supply chains, from the raw
material stage to product distribution stage. Sustainability, involving the multiple objectives of social,
economic, resources, and environmental sustainability, can be sometimes conflicting. Zhou et al. (2000)
propose a multi-objective optimization model to evaluate the objectives of social, economic, resources
and environmental sustainability. The application of this approach was illustrated through a case study on
sustainable supply chain optimization and scheduling of a petrochemical complex. The results obtained
show that this approach is a useful tool for decision-making. Moreover, Wang et al. (2010) studied a
supply chain network design problem with environmental concerns. Their research focused on the
design phase, and proposed a multi-objective optimization model that captures the trade-off between
the total cost and the environment influence in the handling and transportation process, allowing an
effective tool in the strategic planning for green supply chain. Further, research has been done on
extending the traditional process design framework to green process design and industrial ecology
leading to sustainability (Diwekar & Shastri, 2010). Likewise, environmental and economic objective
functions were used simultaneously to select the operating conditions of a steam and power plant. The
methodology developed by Martínez and Eliceche (2009) is used to estimate the potential environmental
impacts during the most important life cycle stages associated with imported fuel and electricity in the
utility plant.
2.4 PROBLEM STATEMENT
As overall summary, the review of the literature shows that environmental management has gained
increasing interest in the field of supply chain management. However, there is a need for effective and
efficient optimization techniques that address pallet operations within an entire supply chain and
consider pallets environmental impacts and costs. This literature review shows a gap of researches that
study pallet life cycle stages and the different pallet management systems.

Chapter II - Literature Review
32
Furthermore, a full picture of the environmental consequences associated with pallet choice will need to
include the tradeoffs between using more energy intensive plastic pallets over longer periods of time
versus using more, less energy intensive wood pallets for shorter periods of time.
Pallets are indirectly responsible for a share of the emissions that are generated as the pallets and their
cargo move through the supply chain. Primary freight transportation methods (ship, rail, air, and truck)
are all fossil fuel based, and heavier pallets will require more fuel to transport them than lighter pallets.
The combustion of the additional fuel will result in greater emissions of CO2, SOx, NOx, and various
forms of particulate matter. Tradeoffs can arise where lighter but less durable pallets could be preferred
to heavier ones because they are responsible for fewer emissions as they move through a supply chain.
Methods are needed to help logistics system designers understand and evaluate these potential
tradeoffs.
Beyond the tradeoff between cost and durability, there are other issues that can drive the choice of
pallet and the selection of a pallet management strategy. As organizations work to develop more
sustainable supply chains, they will need to take into account environmentally oriented criteria such as:
the embodied energy of the materials in the pallet; the energy of the pallet manufacturing process; the
differential emissions that arise during transportation due to the weight differences between pallets of
dissimilar materials; and impacts associated with the various end-of-life alternatives available for different
types of pallets (mulching, incineration, landfilling, etc).
Finally, this study aims to address such a gap by providing a model that studies pallet life cycle stages and
their operations to determine the mix of pallets (type, quantity, and pallet management system) for
product distribution that balances overall environmental impacts and costs according to companies‟
needs. The proposed model and approach will provide companies seeking to engage in more sustainable
practices in their supply chains and distribution with insights and a decision making tool not previously
available.

Chapter III – Methodology
33
CCHHAAPPTTEERR IIIIII
MMEETTHHOODDOOLLOOGGYY
Linear mathematical programming is used to design the system that will determine the optimal mix of
pallets (quantity, material, and pallet management system) to be delivered among facilities, in order to
reduce the use of resources, transportation, thus fuel emissions. A multi-objective optimization model is
used to measure the tradeoffs between the system environmental impacts and costs. The supply chain
considers multiple pallet providers, consumer product manufacturers, distribution centers, retailers, and
return centers.
Outline of Chapter III - Methodology
3.1) Pallet network, a proposed model. The flow of pallets between pallet providers, consumer
product manufacturers, distribution centers, retailers/stores, and return centers is
explained;
3.2) Detailed model based on pallet life-cycle stages, including pallet end-of-life alternatives;
3.3) Modeling approach: (i) model assumptions and research limitations; (ii) abbreviations;
(iii) pallet lifespan; (iv) pallet costs; (v) nomenclature; (vi) objective functions coefficient
descriptions; (vii) decision variables; (viii) model logic; and (ix) time representation;
3.4) Mathematical programming model, including objective functions and constraints;
3.5) Input data collection.

Chapter III – Methodology
34
3.1 PALLET NETWORK - A PROPOSED MODEL
The flow of consumer products, especially in the grocery industry, is illustrated in Figure 2. Consumer
product manufacturers require pallets to transport their products to distribution centers. Pallets are
then unloaded and restacked at the distribution centers with specific orders for the retailers/stores.
Loaded pallets are then sent to these retailers, unloaded upon arrival, while unloaded pallets are sent
back to pallet providers. From retailers pallets are sent to return centers where they are then sorted by
type (or by provider) and sent to the different pallet owners. However, other pallets, such as
whitewood pallets for example, may be discarded (disposed) directly after used, in which case the return
center may be located at the retailer. Pallets may flow from return centers back to distribution centers
or even to consumer product manufacturers for reuse, depending on the pallet management approach
of each pallet type. In addition, pallet providers may decide on the pallet retirement alternative.
Figure 2. An example of a network of physical flow of pallets
CONSUMER
PRODUCT
MANUFACTURERS
(CPM)
RETAILERS
(RET)
RETURN
CENTERS
(RC)
PALLET
PROVIDERS
(PP)
DISTRIBUTION
CENTERS
(DC)
OTHER
USERS IN
THE POOLEND-OF-LIFE
(EOL)

Chapter III – Methodology
35
When pallet providers work under a buy/sell program, they sell their manufactured pallets to users (in
this case consumer product manufacturers). Pallet ownership is transferred with the pallet, from the
pallet manufacturer to the consumer product manufacturer, and further down the chain to the product
distributor and retailer. The product distributor and/or retailer then sell the pallets after they have been
used to the pallet provider. Thus, two pallet costs are involved under this program: the pallet purchase
cost (between the pallet provider and the consumer product manufacturer); and the selling cost
(between the product distributor and/or retailer and a pallet provider).
Pooled pallets are always owned by the pallet pooling company. These companies lease their pallets to
the consumer product manufacturers. A company may contract a service level that provides a fixed
number of pallets (e.g. 40,000), or in other cases a variable number of pallets based on their monthly
needs. The leasing cost usually involves a leasing cost (also known as issue cost), a cost per pallet per
day, and a cost of return when each pallet gets transferred. This cost may differ from one consumer
product manufacturer to another, and can depend on quantity, facility locations, and other variables.
Some pallet providers may charge the product distributors or retailers for returning their pallets to
their depot centers; while other pallet providers may give a credit to the company who returns the
pallets.
Eventually a pallet constructed from any material will come to the end of its useful life. The methods by
which pallets are disposed of when they must be retired include reuse, repair, recycle, downcycle,
landfill, and incineration.
A detailed network may include multiple pallet providers (PP1, PP2… PPn), multiple consumer products
manufacturers (CPM1, CPM2… CPMn), distribution centers (DC1, DC2… DCn), retailers (RET1, RET2…
RETn) and return centers (RC1, RC2… RCn) (Figure 3).

Chapter III – Methodology
36
Figure 3. Pallet supply chain network applied to multiple facilities
3.2 DETAILED MODEL
In order to integrate environmental impacts arising from pallet operations, the system modeled was
designed based on pallets life-cycle stages. Figure 4 incorporates the beginning and end-of-life stages for
a pallet to the diagram presented in Figure 2. The pallet stages considered are: raw material acquisition,
manufacture, use phase (composed by consumer product manufacturers, distribution centers, retailers,
and return centers), as well as various end-of-life (disposal) scenarios. As a result, pallet providers are
not being physically represented, but their actions (reuse, remanufacture, etc.) are included.
CPM 1
CPM 2
CPM n
.
..
CONSUMER
PRODUCT
MANUFACTURERS
DC 1
DC 2
DC n
.
..
DISTRIBUTION
CENTERS
RET 1
RET 2
RET n
.
..
RETAILERS
RC 1
RC 2
RC n
.
..
REUTN CENTERS
PP 1
PP 2
PP n
.
..
PALLET PROVIDERS
OTHER
USERS IN
THE POOL
END-OF-LIFE
(EOL)

Chapter III – Methodology
37
Figure 4. Life-cycle network of pallets
For instance, for a hardwood pallet, the arc into “Raw Material” models the extraction of wood used to
manufacture new hardwood pallets. The CO2 emissions consequent on the extraction of unit mass of
material (in this case wood) include those emissions associated with transport, the generation of the
electric power used by the plant to cut the lumber, and that of feedstock and hydrocarbon fuels if any.
As a result, the CO2 footprint of the raw material stage is then the sum of all the contributions per unit
mass of usable material exiting the plant (Ashby, 2009). The arc from “Raw Material” to “Manufactured
Pallet” models the actual fabrication of a pallet. For example, a plastic pallet may be manufactured with
an injection-molding machine. Further, the CO2 footprint from pallet manufacture does not only include
RAW MATERIAL
(RM)
Reuse
Repair
Recycling
MANUFACTURED
PALLET
(MP)
CONSUMER
PRODUCT
MANUFACTURERS
(CPM)
RETAILERS
(RET)
RETURN
CENTERS
(RC)
DISTRIBUTION
CENTERS
(DC)
INCINERATION
END OF LIFE
(IEOL)
LANDFILL
END OF LIFE
(LEOL)
DOWNCYCLING
END OF LIFE
(DEOL)
USE
Downcycling
Landfill
Inc
ine
ratio
n

Chapter III – Methodology
38
the CO2 released during the manufacturing process, but other emissions created by the plant for the
pallet to be made (including that of feedstock and hydrocarbon fuels, for example) (Ashby, 2009).
In general, the arc coming into “Raw Material” models the extraction of those materials, such as wood
and plastic, used to manufacture new pallets. The arc from “Raw Material” to “Manufactured Pallet”
represents the manufacture of pallets made of raw and/or recycled material. The arc from
“Manufactured Pallet” to “Consumer Product Manufacturer” models the pallets supplied by pallet
providers/manufacturers to consumer product manufacturers, and can include new fabricated pallets
and/or repaired wooden pallets. The use phase starts when the “Consumer Product Manufacturer”
ships their products on pallets to the “Distribution Centers” and further to “Retailers”. Empty pallets
are sent to “Return Centers”. From this return (or collecting) center, pallets are sold and/or sent back
to the pallet providers, who then will decide on the pallet end-of-life scenario. Pallets can also be
returned from the distribution centers to the pallet providers.
Pallet disposal scenarios include reuse, recycle, repair, downcyle, landfill, and incineration. As a result,
the system models pallets flowing from product distributor‟s facilities (specifically from the distribution
centers and return centers) to each of pallet end-of-life alternatives representing the impact of the
selected disposal scenario. Accordinlgy, arcs from either “Distribution Centers” or “Return Centers”
into “Consumer Product Manufacturer” models the scenario reuse. In a similar way, recycle (material
recycling, such as plastic and metal) is modeled by pallets flowing into “Raw Material”. Repair is modeled
by pallets flowing into “Manufactured Pallet”. Downcycling is represented by pallets flowing into
“Donwcycling End-of-Life” which refers to chipping and grounding the wood into by products such as
animal bedding and landscape mulch. The impact of sending a pallet to landfill is illustrated by pallets
flowing into “Landfill End-of-Life”. Incineration is modeled by pallets flowing into “Incineration End-of-
Life”.
Chapter III – Methodology
39
3.3 MODELING APPROACH
Different tools were considered and evaluated to give application to the model proposed. The literature
shows research for supply chain applications modeled with fuzzy logic (Qin & Ji, 2009; Zhang et al.,
2007), neural networks (Wang et al., 2008), systems dynamics (Georgiadis & Besiou, 2008; Kamath &
Roy, 2007), simulation (Iannoni & Morabito, 2006; Kara, Rugrungruang, & Kaebernick, 2007), and
operations research (Mahnam et al., 2009; Martínez & Eliceche, 2009; Sabri & Beamon, 2000; Wang et
al., 2008; Zhou et al., 2000). Further, logistics systems were found to be modeled by using linear
programming (Neto et al., 2009; Sheu, Chou, & Hu, 2005) and mixed-integer programming
(Xanthopoulos & Iakovou, 2007). From the methods reviewed, mixed-integer programming was chosen
because these models can be solved quickly. Thus, one can manipulate the parameters of the model and
analyze the sensitivity of solutions to those parameters.
There are multiple choices and attributes for pallet material (hardwood, softwood, metal, cardboard, or
plastic), management (buy/sell, lease), material toxicity (such a potential carcinogenic effect of deca-
bromine and possible nervous system failure caused by methyl bromide), and end-of-life disposition
(reuse, repair, recycle, downcycle, incineration or landfill), each of which can affect the cost and
environmental impact of possessing and using a pallet. If a decision maker is concerned with only cost
objectives, and wishes to maintain a constant inventory of pallets in the supply chain, then he/she can use
traditional economic analysis methods to make these choices. Challenges may arise when the purpose is
to decide on pallet management systems and material when both objectives (cost and environmental
impact) are considered. Tradeoffs between the system environmental burden and its costs will likely
arise.
One approach is to develop a methodology for converting environmental impacts (such as CO2
emissions) to dollars, and then focus on a single objective, total cost, that includes the dollar cost of
those environmental impacts. An advantage of this approach is that once the methodology for costing

Chapter III – Methodology
40
environmental impacts is developed, well-known economic analysis methods can be used for making
decisions. A disadvantage is that developing such methodology adds a layer of complexity to the
decision-making process and will likely require assumptions that the final decisions prescribed by the
analysis may be sensitive to. For example, there are no accurate tools known today that can precisely
measure the monetary value of eco-system depletion and impacts on biodiversity.
Another option is to deal with the two objectives directly and in their own units of measure. This is the
approach selected in this research, and, to do so, these potential pallet choices have been chosen to be
modeled with a mixed-integer program (as a minimum cost multi-commodity network flow problem).
For effects of the study the combination of material and management program is referred as a pallet type.
3.3.1 MODEL ASSUMPTIONS AND RESEARCH LIMITATIONS
It is assumed that by choosing a pallet provider, the decision maker likely also chooses the end-of-life
disposition of pallets returned to that provider. Also, for pallets that are owned by the decision maker‟s
organization, policies regarding the end-of-life disposition of pallets are likely already in place and cannot
be changed on a pallet-by-pallet basis. Thus, the model is limited to choosing the material each pallet is
made of and how it is managed, while still considering the environmental impacts of the end-of-life
disposition dictated by that management program.
In addition, it is assumed that pallets are being used consistently, meaning that pallets may not stay idle
for long time; thus pallets flow continuously through the nodes while time periods pass.
The need for pallets is modeled by assuming it is known with certainty the demand for products at the
distribution centers and retailers. In addition, a pre-inventory of pallets exists only at the distribution
centers, used to fulfill retailers‟ demand during the first time period.

Chapter III – Methodology
41
This research focuses on GMA standard pallets (48x40). Oak-hardwood is used as base for wood pallet
production, and low alloy steel for nails fabrication; high-density polyethylene (HDPE) is used for plastic
pallets manufacture, which internally have low carbon steel reinforcement bars. This research focuses
only on wooden and plastic pallets; metal pallets are not included. Pallets management systems modeled
include buy/sell programs and leased pools.
Although this study frames the environmental impacts of pallet manufacturing, use, and disposal with
respect to all aspects of sustainability, the focus of the model is on carbon footprint (in particular CO2)
of the operations. Impacts to human health, biodiversity, eco-system depletion, etc. are not addressed in
this study.
Other modeling assumptions include: all wood is used for pallet fabrication and all recycled plastic is
used in production of new plastic pallets. There are an unlimited number of new pallets that can be
manufactured. The same carbon dioxide footprint applies when manufacturing pallets made of raw or
recycled plastic. When pallets get repaired or recycled, supply of new pallets for replacement is readily
available. The possibility of CO2 emissions offsets for energy production when pallets get incinerated is
not being modeled. Truck service is readily available and is the only transportation mode used. Only one
specific pallet management system can be used by each consumer product manufacturer. The residence
time of a pallet leased is 30 days.

Chapter III – Methodology
42
3.3.2 ABBREVIATIONS
The following abbreviations are used to identify each node set N in Figure 4:
Table 2. Abbreviations used to identify each node set N
3.3.3 MODEL TIME REPRESENTATION
Pallets flow within two different time periods in arcs (CPM,DC), (DC,RET), (RET,RC), (DC,EOL), and
(RC,EOL). This way the model considers that products can take a few days, depending on the distance,
since they leave the consumer product manufacturers‟ facilities until they arrive at the distribution
centers (or warehouses); further, pallets may be stored at the distribution centers for some time period
before they are shipped to the retailers. Similarly, different time period are considered in arcs (DC,EOL)
and (RC,EOL) since empty (unloaded) pallets are sent first to pallet providers before they are sent to the
different locations depending on their end-of-life scenario (if they are being either reused, repaired,
recycled, downcyled, incinerated or sent to landfill). A graphical representation of time is shown in
Figure 5.

Chapter III – Methodology
43
(a) Flow of pallets manufactured in period t (b) Flow of pallets manufactured in each time period
Figure 5. Time representation for nodes in set N
Figure 5(a) illustrates the flow of pallets per cycle for those manufactured at time period t. In addition,
Figure 5(b) is a representation of the network with all possible flow of pallets being manufactured in
each time period t (including t+1, t+2, etc.). For example, the darker black lines in the Figure 5 models
pallet life cycle stages as follows:
i) the extraction of raw material and pallet manufacture ((RM,t),(MP,t));
ii) pallet shipment from pallet manufacturer to consumer product manufacturer
((MP,t),(CPM,t));
iii) pallet leaving the consumer product manufacturer in period t and arriving at a distribution
center in period t+1 ((CPM,t),(DC,t+1));
t t+5t+2 t+4t+3t+1
MP
RM
DC
CPM
RET
DEOL
RC
LEOL
IEOL
t t+2 t+3t+1
MP
RM
DC
CPM
RET
DEOL
RC
LEOL
IEOL

Chapter III – Methodology
44
iv) transportation of a loaded pallet leaving the distribution center in period t+1 and arriving at
the retailer in t+2 ((DC,t+1),(RET,t+2));
v) pallet sent to an end-of-life scenario from the return center:
a. (RC,t+2),(CPM,t+3) representing reuse;
b. (RC,t+2),(MP,t+3) representing repair;
c. (RC,t+2),(RM,t+3) representing recycle;
d. (RC,t+2),(DEOL,t+3) representing downcycle;
e. (RC,t+2),(LEOL,t+3) representing landfill; or
f. (RC,t+2),(IEOL,t+3) representing incineration;
vi) pallet sent to an end-of-life scenario from the distribution center if the pallet was damaged
and did not make it to the retailer: (a) (DC,t+2),(CPM,t+3) representing reuse;
(b) (DC,t+2),(MP,t+3) representing repair; (c) (DC,t+2),(RM,t+3) representing recycle;
(d) (DC,t+2),(DEOL,t+3) representing downcycle; (e) (DC,t+2),(LEOL,t+3) representing landfill; or
(f) (DC,t+2),(IEOL,t+3) representing incineration).
3.3.4 PALLET LIFESPAN
For the purpose of this work, the lifespan of a pallet is represented by including the pallet failure fraction
per cycle. The system models damaged pallets leaving from the Distribution Centers (DC) and the
Return Centers (RC). Since pallets are first used at the Consumer Product Manufacturer (CPM), it is
assumed that the percentage of damaged pallets may be negligible to consider a failure fraction at this
location. In addition, in some cases the return center may be at the retailer, which could be easily
modeled if that is the case; for this reason a failure fraction is neither applied to pallets leaving the
retailers.

Chapter III – Methodology
45
For modeling purposes, one cycle is considered the entire pallet sequence starting at the pallet
manufacturer or provider (PP), through the consumer product manufacturer (CPM), distribution center
(DC), retailer (RET), return center (RC), and ending with the pallet provider (when pallets are being
sold or returned). In addition, it is assumed that the same number of trips and handlings per trip apply
from node PP to node DC, and from node DC to RC (Figure 6). Because all new/repaired/recycled
pallets may originate at node PP the amount of damaged pallets leaving from the RC will be greater than
pallets leaving from the DC. These damaged pallets are then sorted to the different end-of-life scenarios
(repair, recycle, downcycle, landfill, and incineration). Note in the figure that all pallets leaving the DCs
and RCs may be sent to the pallet providers first, before ending at an end-of-life scenario.
Figure 6. Pallet failure fraction
3.3.5 PALLET COSTS
This section explains the costs associated with each pallet management system: buy/sell program and
leased pools. A purchase cost applies to those pallets managed under a buy/sell program when Consumer
Product Manufacturers (CPM) buy pallets from Pallet Manufacturers (MP). After use, the assumption is
that these pallets are sold for a selling price.
Reuse
Repair (MP)
Recycling (RM)
PALLET
PROVIDER (PP)
CPM RET RCDC
Downcycling (DEOL)
Landfill (LEOL)
Incineration (IEOL)
Reuse
Pallet Failure
Fraction (fdc)
Pallet Failure
Fraction (frc)
Repair (MP)
Recycling (RM)
Downcycling (DEOL)
Landfill (LEOL)
Incineration (IEOL)

Chapter III – Methodology
46
Leasing cost applies to pallets under leased pools (such as plastic and wooden pallets). This cost is usually
broken into three components: an issue cost, which is a fixed cost per pallet ($/pallet), a rent cost per
day, which will account for the days a pallet is being used in the system ($/pallet-day) and, a cost when
transferred back to the pallet owner ($/pallet).
A credit for return is given to product distributors or retailers for sending pallets back to the pallet
company owner. Product distributors may get charged a transportation cost of return by the pallet owner
when returning their pallets after used.
In addition, a transportation cost per mile applies to all pallet management systems. This cost is usually
calculated based on trucks‟ capacity for shipping loaded and unloaded pallets. Moreover, in the grocery
industry, usually 48 ft. or 53 ft. trucks are used to transport products within facilities, which have an
estimated shipping capacity of 24 loaded pallets or 480 unloaded pallets.
3.3.6 NOMENCLATURE
The following sets are used to define the mathematical programming model:
= Pallet management system; also referred as pallet type
= Material (1, material type 1 for pallet p; and 2, material type 2 for pallet p)
= Disposal scenario of damaged pallets (1, repair; 2, recycle; 3, downcycling; 4, landfill; and 5, incineration)
= Time periods in weeks
The parameters of the mathematical model are:
= Weight of material m of pallet type p on arc (i,j) (lbs/pallet)
= CO2 footprint for material primary production per pound of material m per pallet type p in arc (i,j)
(lbsCO2/lb-pallet)
= CO2 footprint per pound of material m processed per pallet type p in arc (i,j) (lbsCO2/lb-pallet)
= CO2 footprint due to transportation per pallet type p per mile (lbsCO2/mile-lb-pallet)
= CO2 footprint per end-of-life scenario of material m for pallet type p in arc (i,j) (lbsCO2/lb-pallet)

Chapter III – Methodology
47
= Purchase/leasing cost of pallet type p on arc (i,j) ($/pallet)
= Transportation cost per pallet type p per mile on arc (i,j) ($/mile-pallet)
= Credit for selling pallets type p or for returning empty leased pallets type p in arc (i,j) ($/pallet)
= End-of-life scenario fraction d per pallet type p (percent)
= Failure fraction per pallet type p leaving DC (percent)
= Failure fraction per pallet type p leaving RC (percent)
= Pre-positioned inventory of pallets type p at distribution center i (number of pallets)
= Distance traveled between nodes i and j (miles)
= Total demand at distribution center i at time t (number of pallets)
= Total demand at retailer j from distribution center i at time t (number of pallets)
Z = Minimum monetary costs
α = Rate of cost increase (same α as in Algorithm) (percent)
V = Large number of pallets
P = Number of pallet types in model
T = Number of time periods in model
= Total life-cycle CO2 footprint per pallet p in arc (i,j) (lbsCO2)
= Total monetary cost per pallet type p in arc (i,j)
3.3.7 OBJECTIVE FUNCTIONS COEFFICIENT DESCRIPTIONS
Coefficient ($) for System Cost Objective Function:
Represents the purchase/leasing cost associated with each
pallet management system.
Illustrates the transportation cost for pallets shipped between
nodes.
Illustrates the credit obtained by the distributor/retailer when
empty pallets are either sold or returned to a pallet provider.

Chapter III – Methodology
48
Coefficient (pounds of CO2) for System Environmental Impact Objective Function:
Represents the CO2 footprint derived from the primary
production of materials such as wood, plastic, and steel used
for pallet manufacture on arc (i,j).
Represents the CO2 footprint resulting from manufacturing
pallets made of virgin and/or recycled materials (wood, plastic,
and steel) on arc (i,j).
Represents the CO2 footprint resulting from shipping loaded
and/or unloaded pallets on arc (i,j).
represents the CO2 footprint of repairing wooden
pallets (including steel nails recycling) on arc (i,j).
represents the CO2 footprint resulting from
recycling plastic pallets; includes recycling the plastic and the
steel of their reinforcement bars, on arc (i,j).
represents the CO2 footprint resulting from
downcycling wood (including steel nails recycling) on arc (i,j).
represents the CO2 footprint resulting from sending
pallets to landfill on arc (i,j).
represents the CO2 footprint resulting from
incinerating pallets (includes the CO2 footprint of sending the
steel of either the nails or the reinforcement bars to landfill) on
arc (i,j).

Chapter III – Methodology
49
3.3.8 DECISION VARIABLES
The model has the following decision variables:
represents the number of pallets of type that move from node at time to node at time
represents the pallet type inventory at the distribution center at time
binary variable that shows the unique pallet type used by each consumer product manufacturer
( , if CPM uses pallet type ; otherwise )
3.3.9 MODEL LOGIC
For each pallet type (in set p), is modeled its manufacture, procurement, use, and disposition (Figure 4).
Each arc (i,j) in this network, models the transition of a pallet either from one stage in its life cycle to
another or from one type of use to another as explained earlier, associating two attributes, , with
arc (i,j) to represent the monetary cost and environmental impact of such a transition.
To accommodate a multi-period planning horizon, time is included and the network is mapped to a
time-space network with node set N, and arc set A, for each pallet type. A node in N will be of the form
(s,t), where s represents a life cycle stage or use phase, such as “Raw Material,” or, “Retailers,” and t
represents a period. Thus, when studying a planning horizon of one year divided into 52 one-week
periods, N will contain 52 nodes of the form (RM,t), where t ranges between 1 and 52. Each of these
nodes models the opportunity to extract raw material in week t for manufacture. Similarly, the time-
space network will contain 52 nodes of the form (MP,t), (CPM,t), …, (RC,t). An arc in A will be then of the
form (i,j) = ((s,t),(s’,t’)), where t’ >= t. For example, A will contain arcs of the form ((RM,t),(MP,t’)) that
represent the extraction of raw materials in period t for manufacture in period t’. Figure 7 illustrates an
example of the flow of a plastic pallet that is reused after its use. Arc ((RM,t),(MP,t)) represents the
primary production of HDPE in period t for plastic pallet manufacture in t. Moreover, the pallet will be

Chapter III – Methodology
50
shipped to distribution centers and retailers, represented
by arcs ((CPM,t),(DC,t+1)) and ((DC,t+1),(MP,t+2)),
respectively. The pallet, after collected at the return
center, will be reused ((RC,t+2),(CPM,t+3)).
The need for pallets is modeled by assuming it is known
with certainty how many pallets must flow on the arcs
between nodes (CPM,t) and (DC,t’) and between nodes
(DC,t) and (RET,t’) for all time pairs (t,t’) where t’ >= t.
It is assumed that the pallet management program
dictates the end-of-life disposition of a pallet, which can
represent fractions per end-of-life scenario from total pallets managed. Further, the weighted average of
the costs and environmental impacts ( ) associated with the potential pallet dispositions (end-of-
life scenarios) is being modeled.
The finite lifespan of a pallet is included in the model indirectly by assuming that a fraction, , of pallets
of type p leaving node i in the time-space network have in fact become unusable, and thus must leave
the system and be replaced. Indexing this fraction by pallet type enables the modeling of different
lifespans for pallets of different material. For example, the failure fraction for wooden pallets can be set
much higher than the fraction for plastic pallets, hence, reflecting the different durabilities. Thus, for each
pallet type, arcs of the form ((i,t),(EOL,t’)) in the arc set A will represent pallets failing at node i in period t
and thus leaving the system and reaching their end-of-life in period t’. The system models pallet type and
quantity decisions with the continuous and non-negative variables that represent the number of
pallets of type p that travel on arc (i,j) in the time-space network.
A detail explanation follows for all arcs in set N.
t t+2 t+3t+1
MP
RM
DC
CPM
RET
DEOL
RC
LEOL
IEOL
Figure 7. Pallet flow with end-of-life reuse

Chapter III – Methodology
51
RAW MATERIAL
The raw material (RM) node models the
opportunity to extract and produce virgin and
recycled material for further pallet manufacture.
Recycled material includes plastic and steel from
damaged pallets used in previous time periods.
MANUFACTURED PALLET
The manufactured pallet (MP) node models pallet
manufacture with virgin and/or recycled material to
be shipped to consumer product manufacturers.
Further, manufactured pallets plus repaired wooden
pallets coming from nodes DC and RC get shipped
to CPM.
CONSUMER PRODUCT MANUFACTURER
The CPM node models the opportunity of
buying/leasing manufactured, repaired, and reused
pallets from pallet providers by consumer product
manufacturers.
DISTRIBUTION CENTER
The DC node models the shipment of loaded pallets
from CPM to DCs. Further, pallets used to fulfill the
demand at the retailer leave DC and arrive at RET
in the next time period. Some loaded pallets may
stay in inventory, and a few empty and/or damaged
pallets may be sold or sent back to pallet providers.
Pallet providers will than send pallets to different
locations depending on the pallet end-of-life
scenario; damaged plastic pallets are sent to RM for
recycling; damaged wooden pallets are sent to MP
for repair; other wooden pallets are sent to DEOL
for downcycling; some wooden and plastic pallets
may end up in landfills (LEOL) or get incinerated
(IEOL).
RM
DC
RC
MP
MP
DC
RC
RM
CPM
CPM DC
MP
RC
DC
RM
MP
CPM RET
DEOL
LEOL
IEOL
Inv

Chapter III – Methodology
52
RETAILER
The RET node models loaded pallets being shipped
from DC to RET. Empty pallets are then sent from
RET to RC for collection and sorting.
RETURN CENTER
The RC node models the opportunity of collecting
and sorting empty pallets coming from RET. Pallets
are then sold or returned to pallet providers.
Further, damaged plastic pallets are sent to RM for
recycling; damaged wooden pallets are sent to MP
for repair; other wooden pallets are sent to DEOL
for downcycling; some wooden and plastic pallets
may end up in landfills (LEOL) or get incinerated
(IEOL).
DOWNCYCLING
The DEOL node models the opportunity of
downcycling damaged wooden pallets coming from
DC and/or RC. Pallets leaving nodes DC and/or RC
arrive at DEOL in the next time period.
LANDFILL
The LEOL node models the opportunity of sending
wooden and/or plastic pallets coming from DC
and/or RC to landfill. Pallets leaving nodes DC
and/or RC arrive at LEOL in the next time period.
INCINERATION
The IEOL node models the opportunity of
incinerating damaged wooden pallets coming from
DC and/or RC. Pallets leaving nodes DC and/or RC
arrive at IEOL in the next time period.
RETDC RC
RC
RM
MP
CPM
DEOL
LEOL
IEOL
RET
DC
RC
DEOL
DC
RC
LEOL
DC
RC
IEOL

Chapter III – Methodology
53
3.4 MATHEMATICAL PROGRAMMING MODEL
The mixed-integer programming model is a multi-objective and multi-period optimization model which
minimizes monetary costs and environmental impact due to carbon dioxide (CO2) emissions. The
optimization model is defined in detail in this section.
Objective Function: Minimizing System Monetary Cost
(1)
Objective function (1) calculates the system monetary cost, which includes the purchase/leasing cost,
transportation cost, and the credit obtained for selling or returning a pallet after being used.
The feasible region S is defined as the variables values that satisfy the following set of constraints:
Constraint (2) ensures that the sum of all pallets types shipped to each distribution center must
fulfill their demand.
(2)
Constraint (3) ensures that the sum of all pallets shipped to each of the retailers must satisfy their
demand.
(3)
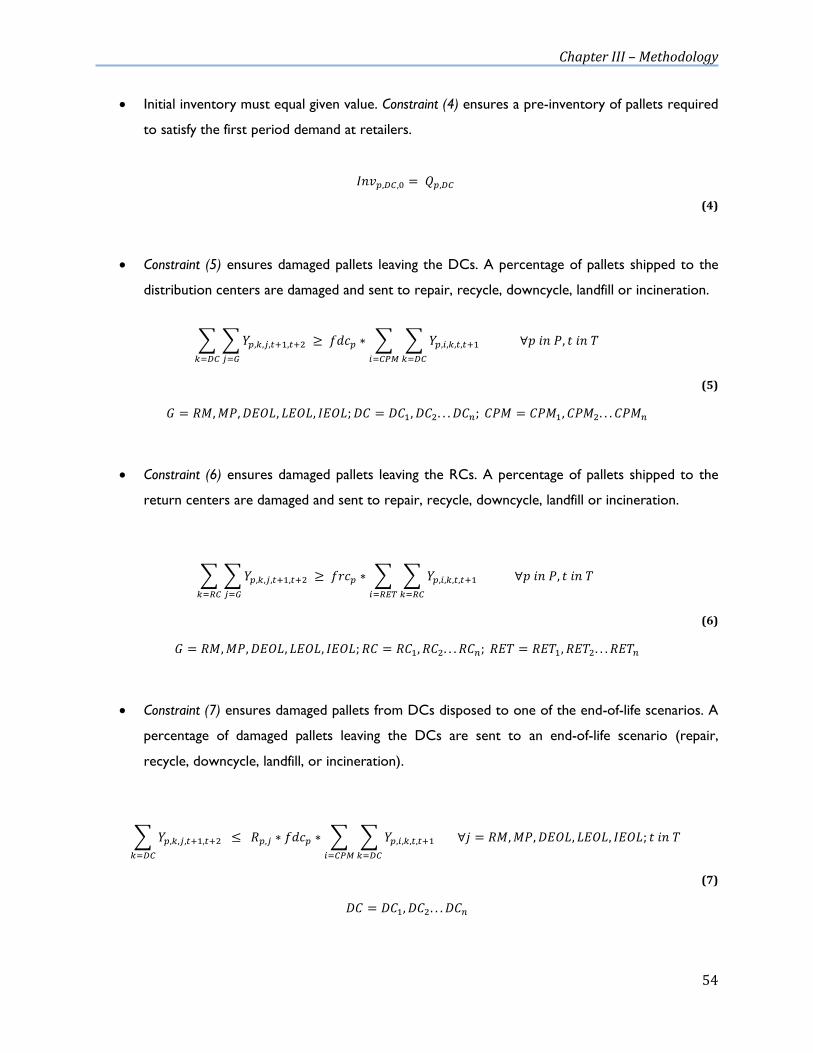
Chapter III – Methodology
54
Initial inventory must equal given value. Constraint (4) ensures a pre-inventory of pallets required
to satisfy the first period demand at retailers.
(4)
Constraint (5) ensures damaged pallets leaving the DCs. A percentage of pallets shipped to the
distribution centers are damaged and sent to repair, recycle, downcycle, landfill or incineration.
(5)
Constraint (6) ensures damaged pallets leaving the RCs. A percentage of pallets shipped to the
return centers are damaged and sent to repair, recycle, downcycle, landfill or incineration.
(6)
Constraint (7) ensures damaged pallets from DCs disposed to one of the end-of-life scenarios. A
percentage of damaged pallets leaving the DCs are sent to an end-of-life scenario (repair,
recycle, downcycle, landfill, or incineration).
(7)

Chapter III – Methodology
55
Constraint (8) ensures damaged pallets from RCs disposed to one of the end-of-life scenarios. A
percentage of damaged pallets leaving the RCs are sent to an end-of-life scenario (repair,
recycle, downcycle, landfill, or incineration).
(8)
Nodes balance constraints. Constraint (9) ensures a balanced flow of pallets for nodes RM, MP,
CPM, RET, and RC. The number of pallets of type p entering the node must be equal to the
number of pallets of type p departing the node.
(9)
Nodes balance constraints for DCs. Constraint (10) ensures a balanced flow of pallets for node
DC. The number of pallets of type p entering the node plus taken from inventory must be equal
to the number of pallets of type p departing the node and put in inventory.
(10)
k (t)
i
i
j
j(t)
(t)
(t-1)
(t+1)

Chapter III – Methodology
56
Set variables to zero:
a. Constraint (11) ensures that wooden pallets do not get recycled.
(11)
b. Constraint (12) ensures that plastic pallets do not get repaired, downcycled, or incinerated.
(12)
Only one specific pallet management system used by each CPM.
a. Constraint (13) allows a very large number, if not unlimited number of pallets (under a
specific and unique pallet management system per CPM) of type p to be manufactured. It
also ensures that pallets are only used if system is chosen.
(13)
b. Constraint (14) makes sure that only one pallet management system is used per CPM.
(14)
c. Constraint (15) represents pallets sent from DC back to reuse and which relate to a unique
CPM.
(15)
d. Constraint (16) represents pallets sent from RC back to reuse and which relate to a unique
CPM.
(16)

Chapter III – Methodology
57
Objective Function: Minimizing System Environmental Impacts (pounds of CO2):
(17)
Objective function (17) calculates the system environmental impacts to satisfy pallet demand and listed
constraints.
Subject to:
All previous constraints: (2), (3),… (16) plus:
Satisfy minimum system cost. Constraint (18) limits the system cost to not be greater than the
minimum cost. This constraint is parameterized with , allowing different cost increases for
further analysis.
(18)
The multi-objective optimization model first finds the set of pallet decisions that minimize the system
cost and then finds the set of pallet decisions that are the least environmentally harmful. The output of
the first objective function forms part of a cost constraint when minimizing the environmental impact;
which allows restricting the cost to be less or equal than the minimum cost. Additionally, this cost
constraint is parameterized, allowing relaxation of the system cost if desired (with parameter α). The
model generates multiple decisions, allowing the decision-maker to choose the tradeoff that fits their
company‟s goals. Likewise, the priority objective functions can also be exchanged, minimizing first the
environmental burden, and then the total costs constrained by these environmental costs.

Chapter III – Methodology
58
3.5 INPUT DATA COLLECTION
Input data for pallet materials, manufacturing processes, and pallet end-of-life scenarios are explained in
this section.
Materials
For the purposes of this work wooden pallets are made of two types of materials: hardwood-oak for
the pallet structure (boards and blocks), and low alloy steel for the nails. On the other hand, the body of
plastic pallets is made off high-density polyethylene (HDPE) with low carbon steel reinforcement bars
(PCRS, 2000).
Table 3 shows the carbon dioxide footprint from materials primary production, such as wood, plastic,
and steel, used later for pallet fabrication. The CO2 footprint refers to the mass of carbon dioxide
(CO2), in pounds, produced and released into the atmosphere, as a consequence of the production of
one pound of the material (CES, 2010). The materials database from the Cambridge Engineering
Selector (CES) 2010 was selected as the main source for these materials impacts. The following
assumptions were made for each material: hardwood-oak medium density; Zinc-Copper alloy, fastener
wire, for low alloy steel; high-density homopolymer for the HDPE; and, AISI 1010, annealed, for low
carbon steel.
Table 3. Carbon dioxide footprint from material primary production

Chapter III – Methodology
59
Manufacture
The fabrication of wooden pallets includes assembly and construction of wood boards, and casting for
the production of nails. Injection molding is assumed for the fabrication of plastic pallets, and extrusion
for their reinforcement bars (PCRS, 2000). Table 4 shows the CO2 footprint associated with pallet
manufacture.
Table 4. Carbon dioxide footprint from pallet manufacture
Transportation
For this research it was assumed the use of a model year 2007 or later Class 8 tractor trailer, which has
a fuel economy of 6 mpg when loaded. The assumed fuel is on-road diesel fuel with an energy content of
128,450 Btu/gal, a mass density of 3170 g/gal, and a carbon fraction of 86 percent (Comer et al., 2010).
The following conversion was used:
Eq. 19
where,
= mass density of fuel in grams of fuel per gallon (3167 gr/gal)
= carbon content of fuel (86 percent)
= CO2 to Carbon ratio (44/12)

Chapter III – Methodology
60
= miles per gallon (6 miles/gal)
= conversion factor to convert grams per pounds
Substituting for the given values, the following equation shows the carbon dioxide emitted per truck per
mile traveled.
Furthermore, the total amount of CO2 released per truck load of pallets per mile traveled is:
Eq. 20
where,
= pallet weight (lbs/pallet)
= number of pallets in load per truck
Therefore, the CO2 footprint per pallet per mile traveled is calculated by substituting the pallet weight
( ) and the number of pallets in load per truck ( ), which may vary if shipping loaded or unloaded
pallets.
End-of-Life Alternatives
Pallets may be disposed according to different scenarios. Each pallet end-of-life may include different
material disposal scenarios. These scenarios are detailed below:

Chapter III – Methodology
61
Reuse: does not create any additional CO2 footprint in the end-of-life stage.
Repair: only applied to wooden pallets. This scenario refers to repairing the wood and recycling
the nails which are made of steel. It has been assumed that for repairing processes 90 percent of
the material, in this case wood, is being recovered (Ashby, 2009), which means the
environmental impact accounts for 10 percent of the material CO2 footprint of each pallet (only
their wood).
Recycle: only applied to plastic pallets. This scenario refers to recycling the plastic and recycling
the steel reinforcement bars. The CO2 footprint refers to the mass of carbon dioxide (CO2), in
pounds, produced and released into the atmosphere, as a consequence of recycling one pound
of the material (CES, 2010).
Downcycle: only applied to wooden pallets. This scenario includes downcycling the wood and
recycling the nails made of steel. Since downcycling allows the creation of by products such as
mulch and animal bedding, it has been assumed that this process releases 40 percent of the total
CO2 released for the wood production. Thus, 60 percent of the material carbon dioxide
footprint for wood is being saved. Therefore, the CO2 footprint associated with downcycling
the wood is being calculated by multiplying 0.40 times the pounds of CO2 released when
processing hardwood/softwood.
Landfill: when products are sent to landfill the recovery factor is neglible (Ashby, 2009), which
means the environmental impact is represented by 100 percent the carbon dioxide footprint for
material primary production.
Incineration: pallets may get incinerated creating a high carbon footprint. This scenario includes
incinerating the wood and sending the steel (from nails) to landfill.
Table 5 shows the CO2 footprint associated to the different material disposal scenarios.

Chapter III – Methodology
62
Table 5. Carbon dioxide footprint per material disposed
Figure 8 shows the CO2 footprint of each end-of-life scenario per pound of material for wood pallets
(only considering the wood) and plastic pallets (only taking into account the plastic for graph purposes).
Repair releases the least amount of CO2; while recycling is the more sustainable option for plastic
pallets. Also, sending pallets to landfill or incineration will create the highest carbon footprint among the
scenarios. Note that this graph only illustrates the environmental impact of each end-of-life scenario per
pound of material per pallet type and does not include the pallet lifespan.
Figure 8. Environmental impact per end-of-life scenario per pound of material per pallet type
0.0
0.5
1.0
1.5
2.0
2.5
3.0
3.5
Repair Recycling Downcycling Landfill Incineration
EOL
Envi
ron
men
tal I
mp
act
(lb
sCO
2/lb
)
Wood Pallet
Plastic Pallet

Chapter IV – Validation
63
CCHHAAPPTTEERR IIVV
VVAALLIIDDAATTIIOONN
The purpose of this section is to validate the proposed model in Figure 4 - Chapter III. Typically,
validation would involve experimenting real data to see how well the model represents the actual
system and to further compare the results obtained through the model with real data of the system.
However, because real data on the carbon footprint from pallet operations in a supply chain is not
available, the validation proposed in this work is formulated differently. Therefore, a series of statements
on hypothesis for which the system behavior was known were tested and used as a tool for supporting
the logic of the system being modeled.
4.1 ASSUMPTIONS
The model is validated studying four different pallet management systems (or pallet types). Pallet type 1
is managed under a buy/sell program, and pallet types 2, 3, and 4 are pallet leasing companies. Pallet
types 1, 2, and 3 are wooden pallets; and pallet type 4 is a plastic pallet. They differ from one another in
weight, cost, and end-of-life scenarios.
o Pallet type 1: Pallet ownership is transferred with the product. Pallet type 1 is made of hardwood
and weighs 45 pounds. This pallet provider does not repair or recycle pallets. The product
distributor gains credit for selling these pallets after they have been used.
o Pallet type 2: Hardwood pallet under pooling system; ownership is not transferred with the pallet.
Type 2 pallets weigh 65 pounds. The pallet provider 2 repairs pallets, and sends wood waste to

Chapter IV – Validation
64
recycling centers. This pallet provider charges for returning their pallets from the product
distributor‟s facilities back to their depots.
o Pallet type 3: Hardwood pallet under pooling system; ownership is not transferred with the pallet.
Type 3 pallets weigh 62 pounds. The pallet provider repairs pallets and sends wood waste to
recycling centers.
o Pallet type 4: Plastic pallet under pooling system; ownership is not transferred with the pallet. Type
4 pallets weigh 47.5 pounds. The pallet provider 4 recycles their pallets when damaged. The product
distributor obtains a credit for returning these pallets back to the pallet provider.
A summary of pallet types characteristics are illustrated in Table 6. In this table the column Logistics
defines if the pallet type is managed under a buy/sell program or a leased pool. Pallet Lifespan is the
fraction of pallets per cycle that in fact have become unusable, and thus must leave the system. Material
and Manufacturing Processes are directly related with the pallet fabrication; and the End-of-life
Percentage represents the fraction of damaged pallets leaving the distribution centers and retailers that
reach each end-of-life scenario (such as repair, recycle, downcycle, landfill, or incineration). In addition,
the CO2 footprint from material primary production, manufacture, transportation, and each end-of-life
scenario per pallet type are detailed in Appendix A.
Table 6. General management characteristics per pallet type

Chapter IV – Validation
65
Other assumptions for the analysis include:
All consumer product manufacturers are collapsed into one single node because the volume of
products supplied by each consumer product manufacturer to each distribution center is not
known;
The use phase has eight (8) distribution centers, seventy five (75) retailers, and a single return
center;
A deterministic demand, estimated on a weekly basis, is assumed at each distribution center and
each retailer;
There is an unlimited number of new pallets that can be manufactured;
All wooden pallets are assumed to use 150 nails (http://www.chep.com). Paint is not considered to
be used in wooden pallets;
Pallet fabrication takes place in each of the pallet providers facilities and all material waste is used
for fabrication. As a result, all wood and recycled plastic is used in production of new pallets;
The same carbon dioxide footprint applies when manufacturing pallets made of raw or recycled
plastic;
All pallet manufacturers are located in the U.S.;
When pallets are repaired or recycled, a supply of new pallets for replacement is readily available;
Truck service is readily available and is the only transportation mode used;
A load per truck is considered to take 480 unloaded pallets or 24 loaded pallets;
Transportation costs remain constant throughout the period in study;
Transportation is only considered between product distributor‟s facilities (among distribution
centers, retailers and the return center);
Residence time of a leased pallet is 30 days;
The system starts with a pre-inventory of 34,000 type 1 pallets in order to satisfy pallet demand at
retailers in period 1.

Chapter IV – Validation
66
4.2 VALIDATION
The mathematical programming model was validated with data gathered from a case study of an existent
grocery supply chain network. Then, systematic experimentation was conducted to verify if the model
was constructed in a logical manner and included all the factors to be considered. The algorithm was run
for different scenarios by changing the inputs of the model in order to determine if the outputs obtained
were logical. A series of different hypotheses for which system behavior was known before hand were
posed and tested. Different results are shown in order to validate the logic of the system and to ensure
that the results are aligned with the system being modeled.
Validation when the objective function is minimization of environmental impacts
The results in Tables 7 and 8 are used for validation purpose to compare against other hypotheses to
validate the optimization model when minimizing the total system environmental burden. These results
are referred to throughout this section as environmental base scenarios, because they were obtained by
using the real input data per pallet type, as for materials, costs, etc.
As seen in Tables 7 and 8, pallets type 3 are preferred in the system, representing 86 percent and 92
percent of total pallet runs required to satisfy the demand for a time horizon of 6 months and 1 year,
respectively. Pallets type 1 are used in smaller quantity, representing only 14 percent for a time horizon
of 6 months, and 8 percent for a time horizon of 1 year, while pallets type 2 and 3 are not selected to
be used. The pallet percentage varies from one time horizon to another since the longer the time frame
is the more pallets type 1 (in pre-inventory) are discarded. As a result, more pallets are required to be
manufactured while the time horizon is longer. A pallet run refers to the pallet use per cycle to satisfy
the pallet demand. This pallet can be a new, reused, or repaired pallet.

Chapter IV – Validation
67
Table 7. Environmental base scenario - Number of pallets required to satisfy demand when minimizing environmental impacts (Time horizon: 6 months)
Table 8. Environmental base scenario - Number of pallets required to satisfy demand when minimizing environmental impacts (Time horizon: 1 year)
As a result, one can conclude that pooled wooden pallets (type 3) are the preferred pallets because they
last the longest among wooden pallets (type 1, 2 and 3), weigh the least among pooled wooden pallets
(type 2 and 3), and are repaired in high percentage (80 percent of total damaged pallets). The
hypotheses/statements used to validate the model are presented below.

Chapter IV – Validation
68
Statement 1: Would pallets type 4 be chosen if the CO2 footprint from plastic primary production is equal to
the CO2 footprint from wood primary production (changing parameter )?
Predicted behavior: Pallet type 4 would not be chosen because the CO2 footprint from manufacturing
processes is very high compared to the CO2 footprint from assembly and construction as for wooden
pallets.
Model results: Pallet type 4 does not appear to be chosen as the preferred option. As shown in Table 9,
pallets type 3 would still be the only type manufactured. These outcomes are the same as the
environmental base scenarios.
Table 9. Statement 1 – Analysis of CO2 footprint from plastic production
Statement 2: Would pallets type 4 be chosen if the CO2 footprint from making plastic pallets would equal
the CO2 footprint from making wooden pallets (changing parameter )?
Predicted behavior: Pallet type 4 would not be chosen as preferred since the CO2 footprint from material
primary production is very high compared to the CO2 footprint from wood primary production.
Model results: As shown in Table 10, pallet type 4 would not be manufactured. Pallet type 3 would be
chosen to be manufactured in the same amount as the environmental base scenario.

Chapter IV – Validation
69
Table 10. Statement 2 – Analysis of CO2 footprint from plastic pallet manufacture
Table 11 shows the CO2 footprint from materials production and pallet manufacturing processes for
each pallet type. The CO2 footprint from material and manufacture life-cycle stages of plastic pallets
(123.58 lbsCO2/lb) is much higher compared to the CO2 footprint of material and manufacture life-cycle
stages of wooden pallets (which range between 34.50 and 44.29 lbsCO2/lb for pallet type 1 and type 2,
respectively). This corroborates why plastic pallets may not be chosen to optimize the system in
questions 1 and 2.
Table 11. CO2 footprint from material and manufacture life-cycle stages per pallet type
Statement 3 - Part A: The answers to questions 1 and 2 imply that neither the CO2 footprint from plastic
production5 nor the CO2 footprint from plastic pallet manufacturing, individually, make a difference on the
total system environmental impact. However, the following question arises: would pallets type 4 be chosen if
both the CO2 footprint from material production and the CO2 footprint from pallet manufacturing processes
are simultaneously changed?
5 The material embodied energy is commonly expressed as (Hm)x by Ashby (2009). For Figure 12 purposes the
expression (Hm+P)x is used for material primary production and process CO2 footprint, where x=p represents
plastic , and x=w represents wood.

Chapter IV – Validation
70
Predicted behavior: Pallet type 4 would be chosen when the CO2 footprint from material primary
production and from pallet manufacture is equal for wooden and plastic pallets. This output is expected
because pallet type 4 last the longest and is reused more times, creating a low environmental impact.
Model results: Figure 9 illustrates the trend of pallets type 4 in the system. The lower the CO2 footprint
from plastic production plus the CO2 footprint from plastic pallet manufacture, the higher the
proportion of these pallets in the system. Different scenarios for the CO2 footprint of plastic production
plus manufacturing processes are illustrated in Figure 9.
Line A in Figure 9 represents the scenario when the CO2 footprint of plastic production and plastic
pallet manufacture equals the CO2 footprint of wood processing and wood pallet fabrication. In this
scenario pallet type 4 (plastic) starts to be manufactured after 5 months, and represent 73 percent of
total new pallets manufactured for a time horizon of 6 months, while the remaining are pallets type 3.
As mentioned earlier in the study, the longer the time span, the higher the percentage of pallets type 4
in the system since they last longer and can get reused more times, offsetting the CO2 footprint from
fabricating new pallets. As a result, pallets type 4 represent 100 percent of total new pallets
manufactured after a time horizon of 9 months.
Figure 9. Statement 3 Part A – CO2 footprint analysis for material and manufacture phases of pallet type 4
0%
10%
20%
30%
40%
50%
60%
70%
80%
90%
100%
0 3 6 9 12 15 18 21 24 27 30 33 36 39 42 45 48 51 54 57 60
Pe
rce
nta
ge o
f n
ew
pal
lets
typ
e 4
man
ufa
ctu
red
Time Horizon (months)
(Hm+P)p = (Hm+P)w
(Hm+P)p = 1.02*(Hm+P)w
(Hm+P)p = 1.05*(Hm+P)w
(Hm+P)p = 1.10*(Hm+P)w
(Hm+P)p = 1.50*(Hm+P)w
(Hm+P)p = 2.00*(Hm+P)w
(Hm+P)p = 2.50*(Hm+P)w
(Hm+P)p = 3.00*(Hm+P)w
(Hm+P)p = 5.24*(Hm+P)w Real value
(Line A)
(Line B)
(Line C)

Chapter IV – Validation
71
Other scenarios study different CO2 footprints for plastic pallets. For example, Line B in the figure
represents the scenario when plastic pallets have a total CO2 footprint for plastic production and plastic
pallet manufacture 1.10 times the CO2 footprint of wood production and wooden pallet fabrication
together. In this scenario, pallets type 4 start to be manufactured after an 11 month time horizon,
representing only 16 percent of the total new pallets manufactured for a time horizon of 12 months. For
a time horizon of 18 months pallets type 4 represent 90 percent of total pallets manufactured.
In summary, the lower the CO2 footprint from plastic production and plastic pallet manufacture, the
higher the percentage of these pallets in the system. The results are expected since pallet type 4 has the
longest lifespan within the pallets in study. Moreover, pallets type 4 with high CO2 footprint from
material production and manufacture are preferred only for long time horizons.
Statement 3 - Part B: Under the assumption that a plastic pallet has the same CO2 footprint in the material
and manufacture life-cycle stages as a wood pallet (Line A in Figure 9), the two following hypotheses are
analyzed:
1) If the model runs for a time horizon of 3 months with only plastic pallets type 4, the total system
environmental impact will be higher than if only wooden pallets type 3 are manufactured.
Predicted behavior: That the system environmental impact will increase because the CO2 footprint from
using plastic pallets of type 4 is higher than the CO2 footprint from using wooden pallets type 3.
Model results: As shown in Figure 10, when only pallet type 4 is manufactured the total environmental
impact of the supply chain increases to 6.65 metric KTons of CO2 (S in figure), compared to 2.85 metric
KTons of CO2 when pallet type 3 is chosen. As a result, the CO2 footprint increases by 233%. This
result is expected because for a short time horizon long lasting pallets are not needed.

Chapter IV – Validation
72
2) If the model runs for a time horizon of 12 months with only wooden pallets type 3, the total system
environmental impact will be lower than if only plastic pallets type 4 are manufactured.
Predicted behavior: That the system environmental impact will decrease because the CO2 footprint from
using pallets of type 3 is lower than the CO2 footprint from using pallets of type 4.
Model results: As shown in Figure 10, when only pallet type 3 is manufactured the total environmental
impact of the supply chain decreases to 4.31 metric KTons of CO2 (V in figure), compared to 4.60
metric KTons of CO2 when pallet type 4 is chosen.
Figure 10. Statement 3 – Part B - Pallet fraction used when the CO2 footprint from plastic primary production and plastic pallet manufacture equal the CO2 footprint from wood primary production and wood pallet manufacture
Statement 4: Would pallets of type 3 represent the highest proportion of new pallets manufactured if their
failure fraction ( ) per cycle would increase from 1/23 to 1/3 (same as failure fraction of pallet type 1)?
Predicted behavior: Pallet type 3 would not be chosen because they weigh more than pallet type 1(65
lbs/pallet compared to 45 lbs/pallet) and because their failure fraction would be high, creating a higher
total environmental impact.
2.85
4.60
4.31
6.65
-
2
4
6
8
10
12
0%
10%
20%
30%
40%
50%
60%
70%
80%
90%
100%
0 3 6 9 12 15 18 21 24 27 30 33 36 39 42
Tota
l sys
tem
en
viro
nm
en
tal
imp
act
(Kto
ns
CO
2)
Pal
let
Frac
tio
n
Time Horizon (months)
Pallet 4 Fraction
Pallet 3 Fraction
System Total Environmental Impact (Metric
KTons CO2)Scenario all WOODEN Pallets 3
Scenario all PLASTIC pallets 4
S
V
S
V

Chapter IV – Validation
73
Model results: Pallets type 3 would not optimize the system if they have such a short lifespan as shown in
Table 12. Instead, pallets of type 2 are the only type manufactured.
Table 12. Statement 4 – Analysis of pallet type 3 failure fraction
Statement 5: Pallets type 3 will be the only type manufactured if the model runs with only pallets type 2 and
type 3. (Note: assuming under this scenario same pre-inventory of both pallet types).
Predicted behavior: Pallets type 3 would be preferred because they weigh less than pallets type 2 and have
the same lifespan, creating a lower total environmental impact.
Model results: Only pallets of type 3 are manufactured.
Table 13. Statement 5 – Only pallets type 2 and type 3 in the system
Statement 6 - Part A: Fewer pallets should be manufactured if the initial inventory (pre-inventory at the
distribution centers) is represented by only plastic pallets type 4 instead of wooden pallets type 1 (Note:
= 34,000 pallets).

Chapter IV – Validation
74
Predicted behavior: Less number of pallets should be manufactured when starting with an inventory of
pallets type 4, due to their long lifespan compared to pallets type 1.
Model results: When the system starts with plastic pallets in pre-inventory, fewer new pallets are needed
to satisfy the demand (refer to Table 14, column Scenario Statement A). A total of 85,158 instead of
109,433 pallets are manufactured for a time horizon of 1 year. The difference between the total
numbers of pallets manufactured is expected because plastic pallets last 80 cycles compared to pallets
type 1 which last 3 cycles.
Also, pallets have to be manufactured during the first week in order to satisfy the demand at the
distribution centers. Pallets type 3 are manufactured to fulfill such demand because their low
environmental impact and high lifespan. Furthermore, a small amount of pallets type 1 (1,996 pallets) are
manufactured during the last weeks of the 1 year time horizon; these pallets are chosen because they
will be used only for a few weeks, and have the lowest total CO2 footprint among the pallets in the
study.
Statement 6 - Part B: Plastic pallets type 4 should be preferred when the pre-inventory has 160,000 pallets
type 4 (an excess amount of pallets included in the system above the pallet amount needed to satisfy
demand at week 1).
Predicted behavior: When starting with an excess inventory of pallets type 4 this should be enough to
satisfy the pallet demand for a 1 year time horizon, since these pallets last approximately 80 cycles
(more than 4 years) before damaged. Note that pre-inventory exists only at the DCs and will satisfy the
demand at the retailers. Furthermore, the plastic pallets in pre-inventory cannot be returned to satisfy
the first week‟s demand at distribution centers. For this reason, it is predicted that pallets will be
manufactured to satisfy the demand only of week 1.

Chapter IV – Validation
75
Model results: The pre-inventory of pallets type 4 are mainly used to fulfill the pallet demand during 1
year. However, the system only manufactures pallets at the beginning of the time horizon to fulfill the
total demand at the distribution centers in week 1, as shown in Table 14 Scenario Statement B. For this
reason, the system chooses to manufacture 33,582 pallets type 1 in order to satisfy the demand at the
DCs in a week.
Table 14. Statement 6 – Analysis of pallet type in pre-inventory
Eco-audit per pallet type
An eco-audit was developed in this section to corroborate the importance of the environmental impact
of materials life-cycle stage within all four life-cycles stages. The eco-audit tool allows designers to
quickly estimate which life-cycle stage causes the most damage to the environment to focus their design
efforts on the most significant life phases (Ashby, 2009). The validation, when minimizing the
environmental impacts, shows the sensitivity of the model when modifying the CO2 footprint from
materials production and pallets manufacture. In addition, it helps to visualize and compare the total
CO2 footprint of the four pallet types in the study.
The functional unit for performing the eco-audit was defined as the number of pallets required to fulfill a
demand of 480 pallets per cycle for a time horizon of 80 cycles and assuming a total transportation of
300 miles. The eco-audit studies the environmental impact of each pallet type when satisfying that

Chapter IV – Validation
76
functional unit (refer to Figure 11). Note the assumptions are used only for the purpose of this analysis;
they do not apply for the mathematical programming model.
(a) Pallet type 1 (b) Pallet type 2
(c) Pallet type 3 (d) Pallet type 4
Figure 11. Eco-Audit per pallet type (80 cycles)
The environmental impact per life-cycle stage (in metric Tons of CO2) for each pallet type is given in
Figure 11. Since pallet type 1 has the highest failure fraction (1/3 per cycle), these pallets are damaged
more often; consequently, more of these pallets (12,800) are needed to satisfy the demand than when
using other pallet types. Furthermore, the system environmental impact is the highest when using pallets
type 1, releasing a total of 270 metric Tons of CO2. Also, for the same functional unit, a total number of
1,670 pallets are required to fulfill the demand when using pallets type 2 and type 3, creating a total

Chapter IV – Validation
77
environmental impact of 41 and 40 metric Tons of CO2. Only 480 pallets of type 4 would be required
because their reuse percentage is very high compared to the other pallet types.
The eco-audits per pallet type validates that the Material life-cycle stage, for all four pallet types in the
study, creates the highest CO2 footprint among all, representing more than 70 percent of total system
environmental impact. On the other hand, it is important to note that this may vary if the total miles of
transportation were to increase (e.g. if 1,000 miles would be travelled instead of 300 miles). In this case,
it is highly expected that the Transportation stage may represent the life-cycle stage with highest
environmental impact. However, under the assumptions of the eco-audit it can be concluded that the
CO2 footprint from the Material stage is much higher than the CO2 footprint from Manufacture and
End-of-Life life-cycle stages.
Validation where the objective function is minimization of monetary costs
This section validates the optimization model when minimizing the total system cost measured in U.S.
dollars. Because pallets are charged the same purchase/leasing cost ( ) each cycle whether the
pallet is new, reused, repaired, or made of recycled material, a simple economic analysis can determine
which pallet is more cost effective. Pallets type 1 and 3 have the same and lowest purchase/leasing cost,
although only pallet type 1 is sold after use during one cycle, which makes this pallet the cheapest among
the pallets in the study and most preferable. Pallet type 2 is the most expensive among the wooden
pallets, and in fact, is the only pallet that charges a cost of return. Even though pallet type 4 (plastic
pallet) has a credit for returning the pallet to the pallet provider, it is an expensive pallet because of its
higher leasing cost. Detailed costs applicable per pallet type are shown in Table 15.

Chapter IV – Validation
78
Table 15. Pallet costs associated to each pallet management system (or pallet type)
Note. Cost information on table was obtained through personal communication with Chris Merta, Ongweoweh Corp. July 15, 2009;
Danielle Rozelle, iGPS January 13, 2010; Heather Tarbet, CHEP January 15, 2010; Mike Tebay, PECO Pallet January 28, 2010; Tim
Murphy, local grocery distributor, February 3, 2010.
Different scenarios were run to validate that the model produces logically correct solutions when
minimizing cost. To do so, a costs base scenario is used as reference for comparison for further
statements.
The cost base scenario results are shown in Tables 16 and 17. For a time horizon of 6 months, 297,698
pallets type 1 are manufactured and represent the only pallet type used. The total system cost required
to satisfy the pallet demand for this time period is $14.9 million. For a time horizon of 1 year, the total
system cost increases to $32.1 million and a mix of pallets type 1 and 3 are used to satisfy the demand;
pallet type 1 representing 99 percent (569,827 pallets) and pallet type 3 representing 1 percent (18,895
pallets) of total pallets manufactured. It is expected that by increasing the time period in study, pallets
with a longer lifespan and less cost will be dominating the system.
Table 16 shows the need of a total of 924,298 pallet runs required to fulfill the demand for a time
horizon of 6 months. From these total pallets, 297,698 are new pallets manufactured, 566,954 are
reused pallets, and 25,646 are repaired pallets. In addition, for a time horizon of 1 year, pallets type 1
and type 3 are used to fulfill the demand, whether they are newly manufactured, reused, or repaired.
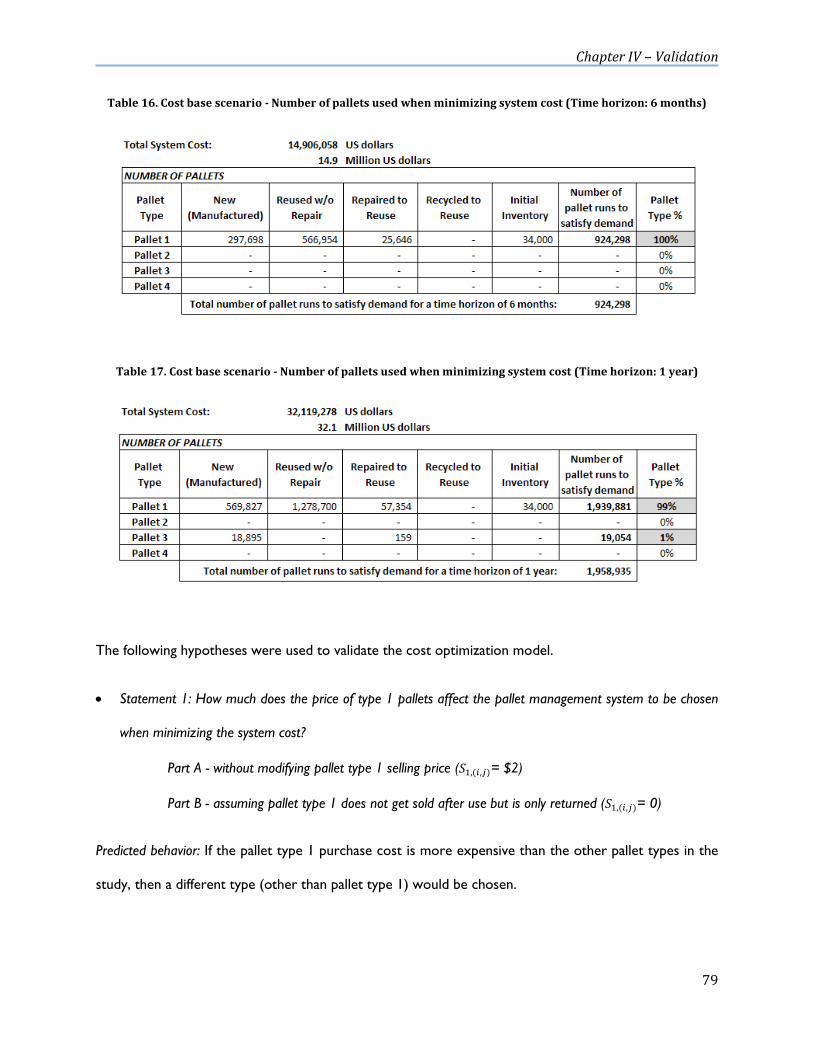
Chapter IV – Validation
79
Table 16. Cost base scenario - Number of pallets used when minimizing system cost (Time horizon: 6 months)
Table 17. Cost base scenario - Number of pallets used when minimizing system cost (Time horizon: 1 year)
The following hypotheses were used to validate the cost optimization model.
Statement 1: How much does the price of type 1 pallets affect the pallet management system to be chosen
when minimizing the system cost?
Part A - without modifying pallet type 1 selling price ( = $2)
Part B - assuming pallet type 1 does not get sold after use but is only returned ( = 0)
Predicted behavior: If the pallet type 1 purchase cost is more expensive than the other pallet types in the
study, then a different type (other than pallet type 1) would be chosen.

Chapter IV – Validation
80
Model results: The model was run by changing the pallet type 1 purchase cost ( ) to different values,
such as 4, 5, 6, 7, 9, and 12 dollars per pallet. For Part A, pallets of type 1 are manufactured when their
purchase cost is low (less than $6/pallet), as shown in Figure 12. However, pallets of type 3 are
manufactured when their cost equals the cost of pallets type 1, and are the only type of pallet
manufactured when pallet type 1 purchase cost is $9 per pallet or higher. Furthermore, under scenario
Part B (Figure 13), the trend of pallets use is similar, although the change of preferred pallet type from
type 1 to type 3 occurs sooner, since the pallets type 1 selling price ( ) is zero.
Figure 12. Statement 1 - Part A – Percentage of new pallets manufactured for different pallet type 1 purchase costs and for pallet type 1 selling price = $2/pallet (Time horizon: 5 years)
Figure 13. Statement 1 - Part B - Percentage of new pallets manufactured for different pallet type 1 purchase costs and for pallet type 1 selling price = $0/pallet (Time horizon: 1 year)
0
500
1,000
1,500
2,000
2,500
3,000
0%
10%
20%
30%
40%
50%
60%
70%
80%
90%
100%
3 4 5 6 7 8 9 10 11 12
Nu
mb
er
of
ne
w p
alle
ts m
anu
fact
ure
d
Frac
tio
n o
f n
ew
pal
lets
man
ufa
ctu
red
Pallet 1 Purchase Cost ($/pallet)
Pallet 1
Pallet 2
Pallet 3
Pallet 4
Total Number of New Pallets Manufactured (in thousand)
Note: min Costs for time horizon 5 years
Selling Price Pallet 1: $2/pallet
0
100
200
300
400
500
600
700
0%
10%
20%
30%
40%
50%
60%
70%
80%
90%
100%
3 4 5 6 7 8 9 10 11 12
Nu
mb
er
of
ne
w p
alle
ts m
nu
fact
ure
d
Frac
tio
n o
f n
ew
pal
lets
man
ufa
ctu
red
Pallet 1 Purchase Cost ($/pallet)
Pallet 1
Pallet 2
Pallet 3
Pallet 4
Total Number of New Pallets Manufactured (in thousand)
Note: min Costs for time horizon 1 yearSelling Price Pallet 1: $0/pallet

Chapter IV – Validation
81
Statement 2: How much does pallet type 4 leasing cost affect the pallet management system to be used
when minimizing cost?
Predicted behavior: If pallet type 4 leasing cost ( ) is changed in the way that its net cost (difference
between the purchase/leasing cost and the selling price/credit for return) is the lowest among all pallet
types in study, then this pallet type is expected to be chosen.
Model results: When pallet type 4 has a leasing cost of $4 per pallet, it is the only type manufactured, as
shown in Figure 14.
Figure 14. Statement 2 – Percentage of new pallets manufactured for different pallet type 4 leasing costs (Time horizon: 1 year)
Statement 3: Which mix of pallet types will make the system perform under the lowest costs when all four
pallet types have the same purchase/leasing cost ( = $5)?
Predicted behavior: Pallet type 1 is expected to be the preferred pallet since a credit is obtained when
selling these pallets.
Model results: Since pallets type 1 are sold after used, this pallet type is preferred for 96 percent of total
new pallets manufactured as expected, while pallets type 2, 3, and 4 represent 0.6, 0.4, and 3 percent,
0
100
200
300
400
500
600
700
800
900
0%
10%
20%
30%
40%
50%
60%
70%
80%
90%
100%
3 4 5 6 7 8 9 10 11 12
Nu
mb
er
of
ne
w p
alle
ts m
anu
fact
ure
d
Frac
tio
n o
f n
ew
pal
lets
man
ufa
ctu
red
Pallet 1 Issue Cost ($/pallet)
Pallet 1
Pallet 2
Pallet 3
Pallet 4
Total Number of New Pallets Manufactured (in thousand)
Note: min Costs for time horizon 1 year

Chapter IV – Validation
82
respectively, as shown in Figure 15. Pallet type 4 is the second preferred pallet because it has a credit
for return and has the longest lifespan.
Figure 15. Statement 3 – New pallets manufactured when all 4 pallet types have the same purchase/leasing cost ($5/pallet)
Statement 4: Would plastic pallets (type 4) be chosen if the wood supply decreases, assuming this generates
an issue cost increase ( ) of 30 percent for wooden pallets (type 1, 2, and 3)?
Predicted behavior: Pallets type 4 may be manufactured since, in the proposed statement, this pallet type
may cost less than a wooden pallet. Moreover, pallet type 1 would cost $6.5 per pallet instead of
$5/pallet, pallet type 2 would cost $7.5 per pallet instead of $5.8/pallet, and pallet type 3 would cost
$6.5 per pallet instead of $5/pallet, compared to the cost of a plastic pallet which is $6/pallet. However,
under this scenario pallets type 1 are still more cost effective because they are sold for $2 per pallet.
Model results: Under this assumption plastic pallets would be manufactured but in very low quantity,
representing 15,655 from a total of 297,713 pallets for a time horizon of 6 months, and 26,859 from a
total of 586,818 pallets for a time horizon of 1 year, as shown in Table 18. Pallets type 1 are still cheaper
and represent the highest percentage of total new pallets manufactured.
96%
0.6% 0.4% 3%
0
100
200
300
400
500
600
Pallet 1 Pallet 2 Pallet 3 Pallet 4Nu
mb
er o
f new
pal
lets
man
ufa
ctu
red
(in
th
ou
san
ds)
Note: min Costs only for time horizon 1 year

Chapter IV – Validation
83
Table 18. Statement 4 – Pallets types manufactured when wooden pallet issue costs increases
Overall, the optimization model chooses a logical mix of pallet management systems depending on the
values given to the different parameters/factors and the objective considered. Furthermore, pallets type
2 are never chosen, neither when minimizing the environmental impacts of the system, nor when
minimizing the total system cost; therefore, this pallet type will not be taken into account for future
experiments analysis.
Chapter V – Case Study – Results and Analysis
84
CCHHAAPPTTEERR VV
CCAASSEE SSTTUUDDYY -- RREESSUULLTTSS AANNDD AANNAALLYYSSIISS
A case study from a large grocery distributor/retailer in the Northeast is presented. The results and
analysis section describes and interprets different outputs obtained when running the algorithm for the
mixed integer optimization model under various scenarios. These scenarios can include change of
factors, parameters, and/or pallet characteristics to see their impact on the pallet management systems
chosen.
5.1 CASE STUDY GROCERY DISTRIBUTOR/RETAILER
The product distributor/retailer analyzed in this case study owns multiple distribution centers (8),
multiple retailers (75), and a single return center, as shown in Figure 16. The case study considers pallets
type 1, 3, and 4 defined in the validation section. Pallet type 1 represents a wooden pallet under a
buy/sell program. Pallet types 3 and 4 are leased pools. Pallet type 3 is a wooden pallet, while pallet type
4 is a plastic pallet.
All stated assumptions included in the modeling approach and validation section apply. Monetary costs
involved per pallet type are the costs presented earlier in Table 15 (Chapter III). In addition, the carbon
dioxide footprint from each life-cycle stage per pallet type is detailed in Appendix A.

Chapter V – Case Study – Results and Analysis
85
Figure 16. Pallets life-cycle network applied to the case study
Because the case study is based on a grocery distributor/retailer a pallet demand exists at two different
locations: distribution centers and retailers. Each of the distributor facilities has a different demand. Data
on pallet demand at each of the 8 DCs and each of the 75 retailers is known for 5 weeks. For the
purpose of the study, this data is repeated when analyzing time horizons longer than 5 weeks. Tables 19
and 20 show the weekly demand at the distribution centers and retailers, respectively. For detailed
information on pallet demand per facility refer to Appendix A. In addition, transportation miles within
distribution centers, retailers, and the return center are specified in Appendix A.
DC5
USE
CPM
DC8
DC7
DC6
DC4
DC3
DC2
DC1
RET75
RET25
RET2
RET1
RC
.
..
.
..
IEOL
LEOL
DEOL
MP
RM

Chapter V – Case Study – Results and Analysis
86
Table 19. Weekly pallet demand at distribution centers (Dc)
Table 20. Weekly pallet demand at retailers (Db)
Table 21 shows the percentages of damaged pallets disposed to the different end-of-life scenarios.
Table 21. Pallets end-of-life percentages per pallet type
5.1.1 MODELING PALLET LIFESPAN
The literature review found that different pallet companies have conducted LCA analyses in the past
years (CHEP, 2008; iGPS, 2008), and different assumptions regarding pallet lifespan (based on number of
trips6 a pallet may last before damaged) were used in each of the studies.
For the purpose of this work, the pallet failure was calculated by averaging (from both sources) the
number of cycles a pallet lasts before damaged (for whitewood, pooled wood and pooled plastic pallets).
Estimations of pallet failure fractions are detailed per pallet type.
6 Note: the word trip in pallet providers‟ context is referred as cycle for the research purpose.
Chapter V – Case Study – Results and Analysis
87
Whitewood Pallet:
CHEP states that whitewood pallets last 4 cycles (Brindley, 2010) (20 trips in the present study, since
there are 5 trips per cycle) and iGPS states that whitewood last 2 cycles (iGPS, 2008) (10 trips for the
study). On average whitewood pallets last 15 trips (3 cycles) before damaged, which translates into a
failure fraction of 1/3 per cycle. In other words, 33.24 percent of total pallets shipped every cycle leave
the system. Considering the trips and handlings per trip, 1/9 of the pallets arrived at the DC and 2/9 of
the pallets arrived at the RC present failure.
Pooled Wooden Pallet:
CHEP states that whitewood pallets last 30 cycles (Brindley, 2010) (150 trips in the present study) and
iGPS states that they last 15 cycles (iGPS, 2008) (75 trips for the study). On average pooled wooden
pallets last 115 trips (23 cycles) before damaged, which translates into a failure fraction of 1/23 per cycle.
Further, 4.35 percent of total pallets shipped every cycle get damaged or present failure. Therefore, 1/69
and 2/69 of pallets arrived at DC and RC, respectively, leave the system.
Pooled Plastic Pallet:
CHEP states that plastic pallets last 60 cycles (Brindley, 2010) (300 trips in the present study) and iGPS
states that they last100 cycles (iGPS, 2008) (500 trips for the study). On average pooled plastic pallets
last 400 trips (80 cycles), which translates into a failure fraction of 1/80 per cycle. Further, 1.25 percent
of total pallets shipped every cycle get damaged. Moreover, 1/240 and 2/240 of pallets arriving the DC
and RC, respectively, present failure.
The lifespan of a pallet may depend on different factors, e.g. pallet material (i.e. softwood, hardwood,
plastic, metal), durability, structure (block vs. stringer), etc. Since pooled wooden pallets are designed to
be reused many times, they typically last longer than whitewood pallets. Figure 17 represents the
percentage of damaged pallets estimated per cycle.

Chapter V – Case Study – Results and Analysis
88
Figure 17. Physical failure fraction representation per pallet
5.2 RESULTS AND ANALYSIS
The questions wished to answer are:
Question 1: What is the tradeoff between environmental impacts and costs?
Question 2: Which mix of pallet management systems minimizes the environmental impacts and
costs under different time frames?
Question 3: How much do pallet weight and purchase/leasing cost affect the pallet management
system used? How much does this affect the system costs and its environmental burden?
Question 4: How much do pallet weight and the CO2 footprint from material production affect
the pallet management system used? How much does this affect the system costs and its
environmental burden?
Question 5: Does demand affect the preferred pallet management system?
Question 6: Does transportation affect the preferred pallet management system?
Question 7: How can new regulations on pallet end-of-life scenarios influence the system carbon
footprint?
PALLET
PROVIDER
(PP)
PALLET
USER
Reused w/o repair
Damaged pallets
(presenting failure)
33.24%
66.76%
Whitewood Pallet
PALLET
PROVIDER
(PP)
PALLET
USER
Reused w/o repair
Damaged pallets
(presenting failure)
4.35%
95.65%
Pooled Wood Pallet
PALLET
PROVIDER
(PP)
PALLET
USER
Reused
Damaged pallets
(presenting failure)
1.25%
98.75%
Pooled Plastic Pallet

Chapter V – Case Study – Results and Analysis
89
5.2.1 WHAT IS THE TRADEOFF BETWEEN ENVIRONMENTAL IMPACTS AND COSTS?
The tradeoff between the total environmental impacts of the system and its costs is represented in
Figure 18. This figure illustrates the environmental and cost values for a time horizon of 1 year, although
the trend remains similar when studying different time frames. From the graph, it can be understood
that if spending 10.6 percent more on pallets than the minimum required ($35,520,957 instead of
$32,119,278; $3.4 millions more) the system would perform under the lowest environmental impacts,
releasing 4.68 metric KTons of CO2 compared to 14.1 metric KTons of CO2.
Figure 18. Tradeoff between system environmental impacts and costs (Time horizon: 1 year)
Furthermore, if the same analysis is performed for a time horizon of 6 months (refer to Appendix D), an
additional 9.82 percent of the minimum total system costs ($14,906,058) would need to be spent (a
difference of approximately $1.5 million) to reduce the system carbon footprint to the lowest possible
value. The system, when performing under the lowest environmental impact, releases 3.46 metric
KTons of CO2.

Chapter V – Case Study – Results and Analysis
90
5.2.2 WHICH MIX OF PALLET MANAGEMENT SYSTEMS MINIMIZES THE ENVIRONMENTAL
IMPACTS AND COST UNDER DIFFERENT TIME FRAMES?
This analysis addresses what mix of pallet types would be manufactured (introduced) in the system in
order to satisfy pallet demand while minimizing the total environmental impacts subject to minimum
cost. The algorithm in Chapter II was run for the different time horizons illustrated in Figure 19. Results
show that pallets type 1 represent more than 90 percent of total new pallets manufactured, pallets type
3 represent the fraction remaining, and pallets type 4 are not used under this scenario.
Note. Pallet fraction represents the total number of pallets manufactured new for the entire time horizon.
Figure 19. Pallet use per pallet type when minimizing environmental impacts subject to minimum cost
Even though the purchase cost of pallet type 1 is the same as the leasing cost of pallet type 3 ($5/pallet),
pallets type 1 are sold after use (for $2/pallet), making this pallet type the less expensive. As a result,
these pallets (type I) are preferred when optimizing the system under this scenario.
When analyzing the total number of new pallets manufactured for each time horizon, it can be noted
that after a time horizon of 8 months the number of pallets type 3 remains almost constant
(approximately 13,600 pallets), whereas the number of pallets type 1 increases for longer time horizons,
representing approximately 370,000 pallets for a time horizon of 8 months and 2,700,000 when running
0%
20%
40%
60%
80%
100%
0 3 6 9 12 15 18 21 24 27 30 33 36 39 42 45 48 51 54 57 60
Frac
tio
n o
f n
ew
pal
lets
man
ufa
ctu
red
Time Horizon (months)
Pallet 1 Fraction
Pallet 3 Fraction

Chapter V – Case Study – Results and Analysis
91
the model for 5 years (refer to Appendix D for detailed graph). This is because the model, under longer
time horizons, chooses to manufacture a pallet type with a longer lifespan, such as pallet type 3.
Moreover, pallets type 1 still optimize the system since they are the less expensive pallet with the least
weight (45 lbs/pallet), thus the lowest total material CO2 footprint.
Figure 20 represents the percentage of new pallets manufactured per pallet type that optimize the
system when minimizing the total environmental impacts but constrained by 125 percent of the
minimum system cost (α=25 percent). Under this scenario, only pallet type 3 is manufactured.
Figure 20. Pallet use per pallet type when minimizing system environmental impacts allowing costs to increase
by 25 percent the minimum cost
When only pallets of type 3 are used, a smaller number of pallets are needed to satisfy the pallet
demand. For example, for the scenario where the system performs under the lowest system cost,
approximately 300,000 of pallets type 1 are needed to satisfy the pallet demand for 6 months; while in
the scenario where 25 percent above the minimum costs is allowed, only 105,000 pallets type 3 are
needed. Furthermore, for time horizons of 2 years under the first scenario (minimum costs), a total of
1,123,601 pallets are manufactured, from which 1,109,940 are pallets type 1 and the rest pallets type 3.
Under the second scenario (relaxing the system cost allowing 25 percent above the minimum) a total of
0%
20%
40%
60%
80%
100%
0 3 6 9 12 15 18 21 24 27 30 33 36 39 42 45 48 51 54 57 60
Frac
tio
n o
f ne
w p
alle
ts m
anu
fact
ure
d
Time Horizon (months)
Pallet 1
Pallet 3
Pallet 4

Chapter V – Case Study – Results and Analysis
92
125,732 pallets are manufactured, all represented by pallets type 3. This result is expected, since for a
time horizon of 2 years (104 weeks), approximately 8 times more pallets type 1 are needed than pallets
type 3 because of their different lifespan characteristic. Pallet type 1 lasts approximately 3 cycles before
getting damaged, while pallet type 3 lasts 23 cycles before damaged.
5.2.3 HOW MUCH DO PALLET WEIGHT AND PURCHASE/LEASING COST AFFECT THE PALLET
MANAGEMENT SYSTEM USED? HOW MUCH DOES THIS AFFECT THE SYSTEM COSTS AND
ITS ENVIRONMENTAL IMPACTS?
From the validation section and previous experiments it is known that factors such as pallet weight and
pallet purchase/leasing cost may have a significant impact on the output of the model.
The experiment was performed for pallet weight ( ) and pallet purchase/leasing cost ( ), at
two levels for each pallet management system (high and low), first minimizing the total system cost and
then minimizing environmental impacts subject to these minimum cost. Figure 21 shows the values for
each level given to each of the pallet types.
The design for two factors and at two levels for each of the three pallet types, results in an experimental
design of 64 different combinations (also referred as runs or scenarios) (refer to Appendix D for
detailed 64 combinations). This design was run for two different time horizons: 6 months and 2 years.
Source: different pallet websites and personal communications referenced in validation section
Figure 21. Levels for weight and purchase/leasing cost factors included in analysis

Chapter V – Case Study – Results and Analysis
93
The same proportion of pallet management systems was obtained for a time horizon of 6 months and 2
years. In 50 percent of the cases where pallet of type 1 weight is at a low level (40 lbs/pallet) (16 of 64
combinations), these pallet types are the only type manufactured; whereas, in 25 percent of the cases
pallets of type 3 are chosen, and in the remaining cases pallets type 4 are manufactured. A similar
situation occurs when pallet type 1 is at a high weight (65 lbs/pallet).
In 100 percent of the cases where pallets of type1 are at a low purchase cost ($3/pallet) (32 of total 64)
these pallet types represent all the pallets manufactured. Otherwise, these are never manufactured when
they are at a high purchase cost ($9/pallet). Pallets of type 3 are manufactured when its leasing cost is at
low ($4/pallet) while pallet type 1 purchase cost is at a high level. Pallets of type 4 are manufactured
when both pallets type 1 and type 3 purchase/leasing costs are at high levels, regardless at what leasing
cost they pallets type 4 are (refer to Appendix D for detailed results).
A conclusion drawn from this analysis is that pallet weight under the factor levels studied does not affect
the output of the model. Furthermore, the pallets purchase/leasing cost drives which pallet is
manufactured. The pallet type chosen when minimizing the environmental impacts subject to minimum
cost will be the pallet type with the lowest purchase/leasing cost.
Results may vary when the total system cost does not perform at its lowest level but at some
percentage higher, or when the objective functions are reversed. Therefore, other tests were run to
analyze these possible effects. Moreover, from the 64 combinations, 3 scenarios were chosen to be
analyzed and compared within each other when performing under different scenarios, as shown in Table
22. They were chosen because of their different pallet outputs; a different pallet type was chosen to be
manufactured 100 percent of the time in each of the three cases, where in Run 1 pallets type 1 were
chosen, in Run 2 pallets type 3 were chosen, and in Run 3 pallets type 4 were chosen. Table 23 shows
the results for a time horizon of 2 years, including total system cost, total system environmental impact,
and type and quantity of pallets manufactured.

Chapter V – Case Study – Results and Analysis
94
Table 22. 3 scenarios from total 64 combinations
Table 23. Minimizing environmental impacts subject to minimum system cost (Time horizon: 2 years)
When using pallet type 1 instead of pallet type 4, a total of $14.29 million is saved, although the system
releases 15.2 metric KTons more of CO2. On the other hand, when the system chooses pallets type 3
instead of pallets type 4, the system saves $2.86 million and decreases its CO2 footprint by 3.8 metric
KTons.
The model was also run under the scenario where costs can increase to 20 percent the minimum cost
(α=20 percent). For each of the three runs, pallets type 3 were chosen, as shown in Table 24.
Table 24. Minimizing environmental impacts when cost can increase to 20 percent the minimum cost (Time horizon: 2 years)
Pallets type 3 have a higher overall cost than pallets type 1 since no credit is obtained from returning
pallets type 3 to the providers, although these pallets last longer than pallets type 1 and have less CO2

Chapter V – Case Study – Results and Analysis
95
footprint from material production than pallets type 4. The total system carbon footprint gets reduced
in each of the scenarios analyzed, as shown in Table 24, and by comparing to the scenarios in Table 23.
For example, in Run 1 by increasing 19.5 percent of the minimum in pallet expenditures ($10.96 million
more), the CO2 footprint from the entire system is reduced by 78 percent (19.2 metric KTons of CO2
emissions).
Table 25 shows the results when the total system cost is minimized subject to the minimum system
environmental cost. The total system CO2 footprint results in 5.4 metric KTons of CO2, which equals
what was obtained when minimizing the total environmental impacts while the minimum cost was
allowed to be increased by 20 percent.
Table 25. Minimizing system cost subject to minimum environmental impacts (Time horizon: 2 years)
Likewise, the optimization model was run to minimize the total system cost while allowing the system to
release 20 percent more than the minimum carbon dioxide, as shown in Table 26.
Table 26. Minimizing system cost when environmental impacts can increase to 20 percent the minimum environmental impact (Time horizon: 2 years)

Chapter V – Case Study – Results and Analysis
96
As concluded earlier, the results are driven by the costs of the pallets. Therefore, the cheapest pallet
will be the predominant in the system. In Run 1, pallets type 3 are manufactured during the first weeks
of the time horizon because of their long lifespan and pallets type 1 are chosen because their low
purchase cost. In Run 2, only pallets type 3 are chosen as preferred because pallets type 1 are too costly
and pallets type 4 have the highest carbon footprint from material production.
5.2.4 HOW MUCH DO PALLET WEIGHT AND THE CO2 FOOTPRINT FROM MATERIAL PRIMARY
PRODUCTION AFFECT THE PALLET MANAGEMENT SYSTEM USED? HOW MUCH DOES
THIS AFFECT THE SYSTEM COSTS AND ITS ENVIRONMENTAL BURDEN?
From the previous analysis it was noted that when minimizing the system environmental impacts subject
to the minimum cost, the output of the model was driven by the costs of the pallets. Moreover, the
pallets manufactured in order to satisfy the pallet demand were usually the less expensive pallets. As a
result, this section studies when minimizing the system cost subject to environmental impacts, thus
giving priority to the system carbon footprint. In addition, similar costs were given to the pallet types, as
shown in Table 27.
Table 27. Costs modified per pallet type for this analysis
The factors considered under this analysis are pallet weight ( ) and the CO2 footprint from
material primary production ( ). An experiment was developed for these two factors, at three
levels only for pallet type 4, with a total of 9 different combinations. The design was run for two

Chapter V – Case Study – Results and Analysis
97
different time horizons: 6 months and 2 years. Figure 22 shows the values for each level given to each of
the pallet types. Refer to Appendix D for details of the 9 combinations.
Source: Cambridge Engineering Selector software tool (CES, 2010)
Figure 22. Levels of factors weight and material CO2 footprint per pallet type included in analysis
Following are the factor levels explained in detail:
- Wooden pallet type 1 is assumed to weigh 45 pounds, an average weight for this type of pallets
made of hardwood oak;
- Pallet type 3 is assumed to be a softwood pine pallet with a weight of 65 pounds per pallet (average
weight for wooden pooled pallets);
- Plastic pallet type 4 is analyzed under different scenarios by giving different material alternatives: (i)
pallet made of recycled plastic and recycled steel for reinforcement bars; (ii) pallet made of only
virgin plastic, and (iii) pallet made of virgin plastic and raw steel. Each of these material alternatives
are also being analyzed with different weights, such as 20, 35, and 47.5 pounds per pallet.
Results when minimizing total costs subject to minimum environmental impacts for a time horizon of 2
years are shown in Table 28. As noted in the results of the model, in all scenarios where pallet type 4
weighs 20 pounds, this pallet type is manufactured in more than 95 percent. When pallet type 4 is made
of all recycled material and weighs 35 pounds per pallet they are still preferred, representing 90 percent
of total new pallets manufactured. The higher the weight and material CO2 footprint of pallet type 4, the

Chapter V – Case Study – Results and Analysis
98
less these pallets are manufactured. Consequently, wooden pallets type 3 are preferred when plastic
pallets weigh 35 pounds per pallet or more and when they are made of raw material or only plastic.
Pallet type 1, even being the less expensive pallet, does not get manufactured in any amount because of
its short lifespan and high weight.
Table 28. Results when minimizing system cost subject to minimum environmental impacts (Time horizon: 2 years)
Different outcomes are obtained in Run 1 relative to Run 7 (as shown in Table 28), where in both cases
plastic pallets are made of all recycled material but have different weights. In Run 1, pallet type 4 weighs
only 20 pounds and is the only type chosen creating 3.7 metric KTons of CO2. However, the pallet
chosen in Run 7 is type 3. Accordingly, in Run 1 the total system environmental impact is almost half the
impact of Run 7. As a result, plastic pallets with low weight (20 lbs/pallet) and made of recycled material
(plastic and steel) are the pallets chosen to perform in a sustainable environment.
In the scenario where the system is minimized for total system cost when the environmental impacts
can increase up to 5 percent (Table 29), pallets type 1 are manufactured in certain percentages under
different scenarios (mainly when plastic pallets have high weight). Similar behavior is noted when the
model runs for a time horizon of 6 months (Appendix D).

Chapter V – Case Study – Results and Analysis
99
Table 29. Results when minimizing system cost allowing environmental impacts to increase by 5 percent (α=5%) (Time horizon: 2 years)
The results of the experiments when the system performs under the lowest environmental impacts
show similarities with studies conducted by The Netherlands Packaging and Pallet Industry Association
for CHEP. Here, the life-cycle assessment (LCA) tool was used to compare the environmental aspects
for wood pallets and plastic pallets (50 percent recycled plastic and 50 percent new HDPE), considering
multiple trips for both. The results of the analysis show that wood pallets are more environmentally
friendly than plastic pallets, specifically because the environmental impact of the material and
manufacture phases for plastic pallets is much higher. As concluded from the study, multi-use wood
pallets utilize considerably less raw material and energy, and contribute far less emissions into water and
air than plastic pallets (CHEP, 2008; Hamner & White, 2007). In addition, the research prepared for this
thesis shows that the CO2 footprint from plastic production is 4.56 times higher than the CO2 footprint
from wood primary production, which ensures that a wooden pallet compared to a plastic pallet with
the same weight will require less energy for material production, and thus create less emissions.
A different LCA was also conducted by the association to evaluate single-use wood pallets (buy/sell)
versus multi-use wood pallets (leased pools), per handling cycle. The results from this study show that
the energy consumption, solid waste, and gas emissions from manufacturing and using multi-use wood
pallets is approximately half that of single-use wood pallets, even though multi-use pallets cost more up
front and use over twice as much wood (CHEP, 2008; Hamner & White, 2007). Furthermore, when the

Chapter V – Case Study – Results and Analysis
100
optimization model proposed in this research performs under the lowest system environmental impact,
the system does not choose single-use wooden pallets (similar to type 1), because of their high failure
fraction and high environmental impact (measured in CO2 emissions). Instead, it chooses pallet type 3, a
pooled wooden pallet (or multi-use pallet) because of its high reuse rate, creating lower emissions (refer
to Figure 20 and Table 28), which correlates to results from the LCA.
Furthermore, Franklin Associates, a leading consultant group specializing in life-cycle inventory analysis
and solid waste management, conducted a LCA for CHEP in 2009. The study covered whitewood
pallets, pooled plastic, and pooled wooden pallets. According to CHEP‟s 2009 study, the CHEP pallet
generates 48 percent less solid waste, consumes 23 percent less total energy, and generates 14 percent
less GHGs than pooled plastic pallets. Compared with limited use white wood pallets, the CHEP system
generates 50 percent less solid waste, consumes 19 percent less total energy, and generates 5 percent
less GHGs (Chaille Brindley, 2010).
5.2.5 DOES DEMAND AFFECT THE PREFERRED PALLET MANAGEMENT SYSTEM?
This section analyzes the system under different pallet demand, in order to determine if the demand
factor may affect the pallet management system chosen. In this case, two pallet demands ( ) are
considered as low and high demand, where the former is 25,250 pallets and the latter is 721,280 pallets
per week at the distribution centers, as shown in Figure 23.
Figure 23. Levels for factor demand

Chapter V – Case Study – Results and Analysis
101
First, results are analyzed for a low demand during a time horizon of 6 months when pallet costs
characteristics are at their nominal values (pallet type 1 purchase cost ( ) at $5/pallet and selling
price ( ) $2/pallet, type 2 leasing cost ( ) at $5/pallet, and type 4 leasing cost (
) $6/pallet
and credit for return ( ) at $0.25/pallet). In the scenario where the system cost is minimized subject
to the minimum environmental impact, pallet type 3 is the pallet type chosen representing 100 percent
of total new pallets manufactured. In the scenario where the system is minimized for total
environmental impacts subject to minimum cost, only pallet type 1 is manufactured (Table 30). Similar
outputs were obtained when considering a high pallet demand (Table 31).
Table 30. Low demand - Costs per pallet type under nominal values
Table 31. High demand - Costs per pallet type under nominal values
In the scenario of low demand (Table 30), by investing $1.11 million more on pallet management
systems, the total system environmental impact can be reduced by 2.9 metric KTons of CO2 emissions.
Likewise, in the scenario of high demand (Table 31), by increasing pallet management systems
investment by $32 million, half of the system environmental impact can be reduced.
When the system considers a slight difference in costs among the pallet types in the study, such as in
purchase/leasing costs and selling prices/credits of return, as shown earlier in Table 27, different outputs
are obtained. In the scenario when minimizing the system cost subject to minimum environmental

Chapter V – Case Study – Results and Analysis
102
impact, pallets of type 3 are the only pallets manufactured. Furthermore, in the scenario where the
system is minimized for total environmental impacts subject to minimum cost, a mix of pallets type 1
and type 3 (approximately 73 percent and 27 percent, respectively) are manufactured (Table 32). These
results are expected since under this cost scenario both pallet types have very similar net cost ($4.75
for pallet type 1, and $5 for pallet type 3; compared to nominal net costs of $3 per type 1, and $5 per
type 3). Similar pallet percentages were obtained when considering high pallet demand (Table 33). In
general it can be concluded that the model outputs are not sensitive to demand
Table 32. Low demand - Costs modified from nominal values per pallet type
Table 33. High demand - Costs modified from nominal values per pallet type
5.2.6 DOES TRANSPORTATION AFFECT THE PREFERRED PALLET MANAGEMENT SYSTEM?
Various distances between distributor‟s facilities, such as distribution centers, retailers, and return
center, are considered to analyze different pallet outcomes. These average distances ( ) are: 30, 300,
and 3,000 miles, as shown in Figure 24. It is expected that the pallet outcome does not get affected by
the miles travelled, since the same distance will apply to each of the pallet types, and further, because
the CO2 footprint per mile from transportation from one pallet to another is slightly similar among the
pallet types (see Appendix A).

Chapter V – Case Study – Results and Analysis
103
Figure 24. Levels for factor distance
Despite the distance between distributors‟ facilities, pallets type 3 are chosen in 100 percent when
minimizing the system cost subject to minimum environmental impacts (for a time horizon of 6 months
and 2 years). Furthermore, Figure 25 illustrates the results of the eco-audit for each distance. Here, for
an average distance of 30 miles, the Material phase represents 84 percent of total system CO2 footprint
(2.78 metric KTons of CO2), whereas, for an average distance of 3,000 miles, Transportation represents
76 percent of total system CO2 footprint (11.07 metric KTons of CO2).
Figure 25. Eco-Audit when minimizing system cost subject to minimum environmental impacts for different distances per cycle (Time horizon: 6 months)
84%
5%3%
8%
66%
4%
24%
6%
21%
1%
76%
2%
0%
10%
20%
30%
40%
50%
60%
70%
80%
90%
100%
MATERIAL MANUFACTURE TRANSPORTATION END-OF-LIFE
CO
2 fo
otp
rin
t p
erc
en
tage
30 miles
300 miles
3,000 miles
Note: Time horizon6 months

Chapter V – Case Study – Results and Analysis
104
Figure 26 shows that purchase/leasing cost represents 76 percent of total system cost ($5.98 million)
under the scenario of 30 miles; compared to the transportation cost which represents 96 percent of
total system cost ($135.17 million) under the scenario of 3,000 miles. Note percentages are shown for a
time horizon of 6 months; similar outputs were obtained considering a time horizon of 2 years.
Figure 26. Cost breakdown when minimizing system cost subject to minimum environmental impacts for different distances per cycle (Time horizon: 6 months)
On the other hand, pallet type 1 is the only type chosen when minimizing the environmental impacts
subject to minimum cost, because they are the less expensive pallet. Thus, when allowing pallet
expenditures to increase by 20 percent the minimum cost while reducing the total system
environmental impact, pallet type 3 is the only type manufactured for a time horizon of 6 months (that
is, assuming a total distance of 3,000 miles). When assuming shorter distances, a mix of pallets type 1
and 3 are manufactured.
As general conclusion, the preferred pallet management system is not sensitive to transportation. In
addition, the higher the distance the higher the impact of the Transportation phase.
76%
20%
4%
27%
71%
1%4%
96%
0%0%
10%
20%
30%
40%
50%
60%
70%
80%
90%
100%
PURCHASE/LEASING TRANSPORTATION SELLING PRICE/CREDIT FOR RETURN
Co
st p
erc
en
tage
s
30 miles
300 miles
3,000 miles
Note: Time horizon 6 months

Chapter V – Case Study – Results and Analysis
105
5.2.7 HOW CAN NEW REGULATIONS ON PALLET END-OF-LIFE SCENARIOS INFLUENCE THE
SYSTEM CARBON FOOTPRINT?
The model is flexible enough to consider possible new regulations regarding pallet end-of-life
alternatives. For example, the state of North Carolina dictated a legislation to ban pallet landfilling in
2009 (Buehlmann et al., 2009). As this, other regulations could help protect the environment.
This section proposes the existence of a regulation which would declare that pallet landfilling would be
banned, regardless the type of pallet, that wooden pallets have to be downcycled at 10 percent and
plastic pallets have to be recycled at 100 percent (Figure 27). These percentages would affect the
parameter in the model.
Figure 27. Levels for factor pallet end-of-life scenarios
When minimizing total system cost subject to minimum environmental impacts, pallets of type 3 are the
only type manufactured. Although, because this pallet type is repaired in higher percentage under the
proposed regulation for a time horizon of 6 months, fewer pallets are needed, reducing the system
environmental impact by 329 metric Tons of CO2 emissions (approximately a 10 percent decrease). In
addition, the cost is reduced by $248 thousands (a 1.4 percent decrease). Under a time horizon of 2
years the total environmental impact is reduced by 447 metric Tons of CO2 (6.5 percent) and by $900
thousands (1.3 percent) of system cost (refer to Table 34).
Table 35 shows the number of pallets disposed to each of the end-of-life alternatives for a time horizon
of 6 months. A higher number of pallets are repaired compared to the current scenario where no
regulation is in place. Refer to Appendix D for results considering a time horizon of 2 years.

Chapter V – Case Study – Results and Analysis
106
Table 34. Results comparison base scenario vs. regulation scenario when minimizing system cost subject to environmental impacts (Time horizon: 6 months and 2 years)
Table 35. End-of-life scenarios base scenario vs. regulation scenario when minimizing system cost subject to environmental impacts (Time horizon: 6 months)

Conclusions and Future Work
107
CCOONNCCLLUUSSIIOONNSS AANNDD FFUUTTUURREE WWOORRKK
This section summarizes the findings and key elements that resulted from the research conducted. In
addition, opportunities for future work and improvements are also discussed.
CONCLUSIONS
In current times companies are continuously making improvements of their operations efficiency and
environmental performance. Efforts for reducing energy and carbon footprint from their supply chain
management, such as shipping and distribution operations, have included minimizing waste, resource
consumption, and overall GHG emissions. However, there is a need for effective and efficient
optimization models which address pallet operations, considering pallet environmental impacts and costs
within an entire supply chain.
This study addressed such a gap by providing a model that studies pallet life cycle stages and their
operations, including raw materials, manufacture, use, and end-of-life scenarios, while embracing the
pallet costs of the system. Such a model determines the mix of pallets (type, quantity, and pallet
management system) for product distribution that balances overall environmental impacts (measured in
carbon dioxide emissions) and costs according to companies‟ needs.
Issues that can drive the choice of a pallet management system are addressed in this study, such as the
carbon dioxide footprint from materials production and pallet manufacturing, the emissions that arise
during product transportation, the impacts associated with the various end-of-life alternatives available

Conclusions and Future Work
108
for different pallet types (such as reuse, recycling, downcycling, repair, landfill, and incineration), and the
costs of purchasing or leasing a pallet, as well as their selling prices or credits for returns.
The model was designed to give flexibility to the tool user to change parameters such as pallet
characteristics (i.e. material, costs, etc.), and network changes, including the number of consumer
product manufacturers, distribution centers, retailers, and return centers considered in the supply chain.
Pallet types (or pallet management systems) addressed in the study include: pallet type 1, a wooden
pallet under buy/sell program; pallet types 2 and 3, pooled wooden pallets; and pallet type 4, a pooled
plastic pallet. In addition, results were driven to cover the different pallet life cycle phases. Areas of
analysis include: pallet materials and weights, pallet purchase/leasing costs, transportation distances,
pallet demand, and pallet end-of-life alternatives.
The tradeoff between environmental impacts and costs was illustrated. For a time horizon of 1 year,
when minimizing the system environmental impacts, the minimum amount of CO2 released is 4,678
metric Tons under the assumptions stated; whereas, when minimizing the system cost the amount of
CO2 released is 14,052 metric Tons. As observed, by allowing the pallet expenditures to increase by
10.6 percent of the minimum (representing in this case a delta of $3.4 million), 9,374 metric Tons of
CO2 could be saved.
For the case study, when the system performs under nominal values and is minimized for the total
environmental impacts while performing under the lowest cost, it was shown for short time horizons
(up to 8 months) that pallet type 1 is the pallet preferred to satisfy the demand. For longer time
horizons (up to 5 years) a mix of pallets type 1 and type 3 are manufactured.
When the system performs under a different scenario where costs can increase to 25 percent the
minimum cost, the only pallet manufactured is type 3. In this case the system chooses a pallet
management system that may cost more but whose pallets last longer.

Conclusions and Future Work
109
Pallet weight and pallet purchase/leasing costs parameters were analyzed through an experiment. Results
show that when minimizing the total system environmental impact subject to minimum cost, pallet
weight under the factor levels studied does not affect the output of the model. In addition, the pallet
that optimizes the system is the pallet type with the lowest purchase/leasing cost, whether it is pallet
type 1, type 3 or type 4. On the other hand, when minimizing the system cost subject to minimum
environmental costs, pallet type 3 is the pallet chosen as preferred.
Factors such as pallet weight and the CO2 footprint from material primary production were analyzed
when minimizing the system cost subject to the minimum environmental impacts. Pallets type 4 are the
only pallet type manufactured when their weigh is 20 pounds per pallet and are made of all recycled
material (recycled plastic and recycled steel for reinforcement bars). The higher the weight and the CO2
footprint from material production for pallet type 4, the less these pallets are manufactured in the
system. Consequently, pallets type 3 are preferred when pallets type 4 weigh 35 pounds per pallet or
more, and when they are made of raw materials (plastic and steel) or only raw plastic.
Furthermore, the system was analyzed under different pallet demands and transportation distances.
From the experiments it was noted that the outcome was not directly affected by either of these
factors. As a result, it was concluded that neither pallet demand nor transportation distances affect the
choice of pallet management.
The model allows considering possible new regulations regarding pallets end-of-life alternatives.
Consequently, different experiments were modeled considering if new regulations were to require that
pallets cannot be sent in any amount to a landfill, while wooden pallets are downcycled at 10 percent
and plastic pallets are recycled at 100 percent. Results show pallet type 3 to be the only pallet
manufactured when minimizing the total system cost while minimizing environmental impacts. In
addition, the total carbon footprint could be reduced by 10 percent.

Conclusions and Future Work
110
As a result of these analyses, it can be concluded that this work provides a decision making tool for
companies seeking to engage in more sustainable practices in their supply chains and distribution. It
could help pallet users reach their goals of CO2 footprint reduction while using an environmental and
cost effective pallet management system. Moreover, pallet providers may be motivated to improve their
pallet design and provide an efficient logistic that will address sustainable concerns to stay competitive in
the market.
In addition, this study was an effort to build better understanding of pallet materials that have been
under controversy and debate, providing deeper understanding in the importance of pallet operations
per se. This research provides the tool to determine where efforts have to be focused and where users
can make better decisions to ensure and preserve the environment.
FUTURE WORK
There are different areas that could be improved in the future and which could contribute to a larger
research scope in understanding more complex systems to decrease the system environmental impact
and its costs. Potential opportunities for improvements are discussed below.
The study evaluates the environmental impacts of pallet manufacturing, use, and disposal with respect to
all aspects of sustainability, emphasizing the carbon footprint (in particular CO2) of the operations.
Future work could include impacts to human health, biodiversity, and eco-system depletion, which may
reveal interesting aspects of the model. In addition, pallet toxicity due to flame retardants (in plastic
pallets) and fumigation chemicals (for wooden pallets) could be modeled as a pallet characteristic.
Results were shown for the case study of a local grocery distributor/retailer. Transportation was not
taken into account between consumer product manufacturers and pallet distributor. Moreover, future
Conclusions and Future Work
111
work could target studying more complex systems with specific and detailed information on facilities‟
locations, also including different cost scenarios.
This thesis focused on studying the use of wooden and plastic pallets in the grocery industry. Metal
pallets or other type of pallets, made of different materials and/or with different structures, could be
addressed to see pallet choices preferences and system environmental impacts.
Further, policy making decisions could be addressed, such as regulations applied to pallets end-of-life
alternatives and carbon tax credits.

References
112
RREEFFEERREENNCCEESS
1. Araman, P. A., Bush, R. J., Hammet, A. L., & Brad Hager, E. (1998). Wood pallet and landfills – status
and opportunities for economic recovery and recycling. Proceedings from WASTECON/ISWA
World Congress 1998. Swana's 36th Annual International Solid Waste Exposition. Charlotte,
North Carolina.
2. Ashby, M. F. (2009). Materials and the Environment - Eco-Informed Material Choice (pp. 15-159).
Elsevier. Oxford, UK.
3. ATA Freight Line. Phitosanitary compliance for pallets. Retrieved 03/04, 2011, from
http://www.atafreight.com/EN/palet.aspx
4. Bejune, J., Bush, R., Araman, P., Hansen, B., & Cumbo, D. (2002a). Recycling behind most growth in
pallet production. September ed., Pallet Enterprise.
5. Bejune, J., Bush, R., Araman, P., Hansen, B., & Cumbo, D. (2002b). Pallet industry relying more on
recovered wood material. October ed., Pallet Enterprise.
6. Brindley, C. (2009). How safe is deca bromine? FDA Statement Raises Toxicity Concerns for Some
Plastic Pallets. Pallet Enterprise.
7. Brindley, C. (2010). Life cycle analysis underscores environmental challenges of plastic pallets. Pallet
Enterprise.
8. Brito, M., & Dekker, R. (2002). Reverse logistics - a framework. European Journal of Operational
Research, Econometric Institute Report EI 2002-38.
9. BTS (2009). National Transportation Statistics 2009. (U.S. Department of Transportation, Bureau of
Transportation Statistics, Washington, DC).
10. Buehlmann, U., Bumgardner, M., & Fluharty, T. (2009). Ban on landfilling of wooden pallets in North
Carolina: an assessment of recycling and industry capacity. Journal of Cleaner Production,
17(2), 271-275.
11. Bush, R. J., & Araman, P. A. (2008). Updated pallet and container industry production and recycling
research. Pallet Enterprise.
12. Bush, R. J., & Araman, P. A. (2009). Material use and production changes in the U.S. wood pallet and
container industry: 1992 to 2006. June ed., Pallet Enterprise, 38-43.
13. Bush, R. J., Corr, D. T., & Araman, P. A. (2001). Fewer pallets reaching landfills, more are processed
for recovery. Pallet Enterprise, 18-21.

References
113
14. Bush, R. J., Reddy, V. S., & Araman, P. A. (1996). Pallets: a growing source of recycled wood. Paper
presented at the Use of Recycled Wood and Paper in Building Applications Conference.
Madison, WI.
15. Bérubé, J.-F., Gendreau, M., & Potvin, J.-Y. (2009). An exact [epsilon]-constraint method for bi-
objective combinatorial optimization problems: Application to the Traveling Salesman
Problem with Profits. European Journal of Operational Research, 194(1), 39-50.
16. CES (2010). Cambridge Engineering Selector. CES Level 3 Eco-selector materials database, Version
5.1.0.
17. Chaille (2007). Quantifying a sustainable future: pallet researcher answers tough questions on
sustainability. Pallet Enterprise.
18. CHEP (Commonwealth Handling Equipment Pooling)(2008). Building a sustainable supply chain. 231
ed.
19. Cheremisinoff, N. P. (1999). Handbook of industrial toxicology and hazardous materials. CRC Press.
New York, NY.
20. Chertow, M. R. (2001). The IPAT equation and its variants. Journal of Industrial Ecology, 4(4).
21. Comer, B., Corbett, J. J., Hawker, J. S., Korfmacher, K., Lee, E. E., Prokop, C., et al. (2010). Marine
vessels as substitutes for heavy-duty trucks in Great Lakes freight transportation. Journal of
the Air & Waste Management Association, 60, 7.
22. Corbiere-Nicollier, T., Gfeller-Laban, B., Lundquist, L., Leterrier, Y., Manson, J. A. E., & Jolliet, O.
(2001). Life cycle assessment of biofibres replacing glass fibres as reinforcement in plastics.
Resources Conservation and Recycling, 33(4), 267-287. Retrieved Nov, from Article database.
23. Council for Solid Waste Solutions (1990). Resource and environmental profile analysis of
polyethylene and unbleached paper grocery sacks. Vol. June.
24. Dana, H. (2010). Pallet Management. Retrieved 08/10, 2010, from
http://www.buzzle.com/articles/pallet-management.html
25. Dictionary of Sustainable Management (2009). In The Dictionary of Sustainable Management.
26. Diwekar, U. M., & Shastri, Y. N. (2010). Green process design, green energy, and sustainability: A
systems analysis perspective. Computers & Chemical Engineering, 34(9), 1348-1355.
27. EPA (2006). U.S. Greenhouse Gas Inventory Report. Annex 2, Washington D.C.: U.S Environmental
Protection Agency (EPA).
28. EPA (2010). The phaseout of methyl bromide. (U.S. Environmental Protection Agency (EPA)).
29. EPAa (2011). Life-Cycle Assessment (LCA). U.S. Environmental Protection Agency (EPA). Retrieved
2009, 08/02, from http://www.epa.gov/nrmrl/lcaccess/

References
114
30. EPAb (2011). Wastes - Resource Conservation - Reduce, Reuse, Recycle. U.S. Environmental Protection
Agency (EPA). Retrieved 07/11, 2009, from
http://www.epa.gov/epawaste/conserve/rrr/reduce.htm
31. Ferguson, T. S. (1995). Linear Programming - A Concise Introduction.
32. FHA. (2010). Freight facts and figures. Washington, D.C. (U.S. Department of Transportation, Federal
Highway Administration).
33. Franklin Associates (1991). Life Cycle Projects.
34. Gasol, C. M., Farreny, R., Gabarrell, X., & Rieradevall, J. (2008). Life cycle assessment comparison
among different reuse intensities for industrial wooden containers. International Journal of Life
Cycle Assessment, 13(5), 421-431. Retrieved Aug, from Article database.
35. Georgiadis, P., & Besiou, M. (2008). Sustainability in electrical and electronic equipment closed-loop
supply chains: A system dynamics approach. Journal of Cleaner Production, 16(15), 1665-1678.
36. G&M Pallet Company, Inc. Pallet designs. Retrieved 11/02, 2009, from http://www.gmpallet.com
37. Graedel, T. E., & Allenby, B. R. (2003). Industrial Ecology. (Pearson Eduaction).
38. Grande, J. A. (2008). Plastic pallets gain ground in an eco-conscious world. Plastics Technology.
39. Hamner, P., & White, M. (2007). Virginia Tech: Convergence of two shades of green - Environmental
impacts from the manufacture, use, and disposal of pallets. Pallet Enterprise.
40. Hart, S. L. (2007). Capitalism at the crossroads: aligning business, earth and humanity; new foreword
by Al Gore (Second edition). Upper Saddle River, N.J. : Wharton School Publishing, 2007.
41. Hunt, R., Franklin, W., & Hunt, R. (1996). LCA - How it came about. The International Journal of Life
Cycle Assessment, 1(1), 4-7.
42. Hunt, R. G. (1974). Resource and environmental profile analysis of nine beverage container
alternatives. Washington, D.C. (Midwest Research Institute for U.S. Environmental
Protection Agency (EPA)).
43. Hunt, R. G., Sellers, J. D., & Franklin, W. E. (1992). Resource and environmental profile analysis: A
life cycle environmental assessment for products and procedures. Environmental Impact
Assessment Review, 12(3), 245-269.
44. Iannoni, A. P., & Morabito, R. (2006). A discrete simulation analysis of a logistics supply system.
Transportation Research Part E: Logistics and Transportation Review, 42(3), 191-210.
45. IFCO (2009). Factors impacting the environmental sustainability of pallet programs. (IFCO Systems).
46. iGPS. (2008). Streamlined life cycle assessment of the iGPS Pallet, the typical pooled wooden pallet,
and the single-use wooden pallets. (Intelligent Global Pooling Systems (iGPS)).
47. IPPC. International Plant Protection Convention. Retrieved 07/04, 2009, from
https://www.ippc.int/IPP/En/default.jsp

References
115
48. International Organization for Standarization (ISO). ISO 14040. Retrieved 06/24, 2010, from
http://www.iso.org/iso/catalogue_detail.htm?csnumber=37456
49. IUCN-UNEP-WWF. (1980). World Conservation Strategy. In Living Resource Conservation for
Sustainable Development. (International Union for Conservation of Nature and Natural
Resources).
50. J&J (2010). Johnson & Johnson 2009 Sustainability Report (pp. 40). Retrieved 03/08, 2011, from
http://www.investor.jnj.com/2009sustainabilityreport/environment/climate.html
51. Kamath, N. B., & Roy, R. (2007). Capacity augmentation of a supply chain for a short lifecycle
product: A system dynamics framework. European Journal of Operational Research, 179(2),
334-351.
52. Kara, S., Rugrungruang, F., & Kaebernick, H. (2007). Simulation modelling of reverse logistics
networks. International Journal of Production Economics, 106(1), 61-69.
53. Kumar, S., & Putnam, V. (2008). Cradle to cradle: Reverse logistics strategies and opportunities
across three industry sectors. International Journal of Production Economics, 115(2), 305-315.
54. Lacefield, S. K. (2008). How green are your pallets? DC Velocity.
55. Linton, J. D., Klassen, R., & Jayaraman, V. (2007). Sustainable supply chains: An introduction. Journal
of Operations Management, 25(6), 1075-1082.
56. Ma, W. (2010). A multi-objective optimization model at signalized junctions. In European Transport
Conference 2010.
57. Mahnam, M., Yadollahpour, M. R., Famil-Dardashti, V., & Hejazi, S. R. (2009). Supply chain modeling
in uncertain environment with bi-objective approach. Computers & Industrial Engineering,
56(4), 1535-1544.
58. Marler, R. T., & Arora, J. S. (2004). Survey of multi-objective optimization methods for engineering.
Vol. Struct Multidisc Optim 26, 369–395.
59. Martínez, P., & Eliceche, A. M. (2009). Multi objective optimization using life cycle environmental
impact and cost in the operation of utility plants. In C. A. O. d. N. a. E. C. B. Rita Maria de
Brito Alves, Jr. (Ed.), Computer Aided Chemical Engineering (Vol. Volume 27, pp. 1869-1874):
Elsevier.
60. MBAO (2010). The U.S. EPA Methyl Bromide phase out website. Retrieved 12/05, 2010, from
http://mbao.org
61. McKeever, D. B. (1999). Changes in the U.S. solid waste wood resource, 1990 to 1998.
62. McKeever, D. B., McCurdy, D. R., Kung, F. H., & Ewers, J. T. (1982). Wood used in pallets
manufactured in the United States, 1982. (U.S. Department of Agriculture and Forest
Products Laboratory).

References
116
63. Meadows, D. H., Meadows, D. L., Randers, J., & Behrens III, W. W. (1972). The limits to growth.
Universe Books, New York.
64. MHEDA. wiki MHEDA. Material Handling Equipment Distributors Association (MHEDA). Retrieved
07/03, 2009, from http://www.wikimheda.org/wiki/index.php/Main_Page
65. Neto, J. Q. F., Walther, G., Bloemhof, J., van Nunen, J., & Spengler, T. (2009). A methodology for
assessing eco-efficiency in logistics networks. European Journal of Operational Research,
193(3), 670-682. Retrieved Mar, from Article database.
66. NWPCA (National Wooden Pallet & Container Association) (1999). Pallet Talk. Alexandria, VA.
67. NWPCA (National Wooden Pallet & Container Association). (2000). Pallet Talk. April ed.
Alexandria, VA.
68. NWPCA (National Wooden Pallet & Container Association) (2008). Harnessing Our Power.
Retrieved 07/03, 2009, from http://www.nwpca.com/AnnualReport/index.html
69. NWPCA (National Wooden Pallet & Container Association) (2009). Retrieved, 03/22, 2009, from
http://www.nwpca.com/_INTLRegulations/PlasticPalletsFireHazardNews.pdf.
70. PCRS (2000). An economic analysis of the plastic pallet business - A PCRS Plastics Industry Report: Plastic
Custom Research Services.
71. PCRS (2003). The opportunities for plastics in material handling - A PCRS Plastics Industry Report: Plastic
Custom Research Services.
72. Pearson S., S. (2009). The rise of the plastic pallet. Vol. September 2009. Modern Materials Handling
Report.
73. PlasticPallet.com. Retrieved 07/04, 2009, from http://plasticpallet.com/.
74. P&G (2010). Procter & Gamble 2010 Sustainability Overview (pp. 32). Retrieved 03/10, 2011, from
http://www.pg.com/en_US/downloads/sustainability/reports/PG_2010_Sustainability_Overvi
ew.pdf
75. Qin, Z., & Ji, X. (2009). Logistics network design for product recovery in fuzzy environment.
European Journal of Operational Research, In Press, Corrected Proof.
76. Raballan, G., & Aldaz-Carroll, E. (2005). How do different standards increase trade costs? The case
of pallets. (World Bank Policy Research Working Paper # 3519).
77. RCPA. Reusable Container and Pallet Association Glossary. Material Handling Industry of America
(MHIA). Retrieved 06/23, 2009, from http://www.mhia.org/industrygroups/rpcpa/glossary
78. Rose, C. M., Ishii, K., & Stevels, A. (2002). Influencing design to improve product end-of-life stage.
Research in Engineering Design-Theory Applications and Concurrent Engineering, 13(2), 83-93.
Retrieved Mar, from Article database.

References
117
79. Sabri, E. H., & Beamon, B. M. (2000). A multi-objective approach to simultaneous strategic and
operational planning in supply chain design. Omega, 28(5), 581-598.
80. Saouter, E., & Hoof, G. (2002). A database for the life-cycle assessment of Procter & Gamble laundry
detergents. The International Journal of Life Cycle Assessment, 7(2), 103-114.
81. SETAC (1991). Life Cycle Assessment. Society for Environmental Toxicology and Chemistry (SETAC).
Retrieved 08/02, 2009, from http://www.setac.org/node/32
82. Sheehan, J., Camobreco, V., Duffield, J., Graboski, M., & Shapouri, H. (1998). Life cycle inventory of
biodiesel and petroleum diesel for use in an urban bus. pp. 314)(National Renewable Energy
Laboratory (U.S. Department of Energy) operated by Midwest Research Institute).
83. Sheu, J. B., Chou, Y. H., & Hu, C. C. (2005). An integrated logistics operational model for green-
supply chain management. Transportation Research Part E-Logistics and Transportation Review,
41(4), 287-313. Retrieved Jul, from Article database.
84. Singh, S. P., & Walker, R. (1995). Life cycle analysis of nestable plastic and wood pallets. Journal of
Plastic Film & Sheeting, 11(4), 312-325. Retrieved Oct, from Article database.
85. Stilwell, J., Canty, R., Kopf, P., & Montrone, A. ( 1991). Packaging for the Environment. ( New Work:
American Management Association).
86. TIMCON (2008). Timber remains the natural packaging solution. Pallet and Case Industry, 13.
87. Walmart (2010). Walmart Global Sustainability Report 2010 (pp. 10). Retrieved 07/03, 2010, from
http://walmartstores.com/sites/sustainabilityreport/2010/
88. Wang, F., Lai, X., & Shi, N. (2010). A multi-objective optimization for green supply chain network
design. Decision Support Systems, In Press, Corrected Proof.
89. Wang, J., Wu, L., Mao, H., & Li, X. (2008). Study on the multi-objective optimization model of logistics
facility layout. Chengdu, China.
90. Wang, K., Chen, X. J., Zhang, Y., & Ieee. (2008). Fuzzy multi-object model and solution to design logistics
facility network for 3PLS. Paper presented at the IEEE International Conference on
Automation and Logistics, Qingdao, PEOPLES R CHINA.
91. WCS. Glossary of Statistical Terms. World Conservation Strategy. Retrieved 07/04, 2009, from
http://stats.oecd.org/glossary/detail.asp?ID=2941
92. White, M. S. (2004). Overview of the U.S. pallet industry. Virginia Polytechnic Institute & State
University.
93. White, M. S., & Hamner, P. (2005). Pallets move the world - The case for developing system-beased
designs for unit loads. Forest Products Journal, 55(3), 8-16.
94. World Commission on Environment and Development (1987). Our Common Future: Oxford
University Press: Oxford.

References
118
95. World Resources Institute (1994). The Procter & Gamble Company: disposable and reusable diapers - A
life-cycle analysis, [1-56973-167-5].
96. Xanthopoulos, A., & Iakovou, E. (2007). On the optimal design of the disassembly and recovery processes.
Paper presented at the 1st International Conference on Environmental Management,
Engineering, Planning and Economics (CEMEPE), Jun 24-28. Skiathos Isl, GREECE.
97. Zhang, Y., Xie, L. J., Hang, W., Cui, X. Y., & Ieee. (2007). A robust model for 3PLS to design a
remanufacturing logistics network under the uncertain environment. Paper presented at the IEEE
International Conference on Automation and Logistics, Aug 18-21. Jinan, PEOPLES R
CHINA.
98. Zhou, Z., Cheng, S., & Hua, B. (2000). Supply chain optimization of continuous process industries
with sustainability considerations. Computers & Chemical Engineering, 24(2-7), 1151-1158.

Appendices
119
AAPPPPEENNDDIICCEESS

Appendices
120
A. VALIDATION AND CASE STUDY INPUT DATA
Table 36. Carbon dioxide footprint from material primary production per pallet type
Table 37. Carbon dioxide footprint from pallet manufacture per pallet type

Appendices
121
Table 38. Carbon dioxide footprint from transportation per pallet type

Appendices
122
Table 39. Carbon dioxide footprint from end-of-life life-cycle stage per pallet type

Appendices
123
B. DETAILED MULTI-OBJECTIVE OPTIMIZATION MODEL IN AMPL, TIME HORIZON: 6 MONTHS
Model File
### SETS ###
set P := 1..4; # set of type of pallets
set N := 1..2; # set of materials (m1, m2)
set D := 1..6; # disposal scenario (reuse, repair, recycle, downcycling, landfill, incineration)
set T := 0..26; # time periods (weeks)
set G;
set RM;
set MP;
set CPM;
set DC;
set RET := 1..75;
set RC;
set DEOL;
set LEOL;
set IEOL;
set Nodes:= G union RM union MP union CPM union DC union RET union RC union DEOL union LEOL union
IEOL;
set DC_RET_Arcs within (DC cross RET);
set Arcs:= (G cross RM) union (RM cross MP) union (MP cross CPM) union (CPM cross DC) union
DC_RET_Arcs union (RET cross RC) union (DC cross CPM) union (DC cross MP) union (DC cross RM) union
(DC cross DEOL) union (DC cross LEOL) union (DC cross IEOL) union (RC cross CPM) union (RC cross MP)
union (RC cross RM) union (RC cross DEOL) union (RC cross LEOL) union (RC cross IEOL);
set ArcsDiffTime := (CPM cross DC) union DC_RET_Arcs union (DC cross CPM) union (RC cross CPM) union
(DC cross MP) union (DC cross RM) union (DC cross DEOL) union (DC cross LEOL) union (DC cross IEOL)
union (RC cross MP) union (RC cross RM) union (RC cross DEOL) union (RC cross LEOL) union (RC cross
IEOL);
set ArcsSameTime := Arcs diff ArcsDiffTime;

Appendices
124
### PARAMETERS ###
param W {p in P, n in N, (i,j) in Arcs}:= (if (p==1) then (if (n=1 and (i,j) in Arcs) then 42 else 3)
else if (p==2) then (if (n=1 and (i,j) in Arcs) then 62 else 3)
else if (p==3) then (if (n=1 and (i,j) in Arcs) then 59 else 3)
else (if (n=1 and (i,j) in Arcs) then 38.36 else 9.14)
); #weight per pallet type p in lbs
# ENVIRONMENTAL PARAMETERS
param M {p in P, n in N, (i,j) in Arcs}:= (if (p==1) then (if (n=1) then (if ((i,j) in Arcs and i=='G' and j=='RM') then
0.4495
else 0)
else (if ((i,j) in Arcs and i=='G' and j=='RM') then 4.58
else 0))
else if (p==2) then (if (n=1) then (if ((i,j) in Arcs and i=='G' and j=='RM') then 0.4495
else 0)
else (if ((i,j) in Arcs and i=='G' and j=='RM') then 4.58
else 0))
else if (p==3) then (if (n=1) then (if ((i,j) in Arcs and i=='G' and j=='RM') then 0.4495
else 0)
else (if ((i,j) in Arcs and i=='G' and j=='RM') then 4.58
else 0))
else (if (n=1) then (if ((i,j) in Arcs and i=='G' and j=='RM') then 2.05
else 0)
else (if ((i,j) in Arcs and i=='G' and j=='RM') then 2.485
else 0))
); #material env imp per lb
param Mfg {p in P, n in N, (i,j) in Arcs}:= (if (p==1) then (if (n=1) then (if ((i,j) in Arcs and i=='RM' and j=='MP')
then 0.04
else 0)
else (if ((i,j) in Arcs and i=='RM' and j=='MP') then 0.0669
else 0))

Appendices
125
else if (p==2) then (if (n=1) then (if ((i,j) in Arcs and i=='RM' and j=='MP') then 0.04
else 0)
else (if ((i,j) in Arcs and i=='RM' and j=='MP') then 0.0669
else 0))
else if (p==3) then (if (n=1) then (if ((i,j) in Arcs and i=='RM' and j=='MP') then 0.04
else 0)
else (if ((i,j) in Arcs and i=='RM' and j=='MP') then 0.0669
else 0))
else (if (n=1) then (if ((i,j) in Arcs and i=='RM' and j=='MP') then 0.5165
else 0)
else (if ((i,j) in Arcs and i=='RM' and j=='MP') then 0.2645
else 0))
); #manufacturing env imp per lb
param EOL {p in P, n in N, (i,j) in Arcs}:= (if (p==1) then (if (n==1) then (if ((i,j) in Arcs and i in DC and j=='MP')
then 0.04495
else if ((i,j) in Arcs and i in DC and j=='DEOL') then 0.18
else if ((i,j) in Arcs and i in DC and j=='LEOL') then 0.4495
else if ((i,j) in Arcs and i in DC and j=='IEOL') then 1.735
else if ((i,j) in Arcs and i=='RC' and j=='MP') then 0.04495
else if ((i,j) in Arcs and i=='RC' and j=='DEOL') then 0.18
else if ((i,j) in Arcs and i=='RC' and j=='LEOL') then 0.4495
else if ((i,j) in Arcs and i=='RC' and j=='IEOL') then 1.735
else 0)
else (if ((i,j) in Arcs and i in DC and j=='MP') then 0.8235
else if ((i,j) in Arcs and i in DC and j=='DEOL') then 0.8235
else if ((i,j) in Arcs and i in DC and j=='LEOL') then 4.58
else if ((i,j) in Arcs and i in DC and j=='IEOL') then 4.58
else if ((i,j) in Arcs and i=='RC' and j=='MP') then 0.8235
else if ((i,j) in Arcs and i=='RC' and j=='DEOL') then 0.8235
else if ((i,j) in Arcs and i=='RC' and j=='LEOL') then 4.58
else if ((i,j) in Arcs and i=='RC' and j=='IEOL') then 4.58
else 0))
else if (p==2) then (if (n==1) then (if ((i,j) in Arcs and i in DC and j=='MP') then 0.04495
else if ((i,j) in Arcs and i in DC and j=='DEOL') then 0.18

Appendices
126
else if ((i,j) in Arcs and i in DC and j=='LEOL') then 0.4495
else if ((i,j) in Arcs and i in DC and j=='IEOL') then 1.735
else if ((i,j) in Arcs and i=='RC' and j=='MP') then 0.04495
else if ((i,j) in Arcs and i=='RC' and j=='DEOL') then 0.18
else if ((i,j) in Arcs and i=='RC' and j=='LEOL') then 0.4495
else if ((i,j) in Arcs and i=='RC' and j=='IEOL') then 1.735
else 0)
else (if ((i,j) in Arcs and i in DC and j=='MP') then 0.8235
else if ((i,j) in Arcs and i in DC and j=='DEOL') then 0.8235
else if ((i,j) in Arcs and i in DC and j=='LEOL') then 4.58
else if ((i,j) in Arcs and i in DC and j=='IEOL') then 4.58
else if ((i,j) in Arcs and i=='RC' and j=='MP') then 0.8235
else if ((i,j) in Arcs and i=='RC' and j=='DEOL') then 0.8235
else if ((i,j) in Arcs and i=='RC' and j=='LEOL') then 4.58
else if ((i,j) in Arcs and i=='RC' and j=='IEOL') then 4.58
else 0))
else if (p==3) then (if (n==1) then (if ((i,j) in Arcs and i in DC and j=='MP') then 0.04495
else if ((i,j) in Arcs and i in DC and j=='DEOL') then 0.18
else if ((i,j) in Arcs and i in DC and j=='LEOL') then 0.4495
else if ((i,j) in Arcs and i in DC and j=='IEOL') then 1.735
else if ((i,j) in Arcs and i=='RC' and j=='MP') then 0.04495
else if ((i,j) in Arcs and i=='RC' and j=='DEOL') then 0.18
else if ((i,j) in Arcs and i=='RC' and j=='LEOL') then 0.4495
else if ((i,j) in Arcs and i=='RC' and j=='IEOL') then 1.735
else 0)
else (if ((i,j) in Arcs and i in DC and j=='MP') then 0.8235
else if ((i,j) in Arcs and i in DC and j=='DEOL') then 0.8235
else if ((i,j) in Arcs and i in DC and j=='LEOL') then 4.58
else if ((i,j) in Arcs and i in DC and j=='IEOL') then 4.58
else if ((i,j) in Arcs and i=='RC' and j=='MP') then 0.8235
else if ((i,j) in Arcs and i=='RC' and j=='DEOL') then 0.8235
else if ((i,j) in Arcs and i=='RC' and j=='LEOL') then 4.58
else if ((i,j) in Arcs and i=='RC' and j=='IEOL') then 4.58
else 0))
else (if (n==1) then (if ((i,j) in Arcs and i in DC and j=='RM') then 0.5

Appendices
127
else if ((i,j) in Arcs and i in DC and j=='LEOL') then 2.05
else if ((i,j) in Arcs and i in DC and j=='IEOL') then 3.14
else if ((i,j) in Arcs and i=='RC' and j=='RM') then 0.5
else if ((i,j) in Arcs and i=='RC' and j=='LEOL') then 2.05
else if ((i,j) in Arcs and i=='RC' and j=='IEOL') then 3.14
else 0)
else (if ((i,j) in Arcs and i in DC and j=='RM') then 0.695
else if ((i,j) in Arcs and i in DC and j=='LEOL') then 2.485
else if ((i,j) in Arcs and i in DC and j=='IEOL') then 2.485
else if ((i,j) in Arcs and i=='RC' and j=='RM') then 0.695
else if ((i,j) in Arcs and i=='RC' and j=='LEOL') then 2.485
else if ((i,j) in Arcs and i=='RC' and j=='IEOL') then 2.485
else 0))
); #env imp per endoflife per pallet type p
# COST PARAMETERS
param CO {p in P, (i,j) in Arcs}:= (if (p==1) then (if ((i,j) in Arcs and i=='MP' and j in CPM) then 5
else if ((i,j) in Arcs and i in DC and j in CPM) then 5
else if ((i,j) in Arcs and i=='RC' and j in CPM) then 5
else 0)
else if (p==2) then (if ((i,j) in Arcs and i=='MP' and j in CPM) then 5.8
else if ((i,j) in Arcs and i in DC and j in CPM) then 5.8
else if ((i,j) in Arcs and i=='RC' and j in CPM) then 5.8
else 0)
else if (p==3) then (if ((i,j) in Arcs and i=='MP' and j in CPM) then 5
else if ((i,j) in Arcs and i in DC and j in CPM) then 5
else if ((i,j) in Arcs and i=='RC' and j in CPM) then 5
else 0)
else (if ((i,j) in Arcs and i=='MP' and j in CPM) then 6
else if ((i,j) in Arcs and i in DC and j in CPM) then 6
else if ((i,j) in Arcs and i=='RC' and j in CPM) then 6
else 0)
); #purchasing/leasing cost for pallet type p

Appendices
128
param S {p in P, (i,j) in Arcs}:= (if (p==1) then (if ((i,j) in Arcs and i in DC and j in CPM) then 2
else if ((i,j) in Arcs and i in DC and j=='MP') then 2
else if ((i,j) in Arcs and i in DC and j=='DEOL') then 2
else if ((i,j) in Arcs and i in DC and j=='LEOL') then 2
else if ((i,j) in Arcs and i in DC and j=='IEOL') then 2
else if ((i,j) in Arcs and i=='RC' and j in CPM) then 2
else if ((i,j) in Arcs and i=='RC' and j=='MP') then 2
else if ((i,j) in Arcs and i=='RC' and j=='DEOL') then 2
else if ((i,j) in Arcs and i=='RC' and j=='LEOL') then 2
else if ((i,j) in Arcs and i=='RC' and j=='IEOL') then 2
else 0)
else if (p==4) then (if ((i,j) in Arcs and i in DC and j in CPM) then 0.25
else if ((i,j) in Arcs and i in DC and j=='RM') then 0.25
else if ((i,j) in Arcs and i in DC and j=='LEOL') then 0.25
else if ((i,j) in Arcs and i in DC and j=='IEOL') then 0.25
else if ((i,j) in Arcs and i=='RC' and j in CPM) then 0.25
else if ((i,j) in Arcs and i=='RC' and j=='RM') then 0.25
else if ((i,j) in Arcs and i=='RC' and j=='LEOL') then 0.25
else if ((i,j) in Arcs and i=='RC' and j=='IEOL') then 0.25
else 0)
else 0); #credit for selling pallets or returning empty leased pallets ($/pallet)
param CT {p in P, (i,j) in Arcs}:= (if (p==1) then (if ((i,j) in Arcs and i in DC and j in RET) then 0.1104
else if ((i,j) in Arcs and i in RET and j=='RC') then 0.0055
else 0)
else if (p==2) then (if ((i,j) in Arcs and i in DC and j in RET) then 0.1104
else if ((i,j) in Arcs and i in RET and j=='RC') then 0.0055
else if ((i,j) in Arcs and i in DC and j in CPM) then 0.07
else if ((i,j) in Arcs and i in DC and j=='MP') then 0.07
else if ((i,j) in Arcs and i in DC and j=='DEOL') then 0.07
else if ((i,j) in Arcs and i in DC and j=='LEOL') then 0.07
else if ((i,j) in Arcs and i in DC and j=='IEOL') then 0.07
else if ((i,j) in Arcs and i=='RC' and j in CPM) then 0.07
else if ((i,j) in Arcs and i=='RC' and j=='MP') then 0.07

Appendices
129
else if ((i,j) in Arcs and i=='RC' and j=='DEOL') then 0.07
else if ((i,j) in Arcs and i=='RC' and j=='LEOL') then 0.07
else if ((i,j) in Arcs and i=='RC' and j=='IEOL') then 0.07
else 0)
else if (p==3) then (if ((i,j) in Arcs and i in DC and j in RET) then 0.1104
else if ((i,j) in Arcs and i in RET and j=='RC') then 0.0055
else 0)
else (if ((i,j) in Arcs and i in DC and j in RET) then 0.1104
else if ((i,j) in Arcs and i in RET and j=='RC') then 0.0055
else 0)
); #cost of transportation ($/mile)
#OTHER PARAMETERS
param Q {p in P, i in DC} >= 0; #pre-position inventory at nodes
param ET {p in P} ; #env imp of transportation
param fdc {p in P}; # FAILURE percent from DC per pallet type
param frc {p in P}; # FAILURE percent from RC per pallet type
param R {p in P, d in D} default 0; #pallet end of life fraction
param L {Arcs} default 0; #distance in miles from i to j
param Dc {DC,T}; #pallet demand per DC at time t
param Db {DC,RET,T}; #total pallet demand in retailers
param Z;
param h; #rate of cost increase
param e {p in P, n in N, (i,j) in Arcs}:= M[p,n,i,j]*W[p,n,i,j] + Mfg[p,n,i,j]*W[p,n,i,j] + ET[p]*W[p,n,i,j]*L[i,j] +
EOL[p,n,i,j]*W[p,n,i,j]; #carbon footprint
param C {p in P, (i,j) in Arcs}:= CO[p,i,j] + CT[p,i,j]*L[i,j] - S[p,i,j]; #cost ($)
check {p in P}: sum {d in D} R[p,d] = 1; #checking that all EOLs together for each pallet type add up to 1
### VARIABLES ###
var Y {p in P, (i,j) in Arcs, t1 in T, t2 in T: t2 <= t1+1 and t2 >= t1} >= 0; #pallet flow per type p from nodes i to j
at time t
var Inv {p in P, i in DC, t in T} >= 0; # number of pallets inventoried at time t

Appendices
130
### OBJECTIVE FUNCTIONS ###
minimize Cost: sum {p in P, (i,j) in Arcs, t in T} C[p,i,j] * Y[p,i,j,t,t] + sum {p in P, (i,j) in Arcs, t in T: t < 26}
C[p,i,j]*Y[p,i,j,t,t+1];
minimize Environmental_Cost: sum {p in P, n in N, (i,j) in Arcs, t in T} e[p,n,i,j]*Y[p,i,j,t,t] + sum {p in P, n in N, (i,j)
in Arcs, t in T: t < 26} e[p,n,i,j]*Y[p,i,j,t,t+1] + sum {p in P, n in N, i in DC} (M[p,n,'G','RM'] +
Mfg[p,n,'RM','MP'])*W[p,n,'G','RM']*Q[p,i];
#Total System Costs parameterized constraint
subject to Costs: sum {p in P, (i,j) in Arcs, t in T} C[p,i,j] * Y[p,i,j,t,t] + sum {p in P, (i,j) in Arcs, t in T: t < 26}
C[p,i,j]*Y[p,i,j,t,t+1] <= Z * (1+h);
#Total System Environmental Burden parameterized constraint
subject to Env_Cost: sum {p in P, n in N, (i,j) in Arcs, t in T} e[p,n,i,j]*Y[p,i,j,t,t] + sum {p in P, n in N, (i,j) in Arcs, t
in T: t < 26} e[p,n,i,j]*Y[p,i,j,t,t+1] + sum {p in P, n in N, i in DC} (M[p,n,'G','RM'] +
Mfg[p,n,'RM','MP'])*W[p,n,'G','RM']*Q[p,i] <= Z * (1+h);
### CONSTRAINTS ###
# Number of pallets required to fulfill demand in distribution centers
subject to Demand_DC {j in DC, t in T: t < 26}: sum {p in P, i in CPM: (i,j) in ArcsDiffTime} Y[p,i,j,t,t+1] >=
Dc[j,t+1];
# Number of pallets required to fulfill demand in Retailers
subject to Demand_Retailers {i in DC, j in RET, t in T: (i,j) in ArcsDiffTime and t < 26}: sum {p in P} Y[p,i,j,t,t+1]
>= Db[i,j,t+1];
# Initial inventory must equal given value
subject to Initial_Inventory {p in P, i in DC, t in T: t==0}: Inv[p,i,t] == Q[p,i];
#RM Nodes balance constraints
subject to RM_Nodes_Balance_0 {p in P, k in RM, t in T: t==0}: sum {(i,k) in ArcsSameTime} Y[p,i,k,t,t] - sum {(k,j)
in ArcsSameTime} Y[p,k,j,t,t] == 0;

Appendices
131
subject to RM_Nodes_Balance {p in P, k in RM, t in T: t>0 and t<=26}: sum {(i,k) in ArcsSameTime} Y[p,i,k,t,t] +
sum {(i,k) in ArcsDiffTime} Y[p,i,k,t-1,t] - sum {(k,j) in ArcsSameTime} Y[p,k,j,t,t] == 0;
#MP Nodes balance constraints
subject to MP_Nodes_Balance_0 {p in P, k in MP, t in T: t==0}: sum {(i,k) in ArcsSameTime} Y[p,i,k,t,t] - sum {(k,j)
in ArcsSameTime} Y[p,k,j,t,t] == 0;
subject to MP_Nodes_Balance {p in P, k in MP, t in T: t>0 and t<=26}: sum {(i,k) in ArcsSameTime} Y[p,i,k,t,t] +
sum {(i,k) in ArcsDiffTime} Y[p,i,k,t-1,t] - sum {(k,j) in ArcsSameTime} Y[p,k,j,t,t] == 0;
#CPM Nodes balance constraints
subject to CPM_Nodes_Balance_0 {p in P, k in CPM, t in T: t==0}: sum {(i,k) in ArcsSameTime} Y[p,i,k,t,t] - sum
{(k,j) in ArcsDiffTime} Y[p,k,j,t,t+1]== 0;
subject to CPM_Nodes_Balance {p in P, k in CPM, t in T: t>0 and t<26}: sum {(i,k) in ArcsSameTime} Y[p,i,k,t,t] +
sum {(i,k) in ArcsDiffTime} Y[p,i,k,t-1,t] - sum {(k,j) in ArcsDiffTime} Y[p,k,j,t,t+1]== 0;
subject to CPM_Nodes_Balance_5 {p in P, k in CPM, t in T: t==26}: sum {(i,k) in ArcsSameTime} Y[p,i,k,t,t] + sum
{(i,k) in ArcsDiffTime} Y[p,i,k,t-1,t] >= 0;
#DC Nodes balance constraints
subject to DC_Nodes_Balance_0 {p in P, k in DC, t in T: t==0}: Inv[p,k,t] - sum {(k1,j) in ArcsDiffTime: k1 == k}
Y[p,k1,j,t,t+1] - Inv[p,k,t+1] == 0;
subject to DC_Nodes_Balance {p in P, k in DC, t in T: t>0 and t<26}: Inv[p,k,t] + sum {(i,k1) in ArcsDiffTime: k1
== k} Y[p,i,k1,t-1,t] - sum {(k1,j) in ArcsDiffTime: k1 == k} Y[p,k1,j,t,t+1] - Inv[p,k,t+1] == 0;
subject to DC_Nodes_Balance_5 {p in P, k in DC, t in T: t==26}: Inv[p,k,t] + sum {(i,k1) in ArcsDiffTime: k1 == k}
Y[p,i,k1,t-1,t] >= 0;
#RET Nodes balance constraints
subject to RET_Nodes_Balance_0 {p in P, k in RET, t in T: t==0}: sum {(k,j) in ArcsSameTime} Y[p,k,j,t,t] == 0;
subject to RET_Nodes_Balance {p in P, k in RET, t in T: t>0 and t<=26}: sum {(i,k) in ArcsDiffTime} Y[p,i,k,t-1,t] -
sum {(k,j) in ArcsSameTime} Y[p,k,j,t,t] == 0;
#RC Nodes balance constraints
subject to RC_Nodes_Balance {p in P, k in RC, t in T: t>=0 and t<26}: sum {(i,k) in ArcsSameTime} Y[p,i,k,t,t] -
sum {(k,j) in ArcsDiffTime} Y[p,k,j,t,t+1] == 0;
subject to RC_Nodes_Balance_5 {p in P, k in RC, t in T: t==26}: sum {(i,k) in ArcsSameTime} Y[p,i,k,t,t] >= 0;

Appendices
132
# Constraint for FAILURE percentage of Pallet type p out of DC
subject to FailureDC {p in P, t in T: t<25}: sum {(k,j) in ArcsDiffTime: (k in DC) and (j in RM or j in MP or j in
DEOL or j in LEOL or j in IEOL)} Y[p,k,j,t+1,t+2] >= fdc[p]*sum {(i,k) in ArcsDiffTime: (i in CPM) and (k in DC)}
Y[p,i,k,t,t+1];
subject to FailureRC {p in P, t in T: t<25}: sum {(k,j) in ArcsDiffTime: (k in RC) and (j in RM or j in MP or j in
DEOL or j in LEOL or j in IEOL)} Y[p,k,j,t,t+1] >= frc[p]*sum {(i,k) in ArcsSameTime: (i in RET) and (k in RC)}
Y[p,i,k,t,t];
#EOL flow per pallet type p
subject to RepairDC {p in P, t in T: p<4 and t<25}: sum {(a,c) in ArcsDiffTime: (a in DC) and (c in MP)}
Y[p,a,c,t+1,t+2] <= R[p,2]*fdc[p]*sum {(a,c) in ArcsDiffTime: (a in CPM) and (c in DC)} Y[p,a,c,t,t+1];
subject to RepairRC {p in P, t in T: p<4 and t<26}: sum {(a,c) in ArcsDiffTime: (a in RC) and (c in MP)}
Y[p,a,c,t,t+1] <= R[p,2]*frc[p]*sum {(a,c) in ArcsSameTime: (a in RET) and (c in RC)} Y[p,a,c,t,t];
subject to RecycleDC {p in P, t in T: p==4 and t<25}: sum {(a,c) in ArcsDiffTime: (a in DC) and (c in RM)}
Y[p,a,c,t+1,t+2] <= R[p,3]*fdc[p]*sum {(a,c) in ArcsDiffTime: (a in CPM) and (c in DC)} Y[p,a,c,t,t+1];
subject to RecycleRC {p in P, t in T: p==4 and t<26}: sum {(a,c) in ArcsDiffTime: (a in RC) and (c in RM)}
Y[p,a,c,t,t+1] <= R[p,3]*frc[p]*sum {(a,c) in ArcsSameTime: (a in RET) and (c in RC)} Y[p,a,c,t,t];
subject to DowncycleDC {p in P, t in T: p<4 and t<25}: sum {(a,c) in ArcsDiffTime: (a in DC) and (c in DEOL)}
Y[p,a,c,t+1,t+2] <= R[p,4]*fdc[p]*sum {(a,c) in ArcsDiffTime: (a in CPM) and (c in DC)} Y[p,a,c,t,t+1];
subject to DowncycleRC {p in P, t in T: p<4 and t<26}: sum {(a,c) in ArcsDiffTime: (a in RC) and (c in DEOL)}
Y[p,a,c,t,t+1] <= R[p,4]*frc[p]*sum {(a,c) in ArcsSameTime: (a in RET) and (c in RC)} Y[p,a,c,t,t];
subject to LandfillDC {p in P, t in T: t<25}: sum {(a,c) in ArcsDiffTime: (a in DC) and (c in LEOL)} Y[p,a,c,t+1,t+2]
<= R[p,5]*fdc[p]*sum {(a,c) in ArcsDiffTime: (a in CPM) and (c in DC)} Y[p,a,c,t,t+1];
subject to LandfillRC {p in P, t in T: t<26}: sum {(a,c) in ArcsDiffTime: (a in RC) and (c in LEOL)} Y[p,a,c,t,t+1] <=
R[p,5]*frc[p]*sum {(a,c) in ArcsSameTime: (a in RET) and (c in RC)} Y[p,a,c,t,t];
subject to IncinerationDC {p in P, t in T: t<25}: sum {(a,c) in ArcsDiffTime: (a in DC) and (c in IEOL)}
Y[p,a,c,t+1,t+2] <= R[p,6]*fdc[p]*sum {(a,c) in ArcsDiffTime: (a in CPM) and (c in DC)} Y[p,a,c,t,t+1];
subject to IncinerationRC {p in P, t in T: t<26}: sum {(a,c) in ArcsDiffTime: (a in RC) and (c in IEOL)} Y[p,a,c,t,t+1]
<= R[p,6]*frc[p]*sum {(a,c) in ArcsSameTime: (a in RET) and (c in RC)} Y[p,a,c,t,t];

Appendices
133
#Fix unexisting variables to zero
subject to Fix0 {p in P, (i,j) in ArcsDiffTime, t in T: p<4 and (i in DC or i in RC) and (j in RM) and t<26}:
Y[p,i,j,t,t+1] = 0;
subject to Fix1 {(i,j) in ArcsDiffTime, t in T: (i in DC or i in RC) and (j in MP or j in DEOL) and t<26}: Y[4,i,j,t,t+1]
= 0;
subject to Fixttp1 {p in P,(i,j) in ArcsSameTime, t in T: t < 26}: Y[p,i,j,t,t+1]=0;
subject to Fixtt {p in P,(i,j) in ArcsDiffTime, t in T}: Y[p,i,j,t,t]=0;
subject to Repair0 {p in P, t in T: t==0}: sum {(a,c) in ArcsDiffTime: (a in DC) and (c in MP)} Y[p,a,c,t,t+1] = 0;
subject to Recycle0 {p in P, t in T: t==0}: sum {(a,c) in ArcsDiffTime: (a in DC) and (c in RM)} Y[p,a,c,t,t+1] = 0;
subject to Downcycle0 {p in P, t in T: t==0}: sum {(a,c) in ArcsDiffTime: (a in DC) and (c in DEOL)} Y[p,a,c,t,t+1]
= 0;
subject to Landfill0 {p in P, t in T: t==0}: sum {(a,c) in ArcsDiffTime: (a in DC) and (c in LEOL)} Y[p,a,c,t,t+1] = 0;
subject to Incineration0 {p in P, t in T: t==0}: sum {(a,c) in ArcsDiffTime: (a in DC) and (c in IEOL)} Y[p,a,c,t,t+1] =
0;
end;

Appendices
134
C. CASE STUDY GROCERY DISTRIBUTOR/RETAILER (DEMAND AND DISTANCES)
Table 40. Pallet demand at the 8 distribution centers (specific for validation and case study)

Appendices
135
Table 41. Pallet demand at the 75 retailers (specific for validation and case study)

Appendices
136
Table 42. Percentage of pallet demand from each distribution center to each retailer

Appendices
137
Table 43. Distances (in miles) between distributor's facilities (specific for validation and case study)

Appendices
138
D. RESULTS
1. MINIMIZING SYSTEM ENVIRONMENTAL IMPACTS SUBJECT TO MINIMUM SYSTEM COST
Figure 28. Number of new pallets manufactured per pallet type when minimizing system environmental impacts subject to minimum cost
2. TRADEOFF BETWEEN SYSTEM COSTS AND ENVIRONMENTAL COSTS
Figure 29. Tradeoff between environmental impacts and costs (Time horizon: 6 months)
138 256
420 524
852
1,110
1,391
1,646
1,926
2,717
14 14 - 14 14 0
500
1,000
1,500
2,000
2,500
3,000
0 3 6 9 12 15 18 21 24 27 30 33 36 39 42 45 48 51 54 57 60
Nu
mb
er
of n
ew
pal
lets
man
ufa
ctu
red
(in
th
ou
san
d)
Time (months)
Pallets 1
Pallets 3
14.9 15.3 15.7 16.0
16.1 16.2
16.3 16.4
18.6 22.4
29.8
89.4
164.0
0
40
80
120
160
200
3 4 5 6 7 8
Syst
em
s C
ost
($ in
mill
ion
)
System Environmental Burden (KTons CO2)

Appendices
139
3. ANALYSIS OF FACTORS: PALLET WEIGHT AND PALLET PURCHASE/LEASING COST
Table 44. 64 combinations for factors analysis (factors: Pallet Weight and Purchase/Leasing Cost)

Appendices
140
Table 45. 64 combinations results (Time horizon: 6 months)

Appendices
141
Table 46. 64 combinations results (Time horizon: 2 years)

Appendices
142
Table 47. Minimizing environmental impacts subject to minimum system cost (Time horizon: 6 months)
Table 48. Minimizing environmental impacts allowing costs to increase by 20 percent the minimum cost (Time horizon: 6 months)
Table 49. Minimizing system cost subject to minimum environmental impacts (Time horizon: 6 months)
Table 50. Minimizing system cost allowing environmental impacts to increase by 20 percent the minimum environmental cost (Time horizon: 6 months)

Appendices
143
4. ANALYSIS OF FACTORS: PALLET WEIGHT AND CO2 FOOTPRINT FROM MATERIAL, PRIMARY
PRODUCTION.
Table 51. 9 combinations for factors analysis (factors: Pallet Weight and CO2 footprint from material production)
Table 52. 9 combinations results when minimizing system cost subject to minimum environmental impacts (Time horizon: 6 months)
Table 53. 9 combinations results when minimizing system cost subject to environmental impacts for α=5 percent (Time horizon: 6 months)
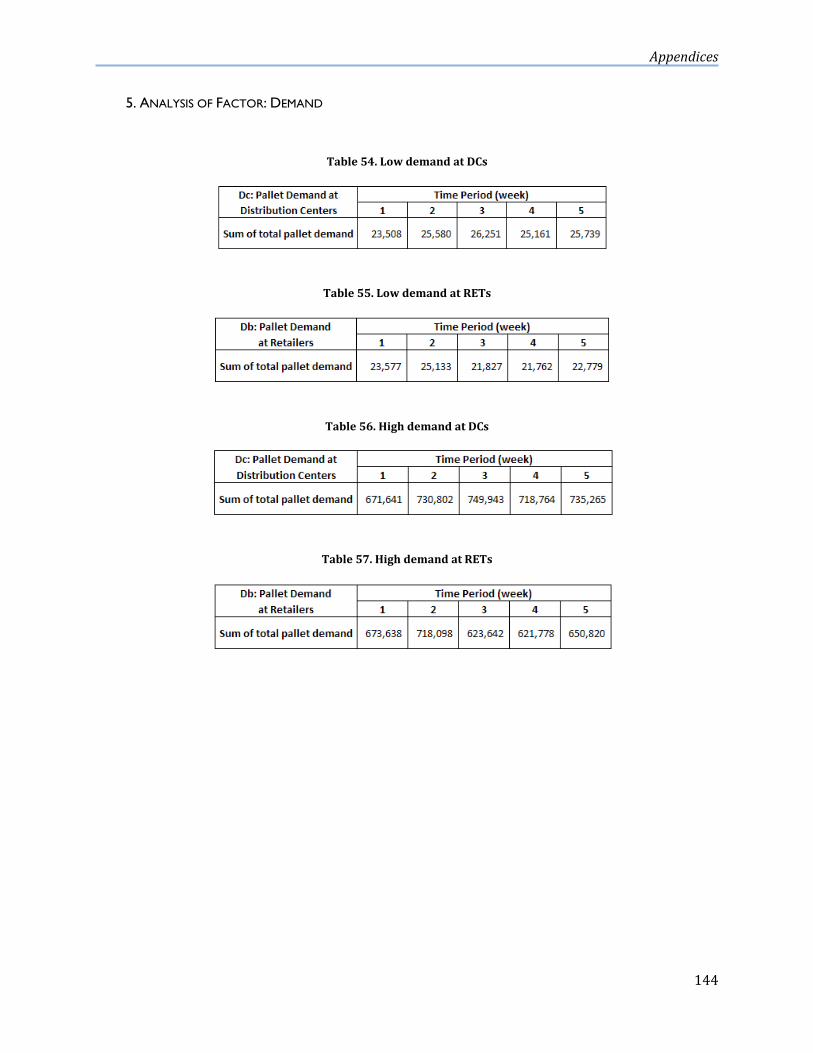
Appendices
144
5. ANALYSIS OF FACTOR: DEMAND
Table 54. Low demand at DCs
Table 55. Low demand at RETs
Table 56. High demand at DCs
Table 57. High demand at RETs

Appendices
145
6. ANALYSIS OF FACTOR: TRANSPORTATION
Table 58. Distance traveled within distributor’s facilities (on average 30 miles)

Appendices
146
Table 59. Distance traveled within distributor’s facilities (on average 3,000 miles)

Appendices
147
7. PALLETS END-OF-LIFE ALTERNATIVES ANALYSIS
Table 60. End-of-life alternatives base scenario vs. regulation scenario when minimizing system cost subject to environmental impacts (Time horizon: 2 years)