environmental impact and economic assessment for uk sugar beet production systems
TRANSCRIPT
www.elsevier.com/locate/agee
Agriculture, Ecosystems and Environment 107 (2005) 341–358
A
0
d
Environmental impact and economic assessment for UK
sugar beet production systems
J. Tzilivakis a,*, K. Jaggard b, K.A. Lewis a, M. May b, D.J. Warner a
a Agriculture and Environment Research Unit (AERU), Science and Technology Research Institute,
University of Hertfordshire, College Lane Campus, Hatfield, Hertfordshire AL10 9AB, UKb Broom’s Barn Research Station, Higham, Bury St Edmunds, Suffolk IP28 6NP, UK
Received 20 April 2004; received in revised form 30 November 2004; accepted 8 December 2004
bstract
It is important to understand and evaluate the environmental impacts of all crops if we are to develop more sustainable
production systems. Understanding the impact of sugar beet (Beta vulgaris) is particularly important as there are alternative
crops that can be used for sugar production and also because there is growing interest in its potential as a source for biofuel. This
paper presents the findings of a research project to evaluate the environmental impact and economic viability of the range of
sugar beet production systems in the UK. The study used 13 sugar beet production scenarios that represent those used throughout
the UK. These scenarios differed in soil type, nutrients applied (inorganic and organic), crop protection (chemical and cultural)
and use of irrigation. The assessment included an evaluation of inputs (nutrients, pesticides and energy) and their impact on the
environment. A net margin for each scenario was also calculated to provide an economic assessment. An average of the
assessment results for the different parameters across the scenarios was calculated (weighted by the sugar beet area each scenario
represented) to provide a mean figure for sugar beet production in the UK. The results for this mean on a per ha basis were a yield
of 52 t, a net margin of £560, consumption of 21.4 GJ of energy, emission of 1.4 equiv. t of carbon dioxide, 3.3 kg nitrogen
leached, 15.2 kg nitrogen lost to denitrification and a pesticide ecotoxicity score of 26 (low). A sustainability profile, on a per ha
and a per tonne basis, for each of the 13 scenarios was constructed enabling all scenarios to be compared in terms of their overall
environmental and economic performance. This comparison showed that the most profitable scenario also had the best overall
environmental performance. This scenario represented 18% of UK sugar beet area. Three other scenarios that represented 57%
of the total area closely followed this performance. The overall performance of the organic scenario was equal to the best
conventional scenario on a per ha basis, but on a per t basis its performance was lower (similar to the mean for sugar beet in the
UK) due to its significantly lower yield. This study illustrates that a significant proportion of the UK crop is being grown in an
economically efficient way whilst minimising environmental damage.
# 2005 Elsevier B.V. All rights reserved.
Keywords: Sugar beet; Environmental impact; Energy; Pesticides; Nutrients; Economics; Sustainability
* Corresponding author. Tel.: +44 1707 285259; fax: +44 1707 284185.
E-mail address: [email protected] (J. Tzilivakis).
167-8809/$ – see front matter # 2005 Elsevier B.V. All rights reserved.
oi:10.1016/j.agee.2004.12.016
J. Tzilivakis et al. / Agriculture, Ecosystems and Environment 107 (2005) 341–358342
1. Introduction
Agriculture has a complex relationship with the
environment because of its dependence on natural
resources and processes. It can have both positive and
negative impacts on the environment. The negative
effects tend to arise from the use of farm inputs
(fertilisers, pesticides and fossil fuels) and land
management practices that can result in pollution,
loss of wildlife habitats and reduced biodiversity. On
the other hand agricultural land management can
create a diverse range of habitats and ameliorate
pollution. The challenge is to enhance the positive and
minimise the negative effects within the framework of
economic viability. This is the balance of sustain-
ability, optimising the production system to meet
evolving economic, environmental and social objec-
tives. In order to achieve this it is important to
understand and evaluate the impacts of all crops.
Sugar beet (Beta vulgaris) is an important crop
within many arable rotations in England and it is
commonly grown in conjunction with wheat (Triticum
spp.) and barley (Hordeum spp.) and sometimes with
potato (Solanum spp.). It is a valuable break crop,
preventing the build up of disease and reducing the
need for pesticides in the following crops. In 2002,
169 000 ha was devoted to sugar beet in the UK
(DEFRA, 2003a). This represents about 3.7% of the
total cropped area and is similar to the area of potato.
This area supplies about 55% of the sugar consumed in
the UK and a surplus (exports less imports) of about
200 000 t for export. It also supplies approximately
600 000 t of dried animal feed each year. The beet
crop is also important for the wider rural economy,
in particular employment. Although agricultural
employment has been in decline, farms still provide
significant employment for those living in the
countryside. This is not just through direct employ-
ment on farms and in beet sugar factories, but also in
the service and ancillary industries that support farms
and processors. The industry estimates that it supports
over 20 000 jobs in the UK (NFU/British Sugar, 2003).
This paper presents the findings of a study in which
the objective was to evaluate the environmental impact
and economic performance of sugar beet production
systems in the UK. Understanding the impact of sugar
beet is particularly important because there are alterna-
tive sources for sugar, e.g. sucrose from sugar cane
(Saccharum officinarum L.) and high fructose syrup
from maize (Zea mays L.). From a sustainability pers-
pective, a broader assessment of the impacts of sugar
production (e.g. processing, packing, transport and
consumption) is required to evaluate fully which sys-
tems present the most sustainable solution for society.
This wider analysis must also acknowledge social
considerations, which are a significant part of the
Government’s sustainable development policy and its
aim of achieving ‘‘a better quality of life for everyone’’
(DEFRA, 2002). It can be difficult to relate social
objectives to the growing of a crop, but links do exist.
For example, transporting sugar beet during winter can
result in soil from fields being deposited on public roads.
This may be trivial in terms of soil erosion, but
important for road safety, which is a serious issue for
many communities. These wider issues have not been
included within the objectives of this study due to their
scale (beyond the farm gate) and difficulties with
objective assessment and quantification (with respect to
social aspects). However, it is important to acknowledge
their existence in order to maintain a holistic perspective
and understand the contribution this study offers. This
study focuses on the production of sugar beet at the farm
level and delivery to the factory gate. This includes the
impacts that arise from the production of farm inputs,
such as fertilisers and pesticides, their use, energy
consumption and emissions of pollutants. An eco-
nomic analysis was also undertaken as part of the study.
2. Methodology
2.1. Sugar beet production scenarios
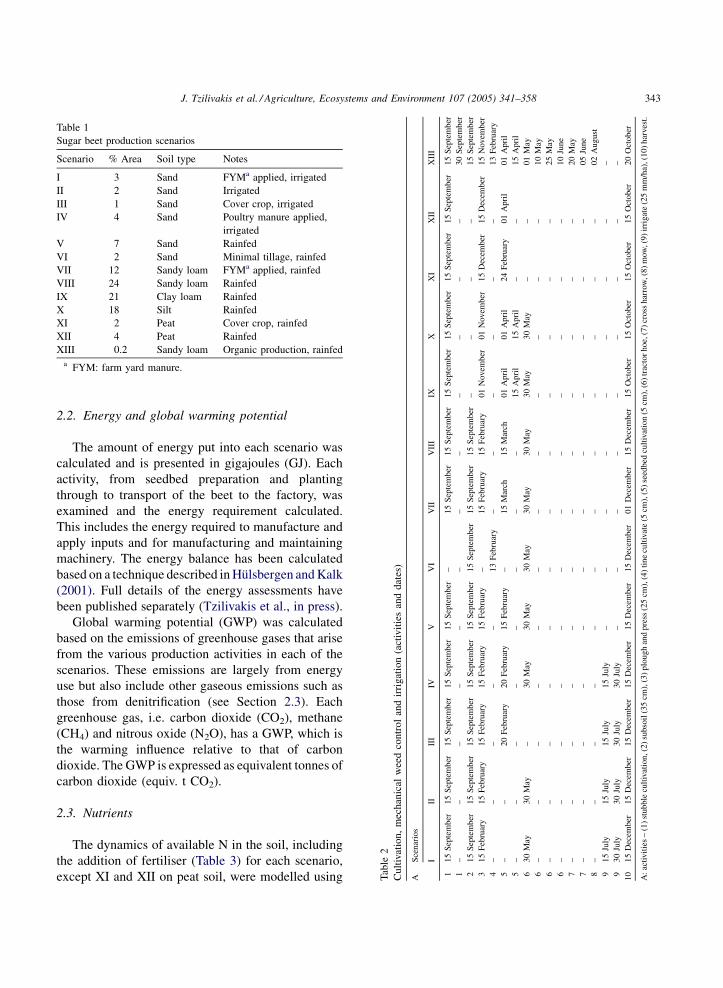
Thirteen theoretical sugar beet production scenarios
were constructed to represent the range of current
production systems in the UK. Table 1 lists some details
of the scenarios and the area they represent today. The
proportion of the UK beet area represented by each
scenario was estimated from recent surveys of
production practices carried out by staff from British
Sugar on a random selection of approximately 500
fields each year. Scott and Jaggard (2000) also used this
survey and Turner (1992) gives details of the survey
structure. Table 2 shows the cultivation operations for
each scenario, Table 3 the crop nutrition and Table 4
the crop protection regimes.
J. Tzilivakis et al. / Agriculture, Ecosystems and Environment 107 (2005) 341–358 343
Tab
le2
Cu
ltiv
atio
n,
mec
han
ical
wee
dco
ntr
ol
and
irri
gat
ion
(act
ivit
ies
and
dat
es)
AS
cen
ario
s
III
III
IVV
VI
VII
VII
IIX
XX
IX
IIX
III
11
5S
epte
mb
er1
5S
epte
mb
er15
Sep
tem
ber
15
Sep
tem
ber
15
Sep
tem
ber
–1
5S
epte
mb
er1
5S
epte
mb
er1
5S
epte
mb
er1
5S
epte
mb
er1
5S
epte
mb
er15
Sep
tem
ber
15
Sep
tem
ber
1–
––
––
––
––
––
–3
0S
epte
mb
er
21
5S
epte
mb
er1
5S
epte
mb
er15
Sep
tem
ber
15
Sep
tem
ber
15
Sep
tem
ber
15
Sep
tem
ber
15
Sep
tem
ber
15
Sep
tem
ber
––
––
15
Sep
tem
ber
31
5F
ebru
ary
15
Feb
ruar
y15
Feb
ruar
y15
Feb
ruar
y1
5F
ebru
ary
–1
5F
ebru
ary
15
Feb
ruar
y0
1N
ovem
ber
01
Novem
ber
15
Dec
emb
er15
Dec
emb
er1
5N
ovem
ber
4–
––
––
13
Feb
ruar
y–
––
––
–1
3F
ebru
ary
5–
–20
Feb
ruar
y20
Feb
ruar
y1
5F
ebru
ary
–15
Mar
ch1
5M
arch
01
Apri
l01
Apri
l24
Feb
ruar
y01
Ap
ril
01
Apri
l
5–
––
––
––
–1
5A
pri
l1
5A
pri
l–
–15
Apri
l
63
0M
ay3
0M
ay–
30
May
30
May
30
May
30
May
30
May
30
May
30
May
––
01
May
6–
––
––
––
––
––
–1
0M
ay
6–
––
––
––
––
––
–2
5M
ay
6–
––
––
––
––
––
–1
0Ju
ne
7–
––
––
––
––
––
–2
0M
ay
7–
––
––
––
––
––
–0
5Ju
ne
8–
––
––
––
––
––
–0
2A
ug
ust
91
5Ju
ly1
5Ju
ly15
July
15
July
––
––
––
––
–
93
0Ju
ly3
0Ju
ly30
July
30
July
––
––
––
––
–
10
15
Dec
emb
er1
5D
ecem
ber
15
Dec
emb
er1
5D
ecem
ber
15
Dec
emb
er1
5D
ecem
ber
01
Dec
emb
er1
5D
ecem
ber
15
Oct
ob
er1
5O
cto
ber
15
Oct
ob
er1
5O
cto
ber
20
Oct
ob
er
A:
acti
vit
ies
–(1
)st
ubble
cult
ivat
ion,(
2)
subso
il(3
5cm
),(3
)plo
ugh
and
pre
ss(2
5cm
),(4
)ti
ne
cult
ivat
e(5
cm),
(5)
seed
bed
cult
ivat
ion
(5cm
),(6
)tr
acto
rhoe,
(7)
cross
har
row
,(8)
mow
,(9
)ir
rigat
e(2
5m
m/h
a),(
10)
har
ves
t.
Table 1
Sugar beet production scenarios
Scenario % Area Soil type Notes
I 3 Sand FYMa applied, irrigated
II 2 Sand Irrigated
III 1 Sand Cover crop, irrigated
IV 4 Sand Poultry manure applied,
irrigated
V 7 Sand Rainfed
VI 2 Sand Minimal tillage, rainfed
VII 12 Sandy loam FYMa applied, rainfed
VIII 24 Sandy loam Rainfed
IX 21 Clay loam Rainfed
X 18 Silt Rainfed
XI 2 Peat Cover crop, rainfed
XII 4 Peat Rainfed
XIII 0.2 Sandy loam Organic production, rainfed
a FYM: farm yard manure.
2.2. Energy and global warming potential
The amount of energy put into each scenario was
calculated and is presented in gigajoules (GJ). Each
activity, from seedbed preparation and planting
through to transport of the beet to the factory, was
examined and the energy requirement calculated.
This includes the energy required to manufacture and
apply inputs and for manufacturing and maintaining
machinery. The energy balance has been calculated
based on a technique described in Hulsbergen and Kalk
(2001). Full details of the energy assessments have
been published separately (Tzilivakis et al., in press).
Global warming potential (GWP) was calculated
based on the emissions of greenhouse gases that arise
from the various production activities in each of the
scenarios. These emissions are largely from energy
use but also include other gaseous emissions such as
those from denitrification (see Section 2.3). Each
greenhouse gas, i.e. carbon dioxide (CO2), methane
(CH4) and nitrous oxide (N2O), has a GWP, which is
the warming influence relative to that of carbon
dioxide. The GWP is expressed as equivalent tonnes of
carbon dioxide (equiv. t CO2).
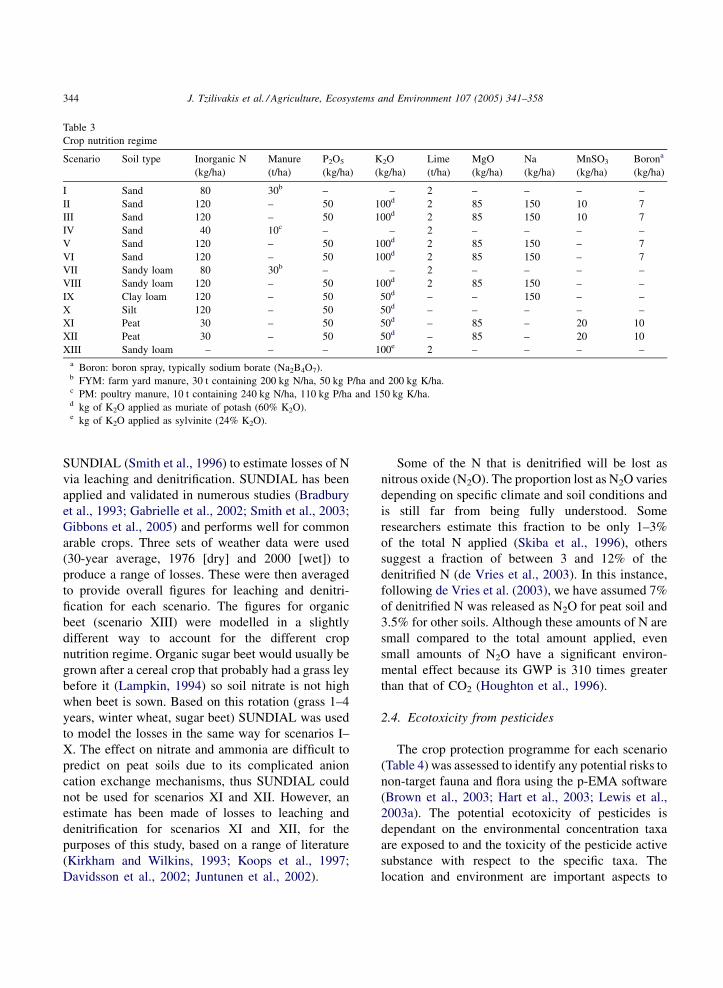
2.3. Nutrients
The dynamics of available N in the soil, including
the addition of fertiliser (Table 3) for each scenario,
except XI and XII on peat soil, were modelled using
J. Tzilivakis et al. / Agriculture, Ecosystems and Environment 107 (2005) 341–358344
Table 3
Crop nutrition regime
Scenario Soil type Inorganic N
(kg/ha)
Manure
(t/ha)
P2O5
(kg/ha)
K2O
(kg/ha)
Lime
(t/ha)
MgO
(kg/ha)
Na
(kg/ha)
MnSO3
(kg/ha)
Borona
(kg/ha)
I Sand 80 30b – – 2 – – – –
II Sand 120 – 50 100d 2 85 150 10 7
III Sand 120 – 50 100d 2 85 150 10 7
IV Sand 40 10c – – 2 – – – –
V Sand 120 – 50 100d 2 85 150 – 7
VI Sand 120 – 50 100d 2 85 150 – 7
VII Sandy loam 80 30b – – 2 – – – –
VIII Sandy loam 120 – 50 100d 2 85 150 – –
IX Clay loam 120 – 50 50d – – 150 – –
X Silt 120 – 50 50d – – – – –
XI Peat 30 – 50 50d – 85 – 20 10
XII Peat 30 – 50 50d – 85 – 20 10
XIII Sandy loam – – – 100e 2 – – – –
a Boron: boron spray, typically sodium borate (Na2B4O7).b FYM: farm yard manure, 30 t containing 200 kg N/ha, 50 kg P/ha and 200 kg K/ha.c PM: poultry manure, 10 t containing 240 kg N/ha, 110 kg P/ha and 150 kg K/ha.d kg of K2O applied as muriate of potash (60% K2O).e kg of K2O applied as sylvinite (24% K2O).
SUNDIAL (Smith et al., 1996) to estimate losses of N
via leaching and denitrification. SUNDIAL has been
applied and validated in numerous studies (Bradbury
et al., 1993; Gabrielle et al., 2002; Smith et al., 2003;
Gibbons et al., 2005) and performs well for common
arable crops. Three sets of weather data were used
(30-year average, 1976 [dry] and 2000 [wet]) to
produce a range of losses. These were then averaged
to provide overall figures for leaching and denitri-
fication for each scenario. The figures for organic
beet (scenario XIII) were modelled in a slightly
different way to account for the different crop
nutrition regime. Organic sugar beet would usually be
grown after a cereal crop that probably had a grass ley
before it (Lampkin, 1994) so soil nitrate is not high
when beet is sown. Based on this rotation (grass 1–4
years, winter wheat, sugar beet) SUNDIAL was used
to model the losses in the same way for scenarios I–
X. The effect on nitrate and ammonia are difficult to
predict on peat soils due to its complicated anion
cation exchange mechanisms, thus SUNDIAL could
not be used for scenarios XI and XII. However, an
estimate has been made of losses to leaching and
denitrification for scenarios XI and XII, for the
purposes of this study, based on a range of literature
(Kirkham and Wilkins, 1993; Koops et al., 1997;
Davidsson et al., 2002; Juntunen et al., 2002).
Some of the N that is denitrified will be lost as
nitrous oxide (N2O). The proportion lost as N2O varies
depending on specific climate and soil conditions and
is still far from being fully understood. Some
researchers estimate this fraction to be only 1–3%
of the total N applied (Skiba et al., 1996), others
suggest a fraction of between 3 and 12% of the
denitrified N (de Vries et al., 2003). In this instance,
following de Vries et al. (2003), we have assumed 7%
of denitrified N was released as N2O for peat soil and
3.5% for other soils. Although these amounts of N are
small compared to the total amount applied, even
small amounts of N2O have a significant environ-
mental effect because its GWP is 310 times greater
than that of CO2 (Houghton et al., 1996).
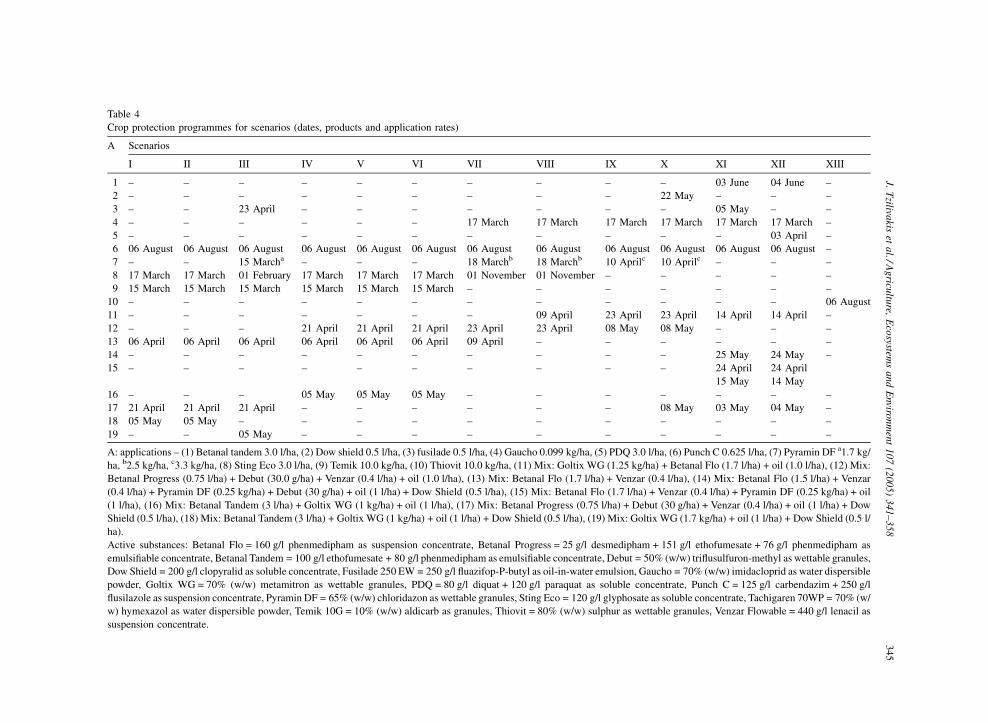
2.4. Ecotoxicity from pesticides
The crop protection programme for each scenario
(Table 4) was assessed to identify any potential risks to
non-target fauna and flora using the p-EMA software
(Brown et al., 2003; Hart et al., 2003; Lewis et al.,
2003a). The potential ecotoxicity of pesticides is
dependant on the environmental concentration taxa
are exposed to and the toxicity of the pesticide active
substance with respect to the specific taxa. The
location and environment are important aspects to
J.T
zilivakis
eta
l./Ag
ricultu
re,E
cosystem
sa
nd
Enviro
nm
ent
10
7(2
00
5)
34
1–
35
83
45
Table 4
Crop protection programmes for scenarios (dates, products and application rates)
A Scenarios
I II III IV V VI VII VIII IX XI XII XIII
1 – – – – – – – – – 03 June 04 June –
2 – – – – – – – – – 2 May – – –
3 – – 23 April – – – – – – 05 May – –
4 – – – – – – 17 March 17 March 17 March 7 March 17 March 17 March –
5 – – – – – – – – – – 03 April –
6 06 August 06 August 06 August 06 August 06 August 06 August 06 August 06 August 06 August 6 August 06 August 06 August –
7 – – 15 Marcha – – – 18 Marchb 18 Marchb 10 Aprilc 0 Aprilc – – –
8 17 March 17 March 01 February 17 March 17 March 17 March 01 November 01 November – – – –
9 15 March 15 March 15 March 15 March 15 March 15 March – – – – – –
10 – – – – – – – – – – – 06 August
11 – – – – – – – 09 April 23 April 3 April 14 April 14 April –
12 – – – 21 April 21 April 21 April 23 April 23 April 08 May 8 May – – –
13 06 April 06 April 06 April 06 April 06 April 06 April 09 April – – – – –
14 – – – – – – – – – 25 May 24 May –
15 – – – – – – – – – 24 April 24 April
15 May 14 May
16 – – – 05 May 05 May 05 May – – – – – –
17 21 April 21 April 21 April – – – – – – 8 May 03 May 04 May –
18 05 May 05 May – – – – – – – – – –
19 – – 05 May – – – – – – – – –
A: applications – (1) Betanal tandem 3.0 l/ha, (2) Dow shield 0.5 l/ha, (3) fusilade 0.5 l/ha, (4) Gaucho 0.099 kg/ha, (5) PDQ 3.0 l/h (6) Punch C 0.625 l/ha, (7) Pyramin DF a1.7 kg/
ha, b2.5 kg/ha, c3.3 kg/ha, (8) Sting Eco 3.0 l/ha, (9) Temik 10.0 kg/ha, (10) Thiovit 10.0 kg/ha, (11) Mix: Goltix WG (1.25 kg/ha) Betanal Flo (1.7 l/ha) + oil (1.0 l/ha), (12) Mix:
Betanal Progress (0.75 l/ha) + Debut (30.0 g/ha) + Venzar (0.4 l/ha) + oil (1.0 l/ha), (13) Mix: Betanal Flo (1.7 l/ha) + Venzar (0. l/ha), (14) Mix: Betanal Flo (1.5 l/ha) + Venzar
(0.4 l/ha) + Pyramin DF (0.25 kg/ha) + Debut (30 g/ha) + oil (1 l/ha) + Dow Shield (0.5 l/ha), (15) Mix: Betanal Flo (1.7 l/ha) + nzar (0.4 l/ha) + Pyramin DF (0.25 kg/ha) + oil
(1 l/ha), (16) Mix: Betanal Tandem (3 l/ha) + Goltix WG (1 kg/ha) + oil (1 l/ha), (17) Mix: Betanal Progress (0.75 l/ha) + Debut 0 g/ha) + Venzar (0.4 l/ha) + oil (1 l/ha) + Dow
Shield (0.5 l/ha), (18) Mix: Betanal Tandem (3 l/ha) + Goltix WG (1 kg/ha) + oil (1 l/ha) + Dow Shield (0.5 l/ha), (19) Mix: Goltix G (1.7 kg/ha) + oil (1 l/ha) + Dow Shield (0.5 l/
ha).
Active substances: Betanal Flo = 160 g/l phenmedipham as suspension concentrate, Betanal Progress = 25 g/l desmedipham + 51 g/l ethofumesate + 76 g/l phenmedipham as
emulsifiable concentrate, Betanal Tandem = 100 g/l ethofumesate + 80 g/l phenmedipham as emulsifiable concentrate, Debut = 50% (w/w) triflusulfuron-methyl as wettable granules,
Dow Shield = 200 g/l clopyralid as soluble concentrate, Fusilade 250 EW = 250 g/l fluazifop-P-butyl as oil-in-water emulsion, Gauc o = 70% (w/w) imidacloprid as water dispersible
powder, Goltix WG = 70% (w/w) metamitron as wettable granules, PDQ = 80 g/l diquat + 120 g/l paraquat as soluble conce trate, Punch C = 125 g/l carbendazim + 250 g/l
flusilazole as suspension concentrate, Pyramin DF = 65% (w/w) chloridazon as wettable granules, Sting Eco = 120 g/l glyphosate as oluble concentrate, Tachigaren 70WP = 70% (w/
w) hymexazol as water dispersible powder, Temik 10G = 10% (w/w) aldicarb as granules, Thiovit = 80% (w/w) sulphur as wetta e granules, Venzar Flowable = 440 g/l lenacil as
suspension concentrate.
X
–
2
–
1
–
0
1
–
–
–
2
0
–
–
–
–
0
–
–
a,
+
4
Ve
(3
W
1
h
n
s
bl
J. Tzilivakis et al. / Agriculture, Ecosystems and Environment 107 (2005) 341–358346
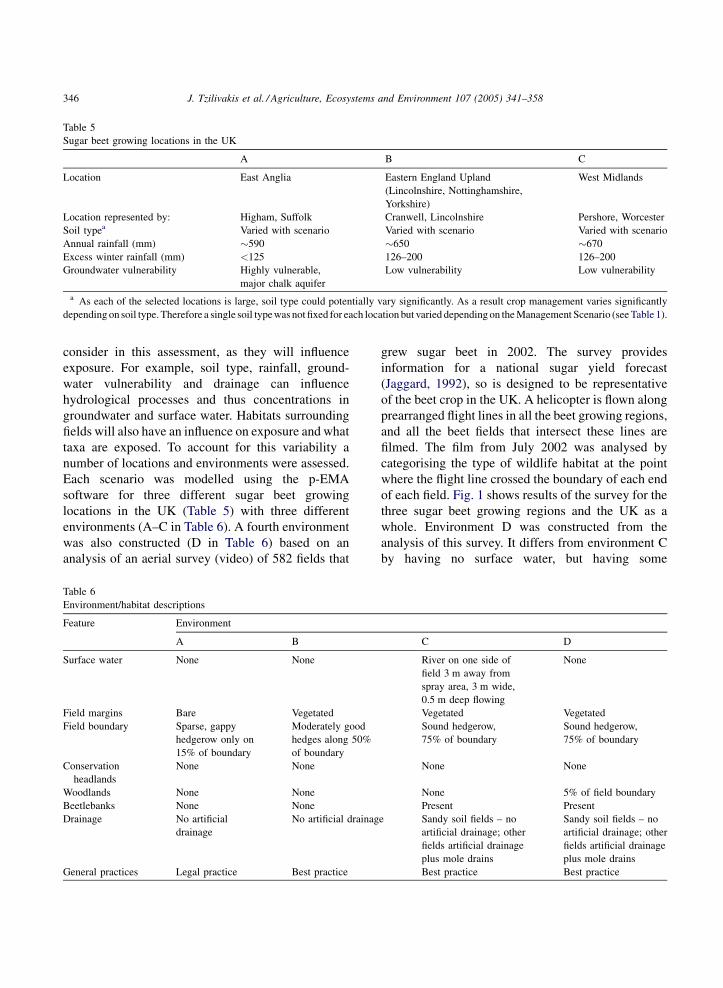
Table 5
Sugar beet growing locations in the UK
A B C
Location East Anglia Eastern England Upland
(Lincolnshire, Nottinghamshire,
Yorkshire)
West Midlands
Location represented by: Higham, Suffolk Cranwell, Lincolnshire Pershore, Worcester
Soil typea Varied with scenario Varied with scenario Varied with scenario
Annual rainfall (mm) �590 �650 �670
Excess winter rainfall (mm) <125 126–200 126–200
Groundwater vulnerability Highly vulnerable,
major chalk aquifer
Low vulnerability Low vulnerability
a As each of the selected locations is large, soil type could potentially vary significantly. As a result crop management varies significantly
depending on soil type. Therefore a single soil type was not fixed for each location but varied depending on the Management Scenario (see Table 1).
consider in this assessment, as they will influence
exposure. For example, soil type, rainfall, ground-
water vulnerability and drainage can influence
hydrological processes and thus concentrations in
groundwater and surface water. Habitats surrounding
fields will also have an influence on exposure and what
taxa are exposed. To account for this variability a
number of locations and environments were assessed.
Each scenario was modelled using the p-EMA
software for three different sugar beet growing
locations in the UK (Table 5) with three different
environments (A–C in Table 6). A fourth environment
was also constructed (D in Table 6) based on an
analysis of an aerial survey (video) of 582 fields that
Table 6
Environment/habitat descriptions
Feature Environment
A B
Surface water None None
Field margins Bare Vegetated
Field boundary Sparse, gappy
hedgerow only on
15% of boundary
Moderately good
hedges along 50%
of boundary
Conservation
headlands
None None
Woodlands None None
Beetlebanks None None
Drainage No artificial
drainage
No artificial drainag
General practices Legal practice Best practice
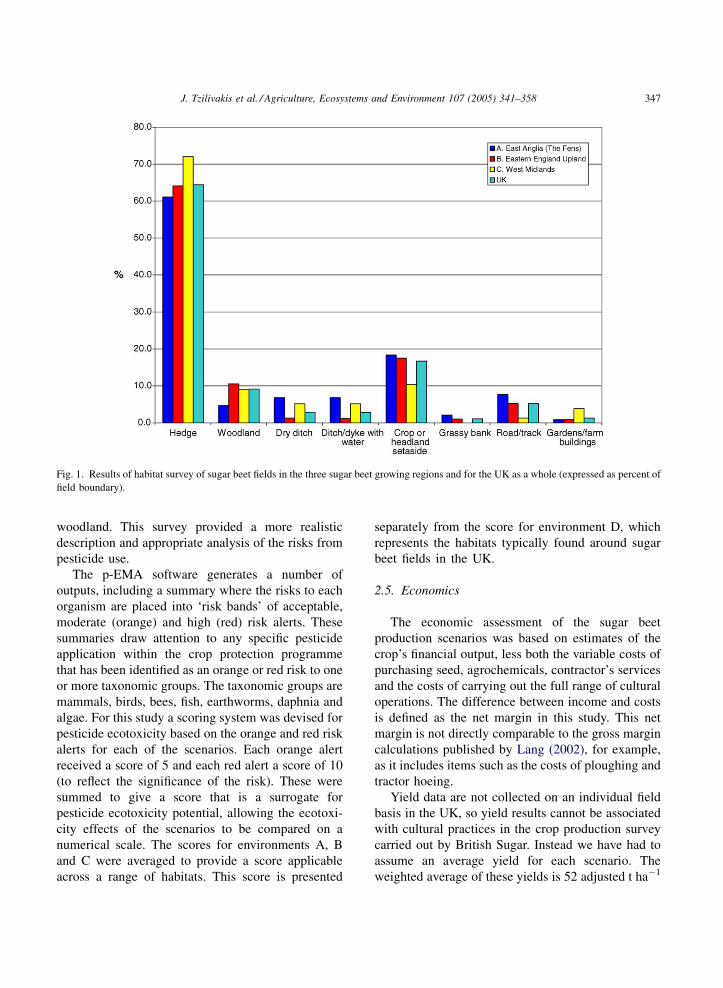
grew sugar beet in 2002. The survey provides
information for a national sugar yield forecast
(Jaggard, 1992), so is designed to be representative
of the beet crop in the UK. A helicopter is flown along
prearranged flight lines in all the beet growing regions,
and all the beet fields that intersect these lines are
filmed. The film from July 2002 was analysed by
categorising the type of wildlife habitat at the point
where the flight line crossed the boundary of each end
of each field. Fig. 1 shows results of the survey for the
three sugar beet growing regions and the UK as a
whole. Environment D was constructed from the
analysis of this survey. It differs from environment C
by having no surface water, but having some
C D
River on one side of
field 3 m away from
spray area, 3 m wide,
0.5 m deep flowing
None
Vegetated Vegetated
Sound hedgerow,
75% of boundary
Sound hedgerow,
75% of boundary
None None
None 5% of field boundary
Present Present
e Sandy soil fields – no
artificial drainage; other
fields artificial drainage
plus mole drains
Sandy soil fields – no
artificial drainage; other
fields artificial drainage
plus mole drains
Best practice Best practice
J. Tzilivakis et al. / Agriculture, Ecosystems and Environment 107 (2005) 341–358 347
Fig. 1. Results of habitat survey of sugar beet fields in the three sugar beet growing regions and for the UK as a whole (expressed as percent of
field boundary).
woodland. This survey provided a more realistic
description and appropriate analysis of the risks from
pesticide use.
The p-EMA software generates a number of
outputs, including a summary where the risks to each
organism are placed into ‘risk bands’ of acceptable,
moderate (orange) and high (red) risk alerts. These
summaries draw attention to any specific pesticide
application within the crop protection programme
that has been identified as an orange or red risk to one
or more taxonomic groups. The taxonomic groups are
mammals, birds, bees, fish, earthworms, daphnia and
algae. For this study a scoring system was devised for
pesticide ecotoxicity based on the orange and red risk
alerts for each of the scenarios. Each orange alert
received a score of 5 and each red alert a score of 10
(to reflect the significance of the risk). These were
summed to give a score that is a surrogate for
pesticide ecotoxicity potential, allowing the ecotoxi-
city effects of the scenarios to be compared on a
numerical scale. The scores for environments A, B
and C were averaged to provide a score applicable
across a range of habitats. This score is presented
separately from the score for environment D, which
represents the habitats typically found around sugar
beet fields in the UK.
2.5. Economics
The economic assessment of the sugar beet
production scenarios was based on estimates of the
crop’s financial output, less both the variable costs of
purchasing seed, agrochemicals, contractor’s services
and the costs of carrying out the full range of cultural
operations. The difference between income and costs
is defined as the net margin in this study. This net
margin is not directly comparable to the gross margin
calculations published by Lang (2002), for example,
as it includes items such as the costs of ploughing and
tractor hoeing.
Yield data are not collected on an individual field
basis in the UK, so yield results cannot be associated
with cultural practices in the crop production survey
carried out by British Sugar. Instead we have had to
assume an average yield for each scenario. The
weighted average of these yields is 52 adjusted t ha�1
J. Tzilivakis et al. / Agriculture, Ecosystems and Environment 107 (2005) 341–358348
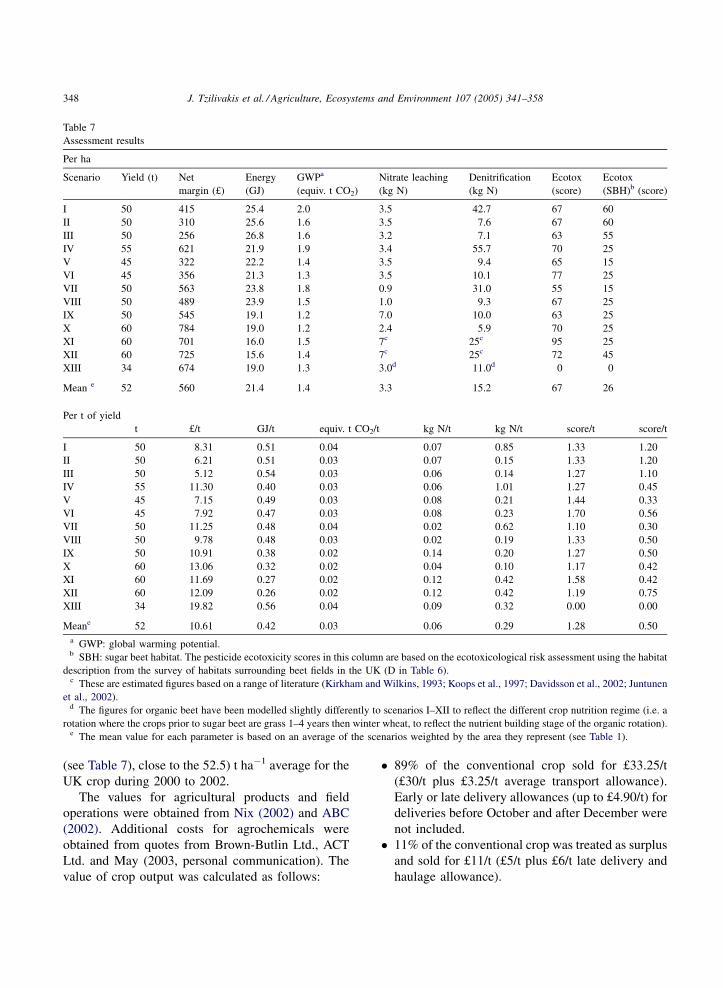
Table 7
Assessment results
Per ha
Scenario Yield (t) Net
margin (£)
Energy
(GJ)
GWPa
(equiv. t CO2)
Nitrate leaching
(kg N)
Denitrification
(kg N)
Ecotox
(score)
Ecotox
(SBH)b (score)
I 50 415 25.4 2.0 3.5 42.7 67 60
II 50 310 25.6 1.6 3.5 7.6 67 60
III 50 256 26.8 1.6 3.2 7.1 63 55
IV 55 621 21.9 1.9 3.4 55.7 70 25
V 45 322 22.2 1.4 3.5 9.4 65 15
VI 45 356 21.3 1.3 3.5 10.1 77 25
VII 50 563 23.8 1.8 0.9 31.0 55 15
VIII 50 489 23.9 1.5 1.0 9.3 67 25
IX 50 545 19.1 1.2 7.0 10.0 63 25
X 60 784 19.0 1.2 2.4 5.9 70 25
XI 60 701 16.0 1.5 7c 25c 95 25
XII 60 725 15.6 1.4 7c 25c 72 45
XIII 34 674 19.0 1.3 3.0d 11.0d 0 0
Mean e 52 560 21.4 1.4 3.3 15.2 67 26
Per t of yield
t £/t GJ/t equiv. t CO2/t kg N/t kg N/t score/t score/t
I 50 8.31 0.51 0.04 0.07 0.85 1.33 1.20
II 50 6.21 0.51 0.03 0.07 0.15 1.33 1.20
III 50 5.12 0.54 0.03 0.06 0.14 1.27 1.10
IV 55 11.30 0.40 0.03 0.06 1.01 1.27 0.45
V 45 7.15 0.49 0.03 0.08 0.21 1.44 0.33
VI 45 7.92 0.47 0.03 0.08 0.23 1.70 0.56
VII 50 11.25 0.48 0.04 0.02 0.62 1.10 0.30
VIII 50 9.78 0.48 0.03 0.02 0.19 1.33 0.50
IX 50 10.91 0.38 0.02 0.14 0.20 1.27 0.50
X 60 13.06 0.32 0.02 0.04 0.10 1.17 0.42
XI 60 11.69 0.27 0.02 0.12 0.42 1.58 0.42
XII 60 12.09 0.26 0.02 0.12 0.42 1.19 0.75
XIII 34 19.82 0.56 0.04 0.09 0.32 0.00 0.00
Meane 52 10.61 0.42 0.03 0.06 0.29 1.28 0.50
a GWP: global warming potential.b SBH: sugar beet habitat. The pesticide ecotoxicity scores in this column are based on the ecotoxicological risk assessment using the habitat
description from the survey of habitats surrounding beet fields in the UK (D in Table 6).c These are estimated figures based on a range of literature (Kirkham and Wilkins, 1993; Koops et al., 1997; Davidsson et al., 2002; Juntunen
et al., 2002).d The figures for organic beet have been modelled slightly differently to scenarios I–XII to reflect the different crop nutrition regime (i.e. a
rotation where the crops prior to sugar beet are grass 1–4 years then winter wheat, to reflect the nutrient building stage of the organic rotation).e The mean value for each parameter is based on an average of the scenarios weighted by the area they represent (see Table 1).
(see Table 7), close to the 52.5) t ha�1 average for the
UK crop during 2000 to 2002.
The values for agricultural products and field
operations were obtained from Nix (2002) and ABC
(2002). Additional costs for agrochemicals were
obtained from quotes from Brown-Butlin Ltd., ACT
Ltd. and May (2003, personal communication). The
value of crop output was calculated as follows:
� 8
9% of the conventional crop sold for £33.25/t(£30/t plus £3.25/t average transport allowance).
Early or late delivery allowances (up to £4.90/t) for
deliveries before October and after December were
not included.
� 1
1% of the conventional crop was treated as surplusand sold for £11/t (£5/t plus £6/t late delivery and
haulage allowance).
J. Tzilivakis et al. / Agriculture, Ecosystems and Environment 107 (2005) 341–358 349
� 1
00% of the organic crop sold for £51.5/t(excluding transport allowance). This assumes that
the transport costs from the farm to the Newark
factory (the only factory to process organic beet) are
paid in full by the processor (ABC, 2002).
The average value of the conventional crop was £3-
0.80/t, very close to the average value of £31/t achieved
by growers in Eastern England in 2001 (Lang, 2002).
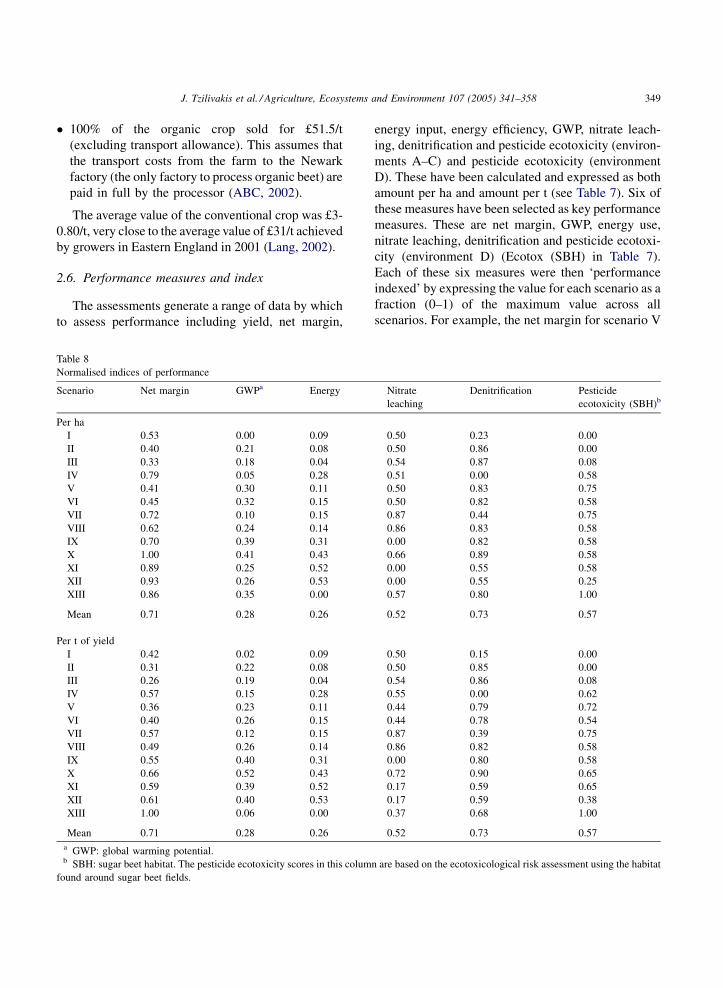
2.6. Performance measures and index
The assessments generate a range of data by which
to assess performance including yield, net margin,
Table 8
Normalised indices of performance
Scenario Net margin GWPa Energy
Per ha
I 0.53 0.00 0.09
II 0.40 0.21 0.08
III 0.33 0.18 0.04
IV 0.79 0.05 0.28
V 0.41 0.30 0.11
VI 0.45 0.32 0.15
VII 0.72 0.10 0.15
VIII 0.62 0.24 0.14
IX 0.70 0.39 0.31
X 1.00 0.41 0.43
XI 0.89 0.25 0.52
XII 0.93 0.26 0.53
XIII 0.86 0.35 0.00
Mean 0.71 0.28 0.26
Per t of yield
I 0.42 0.02 0.09
II 0.31 0.22 0.08
III 0.26 0.19 0.04
IV 0.57 0.15 0.28
V 0.36 0.23 0.11
VI 0.40 0.26 0.15
VII 0.57 0.12 0.15
VIII 0.49 0.26 0.14
IX 0.55 0.40 0.31
X 0.66 0.52 0.43
XI 0.59 0.39 0.52
XII 0.61 0.40 0.53
XIII 1.00 0.06 0.00
Mean 0.71 0.28 0.26
a GWP: global warming potential.b SBH: sugar beet habitat. The pesticide ecotoxicity scores in this colum
found around sugar beet fields.
energy input, energy efficiency, GWP, nitrate leach-
ing, denitrification and pesticide ecotoxicity (environ-
ments A–C) and pesticide ecotoxicity (environment
D). These have been calculated and expressed as both
amount per ha and amount per t (see Table 7). Six of
these measures have been selected as key performance
measures. These are net margin, GWP, energy use,
nitrate leaching, denitrification and pesticide ecotoxi-
city (environment D) (Ecotox (SBH) in Table 7).
Each of these six measures were then ‘performance
indexed’ by expressing the value for each scenario as a
fraction (0–1) of the maximum value across all
scenarios. For example, the net margin for scenario V
Nitrate
leaching
Denitrification Pesticide
ecotoxicity (SBH)b
0.50 0.23 0.00
0.50 0.86 0.00
0.54 0.87 0.08
0.51 0.00 0.58
0.50 0.83 0.75
0.50 0.82 0.58
0.87 0.44 0.75
0.86 0.83 0.58
0.00 0.82 0.58
0.66 0.89 0.58
0.00 0.55 0.58
0.00 0.55 0.25
0.57 0.80 1.00
0.52 0.73 0.57
0.50 0.15 0.00
0.50 0.85 0.00
0.54 0.86 0.08
0.55 0.00 0.62
0.44 0.79 0.72
0.44 0.78 0.54
0.87 0.39 0.75
0.86 0.82 0.58
0.00 0.80 0.58
0.72 0.90 0.65
0.17 0.59 0.65
0.17 0.59 0.38
0.37 0.68 1.00
0.52 0.73 0.57
n are based on the ecotoxicological risk assessment using the habitat
J. Tzilivakis et al. / Agriculture, Ecosystems and Environment 107 (2005) 341–358350
would score 0.41 (i.e. 322/784). For the parameters
where the smallest figure is desirable (GWP, energy
efficiency, leaching, denitrification and pesticide
ecotoxicity) the inverse is calculated (i.e. 1 minus
the fraction of the maximum). This process generates a
normalised set of performance scores as shown in
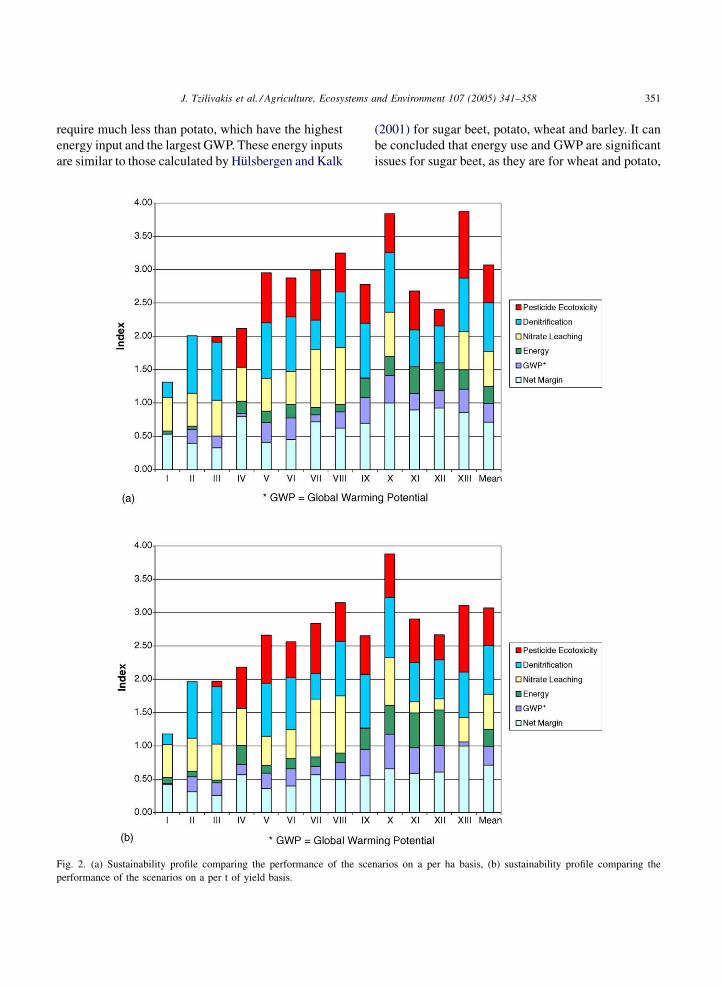
Table 8. Summing and then plotting all the scores
identifies the best performing scenario overall, i.e. the
scenario with the highest index, on a per ha and per t
basis (Fig. 2(a and b), respectively).
A mean value was calculated for all the assessment
results (Table 7) and performance measures (Table 8).
This is an average of the values in the scenarios
weighted by the area of the sugar beet production they
represent (see Table 1). This indicates how national
sugar beet production compares with the best and
worst scenarios in this study.
2.7. Comparison with other crops
The performance index is a mechanism for
comparing sugar beet production scenarios, but it
cannot be used to compare sugar beet with other crops.
Instead, these comparisons have to be made for each of
the performance measures in turn and in most
instances on a per ha basis. The figures for the other
crops were obtained from those calculated for another
study (DEFRA, 2003b) using the same techniques
described here, but using fewer scenarios. Where
appropriate, figures from other studies were also
included in the comparison.
3. Results
3.1. Overview
Table 7 shows the results of the assessments made
on the 13 scenarios. The mean values (and variation
between the scenarios) on a per ha basis were a yield
of 52 t (45–60 t), net margin of £560 (£256–784),
consumption of 21.4 GJ of energy (15.6–26.8 GJ),
emission of 1.4 equiv. t CO2 (1.2–2.0 equiv. t CO2),
3.3 kg N leached (0.9–7.0 kg N), 15.2 kg N lost to
denitrification (5.9–55.7 kg N) and a pesticide
ecotoxicity score of 26 (0–60). Table 8 shows the
normalised performance scores for the key measures,
which have been plotted in Fig. 2(a and b).
Scenario X is the best all round performer on both a
per t and a per ha basis. It is one of the highest yielding,
with the best net margin, smallest GWP and least
denitrification. Its energy efficiency (GJ/t) is also good,
nitrate leaching losses are small and the ecotoxicolo-
gical effects from the pesticides are minimal. Other
scenarios perform better in relation to pesticide
ecotoxicity, energy input efficiency and leaching, but
they perform less well in other areas. Scenario XIII, the
organic scenario, performed well on a per ha basis,
comparable to scenario X. However, on a per t basis it is
penalised by its low yield (34 t ha�1), particularly with
respect to energy use and GWP. Scenario I performed
the least well overall. It is not the worst in all the
categories, only in pesticide ecotoxicity and GWP, but
it does not do well in any category. The net margin is
slightly below average, the energy efficiency is low,
nitrate leaching is average and denitrification is one of
the highest (second only to scenario IV).
3.2. Interpretation of results and comparison with
other crops
3.2.1. Net margin
The net margin calculated for UK sugar beet
production (£560 ha�1, Table 7) compares favourably
with the enterprise margins for growers with near-
average yields in British Sugar’s crop profitability
study in 2002 (£508 ha�1) (Bee and Limb, 2003). Net
margins or enterprise margins are seldom published,
so it is not possible to compare these sugar beet values
to those for other crops. However, in our case it is more
important to note that the scenarios that we have
constructed do reflect closely the economics of real
sugar beet production in the UK. A surprising feature
was the profitability of the organic scenario (XIII),
despite its small yield. The profitability of real organic
crops depends heavily on the weed control costs. The
cultivation and weed control programme in this study
cost approximately £600 ha�1.
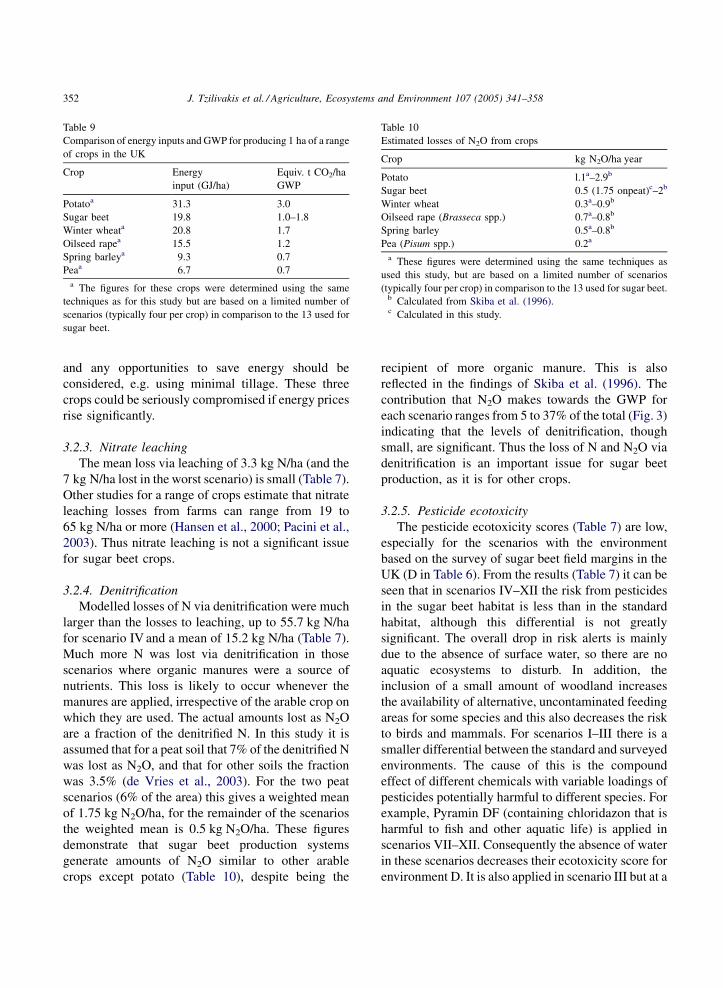
3.2.2. Energy and GWP
Energy input for the sugar beet crop, averaged
across all scenarios, was 21.4 or 19.8 GJ/ha if
transport to the factory is excluded. Table 9 compares
energy inputs and GWP for a range of crops grown in
the UK, including sugar beet. Sugar beet and winter
wheat require similar amounts of energy but both
J. Tzilivakis et al. / Agriculture, Ecosystems and Environment 107 (2005) 341–358 351
require much less than potato, which have the highest
energy input and the largest GWP. These energy inputs
are similar to those calculated by Hulsbergen and Kalk
Fig. 2. (a) Sustainability profile comparing the performance of the sce
performance of the scenarios on a per t of yield basis.
(2001) for sugar beet, potato, wheat and barley. It can
be concluded that energy use and GWP are significant
issues for sugar beet, as they are for wheat and potato,
narios on a per ha basis, (b) sustainability profile comparing the
J. Tzilivakis et al. / Agriculture, Ecosystems and Environment 107 (2005) 341–358352
Table 10
Estimated losses of N2O from crops
Crop kg N2O/ha year
Potato l.1a–2.9b
Sugar beet 0.5 (1.75 onpeat)c–2b
Winter wheat 0.3a–0.9b
Oilseed rape (Brasseca spp.) 0.7a–0.8b
Spring barley 0.5a–0.8b
Pea (Pisum spp.) 0.2a
a These figures were determined using the same techniques as
used this study, but are based on a limited number of scenarios
(typically four per crop) in comparison to the 13 used for sugar beet.b Calculated from Skiba et al. (1996).c Calculated in this study.
Table 9
Comparison of energy inputs and GWP for producing 1 ha of a range
of crops in the UK
Crop Energy
input (GJ/ha)
Equiv. t CO2/ha
GWP
Potatoa 31.3 3.0
Sugar beet 19.8 1.0–1.8
Winter wheata 20.8 1.7
Oilseed rapea 15.5 1.2
Spring barleya 9.3 0.7
Peaa 6.7 0.7
a The figures for these crops were determined using the same
techniques as for this study but are based on a limited number of
scenarios (typically four per crop) in comparison to the 13 used for
sugar beet.
and any opportunities to save energy should be
considered, e.g. using minimal tillage. These three
crops could be seriously compromised if energy prices
rise significantly.
3.2.3. Nitrate leaching
The mean loss via leaching of 3.3 kg N/ha (and the
7 kg N/ha lost in the worst scenario) is small (Table 7).
Other studies for a range of crops estimate that nitrate
leaching losses from farms can range from 19 to
65 kg N/ha or more (Hansen et al., 2000; Pacini et al.,
2003). Thus nitrate leaching is not a significant issue
for sugar beet crops.
3.2.4. Denitrification
Modelled losses of N via denitrification were much
larger than the losses to leaching, up to 55.7 kg N/ha
for scenario IV and a mean of 15.2 kg N/ha (Table 7).
Much more N was lost via denitrification in those
scenarios where organic manures were a source of
nutrients. This loss is likely to occur whenever the
manures are applied, irrespective of the arable crop on
which they are used. The actual amounts lost as N2O
are a fraction of the denitrified N. In this study it is
assumed that for a peat soil that 7% of the denitrified N
was lost as N2O, and that for other soils the fraction
was 3.5% (de Vries et al., 2003). For the two peat
scenarios (6% of the area) this gives a weighted mean
of 1.75 kg N2O/ha, for the remainder of the scenarios
the weighted mean is 0.5 kg N2O/ha. These figures
demonstrate that sugar beet production systems
generate amounts of N2O similar to other arable
crops except potato (Table 10), despite being the
recipient of more organic manure. This is also
reflected in the findings of Skiba et al. (1996). The
contribution that N2O makes towards the GWP for
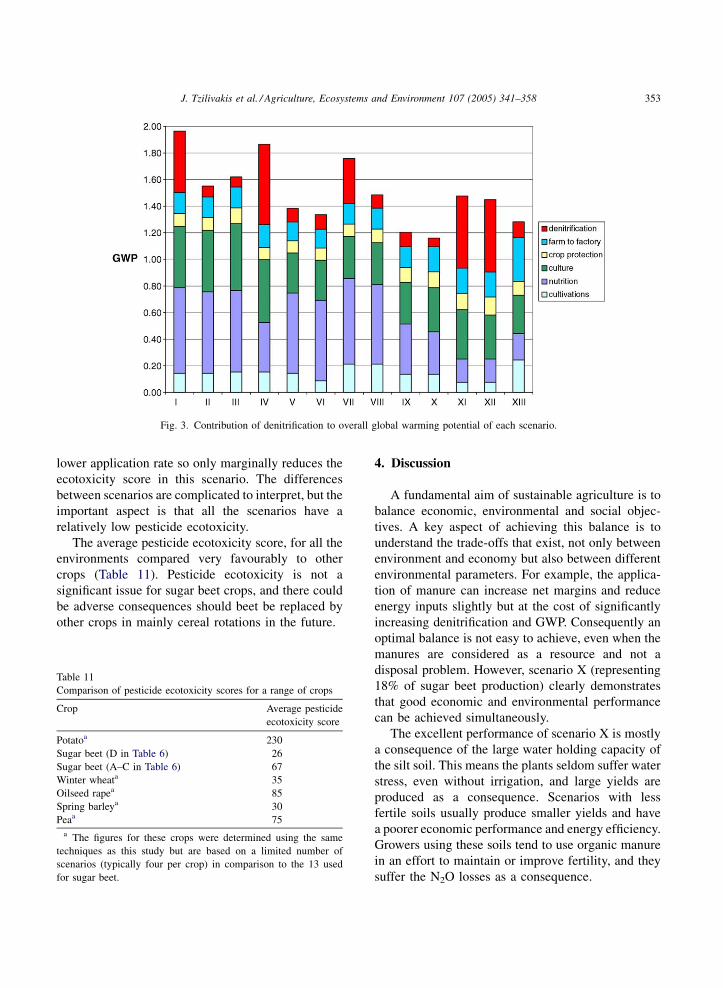
each scenario ranges from 5 to 37% of the total (Fig. 3)
indicating that the levels of denitrification, though
small, are significant. Thus the loss of N and N2O via
denitrification is an important issue for sugar beet
production, as it is for other crops.
3.2.5. Pesticide ecotoxicity
The pesticide ecotoxicity scores (Table 7) are low,
especially for the scenarios with the environment
based on the survey of sugar beet field margins in the
UK (D in Table 6). From the results (Table 7) it can be
seen that in scenarios IV–XII the risk from pesticides
in the sugar beet habitat is less than in the standard
habitat, although this differential is not greatly
significant. The overall drop in risk alerts is mainly
due to the absence of surface water, so there are no
aquatic ecosystems to disturb. In addition, the
inclusion of a small amount of woodland increases
the availability of alternative, uncontaminated feeding
areas for some species and this also decreases the risk
to birds and mammals. For scenarios I–III there is a
smaller differential between the standard and surveyed
environments. The cause of this is the compound
effect of different chemicals with variable loadings of
pesticides potentially harmful to different species. For
example, Pyramin DF (containing chloridazon that is
harmful to fish and other aquatic life) is applied in
scenarios VII–XII. Consequently the absence of water
in these scenarios decreases their ecotoxicity score for
environment D. It is also applied in scenario III but at a
J. Tzilivakis et al. / Agriculture, Ecosystems and Environment 107 (2005) 341–358 353
Fig. 3. Contribution of denitrification to overall global warming potential of each scenario.
lower application rate so only marginally reduces the
ecotoxicity score in this scenario. The differences
between scenarios are complicated to interpret, but the
important aspect is that all the scenarios have a
relatively low pesticide ecotoxicity.
The average pesticide ecotoxicity score, for all the
environments compared very favourably to other
crops (Table 11). Pesticide ecotoxicity is not a
significant issue for sugar beet crops, and there could
be adverse consequences should beet be replaced by
other crops in mainly cereal rotations in the future.
Table 11
Comparison of pesticide ecotoxicity scores for a range of crops
Crop Average pesticide
ecotoxicity score
Potatoa 230
Sugar beet (D in Table 6) 26
Sugar beet (A–C in Table 6) 67
Winter wheata 35
Oilseed rapea 85
Spring barleya 30
Peaa 75
a The figures for these crops were determined using the same
techniques as this study but are based on a limited number of
scenarios (typically four per crop) in comparison to the 13 used
for sugar beet.
4. Discussion
A fundamental aim of sustainable agriculture is to
balance economic, environmental and social objec-
tives. A key aspect of achieving this balance is to
understand the trade-offs that exist, not only between
environment and economy but also between different
environmental parameters. For example, the applica-
tion of manure can increase net margins and reduce
energy inputs slightly but at the cost of significantly
increasing denitrification and GWP. Consequently an
optimal balance is not easy to achieve, even when the
manures are considered as a resource and not a
disposal problem. However, scenario X (representing
18% of sugar beet production) clearly demonstrates
that good economic and environmental performance
can be achieved simultaneously.
The excellent performance of scenario X is mostly
a consequence of the large water holding capacity of
the silt soil. This means the plants seldom suffer water
stress, even without irrigation, and large yields are
produced as a consequence. Scenarios with less
fertile soils usually produce smaller yields and have
a poorer economic performance and energy efficiency.
Growers using these soils tend to use organic manure
in an effort to maintain or improve fertility, and they
suffer the N2O losses as a consequence.
J. Tzilivakis et al. / Agriculture, Ecosystems and Environment 107 (2005) 341–358354
The balance of economic, environmental and social
objectives is dynamic in sustainable agriculture, the
‘goal posts’ are always moving. This means there is
always scope to improve the environmental perfor-
mance of a production system, essentially optimising
the production process to meet the current objectives.
This is discussed below with respect to the scenarios
examined in this study and to sugar beet production as
whole.
4.1. Energy and GWP
There is a range in energy efficiency amongst the
scenarios from a very efficient 0.26 GJ/t in scenario
XII to 0.56 GJ/t in scenario XIII. However, these two
scenarios represent only a small fraction of the total
area of sugar beet. If we limit the scenarios to those
that are more representative (10% or more of the sugar
beet area) the range is limited to 0.32–0.49 GJ/t. This
mostly reflects the variation in yield (45–60 t) but also
the amount of energy input.
One of the largest single energy inputs is crop
nutrition, particularly the manufacture of inorganic
fertilisers. Crop nutrition accounts for 18–50% of the
total energy input across the scenarios, and accounts
for 12–43% of GWP. Fertiliser manufacture is
becoming more energy efficient (Jenssen and Kong-
shaug, 2003) but this process is beyond the control of
farmer. However, 28–58% of energy inputs are
directly within the farmer’s control and account for
30–45% of GWP. If denitrification is also included
within the control of the farm then the figures rise to
38–69% of GWP. Clearly any scope to improve the
efficiency of farm and field activities could be
beneficial for energy efficiency and GWP. This is
illustrated in the minimal tillage scenario (VI), which
had the smallest energy input. Although scenario VI
only represents 2% of the sugar beet area, its overall
performance is roughly comparable with scenarios V,
VII, VIII and IX, which represent 64% of the area.
Irrigation is a large energy consumer (10% of total
energy inputs for scenarios I, III and IV). However, it
is not widely used for beet in the UK, representing less
than 10% of the area.
This study does not include calculations for each
scenario of the C balance (the amount of CO2 released
while growing the crop compared to the amount fixed
in the crop by photosynthesis). However, if we assume
that the amount of C fixed per t of beet is the same for
all the scenarios then we can use the GWP per t of
yield (see Table 7) as an indicator of the C balance.
This does not show the net C balance, but does
highlight the relative GWP burden of each scenario
(i.e. the equiv. t of CO2 emitted per t of yield).
Scenario X performs well with the largest yield and
lowest GWP. The manure applied in scenarios I, IV
and VII, consequent denitrification and the impact on
GWP can also be seen (Table 7), as these scenarios
have the highest GWP burden per t of yield. The low
yield (34 t/ha) of the organic crop, scenario XIII,
results in a high GWP burden per t.
4.2. Nitrate leaching and denitrification
The study showed that the risk of nitrate leaching
from sugar beet crops is minimal in comparison to
other crops and farming systems, and there is little
scope to reduce it further.
Denitrification was estimated to be a larger route
for the loss of nitrogen than leaching. In most
scenarios losses were still small (5.9–25 kg N/ha).
However, when organic manures were applied, losses
were significantly increased to the extent that the
fraction lost as nitrous oxide was making a significant
contribution to the total GWP of the scenario (up 37%
of GWP). Of the organic manure scenarios, scenario
VII is the most significant as it represents 12% of the
sugar beet area: it lost 31 kg N/ha. Scenarios I and IV,
representing 7% of the sugar beet area lost 42.7 and
55.7 kg N/ha, respectively. Additionally, about one-
third of beet crops on clay loam soils also received
manure and this is likely to result in a similar amount
of denitrification. Because the land destined to grow
sugar beet is fallow for a long period after cereal
harvest, it represents what appears to be an ideal
opportunity to apply the manure. This manure is a
cheap source of nutrients and can help improve soil
organic matter content and structure and reduce
erosion in vulnerable areas, but clearly there are some
negative environmental side effects, in terms of
denitrification and GWP. There may be scope to
reduce N losses through improved application tech-
niques or through application to other crops in the
rotation, but these will have to be assessed for their
cost and energy consumption to evaluate if any overall
improvements can be made.
J. Tzilivakis et al. / Agriculture, Ecosystems and Environment 107 (2005) 341–358 355
4.3. Pesticide ecotoxicity
There are some aspects of environmental perfor-
mance that could be improved with regard to pesticide
use, although the benefits are likely to be marginal. Of
the many active substances applied to the scenarios
(Table 4), aldicarb is a key cause of concern in
scenarios I–VI. However, an on-going EU review,
which was established by Council Directive 91/414/
EEC and subsequent regulations, failed to grant Annex
1 status to aldicarb (except for some essential uses).
Consequently the approval of aldicarb for use on sugar
beet in the UK was revoked on September 18, 2003.
However, aldicarb is likely to be replaced by other
granular carbamate pesticides whose environmental
profile is similar but less toxic. Imadacloprid raises
orange alerts (but no red alerts) across scenarios VII–
XII (81% of the area). To avoid its use would bring a
broad marginal benefit, but this benefit would have to
be traded against a probable loss in net margin and
greatly increased use of insecticide sprays: these sprays
could represent a significant risk. Metamitron raises a
concern in scenarios I, II, III, XI and XII, which
represent 12% of the beet area. A similar situation
exists for chloridazon, which raises orange alerts in
scenarios VII–X (75% of the area). A reduction in the
use of metamitron would tend to increase the use of
chloridazon. The use of paraquat and diquat (PDQ) to
control large weeds in the seed bed raised red and
orange alerts for mammals and birds, but in a random
survey of farms in 2002, paraquat and diquat was used
on less than 1% of the crop (Garthwaite et al., 2003).
Additionally, PDQ is used in March and April when
there is almost no foliage in the field and this reduces
the risk of poisoning hares (which are particularly
susceptible to paraquat). The use of PDQ could be
replaced by use of glyphosate, and this would improve
the pesticide ecotoxicity risk.
4.4. Economics
This study shows that, even with near-average
yields, there can be a wide range in economic returns
from growing sugar beet, with net margins ranging
from £256 up to £784/ha. Clearly to be sustainable
good environmental performance must be achieved
within the constraints of economic viability. If the crop
does not perform well economically then it is unlikely
to be grown and the land may be put to an alternative
use that could have a worse environmental perfor-
mance. If, as a consequence of change to the EU Sugar
Regime (Council Regulation (EC) No 1260/2001),
sugar beet becomes less profitable, it is likely to be
replaced in the UK by either another break crop or by
more winter wheat. The replacement crop will
inevitably have its own set of environmental impacts,
which may or may not be better than those from sugar
beet (as discussed in Section 3.2). Additionally, if beet
is replaced by wheat, the proportion of first wheats in
arable rotations could fall and consequently increase
the N fertiliser and pesticide usage of that crop,
worsening its ecotoxicity profile and energy efficiency.
4.5. Limitations of the study
This study has compared different sugar beet
production systems and, to a limited extent, different
crops. However, it has not addressed the issue of what
level of environmental burden is sustainable. Except in
extreme catastrophic circumstances, e.g. massive soil
loss, the sustainability thresholds are not known
(Tzilivakis et al., 1999). Consequently in this study we
were limited to analysing impacts on the basis of what
is desirable, i.e. we know that it is desirable to reduce
greenhouse gas emissions, losses of nutrients and
energy inputs and undesirable to expose benign and
beneficial species to toxic substances. Methods to
determine the sustainability of human activities are
needed and are still the subject of research (Pacini
et al., 2003; Haberl et al., 2004; Pope et al., 2004).
The study used the most up-to-date techniques to
assess impacts of energy, pesticide and nutrient use by
the crop on the environment. However, some important
topics were excluded, i.e. impacts on biodiversity and
on soil quality. Topics like these still lack objective
assessment and/or modelling frameworks (Perry et al.,
2004; Tzilivakis et al., 2005), hence their exclusion
from this study. Loss of nutrients via surface run-off was
another aspect not included within this study due to the
lack of a suitable modelling framework. Some
modelling frameworks (Lewis and McGechan, 1999;
Lewis et al., 2003b) are under development and these
may offer practical assessment tools to address this
issue in the future. Loss of N as a consequence of soil
erosion from sugar beet fields is anticipated to be very
small. About 15% of beet fields, mostly on sandy soils,
J. Tzilivakis et al. / Agriculture, Ecosystems and Environment 107 (2005) 341–358356
suffer from a small amount of water erosion (median
rate about 1 m3/ha), but movement out of the field is
very rare (Evans, 2002).
The assessment of genetically modified (GM)
herbicide tolerant sugar beet would have been a useful
addition to this study to compare its relative
environmental performance with the conventional
crop. However, a GM scenario was not included as the
farm scale evaluations (Firbank et al., 2003) were still
in progress and important environmental impact data
were not available. The possible impact of GM beet on
crop economics was described by May (2003) and its
impact on weed flora and indirect effects on
arthropods have been explored (Squire et al., 2003).
Since this study, Bennett et al. (2004) have published
work in which they used a life cycle assessment (LCA)
approach to compare GM herbicide tolerant sugar beet
with conventionally grown sugar beet. They suggest
that growing the GM crop would be less harmful to the
environment and human health than growing the
conventional crop, largely due to smaller emissions
from herbicide manufacture and field operations. The
techniques Bennett et al. (2004) used for calculating
energy and GWP were similar to those presented in
this paper and consequently the results are compar-
able. However, the techniques used for ecotoxicity and
nutrient loss were completely different and so are not
comparable. For example, their ecotoxicity calcula-
tion is a generic method within the PEMS LCA
software (PIRA, 1998) based on emissions of the
active substances and their mammalian toxicity and
expressed as kg of chromium (Cr) equivalent.
Whereas in this study, p-EMA is specifically designed
for agriculture and makes use of site-specific
information (such as habitats and soil type) to
calculate exposure and then ecotoxicity to a range
of taxa (Hart et al., 2003).
5. Conclusions
The sugar beet crop is grown in the UK using a
variety of techniques in different locations. Economic
returns from different systems of production can vary,
as can the impacts on the environment. This study has
shown that the detrimental impacts on the environment
from sugar beet production are limited, especially when
the poorest overall performances (see Figs. 2(a and b))
(scenarios I–IV) can be discounted as they represent
only 10% of the area of sugar beet production. However,
most importantly, the study has illustrated that good
economic performance can go hand in hand with good
environmental performance. In the case of sugar beet,
under the assumptions made within the study, a large
yield could be obtained whilst minimising environ-
mental impact. This is clearly demonstrated in scenario
X which represents 18% of the sugar beet area and
which achieved the best economic and environmental
performance. This was closely followed by scenarios
IX, VII and VIII (representing 57%) whose overall
performance was similar to the organic scenario (XIII)
on a per t basis (see Fig. 2(b)). On a per ha basis the
organic scenario (XIII) was equal to scenario X (see
Fig. 2(a)). Although the organic scenario had slightly
lower economic performance than scenario X, its
overall environmental burden on a per ha basis was the
smallest of all the scenarios. However, it is salutary to
note that organic beet production in the UK has now
ceased because it was not economically viable for the
sugar processor.
There is scope to undertake a more holistic study.
The boundaries of the study could be expanded to
include a life cycle assessment (LCA) of sugar produc-
tion. It would then be possible to compare the impacts of
producing sugar from beet and cane. Similarly, sugar
beet could be compared to other crops, such as wheat
and oilseed rape, for the production of biofuels (ethanol
from sugar beet and wheat and biodiesel from oilseed
rape). Both these issues are important for sustainable
agriculture and for the sustainability of society as
whole. Consequently, studies such as this one provide
an important foundation for assessing the sustainability
of an important commodity and renewable fuel.
Acknowledgement
This work was funded by the British Beet Research
Organisation (BBRO).
References
ABC, 2002. The Agricultural Budgeting and Costing Book Number
55 (November 2002). Agro Business Consultants Ltd., Melton
Mowbray, Leicestershire.
J. Tzilivakis et al. / Agriculture, Ecosystems and Environment 107 (2005) 341–358 357
Bee, P., Limb, R., 2003. Crop profitability – 2003 update. Br. Sugar
Beet Rev. 71 (2), 32–35.
Bennett, R., Phipps, R., Strange, A., Grey, P., 2004. Environmental
and human health impacts of growing genetically modified
herbicide-tolerant sugar beet: a life-cycle assessment. Plant
Biotechnol. J. 2, 273–278.
Bradbury, B.J., Whitmore, A.P., Hart, P.B.S., Jenkinson, D.S., 1993.
Modelling the fate of nitrogen in crop and soil in the years
following application of 15N-labelled fertiliser to winter wheat.
J. Agric. Sci. Camb. 121, 363–379.
Brown, C.D., Hart, A., Lewis, K.A., Dubus, I.G., 2003. p-EMA (I):
simulating the environmental fate of pesticides for a farm-level
risk assessment system. Agronomie 23, 67–74.
Council Directive 91/414/EEC concerning the placing of plant
protection products on the market. Official Journal of the
European Commission, No. L230/1, 19/08/1991.
Council Regulation (EC) No 1260/2001 on the common organisa-
tion of the markets in the sugar sector. Official Journal of the
European Commission, No. L178/1, 30/06/2001.
Davidsson, T.E., Trepel, M., Schrautzer, J., 2002. Denitrification in
drained and rewetted minerotrophic peat soils in Northern
Germany (Pohnsdorfer Stauung). J. Plant Nutr. Soil Sci. 165,
199–204.
DEFRA, 2002. Working for the Essentials of Life. Department for
the Environment, Food and Rural Affairs (DEFRA).
DEFRA, 2003a. Agriculture in the United Kingdom 2002. The
Stationary Office, London.
DEFRA, 2003b. Investigation of Varietal Characteristics Req-
uired for Sustainable Agriculture. Final Report for project
VS0128 undertaken by NIAB and the University of Hertford-
shire for the Department for Environment, Food and Rural
Affairs.
de Vries, W., Kros, J., Oenema, O., de Klein, J., 2003. Uncertainties
in the fate of nitrogen II: a quantitative assessment of the
uncertainties in major nitrogen fluxes in the Netherlands. Nutr.
Cycl. Agroecosyst. 66, 71–102.
Evans, R., 2002. An alternative way to assess water erosion of
cultivated land – field-based measurements: and analysis of
some results. Appl. Geogr. 22, 187–208.
Firbank, L.G., Heard, M.S., Woiwod, I.P., Hawes, C., Haughton,
A.J., Champion, G.T., Scott, R.J., Hill, M.O., Dewar, A.M.,
Squire, G.R., May, M.J., Brooks, D.R., Bohan, D.A., Daniels,
R.E., Osborne, J.L., Roy, D.B., Black, H.I.J., Rothery, P., Perry,
J.N., 2003. An introduction to the farm-scale evaluations of
genetically modified herbicide-tolerant crops. J. Appl. Ecol. 40,
2–16.
Gabrielle, B., Mary, B., Roche, R., Smith, P., Gosse, G., 2002.
Simulation of C and nitrogen dynamics in arable soils: a
comparison of approaches. Eur. J. Agron. 18, 107–120.
Garthwaite, D.G., Thomas, M.R., Dawson, A., Stoddart, H.,
2003. Pesticide Usage Survey Report 187: Arable Crops in
Great Britain 2002. Central Science Laboratory, York,
108 pp.
Gibbons, J.M., Sparkes, D.L., Wilson, P., Ramsden, S.J., 2005.
Modelling optimal strategies for decreasing nitrate loss with
variation in weather – a farm-level approach. Agric. Syst. 83,
113–134.
Haberl, H., Fischer-Kowalski, M., Krausmann, F., Weisz, H., Wini-
warter, V., 2004. Progress towards sustainability? What the
conceptual framework of material and energy flow accounting
(MEFA) can offer. Land Use Policy 21, 199–213.
Hansen, B., Kristensen, E.S., Grant, R., Hogh-Jensen, H., Simmels-
gaard, S.E., Olesen, J.E., 2000. Nitrogen leaching from conven-
tional versus organic farming systems – a systems modelling
approach. Eur. J. Agron. 13, 65–82.
Hart, A., Lewis, K.A., Brown, C.D., 2003. p-EMA (II): evaluating
ecological risks of pesticides for a farm-level risk assessment
system. Agronomie 23, 75–84.
Houghton, J.T., Miera Filho, J.G., Callander, B.A., Harris, N.,
Kattenberg, A., Maskell, K., 1996. Climate Change 1995:
The Science of Climate Change, Contribution of Working
Group 1 to the Second Assessment Report of the Intergovern-
mental Panel on Climate Change. Cambridge University Press,
Cambridge.
Hulsbergen, K.J., Kalk, W.D., 2001. Energy balances in different
agricultural systems – can they be improved? In: Proceedings of
the International Fertiliser Symposium, Lisbon, March 5.
Jaggard, K.W., 1992. Remote sensing to forecast yield in England.
In: Proceedings of the 55 Winter Congress of the IIRB, Brussels,
February, pp. 253–260.
Jenssen, T.K., Kongshaug, G., 2003. Energy consumption and
greenhouse gas emissions in fertiliser production. The Interna-
tional Fertiliser Society Proceedings No. 509.
Juntunen, M.L., Hammar, T., Rikala, R., 2002. Leaching of nitrogen
and phosphorus during production of forest seedlings in contain-
ers. J. Environ. Qual. 31, 1868–1874.
Kirkham, F.W., Wilkins, R.J., 1993. Seasonal fluctuations in the
mineral nitrogen content of an undrained wetland peat soil
following differing rates of fertiliser nitrogen application. Agric.
Ecosyst. Environ. 43, 11–29.
Koops, J.G., van Beusichem, M.L., Oenema, O., 1997. Nitrogen loss
from grassland on peat soils through nitrous oxide production.
Plant Soil 188, 119–130.
Lampkin, N., 1994. Organic Farming, 3rd ed. Farming Press
Limited, Ipswich, UK.
Lang, B., 2002. Report on Farming in the Eastern Counties of
England 2001/2002. Department of Land Economy, University
of Cambridge.
Lewis, K.A., Brown, C.D., Hart, A., Tzilivakis, J., 2003a. p-EMA
(III): overview and application of a software system designed to
assess the environmental risk of agricultural pesticides. Agro-
nomie 23, 85–96.
Lewis, D.R., McGechan, M.B., 1999. Watercourse pollution due to
surface runoff following slurry spreading. Part I: calibration of
the soil water simulation model SOIL for fields prone to surface
runoff. J. Agric. Eng. Res. 72, 275–290.
Lewis, D.R., McGechan, M.B., McTaggart, I.P., 2003b. Simulating
field-scale nitrogen management scenarios involving fertiliser
and slurry applications. Agric. Syst. 76, 159–180.
May, M.J., 2003. Economic consequences for UK farmers of
growing GM herbicide tolerant sugar beet. Ann. Appl. Biol.
142, 41–48.
NFU/British Sugar, 2003. Review of the European Sugar Sector –
the position of the UK industry.
J. Tzilivakis et al. / Agriculture, Ecosystems and Environment 107 (2005) 341–358358
Nix, J., 2002. Farm Management Pocketbook, 33rd ed. White Horse
Press, Whistable, UK.
Pacini, C., Wossink, A., Giesen, G., Vazzana, C., Huirne, R., 2003.
Evaluation of sustainability of organic, integrated and conven-
tional farming systems: a farm and field-scale analysis.. Agric.
Ecosyst. Environ. 95, 273–288.
Perry, J., Clark, S., Rothery, P., 2004. Research needs on the design,
analysis and statistical power of studies of the effects of agri-
cultural practices on biodiversity. In: Young, J., Bolger, T., Kull,
T., Tinch, R., Scally, L., Watt, A.D. (Eds.), Sustaining Liveli-
hoods and Biodiversity – Attaining the 2010 Target in the
European Biodiversity Strategy, Report of an Electronic Con-
ference for the European Platform for Biodiversity Research
Strategy, pp. 36.
PIRA, 1998. PEMS Life Cycle Assessment Computer Model. PIRA
International, Leatherhead, Surrey, UK.
Pope, J., Annandale, D., Morrison-Saunders, A., 2004. Conceptua-
lising sustainability assessment. Environ. Impact Assess. Rev.
24, 595–616.
Scott, R.K., Jaggard, K.W., 2000. Impact of weather, agronomy and
breeding on yields of sugar beet grown in the UK sincedkjdot. J.
Agric. Sci. Camb. 134, 341–352.
Skiba, U., McTaggart, I.P., Smith, K.A., Hargreaves, K.J., Fowler,
D., 1996. Estimates of nitrous oxide emissions from soil in the
UK. Energy Conserv. Manage. 37, 1303–1308.
Smith, J.U., Bradbury, N.J., Addiscott, T.M., 1996. SUNDIAL: a
PC-based system for simulating nitrogen dynamics in arable
land. Agron. J. 88, 38–43.
Smith, J.U., Smith, P., Richter, G.M., Agostini, F.A., Welham, S.J.,
2003. Testing the adequacy of measured data for evaluating
nitrogen turnover models by the dot-to-dot method. Eur. J. Soil
Sci. 54, 175–185.
Squire, G.R., Brooks, D.R., Bohan, D.A., Champion, G.T., Daniels,
R.E., Haughton, A.J., Hawes, C., Heard, M.S., Hill, M.O., May,
M.J., Osborne, J.L., Perry, J.N., Roy, D.B., Woiwod, I.P., Fir-
bank, L.G., 2003. On the rationale and interpretation of the farm
scale evaluations of genetically modified herbicide-tolerant
crops.. Phil. Trans. Roy. Soc., Lond. Ser. B 358, 1779–1799.
Turner, R., 1992. Statistics – Who needs them? Br. Sugar Beet Rev.
66, 44–45.
Tzilivakis, J., Broom, C., Lewis, K.A., Tucker, P., Drummond, C.,
Cook, R., 1999. A strategic environmental assessment method
for agricultural policy in the UK. Land Use Policy 16, 223–234.
Tzilivakis, J., Lewis K.A., Williamson, A.R., 2005. A prototype
framework for assessing risks to soil functions. EIA Rev. 25,
181–195.
Tzilivakis, J., Warner, D.J., May, M., Lewis, K.A., Jaggard, K., in
press. An assessment of the energy inputs and greenhouse gas
emissions in sugar beet (Beta vulgaris) production in the UK.
Agric. Syst.