environmental impact assessment caribbean cement …cement.pdf · environmental impact assessment...
TRANSCRIPT
ENVIRONMENTAL IMPACT ASSESSMENT
CARIBBEAN CEMENT COMPANY
EXPANSION AND MODERNISATION PROGRAMME
Submitted to: CARIBBEAN CEMENT COMPANY LIMITED Rock Fort St. Andrew Jamaica
Prepared by: ENVIRONMENTAL SOLUTIONS LTD. 20 West Kings House Road Kingston 10 Jamaica
August 2005
Caribbean Cement Company Expansion EIA
____________________________________________________________________ Environmental Solutions Ltd.
i
EXECUTIVE SUMMARY
The Project
Caribbean Cement Company (Carib Cement) proposes to expand and modernize the plant at
Rockfort, Kingston. The proposed programme is phased over a five-year period, with the largest
component being the clinker production process expansion. This project will involve the installation
of a new dry clinker production line to be constructed over three years. Upon completion, this new
clinker production line will replace the existing wet clinker line. The proposed expansion will take
place within the footprint of the existing plant.
Carib Cement is the sole manufacturer of cement in Jamaica and was the sole supplier until as
recently as 1999. The size of the cement market has grown substantially over the last 10 years:
demand has increased by 52% or 5.1% per annum. The domestic market is conservatively forecast
to grow by approximately 4% per annum from 862,289 tonnes in 2004 to 1,291,167 tonnes in 2010.
Carib Cement presently holds the dominant share of the domestic market and is developing and
implementing strategies to meet this increasing demand and to provide even better service to the
construction industry. The proposed new production line will have a rated capacity of 1.3 million
tonnes per year up from the current 650 thousand tonnes per year produced by the existing plant.
The modernization and expansion of the existing plant is necessary in order to meet the growing
demand for cement in Jamaica as well as the need to reduce fuel consumption, improve production
efficiencies and environmental performance.
Environmental Impact Assessment
In order to determine the environmental variables influencing the project, Carib Cement retained
the firm Environmental Solutions Limited to conduct an Environmental Impact Assessment (EIA) of
the proposed expansion works at the plant in Rockfort Kingston. As an integral part of the EIA the
current system of manufacturing cement was evaluated. Carib Cement also retained Scheiber,
Yonley and Associates, Environmental Consultants, out of Missouri, U.S.A., who are specialists in
the field of air dispersion modelling for Cement Plants.
Cement Manufacturing Process
Caribbean Cement Company Expansion EIA
____________________________________________________________________ Environmental Solutions Ltd.
ii
The production of cement includes mining; crushing and grinding of raw materials (principally
limestone and clay); calcining the materials in a rotary kiln; cooling the resulting clinker; mixing the
clinker with gypsum; and milling, storing and bagging the finished cement. The process results in a
variety of wastes, including dust, which are captured and recycled to the process. The process is
very energy-intensive and there are strong incentives for energy conservation.
Carib Cement operates a dual process cement manufacturing plant, utilising both the wet and dry
process technologies. The dry process, using preheaters and precalciners, is both economically
and environmentally preferable to the wet process because the energy consumption (3,200 kilo
joules per kilogram (kg)) is approximately half of that for the wet process.
Wet Process
The critical manufacturing step, called “pyroprocessing,” takes place in the cement kiln. The
prepared raw feed is pumped into the kiln where it is exposed to gas temperatures starting at
260°C at the elevated feed end to over 1,870°C near the product discharge end. After tumbling
slowly through the kiln, exothermic chemical changes in the burning zone transform the raw
materials to cement clinker, a product physically resembling grey gravel.
The production of clinker in a wet kiln requires that the solid material be heated to approximately
1,400°C to 1,482°C, while the gaseous material reaches a temperature of greater than 1,870°C.
Tricalcium silicate is the major strength-producing constituent of cement, and its formation begins
in the burning zone at material temperatures above 1,400°C. Other clinker compounds important
for the performance of Portland cement are formed by reactions that take place in the burning
zone.
Exhaust gases from the kiln are routed to the air pollution control system and then discharged to
the atmosphere through a stack.
Dry Process
The (kiln 4 line) dry process is described as follows. Initially, the crushed raw materials (raw meal
feed i.e., limestone, clay, ash, sand, and/or iron ore) enter the raw mill to be dried and ground. A
fan draws hot combustion gas from the top of the preheater tower into the raw mill to evaporate
moisture from the raw meal, as it is ground. The prepared raw meal feed is transported to a
blending silo where it is held pending introduction into the pyroprocess.
The dry process, by re-use of the hot gases for drying raw materials and with the use of the vertical
Caribbean Cement Company Expansion EIA
____________________________________________________________________ Environmental Solutions Ltd.
iii
tower for calcining the raw material is very energy efficient. The rapid heating of the raw materials
is the key to the efficiency of the preheater tower. The entrainment of the raw material in the air
stream and collection of the solids through the cyclones transfers heat to the raw materials rapidly
and efficiently. The addition of fuel in the precalciner also prepares the raw material for final
chemical transformation in the rotary kiln. This efficiency is borne by the typical heat requirement
for a preheater/precalciner system that is approximately 3,200 kJ/kg of clinker, compared to about
5,400 kJ/kg of clinker for a wet kiln.
Proposed Project Description
Carib Cement proposes to construct and operate a new dry line production cement facility (kiln 5)
on an existing footprint at the company's facility at Rockfort, as well as modify their existing dry line
(kiln 4) to improve emissions. They will also shutdown the existing kiln 3 wet process line.
The new dry line clinker production facility will be a 2,800-MTPD plant. The proposed upgrade will
increase the capacity of the overall plant by approximately six hundred thousand tonnes of clinker
per year, while utilizing the latest technology and innovation available in the cement industry.
The proposed kiln 5 systems consisting of a vertical roller mill, preheater vessels, calciner, kiln, and
clinker cooler will all use the most recent technology, thus significantly lowering operating costs and
providing the best environmental performance.
Environmental Features of the New Dry Line
The dry line has several built-in pollution control features. These include:
v The use of low NOx burners
v The use of a low NOx calciner.
v Firing of fuel in the riser duct of the preheater /precalciner to reduce NOx emissions.
The decommissioning of the wet line will see significant improvements in:
v Liquid effluent quality
v Water consumption
v Fuel efficiencies
Caribbean Cement Company Expansion EIA
____________________________________________________________________ Environmental Solutions Ltd.
iv
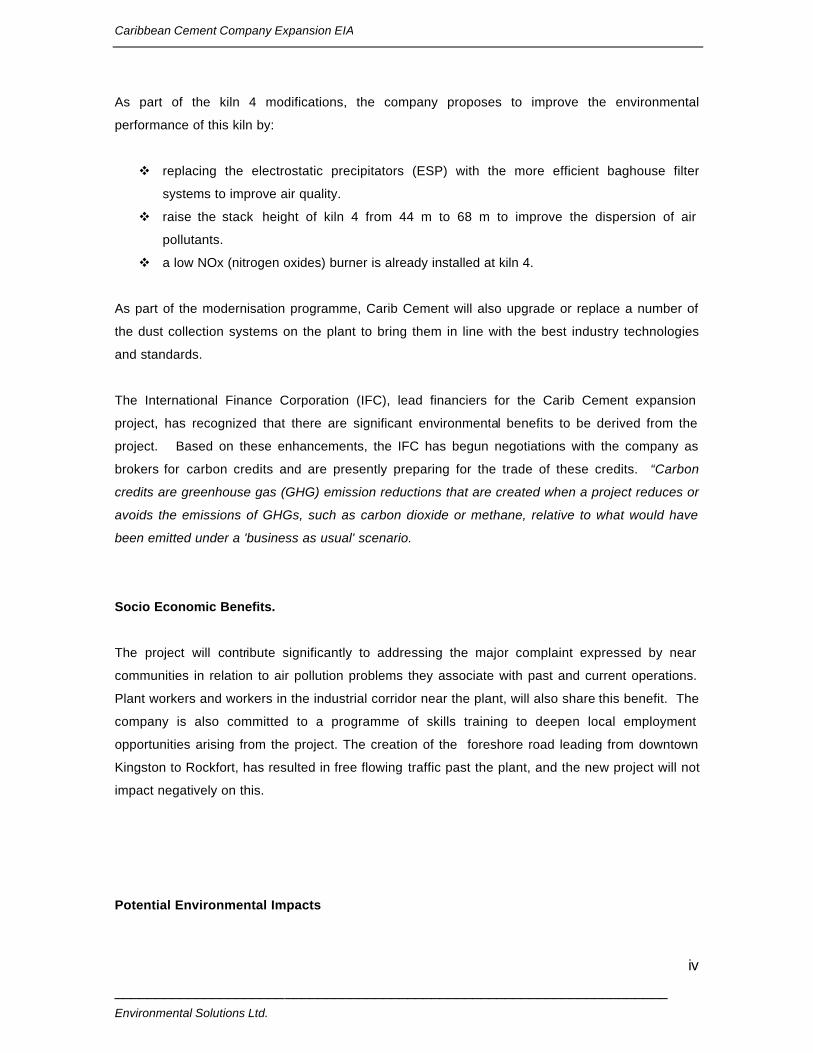
As part of the kiln 4 modifications, the company proposes to improve the environmental
performance of this kiln by:
v replacing the electrostatic precipitators (ESP) with the more efficient baghouse filter
systems to improve air quality.
v raise the stack height of kiln 4 from 44 m to 68 m to improve the dispersion of air
pollutants.
v a low NOx (nitrogen oxides) burner is already installed at kiln 4.
As part of the modernisation programme, Carib Cement will also upgrade or replace a number of
the dust collection systems on the plant to bring them in line with the best industry technologies
and standards.
The International Finance Corporation (IFC), lead financiers for the Carib Cement expansion
project, has recognized that there are significant environmental benefits to be derived from the
project. Based on these enhancements, the IFC has begun negotiations with the company as
brokers for carbon credits and are presently preparing for the trade of these credits. “Carbon
credits are greenhouse gas (GHG) emission reductions that are created when a project reduces or
avoids the emissions of GHGs, such as carbon dioxide or methane, relative to what would have
been emitted under a 'business as usual' scenario.
Socio Economic Benefits.
The project will contribute significantly to addressing the major complaint expressed by near
communities in relation to air pollution problems they associate with past and current operations.
Plant workers and workers in the industrial corridor near the plant, will also share this benefit. The
company is also committed to a programme of skills training to deepen local employment
opportunities arising from the project. The creation of the foreshore road leading from downtown
Kingston to Rockfort, has resulted in free flowing traffic past the plant, and the new project will not
impact negatively on this.
Potential Environmental Impacts
Caribbean Cement Company Expansion EIA
____________________________________________________________________ Environmental Solutions Ltd.
v
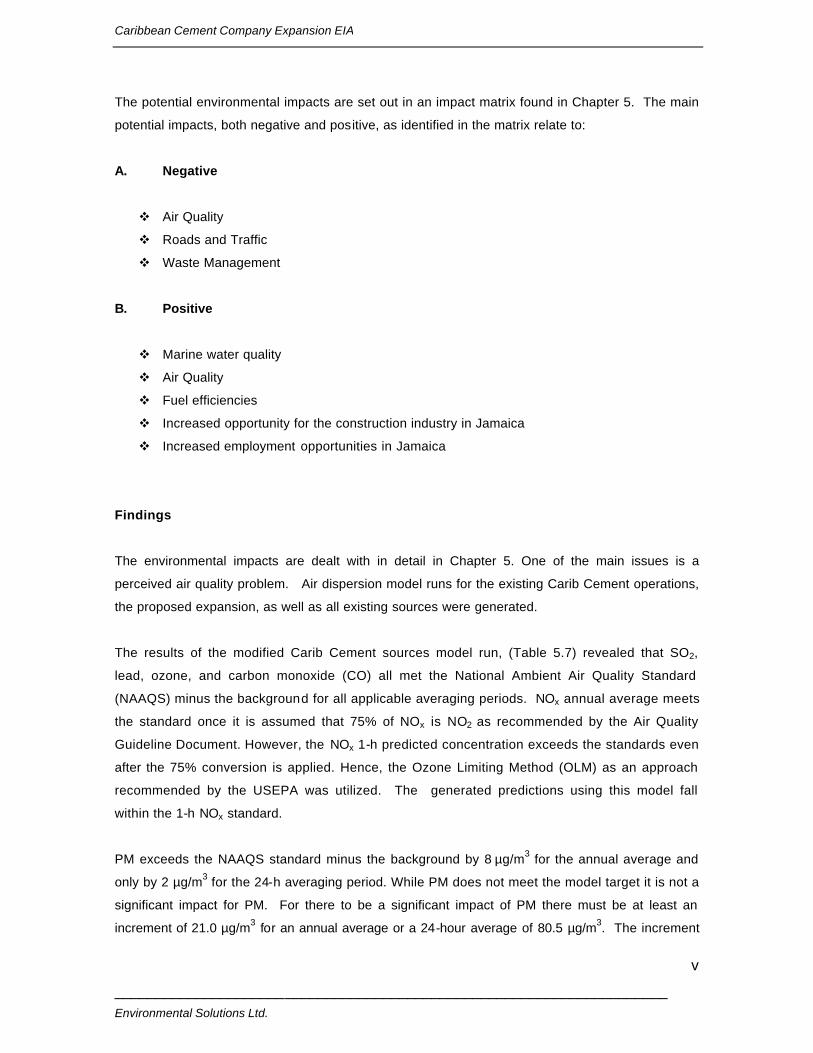
The potential environmental impacts are set out in an impact matrix found in Chapter 5. The main
potential impacts, both negative and positive, as identified in the matrix relate to:
A. Negative
v Air Quality
v Roads and Traffic
v Waste Management
B. Positive
v Marine water quality
v Air Quality
v Fuel efficiencies
v Increased opportunity for the construction industry in Jamaica
v Increased employment opportunities in Jamaica
Findings
The environmental impacts are dealt with in detail in Chapter 5. One of the main issues is a
perceived air quality problem. Air dispersion model runs for the existing Carib Cement operations,
the proposed expansion, as well as all existing sources were generated.
The results of the modified Carib Cement sources model run, (Table 5.7) revealed that SO2,
lead, ozone, and carbon monoxide (CO) all met the National Ambient Air Quality Standard
(NAAQS) minus the background for all applicable averaging periods. NOx annual average meets
the standard once it is assumed that 75% of NOx is NO2 as recommended by the Air Quality
Guideline Document. However, the NOx 1-h predicted concentration exceeds the standards even
after the 75% conversion is applied. Hence, the Ozone Limiting Method (OLM) as an approach
recommended by the USEPA was utilized. The generated predictions using this model fall
within the 1-h NOx standard.
PM exceeds the NAAQS standard minus the background by 8 µg/m3 for the annual average and
only by 2 µg/m3 for the 24-h averaging period. While PM does not meet the model target it is not a
significant impact for PM. For there to be a significant impact of PM there must be at least an
increment of 21.0 µg/m3 for an annual average or a 24-hour average of 80.5 µg/m3. The increment

Caribbean Cement Company Expansion EIA
____________________________________________________________________ Environmental Solutions Ltd.
vi
model run gave results of an annual average less than 0 µg/m3 and a 24-hour average of 23 µg/m3;
hence, there is no significant impact for PM. Additionally the plot files show that the area most
impacted by the predicted pollutant concentrations is the northwestern section of the Carib Cement
facility. This pattern is consistent with the fact that the most predominant wind direction blows from
the southeast.
Conclusions
All the potential impacts identified can be effectively mitigated to reduce the risks and to meet the
required environmental standards. Some of these measures are built into the new line and others
can be designed and incorporated into the operation without difficulty.
A critical element of the operation must be the monitoring of the internal and external environment
in order to detect and correct any variances. Furthermore, the monitoring programme should
include the community through routine sharing of information.
Caribbean Cement Company Expansion EIA
____________________________________________________________________ Environmental Solutions Ltd.
vii
TABLE OF CONTENTS
EXECUTIVE SUMMARY ............................................................................................................ i
TABLE OF CONTENTS ...........................................................................................................vii
LIST OF TABLES......................................................................................................................x
LIST OF FIGURES................................................................................................................... xi
LIST OF PLATES.................................................................................................................... xii
1.0 INTRODUCTION .............................................................................................................1
1.1 BACKGROUND............................................................................................................1 1.2 TERMS OF REFERENCE .............................................................................................3
Introduction ..................................................................................................................3 Background Information .....................................................................................................3 Study Area ..................................................................................................................3 EIA Team ..................................................................................................................3 Scope of Work ..................................................................................................................3
1.3 STUDY TEAM ..............................................................................................................6 1.4 METHODOLOGY..........................................................................................................7
1.4.1 Physical Parameters .............................................................................................7 1.4.2 Ecological Baseline ............................................................................................ 11 1.4.3 Socioeconomic Setting ........................................................................................ 11
2.0 DESCRIPTION OF THE PROPOSED PROJECT ............................................................ 12
2.1 EXISTING OPERATIONS............................................................................................ 12 2.2 THE CEMENT PRODUCTION PROCESS.................................................................... 12
2.2.1 Wet Process....................................................................................................... 12 2.2.2 Dry Process........................................................................................................ 13 2.2.3 Proposed Project Description............................................................................... 14
2.3 CARBON CREDITS .................................................................................................... 18 2.3 PROJECT ENGINEERING .......................................................................................... 20
3.0 POLICY, LEGAL AND REGULATORY FRAMEWORK ..................................................... 21
3.1 LEGISLATION RELATING TO DEVELOPMENT........................................................... 21 3.1.1 The Natural Resources Conservation (Permits and Licences) Regulations (1996) ... 21
Caribbean Cement Company Expansion EIA
____________________________________________________________________ Environmental Solutions Ltd.
viii
3.2 LEGISLATION RELATING TO POLLUTION CONTROL ................................................. 22 3.2.1 Natural Resources Conservation Authority Act, 1991............................................. 22 3.2.2 The Natural Resources Conservation Authority (Air Quality) Regulations, 2002....... 22 3.2.3 The National Solid Waste Management Authority Act, 2000................................... 23 3.2.4 Public Health Act, 1976 ......................................................................................... 23 3.2.5 The Clean Air Act, 1964 ........................................................................................ 24
3.3 REGULATIONS PERTAINING TO STANDARDS ........................................................ 24 3.3.1 Trade Effluent Standards ..................................................................................... 24 3.3.2 Noise Standards ................................................................................................. 24
3.4 LEGISLATION RELATING TO FACTORY OPERATIONS ............................................. 25 3.4.1 Factories Act, 1968 ............................................................................................. 25 3.4.2 Petroleum and Oil Fuel (Landing & Storage) Act (1925)......................................... 25 3.4.3 The Office of Disaster Preparedness and Emergency Management Act (1998)....... 25
3.5 LEGISLATION RELATING TO ENVIRONMENTAL SETTING ..................................... 26 3.5.1 Beach Control Act, 1956...................................................................................... 26 3.5.2 The Water Resources Act, 1995 ............................................................................ 26
4. 0 DESCRIP TION OF THE EXISTING ENVIRONMENT...................................................... 27
4.1 PHYSICAL ENVIRONMENT........................................................................................ 27 4.1.1 Climate............................................................................................................... 27 4.1.2 Topography and Drainage ................................................................................... 31 4.1.3 Geology ............................................................................................................. 33 4.1.4 Hydrology ........................................................................................................... 35 4.1.5 Landscape and Aesthetics................................................................................... 35
4.2 AIR AND WATER QUALITY ........................................................................................ 36 4.2.1 General Description of the Airshed....................................................................... 36 4.2.2 Existing Air Quality.............................................................................................. 43 4.2.3 Water Quality – Coastal Zone .............................................................................. 44 4.2.4 Noise Levels....................................................................................................... 47
4.3 NATURAL HAZARD VULNERABILITY ......................................................................... 48 4.3.1 Seismic Activity................................................................................................... 48 4.3.2 Hurricanes .......................................................................................................... 50 4.3.3 Coastal Flooding ................................................................................................. 50
4.4 BIOLOGICAL ENVIRONMENT.................................................................................... 51 4.4.1 Flora ................................................................................................................ 51 4.4.2 Fauna ................................................................................................................ 53 4.4.3 Coastal Environment ........................................................................................... 55
Caribbean Cement Company Expansion EIA
____________________________________________________________________ Environmental Solutions Ltd.
ix
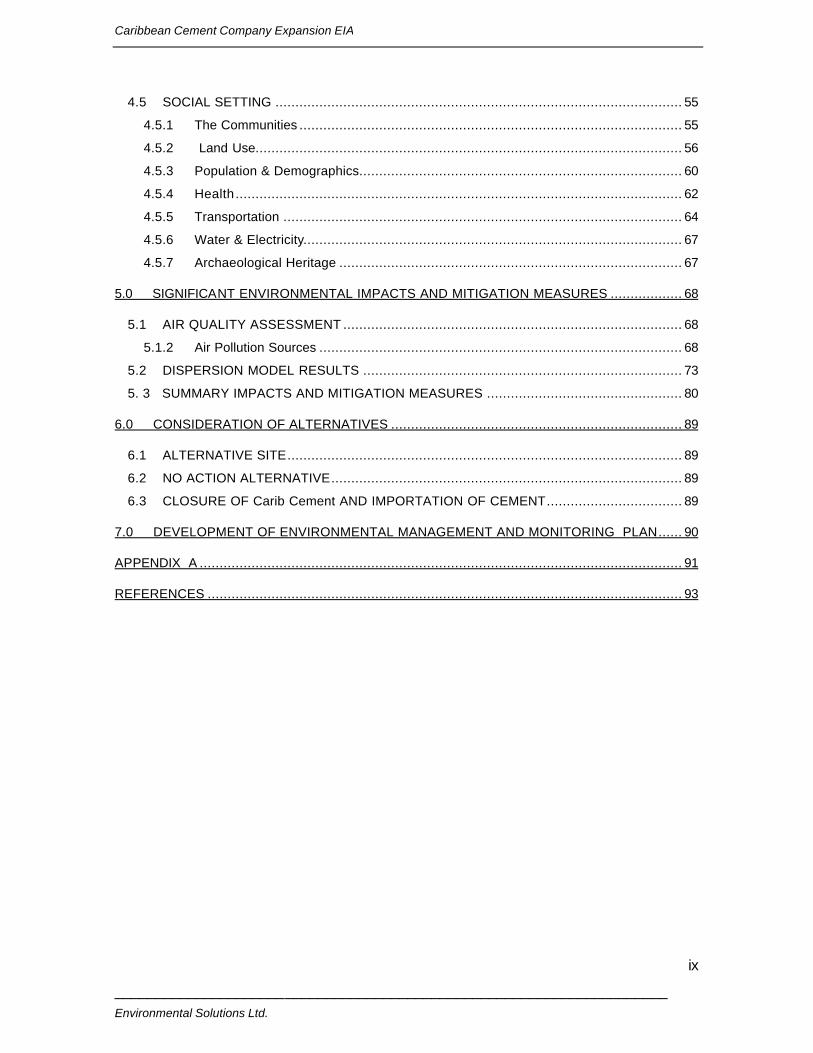
4.5 SOCIAL SETTING ...................................................................................................... 55 4.5.1 The Communities ................................................................................................ 55 4.5.2 Land Use........................................................................................................... 56 4.5.3 Population & Demographics................................................................................. 60 4.5.4 Health ................................................................................................................ 62 4.5.5 Transportation .................................................................................................... 64 4.5.6 Water & Electricity............................................................................................... 67 4.5.7 Archaeological Heritage ...................................................................................... 67
5.0 SIGNIFICANT ENVIRONMENTAL IMPACTS AND MITIGATION MEASURES .................. 68
5.1 AIR QUALITY ASSESSMENT ..................................................................................... 68 5.1.2 Air Pollution Sources ........................................................................................... 68
5.2 DISPERSION MODEL RESULTS ................................................................................ 73 5. 3 SUMMARY IMPACTS AND MITIGATION MEASURES ................................................. 80
6.0 CONSIDERATION OF ALTERNATIVES ......................................................................... 89
6.1 ALTERNATIVE SITE................................................................................................... 89 6.2 NO ACTION ALTERNATIVE........................................................................................ 89 6.3 CLOSURE OF Carib Cement AND IMPORTATION OF CEMENT.................................. 89
7.0 DEVELOPMENT OF ENVIRONMENTAL MANAGEMENT AND MONITORING PLAN...... 90
APPENDIX A ......................................................................................................................... 91
REFERENCES ....................................................................................................................... 93
Caribbean Cement Company Expansion EIA
____________________________________________________________________ Environmental Solutions Ltd.
x
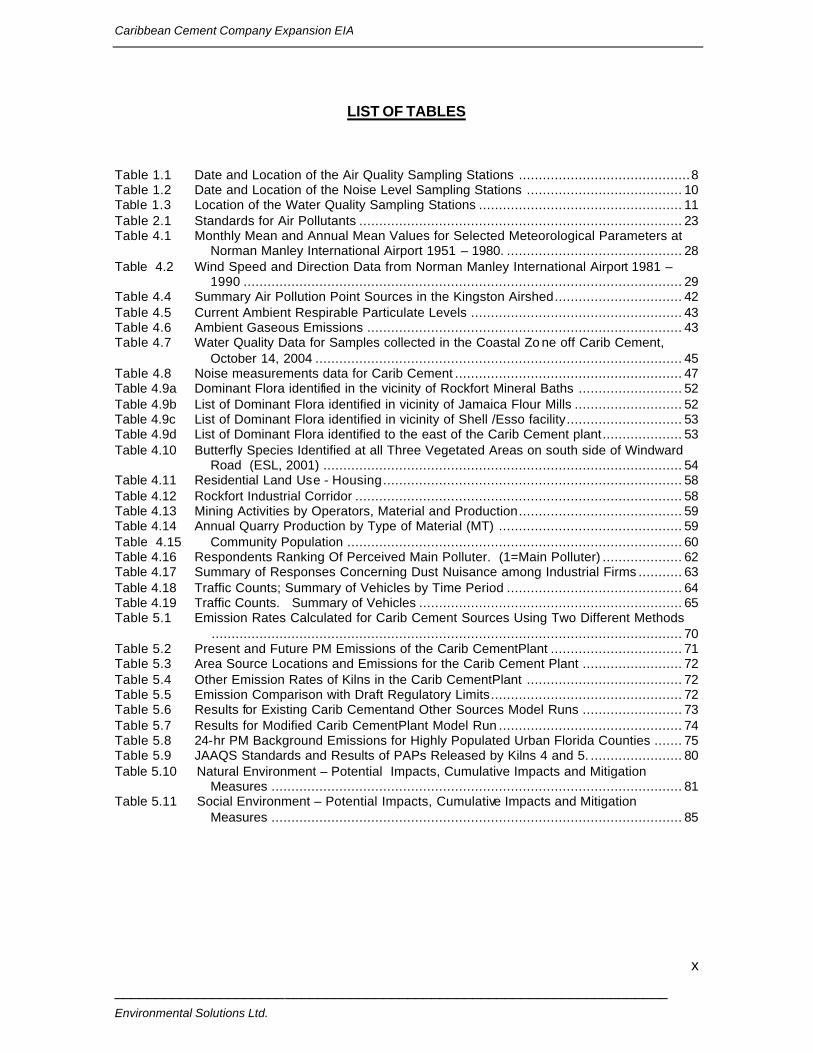
LIST OF TABLES
Table 1.1 Date and Location of the Air Quality Sampling Stations ...........................................8 Table 1.2 Date and Location of the Noise Level Sampling Stations ....................................... 10 Table 1.3 Location of the Water Quality Sampling Stations ................................................... 11 Table 2.1 Standards for Air Pollutants ................................................................................. 23 Table 4.1 Monthly Mean and Annual Mean Values for Selected Meteorological Parameters at
Norman Manley International Airport 1951 – 1980. ............................................ 28 Table 4.2 Wind Speed and Direction Data from Norman Manley International Airport 1981 –
1990 .............................................................................................................. 29 Table 4.4 Summary Air Pollution Point Sources in the Kingston Airshed................................ 42 Table 4.5 Current Ambient Respirable Particulate Levels ..................................................... 43 Table 4.6 Ambient Gaseous Emissions ............................................................................... 43 Table 4.7 Water Quality Data for Samples collected in the Coastal Zo ne off Carib Cement,
October 14, 2004 ............................................................................................ 45 Table 4.8 Noise measurements data for Carib Cement ......................................................... 47 Table 4.9a Dominant Flora identified in the vicinity of Rockfort Mineral Baths .......................... 52 Table 4.9b List of Dominant Flora identified in vicinity of Jamaica Flour Mills ........................... 52 Table 4.9c List of Dominant Flora identified in vicinity of Shell /Esso facility............................. 53 Table 4.9d List of Dominant Flora identified to the east of the Carib Cement plant.................... 53 Table 4.10 Butterfly Species Identified at all Three Vegetated Areas on south side of Windward
Road (ESL, 2001) .......................................................................................... 54 Table 4.11 Residential Land Use - Housing........................................................................... 58 Table 4.12 Rockfort Industrial Corridor .................................................................................. 58 Table 4.13 Mining Activities by Operators, Material and Production......................................... 59 Table 4.14 Annual Quarry Production by Type of Material (MT) .............................................. 59 Table 4.15 Community Population .................................................................................... 60 Table 4.16 Respondents Ranking Of Perceived Main Polluter. (1=Main Polluter) .................... 62 Table 4.17 Summary of Responses Concerning Dust Nuisance among Industrial Firms ........... 63 Table 4.18 Traffic Counts; Summary of Vehicles by Time Period ............................................ 64 Table 4.19 Traffic Counts. Summary of Vehicles .................................................................. 65 Table 5.1 Emission Rates Calculated for Carib Cement Sources Using Two Different Methods
...................................................................................................................... 70 Table 5.2 Present and Future PM Emissions of the Carib CementPlant ................................. 71 Table 5.3 Area Source Locations and Emissions for the Carib Cement Plant ......................... 72 Table 5.4 Other Emission Rates of Kilns in the Carib CementPlant ....................................... 72 Table 5.5 Emission Comparison with Draft Regulatory Limits................................................ 72 Table 5.6 Results for Existing Carib Cementand Other Sources Model Runs ......................... 73 Table 5.7 Results for Modified Carib CementPlant Model Run .............................................. 74 Table 5.8 24-hr PM Background Emissions for Highly Populated Urban Florida Counties ....... 75 Table 5.9 JAAQS Standards and Results of PAPs Released by Kilns 4 and 5. ....................... 80 Table 5.10 Natural Environment – Potential Impacts, Cumulative Impacts and Mitigation
Measures ....................................................................................................... 81 Table 5.11 Social Environment – Potential Impacts, Cumulative Impacts and Mitigation
Measures ....................................................................................................... 85
Caribbean Cement Company Expansion EIA
____________________________________________________________________ Environmental Solutions Ltd.
xi
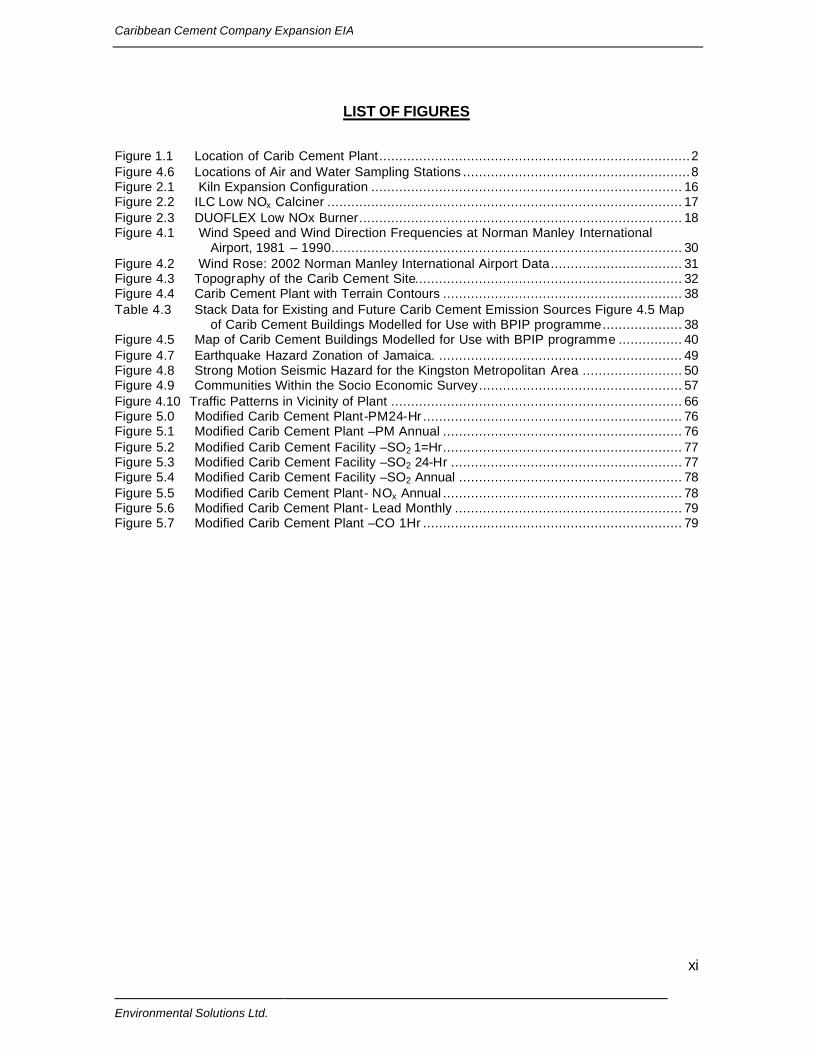
LIST OF FIGURES
Figure 1.1 Location of Carib Cement Plant..............................................................................2 Figure 4.6 Locations of Air and Water Sampling Stations .........................................................8 Figure 2.1 Kiln Expansion Configuration .............................................................................. 16 Figure 2.2 ILC Low NOx Calciner ......................................................................................... 17 Figure 2.3 DUOFLEX Low NOx Burner................................................................................. 18 Figure 4.1 Wind Speed and Wind Direction Frequencies at Norman Manley International
Airport, 1981 – 1990........................................................................................ 30 Figure 4.2 Wind Rose: 2002 Norman Manley International Airport Data................................. 31 Figure 4.3 Topography of the Carib Cement Site................................................................... 32 Figure 4.4 Carib Cement Plant with Terrain Contours ............................................................ 38 Table 4.3 Stack Data for Existing and Future Carib Cement Emission Sources Figure 4.5 Map
of Carib Cement Buildings Modelled for Use with BPIP programme.................... 38 Figure 4.5 Map of Carib Cement Buildings Modelled for Use with BPIP programme ................ 40 Figure 4.7 Earthquake Hazard Zonation of Jamaica. ............................................................. 49 Figure 4.8 Strong Motion Seismic Hazard for the Kingston Metropolitan Area ......................... 50 Figure 4.9 Communities Within the Socio Economic Survey................................................... 57 Figure 4.10 Traffic Patterns in Vicinity of Plant ......................................................................... 66 Figure 5.0 Modified Carib Cement Plant-PM24-Hr ................................................................. 76 Figure 5.1 Modified Carib Cement Plant –PM Annual ............................................................ 76 Figure 5.2 Modified Carib Cement Facility –SO2 1=Hr............................................................ 77 Figure 5.3 Modified Carib Cement Facility –SO2 24-Hr .......................................................... 77 Figure 5.4 Modified Carib Cement Facility –SO2 Annual ........................................................ 78 Figure 5.5 Modified Carib Cement Plant- NOx Annual ............................................................ 78 Figure 5.6 Modified Carib Cement Plant- Lead Monthly ......................................................... 79 Figure 5.7 Modified Carib Cement Plant –CO 1Hr ................................................................. 79
Caribbean Cement Company Expansion EIA
____________________________________________________________________ Environmental Solutions Ltd.
xii
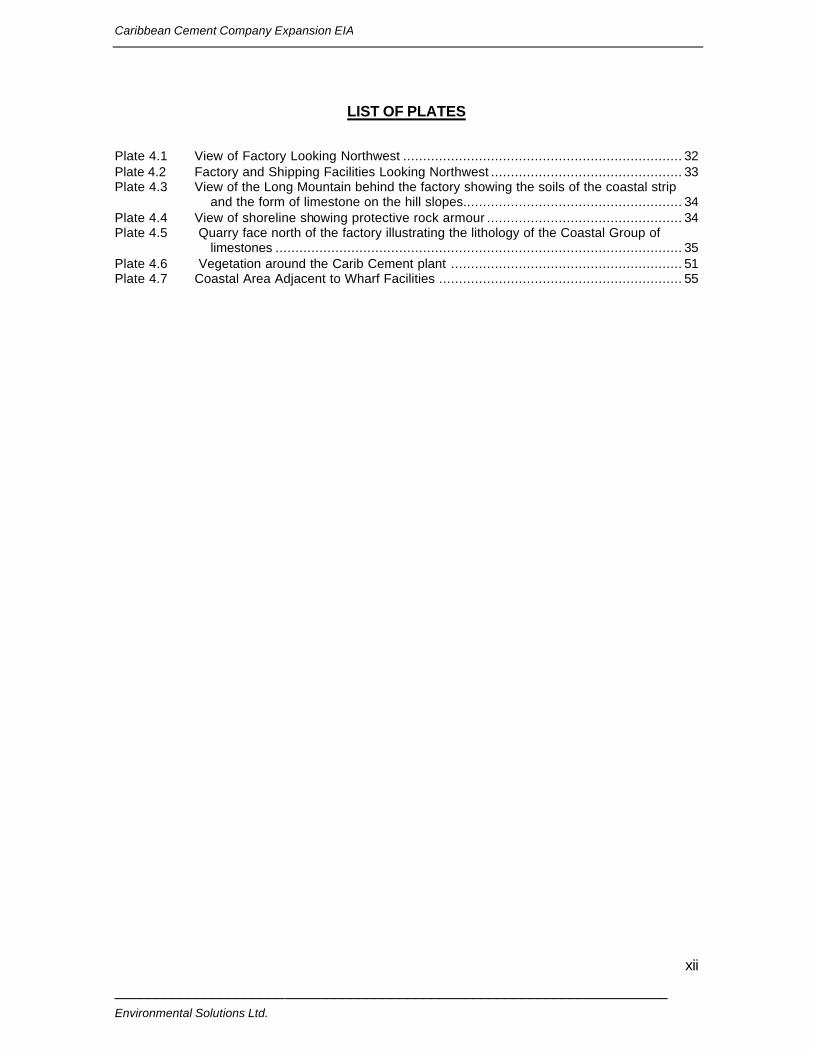
LIST OF PLATES
Plate 4.1 View of Factory Looking Northwest ...................................................................... 32 Plate 4.2 Factory and Shipping Facilities Looking Northwest ................................................ 33 Plate 4.3 View of the Long Mountain behind the factory showing the soils of the coastal strip
and the form of limestone on the hill slopes....................................................... 34 Plate 4.4 View of shoreline showing protective rock armour ................................................. 34 Plate 4.5 Quarry face north of the factory illustrating the lithology of the Coastal Group of
limestones ...................................................................................................... 35 Plate 4.6 Vegetation around the Carib Cement plant .......................................................... 51 Plate 4.7 Coastal Area Adjacent to Wharf Facilities ............................................................. 55
Caribbean Cement Company Expansion EIA
____________________________________________________________________ Environmental Solutions Ltd.
1
1.0 INTRODUCTION
1.1 BACKGROUND
This document presents the findings of an Environmental Impact Assessment (EIA) of the
proposed Caribbean Cement Company Limited (Carib Cement) Expansion Project. Carib Cement
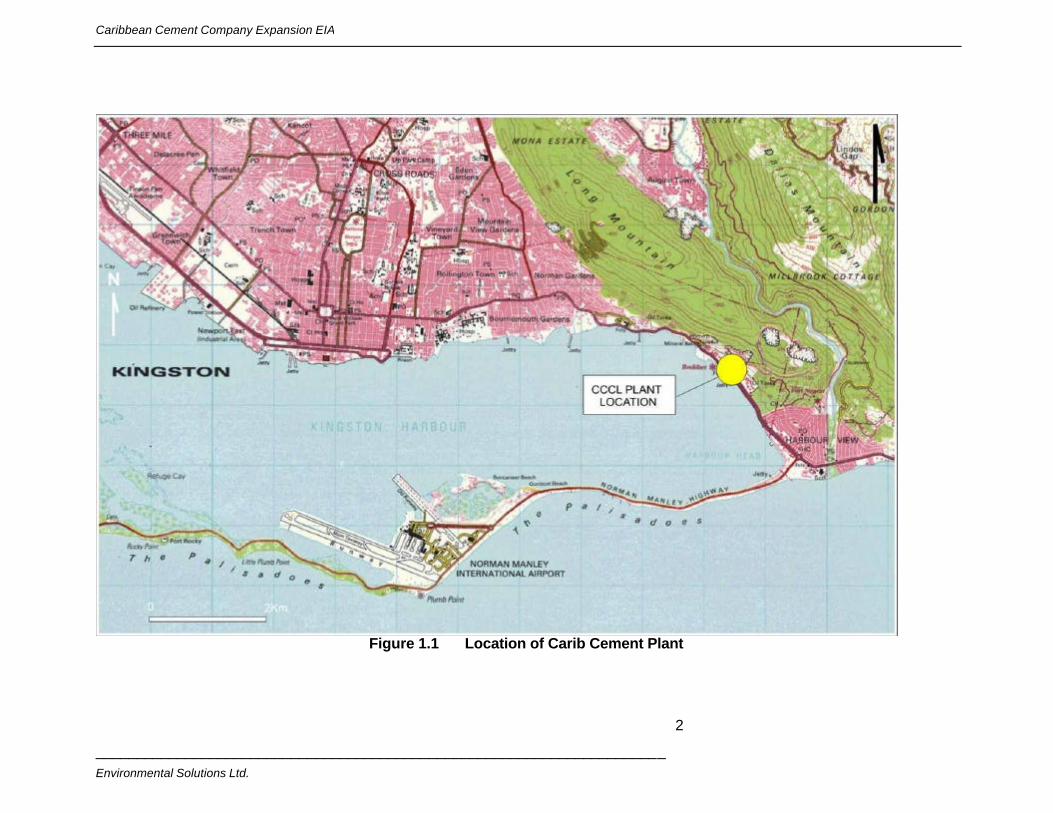
is carrying out a modernization and expansion programme of the plant at Rockfort, in Kingston
(Figure 1.1). The programme is phased over a five-year period, with the largest component being
the clinker production process expansion. This project will involve the installation of a new clinker
production line to be constructed over three years. Upon completion, the new “dry” clinker
production line will replace the existing wet clinker line. The proposed expansion will take place
within the footprint of the existing plant.
Carib Cement is the sole manufacturer of cement in Jamaica and was the sole supplier until as
recently as 1999. The size of the cement market has grown substantially over the last 10 years:
demand has increased by 52% or 5.1% per annum. The domestic market is conservatively forecast
to grow by approximately 4% per annum from 862,289 tonnes in 2004 to 1,291,167 tonnes in 2010.
Carib Cement presently holds the dominant share of the domestic market and is developing and
implementing strategies to meet this increasing demand and to provide even better service to the
construction industry.
Modernization and expansion of the existing plant is necessary in order to meet future demand and
to reduce operating costs. The proposed new production line will have a rated capacity in excess of
1 million tonnes per year up from the current 650 thousand tonnes per year produced by the
existing plant. In general the new production line will reduce fuel consumption and improve
efficiencies and environmental performance (Section 2.2).
Under the Natural Resources Conservation Authority (NRCA) Act (1991) significant expansion of
industrial plants is included on the list of prescribed activities that require an application for
permission to implement. The National Environmental Planning Agency (NEPA), which administers
the NRCA Act, has requested that an Environmental Impact Assessment (EIA) be conducted for
this project to support the application for a permit (Appendix I).
Environmental Solutions Limited (ESL) was retained by Carib Cement to prepare the EIA. The
Terms of Reference for the EIA are provided at Section 1.2 below.
Caribbean Cement Company Expansion EIA
______________________________________________________________________ Environmental Solutions Ltd.
2
Figure 1.1 Location of Carib Cement Plant
Caribbean Cement Company Expansion EIA
______________________________________________________________________ Environmental Solutions Ltd.
3
1.2 TERMS OF REFERENCE
The Terms of Reference for the Environmental Impact Assessment of the proposed cement plant
expansion at Rock Fort, St. Andrew are provided below. These have been adapted from World
Bank guidelines and take account of NEPA’s generic guidelines for EIA preparation.
By letter dated November 19, 2004, (Appendix I), NEPA requested that an EIA be prepared and
indicated that the terms of reference must include detailed air dispersion modelling.
Introduction
Identify the development project to be assessed and explain the executing arrangements for the
environmental assessment.
Background Information
Briefly describe the major components of the proposed project, the implementing agents, and
include a brief history of the project and its current status.
Study Area
Specify the boundaries of the study area for the assessment as well as any adjacent or remote
areas within the area of influence of the project.
EIA Team
Identify the individuals responsible for collecting the data and carrying out the impact assessment
and their respective skills.
Scope of Work
The following tasks were undertaken:
Task 1. Description of the Proposed Project (Section 2) - A full description is provided of the
overall project and its existing setting using plans, maps and graphic aids as appropriate. This
includes: location; general layout (size, capacity, etc.); areas slated for development, pre-
construction and construction activities; construction methodology (earthworks, bunds, etc.), site
management, operation and maintenance activities; project life span; plans for providing electricity
Caribbean Cement Company Expansion EIA
______________________________________________________________________ Environmental Solutions Ltd.
4
and water; and employment. Specific attention is given to issues of air quality, energy consumption,
raw material supply, and waste generation and management.
Task 2. Description of the Environment (Section 4) – A description of the physical, ecological,
demographic, socio-cultural and institutional setting of the project is provided. Information that
provides an insight into previously existing conditions of the site and the influences of past
development initiatives is reviewed and presented. Baseline data on the relevant environmental
characteristics of the study area assembled, evaluated and presented. These include the following:
a) Physical environment (Section 4.1): terrestrial and coastal features; topography; geology;
soils; climate and meteorology; ambient noise; hydrology; drainage and storm water runoff; and
Kingston Harbour water quality1. Existing sources of pollution and the extent of contamination
relevant to the project area are identified. The natural hazard vulnerability of the site is also
considered, particularly with respect to potential earthquakes, hurricanes and storm surge. A stand-
alone air dispersion modelling report was requested by NEPA to be a part of the EIA (Section 5.2).
b) Biological environment (Section 4.4): flora and fauna of the terrestrial ecosystems on
and adjacent to the project site. Reference is also made to the Kingston Harbour. Rare or
endangered species, species of commercial importance, and species with potential to become
vectors or nuisances are specified.
c) Social environment (Section 4.5): present and projected population size, land use,
community structure, issues related to squatting and relocation, current development plans,
recreation and public health, public and community perceptions of and attitudes to the proposed
project, and any historical sites affected by the project. Solid waste management issues related to
the project are identified.
Task 3. Legislative and Regulatory Considerations (Section 3) - The pertinent environmental laws,
regulations and standards governing land use control, environmental quality, health and safety,
sewage effluent discharge, protection of sensitive areas, and protection of endangered species are
identified.
Task 4. Determinations of Potential Impacts (Section 5) – The major issues of environmental
concern were identified and their relative importances to the design of the project are indicated.
Long-term and short-term impacts, construction and post-construction phase impacts, positive and
1 Parameters to include: BOD, TSS, NO3, PO4, and faecal coliforms .
Caribbean Cement Company Expansion EIA
______________________________________________________________________ Environmental Solutions Ltd.
5
negative impacts, and direct and indirect impacts were distinguished. The significant impacts and
those that are cumulative, unavoidable or irreversible are identified.
Special attention was given to the following matters:
• Air quality and air dispersion modelling
• Vegetation clearance, and placement of buildings and services installation.
• Modification of existing drainage patterns and surface runoff during construction and post-
construction phases.
• Raw material quarrying, transport and storage
• Solid waste management during construction and post-construction phases.
• Environmental health within the plant and in surrounding areas
• Traffic movement
• Employment and effects on existing users of the adjacent coastal areas; community
involvement, and public perceptions of the project.
• Potential impacts of the development on adjacent property owners.
• Natural hazard vulnerability
Task 5. Mitigation and Management of Negative Impacts (Section 5) - Feasible and cost-effective
measures to prevent or to reduce the significant negative impacts to acceptable levels are
recommended.
Task 6. Environmental Management and Monitoring Plan (Section 7) - The outline of a plan for
monitoring the impacts of the project and the implementation of mitigating measures during
construction was prepared. This plan is to be detailed after the permit for the project is granted and
the construction plans for the project have been finalized, at which time the plan is to be submitted
to NEPA for approval.
Task 7. Determination of Project Alternatives(Section 6) – Alternatives to the project including the
no-action option and alternatives treatment processes and site location are examined.
Task 8: Assist in Inter-Agency Coordination and Public/NGO Participation - EIA Review by
Regulatory Agency. - The environmental assessment was coordinated with the government
agencies and the views of local NGO's and affected groups were obtained. Public hearing on the
EIA findings as required by the NEPA permit approval process will be managed and coordinated.
6. Report - The environmental assessment report is concise and limited to significant
environmental issues. The main text focuses on findings, conclusions and recommended actions
Caribbean Cement Company Expansion EIA
______________________________________________________________________ Environmental Solutions Ltd.
6
and is supported by summaries of the data collected and citations for references used in
interpreting those data. The environmental assessment report is organized according to the outline
below.
- Executive Summary
- Introduction
- Description of Proposed Project
- Policy, Legal and Administrative Framework
- Description of the Existing Environment
- Significant Environmental Impacts and Impact Mitigation Measures
- Consideration of Alternatives
- Environmental Management and Monitoring Plan
- Inter-Agency and Public/NGO Involvement
- List of References
1.3 STUDY TEAM
Environmental Solutions Ltd developed out this EIA. The multidisciplinary team engaged to do the
assessment included local expertise in environmental impact assessment, environmental
engineering, coastal and terrestrial ecology, environmental chemistry, and social impact
assessment. The team members were:
Environmental Solutions Ltd.:
Eleanor B. Jones, M.A. - Environmental Planner –Team Leader
George Campbell, M.Sc. – Social and Economic Analyst
Aedan Earle, M.Phil. – Geologist
Margaret Jones Williams, Ph.D. - Ecologist
Sharonmae Shirley, M.Phil. – Environmental Chemist
ESL Associate: Steven Haughton, M.Sc. – Environmental Engineer
Scheiber, Yonley and Associates Brad Phillips
Nalin Joslin
Caribbean Cement Company Expansion EIA
______________________________________________________________________ Environmental Solutions Ltd.
7
1.4 METHODOLOGY
1.4.1 Physical Parameters
Information was gathered on the existing physical environment, particularly as related to climate,
geology, topography, soils, hydrology and drainage, air quality, water quality, and noise.
1.4.1.1 Climate, Geology, Topography, and Soils
Information on the climate, geology, topography, soils, was obtained by compiling existing data
from reports (Adams, 1972; Downer and Sutton, 1990; ESL, 2001), Grossman et al, 1991) as well
as from source agencies. Aerial photos, satellite imagery and published maps were also examined.
Fieldwork was carried out to augment and verify existing information relating to geology and soils
and to obtain first hand knowledge of the topography.
1.4.1.2 Hydrology and Drainage
Surface and ground water characteristics and flows were assessed using field investigation as well
as maps, aerial photographs and data from previous reports (Smith, 2004)
1.4.1.3 Air Quality
The objective of the air quality monitoring exercise is to determine the normal concentration of
respirable particulates and gaseous emissions in the project area prior to the start of the proposed
expansion works. Air quality measurements were taken at nine sites in the project area (Table 1.1
and Figure 1.1). These sites were selected based on their location relative to key community
receptors, as well as their current or potential for impairment. The sampling and analytical
methods used are based on established procedures in the text Fundamentals of Industrial Hygiene
[Plog, 1988]. The methodology used does not conform to all the USEPA guidelines for the
assessment of ambient particulates. The USEPA method requires the use of high volume
samplers whereas low volume samplers were used in this sampling exercise.
Caribbean Cement Company Expansion EIA
______________________________________________________________________ Environmental Solutions Ltd.
8
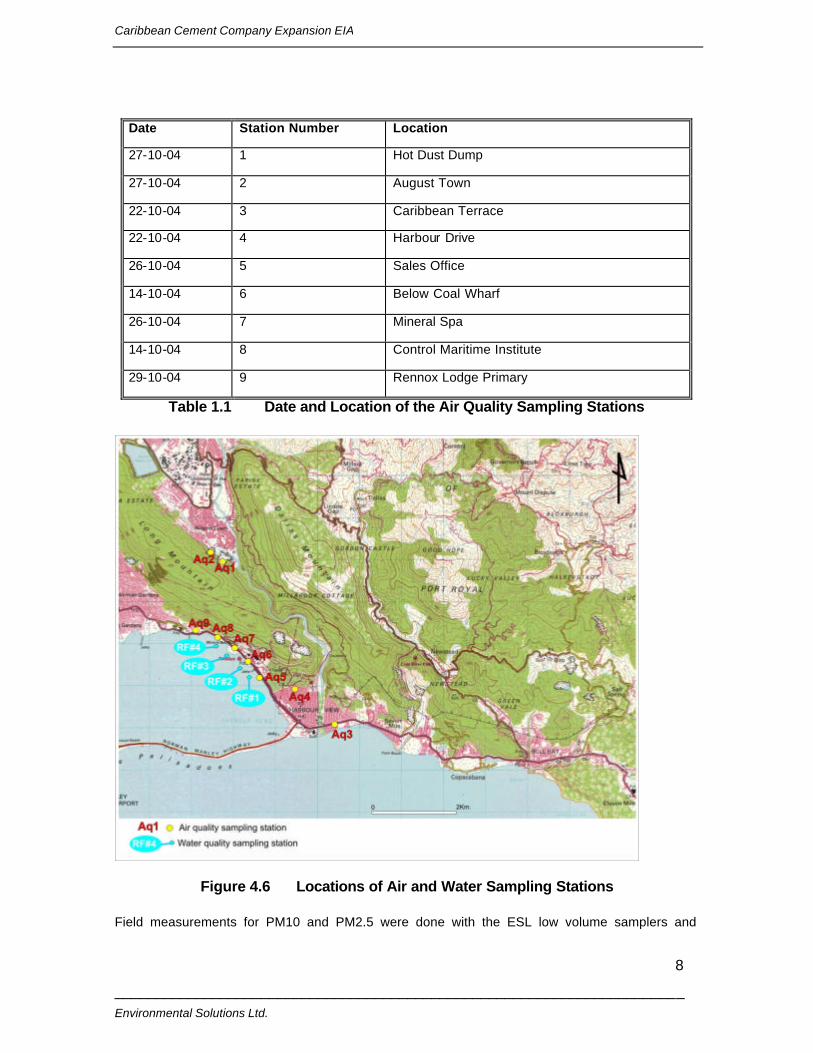
Date Station Number Location
27-10-04 1 Hot Dust Dump
27-10-04 2 August Town
22-10-04 3 Caribbean Terrace
22-10-04 4 Harbour Drive
26-10-04 5 Sales Office
14-10-04 6 Below Coal Wharf
26-10-04 7 Mineral Spa
14-10-04 8 Control Maritime Institute
29-10-04 9 Rennox Lodge Primary
Table 1.1 Date and Location of the Air Quality Sampling Stations
Figure 4.6 Locations of Air and Water Sampling Stations Field measurements for PM10 and PM2.5 were done with the ESL low volume samplers and
Caribbean Cement Company Expansion EIA
______________________________________________________________________ Environmental Solutions Ltd.
9
standard high volume samplers and the results were similar. The test programme was not
rigorous, the comparative data serves as an indicator that the results are similar. Further detailed
tests would have to be performed to determine the exact correlation.
Particulates
The air quality assessment involved the determination of ambient levels of respirable particulates,
PM10 (<10µm). Particulates were measured using Sensidyne (BDX 530) personal vacuum pumps
(suction 2-3 1/min), attached to pre-weighed millipore filters. The pumps were placed at the
approximate respiratory height of pedestrians for a specified period of time, after which the fi lters
were stabilised and weighed to determine a Time Weighted Average (TWA) value for the
particulates.
Gaseous Emissions
Sulphur oxides, nitrogen oxides, and carbon monoxide gases were measured using the Draegar
CMS and Teledyne Max 5 direct monitoring meters.
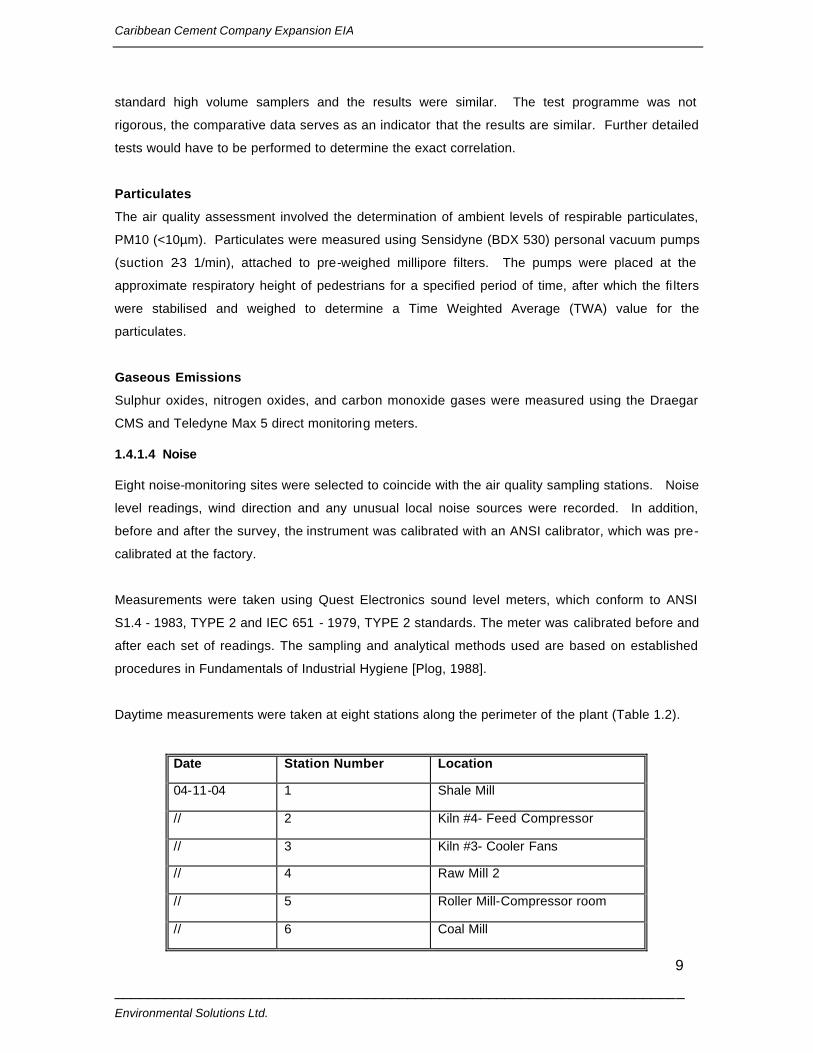
1.4.1.4 Noise
Eight noise-monitoring sites were selected to coincide with the air quality sampling stations. Noise
level readings, wind direction and any unusual local noise sources were recorded. In addition,
before and after the survey, the instrument was calibrated with an ANSI calibrator, which was pre-
calibrated at the factory.
Measurements were taken using Quest Electronics sound level meters, which conform to ANSI
S1.4 - 1983, TYPE 2 and IEC 651 - 1979, TYPE 2 standards. The meter was calibrated before and
after each set of readings. The sampling and analytical methods used are based on established
procedures in Fundamentals of Industrial Hygiene [Plog, 1988].
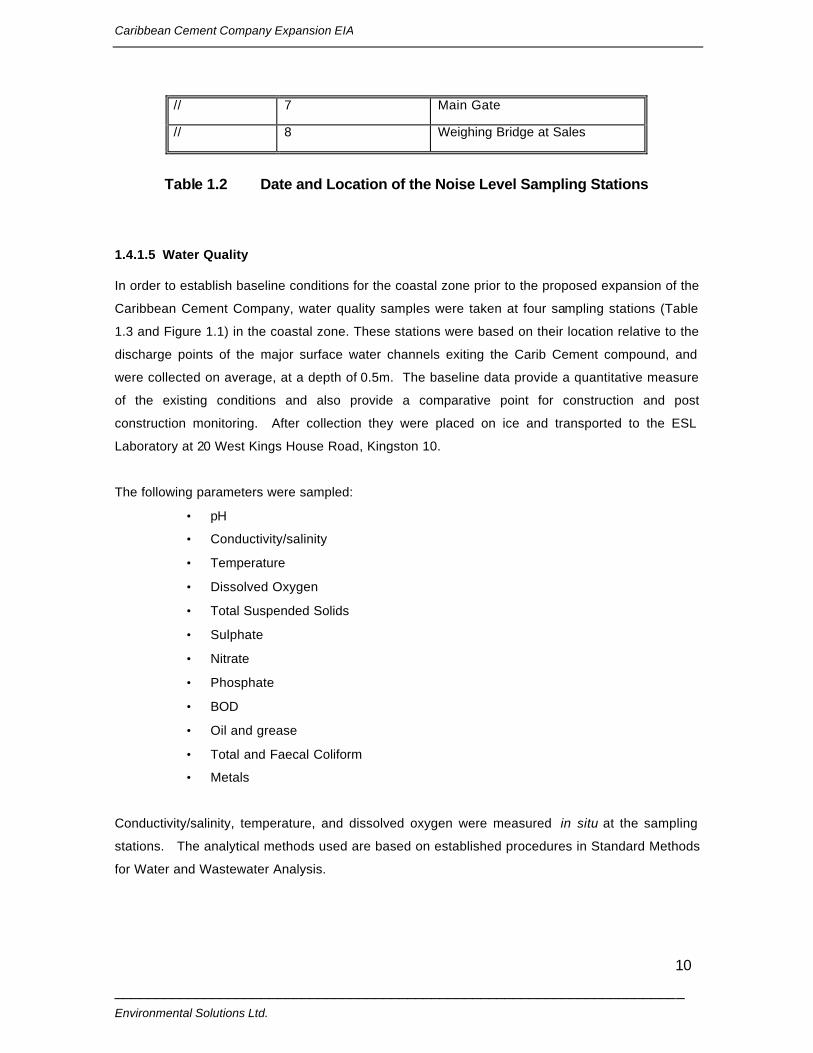
Daytime measurements were taken at eight stations along the perimeter of the plant (Table 1.2).
Date Station Number Location
04-11-04 1 Shale Mill
// 2 Kiln #4- Feed Compressor
// 3 Kiln #3- Cooler Fans
// 4 Raw Mill 2
// 5 Roller Mill-Compressor room
// 6 Coal Mill
Caribbean Cement Company Expansion EIA
______________________________________________________________________ Environmental Solutions Ltd.
10
// 7 Main Gate
// 8 Weighing Bridge at Sales
Table 1.2 Date and Location of the Noise Level Sampling Stations
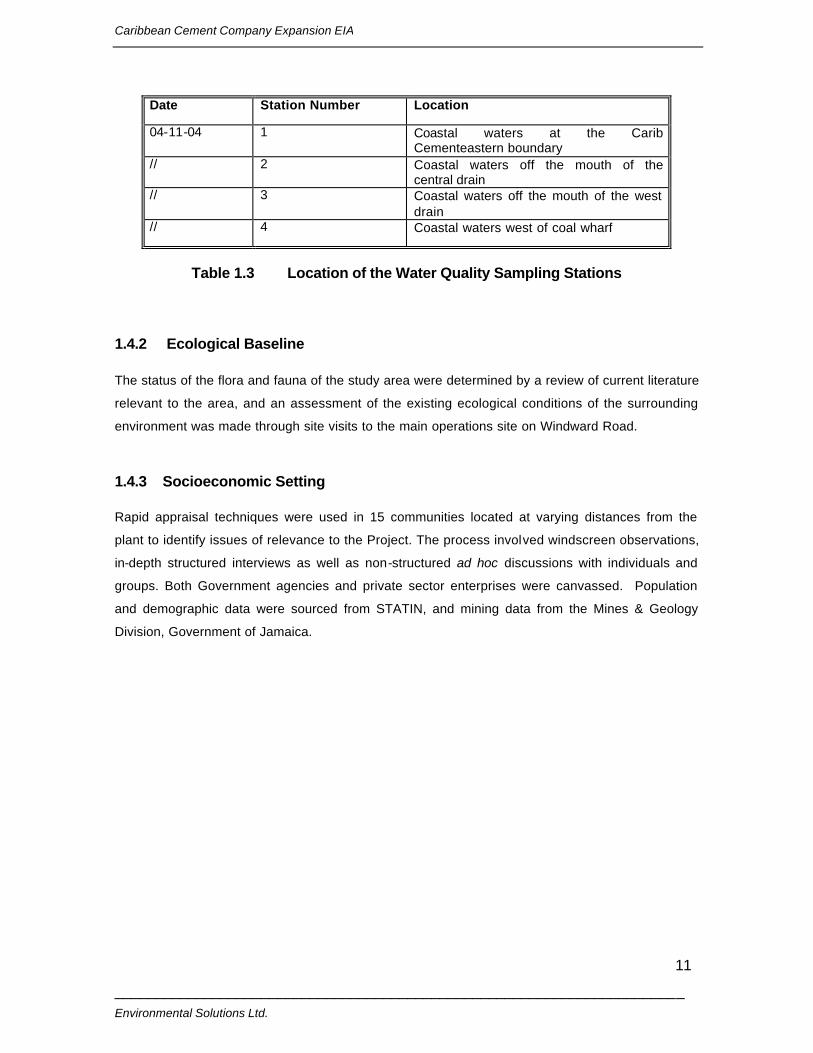
1.4.1.5 Water Quality
In order to establish baseline conditions for the coastal zone prior to the proposed expansion of the
Caribbean Cement Company, water quality samples were taken at four sampling stations (Table
1.3 and Figure 1.1) in the coastal zone. These stations were based on their location relative to the
discharge points of the major surface water channels exiting the Carib Cement compound, and
were collected on average, at a depth of 0.5m. The baseline data provide a quantitative measure
of the existing conditions and also provide a comparative point for construction and post
construction monitoring. After collection they were placed on ice and transported to the ESL
Laboratory at 20 West Kings House Road, Kingston 10.
The following parameters were sampled:
• pH
• Conductivity/salinity
• Temperature
• Dissolved Oxygen
• Total Suspended Solids
• Sulphate
• Nitrate
• Phosphate
• BOD
• Oil and grease
• Total and Faecal Coliform
• Metals
Conductivity/salinity, temperature, and dissolved oxygen were measured in situ at the sampling
stations. The analytical methods used are based on established procedures in Standard Methods
for Water and Wastewater Analysis.
Caribbean Cement Company Expansion EIA
______________________________________________________________________ Environmental Solutions Ltd.
11
Date Station Number Location
04-11-04 1 Coastal waters at the Carib Cementeastern boundary
// 2 Coastal waters off the mouth of the central drain
// 3 Coastal waters off the mouth of the west drain
// 4 Coastal waters west of coal wharf
Table 1.3 Location of the Water Quality Sampling Stations
1.4.2 Ecological Baseline
The status of the flora and fauna of the study area were determined by a review of current literature
relevant to the area, and an assessment of the existing ecological conditions of the surrounding
environment was made through site visits to the main operations site on Windward Road.
1.4.3 Socioeconomic Setting
Rapid appraisal techniques were used in 15 communities located at varying distances from the
plant to identify issues of relevance to the Project. The process involved windscreen observations,
in-depth structured interviews as well as non-structured ad hoc discussions with individuals and
groups. Both Government agencies and private sector enterprises were canvassed. Population
and demographic data were sourced from STATIN, and mining data from the Mines & Geology
Division, Government of Jamaica.
Caribbean Cement Company Expansion EIA
______________________________________________________________________ Environmental Solutions Ltd.
12
2.0 DESCRIPTION OF THE PROPOSED PROJECT
2.1 EXISTING OPERATIONS
Caribbean Cement Company Limited was incorporated in 1947, and the first bag of cement was
delivered in 1952. The plant capacity at that time was 100,000 MTPY with one kiln. This was
doubled in 1956 to 200,000 MTPY. In 1962, construction started on a third production line, kiln 3,
which was commissioned in 1964. When this was completed the capacity was 400,000 MTPY.
The construction of the fourth line was started in 1984, with commissioning in 1988. This brought
the plant to a current capacity of 600,000 MTPY. Since then smaller upgrades have increased the
capacity to a nominal value of 650,000 MTPY.
Carib Cement operates a dual process cement manufacturing plant, utilising both the wet and dry
process technologies. The dry process, using preheaters and precalciners, is both economically
and environmentally preferable to the wet process because the energy consumption (3200 joules
per kilogram (kg) is approximately half of that for the wet process. A detailed description of both
the dry and wet cement manufacturing process is provided at Section 2.2.
2.2 THE CEMENT PRODUCTION PROCESS
The production of cement includes mining; crushing and grinding of raw materials (principally
limestone and clay); calcining the materials in a rotary kiln; cooling the resulting clinker; mixing the
clinker with gypsum; and milling, storing and bagging the finished cement. The process results in a
variety of wastes, including dust, which is captured and recycled to the process. The process is
very energy-intensive and there are strong incentives for energy conservation.
2.2.1 Wet Process
The manufacture of Portland cement in a wet process kiln (Kiln 3) begins with the acquisition of the
major components, limestone, clay, ash, sand, and/or iron ore. After size reduction processes, the
raw materials are further prepared by wet milling, where approximately 30%-35% water is added to
produce a homogenized kiln slurry, or raw feed material.
The critical manufacturing step, called “pyroprocessing,” takes place in the cement kiln. The
prepared raw feed is pumped into the kiln where it is exposed to gas temperatures starting at
Caribbean Cement Company Expansion EIA
______________________________________________________________________ Environmental Solutions Ltd.
13
260°C at the elevated feed end to over 1870°C near the product discharge end. The kiln is a
cylindrical tube on a slight incline that rotates slowly. The slurry, or kiln feed, is heated as it travels
down the kiln. As the kiln feed progresses through the kiln, it undergoes physical and chemical
changes. After tumbling slowly through the kiln, exothermic chemical changes in the burning zone
transform the raw materials to cement clinker, a product physically resembling grey gravel.
In the wet process, the kiln feed loses water as it is heated and passed through the chain section.
In this section, chains hung from the inside of the kiln assist in heat transfer to the slurry. Next,
calcium carbonate in the material is calcined into calcium oxide (lime), which finally fuses at high
temperatures with silicates, iron, and aluminum to produce an intermediate of Portland cement
called “clinker.” The clinker produced from this process is conveyed through a grate cooler, and is
cooled by air from forced-draft fans. The cooled clinker is then stored for subsequent grinding,
during which approximately 5% gypsum and/or other additives are added to produce Portland
cement, the final product.
The production of clinker in a wet kiln requires that the solid material be heated to approximately
1400°C to 1482°C, while the gaseous material reaches a temperature of greater than 1400°C.
Tricalcium silicate is the major strength-producing constituent of cement, and its formation begins
in the burning zone at material temperatures above 1870°C. Other clinker compounds important
for the performance of Portland cement are formed by reactions that take place in the burning
zone.
Fuel utilized in the kiln to drive the cement manufacturing process is typically coal and/or coke or
other fossil fuels. All fuel is injected counter-current to the product flow through injection system at
the product discharge end of the kiln. Exhaust gases from the kiln are routed to the air pollution
control system and then discharged to the atmosphere through a stack.
2.2.2 Dry Process
The kiln 4 line is a dry process which is described as follows. Initially, the crushed raw materials
(raw meal feed) (i.e., limestone, clay, ash, sand, and/or iron ore) enter the raw mill to be dried and
ground. A fan draws hot combustion gas from the top of the preheater tower into the raw mill to
evaporate moisture from the raw meal, as it is ground. The prepared raw meal feed is transported
to a blending silo where it is held pending introduction into the pyroprocess.
The first step of the pyroprocessing is feeding the kiln feed into the top of the preheater tower.
From the preheating zone of the preheater/precalciner tower, the kiln feed flows by gravity into the
Caribbean Cement Company Expansion EIA
______________________________________________________________________ Environmental Solutions Ltd.
14
calciner where fuel is burned in direct contact with the kiln feed to begin the calcination process of
the limestone. The preheater tower consists of multiple cyclone stages, which provide direct
contact between the hot combustion gases and the kiln feed.
When limestone is calcined, calcium carbonate dissociates to produce calcium oxide and carbon
dioxide (CO2). This step consumes about 85% of the theoretical thermal energy required by the
process and occurs at temperatures of about 900ºC. A majority of the limestone is calcined in the
calciner and preheater tower. The remainder of the calcining takes place at the feed end of the
rotary kiln.
Once through the calcining zone of the rotary kiln, the partially calcined feed moves into the
burning zone. Flame temperatures of about 1870°C must be reached within the rotary kiln to
produce material temperatures in the range of 1482°C and bring about the chemical reactions that
turn the partially calcined feed into the rock-like, solid nodules or clinker. Fuel enters the rotary kiln
pyroprocessing system via the burner nozzles at the clinker discharge end of the kiln.
Clinker is discharged from the lower, hot end of the rotary kiln into the clinker cooler, where forcing
air through the moving bed of hot material cools it. The cooled clinker is transported by conveyor
system to clinker storage and then to the finish mill system. The pre-heated air from the clinker
cooler process is used as secondary combustion air in the rotary kiln, tertiary combustion air for the
calciner, and is also used to dry the conventional fossil fuels in the coal mills.
The dry process, by re-use of the hot gases for drying raw materials and with the use of the vertical
tower for calcining the raw material is very energy efficient. The rapid heating of the raw materials
is the key to the efficiency of the preheater tower. The entrainment of the raw material in the air
stream and collection of the solids through the cyclones transfers heat to the raw materials rapidly
and efficiently. The addition of fuel in the precalciner also prepares the raw material for final
chemical transformation in the rotary kiln. This efficiency is borne by the typical heat requirement
for a preheater/precalciner system that is approximately 3,200 kJ/kg of clinker, compared to about
5,400 kJ/kg of clinker for a wet kiln. As a result, the project is being identified as a Clean
Development Mechanism one and as such the International Finance Corporation, lead financiers
for Caribbean Cement Company’s expansion project is earmarking Carib Cement as a recipient for
carbon credits.
2.2.3 Proposed Project Description
Carib Cement has proposed to construct and operate a new dry line production cement facility
Caribbean Cement Company Expansion EIA
______________________________________________________________________ Environmental Solutions Ltd.
15
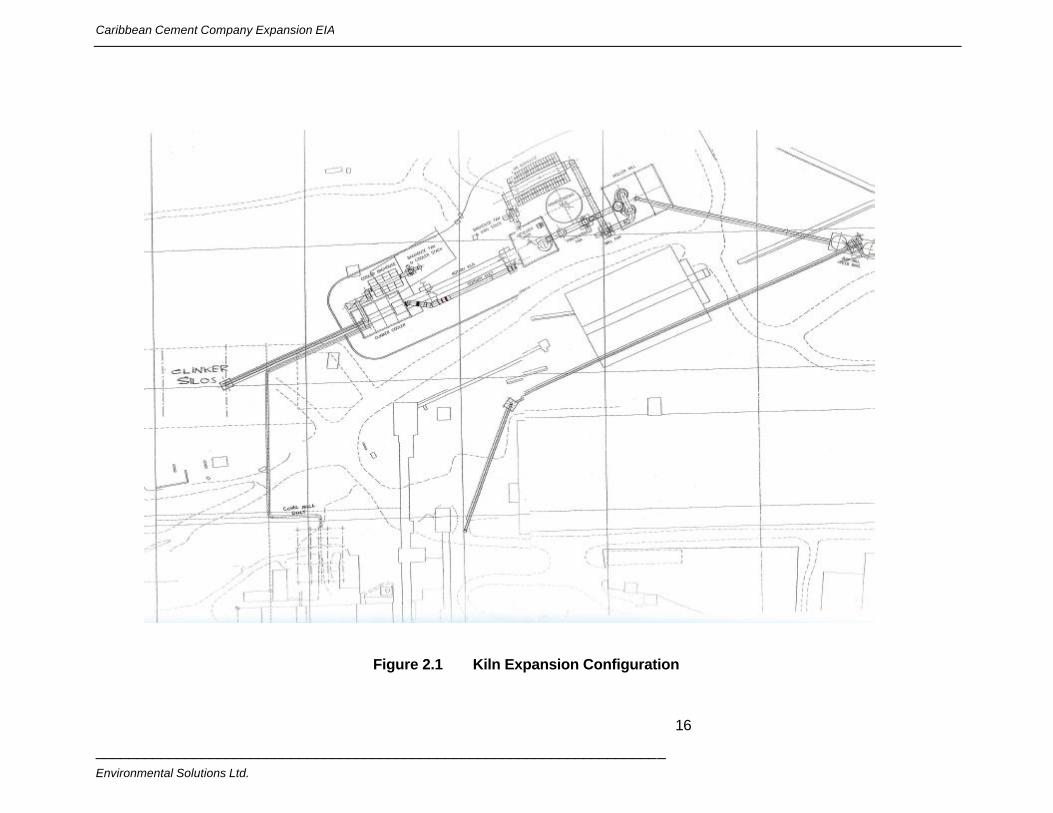
(kiln 5) on an existing footprint at the company's facility at Rockfort, as well as modify their existing
dry line (kiln 4) to improve emissions (Figure 2.1). They will also shutdown the existing kiln 3 wet
process line. As part of the kiln 4 modifications, the company proposes to replace the electrostatic
precipitators (ESP) on the kiln and clinker cooler to more efficient baghouse filter systems, as well
as to raise the stack height of kiln 4 from 44 m to 68 m in order to improve pollution dispersion.
The new dry line cement production facility will be a 2,800-MTPD plant. The proposed upgrade will
increase the capacity of the plant by approximately one million tonnes of clinker per year, while
utilizing the latest technology and innovation available in the cement industry. The proposed kiln 5
systems consisting of a vertical roller mill, preheater vessels, calciner, kiln, and clinker cooler will all
use the most recent technology, thus significantly lowering operating costs. In fact the technology
will see a low NOx burner and a low NOx calciner associated with the new dry line, while a low
NOx burner is already installed at kiln 4. In addition, firing of fuel in the riser duct of the
preheater/precalciner will be utilized to reduce NOx emissions.
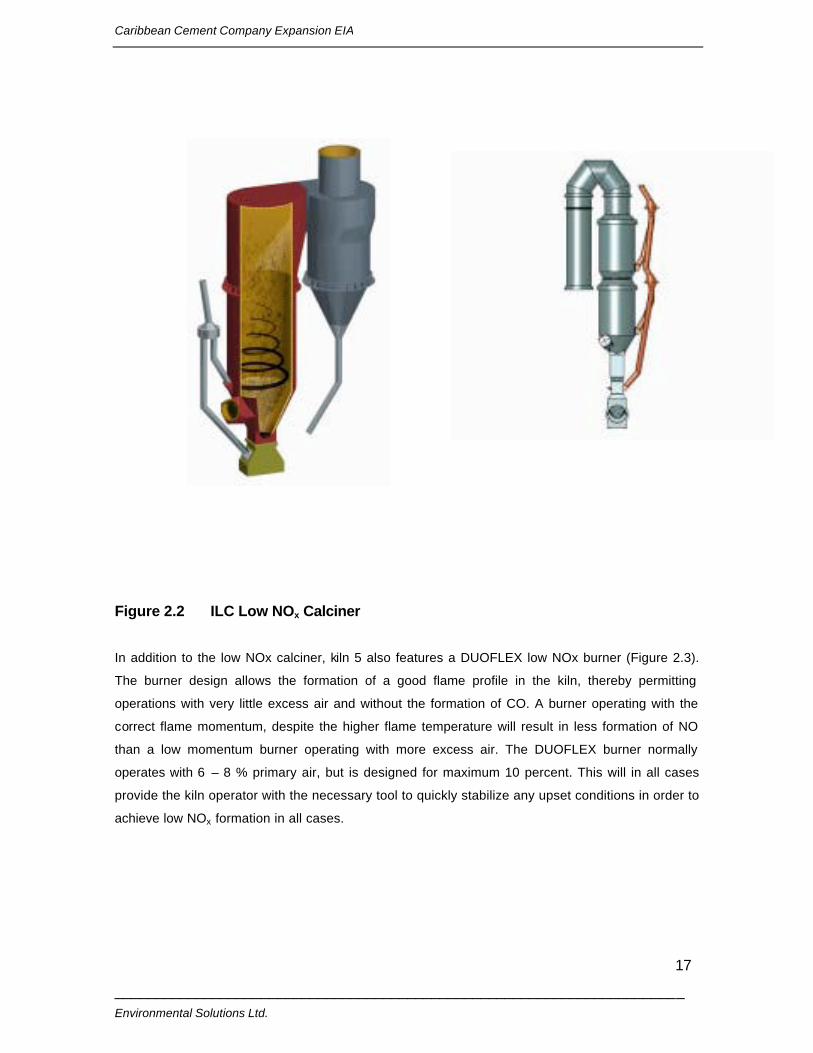
Figure 2.2 shows the ILC Low NOx calciner that is constructed to utilize and favour as many of the
NOx removing reactions as possible. At the inlet to the reduction zone where the coal is introduced
the only oxygen available is the amount present in the rotary kiln gases and this favours the NOx
reduction reactions. These reactions require high temperature and this is provided by splitting the
raw meal between the oxidizing zone and the reduction zone, thus improving the efficiency of the
reaction, and thereby reducing NOx formation. The temperature is kept between 925-1050 °C or as
high as possible without getting any encrustations in the kiln riser and the reduction zone.
Caribbean Cement Company Expansion EIA
______________________________________________________________________ Environmental Solutions Ltd.
16
Figure 2.1 Kiln Expansion Configuration
Caribbean Cement Company Expansion EIA
______________________________________________________________________ Environmental Solutions Ltd.
17
Figure 2.2 ILC Low NOx Calciner
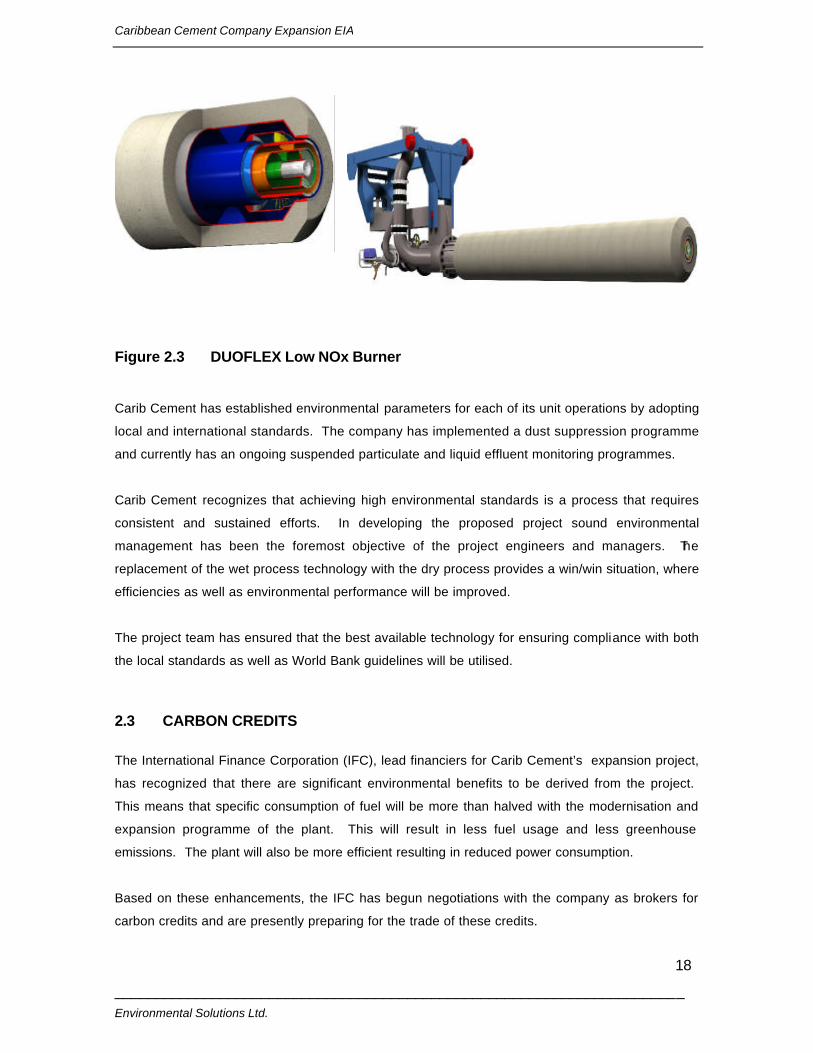
In addition to the low NOx calciner, kiln 5 also features a DUOFLEX low NOx burner (Figure 2.3).
The burner design allows the formation of a good flame profile in the kiln, thereby permitting
operations with very little excess air and without the formation of CO. A burner operating with the
correct flame momentum, despite the higher flame temperature will result in less formation of NO
than a low momentum burner operating with more excess air. The DUOFLEX burner normally
operates with 6 – 8 % primary air, but is designed for maximum 10 percent. This will in all cases
provide the kiln operator with the necessary tool to quickly stabilize any upset conditions in order to
achieve low NOx formation in all cases.
Caribbean Cement Company Expansion EIA
______________________________________________________________________ Environmental Solutions Ltd.
18
Figure 2.3 DUOFLEX Low NOx Burner
Carib Cement has established environmental parameters for each of its unit operations by adopting
local and international standards. The company has implemented a dust suppression programme
and currently has an ongoing suspended particulate and liquid effluent monitoring programmes.
Carib Cement recognizes that achieving high environmental standards is a process that requires
consistent and sustained efforts. In developing the proposed project sound environmental
management has been the foremost objective of the project engineers and managers. The
replacement of the wet process technology with the dry process provides a win/win situation, where
efficiencies as well as environmental performance will be improved.
The project team has ensured that the best available technology for ensuring compliance with both
the local standards as well as World Bank guidelines will be utilised.
2.3 CARBON CREDITS
The International Finance Corporation (IFC), lead financiers for Carib Cement’s expansion project,
has recognized that there are significant environmental benefits to be derived from the project.
This means that specific consumption of fuel will be more than halved with the modernisation and
expansion programme of the plant. This will result in less fuel usage and less greenhouse
emissions. The plant will also be more efficient resulting in reduced power consumption.
Based on these enhancements, the IFC has begun negotiations with the company as brokers for
carbon credits and are presently preparing for the trade of these credits.

Caribbean Cement Company Expansion EIA
______________________________________________________________________ Environmental Solutions Ltd.
19
“Carbon credits are greenhouse gas (GHG) emission reductions that are created
when a project reduces or avoids the emissions of GHGs, such as carbon dioxide
or methane, relative to what would have been emitted under a 'business as usual'
scenario. Under the IFC’s Carbon Finance Facilities, the IFC purchases carbon
credits for the benefit of the Government of the Netherlands under the international
emission reduction transfer rules of the Kyoto Protocol”. (Source - IFC Website).
Caribbean Cement Company Expansion EIA
______________________________________________________________________ Environmental Solutions Ltd.
20
2.3 PROJECT ENGINEERING
The engineering work to be performed for the project will conform to the latest Codes and
Standards applicable in the USA and Jamaica. Documents and drawings defining the project in
detail will consist of:
• Plot Plan
• Process and Mechanical Flow Sheets
• General Arrangement Drawings
• Equipment Drawings
• Process Ductwork
• Dedusting Ductwork
• Piping Diagrams
• Utility and Related Drawings
• Chutes, Bins, Spouts and Hoppers
• Maintenance Platforms
• Civil/Structural Drawings
• Electrical Engineering – Power Distribution, Control System
• Specifications
• As-Built (Record) Drawings
Caribbean Cement Company Expansion EIA
______________________________________________________________________ Environmental Solutions Ltd.
21
3.0 POLICY, LEGAL AND REGULATORY FRAMEWORK
The following pieces of legislation relate to the proposed plan of the Carib Cement to expand and
modify its generating facility in Rockfort, Kingston.
3.1 LEGISLATION RELATING TO DEVELOPMENT
The Natural Resources Conservation Authority (NRCA), now the National Environment and
Planning Agency (NEPA), has been given responsibility for environmental management in
Jamaica under the NRCA Act of 1991. Since the promulgation of the Act, the NRCA has been
developing local standards. The Act was strengthened by supporting regulations, which became
effective in January 1997. The underlying principles, which have been used in the development
of the Act, are:
• The Polluter pays Principle
• The Cradle to Grave approach to waste management
The NRCA Act binds the Crown and as such supersedes all other legislation relating to
environmental issues. The Minister is empowered to request an Environmental Impact
Assessment (EIA) in relation to certain major projects. Under this authority Carib Cement was
asked to complete this EIA as part of its expansion project
3.1.1 The Natural Resources Conservation (Permits and Licences) Regulations
(1996)
These regulations came into effect on January 1, 1997 when the Environmental Permit and
License System (P&L) was introduced. The (P&L) is a mechanism to ensure that all
developments in Jamaica meet required standards in order to minimize negative environmental
impacts. The P&L is administered by NEPA, through the Applications Section (formerly the
Permit and License Secretariat). Persons undertaking new developments, which fall within a
prescribed category, require permits. Under the NRCA Act of 1991, the NRCA has the authority
to issue, suspend and revoke environmental permits and licences. An applicant for a Permit or
License must complete a Permit Application Form (PAF) as well as a Project Information Form
(PIF) for submission to the NRCA/NEPA.
Caribbean Cement Company Expansion EIA
______________________________________________________________________ Environmental Solutions Ltd.
22
3.2 LEGISLATION RELATING TO POLLUTION CONTROL
Pollution prevention is significant consideration for Carib Cement’s operations and therefore all
pertinent policies and regulations need to be complied with. The legislation that relates to Carib
Cement’s operations is outlined below.
3.2.1 Natural Resources Conservation Authority Act, 1991
The N.R.C.A Act, 1991, empowers the authority to manage, conserve and protect the natural
resources of Jamaica by introducing appropriate standards and codes of practice. The body is
also responsible for investigating the effect on the environment of any activity that may cause
pollution or which involves waste management. Sections of the Act that relate specifically to
pollution control state that:
• No person shall discharge on or cause or permit the entry into waters, on the ground or
into the ground, any sewage or trade effluent or any poisonous, noxious or polluting
matter.
• No person is allowed to construct or reconstruct or alter any works designed for the
discharge of any effluent.
The Act also empowers the authority to require of any owner or operator of a facility that is a
probable polluter, information on the performance of the facility, the quantity and condition of
effluent discharged and the area affected by the discharge of such effluent.
The Authority has the right to consult with any agency or department of Government having
functions in relation to water or water resources to carry out operations to:
• Prevent pollutants from reaching water bodies.
• Remove and dispose of any polluting matter or remedy or mitigate any polluted water
body in order to restore it.
3.2.2 The Natural Resources Conservation Authority (Air Quality) Regulations,
2002
Part I of this Act stipulates license requirements and states that every owner of a major facility or
a significant facility shall apply for an air pollutant discharge license. Part II speaks to the stack
emission targets, standards and guidelines (Appendix I).
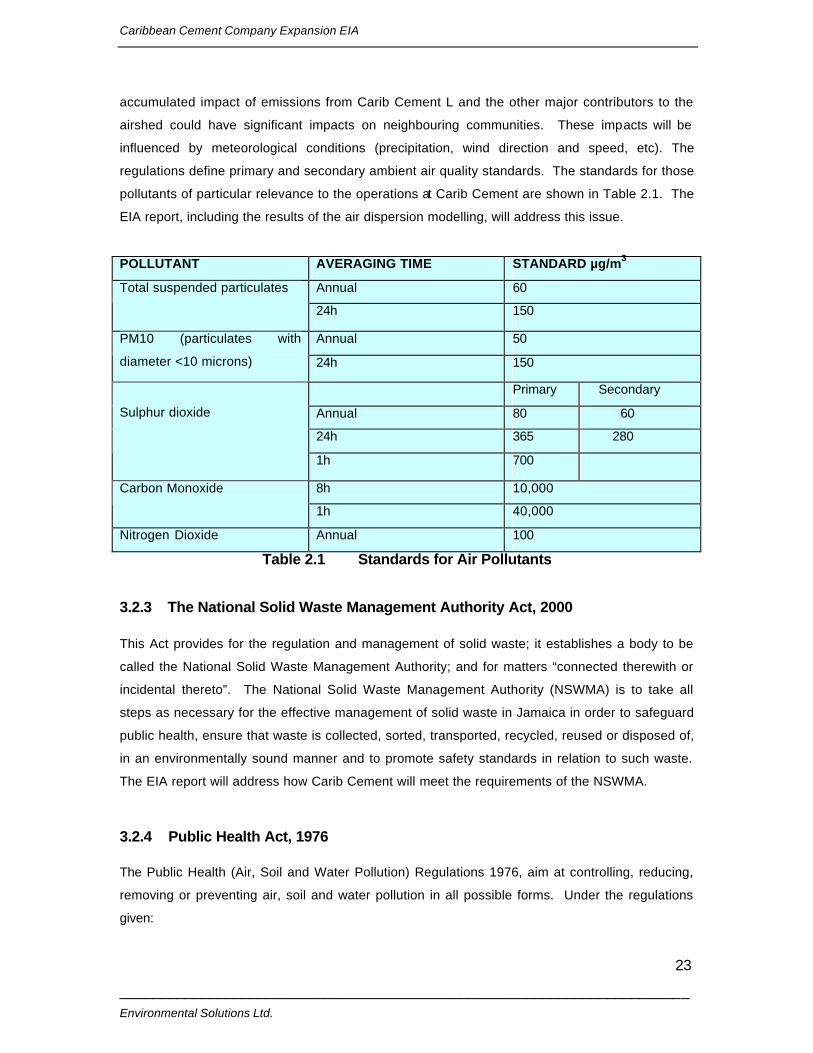
Emissions from the Carib Cement plant have the potential to influence ambient air quality. The
Caribbean Cement Company Expansion EIA
______________________________________________________________________ Environmental Solutions Ltd.
23
accumulated impact of emissions from Carib Cement L and the other major contributors to the
airshed could have significant impacts on neighbouring communities. These impacts will be
influenced by meteorological conditions (precipitation, wind direction and speed, etc). The
regulations define primary and secondary ambient air quality standards. The standards for those
pollutants of particular relevance to the operations at Carib Cement are shown in Table 2.1. The
EIA report, including the results of the air dispersion modelling, will address this issue.
POLLUTANT AVERAGING TIME STANDARD µg/m3
Annual 60 Total suspended particulates
24h 150
Annual 50 PM10 (particulates with
diameter <10 microns) 24h 150
Primary Secondary
Annual 80 60
24h 365 280
Sulphur dioxide
1h 700
8h 10,000 Carbon Monoxide
1h 40,000
Nitrogen Dioxide Annual 100
Table 2.1 Standards for Air Pollutants
3.2.3 The National Solid Waste Management Authority Act, 2000
This Act provides for the regulation and management of solid waste; it establishes a body to be
called the National Solid Waste Management Authority; and for matters “connected therewith or
incidental thereto”. The National Solid Waste Management Authority (NSWMA) is to take all
steps as necessary for the effective management of solid waste in Jamaica in order to safeguard
public health, ensure that waste is collected, sorted, transported, recycled, reused or disposed of,
in an environmentally sound manner and to promote safety standards in relation to such waste.
The EIA report will address how Carib Cement will meet the requirements of the NSWMA.
3.2.4 Public Health Act, 1976
The Public Health (Air, Soil and Water Pollution) Regulations 1976, aim at controlling, reducing,
removing or preventing air, soil and water pollution in all possible forms. Under the regulations
given:
Caribbean Cement Company Expansion EIA
______________________________________________________________________ Environmental Solutions Ltd.
24
• No individual or corporation is allowed to emit, deposit, issue or discharge into the
environment from any source.
• Whoever is responsible for the accidental presence in the environment of a contaminant
must advise the Environmental Control Division of the Ministry of Health and
Environmental Control, without delay.
• Any person or organization that conducts activities which release air contaminants such
as dust and other particulates is required to institute measures to reduce or eliminate the
presence of such contaminants.
• No industrial waste should be discharged into any water body, which will result in the
deterioration of the quality of the water.
Carib Cement’s compliance with these regulations is addressed in the EIA report.
3.2.5 The Clean Air Act, 1964
• This act refers to premises on which there are industrial works, the operation of which is
in the opinion of an inspector likely to result in the discharge of smoke or fumes or gases
or dust in the air.
• An inspector may enter any affected premise to examine, make enquiries, make tests
and take samples of any substance, smoke, fumes, gas or dust as he considers
necessary or proper for the performance of his duties.
3.3 REGULATIONS PERTAINING TO STANDARDS
3.3.1 Trade Effluent Standards
Since 1996 Jamaica has had draft regulations governing the quality of the effluent discharged
from facilities to public sewers and surface water systems. These draft guidelines require the
facility to meet certain basic water quality standards for trade effluent including sewage.
3.3.2 Noise Standards
Jamaica has no national legislation for noise, but World Bank guidelines have been adopted by
NEPA and are used for benchmarking purposes along with the draft National Noise Standards
that are being prepared. The guideline for daytime perimeter noise is 75 decibels. Section 4.2.4
addresses noise issues.
Caribbean Cement Company Expansion EIA
______________________________________________________________________ Environmental Solutions Ltd.
25
3.4 LEGISLATION RELATING TO FACTORY OPERATIONS
3.4.1 Factories Act, 1968
The Act empowers the Minister of Labour to register factories, inspect and regulate their
operations. The regulations updated in 1968 provide for the following:
• The safe means of approach or access to, and exit from, any factory, or machinery
• The fencing and covering of all dangerous places or machines;
• Life-saving and first aid appliances;
• Securing safety in connection with all operations carried on in a factory
• Securing safety in connection with the use of cranes, winches, pulley-blocks and of all
engines, machinery, mechanical gear and contrivances generally whatsoever;
• The periodic inspection, testing and classification, according to age, type or condition, of
boilers;
• The duties and responsibilities assignable to any person generally, and in particular to
employers, owners, and managers in charge of factories, in connection with any one or
more of such regulations;
• The proper ventilation of any factory, having regard to the nature of the process carried
on therein;
• The sanitation, including the provision of lavatory accommodation (having regard to the
number of workers employed) at any factory;
3.4.2 Petroleum and Oil Fuel (Landing & Storage) Act (1925)
This extends to the storage of petroleum in quantities greater than one hundred and twenty
imperial gallons in a building specially appointed for this purpose by the Minister.
3.4.3 The Office of Disaster Preparedness and Emergency Management Act
(1998)
This Act was established by the Office of Disaster Preparedness and Emergency Management
(ODPEM) to develop and implement policy and programmes to achieve and maintain an
appropriate state of national and sectoral preparedness for coping with emergency situations.
Carib Cement should have its own disaster and emergency response plan for fire, earthquake,
and storm events, specific to its operations, to minimise loss of life, injury and damage to
structures.
Caribbean Cement Company Expansion EIA
______________________________________________________________________ Environmental Solutions Ltd.
26
3.5 LEGISLATION RELATING TO ENVIRONMENTAL SETTING
3.5.1 Beach Control Act, 1956
The NRCA Act, 1991 names the NRCA as the governing body of The Beach Control Act of 1956.
This Act states that:
• No person shall encroach on or use the foreshore or floor of the sea for any public
purpose or in connection with any trade or business, or commercial enterprise without a
proper license.
• The Minister, may upon the recommendation of the Authority, declare any part of the
foreshore and the floor of the sea together with the water lying on such a part of the floor
of the sea to be a protected area.
3.5.2 The Water Resources Act, 1995
The Act established the Water Resources Authority (WRA) and authorizes this Authority to
regulate, allocate, conserve and manage the water resources of the island. The Authority is also
responsible for water quality control and is required under Section 4 of the Act to provide upon
request to any department or agency of Government, technical assistance for any projects,
programmes or activities relating to development, conservation and the use of water resources. It
is the responsibility of the WRA as outlined in Section 16 to prepare, for the approval of the
Minister, a draft National Water Resources Master Plan for Jamaica. Areas to be covered in this
Master Plan include objectives for the development, conservation and use of water resources in
Jamaica with consideration being given to the protection and encouragement of economic
activity, and the protection of the environment and the enhancement of environmental values.
• The Minister may declare an order that prohibits activities such as fishing, the use of
boats, the disposal of rubbish or waste, water-skiing, dredging, the destruction of marine
organisms or the search for and removal of artefacts from protected areas.
• No person may erect, construct or maintain any dock, wharf, pier or jetty on the foreshore
or the floor of the sea, unless expressly permitted to do so through a license granted by
the Minister.
• The Authority is empowered to maintain, use and develop beaches for the benefit of the
public and to take steps for the establishment of the right of the public to use beaches or
to gain access to such.
Caribbean Cement Company Expansion EIA
______________________________________________________________________ Environmental Solutions Ltd.
27
4. 0 DESCRIPTION OF THE EXISTING ENVIRONMENT
4.1 PHYSICAL ENVIRONMENT
The Carib Cement facility is located on the south coast of Jamaica, in Kingston Harbour,
separated from the Caribbean Sea proper by the Palisadoes sandspit/ tombolo. It lies within the
Kingston Metropolitan Area (KMA), with the Liguanea Plains and Kingston to the west, Long
Mountain beyond that, the Blue Mountains, to the north, Harbour View and St Thomas to the east
and Kinsgton Harbour, the Palisadoes and the Norman Manley International Airport to the south.
4.1.1 Climate
Since local and regional climatic conditions affect the dispersion of pollutants, an understanding
of the prevailing long-term climatic patterns and the short term, site-specific meteorological
conditions will help to assess the likely impact of emissions from the cement plant on local air
quality.
The site is only approximately 6 km southwest of the meteorological station at Norman Manley
International Airport (NMIA) and there are no intervening topographical features that would result
in differences in meteorology between NMIA and the site. Meteorological data from NMIA will
therefore be representative of the site and can be considered site-specific.
Table 4.1 summarises the temperature, rainfall, and humidity values recorded between 1951 and
1980 and this data is indicative of the conditions that have existed at the site. The minimum
temperature ranges from 22.3 °C to 25.6 °C with highest temperatures in July and August and the
maximum daily temperature ranges from 29.6 °C to 31.9 °C. The relatively narrow range in
temperature reflects the moderating influence of the sea. Highest monthly average rainfall occurs
between May and October and the annual mean rainfall is 62.1 mm. October has the highest
average monthly rainfall (167 mm) and days with rain (10 days).
The main regional scale weather features that affect the island are upper level pressure troughs
(an elongated area of low atmospheric pressure at high altitude), tropical waves and incipient
storms and cold fronts. Upper level troughs occur year round but are more frequent in the winter
when there are more frequent temperate latitude low-pressure systems and fronts. During the
winter months, cold fronts associated with low-pressure systems that form over the south central
United States can reach Jamaica although the still warm water in the Gulf of Mexico and the

Caribbean Cement Company Expansion EIA
______________________________________________________________________ Environmental Solutions Ltd.
28
Caribbean moderates them. These fronts can be stationary and produce much rainfall over the
northern areas of Jamaica.
The summer troughs are fewer but can be more persistent. The troughs sometimes interact with
the easterly waves (a wavelike disturbance in the tropical easterly winds that usually moves from
east to west) and tropical storms to produce intense rainfall.
Tropical waves and incipient storms occur in the summer and move from east to west and are
good rainfall producers. A tropical wave is a kink or bend in the normally straight flow of surface
air in the tropics that form a low-pressure trough, or pressure boundary, and showers and
thunderstorms. It can develop into a tropical cyclone.
JAN FEB MAR APR MAY JUN JUL AUG SEP OCT NOV DEC Annual
Mean
Maximum
Temp. (°C)
29.8 29.6 29.8 30.3 30.8 31.2 31.7 31.9 31.7 31.3 31.1 30.5 30.8
Minimum
Temp. (°C)
22.3 22.3 22.9 22.6 24.7 25.3 25.6 25.3 25.3 24.8 24.1 23.1 24.0
Rainfall
(mm)
18 16 14 27 100 83 40 81 107 167 61 31 62.1
No. of rain
days
4 4 3 5 5 6 4 6 8 10 6 4 5.4
Rel. Hum.
7am (%)
80 78 77 77 76 73 76 76 78 80 79 78 77.3
Rel. Hum.
1pm (%)
61 62 64 60 66 65 65 68 68 65 65 64 64.4
Sunshine
(Hours)
8.3 8.6 8.5 8.7 8.2 7.7 8.2 8 7.2 7.4 7.8 7.8 8.0
Table 4.1 Monthly Mean and Annual Mean Values for Selected Meteorological
Parameters at Norman Manley International Airport 1951 – 1980.
The dominant winds over Jamaica are the northeast trade winds whose strength is governed by
the strength and location of the Azores-Bermuda sub tropic high-pressure cell. During the
summer months the high-pressure cell is weaker and farther north (than in summer) and
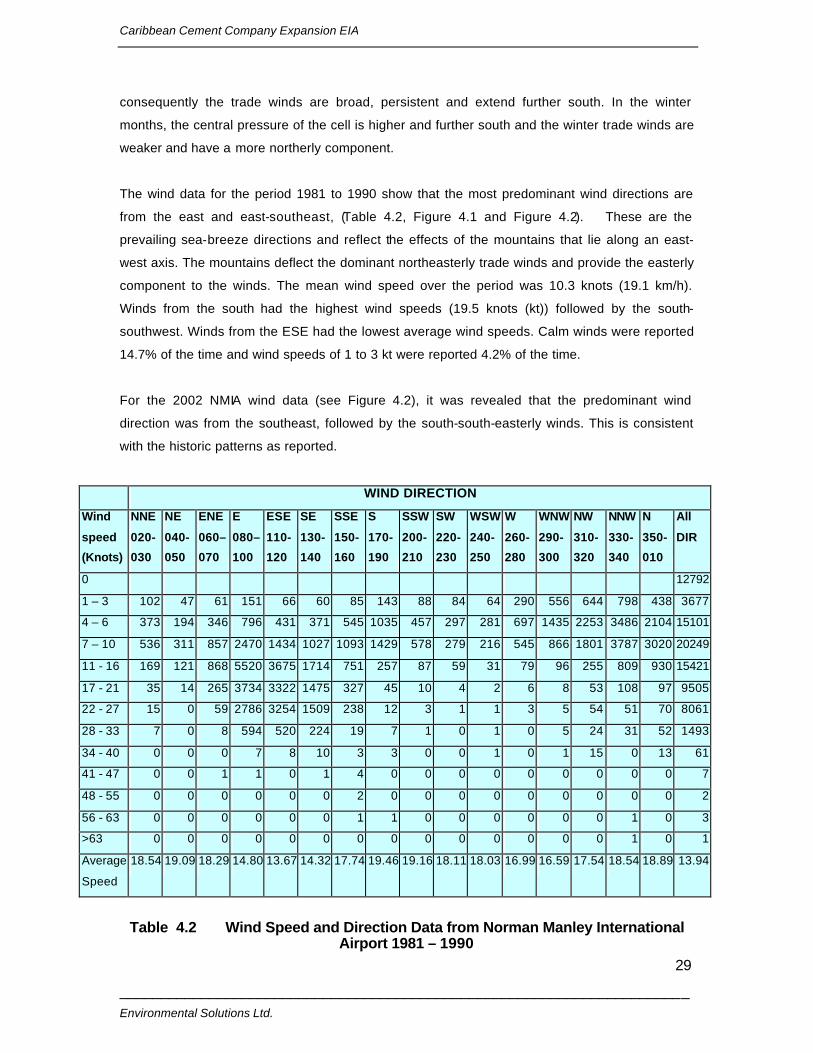
Caribbean Cement Company Expansion EIA
______________________________________________________________________ Environmental Solutions Ltd.
29
consequently the trade winds are broad, persistent and extend further south. In the winter
months, the central pressure of the cell is higher and further south and the winter trade winds are
weaker and have a more northerly component.
The wind data for the period 1981 to 1990 show that the most predominant wind directions are
from the east and east-southeast, (Table 4.2, Figure 4.1 and Figure 4.2). These are the
prevailing sea-breeze directions and reflect the effects of the mountains that lie along an east-
west axis. The mountains deflect the dominant northeasterly trade winds and provide the easterly
component to the winds. The mean wind speed over the period was 10.3 knots (19.1 km/h).
Winds from the south had the highest wind speeds (19.5 knots (kt)) followed by the south-
southwest. Winds from the ESE had the lowest average wind speeds. Calm winds were reported
14.7% of the time and wind speeds of 1 to 3 kt were reported 4.2% of the time.
For the 2002 NMIA wind data (see Figure 4.2), it was revealed that the predominant wind
direction was from the southeast, followed by the south-south-easterly winds. This is consistent
with the historic patterns as reported.
WIND DIRECTION
Wind
speed
(Knots)
NNE
020-
030
NE
040-
050
ENE
060–
070
E
080–
100
ESE
110-
120
SE
130-
140
SSE
150-
160
S
170-
190
SSW
200-
210
SW
220-
230
WSW
240-
250
W
260-
280
WNW
290-
300
NW
310-
320
NNW
330-
340
N
350-
010
All
DIR
0 12792
1 – 3 102 47 61 151 66 60 85 143 88 84 64 290 556 644 798 438 3677
4 – 6 373 194 346 796 431 371 545 1035 457 297 281 697 1435 2253 3486 2104 15101
7 – 10 536 311 857 2470 1434 1027 1093 1429 578 279 216 545 866 1801 3787 3020 20249
11 - 16 169 121 868 5520 3675 1714 751 257 87 59 31 79 96 255 809 930 15421
17 - 21 35 14 265 3734 3322 1475 327 45 10 4 2 6 8 53 108 97 9505
22 - 27 15 0 59 2786 3254 1509 238 12 3 1 1 3 5 54 51 70 8061
28 - 33 7 0 8 594 520 224 19 7 1 0 1 0 5 24 31 52 1493
34 - 40 0 0 0 7 8 10 3 3 0 0 1 0 1 15 0 13 61
41 - 47 0 0 1 1 0 1 4 0 0 0 0 0 0 0 0 0 7
48 - 55 0 0 0 0 0 0 2 0 0 0 0 0 0 0 0 0 2
56 - 63 0 0 0 0 0 0 1 1 0 0 0 0 0 0 1 0 3
>63 0 0 0 0 0 0 0 0 0 0 0 0 0 0 1 0 1
Average
Speed
18.54 19.09 18.29 14.80 13.67 14.32 17.74 19.46 19.16 18.11 18.03 16.99 16.59 17.54 18.54 18.89 13.94
Table 4.2 Wind Speed and Direction Data from Norman Manley International Airport 1981 – 1990
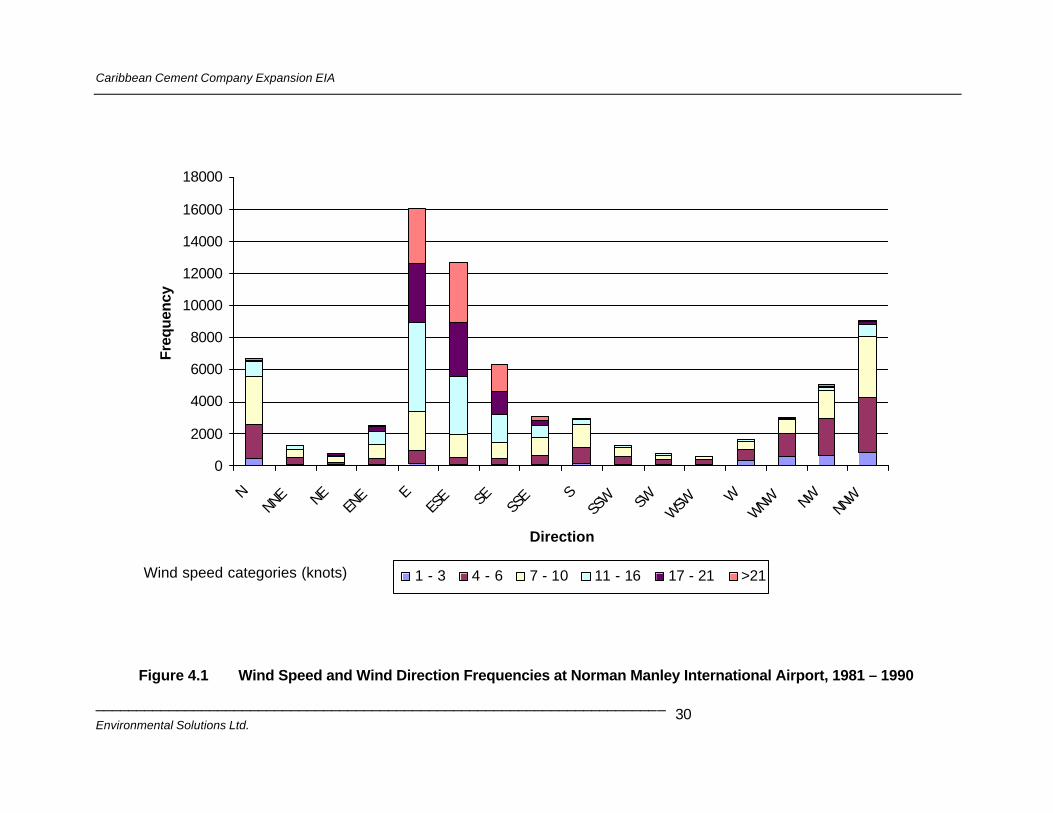
Caribbean Cement Company Expansion EIA
______________________________________________________________________ Environmental Solutions Ltd.
30
Figure 4.1 Wind Speed and Wind Direction Frequencies at Norman Manley International Airport, 1981 – 1990
0
2000
4000
6000
8000
10000
12000
14000
16000
18000
NNNE NE
ENE E
ESE SE SS
E SSS
W SWWSW W
WNW NWNN
W
Direction
Freq
uenc
y
1 - 3 4 - 6 7 - 10 11 - 16 17 - 21 >21Wind speed categories (knots)
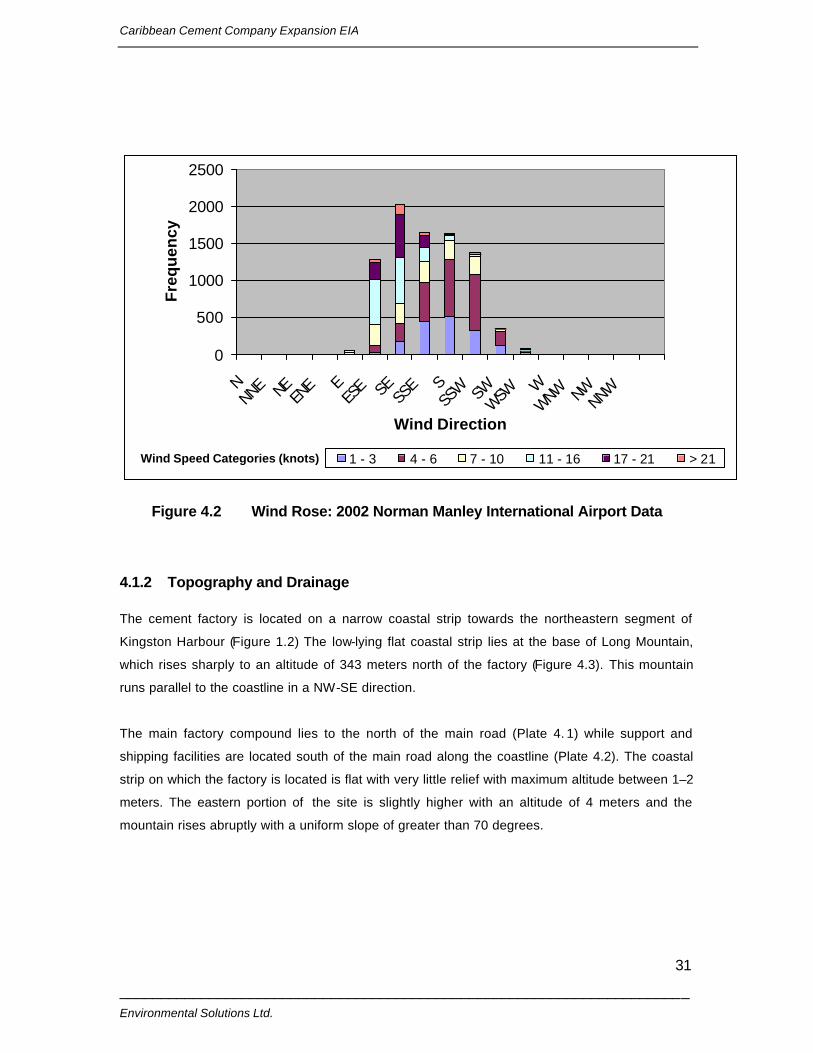
Caribbean Cement Company Expansion EIA
______________________________________________________________________ Environmental Solutions Ltd.
31
0
500
1000
1500
2000
2500
NNNE NE EN
E EES
E SE SSE S
SSW SW
WSWWWNW NWNNW
Wind Direction
Fre
qu
ency
1 - 3 4 - 6 7 - 10 11 - 16 17 - 21 > 21Wind Speed Categories (knots)
Figure 4.2 Wind Rose: 2002 Norman Manley International Airport Data
4.1.2 Topography and Drainage
The cement factory is located on a narrow coastal strip towards the northeastern segment of
Kingston Harbour (Figure 1.2) The low-lying flat coastal strip lies at the base of Long Mountain,
which rises sharply to an altitude of 343 meters north of the factory (Figure 4.3). This mountain
runs parallel to the coastline in a NW-SE direction.
The main factory compound lies to the north of the main road (Plate 4. 1) while support and
shipping facilities are located south of the main road along the coastline (Plate 4.2). The coastal
strip on which the factory is located is flat with very little relief with maximum altitude between 1–2
meters. The eastern portion of the site is slightly higher with an altitude of 4 meters and the
mountain rises abruptly with a uniform slope of greater than 70 degrees.
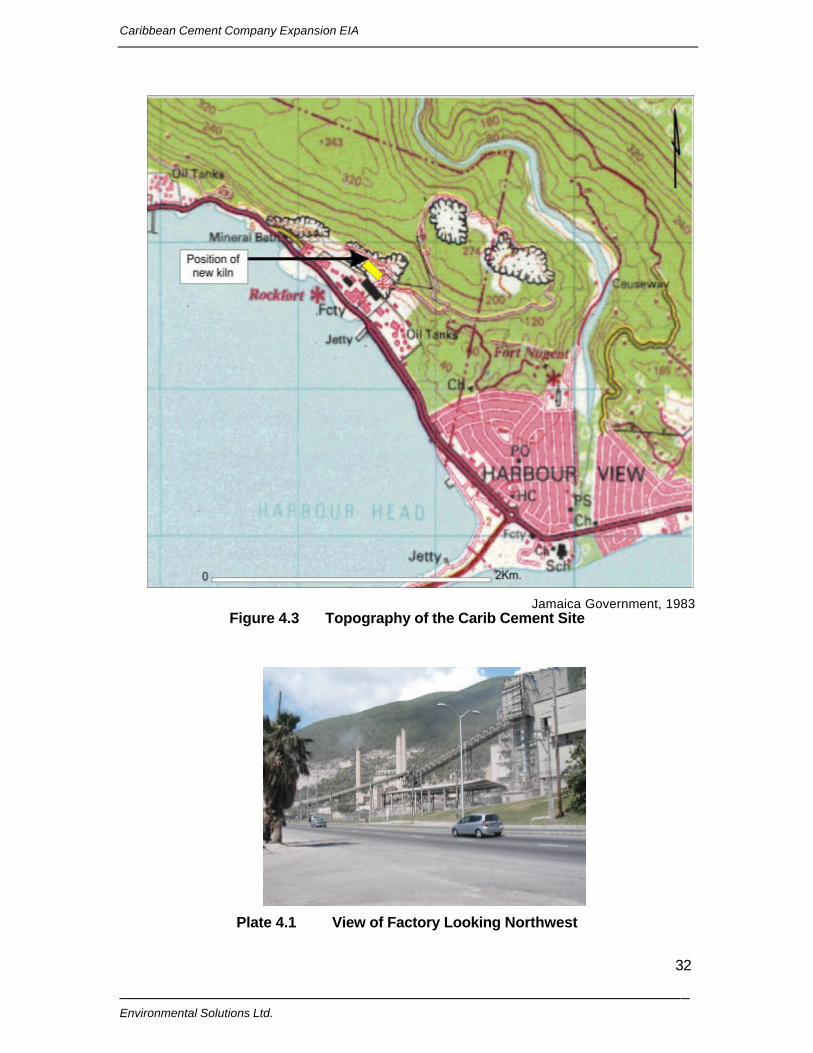
Caribbean Cement Company Expansion EIA
______________________________________________________________________ Environmental Solutions Ltd.
32
Jamaica Government, 1983 Figure 4.3 Topography of the Carib Cement Site
Plate 4.1 View of Factory Looking Northwest
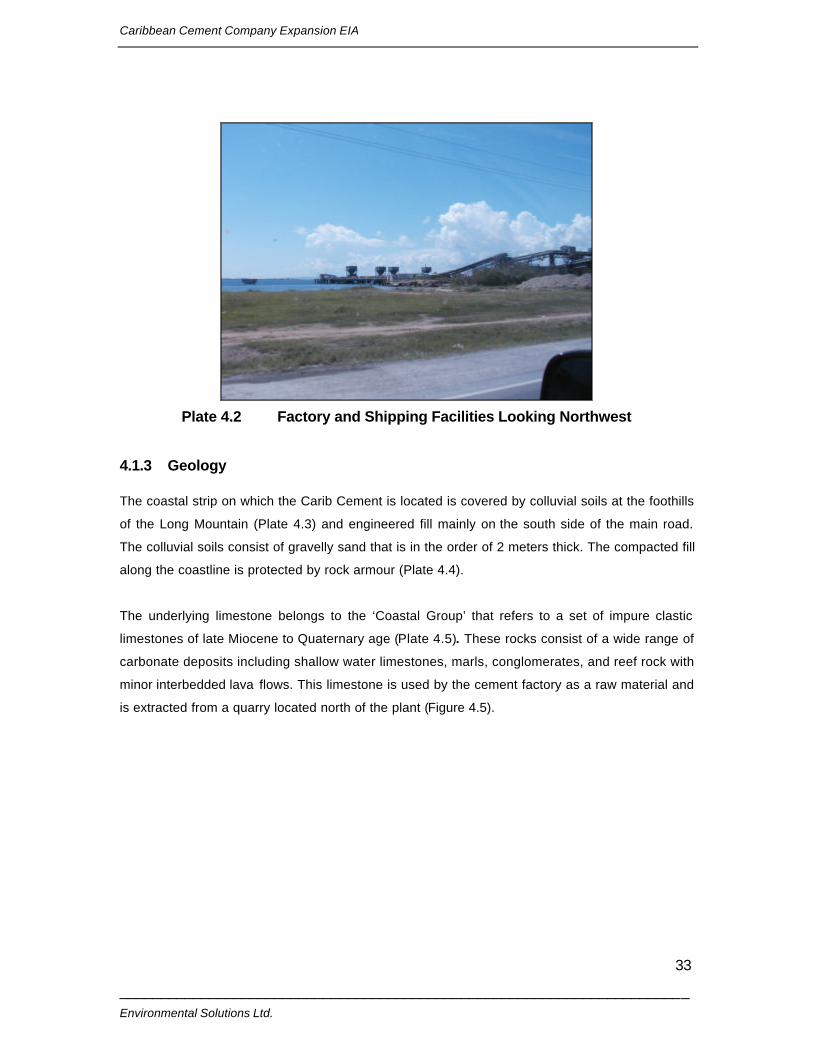
Caribbean Cement Company Expansion EIA
______________________________________________________________________ Environmental Solutions Ltd.
33
Plate 4.2 Factory and Shipping Facilities Looking Northwest
4.1.3 Geology
The coastal strip on which the Carib Cement is located is covered by colluvial soils at the foothills
of the Long Mountain (Plate 4.3) and engineered fill mainly on the south side of the main road.
The colluvial soils consist of gravelly sand that is in the order of 2 meters thick. The compacted fill
along the coastline is protected by rock armour (Plate 4.4).
The underlying limestone belongs to the ‘Coastal Group’ that refers to a set of impure clastic
limestones of late Miocene to Quaternary age (Plate 4.5). These rocks consist of a wide range of
carbonate deposits including shallow water limestones, marls, conglomerates, and reef rock with
minor interbedded lava flows. This limestone is used by the cement factory as a raw material and
is extracted from a quarry located north of the plant (Figure 4.5).
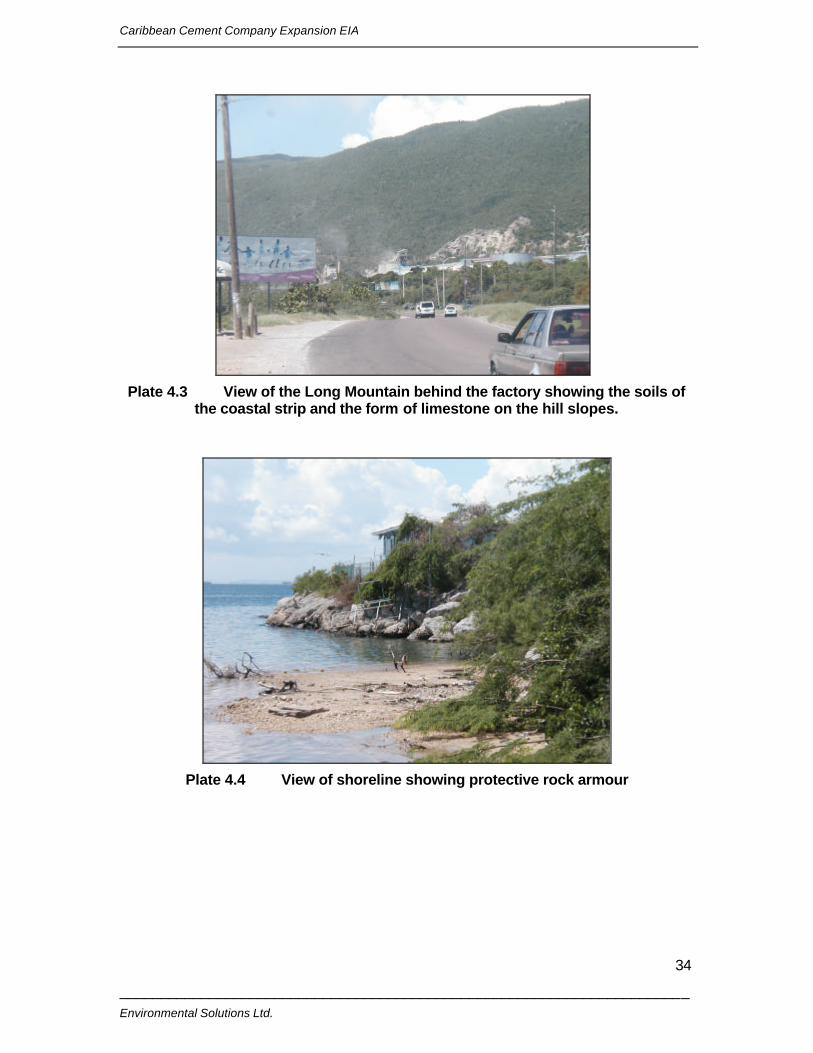
Caribbean Cement Company Expansion EIA
______________________________________________________________________ Environmental Solutions Ltd.
34
Plate 4.3 View of the Long Mountain behind the factory showing the soils of
the coastal strip and the form of limestone on the hill slopes.
Plate 4.4 View of shoreline showing protective rock armour
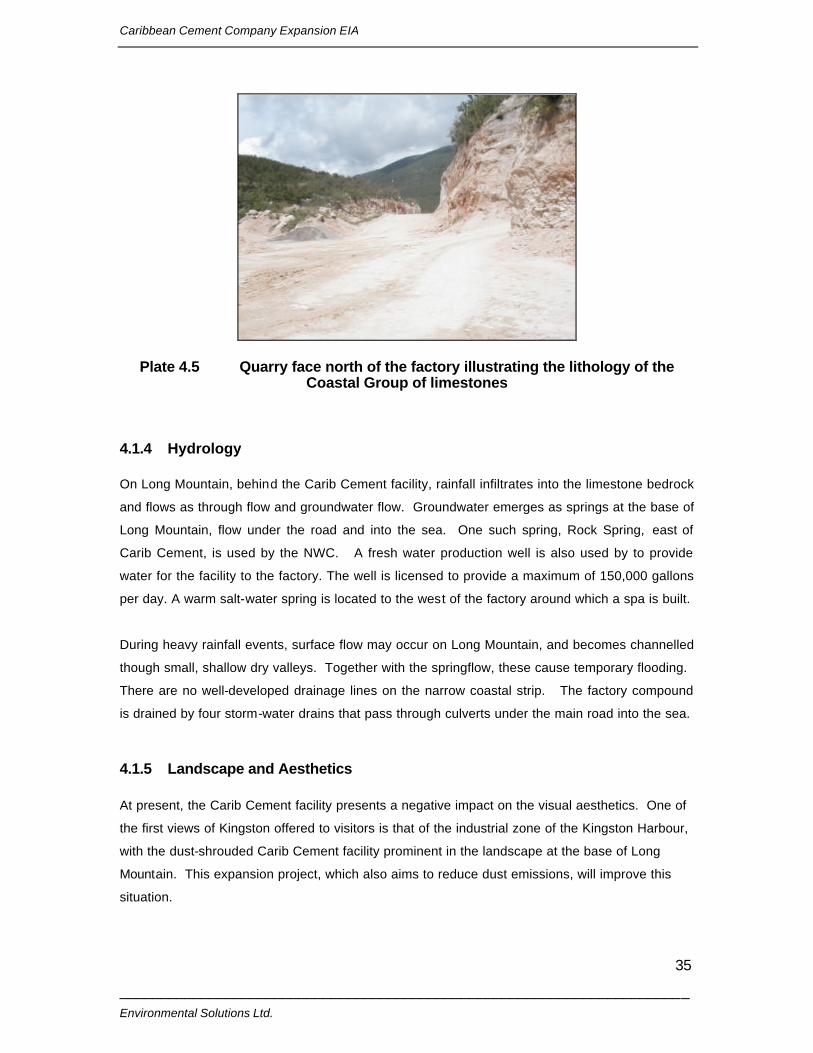
Caribbean Cement Company Expansion EIA
______________________________________________________________________ Environmental Solutions Ltd.
35
Plate 4.5 Quarry face north of the factory illustrating the lithology of the Coastal Group of limestones
4.1.4 Hydrology
On Long Mountain, behind the Carib Cement facility, rainfall infiltrates into the limestone bedrock
and flows as through flow and groundwater flow. Groundwater emerges as springs at the base of
Long Mountain, flow under the road and into the sea. One such spring, Rock Spring, east of
Carib Cement, is used by the NWC. A fresh water production well is also used by to provide
water for the facility to the factory. The well is licensed to provide a maximum of 150,000 gallons
per day. A warm salt-water spring is located to the west of the factory around which a spa is built.
During heavy rainfall events, surface flow may occur on Long Mountain, and becomes channelled
though small, shallow dry valleys. Together with the springflow, these cause temporary flooding.
There are no well-developed drainage lines on the narrow coastal strip. The factory compound
is drained by four storm-water drains that pass through culverts under the main road into the sea.
4.1.5 Landscape and Aesthetics
At present, the Carib Cement facility presents a negative impact on the visual aesthetics. One of
the first views of Kingston offered to visitors is that of the industrial zone of the Kingston Harbour,
with the dust-shrouded Carib Cement facility prominent in the landscape at the base of Long
Mountain. This expansion project, which also aims to reduce dust emissions, will improve this
situation.
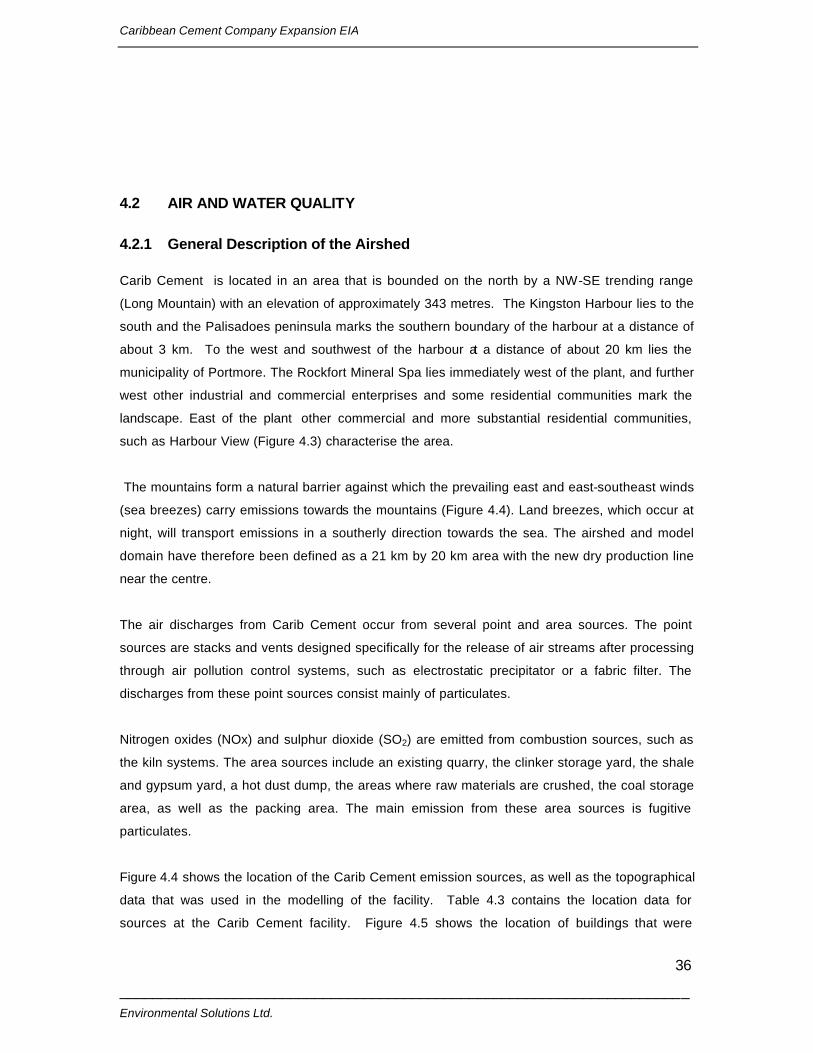
Caribbean Cement Company Expansion EIA
______________________________________________________________________ Environmental Solutions Ltd.
36
4.2 AIR AND WATER QUALITY
4.2.1 General Description of the Airshed
Carib Cement is located in an area that is bounded on the north by a NW-SE trending range
(Long Mountain) with an elevation of approximately 343 metres. The Kingston Harbour lies to the
south and the Palisadoes peninsula marks the southern boundary of the harbour at a distance of
about 3 km. To the west and southwest of the harbour at a distance of about 20 km lies the
municipality of Portmore. The Rockfort Mineral Spa lies immediately west of the plant, and further
west other industrial and commercial enterprises and some residential communities mark the
landscape. East of the plant other commercial and more substantial residential communities,
such as Harbour View (Figure 4.3) characterise the area.
The mountains form a natural barrier against which the prevailing east and east-southeast winds
(sea breezes) carry emissions towards the mountains (Figure 4.4). Land breezes, which occur at
night, will transport emissions in a southerly direction towards the sea. The airshed and model
domain have therefore been defined as a 21 km by 20 km area with the new dry production line
near the centre.
The air discharges from Carib Cement occur from several point and area sources. The point
sources are stacks and vents designed specifically for the release of air streams after processing
through air pollution control systems, such as electrostatic precipitator or a fabric filter. The
discharges from these point sources consist mainly of particulates.
Nitrogen oxides (NOx) and sulphur dioxide (SO2) are emitted from combustion sources, such as
the kiln systems. The area sources include an existing quarry, the clinker storage yard, the shale
and gypsum yard, a hot dust dump, the areas where raw materials are crushed, the coal storage
area, as well as the packing area. The main emission from these area sources is fugitive
particulates.
Figure 4.4 shows the location of the Carib Cement emission sources, as well as the topographical
data that was used in the modelling of the facility. Table 4.3 contains the location data for
sources at the Carib Cement facility. Figure 4.5 shows the location of buildings that were

Caribbean Cement Company Expansion EIA
______________________________________________________________________ Environmental Solutions Ltd.
37
modelled and input into the Building Profile Input Programme (BPIP) to simulate the building
downwash. The other significant air pollution point sources in the Kingston airshed are
summarized in Table 4.4
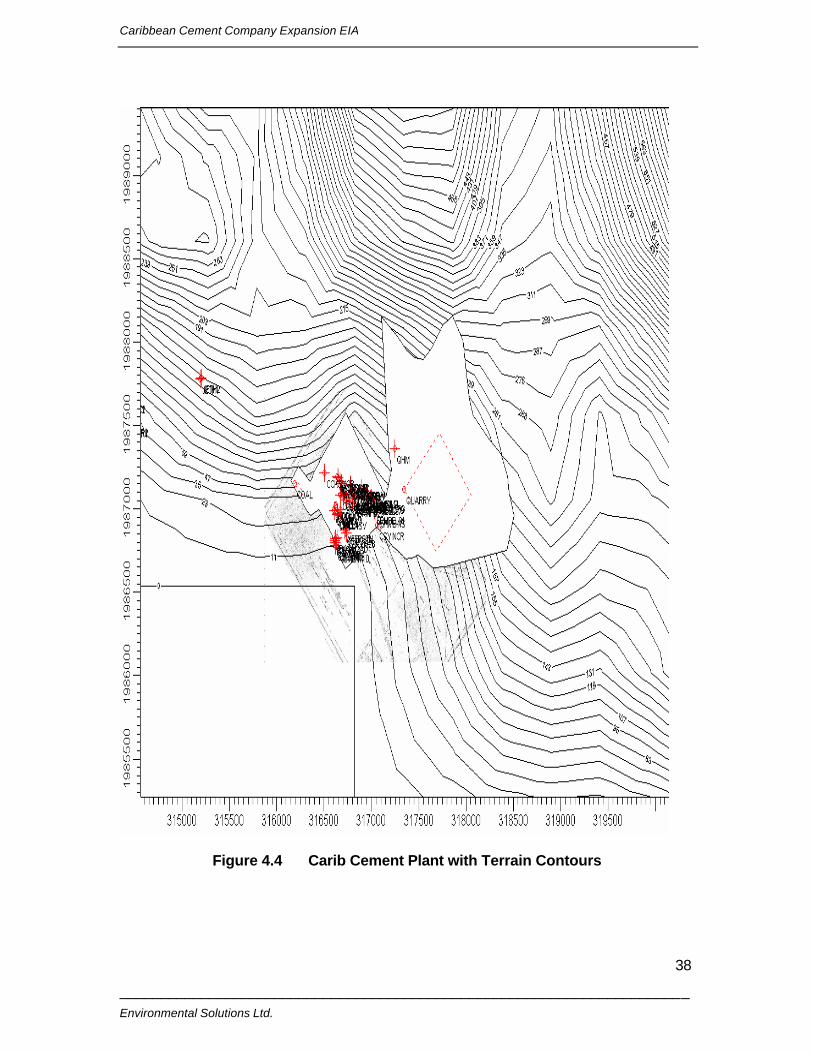
Caribbean Cement Company Expansion EIA
______________________________________________________________________ Environmental Solutions Ltd.
38
Figure 4.4 Carib Cement Plant with Terrain Contours
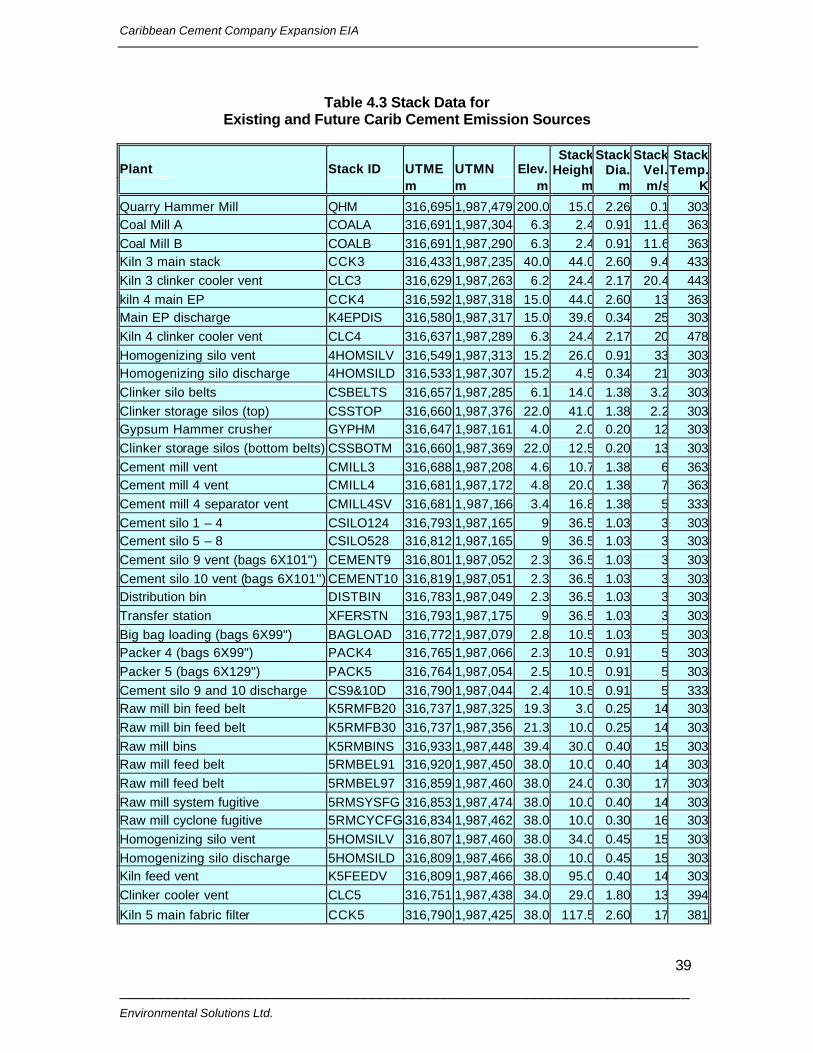
Caribbean Cement Company Expansion EIA
______________________________________________________________________ Environmental Solutions Ltd.
39
Table 4.3 Stack Data for Existing and Future Carib Cement Emission Sources
Plant Stack ID UTME UTMN Elev. Stack
HeightStack
Dia.Stack
Vel.Stack
Temp. m m m m m m/s K
Quarry Hammer Mill QHM 316,695 1,987,479 200.0 15.0 2.26 0.1 303Coal Mill A COALA 316,691 1,987,304 6.3 2.4 0.91 11.6 363Coal Mill B COALB 316,691 1,987,290 6.3 2.4 0.91 11.6 363Kiln 3 main stack CCK3 316,433 1,987,235 40.0 44.0 2.60 9.4 433Kiln 3 clinker cooler vent CLC3 316,629 1,987,263 6.2 24.4 2.17 20.4 443kiln 4 main EP CCK4 316,592 1,987,318 15.0 44.0 2.60 13 363Main EP discharge K4EPDIS 316,580 1,987,317 15.0 39.6 0.34 25 303Kiln 4 clinker cooler vent CLC4 316,637 1,987,289 6.3 24.4 2.17 20 478Homogenizing silo vent 4HOMSILV 316,549 1,987,313 15.2 26.0 0.91 33 303Homogenizing silo discharge 4HOMSILD 316,533 1,987,307 15.2 4.5 0.34 21 303Clinker silo belts CSBELTS 316,657 1,987,285 6.1 14.0 1.38 3.2 303Clinker storage silos (top) CSSTOP 316,660 1,987,376 22.0 41.0 1.38 2.2 303Gypsum Hammer crusher GYPHM 316,647 1,987,161 4.0 2.0 0.20 12 303Clinker storage silos (bottom belts) CSSBOTM 316,660 1,987,369 22.0 12.5 0.20 13 303Cement mill vent CMILL3 316,688 1,987,208 4.6 10.7 1.38 6 363Cement mill 4 vent CMILL4 316,681 1,987,172 4.8 20.0 1.38 7 363Cement mill 4 separator vent CMILL4SV 316,681 1,987,166 3.4 16.8 1.38 5 333Cement silo 1 – 4 CSILO124 316,793 1,987,165 9 36.5 1.03 3 303Cement silo 5 – 8 CSILO528 316,812 1,987,165 9 36.5 1.03 3 303Cement silo 9 vent (bags 6X101'') CEMENT9 316,801 1,987,052 2.3 36.5 1.03 3 303Cement silo 10 vent (bags 6X101'') CEMENT10 316,819 1,987,051 2.3 36.5 1.03 3 303Distribution bin DISTBIN 316,783 1,987,049 2.3 36.5 1.03 3 303Transfer station XFERSTN 316,793 1,987,175 9 36.5 1.03 3 303Big bag loading (bags 6X99") BAGLOAD 316,772 1,987,079 2.8 10.5 1.03 5 303Packer 4 (bags 6X99") PACK4 316,765 1,987,066 2.3 10.5 0.91 5 303Packer 5 (bags 6X129") PACK5 316,764 1,987,054 2.5 10.5 0.91 5 303Cement silo 9 and 10 discharge CS9&10D 316,790 1,987,044 2.4 10.5 0.91 5 333Raw mill bin feed belt K5RMFB20 316,737 1,987,325 19.3 3.0 0.25 14 303Raw mill bin feed belt K5RMFB30 316,737 1,987,356 21.3 10.0 0.25 14 303Raw mill bins K5RMBINS 316,933 1,987,448 39.4 30.0 0.40 15 303Raw mill feed belt 5RMBEL91 316,920 1,987,450 38.0 10.0 0.40 14 303Raw mill feed belt 5RMBEL97 316,859 1,987,460 38.0 24.0 0.30 17 303Raw mill system fugitive 5RMSYSFG 316,853 1,987,474 38.0 10.0 0.40 14 303Raw mill cyclone fugitive 5RMCYCFG 316,834 1,987,462 38.0 10.0 0.30 16 303Homogenizing silo vent 5HOMSILV 316,807 1,987,460 38.0 34.0 0.45 15 303Homogenizing silo discharge 5HOMSILD 316,809 1,987,466 38.0 10.0 0.45 15 303Kiln feed vent K5FEEDV 316,809 1,987,466 38.0 95.0 0.40 14 303Clinker cooler vent CLC5 316,751 1,987,438 34.0 29.0 1.80 13 394
Kiln 5 main fabric filter CCK5 316,790 1,987,425 38.0 117.5 2.60 17 381
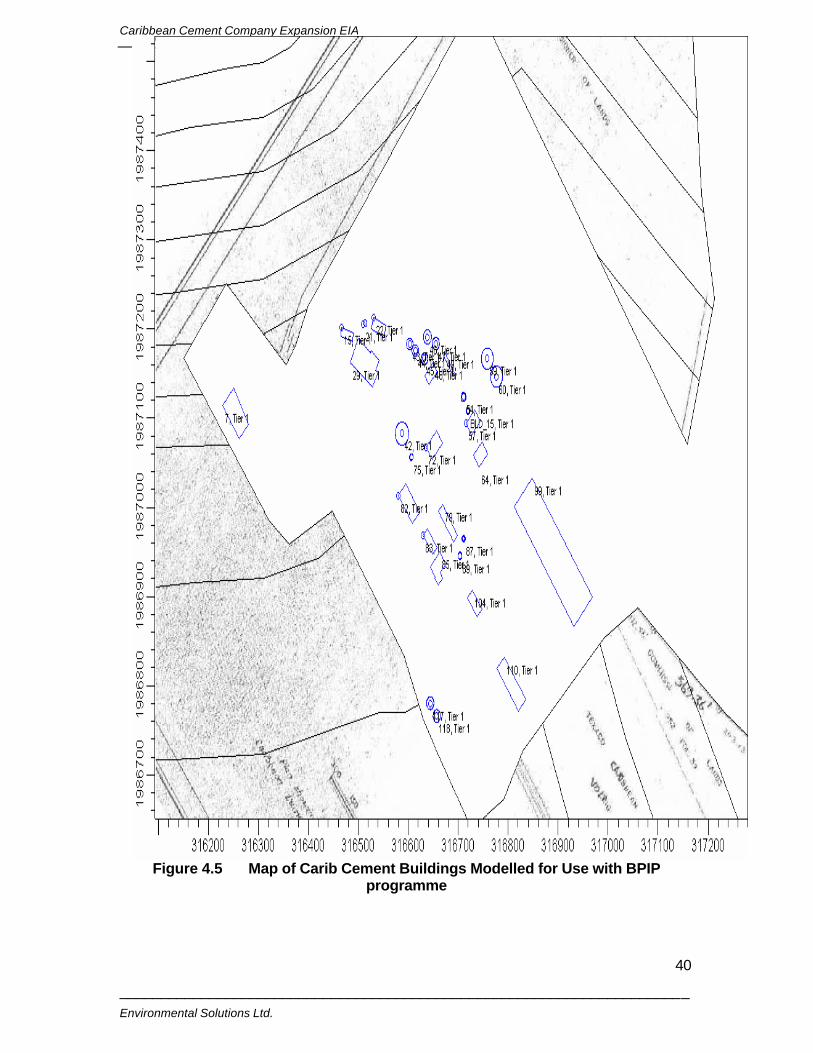
Caribbean Cement Company Expansion EIA
______________________________________________________________________ Environmental Solutions Ltd.
40
Figure 4.5 Map of Carib Cement Buildings Modelled for Use with BPIP programme
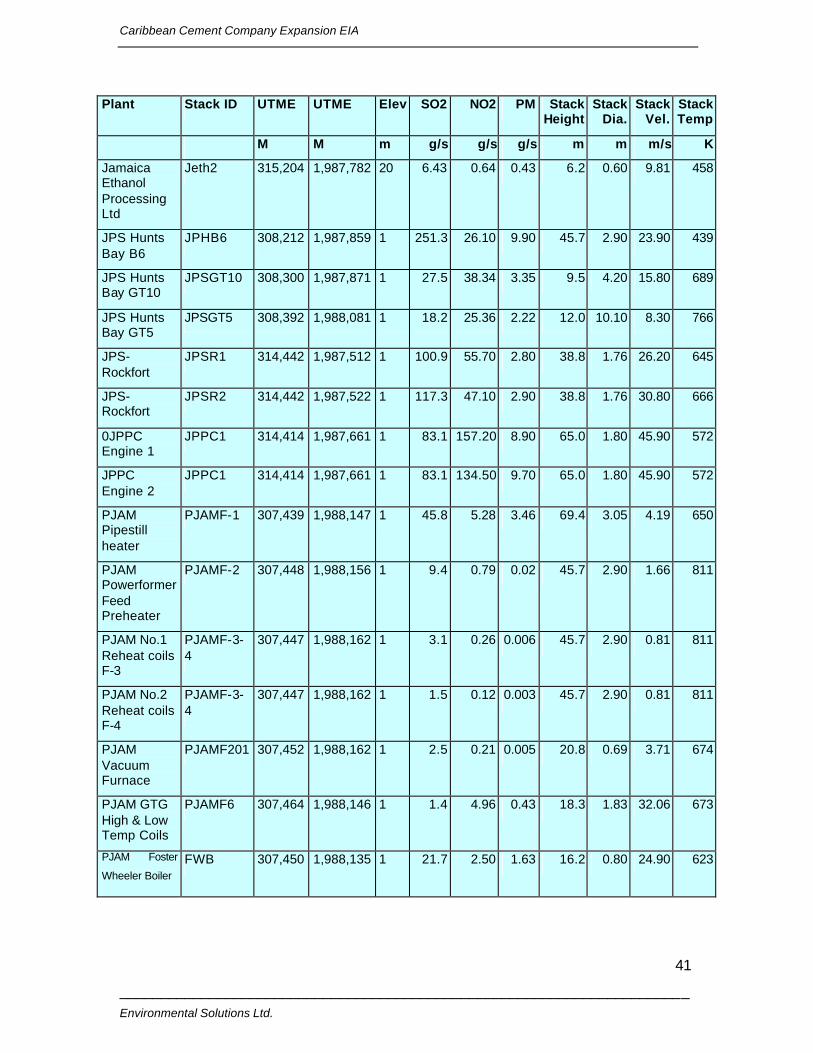
Caribbean Cement Company Expansion EIA
______________________________________________________________________ Environmental Solutions Ltd.
41
Plant Stack ID UTME UTME Elev SO2 NO2 PM Stack Height
Stack Dia.
Stack Vel.
Stack Temp
M M m g/s g/s g/s m m m/s K
Jamaica Ethanol Processing Ltd
Jeth2 315,204 1,987,782 20 6.43 0.64 0.43 6.2 0.60 9.81 458
JPS Hunts Bay B6
JPHB6 308,212 1,987,859 1 251.3 26.10 9.90 45.7 2.90 23.90 439
JPS Hunts Bay GT10
JPSGT10 308,300 1,987,871 1 27.5 38.34 3.35 9.5 4.20 15.80 689
JPS Hunts Bay GT5
JPSGT5 308,392 1,988,081 1 18.2 25.36 2.22 12.0 10.10 8.30 766
JPS-Rockfort
JPSR1 314,442 1,987,512 1 100.9 55.70 2.80 38.8 1.76 26.20 645
JPS-Rockfort
JPSR2 314,442 1,987,522 1 117.3 47.10 2.90 38.8 1.76 30.80 666
0JPPC Engine 1
JPPC1 314,414 1,987,661 1 83.1 157.20 8.90 65.0 1.80 45.90 572
JPPC Engine 2
JPPC1 314,414 1,987,661 1 83.1 134.50 9.70 65.0 1.80 45.90 572
PJAM Pipestill heater
PJAMF-1 307,439 1,988,147 1 45.8 5.28 3.46 69.4 3.05 4.19 650
PJAM Powerformer Feed Preheater
PJAMF-2 307,448 1,988,156 1 9.4 0.79 0.02 45.7 2.90 1.66 811
PJAM No.1 Reheat coils F-3
PJAMF-3-4
307,447 1,988,162 1 3.1 0.26 0.006 45.7 2.90 0.81 811
PJAM No.2 Reheat coils F-4
PJAMF-3-4
307,447 1,988,162 1 1.5 0.12 0.003 45.7 2.90 0.81 811
PJAM Vacuum Furnace
PJAMF201 307,452 1,988,162 1 2.5 0.21 0.005 20.8 0.69 3.71 674
PJAM GTG High & Low Temp Coils
PJAMF6 307,464 1,988,146 1 1.4 4.96 0.43 18.3 1.83 32.06 673
PJAM Foster
Wheeler Boiler FWB 307,450 1,988,135 1 21.7 2.50 1.63 16.2 0.80 24.90 623
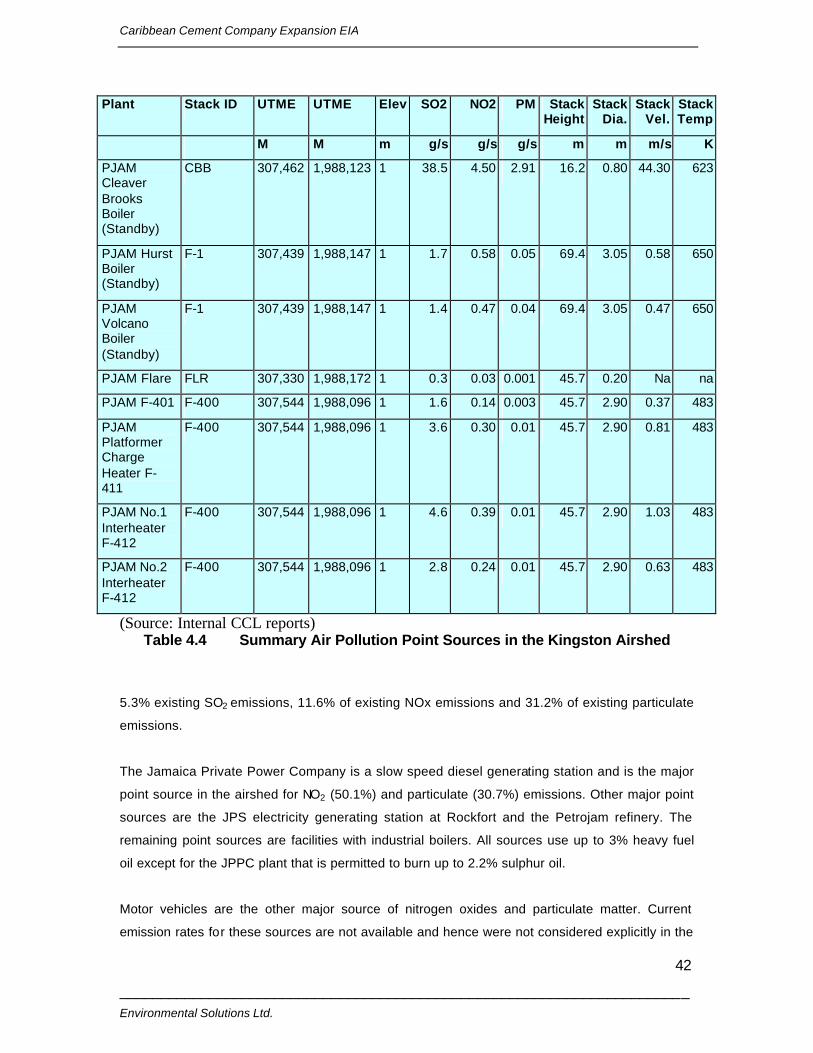
Caribbean Cement Company Expansion EIA
______________________________________________________________________ Environmental Solutions Ltd.
42
Plant Stack ID UTME UTME Elev SO2 NO2 PM Stack Height
Stack Dia.
Stack Vel.
Stack Temp
M M m g/s g/s g/s m m m/s K
PJAM Cleaver Brooks Boiler (Standby)
CBB 307,462 1,988,123 1 38.5 4.50 2.91 16.2 0.80 44.30 623
PJAM Hurst Boiler (Standby)
F-1 307,439 1,988,147 1 1.7 0.58 0.05 69.4 3.05 0.58 650
PJAM Volcano Boiler (Standby)
F-1 307,439 1,988,147 1 1.4 0.47 0.04 69.4 3.05 0.47 650
PJAM Flare FLR 307,330 1,988,172 1 0.3 0.03 0.001 45.7 0.20 Na na
PJAM F-401 F-400 307,544 1,988,096 1 1.6 0.14 0.003 45.7 2.90 0.37 483
PJAM Platformer Charge Heater F-411
F-400 307,544 1,988,096 1 3.6 0.30 0.01 45.7 2.90 0.81 483
PJAM No.1 Interheater F-412
F-400 307,544 1,988,096 1 4.6 0.39 0.01 45.7 2.90 1.03 483
PJAM No.2 Interheater F-412
F-400 307,544 1,988,096 1 2.8 0.24 0.01 45.7 2.90 0.63 483
(Source: Internal CCL reports) Table 4.4 Summary Air Pollution Point Sources in the Kingston Airshed
5.3% existing SO2 emissions, 11.6% of existing NOx emissions and 31.2% of existing particulate
emissions.
The Jamaica Private Power Company is a slow speed diesel generating station and is the major
point source in the airshed for NO2 (50.1%) and particulate (30.7%) emissions. Other major point
sources are the JPS electricity generating station at Rockfort and the Petrojam refinery. The
remaining point sources are facilities with industrial boilers. All sources use up to 3% heavy fuel
oil except for the JPPC plant that is permitted to burn up to 2.2% sulphur oil.
Motor vehicles are the other major source of nitrogen oxides and particulate matter. Current
emission rates for these sources are not available and hence were not considered explicitly in the
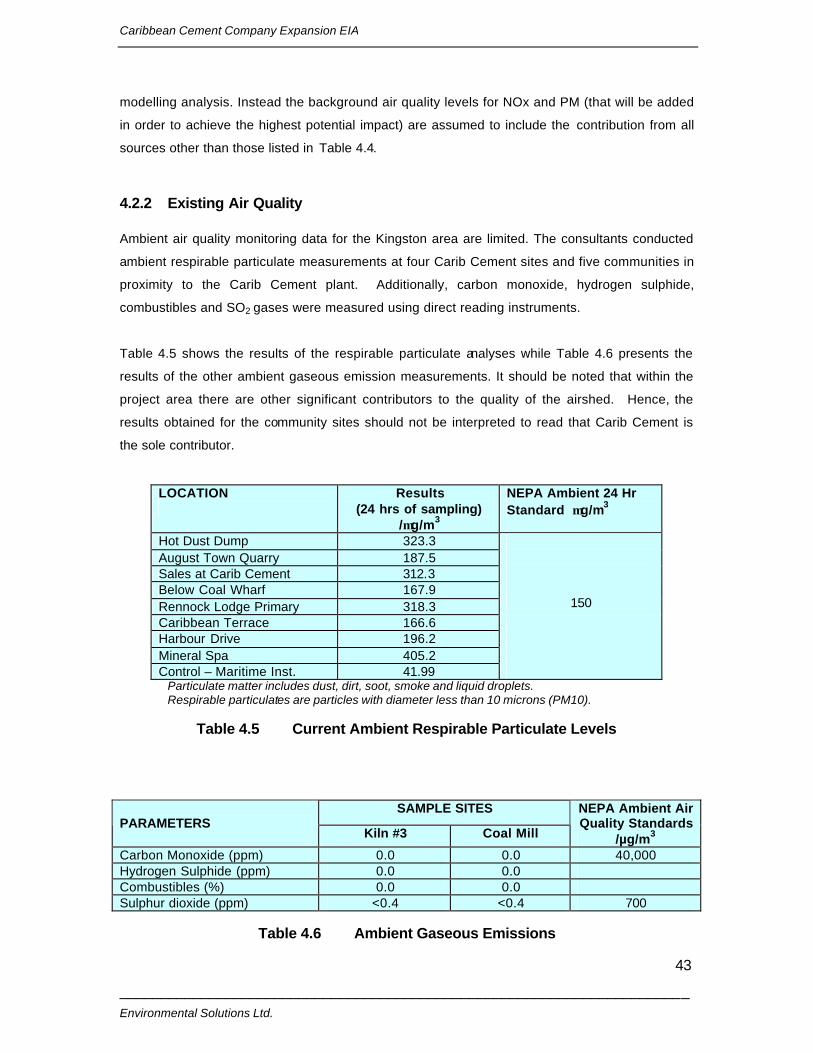
Caribbean Cement Company Expansion EIA
______________________________________________________________________ Environmental Solutions Ltd.
43
modelling analysis. Instead the background air quality levels for NOx and PM (that will be added
in order to achieve the highest potential impact) are assumed to include the contribution from all
sources other than those listed in Table 4.4.
4.2.2 Existing Air Quality
Ambient air quality monitoring data for the Kingston area are limited. The consultants conducted
ambient respirable particulate measurements at four Carib Cement sites and five communities in
proximity to the Carib Cement plant. Additionally, carbon monoxide, hydrogen sulphide,
combustibles and SO2 gases were measured using direct reading instruments.
Table 4.5 shows the results of the respirable particulate analyses while Table 4.6 presents the
results of the other ambient gaseous emission measurements. It should be noted that within the
project area there are other significant contributors to the quality of the airshed. Hence, the
results obtained for the community sites should not be interpreted to read that Carib Cement is
the sole contributor.
LOCATION
Results (24 hrs of sampling)
/µg/m3
NEPA Ambient 24 Hr Standard µg/m3
Hot Dust Dump 323.3 August Town Quarry 187.5 Sales at Carib Cement 312.3 Below Coal Wharf 167.9 Rennock Lodge Primary 318.3
150
Caribbean Terrace 166.6 Harbour Drive 196.2 Mineral Spa 405.2 Control – Maritime Inst. 41.99
Particulate matter includes dust, dirt, soot, smoke and liquid droplets. Respirable particulates are particles with diameter less than 10 microns (PM10).
Table 4.5 Current Ambient Respirable Particulate Levels
SAMPLE SITES
PARAMETERS Kiln #3 Coal Mill
NEPA Ambient Air Quality Standards
/µg/m3 Carbon Monoxide (ppm) 0.0 0.0 40,000 Hydrogen Sulphide (ppm) 0.0 0.0 Combustibles (%) 0.0 0.0 Sulphur dioxide (ppm) <0.4 <0.4 700
Table 4.6 Ambient Gaseous Emissions
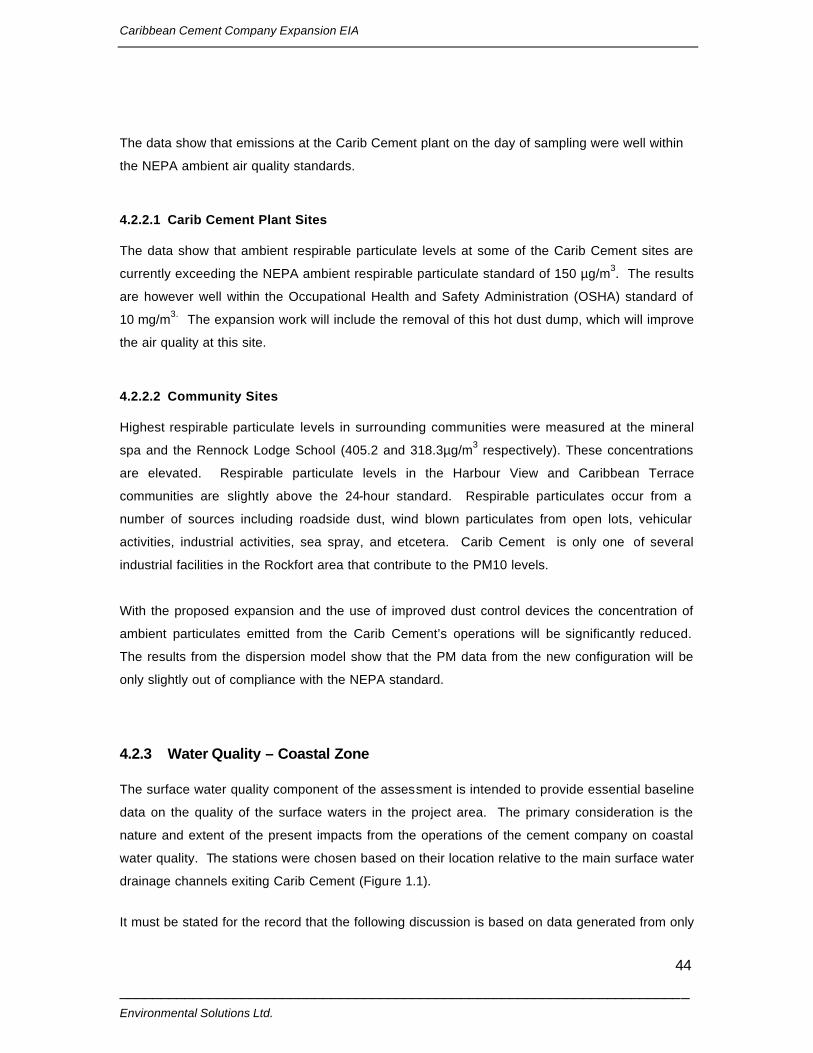
Caribbean Cement Company Expansion EIA
______________________________________________________________________ Environmental Solutions Ltd.
44
The data show that emissions at the Carib Cement plant on the day of sampling were well within
the NEPA ambient air quality standards.
4.2.2.1 Carib Cement Plant Sites
The data show that ambient respirable particulate levels at some of the Carib Cement sites are
currently exceeding the NEPA ambient respirable particulate standard of 150 µg/m3. The results
are however well within the Occupational Health and Safety Administration (OSHA) standard of
10 mg/m3. The expansion work will include the removal of this hot dust dump, which will improve
the air quality at this site.
4.2.2.2 Community Sites
Highest respirable particulate levels in surrounding communities were measured at the mineral
spa and the Rennock Lodge School (405.2 and 318.3µg/m3 respectively). These concentrations
are elevated. Respirable particulate levels in the Harbour View and Caribbean Terrace
communities are slightly above the 24-hour standard. Respirable particulates occur from a
number of sources including roadside dust, wind blown particulates from open lots, vehicular
activities, industrial activities, sea spray, and etcetera. Carib Cement is only one of several
industrial facilities in the Rockfort area that contribute to the PM10 levels.
With the proposed expansion and the use of improved dust control devices the concentration of
ambient particulates emitted from the Carib Cement’s operations will be significantly reduced.
The results from the dispersion model show that the PM data from the new configuration will be
only slightly out of compliance with the NEPA standard.
4.2.3 Water Quality – Coastal Zone
The surface water quality component of the assessment is intended to provide essential baseline
data on the quality of the surface waters in the project area. The primary consideration is the
nature and extent of the present impacts from the operations of the cement company on coastal
water quality. The stations were chosen based on their location relative to the main surface water
drainage channels exiting Carib Cement (Figure 1.1).
It must be stated for the record that the following discussion is based on data generated from only
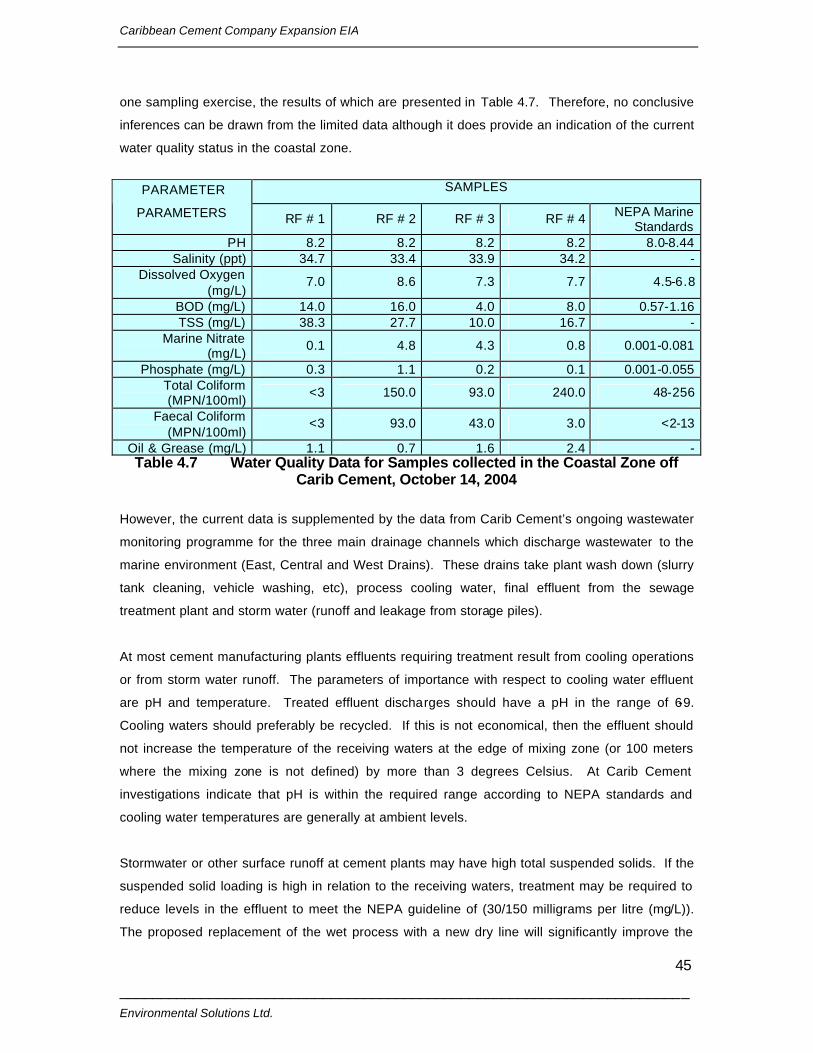
Caribbean Cement Company Expansion EIA
______________________________________________________________________ Environmental Solutions Ltd.
45
one sampling exercise, the results of which are presented in Table 4.7. Therefore, no conclusive
inferences can be drawn from the limited data although it does provide an indication of the current
water quality status in the coastal zone.
SAMPLES PARAMETER
PARAMETERS RF # 1 RF # 2 RF # 3 RF # 4 NEPA Marine Standards
PH 8.2 8.2 8.2 8.2 8.0-8.44 Salinity (ppt) 34.7 33.4 33.9 34.2 -
Dissolved Oxygen (mg/L)
7.0 8.6 7.3 7.7 4.5-6.8
BOD (mg/L) 14.0 16.0 4.0 8.0 0.57-1.16 TSS (mg/L) 38.3 27.7 10.0 16.7 -
Marine Nitrate (mg/L)
0.1 4.8 4.3 0.8 0.001-0.081
Phosphate (mg/L) 0.3 1.1 0.2 0.1 0.001-0.055 Total Coliform (MPN/100ml)
<3 150.0 93.0 240.0 48-256
Faecal Coliform (MPN/100ml)
<3 93.0 43.0 3.0 <2-13
Oil & Grease (mg/L) 1.1 0.7 1.6 2.4 - Table 4.7 Water Quality Data for Samples collected in the Coastal Zone off
Carib Cement, October 14, 2004
However, the current data is supplemented by the data from Carib Cement’s ongoing wastewater
monitoring programme for the three main drainage channels which discharge wastewater to the
marine environment (East, Central and West Drains). These drains take plant wash down (slurry
tank cleaning, vehicle washing, etc), process cooling water, final effluent from the sewage
treatment plant and storm water (runoff and leakage from storage piles).
At most cement manufacturing plants effluents requiring treatment result from cooling operations
or from storm water runoff. The parameters of importance with respect to cooling water effluent
are pH and temperature. Treated effluent discharges should have a pH in the range of 6-9.
Cooling waters should preferably be recycled. If this is not economical, then the effluent should
not increase the temperature of the receiving waters at the edge of mixing zone (or 100 meters
where the mixing zone is not defined) by more than 3 degrees Celsius. At Carib Cement
investigations indicate that pH is within the required range according to NEPA standards and
cooling water temperatures are generally at ambient levels.
Stormwater or other surface runoff at cement plants may have high total suspended solids. If the
suspended solid loading is high in relation to the receiving waters, treatment may be required to
reduce levels in the effluent to meet the NEPA guideline of (30/150 milligrams per litre (mg/L)).
The proposed replacement of the wet process with a new dry line will significantly improve the
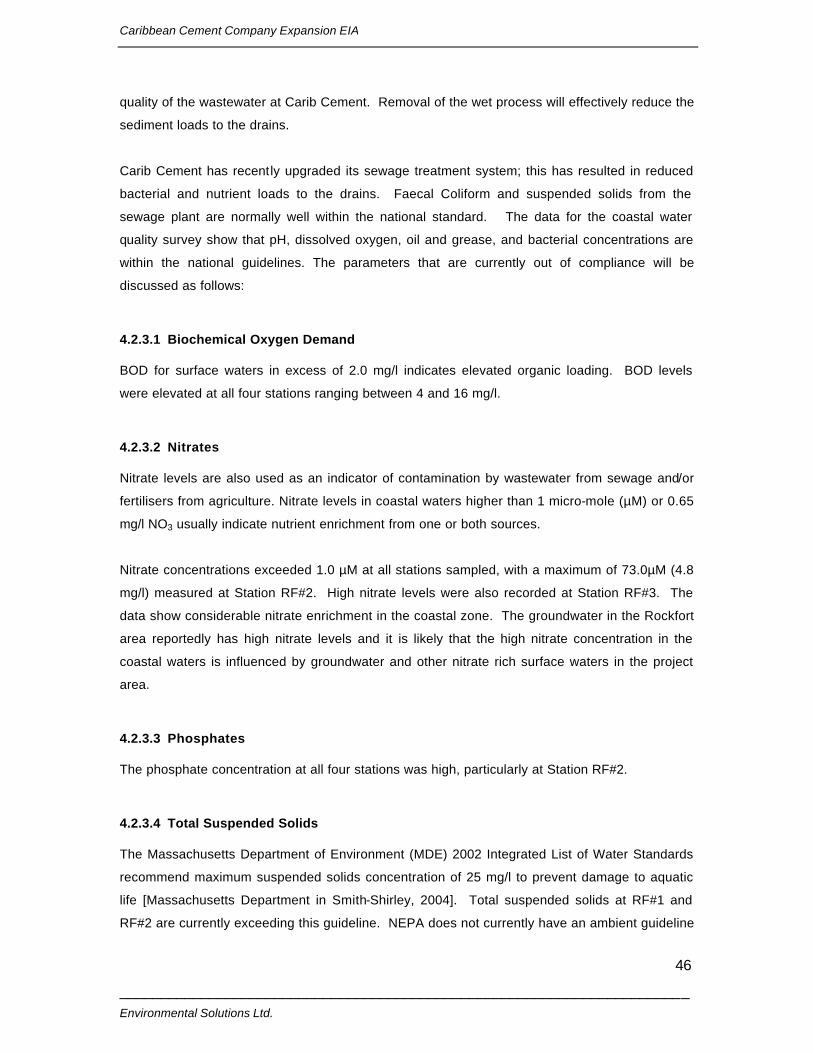
Caribbean Cement Company Expansion EIA
______________________________________________________________________ Environmental Solutions Ltd.
46
quality of the wastewater at Carib Cement. Removal of the wet process will effectively reduce the
sediment loads to the drains.
Carib Cement has recently upgraded its sewage treatment system; this has resulted in reduced
bacterial and nutrient loads to the drains. Faecal Coliform and suspended solids from the
sewage plant are normally well within the national standard. The data for the coastal water
quality survey show that pH, dissolved oxygen, oil and grease, and bacterial concentrations are
within the national guidelines. The parameters that are currently out of compliance will be
discussed as follows:
4.2.3.1 Biochemical Oxygen Demand
BOD for surface waters in excess of 2.0 mg/l indicates elevated organic loading. BOD levels
were elevated at all four stations ranging between 4 and 16 mg/l.
4.2.3.2 Nitrates
Nitrate levels are also used as an indicator of contamination by wastewater from sewage and/or
fertilisers from agriculture. Nitrate levels in coastal waters higher than 1 micro-mole (µM) or 0.65
mg/l NO3 usually indicate nutrient enrichment from one or both sources.
Nitrate concentrations exceeded 1.0 µM at all stations sampled, with a maximum of 73.0µM (4.8
mg/l) measured at Station RF#2. High nitrate levels were also recorded at Station RF#3. The
data show considerable nitrate enrichment in the coastal zone. The groundwater in the Rockfort
area reportedly has high nitrate levels and it is likely that the high nitrate concentration in the
coastal waters is influenced by groundwater and other nitrate rich surface waters in the project
area.
4.2.3.3 Phosphates
The phosphate concentration at all four stations was high, particularly at Station RF#2.
4.2.3.4 Total Suspended Solids
The Massachusetts Department of Environment (MDE) 2002 Integrated List of Water Standards
recommend maximum suspended solids concentration of 25 mg/l to prevent damage to aquatic
life [Massachusetts Department in Smith-Shirley, 2004]. Total suspended solids at RF#1 and
RF#2 are currently exceeding this guideline. NEPA does not currently have an ambient guideline
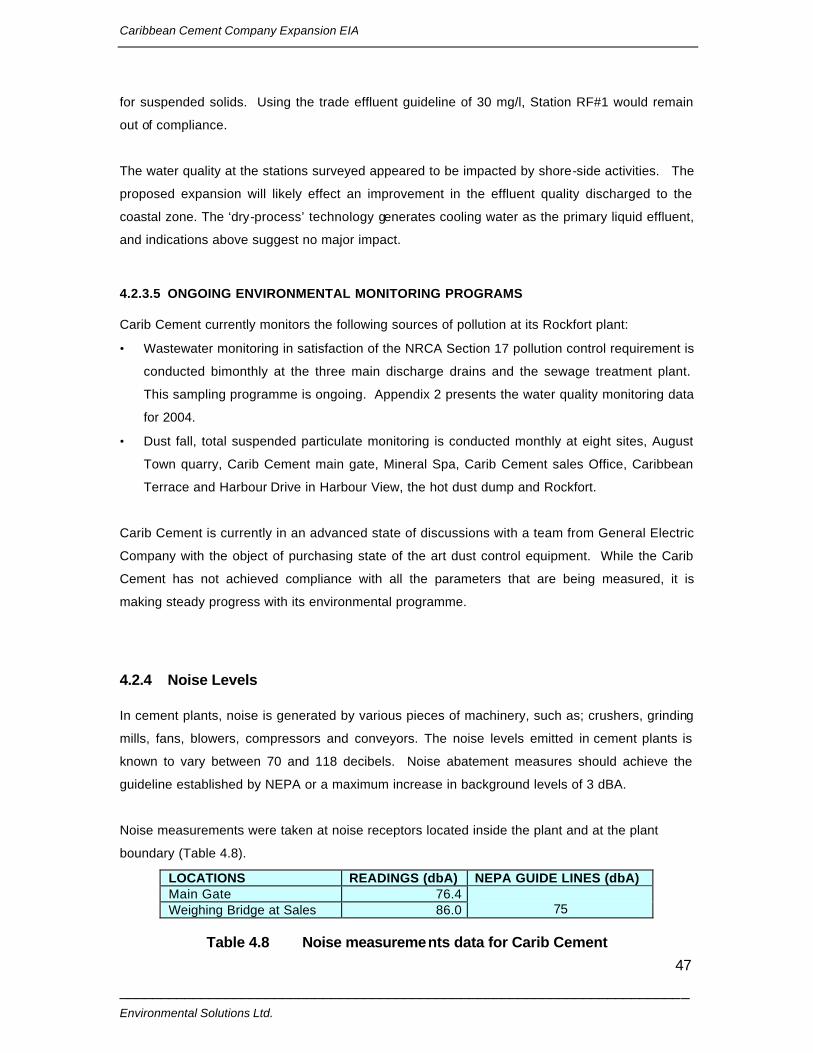
Caribbean Cement Company Expansion EIA
______________________________________________________________________ Environmental Solutions Ltd.
47
for suspended solids. Using the trade effluent guideline of 30 mg/l, Station RF#1 would remain
out of compliance.
The water quality at the stations surveyed appeared to be impacted by shore-side activities. The
proposed expansion will likely effect an improvement in the effluent quality discharged to the
coastal zone. The ‘dry-process’ technology generates cooling water as the primary liquid effluent,
and indications above suggest no major impact.
4.2.3.5 ONGOING ENVIRONMENTAL MONITORING PROGRAMS
Carib Cement currently monitors the following sources of pollution at its Rockfort plant:
• Wastewater monitoring in satisfaction of the NRCA Section 17 pollution control requirement is
conducted bimonthly at the three main discharge drains and the sewage treatment plant.
This sampling programme is ongoing. Appendix 2 presents the water quality monitoring data
for 2004.
• Dust fall, total suspended particulate monitoring is conducted monthly at eight sites, August
Town quarry, Carib Cement main gate, Mineral Spa, Carib Cement sales Office, Caribbean
Terrace and Harbour Drive in Harbour View, the hot dust dump and Rockfort.
Carib Cement is currently in an advanced state of discussions with a team from General Electric
Company with the object of purchasing state of the art dust control equipment. While the Carib
Cement has not achieved compliance with all the parameters that are being measured, it is
making steady progress with its environmental programme.
4.2.4 Noise Levels
In cement plants, noise is generated by various pieces of machinery, such as; crushers, grinding
mills, fans, blowers, compressors and conveyors. The noise levels emitted in cement plants is
known to vary between 70 and 118 decibels. Noise abatement measures should achieve the
guideline established by NEPA or a maximum increase in background levels of 3 dBA.
Noise measurements were taken at noise receptors located inside the plant and at the plant
boundary (Table 4.8).
LOCATIONS READINGS (dbA) NEPA GUIDE LINES (dbA) Main Gate 76.4 Weighing Bridge at Sales 86.0
75
Table 4.8 Noise measurements data for Carib Cement
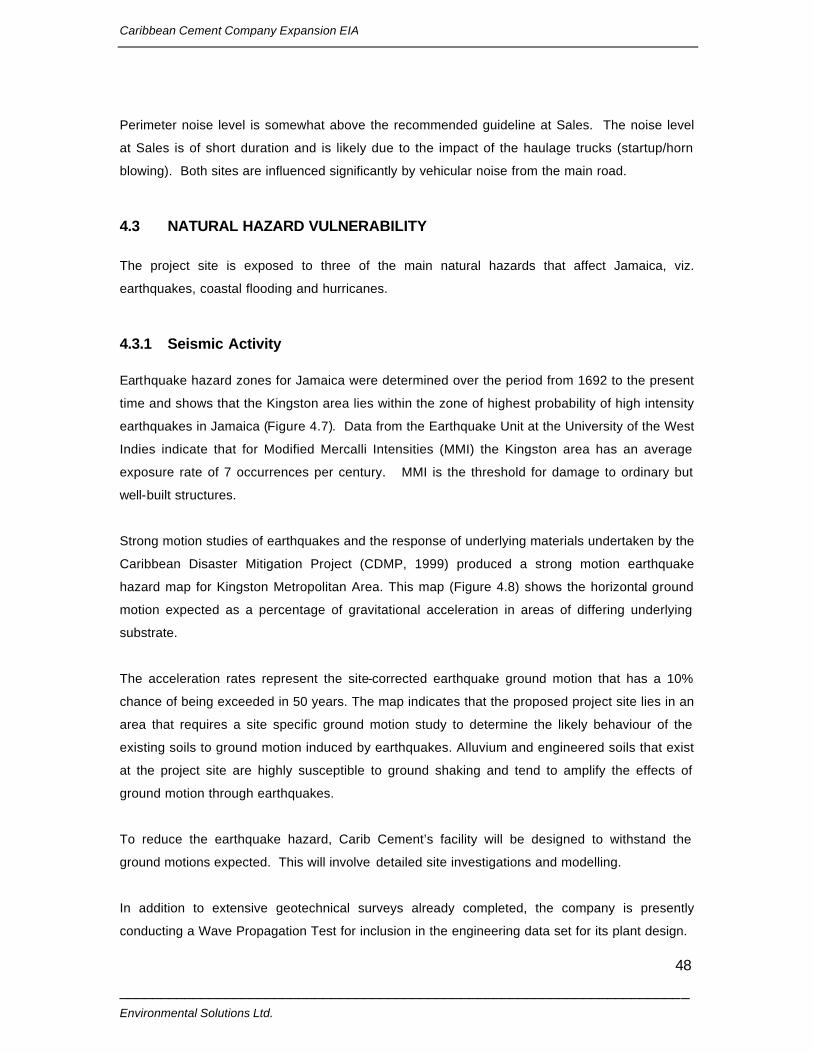
Caribbean Cement Company Expansion EIA
______________________________________________________________________ Environmental Solutions Ltd.
48
Perimeter noise level is somewhat above the recommended guideline at Sales. The noise level
at Sales is of short duration and is likely due to the impact of the haulage trucks (startup/horn
blowing). Both sites are influenced significantly by vehicular noise from the main road.
4.3 NATURAL HAZARD VULNERABILITY
The project site is exposed to three of the main natural hazards that affect Jamaica, viz.
earthquakes, coastal flooding and hurricanes.
4.3.1 Seismic Activity
Earthquake hazard zones for Jamaica were determined over the period from 1692 to the present
time and shows that the Kingston area lies within the zone of highest probability of high intensity
earthquakes in Jamaica (Figure 4.7). Data from the Earthquake Unit at the University of the West
Indies indicate that for Modified Mercalli Intensities (MMI) the Kingston area has an average
exposure rate of 7 occurrences per century. MMI is the threshold for damage to ordinary but
well-built structures.
Strong motion studies of earthquakes and the response of underlying materials undertaken by the
Caribbean Disaster Mitigation Project (CDMP, 1999) produced a strong motion earthquake
hazard map for Kingston Metropolitan Area. This map (Figure 4.8) shows the horizontal ground
motion expected as a percentage of gravitational acceleration in areas of differing underlying
substrate.
The acceleration rates represent the site-corrected earthquake ground motion that has a 10%
chance of being exceeded in 50 years. The map indicates that the proposed project site lies in an
area that requires a site specific ground motion study to determine the likely behaviour of the
existing soils to ground motion induced by earthquakes. Alluvium and engineered soils that exist
at the project site are highly susceptible to ground shaking and tend to amplify the effects of
ground motion through earthquakes.
To reduce the earthquake hazard, Carib Cement’s facility will be designed to withstand the
ground motions expected. This will involve detailed site investigations and modelling.
In addition to extensive geotechnical surveys already completed, the company is presently
conducting a Wave Propagation Test for inclusion in the engineering data set for its plant design.
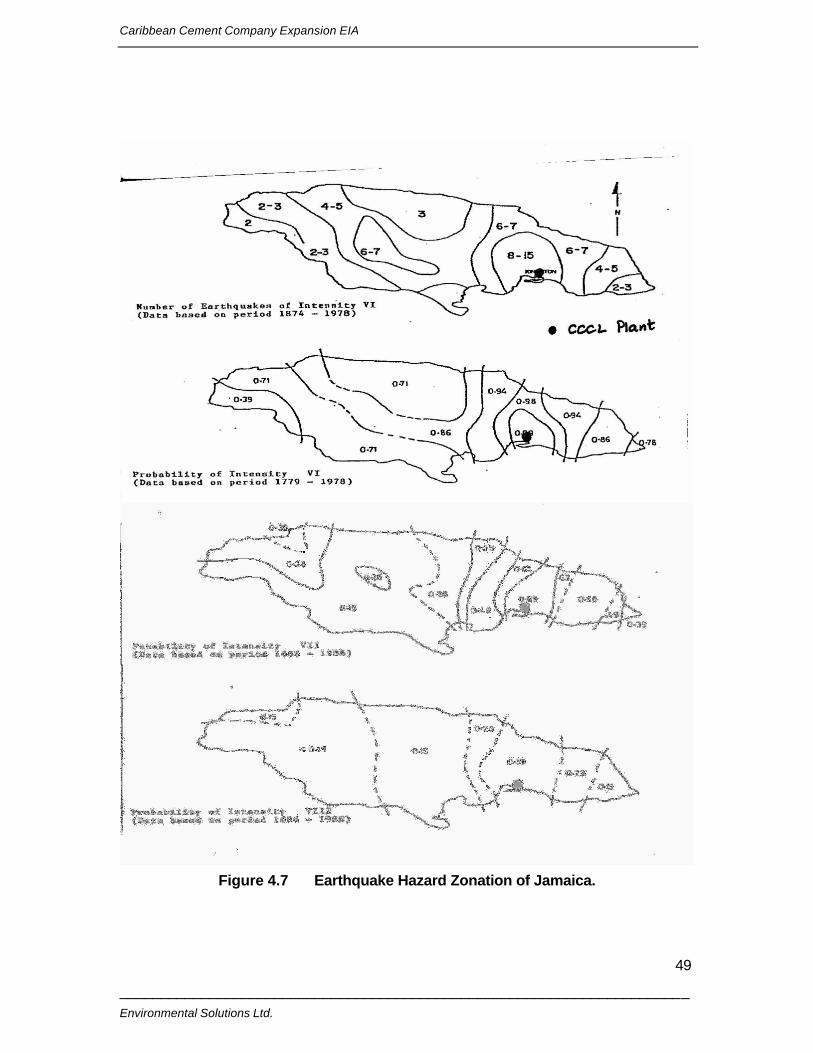
Caribbean Cement Company Expansion EIA
______________________________________________________________________ Environmental Solutions Ltd.
49
Figure 4.7 Earthquake Hazard Zonation of Jamaica.
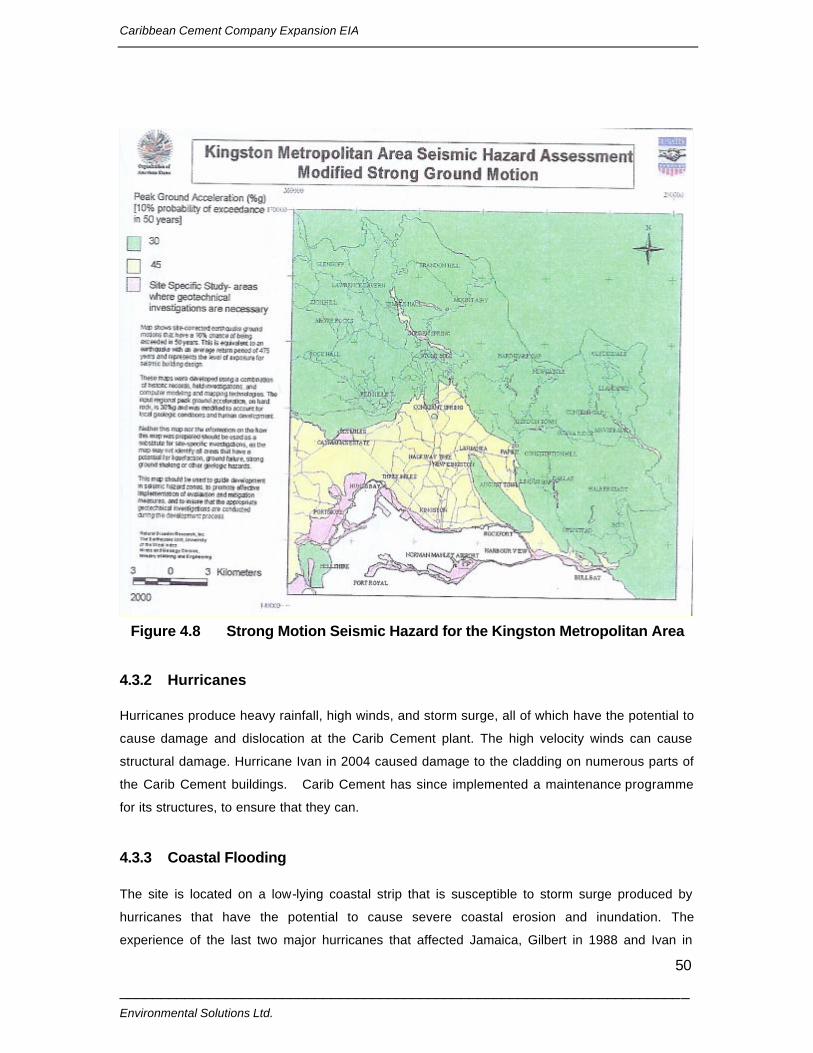
Caribbean Cement Company Expansion EIA
______________________________________________________________________ Environmental Solutions Ltd.
50
Figure 4.8 Strong Motion Seismic Hazard for the Kingston Metropolitan Area
4.3.2 Hurricanes
Hurricanes produce heavy rainfall, high winds, and storm surge, all of which have the potential to
cause damage and dislocation at the Carib Cement plant. The high velocity winds can cause
structural damage. Hurricane Ivan in 2004 caused damage to the cladding on numerous parts of
the Carib Cement buildings. Carib Cement has since implemented a maintenance programme
for its structures, to ensure that they can.
4.3.3 Coastal Flooding
The site is located on a low-lying coastal strip that is susceptible to storm surge produced by
hurricanes that have the potential to cause severe coastal erosion and inundation. The
experience of the last two major hurricanes that affected Jamaica, Gilbert in 1988 and Ivan in
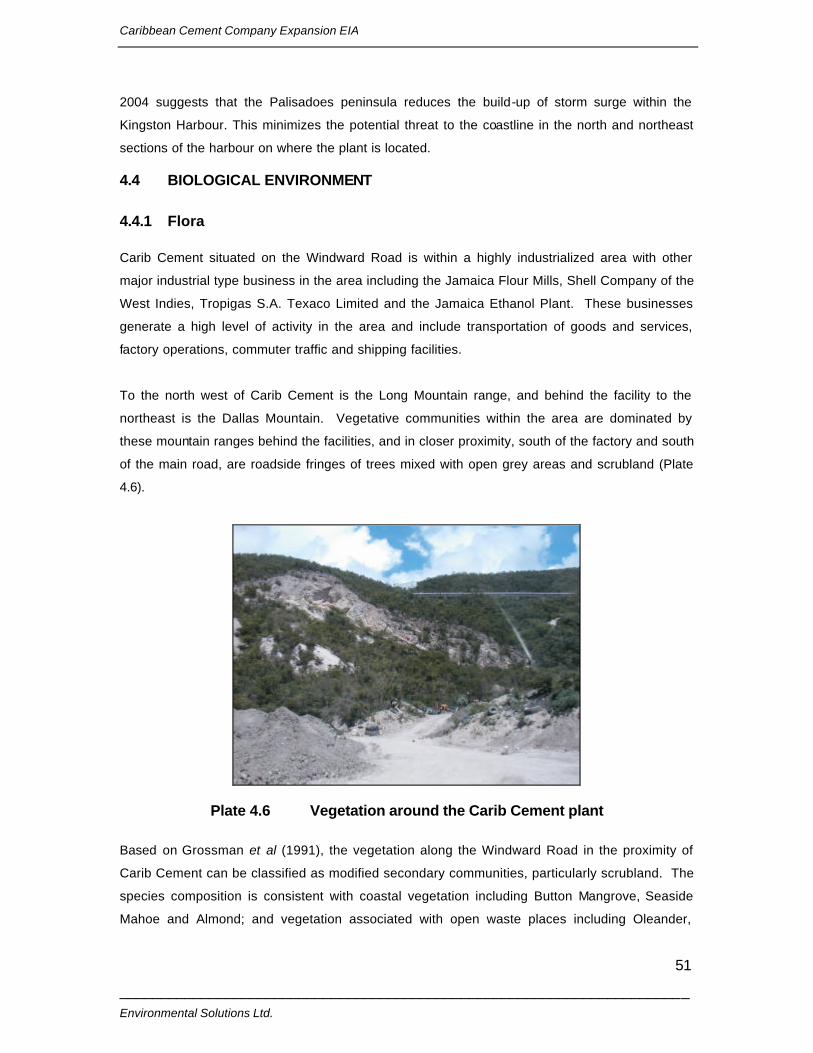
Caribbean Cement Company Expansion EIA
______________________________________________________________________ Environmental Solutions Ltd.
51
2004 suggests that the Palisadoes peninsula reduces the build-up of storm surge within the
Kingston Harbour. This minimizes the potential threat to the coastline in the north and northeast
sections of the harbour on where the plant is located.
4.4 BIOLOGICAL ENVIRONMENT
4.4.1 Flora
Carib Cement situated on the Windward Road is within a highly industrialized area with other
major industrial type business in the area including the Jamaica Flour Mills, Shell Company of the
West Indies, Tropigas S.A. Texaco Limited and the Jamaica Ethanol Plant. These businesses
generate a high level of activity in the area and include transportation of goods and services,
factory operations, commuter traffic and shipping facilities.
To the north west of Carib Cement is the Long Mountain range, and behind the facility to the
northeast is the Dallas Mountain. Vegetative communities within the area are dominated by
these mountain ranges behind the facilities, and in closer proximity, south of the factory and south
of the main road, are roadside fringes of trees mixed with open grey areas and scrubland (Plate
4.6).
Plate 4.6 Vegetation around the Carib Cement plant
Based on Grossman et al (1991), the vegetation along the Windward Road in the proximity of
Carib Cement can be classified as modified secondary communities, particularly scrubland. The
species composition is consistent with coastal vegetation including Button Mangrove, Seaside
Mahoe and Almond; and vegetation associated with open waste places including Oleander,
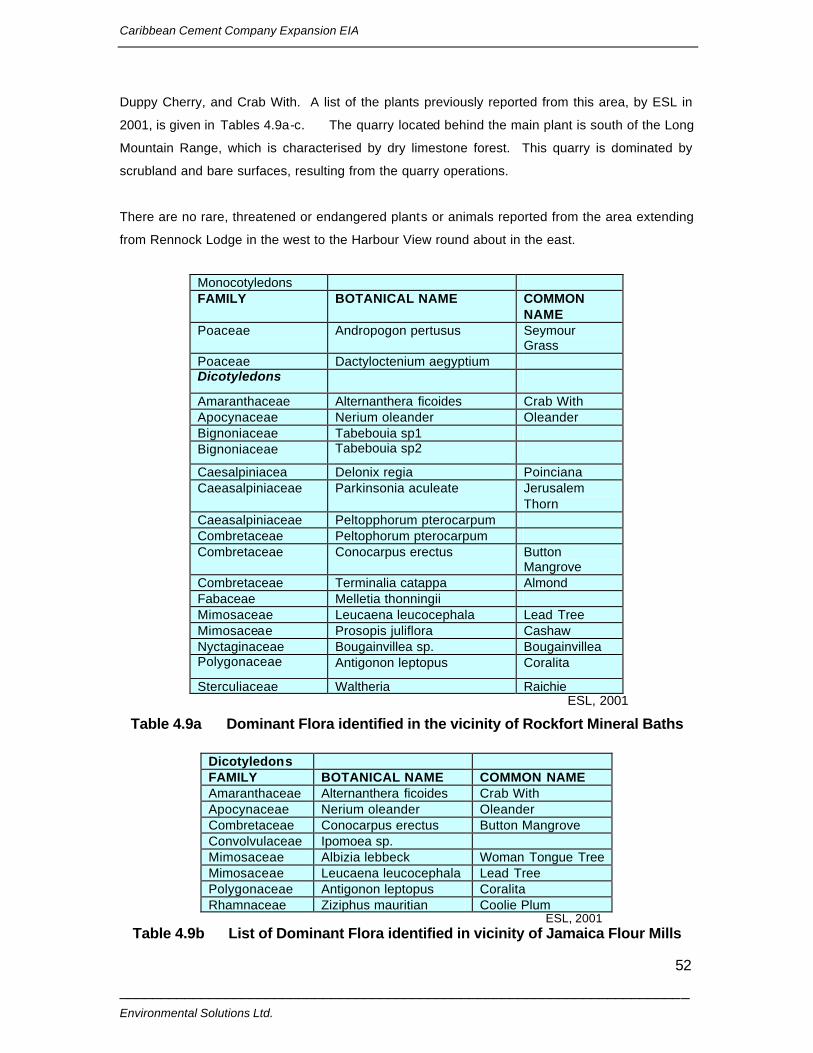
Caribbean Cement Company Expansion EIA
______________________________________________________________________ Environmental Solutions Ltd.
52
Duppy Cherry, and Crab With. A list of the plants previously reported from this area, by ESL in
2001, is given in Tables 4.9a-c. The quarry located behind the main plant is south of the Long
Mountain Range, which is characterised by dry limestone forest. This quarry is dominated by
scrubland and bare surfaces, resulting from the quarry operations.
There are no rare, threatened or endangered plants or animals reported from the area extending
from Rennock Lodge in the west to the Harbour View round about in the east.
Monocotyledons FAMILY BOTANICAL NAME COMMON
NAME Poaceae Andropogon pertusus Seymour
Grass Poaceae Dactyloctenium aegyptium Dicotyledons
Amaranthaceae Alternanthera ficoides Crab With Apocynaceae Nerium oleander Oleander Bignoniaceae Tabebouia sp1 Bignoniaceae Tabebouia sp2
Caesalpiniacea Delonix regia Poinciana Caeasalpiniaceae Parkinsonia aculeate Jerusalem
Thorn Caeasalpiniaceae Peltopphorum pterocarpum Combretaceae Peltophorum pterocarpum Combretaceae Conocarpus erectus Button
Mangrove Combretaceae Terminalia catappa Almond Fabaceae Melletia thonningii Mimosaceae Leucaena leucocephala Lead Tree Mimosaceae Prosopis juliflora Cashaw Nyctaginaceae Bougainvillea sp. Bougainvillea Polygonaceae Antigonon leptopus Coralita
Sterculiaceae Waltheria Raichie ESL, 2001
Table 4.9a Dominant Flora identified in the vicinity of Rockfort Mineral Baths
Dicotyledons FAMILY BOTANICAL NAME COMMON NAME Amaranthaceae Alternanthera ficoides Crab With Apocynaceae Nerium oleander Oleander Combretaceae Conocarpus erectus Button Mangrove Convolvulaceae Ipomoea sp. Mimosaceae Albizia lebbeck Woman Tongue Tree Mimosaceae Leucaena leucocephala Lead Tree Polygonaceae Antigonon leptopus Coralita Rhamnaceae Ziziphus mauritian Coolie Plum
ESL, 2001 Table 4.9b List of Dominant Flora identified in vicinity of Jamaica Flour Mills
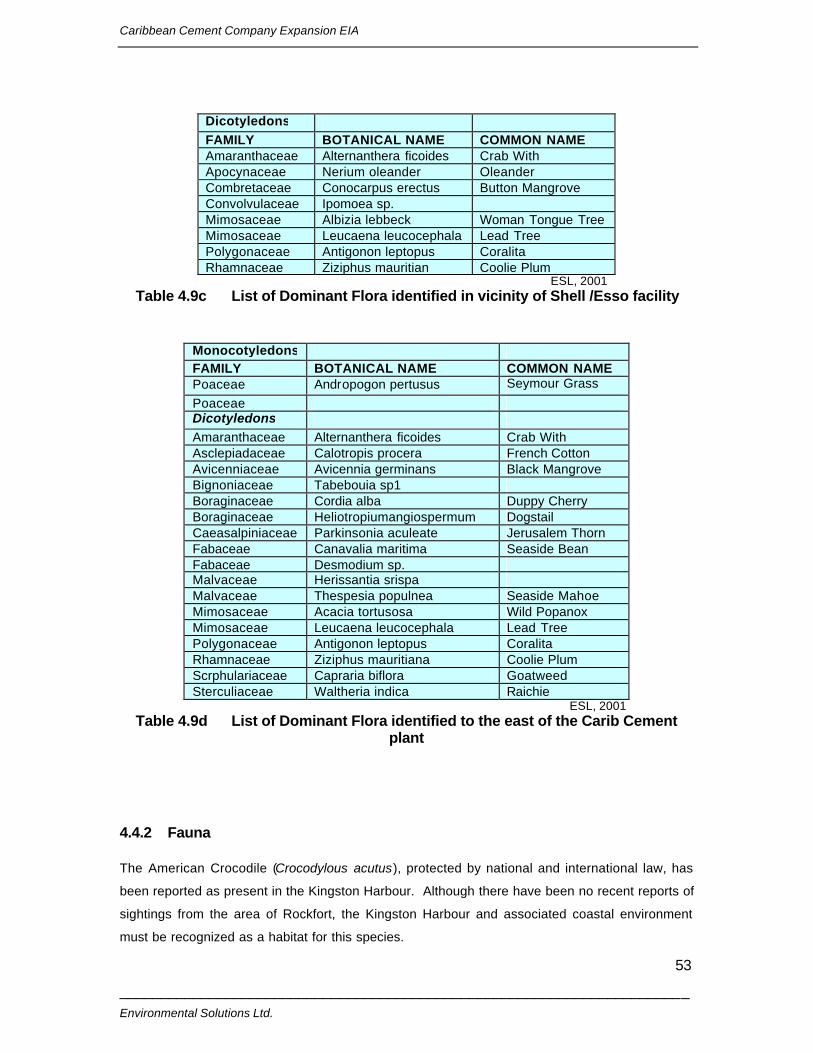
Caribbean Cement Company Expansion EIA
______________________________________________________________________ Environmental Solutions Ltd.
53
Dicotyledons FAMILY BOTANICAL NAME COMMON NAME Amaranthaceae Alternanthera ficoides Crab With Apocynaceae Nerium oleander Oleander Combretaceae Conocarpus erectus Button Mangrove Convolvulaceae Ipomoea sp. Mimosaceae Albizia lebbeck Woman Tongue Tree Mimosaceae Leucaena leucocephala Lead Tree Polygonaceae Antigonon leptopus Coralita Rhamnaceae Ziziphus mauritian Coolie Plum
ESL, 2001 Table 4.9c List of Dominant Flora identified in vicinity of Shell /Esso facility
Monocotyledons FAMILY BOTANICAL NAME COMMON NAME Poaceae Andropogon pertusus Seymour Grass
Poaceae Dicotyledons Amaranthaceae Alternanthera ficoides Crab With Asclepiadaceae Calotropis procera French Cotton Avicenniaceae Avicennia germinans Black Mangrove Bignoniaceae Tabebouia sp1 Boraginaceae Cordia alba Duppy Cherry Boraginaceae Heliotropiumangiospermum Dogstail Caeasalpiniaceae Parkinsonia aculeate Jerusalem Thorn Fabaceae Canavalia maritima Seaside Bean Fabaceae Desmodium sp. Malvaceae Herissantia srispa Malvaceae Thespesia populnea Seaside Mahoe Mimosaceae Acacia tortusosa Wild Popanox Mimosaceae Leucaena leucocephala Lead Tree Polygonaceae Antigonon leptopus Coralita Rhamnaceae Ziziphus mauritiana Coolie Plum Scrphulariaceae Capraria biflora Goatweed Sterculiaceae Waltheria indica Raichie
ESL, 2001 Table 4.9d List of Dominant Flora identified to the east of the Carib Cement
plant
4.4.2 Fauna
The American Crocodile (Crocodylous acutus), protected by national and international law, has
been reported as present in the Kingston Harbour. Although there have been no recent reports of
sightings from the area of Rockfort, the Kingston Harbour and associated coastal environment
must be recognized as a habitat for this species.
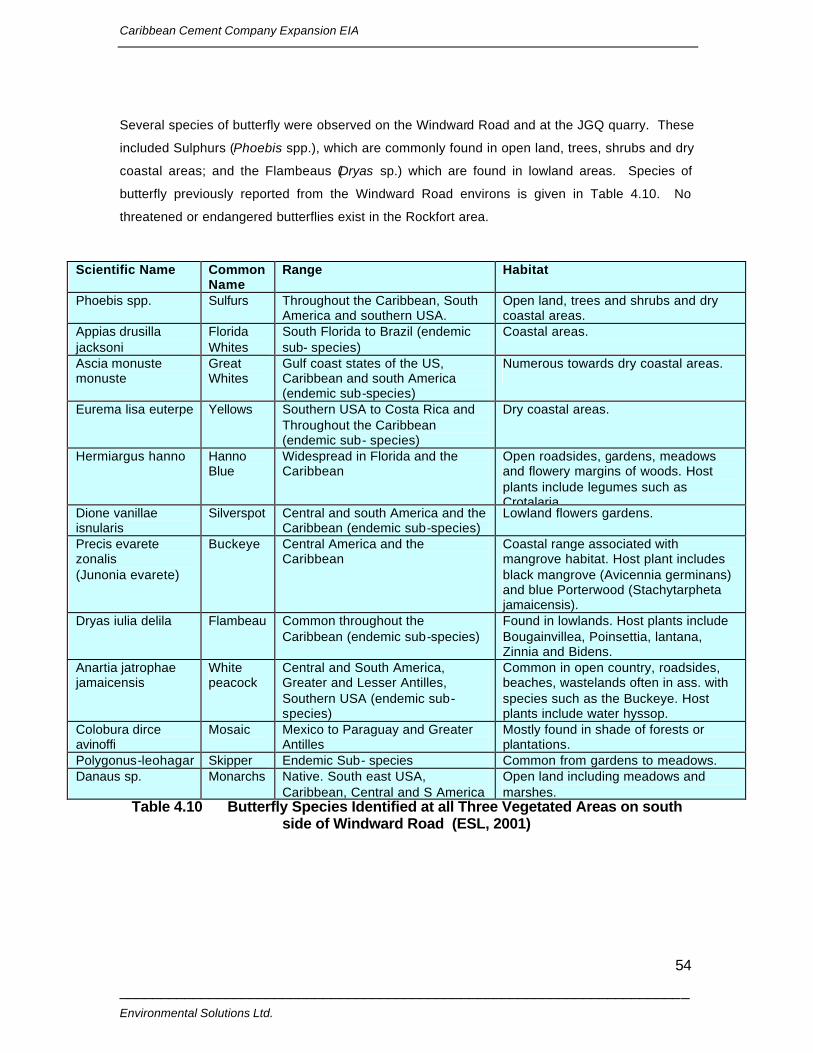
Caribbean Cement Company Expansion EIA
______________________________________________________________________ Environmental Solutions Ltd.
54
Several species of butterfly were observed on the Windward Road and at the JGQ quarry. These
included Sulphurs (Phoebis spp.), which are commonly found in open land, trees, shrubs and dry
coastal areas; and the Flambeaus (Dryas sp.) which are found in lowland areas. Species of
butterfly previously reported from the Windward Road environs is given in Table 4.10. No
threatened or endangered butterflies exist in the Rockfort area.
Scientific Name
Common Name
Range Habitat
Phoebis spp.
Sulfurs Throughout the Caribbean, South America and southern USA.
Open land, trees and shrubs and dry coastal areas.
Appias drusilla jacksoni
Florida Whites
South Florida to Brazil (endemic sub- species)
Coastal areas.
Ascia monuste monuste
Great Whites
Gulf coast states of the US, Caribbean and south America (endemic sub-species)
Numerous towards dry coastal areas.
Eurema lisa euterpe Yellows Southern USA to Costa Rica and Throughout the Caribbean (endemic sub- species)
Dry coastal areas.
Hermiargus hanno Hanno Blue
Widespread in Florida and the Caribbean
Open roadsides, gardens, meadows and flowery margins of woods. Host plants include legumes such as Crotalaria.
Dione vanillae isnularis
Silverspot Central and south America and the Caribbean (endemic sub-species)
Lowland flowers gardens.
Precis evarete zonalis (Junonia evarete)
Buckeye Central America and the Caribbean
Coastal range associated with mangrove habitat. Host plant includes black mangrove (Avicennia germinans) and blue Porterwood (Stachytarpheta jamaicensis).
Dryas iulia delila Flambeau Common throughout the Caribbean (endemic sub-species)
Found in lowlands. Host plants include Bougainvillea, Poinsettia, lantana, Zinnia and Bidens.
Anartia jatrophae jamaicensis
White peacock
Central and South America, Greater and Lesser Antilles, Southern USA (endemic sub- species)
Common in open country, roadsides, beaches, wastelands often in ass. with species such as the Buckeye. Host plants include water hyssop.
Colobura dirce avinoffi
Mosaic Mexico to Paraguay and Greater Antilles
Mostly found in shade of forests or plantations.
Polygonus-leohagar Skipper Endemic Sub- species Common from gardens to meadows. Danaus sp. Monarchs Native. South east USA,
Caribbean, Central and S America Open land including meadows and marshes.
Table 4.10 Butterfly Species Identified at all Three Vegetated Areas on south side of Windward Road (ESL, 2001)
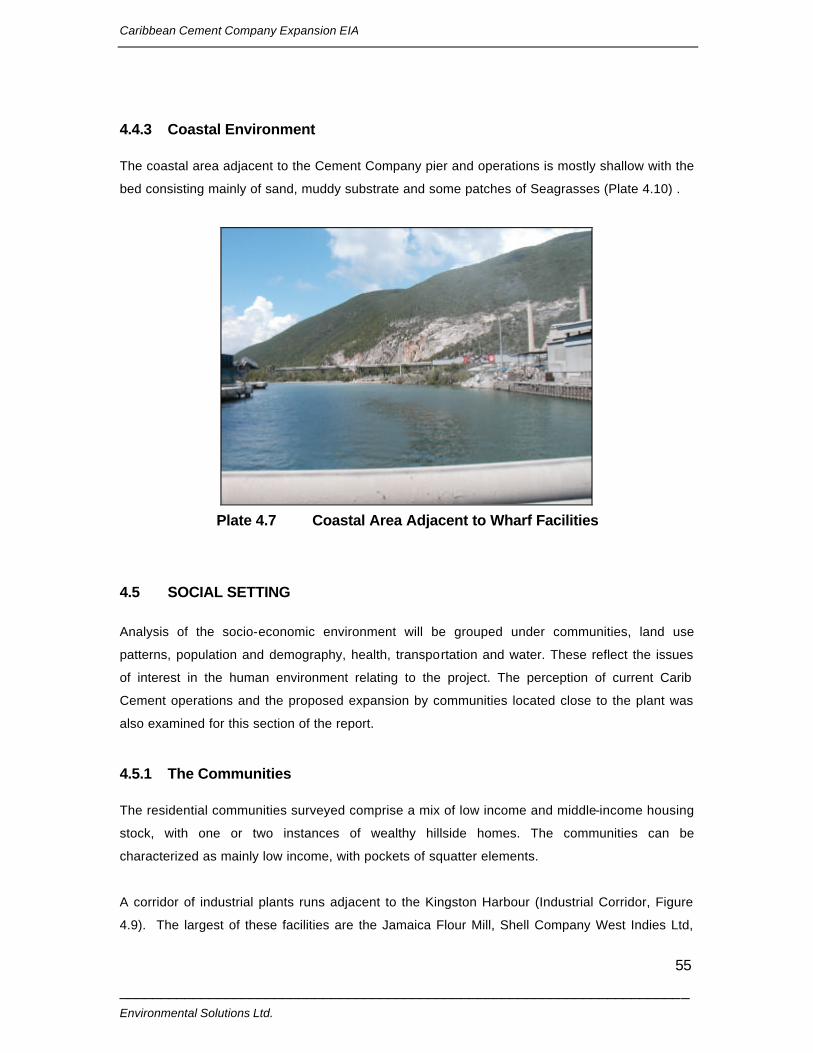
Caribbean Cement Company Expansion EIA
______________________________________________________________________ Environmental Solutions Ltd.
55
4.4.3 Coastal Environment
The coastal area adjacent to the Cement Company pier and operations is mostly shallow with the
bed consisting mainly of sand, muddy substrate and some patches of Seagrasses (Plate 4.10) .
Plate 4.7 Coastal Area Adjacent to Wharf Facilities
4.5 SOCIAL SETTING
Analysis of the socio-economic environment will be grouped under communities, land use
patterns, population and demography, health, transportation and water. These reflect the issues
of interest in the human environment relating to the project. The perception of current Carib
Cement operations and the proposed expansion by communities located close to the plant was
also examined for this section of the report.
4.5.1 The Communities
The residential communities surveyed comprise a mix of low income and middle-income housing
stock, with one or two instances of wealthy hillside homes. The communities can be
characterized as mainly low income, with pockets of squatter elements.
A corridor of industrial plants runs adjacent to the Kingston Harbour (Industrial Corridor, Figure
4.9). The largest of these facilities are the Jamaica Flour Mill, Shell Company West Indies Ltd,
Caribbean Cement Company Expansion EIA
______________________________________________________________________ Environmental Solutions Ltd.
56
Texaco Caribbean, Jamaica Public Service and Jamaica Private Power Company.
Starting west of the Carib Cement plant and proceeding eastwards, the communities (Figure 4.9)
from which data were collected included:
Springfield
Norman Gardens
Johnson Town
Rennock Lodge
The Industrial Corridor
Bayshore Park (Harbour Heights)
Harbour View
Harbour Head Fishing Beach
Number 1 Palisadoes
St. Benedicts
Shooters Hill
Rest Haven & Copacabana
Seven Miles
Bay View
Ten Miles
4.5.2 Land Use
4.5.2.1 Residential Land Use
Within the project area, relatively large land areas are devoted to human habitation, mainly
residential. Although exact hectares utilized by housing have not been estimated, from
observation this exceeds any other competing land use. STATIN 2001 census data puts the
number of dwellings in these communities at 9,692 (2001 Census STATIN).
At the time of its original construction, the plant was an isolated operation, with no residential and
only one or two industrial neighbours. Over the years this has changed. The nearest residential
communities now border the plant at Bayshore in the east (Figure 4.9), with a very small element
of the community actually squatting on the company’s land, and on the flanks of the Hope River
Valley close to the Rockfort Mines. To the west, about 2 miles, in a line of sight, is Rennock
Lodge, one of the larger communities in a cluster collectively referred to as Rockfort.
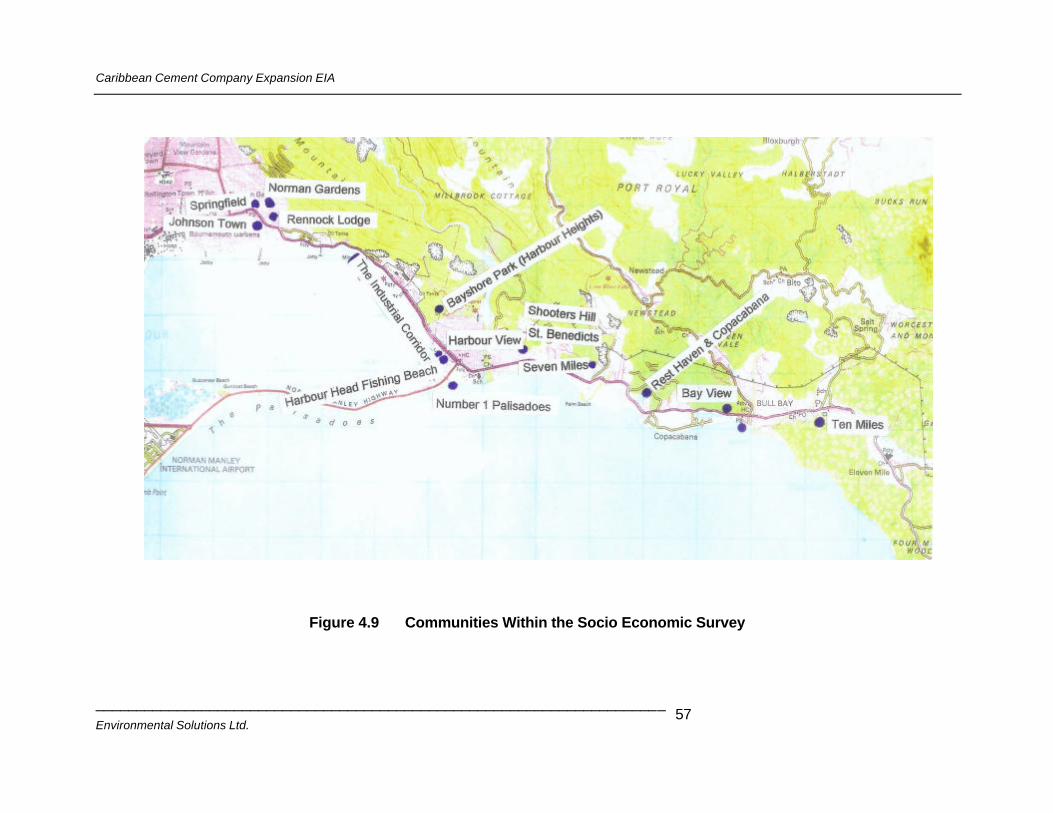
Caribbean Cement Company Expansion EIA
______________________________________________________________________ Environmental Solutions Ltd.
57
Figure 4.9 Communities Within the Socio Economic Survey
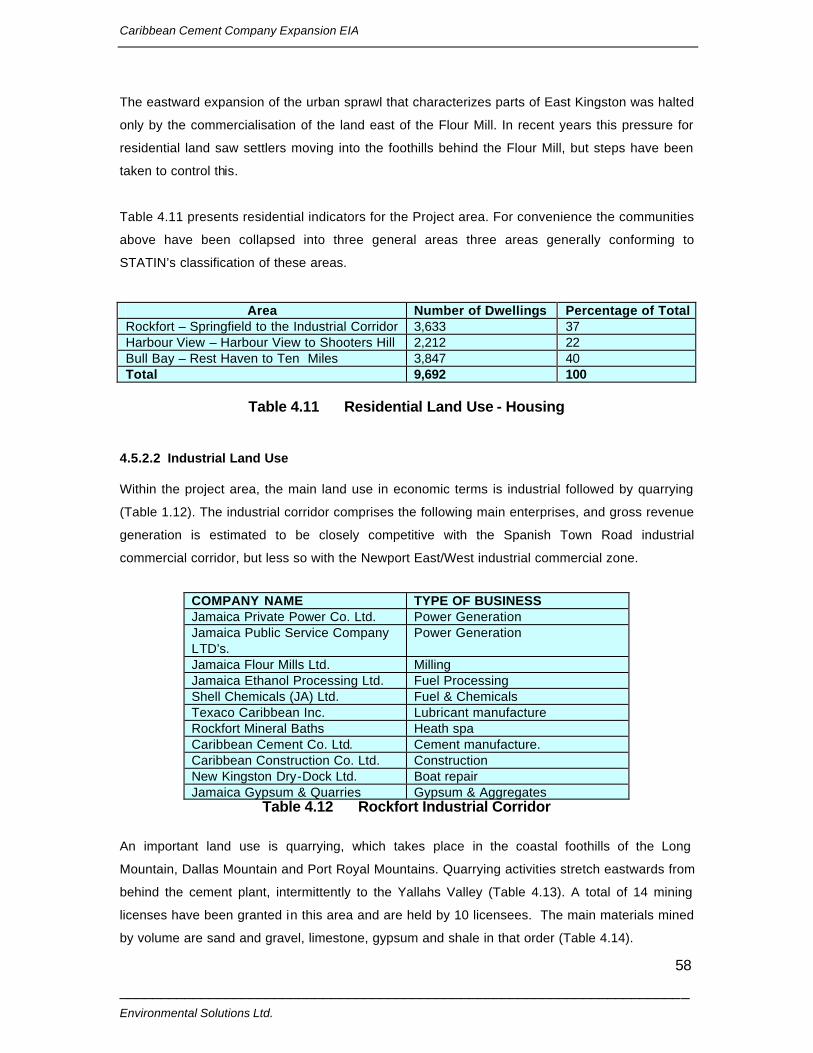
Caribbean Cement Company Expansion EIA
______________________________________________________________________ Environmental Solutions Ltd.
58
The eastward expansion of the urban sprawl that characterizes parts of East Kingston was halted
only by the commercialisation of the land east of the Flour Mill. In recent years this pressure for
residential land saw settlers moving into the foothills behind the Flour Mill, but steps have been
taken to control this.
Table 4.11 presents residential indicators for the Project area. For convenience the communities
above have been collapsed into three general areas three areas generally conforming to
STATIN’s classification of these areas.
Area Number of Dwellings Percentage of Total Rockfort – Springfield to the Industrial Corridor 3,633 37 Harbour View – Harbour View to Shooters Hill 2,212 22 Bull Bay – Rest Haven to Ten Miles 3,847 40 Total 9,692 100
Table 4.11 Residential Land Use - Housing
4.5.2.2 Industrial Land Use
Within the project area, the main land use in economic terms is industrial followed by quarrying
(Table 1.12). The industrial corridor comprises the following main enterprises, and gross revenue
generation is estimated to be closely competitive with the Spanish Town Road industrial
commercial corridor, but less so with the Newport East/West industrial commercial zone.
COMPANY NAME TYPE OF BUSINESS Jamaica Private Power Co. Ltd. Power Generation Jamaica Public Service Company LTD’s.
Power Generation
Jamaica Flour Mills Ltd. Milling Jamaica Ethanol Processing Ltd. Fuel Processing Shell Chemicals (JA) Ltd. Fuel & Chemicals Texaco Caribbean Inc. Lubricant manufacture Rockfort Mineral Baths Heath spa Caribbean Cement Co. Ltd. Cement manufacture. Caribbean Construction Co. Ltd. Construction New Kingston Dry-Dock Ltd. Boat repair Jamaica Gypsum & Quarries Gypsum & Aggregates
Table 4.12 Rockfort Industrial Corridor
An important land use is quarrying, which takes place in the coastal foothills of the Long
Mountain, Dallas Mountain and Port Royal Mountains. Quarrying activities stretch eastwards from
behind the cement plant, intermittently to the Yallahs Valley (Table 4.13). A total of 14 mining
licenses have been granted in this area and are held by 10 licensees. The main materials mined
by volume are sand and gravel, limestone, gypsum and shale in that order (Table 4.14).
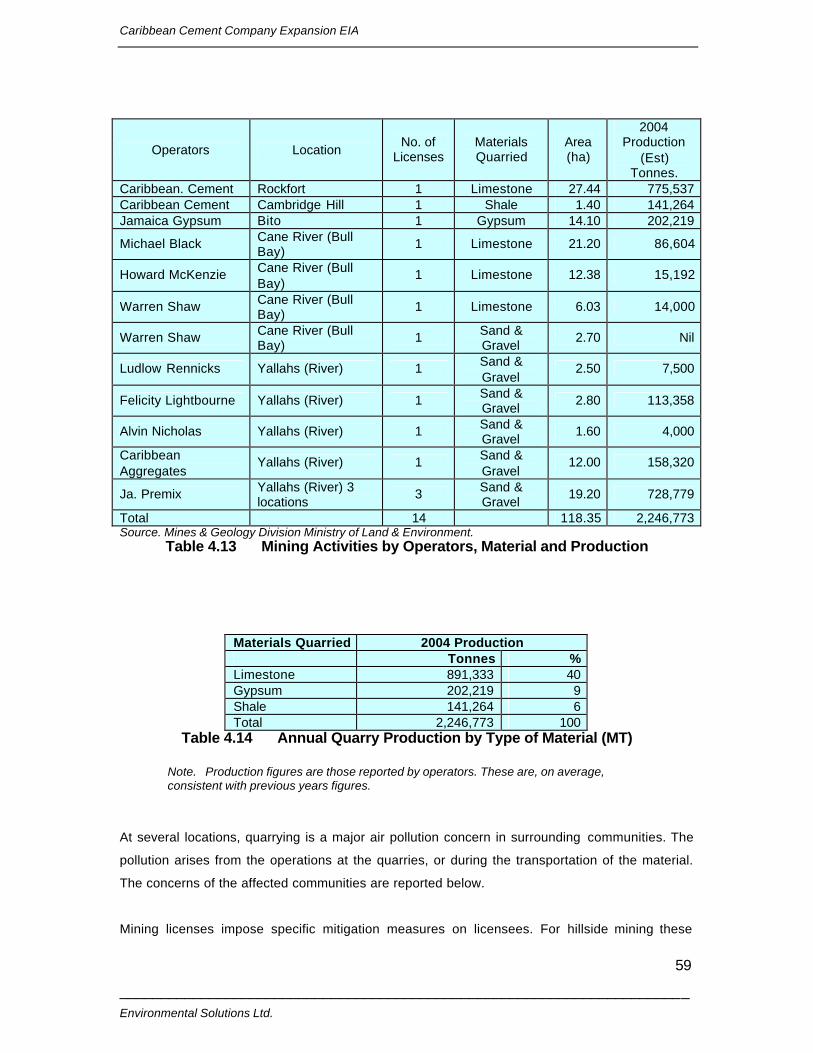
Caribbean Cement Company Expansion EIA
______________________________________________________________________ Environmental Solutions Ltd.
59
Operators Location No. of
Licenses Materials Quarried
Area (ha)
2004 Production
(Est) Tonnes.
Caribbean. Cement Rockfort 1 Limestone 27.44 775,537 Caribbean Cement Cambridge Hill 1 Shale 1.40 141,264 Jamaica Gypsum Bito 1 Gypsum 14.10 202,219
Michael Black Cane River (Bull Bay)
1 Limestone 21.20 86,604
Howard McKenzie Cane River (Bull Bay)
1 Limestone 12.38 15,192
Warren Shaw Cane River (Bull Bay)
1 Limestone 6.03 14,000
Warren Shaw Cane River (Bull Bay)
1 Sand & Gravel
2.70 Nil
Ludlow Rennicks Yallahs (River) 1 Sand & Gravel
2.50 7,500
Felicity Lightbourne Yallahs (River) 1 Sand & Gravel
2.80 113,358
Alvin Nicholas Yallahs (River) 1 Sand & Gravel
1.60 4,000
Caribbean Aggregates
Yallahs (River) 1 Sand & Gravel
12.00 158,320
Ja. Premix Yallahs (River) 3 locations
3 Sand & Gravel
19.20 728,779
Total 14 118.35 2,246,773 Source. Mines & Geology Division Ministry of Land & Environment.
Table 4.13 Mining Activities by Operators, Material and Production
Materials Quarried 2004 Production Tonnes % Limestone 891,333 40 Gypsum 202,219 9 Shale 141,264 6 Total 2,246,773 100
Table 4.14 Annual Quarry Production by Type of Material (MT)
Note. Production figures are those reported by operators. These are, on average, consistent with previous years figures.
At several locations, quarrying is a major air pollution concern in surrounding communities. The
pollution arises from the operations at the quarries, or during the transportation of the material.
The concerns of the affected communities are reported below.
Mining licenses impose specific mitigation measures on licensees. For hillside mining these
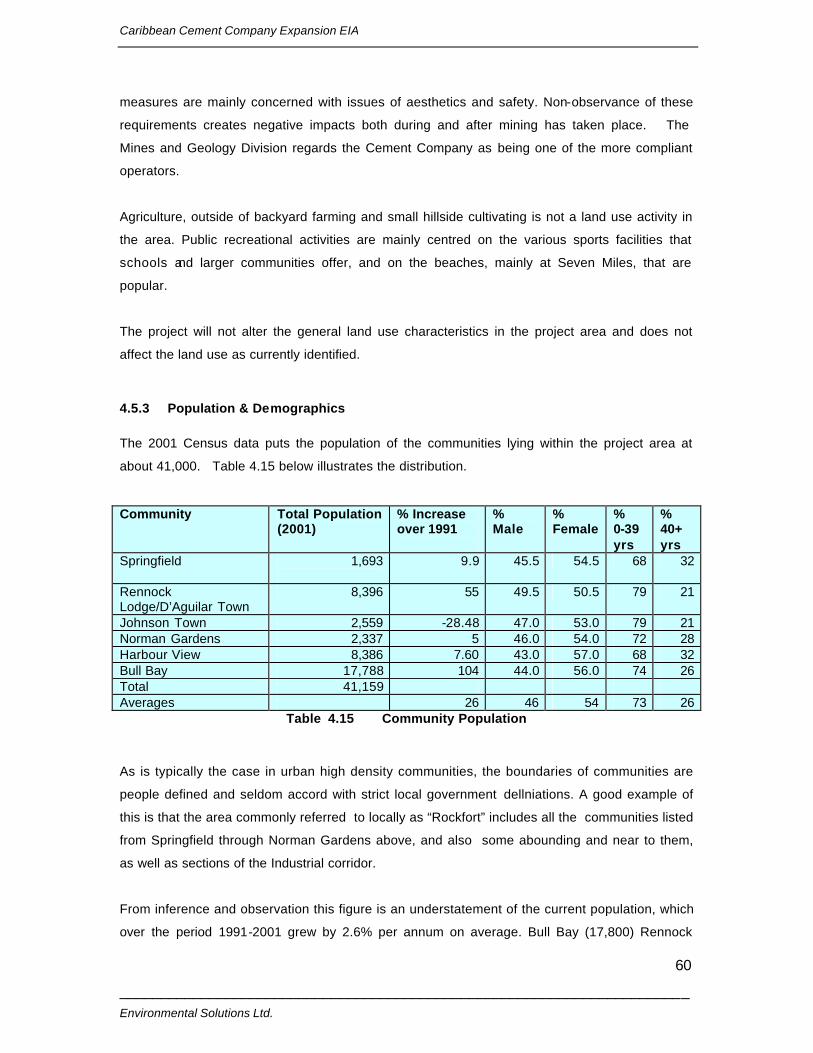
Caribbean Cement Company Expansion EIA
______________________________________________________________________ Environmental Solutions Ltd.
60
measures are mainly concerned with issues of aesthetics and safety. Non-observance of these
requirements creates negative impacts both during and after mining has taken place. The
Mines and Geology Division regards the Cement Company as being one of the more compliant
operators.
Agriculture, outside of backyard farming and small hillside cultivating is not a land use activity in
the area. Public recreational activities are mainly centred on the various sports facilities that
schools and larger communities offer, and on the beaches, mainly at Seven Miles, that are
popular.
The project will not alter the general land use characteristics in the project area and does not
affect the land use as currently identified.
4.5.3 Population & Demographics
The 2001 Census data puts the population of the communities lying within the project area at
about 41,000. Table 4.15 below illustrates the distribution.
Community Total Population (2001)
% Increase over 1991
% Male
% Female
% 0-39 yrs
% 40+ yrs
Springfield 1,693
9.9 45.5 54.5 68 32
Rennock Lodge/D’Aguilar Town
8,396 55 49.5 50.5 79 21
Johnson Town 2,559 -28.48 47.0 53.0 79 21 Norman Gardens 2,337 5 46.0 54.0 72 28 Harbour View 8,386 7.60 43.0 57.0 68 32 Bull Bay 17,788 104 44.0 56.0 74 26 Total 41,159 Averages 26 46 54 73 26
Table 4.15 Community Population
As is typically the case in urban high density communities, the boundaries of communities are
people defined and seldom accord with strict local government dellniations. A good example of
this is that the area commonly referred to locally as “Rockfort” includes all the communities listed
from Springfield through Norman Gardens above, and also some abounding and near to them,
as well as sections of the Industrial corridor.
From inference and observation this figure is an understatement of the current population, which
over the period 1991-2001 grew by 2.6% per annum on average. Bull Bay (17,800) Rennock
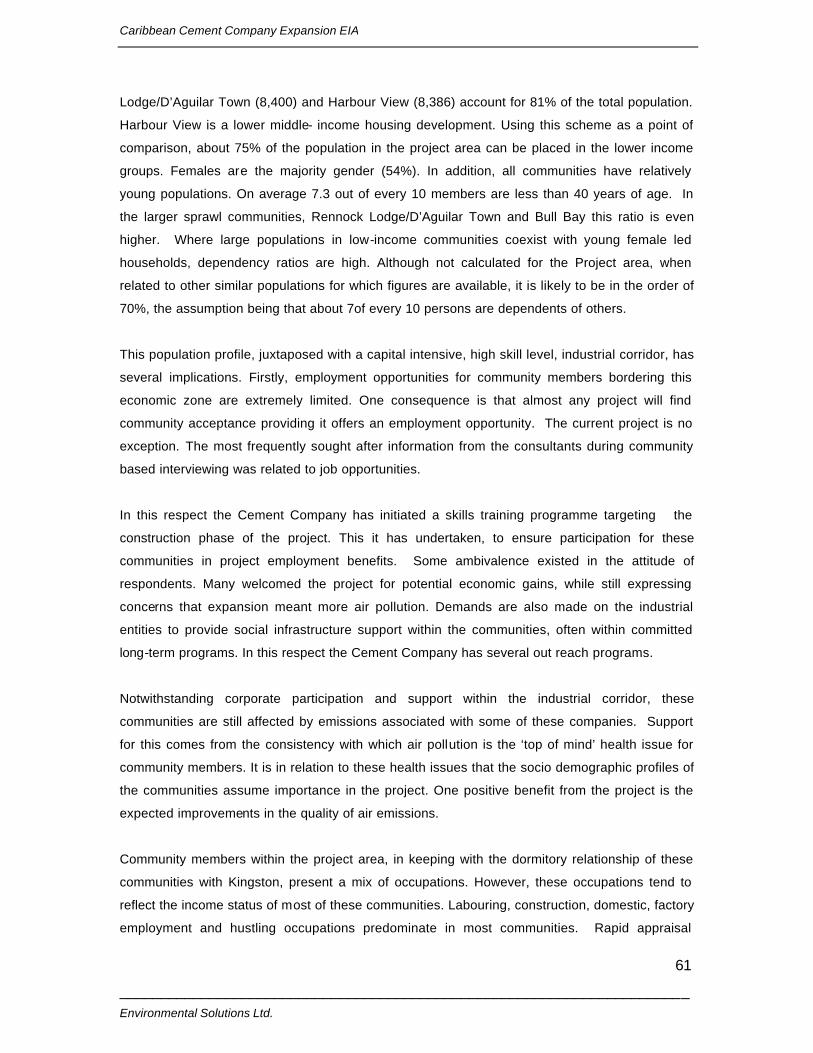
Caribbean Cement Company Expansion EIA
______________________________________________________________________ Environmental Solutions Ltd.
61
Lodge/D’Aguilar Town (8,400) and Harbour View (8,386) account for 81% of the total population.
Harbour View is a lower middle- income housing development. Using this scheme as a point of
comparison, about 75% of the population in the project area can be placed in the lower income
groups. Females are the majority gender (54%). In addition, all communities have relatively
young populations. On average 7.3 out of every 10 members are less than 40 years of age. In
the larger sprawl communities, Rennock Lodge/D’Aguilar Town and Bull Bay this ratio is even
higher. Where large populations in low-income communities coexist with young female led
households, dependency ratios are high. Although not calculated for the Project area, when
related to other similar populations for which figures are available, it is likely to be in the order of
70%, the assumption being that about 7of every 10 persons are dependents of others.
This population profile, juxtaposed with a capital intensive, high skill level, industrial corridor, has
several implications. Firstly, employment opportunities for community members bordering this
economic zone are extremely limited. One consequence is that almost any project will find
community acceptance providing it offers an employment opportunity. The current project is no
exception. The most frequently sought after information from the consultants during community
based interviewing was related to job opportunities.
In this respect the Cement Company has initiated a skills training programme targeting the
construction phase of the project. This it has undertaken, to ensure participation for these
communities in project employment benefits. Some ambivalence existed in the attitude of
respondents. Many welcomed the project for potential economic gains, while still expressing
concerns that expansion meant more air pollution. Demands are also made on the industrial
entities to provide social infrastructure support within the communities, often within committed
long-term programs. In this respect the Cement Company has several out reach programs.
Notwithstanding corporate participation and support within the industrial corridor, these
communities are still affected by emissions associated with some of these companies. Support
for this comes from the consistency with which air pollution is the ‘top of mind’ health issue for
community members. It is in relation to these health issues that the socio demographic profiles of
the communities assume importance in the project. One positive benefit from the project is the
expected improvements in the quality of air emissions.
Community members within the project area, in keeping with the dormitory relationship of these
communities with Kingston, present a mix of occupations. However, these occupations tend to
reflect the income status of most of these communities. Labouring, construction, domestic, factory
employment and hustling occupations predominate in most communities. Rapid appraisal
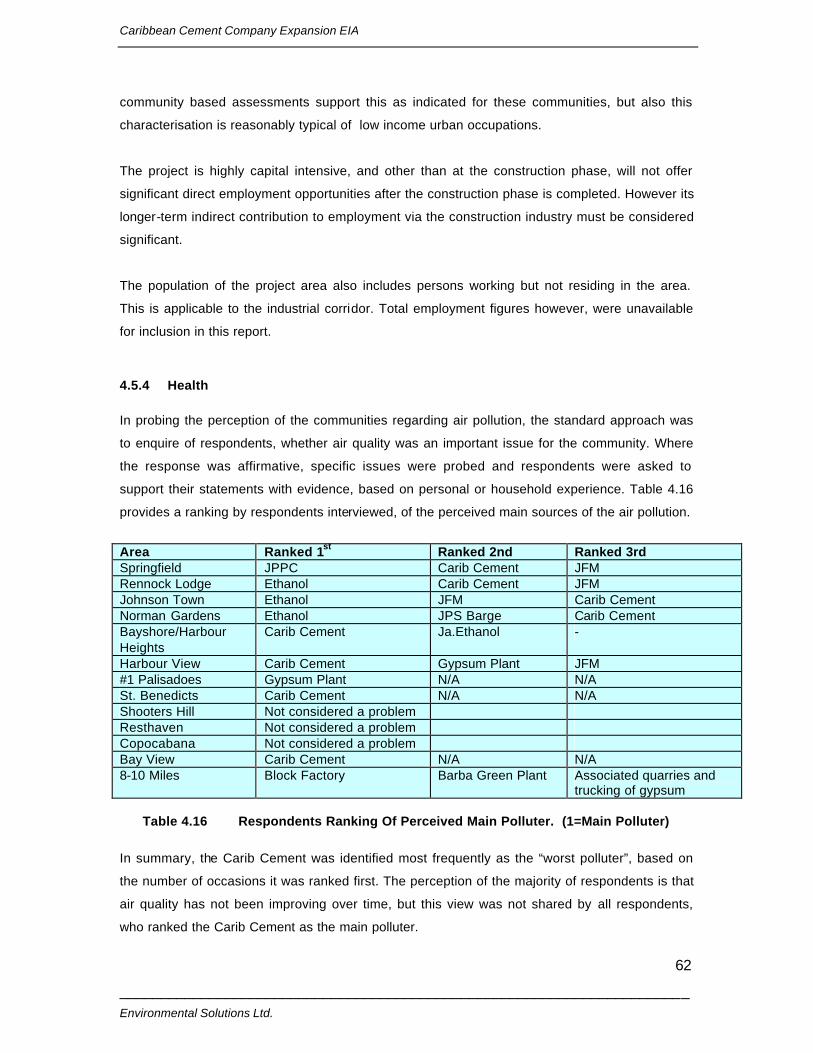
Caribbean Cement Company Expansion EIA
______________________________________________________________________ Environmental Solutions Ltd.
62
community based assessments support this as indicated for these communities, but also this
characterisation is reasonably typical of low income urban occupations.
The project is highly capital intensive, and other than at the construction phase, will not offer
significant direct employment opportunities after the construction phase is completed. However its
longer-term indirect contribution to employment via the construction industry must be considered
significant.
The population of the project area also includes persons working but not residing in the area.
This is applicable to the industrial corridor. Total employment figures however, were unavailable
for inclusion in this report.
4.5.4 Health
In probing the perception of the communities regarding air pollution, the standard approach was
to enquire of respondents, whether air quality was an important issue for the community. Where
the response was affirmative, specific issues were probed and respondents were asked to
support their statements with evidence, based on personal or household experience. Table 4.16
provides a ranking by respondents interviewed, of the perceived main sources of the air pollution.
Area Ranked 1st Ranked 2nd Ranked 3rd Springfield JPPC Carib Cement JFM Rennock Lodge Ethanol Carib Cement JFM Johnson Town Ethanol JFM Carib Cement Norman Gardens Ethanol JPS Barge Carib Cement Bayshore/Harbour Heights
Carib Cement Ja.Ethanol -
Harbour View Carib Cement Gypsum Plant JFM #1 Palisadoes Gypsum Plant N/A N/A St. Benedicts Carib Cement N/A N/A Shooters Hill Not considered a problem Resthaven Not considered a problem Copocabana Not considered a problem Bay View Carib Cement N/A N/A 8-10 Miles Block Factory Barba Green Plant Associated quarries and
trucking of gypsum
Table 4.16 Respondents Ranking Of Perceived Main Polluter. (1=Main Polluter)
In summary, the Carib Cement was identified most frequently as the “worst polluter”, based on
the number of occasions it was ranked first. The perception of the majority of respondents is that
air quality has not been improving over time, but this view was not shared by all respondents,
who ranked the Carib Cement as the main polluter.
Caribbean Cement Company Expansion EIA
______________________________________________________________________ Environmental Solutions Ltd.
63
The general perception received from respondents in the communities is that those communities
closest to the Carib Cement are the ones mostly affected by the plant. This seems substantiated
by the consistency of complaints found in Rennock Lodge to the west of the plant and Bayshore
to the east, and supported by the air quality sampling conducted in these two communities.
In conducting the survey, women were observed to be the gender most impacted by cement dust,
as they carried the burden of both maintaining household cleanliness and providing care to family
ailments they attribute to poor air quality.
Data was collected mainly from community individuals and groups, but key informants were also
canvassed. These were heads of local citizen’s association, principals of schools and persons
identified as community leaders. As a group there was less unanimity in relation to cause and
effect of air pollution on the communities.
A survey was also conducted among the firms in the industrial corridor where an important
segment of the work force find employment. The responses received are summarized in Table
4.17. Only members of senior management, who could offer an opinion on behalf of the firms,
were interviewed.
Industrial Firm Comment
Jamaica Private Power Co. Ltd. Not a problem as far as can be determined.
Jamaica Public Service Company Ltd. (Barge) Not a problem
Jamaica Flour Mills Ltd. A problem that has not improved over the years.
Jamaica Ethanol Processing Ltd. A major problem
Shell Chemicals (JA) Ltd. Remains a problem but has improved in recent years.
Texaco Caribbean Inc. A problem that has not changed over time.
Rockfort Mineral Baths Not a problem
Caribbean Construction Co. Ltd. Not a problem
Mineral Bath Not a problem
Table 4.17 Summary of Responses Concerning Dust Nuisance among
Industrial Firms
Responses were almost evenly balanced between perceiving cement dust to be a problem and
not. While the question remains as to whether the pollution experienced is in fact cement dust,
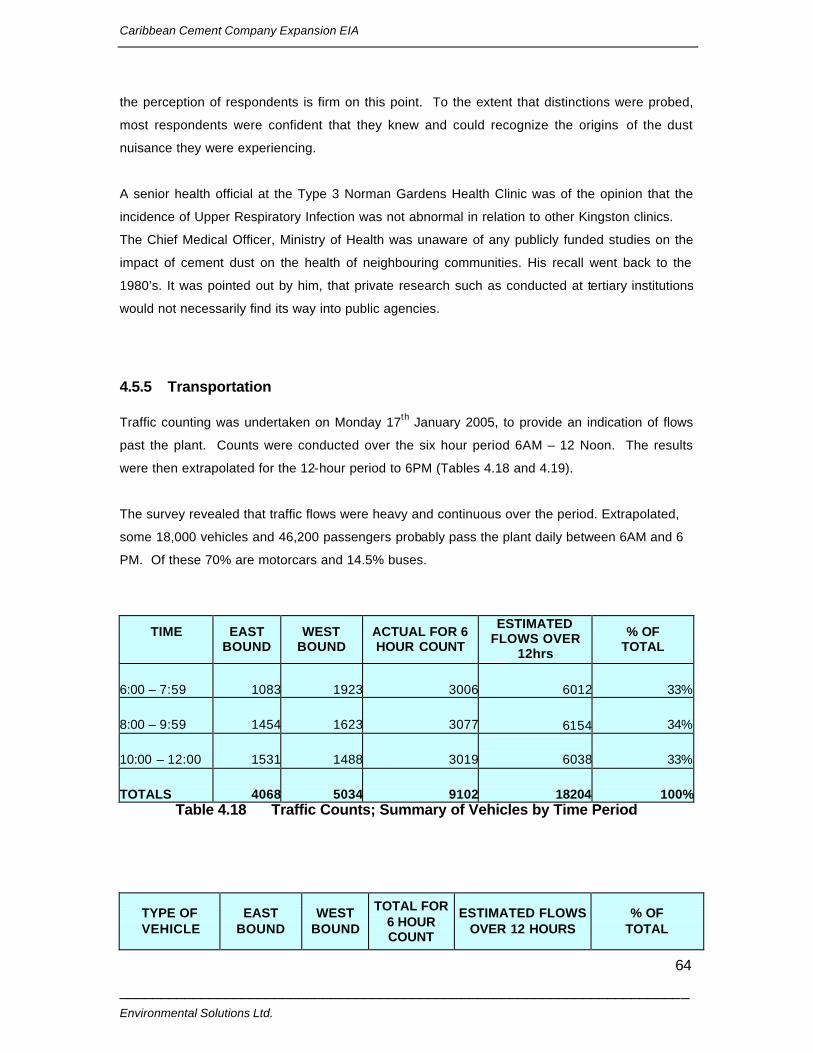
Caribbean Cement Company Expansion EIA
______________________________________________________________________ Environmental Solutions Ltd.
64
the perception of respondents is firm on this point. To the extent that distinctions were probed,
most respondents were confident that they knew and could recognize the origins of the dust
nuisance they were experiencing.
A senior health official at the Type 3 Norman Gardens Health Clinic was of the opinion that the
incidence of Upper Respiratory Infection was not abnormal in relation to other Kingston clinics.
The Chief Medical Officer, Ministry of Health was unaware of any publicly funded studies on the
impact of cement dust on the health of neighbouring communities. His recall went back to the
1980’s. It was pointed out by him, that private research such as conducted at tertiary institutions
would not necessarily find its way into public agencies.
4.5.5 Transportation
Traffic counting was undertaken on Monday 17th January 2005, to provide an indication of flows
past the plant. Counts were conducted over the six hour period 6AM – 12 Noon. The results
were then extrapolated for the 12-hour period to 6PM (Tables 4.18 and 4.19).
The survey revealed that traffic flows were heavy and continuous over the period. Extrapolated,
some 18,000 vehicles and 46,200 passengers probably pass the plant daily between 6AM and 6
PM. Of these 70% are motorcars and 14.5% buses.
TIME
EAST BOUND
WEST BOUND
ACTUAL FOR 6 HOUR COUNT
ESTIMATED FLOWS OVER
12hrs
% OF TOTAL
6:00 – 7:59 1083 1923 3006
6012 33%
8:00 – 9:59 1454 1623 3077
6154 34%
10:00 – 12:00 1531 1488 3019
6038 33%
TOTALS 4068 5034 9102
18204 100%Table 4.18 Traffic Counts; Summary of Vehicles by Time Period
TYPE OF VEHICLE
EAST BOUND
WEST BOUND
TOTAL FOR 6 HOUR COUNT
ESTIMATED FLOWS OVER 12 HOURS
% OF TOTAL
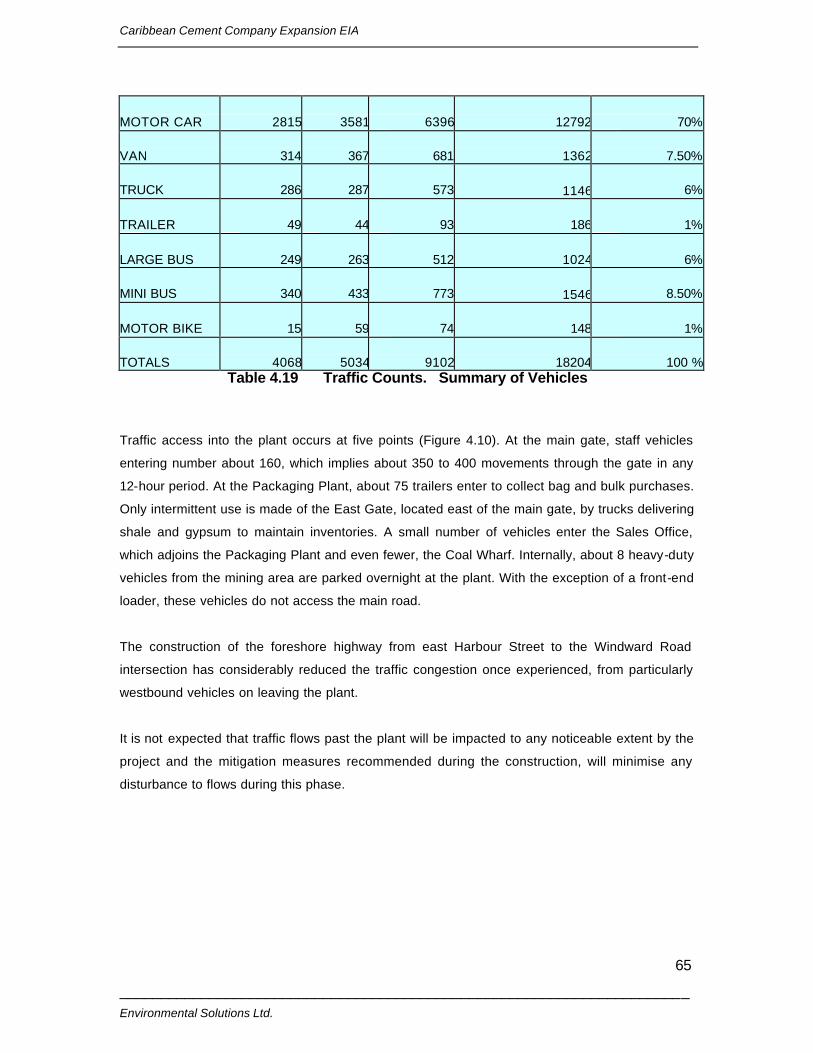
Caribbean Cement Company Expansion EIA
______________________________________________________________________ Environmental Solutions Ltd.
65
MOTOR CAR 2815 3581 6396
12792 70%
VAN 314 367 681
1362 7.50%
TRUCK 286 287 573
1146 6%
TRAILER 49 44 93
186 1%
LARGE BUS 249 263 512
1024 6%
MINI BUS 340 433 773
1546 8.50%
MOTOR BIKE 15 59 74
148 1%
TOTALS 4068 5034 9102
18204 100 %Table 4.19 Traffic Counts. Summary of Vehicles
Traffic access into the plant occurs at five points (Figure 4.10). At the main gate, staff vehicles
entering number about 160, which implies about 350 to 400 movements through the gate in any
12-hour period. At the Packaging Plant, about 75 trailers enter to collect bag and bulk purchases.
Only intermittent use is made of the East Gate, located east of the main gate, by trucks delivering
shale and gypsum to maintain inventories. A small number of vehicles enter the Sales Office,
which adjoins the Packaging Plant and even fewer, the Coal Wharf. Internally, about 8 heavy-duty
vehicles from the mining area are parked overnight at the plant. With the exception of a front-end
loader, these vehicles do not access the main road.
The construction of the foreshore highway from east Harbour Street to the Windward Road
intersection has considerably reduced the traffic congestion once experienced, from particularly
westbound vehicles on leaving the plant.
It is not expected that traffic flows past the plant will be impacted to any noticeable extent by the
project and the mitigation measures recommended during the construction, will minimise any
disturbance to flows during this phase.
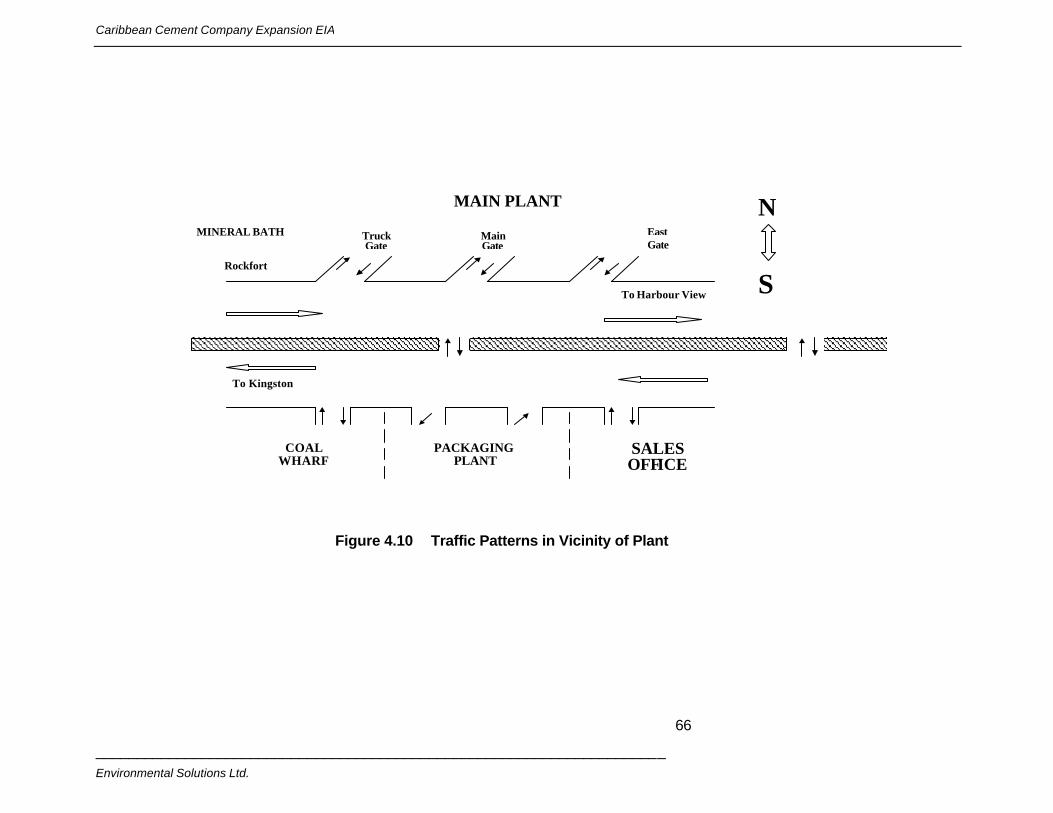
Caribbean Cement Company Expansion EIA
______________________________________________________________________ Environmental Solutions Ltd.
66
MINERAL BATH
Rockfort
Truck Gate Main Gate
East Gate
To Kingston
To Harbour View
PACKAGING PLANT
COAL WHARF
SALES OFF ICE
MAIN PLANT N
S
Figure 4.10 Traffic Patterns in Vicinity of Plant
Caribbean Cement Company Expansion EIA
______________________________________________________________________ Environmental Solutions Ltd.
67
4.5.6 Water & Electricity
Although exact values are not final, the consumption of both water and electricity by the project
will be lower than presently consumed. This is because of the switch from a wet kiln cement
process to a dry process. For water consumption, the company has projected that the project will
save 224 Million litres of water currently consumed in clinker production. Reduction in electricity
consumption is a major rationale for the new kiln technology selection although absolute values in
savings are not available for this report. Over the life of the project, which has as a main rationale,
increased production levels of close to 40%, input requirements of electricity may or may not
increase absolutely, but proportionally these inputs will still be more efficiently absorbed by
production than they are currently. New utilities will not be needed.
4.5.7 Archaeological Heritage
Rockfort, which lies to the west but within the plant environs, dates from 1729. The Fort formed
part of the island’s British colonial military history and has been “preserved” as part of the
archaeological heritage. A warm spring emerges from Long Mountain and was captured in a
‘mineral spa’ on the Rockfort grounds from the 1950’s. This spa has been upgraded and is
maintained by the Carib Cement.
Overall the project will impact positively on heritage assets within the plant environs, since the
targeted reduction in stack emissions will reduce one important corrosive element at work,
cement dust. Recommendations for the mitigation of dust nuisance during construction phase
have also been made.
Caribbean Cement Company Expansion EIA
______________________________________________________________________ Environmental Solutions Ltd.
68
5.0 SIGNIFICANT ENVIRONMENTAL IMPACTS AND MITIGATION MEASURES
5.1 AIR QUALITY ASSESSMENT
The cement manufacturing process is very energy-intensive and there are strong incentives for
energy conservation. The dry process is both economically and environmentally preferable to the
wet process because the energy consumption is approximately half of that for the wet process.
The dry process technology also has some environmental challenges, namely the handling of
huge volumes of dry powdered materials such as limestone and shale that can lead to greater
fugitive dust levels. However, advances in dust control technology such as the Electrostatic
Precipitators (ESP) and Fabric Filters should allow Carib Cement to successfully mitigate this
impact from particulate emissions, on the one hand, and through increased efficiency of
production resulting from conversion of waste emissions (which are added to the cement output).
Air Quality impacts during operations were assessed by looking at the air pollutant emissions
from the Carib Cement sources alone and also in relation to the emissions from other point
sources in the Kingston airshed. The potential air quality impacts were determined by modelling
the dispersion of the air pollutants from existing sources as well as after the proposed production
expansion at Carib Cement. In order to get more accurate results for impacts from the Carib
Cement facility, the decommissioned point and area sources were left out of the future plant
models that include the expansion project.
5.1.2 Air Pollution Sources
Air discharges occur from several point and area sources at Carib Cement. The point sources are
stacks and vents designed specifically for the release of air streams after processing by air
pollution control systems, such as electrostatic precipitator or a fabric filter. The discharges from
the point sources consist mainly of PM. Nitrogen oxides (NOx) and sulphur dioxide (SO2)are
emitted from combustion sources, such as kiln systems.
The area sources consist of a wide variety that can be categorized as storage piles, transfer
stations on conveyor belts, dump sites and open yard areas. PM is the main pollutant emitted
from these area sources.
A critical step for conducting air dispersion modelling is to quantify emissions from the various
sources at the Carib Cement facility and other nearby sources. The Air Quality Guideline
Document (Davis, 1999) indicates that surrounding sources that will “significantly” contribute to
Caribbean Cement Company Expansion EIA
______________________________________________________________________ Environmental Solutions Ltd.
69
the impact of the source or sources under consideration (termed the subject source) must be
included in the modelling analysis. The document further states, "all major point and area
sources located within 10 km and all significant point sources within 5 km of the subject source
should be included in the modelling analysis."
An attempt was made to determine the emission rates from such point and area sources in the
vicinity of the Carib Cement facility. The emission rates from these sources were estimated in
accordance with the recommendation outlined in the Ambient Air Quality Guideline Document.
According to Davis & Associates (1999), emission rates are estimated in the following order of
preference:
• Stack Emission Testing
• Manufacturer's emission data
• Mass balance calculations
• Emission factors
• Engineering calculations
Table 5.1 shows the data found for point and area sources in the vicinity of the Carib Cement
facility.
For the new sources at the Carib Cement facility, manufacturer's emission data were supplied
for kiln 5 production units. For existing Carib Cement sources, including the existing dry
process (kiln 4), the wet process (kiln 3), the two existing clinker coolers, the various point
sources associated with the dust collectors on the plant, as well as area sources throughout the
plant complex, the emission factor estimation method was utilized. Regarding the other
existing point sources within 10 km of the Carib Cement facility, the emission factor
methodology was utilized to determine emission rates, except for JPS and JPPC sources.
Stack emission test data were available for JPS sources (2001) and JPPC (1999).
Table 5.1.1 shows emission rates calculated using two different methods for all Carib Cement
sources that contribute to PM modelling. Method A uses US AP-42 emission factors multiplied
by the production rate to give the emission rate. Method B uses mass loading factors given by
the manufacturer multiplied by the flow rate to give the emission rate.
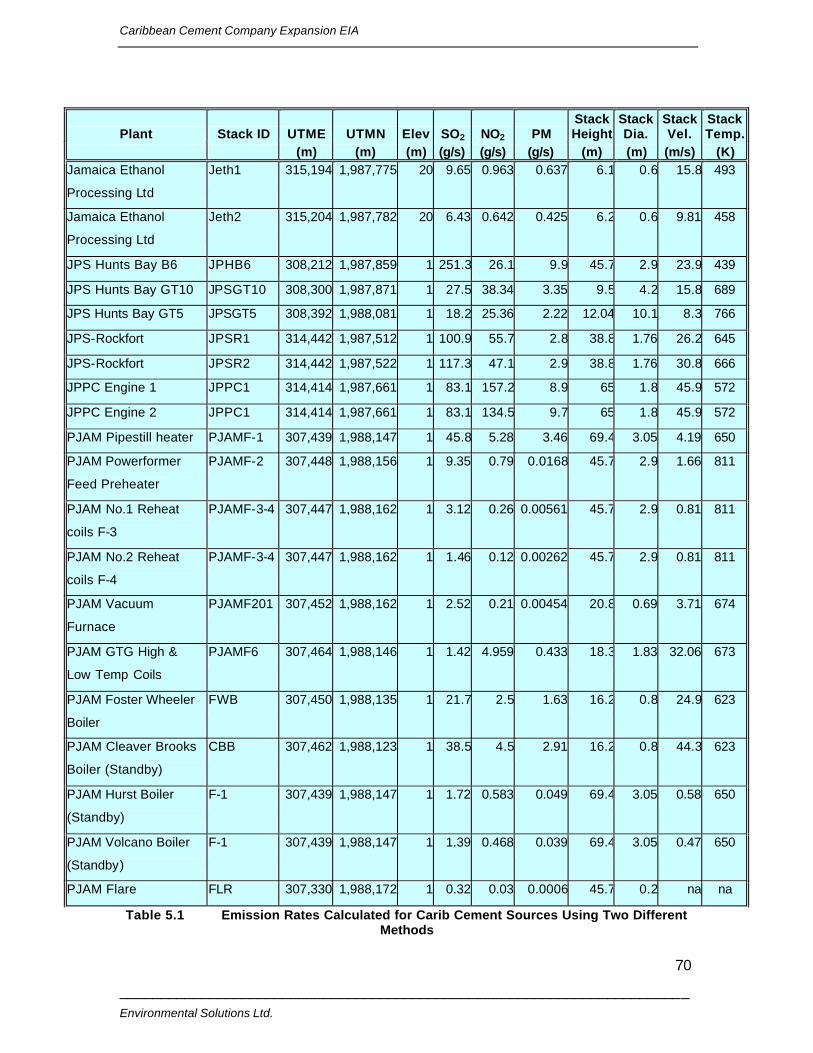
Caribbean Cement Company Expansion EIA
______________________________________________________________________ Environmental Solutions Ltd.
70
Table 5.1 Emission Rates Calculated for Carib Cement Sources Using Two Different Methods
Plant Stack ID UTME UTMN Elev SO2 NO2 PM Stack Height
Stack Dia.
Stack Vel.
Stack Temp.
(m) (m) (m) (g/s) (g/s) (g/s) (m) (m) (m/s) (K) Jamaica Ethanol
Processing Ltd
Jeth1 315,194 1,987,775 20 9.65 0.963 0.637 6.1 0.6 15.8 493
Jamaica Ethanol
Processing Ltd
Jeth2 315,204 1,987,782 20 6.43 0.642 0.425 6.2 0.6 9.81 458
JPS Hunts Bay B6 JPHB6 308,212 1,987,859 1 251.3 26.1 9.9 45.7 2.9 23.9 439
JPS Hunts Bay GT10 JPSGT10 308,300 1,987,871 1 27.5 38.34 3.35 9.5 4.2 15.8 689
JPS Hunts Bay GT5 JPSGT5 308,392 1,988,081 1 18.2 25.36 2.22 12.04 10.1 8.3 766
JPS-Rockfort JPSR1 314,442 1,987,512 1 100.9 55.7 2.8 38.8 1.76 26.2 645
JPS-Rockfort JPSR2 314,442 1,987,522 1 117.3 47.1 2.9 38.8 1.76 30.8 666
JPPC Engine 1 JPPC1 314,414 1,987,661 1 83.1 157.2 8.9 65 1.8 45.9 572
JPPC Engine 2 JPPC1 314,414 1,987,661 1 83.1 134.5 9.7 65 1.8 45.9 572
PJAM Pipestill heater PJAMF-1 307,439 1,988,147 1 45.8 5.28 3.46 69.4 3.05 4.19 650
PJAM Powerformer
Feed Preheater
PJAMF-2 307,448 1,988,156 1 9.35 0.79 0.0168 45.7 2.9 1.66 811
PJAM No.1 Reheat
coils F-3
PJAMF-3-4 307,447 1,988,162 1 3.12 0.26 0.00561 45.7 2.9 0.81 811
PJAM No.2 Reheat
coils F-4
PJAMF-3-4 307,447 1,988,162 1 1.46 0.12 0.00262 45.7 2.9 0.81 811
PJAM Vacuum
Furnace
PJAMF201 307,452 1,988,162 1 2.52 0.21 0.00454 20.8 0.69 3.71 674
PJAM GTG High &
Low Temp Coils
PJAMF6 307,464 1,988,146 1 1.42 4.959 0.433 18.3 1.83 32.06 673
PJAM Foster Wheeler
Boiler
FWB 307,450 1,988,135 1 21.7 2.5 1.63 16.2 0.8 24.9 623
PJAM Cleaver Brooks
Boiler (Standby)
CBB 307,462 1,988,123 1 38.5 4.5 2.91 16.2 0.8 44.3 623
PJAM Hurst Boiler
(Standby)
F-1 307,439 1,988,147 1 1.72 0.583 0.049 69.4 3.05 0.58 650
PJAM Volcano Boiler
(Standby)
F-1 307,439 1,988,147 1 1.39 0.468 0.039 69.4 3.05 0.47 650
PJAM Flare FLR 307,330 1,988,172 1 0.32 0.03 0.0006 45.7 0.2 na na
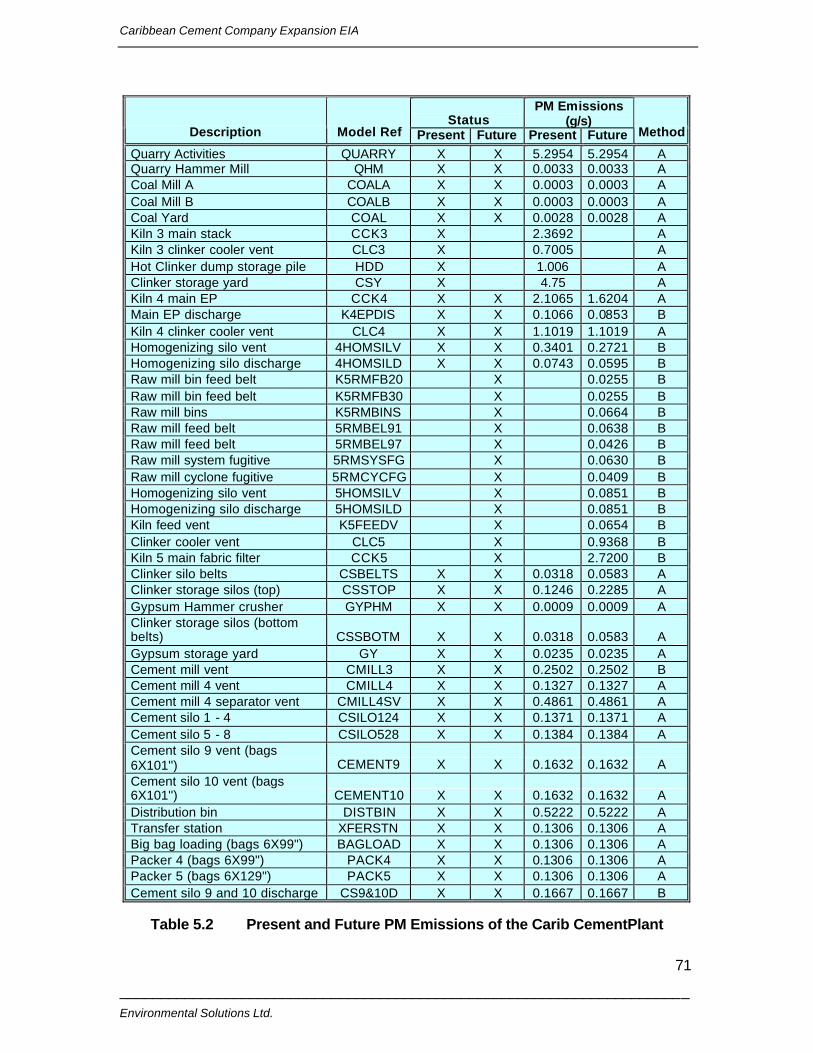
Caribbean Cement Company Expansion EIA
______________________________________________________________________ Environmental Solutions Ltd.
71
Status PM Emissions
(g/s) Description Model Ref Present Future Present Future Method
Quarry Activities QUARRY X X 5.2954 5.2954 A Quarry Hammer Mill QHM X X 0.0033 0.0033 A Coal Mill A COALA X X 0.0003 0.0003 A Coal Mill B COALB X X 0.0003 0.0003 A Coal Yard COAL X X 0.0028 0.0028 A Kiln 3 main stack CCK3 X 2.3692 A Kiln 3 clinker cooler vent CLC3 X 0.7005 A Hot Clinker dump storage pile HDD X 1.006 A Clinker storage yard CSY X 4.75 A Kiln 4 main EP CCK4 X X 2.1065 1.6204 A Main EP discharge K4EPDIS X X 0.1066 0.0853 B Kiln 4 clinker cooler vent CLC4 X X 1.1019 1.1019 A Homogenizing silo vent 4HOMSILV X X 0.3401 0.2721 B Homogenizing silo discharge 4HOMSILD X X 0.0743 0.0595 B Raw mill bin feed belt K5RMFB20 X 0.0255 B Raw mill bin feed belt K5RMFB30 X 0.0255 B Raw mill bins K5RMBINS X 0.0664 B Raw mill feed belt 5RMBEL91 X 0.0638 B Raw mill feed belt 5RMBEL97 X 0.0426 B Raw mill system fugitive 5RMSYSFG X 0.0630 B Raw mill cyclone fugitive 5RMCYCFG X 0.0409 B Homogenizing silo vent 5HOMSILV X 0.0851 B Homogenizing silo discharge 5HOMSILD X 0.0851 B Kiln feed vent K5FEEDV X 0.0654 B Clinker cooler vent CLC5 X 0.9368 B Kiln 5 main fabric filter CCK5 X 2.7200 B Clinker silo belts CSBELTS X X 0.0318 0.0583 A Clinker storage silos (top) CSSTOP X X 0.1246 0.2285 A Gypsum Hammer crusher GYPHM X X 0.0009 0.0009 A Clinker storage silos (bottom belts) CSSBOTM X X 0.0318 0.0583 A Gypsum storage yard GY X X 0.0235 0.0235 A Cement mill vent CMILL3 X X 0.2502 0.2502 B Cement mill 4 vent CMILL4 X X 0.1327 0.1327 A Cement mill 4 separator vent CMILL4SV X X 0.4861 0.4861 A Cement silo 1 - 4 CSILO124 X X 0.1371 0.1371 A Cement silo 5 - 8 CSILO528 X X 0.1384 0.1384 A Cement silo 9 vent (bags 6X101'') CEMENT9 X X 0.1632 0.1632 A Cement silo 10 vent (bags 6X101'') CEMENT10 X X 0.1632 0.1632 A Distribution bin DISTBIN X X 0.5222 0.5222 A Transfer station XFERSTN X X 0.1306 0.1306 A Big bag loading (bags 6X99") BAGLOAD X X 0.1306 0.1306 A Packer 4 (bags 6X99") PACK4 X X 0.1306 0.1306 A Packer 5 (bags 6X129") PACK5 X X 0.1306 0.1306 A Cement silo 9 and 10 discharge CS9&10D X X 0.1667 0.1667 B
Table 5.2 Present and Future PM Emissions of the Carib CementPlant
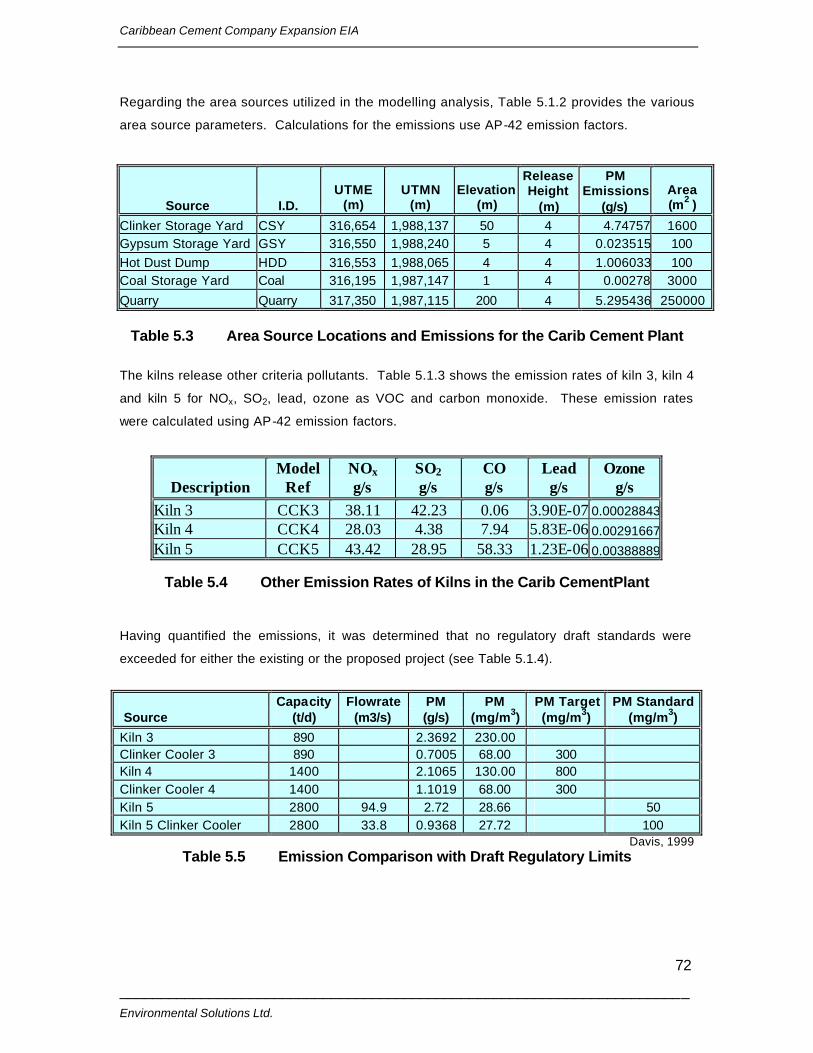
Caribbean Cement Company Expansion EIA
______________________________________________________________________ Environmental Solutions Ltd.
72
Regarding the area sources utilized in the modelling analysis, Table 5.1.2 provides the various
area source parameters. Calculations for the emissions use AP-42 emission factors.
Source I.D. UTME
(m) UTMN
(m) Elevation
(m)
Release Height
(m)
PM Emissions
(g/s) Area (m2 )
Clinker Storage Yard CSY 316,654 1,988,137 50 4 4.74757 1600 Gypsum Storage Yard GSY 316,550 1,988,240 5 4 0.023515 100 Hot Dust Dump HDD 316,553 1,988,065 4 4 1.006033 100 Coal Storage Yard Coal 316,195 1,987,147 1 4 0.00278 3000
Quarry Quarry 317,350 1,987,115 200 4 5.295436 250000
Table 5.3 Area Source Locations and Emissions for the Carib Cement Plant
The kilns release other criteria pollutants. Table 5.1.3 shows the emission rates of kiln 3, kiln 4
and kiln 5 for NOx, SO2, lead, ozone as VOC and carbon monoxide. These emission rates
were calculated using AP-42 emission factors.
Description Model
Ref NOx g/s
SO2 g/s
CO g/s
Lead g/s
Ozone g/s
Kiln 3 CCK3 38.11 42.23 0.06 3.90E-07 0.00028843Kiln 4 CCK4 28.03 4.38 7.94 5.83E-06 0.00291667Kiln 5 CCK5 43.42 28.95 58.33 1.23E-06 0.00388889
Table 5.4 Other Emission Rates of Kilns in the Carib CementPlant
Having quantified the emissions, it was determined that no regulatory draft standards were
exceeded for either the existing or the proposed project (see Table 5.1.4).
Capacity Flowrate PM PM PM Target PM Standard Source (t/d) (m3/s) (g/s) (mg/m3) (mg/m3) (mg/m3)
Kiln 3 890 2.3692 230.00 Clinker Cooler 3 890 0.7005 68.00 300 Kiln 4 1400 2.1065 130.00 800 Clinker Cooler 4 1400 1.1019 68.00 300 Kiln 5 2800 94.9 2.72 28.66 50 Kiln 5 Clinker Cooler 2800 33.8 0.9368 27.72 100
Davis, 1999 Table 5.5 Emission Comparison with Draft Regulatory Limits
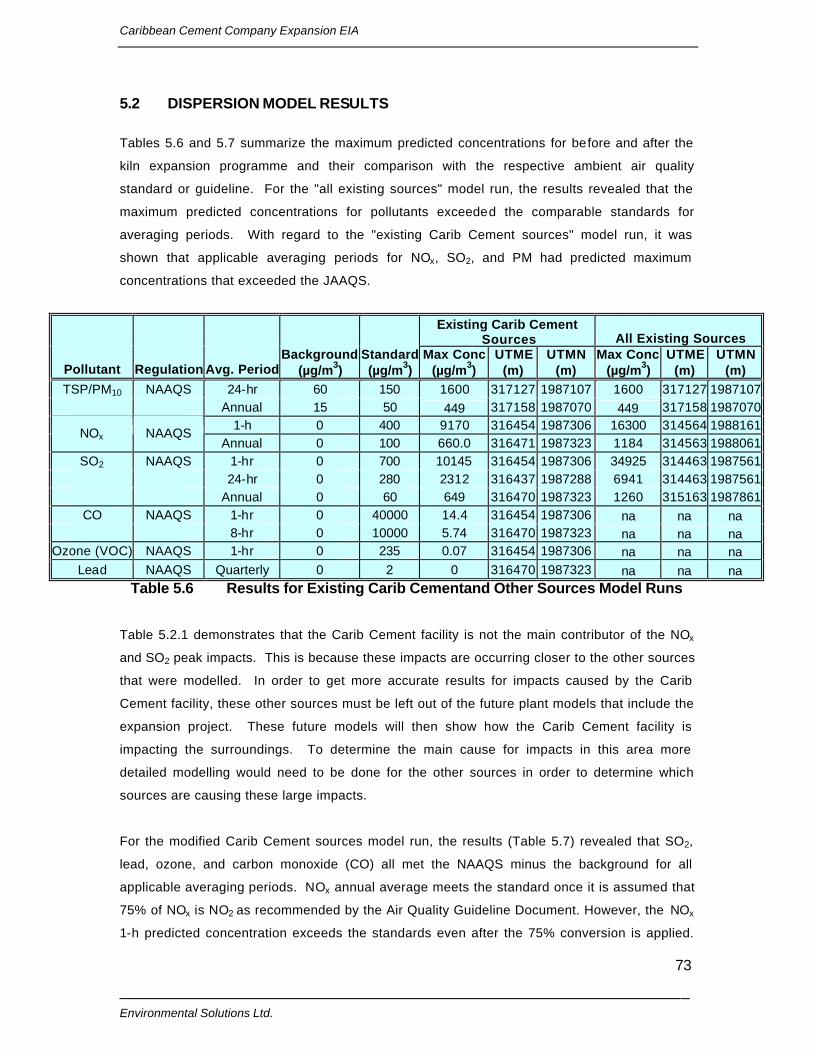
Caribbean Cement Company Expansion EIA
______________________________________________________________________ Environmental Solutions Ltd.
73
5.2 DISPERSION MODEL RESULTS
Tables 5.6 and 5.7 summarize the maximum predicted concentrations for before and after the
kiln expansion programme and their comparison with the respective ambient air quality
standard or guideline. For the "all existing sources" model run, the results revealed that the
maximum predicted concentrations for pollutants exceeded the comparable standards for
averaging periods. With regard to the "existing Carib Cement sources" model run, it was
shown that applicable averaging periods for NOx, SO2, and PM had predicted maximum
concentrations that exceeded the JAAQS.
Existing Carib Cement
Sources All Existing Sources
Pollutant Regulation Avg. PeriodBackground
(µg/m3) Standard(µg/m3)
Max Conc (µg/m3)
UTME (m)
UTMN (m)
Max Conc (µg/m3)
UTME (m)
UTMN (m)
TSP/PM10 NAAQS 24-hr 60 150 1600 317127 1987107 1600 317127 1987107 Annual 15 50 449 317158 1987070 449 317158 1987070
1-h 0 400 9170 316454 1987306 16300 314564 1988161NOx NAAQS
Annual 0 100 660.0 316471 1987323 1184 314563 1988061SO2 NAAQS 1-hr 0 700 10145 316454 1987306 34925 314463 1987561
24-hr 0 280 2312 316437 1987288 6941 314463 1987561 Annual 0 60 649 316470 1987323 1260 315163 1987861
CO NAAQS 1-hr 0 40000 14.4 316454 1987306 na na na 8-hr 0 10000 5.74 316470 1987323 na na na
Ozone (VOC) NAAQS 1-hr 0 235 0.07 316454 1987306 na na na Lead NAAQS Quarterly 0 2 0 316470 1987323 na na na
Table 5.6 Results for Existing Carib Cementand Other Sources Model Runs Table 5.2.1 demonstrates that the Carib Cement facility is not the main contributor of the NOx
and SO2 peak impacts. This is because these impacts are occurring closer to the other sources
that were modelled. In order to get more accurate results for impacts caused by the Carib
Cement facility, these other sources must be left out of the future plant models that include the
expansion project. These future models will then show how the Carib Cement facility is
impacting the surroundings. To determine the main cause for impacts in this area more
detailed modelling would need to be done for the other sources in order to determine which
sources are causing these large impacts.
For the modified Carib Cement sources model run, the results (Table 5.7) revealed that SO2,
lead, ozone, and carbon monoxide (CO) all met the NAAQS minus the background for all
applicable averaging periods. NOx annual average meets the standard once it is assumed that
75% of NOx is NO2 as recommended by the Air Quality Guideline Document. However, the NOx
1-h predicted concentration exceeds the standards even after the 75% conversion is applied.
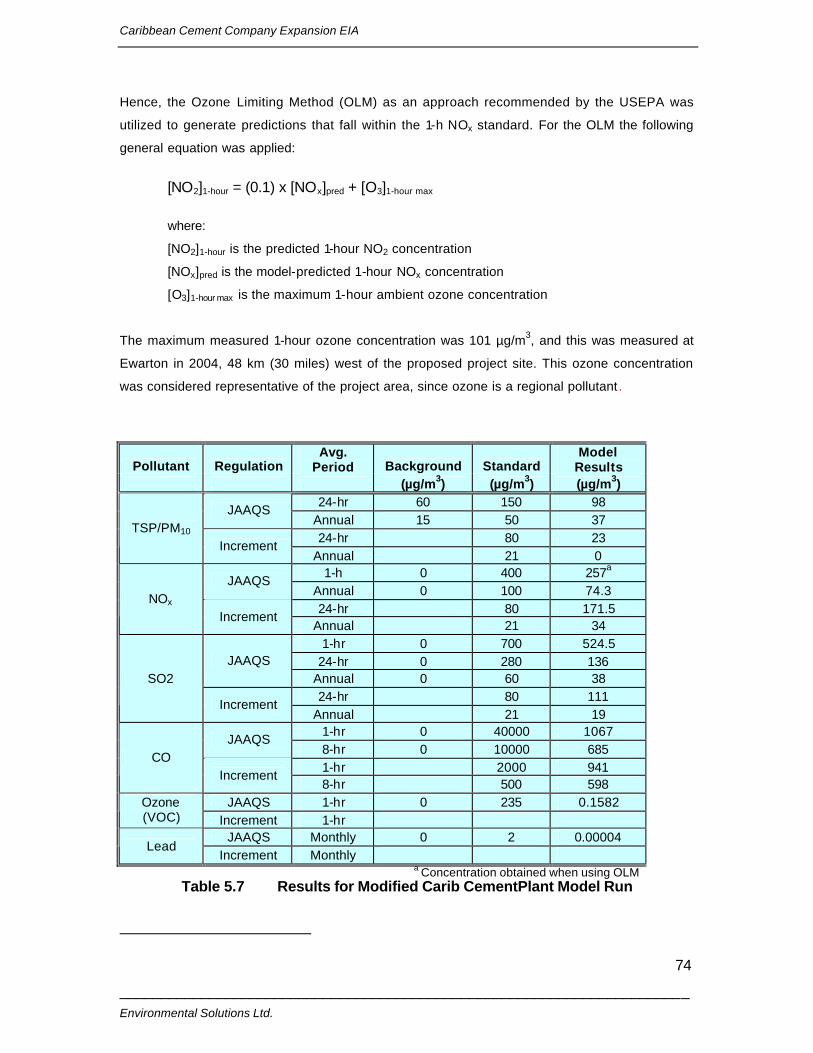
Caribbean Cement Company Expansion EIA
______________________________________________________________________ Environmental Solutions Ltd.
74
Hence, the Ozone Limiting Method (OLM) as an approach recommended by the USEPA was
utilized to generate predictions that fall within the 1-h NOx standard. For the OLM the following
general equation was applied:
[NO2]1-hour = (0.1) x [NOx]pred + [O3]1-hour max
where:
[NO2]1-hour is the predicted 1-hour NO2 concentration
[NOx]pred is the model-predicted 1-hour NOx concentration
[O3]1-hour max is the maximum 1-hour ambient ozone concentration
The maximum measured 1-hour ozone concentration was 101 µg/m3, and this was measured at
Ewarton in 2004, 48 km (30 miles) west of the proposed project site. This ozone concentration
was considered representative of the project area, since ozone is a regional pollutant.
Pollutant Regulation Avg.
Period Background Standard Model
Results (µg/m3) (µg/m3) (µg/m3)
24-hr 60 150 98 JAAQS
Annual 15 50 37 24-hr 80 23
TSP/PM10 Increment
Annual 21 0 1-h 0 400 257a
JAAQS Annual 0 100 74.3 24-hr 80 171.5
NOx Increment
Annual 21 34 1-hr 0 700 524.5
24-hr 0 280 136 JAAQS Annual 0 60 38 24-hr 80 111
SO2
Increment Annual 21 19
1-hr 0 40000 1067 JAAQS
8-hr 0 10000 685 1-hr 2000 941
CO Increment
8-hr 500 598 JAAQS 1-hr 0 235 0.1582 Ozone
(VOC) Increment 1-hr JAAQS Monthly 0 2 0.00004
Lead Increment Monthly
a Concentration obtained when using OLM Table 5.7 Results for Modified Carib CementPlant Model Run
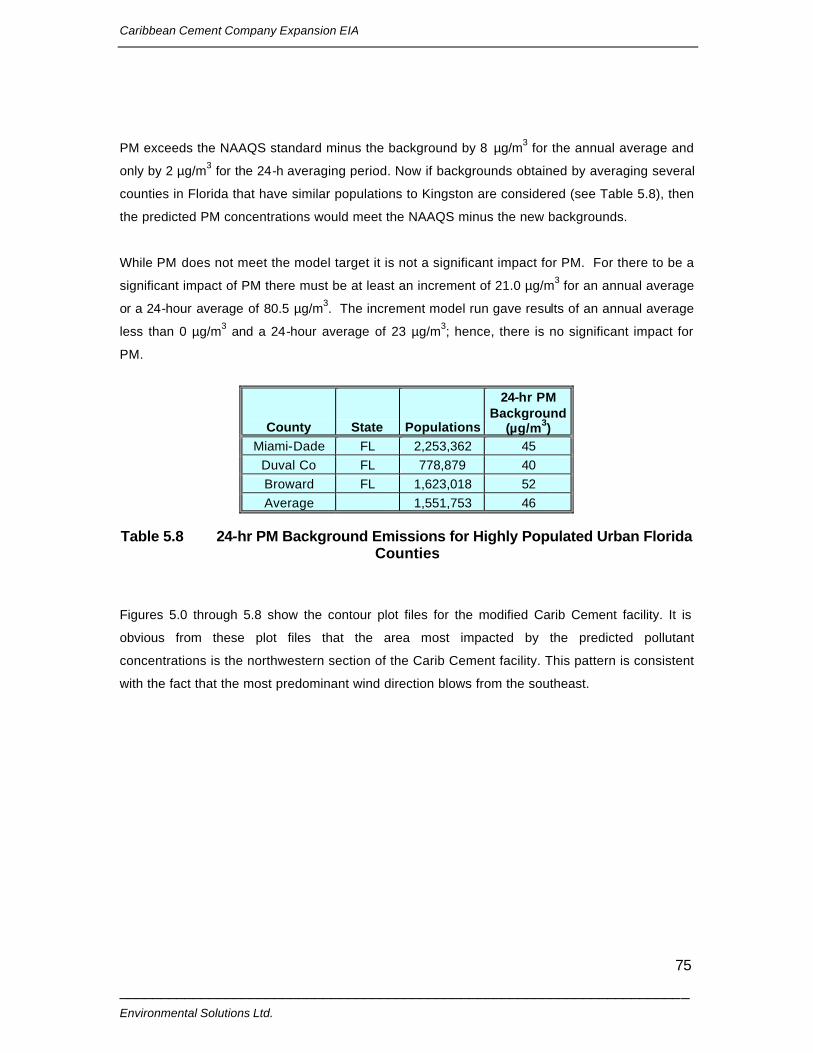
Caribbean Cement Company Expansion EIA
______________________________________________________________________ Environmental Solutions Ltd.
75
PM exceeds the NAAQS standard minus the background by 8 µg/m3 for the annual average and
only by 2 µg/m3 for the 24-h averaging period. Now if backgrounds obtained by averaging several
counties in Florida that have similar populations to Kingston are considered (see Table 5.8), then
the predicted PM concentrations would meet the NAAQS minus the new backgrounds.
While PM does not meet the model target it is not a significant impact for PM. For there to be a
significant impact of PM there must be at least an increment of 21.0 µg/m3 for an annual average
or a 24-hour average of 80.5 µg/m3. The increment model run gave results of an annual average
less than 0 µg/m3 and a 24-hour average of 23 µg/m3; hence, there is no significant impact for
PM.
County State Populations
24-hr PM Background
(µg/m3) Miami-Dade FL 2,253,362 45
Duval Co FL 778,879 40 Broward FL 1,623,018 52 Average 1,551,753 46
Table 5.8 24-hr PM Background Emissions for Highly Populated Urban Florida
Counties
Figures 5.0 through 5.8 show the contour plot files for the modified Carib Cement facility. It is
obvious from these plot files that the area most impacted by the predicted pollutant
concentrations is the northwestern section of the Carib Cement facility. This pattern is consistent
with the fact that the most predominant wind direction blows from the southeast.
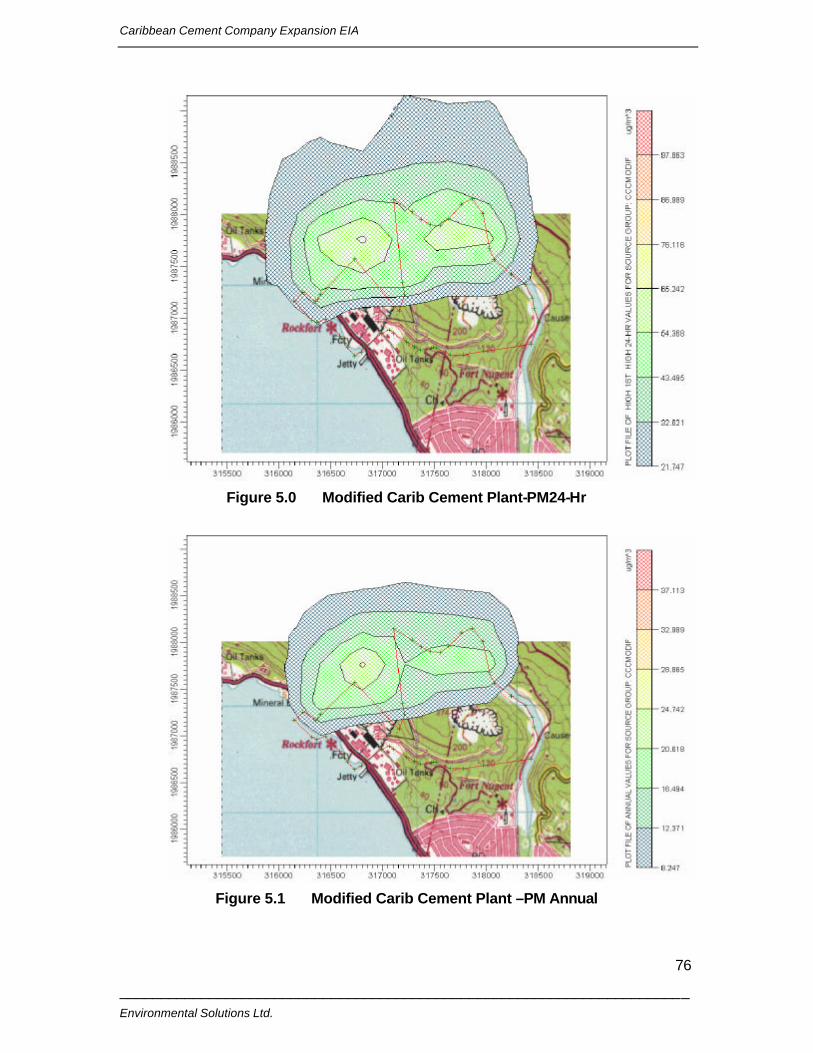
Caribbean Cement Company Expansion EIA
______________________________________________________________________ Environmental Solutions Ltd.
76
Figure 5.0 Modified Carib Cement Plant-PM24-Hr
Figure 5.1 Modified Carib Cement Plant –PM Annual
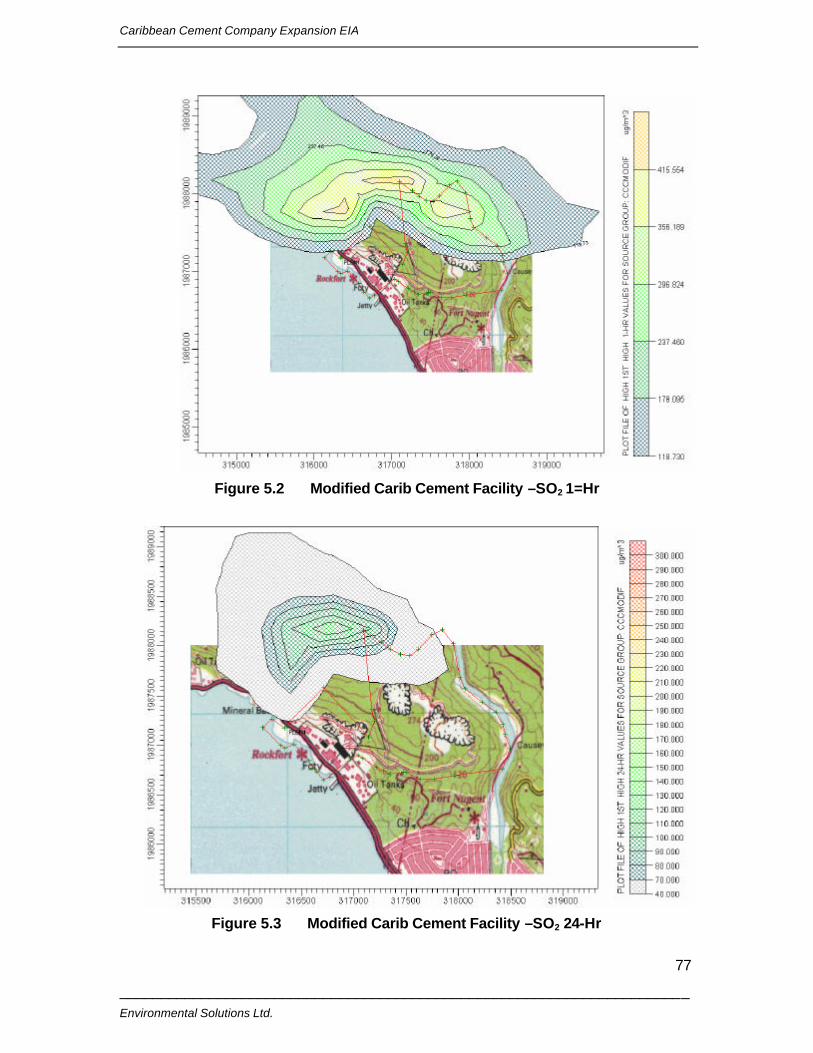
Caribbean Cement Company Expansion EIA
______________________________________________________________________ Environmental Solutions Ltd.
77
Figure 5.2 Modified Carib Cement Facility –SO2 1=Hr
Figure 5.3 Modified Carib Cement Facility –SO2 24-Hr
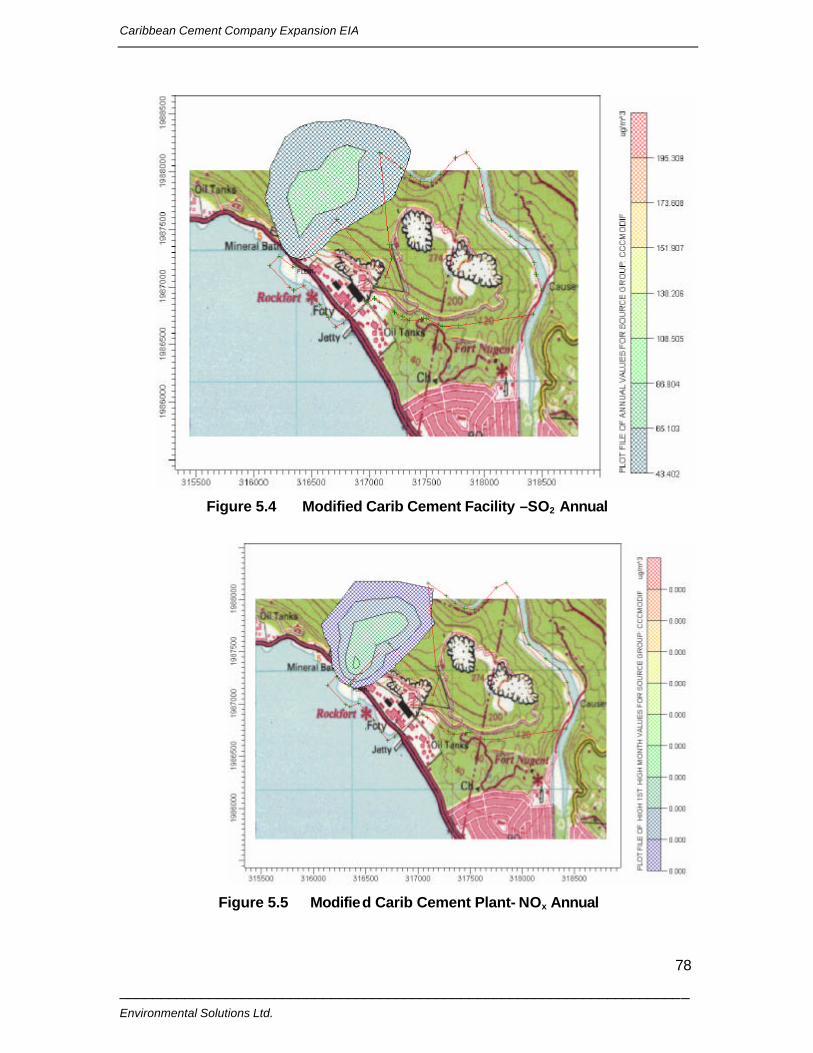
Caribbean Cement Company Expansion EIA
______________________________________________________________________ Environmental Solutions Ltd.
78
Figure 5.4 Modified Carib Cement Facility –SO2 Annual
Figure 5.5 Modified Carib Cement Plant- NOx Annual
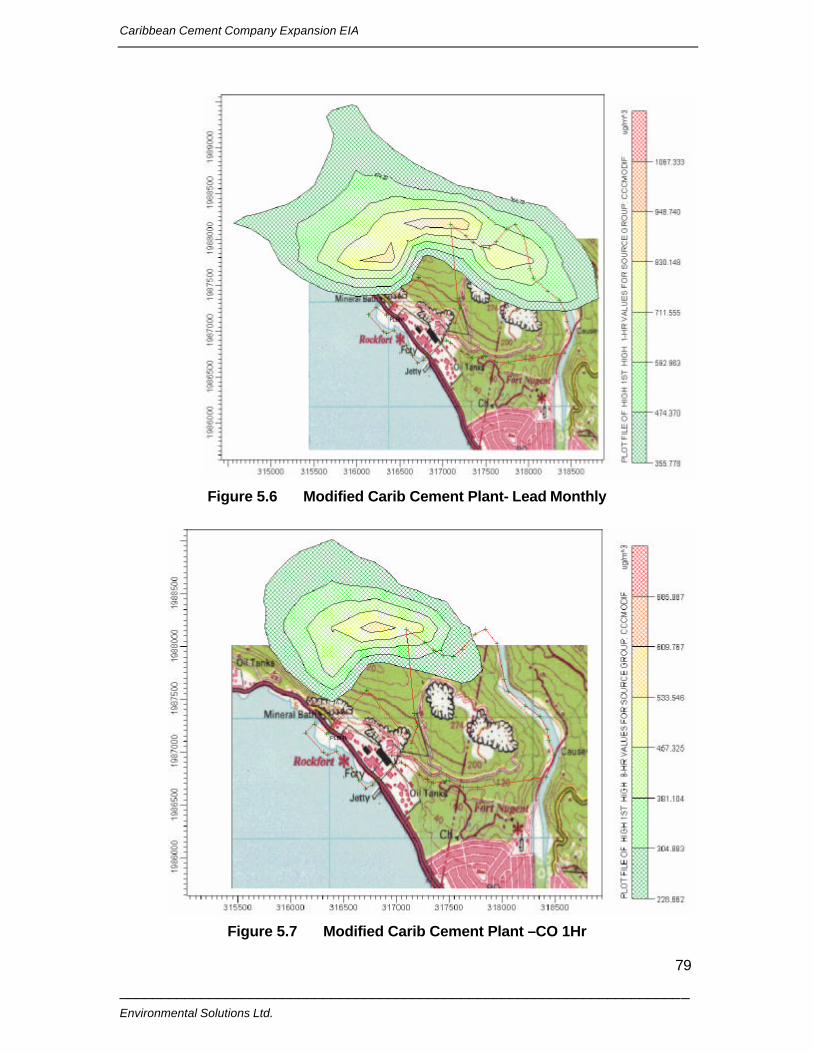
Caribbean Cement Company Expansion EIA
______________________________________________________________________ Environmental Solutions Ltd.
79
Figure 5.6 Modified Carib Cement Plant- Lead Monthly
Figure 5.7 Modified Carib Cement Plant –CO 1Hr
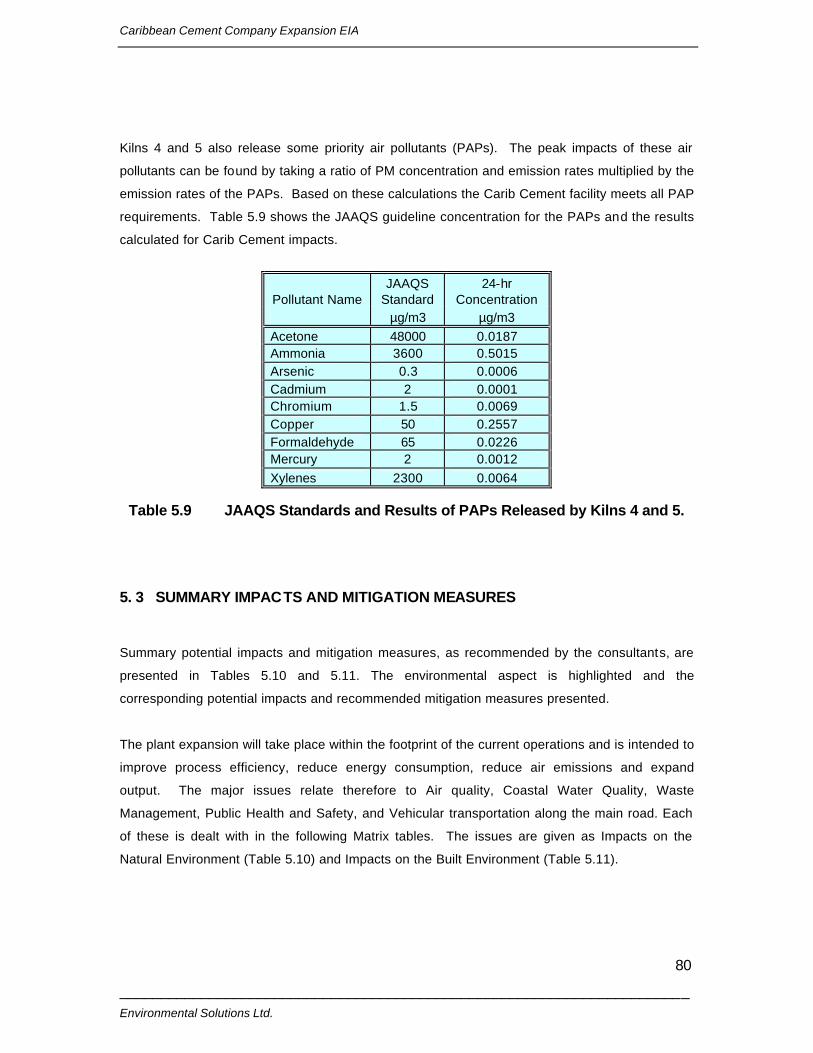
Caribbean Cement Company Expansion EIA
______________________________________________________________________ Environmental Solutions Ltd.
80
Kilns 4 and 5 also release some priority air pollutants (PAPs). The peak impacts of these air
pollutants can be found by taking a ratio of PM concentration and emission rates multiplied by the
emission rates of the PAPs. Based on these calculations the Carib Cement facility meets all PAP
requirements. Table 5.9 shows the JAAQS guideline concentration for the PAPs and the results
calculated for Carib Cement impacts.
Pollutant Name JAAQS
Standard 24-hr
Concentration µg/m3 µg/m3 Acetone 48000 0.0187 Ammonia 3600 0.5015 Arsenic 0.3 0.0006 Cadmium 2 0.0001 Chromium 1.5 0.0069 Copper 50 0.2557 Formaldehyde 65 0.0226 Mercury 2 0.0012 Xylenes 2300 0.0064
Table 5.9 JAAQS Standards and Results of PAPs Released by Kilns 4 and 5.
5. 3 SUMMARY IMPACTS AND MITIGATION MEASURES
Summary potential impacts and mitigation measures, as recommended by the consultants, are
presented in Tables 5.10 and 5.11. The environmental aspect is highlighted and the
corresponding potential impacts and recommended mitigation measures presented.
The plant expansion will take place within the footprint of the current operations and is intended to
improve process efficiency, reduce energy consumption, reduce air emissions and expand
output. The major issues relate therefore to Air quality, Coastal Water Quality, Waste
Management, Public Health and Safety, and Vehicular transportation along the main road. Each
of these is dealt with in the following Matrix tables. The issues are given as Impacts on the
Natural Environment (Table 5.10) and Impacts on the Built Environment (Table 5.11).
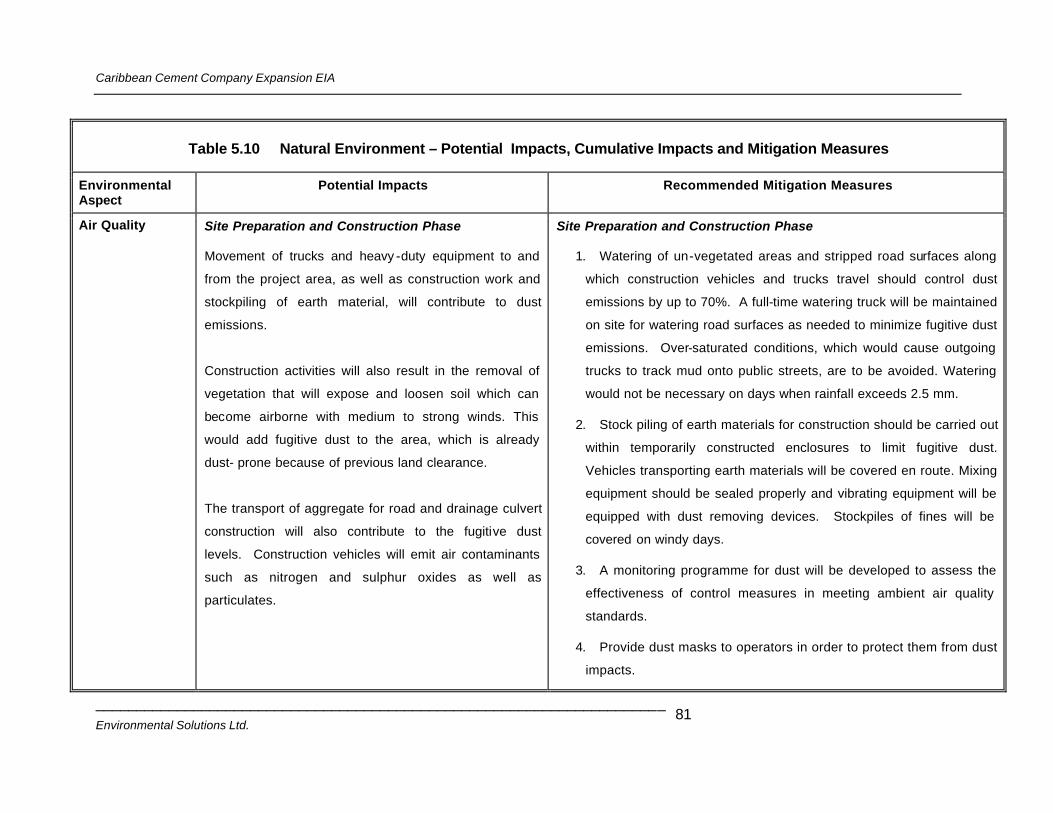
Caribbean Cement Company Expansion EIA
______________________________________________________________________ Environmental Solutions Ltd.
81
Table 5.10 Natural Environment – Potential Impacts, Cumulative Impacts and Mitigation Measures
Environmental Aspect
Potential Impacts Recommended Mitigation Measures
Air Quality
Site Preparation and Construction Phase Movement of trucks and heavy -duty equipment to and
from the project area, as well as construction work and
stockpiling of earth material, will contribute to dust
emissions.
Construction activities will also result in the removal of
vegetation that will expose and loosen soil which can
become airborne with medium to strong winds. This
would add fugitive dust to the area, which is already
dust- prone because of previous land clearance.
The transport of aggregate for road and drainage culvert
construction will also contribute to the fugitive dust
levels. Construction vehicles will emit air contaminants
such as nitrogen and sulphur oxides as well as
particulates.
Site Preparation and Construction Phase
1. Watering of un-vegetated areas and stripped road surfaces along
which construction vehicles and trucks travel should control dust
emissions by up to 70%. A full-time watering truck will be maintained
on site for watering road surfaces as needed to minimize fugitive dust
emissions. Over-saturated conditions, which would cause outgoing
trucks to track mud onto public streets, are to be avoided. Watering
would not be necessary on days when rainfall exceeds 2.5 mm.
2. Stock piling of earth materials for construction should be carried out
within temporarily constructed enclosures to limit fugitive dust.
Vehicles transporting earth materials will be covered en route. Mixing
equipment should be sealed properly and vibrating equipment will be
equipped with dust removing devices. Stockpiles of fines will be
covered on windy days.
3. A monitoring programme for dust will be developed to assess the
effectiveness of control measures in meeting ambient air quality
standards.
4. Provide dust masks to operators in order to protect them from dust
impacts.
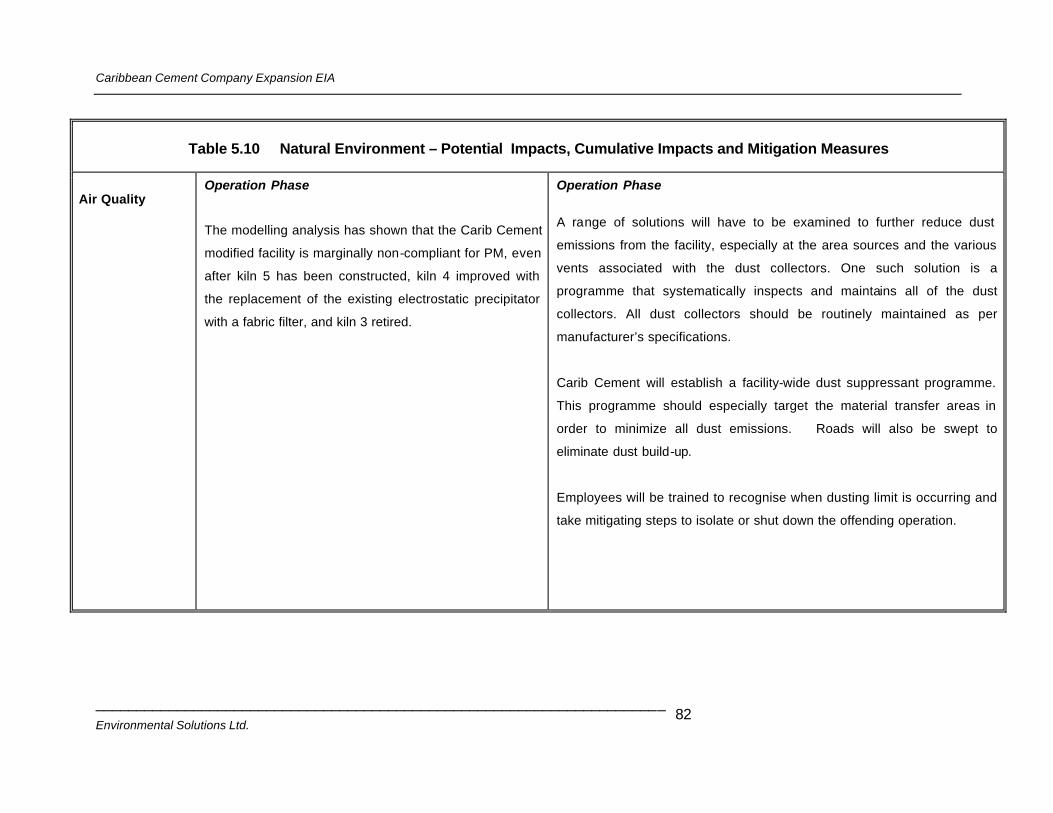
Caribbean Cement Company Expansion EIA
______________________________________________________________________ Environmental Solutions Ltd.
82
Table 5.10 Natural Environment – Potential Impacts, Cumulative Impacts and Mitigation Measures
Air Quality
Operation Phase The modelling analysis has shown that the Carib Cement
modified facility is marginally non-compliant for PM, even
after kiln 5 has been constructed, kiln 4 improved with
the replacement of the existing electrostatic precipitator
with a fabric filter, and kiln 3 retired.
Operation Phase
A range of solutions will have to be examined to further reduce dust
emissions from the facility, especially at the area sources and the various
vents associated with the dust collectors. One such solution is a
programme that systematically inspects and maintains all of the dust
collectors. All dust collectors should be routinely maintained as per
manufacturer’s specifications.
Carib Cement will establish a facility-wide dust suppressant programme.
This programme should especially target the material transfer areas in
order to minimize all dust emissions. Roads will also be swept to
eliminate dust build-up.
Employees will be trained to recognise when dusting limit is occurring and
take mitigating steps to isolate or shut down the offending operation.
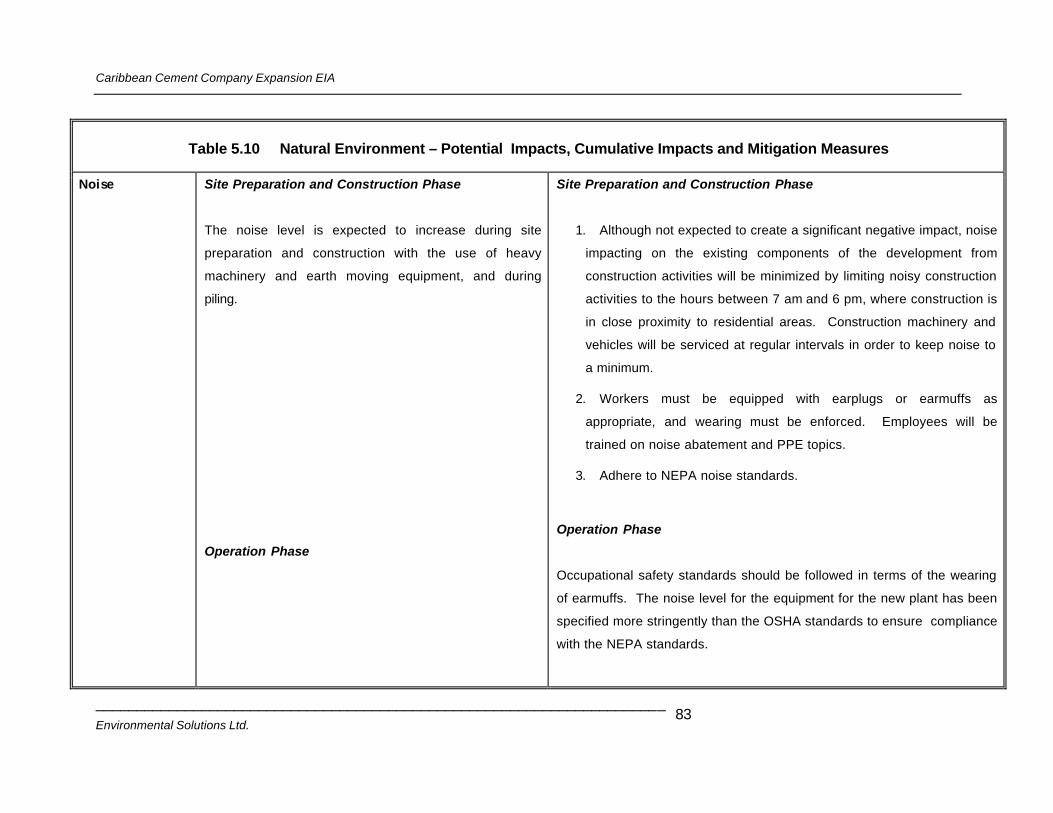
Caribbean Cement Company Expansion EIA
______________________________________________________________________ Environmental Solutions Ltd.
83
Table 5.10 Natural Environment – Potential Impacts, Cumulative Impacts and Mitigation Measures
Noise Site Preparation and Construction Phase
The noise level is expected to increase during site
preparation and construction with the use of heavy
machinery and earth moving equipment, and during
piling.
Operation Phase
Site Preparation and Construction Phase
1. Although not expected to create a significant negative impact, noise
impacting on the existing components of the development from
construction activities will be minimized by limiting noisy construction
activities to the hours between 7 am and 6 pm, where construction is
in close proximity to residential areas. Construction machinery and
vehicles will be serviced at regular intervals in order to keep noise to
a minimum.
2. Workers must be equipped with earplugs or earmuffs as
appropriate, and wearing must be enforced. Employees will be
trained on noise abatement and PPE topics.
3. Adhere to NEPA noise standards.
Operation Phase
Occupational safety standards should be followed in terms of the wearing
of earmuffs. The noise level for the equipment for the new plant has been
specified more stringently than the OSHA standards to ensure compliance
with the NEPA standards.
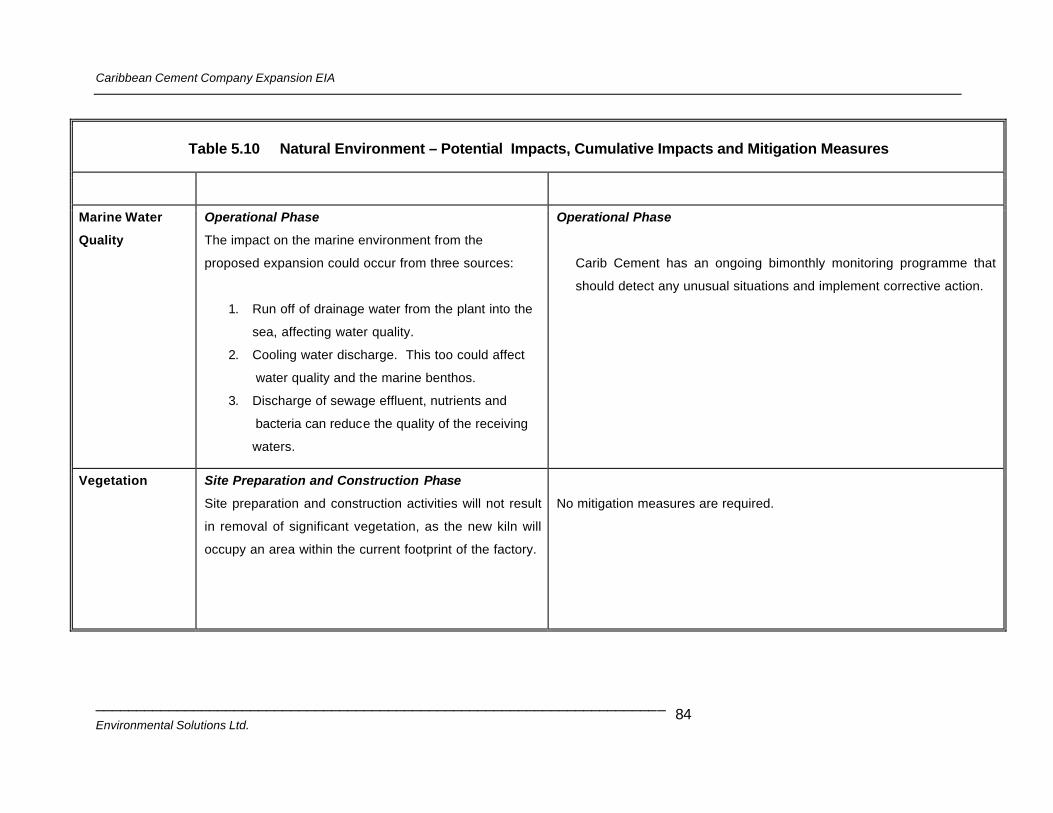
Caribbean Cement Company Expansion EIA
______________________________________________________________________ Environmental Solutions Ltd.
84
Table 5.10 Natural Environment – Potential Impacts, Cumulative Impacts and Mitigation Measures
Marine Water
Quality
Operational Phase
The impact on the marine environment from the
proposed expansion could occur from three sources:
1. Run off of drainage water from the plant into the
sea, affecting water quality.
2. Cooling water discharge. This too could affect
water quality and the marine benthos.
3. Discharge of sewage effluent, nutrients and
bacteria can reduce the quality of the receiving
waters.
Operational Phase
Carib Cement has an ongoing bimonthly monitoring programme that
should detect any unusual situations and implement corrective action.
Vegetation Site Preparation and Construction Phase
Site preparation and construction activities will not result
in removal of significant vegetation, as the new kiln will
occupy an area within the current footprint of the factory.
No mitigation measures are required.
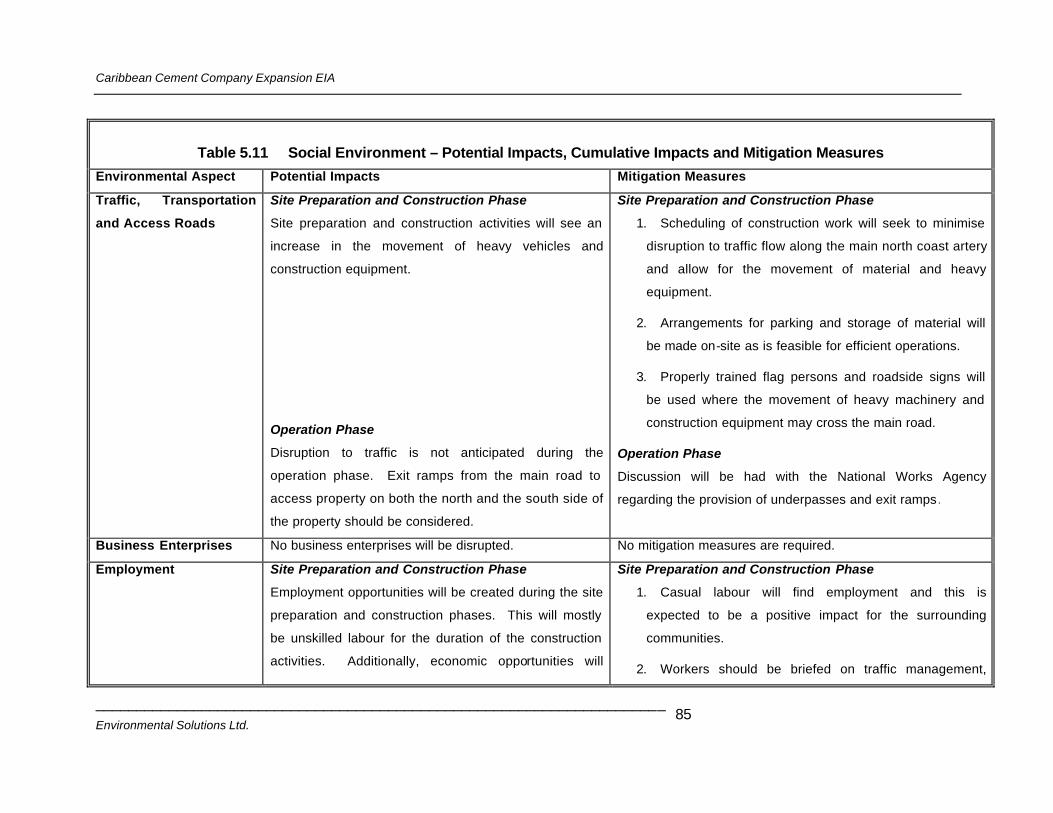
Caribbean Cement Company Expansion EIA
______________________________________________________________________ Environmental Solutions Ltd.
85
Table 5.11 Social Environment – Potential Impacts, Cumulative Impacts and Mitigation Measures
Environmental Aspect Potential Impacts Mitigation Measures
Traffic, Transportation
and Access Roads
Site Preparation and Construction Phase
Site preparation and construction activities will see an
increase in the movement of heavy vehicles and
construction equipment.
Operation Phase
Disruption to traffic is not anticipated during the
operation phase. Exit ramps from the main road to
access property on both the north and the south side of
the property should be considered.
Site Preparation and Construction Phase
1. Scheduling of construction work will seek to minimise
disruption to traffic flow along the main north coast artery
and allow for the movement of material and heavy
equipment.
2. Arrangements for parking and storage of material will
be made on-site as is feasible for efficient operations.
3. Properly trained flag persons and roadside signs will
be used where the movement of heavy machinery and
construction equipment may cross the main road.
Operation Phase
Discussion will be had with the National Works Agency
regarding the provision of underpasses and exit ramps.
Business Enterprises No business enterprises will be disrupted. No mitigation measures are required.
Employment
Site Preparation and Construction Phase
Employment opportunities will be created during the site
preparation and construction phases. This will mostly
be unskilled labour for the duration of the construction
activities. Additionally, economic opportunities will
Site Preparation and Construction Phase
1. Casual labour will find employment and this is
expected to be a positive impact for the surrounding
communities.
2. Workers should be briefed on traffic management,
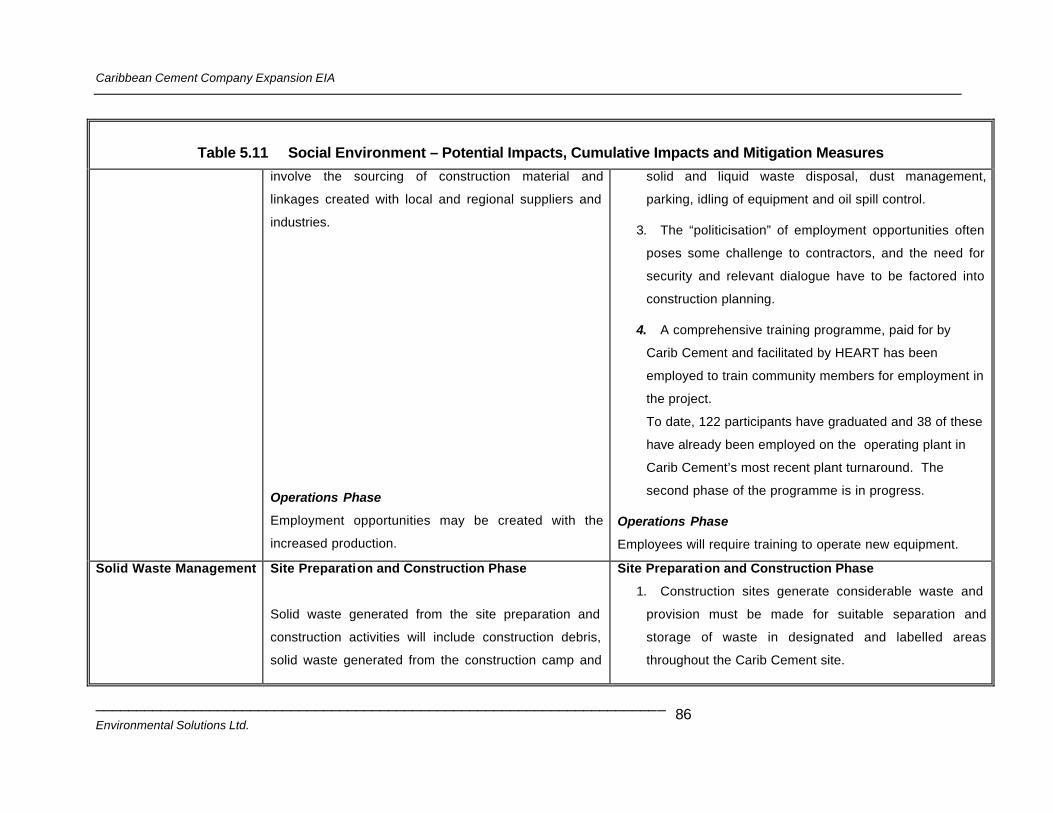
Caribbean Cement Company Expansion EIA
______________________________________________________________________ Environmental Solutions Ltd.
86
Table 5.11 Social Environment – Potential Impacts, Cumulative Impacts and Mitigation Measures
involve the sourcing of construction material and
linkages created with local and regional suppliers and
industries.
Operations Phase
Employment opportunities may be created with the
increased production.
solid and liquid waste disposal, dust management,
parking, idling of equipment and oil spill control.
3. The “politicisation” of employment opportunities often
poses some challenge to contractors, and the need for
security and relevant dialogue have to be factored into
construction planning.
4. A comprehensive training programme, paid for by
Carib Cement and facilitated by HEART has been
employed to train community members for employment in
the project.
To date, 122 participants have graduated and 38 of these
have already been employed on the operating plant in
Carib Cement’s most recent plant turnaround. The
second phase of the programme is in progress.
Operations Phase
Employees will require training to operate new equipment.
Solid Waste Management Site Preparation and Construction Phase
Solid waste generated from the site preparation and
construction activities will include construction debris,
solid waste generated from the construction camp and
Site Preparation and Construction Phase
1. Construction sites generate considerable waste and
provision must be made for suitable separation and
storage of waste in designated and labelled areas
throughout the Carib Cement site.
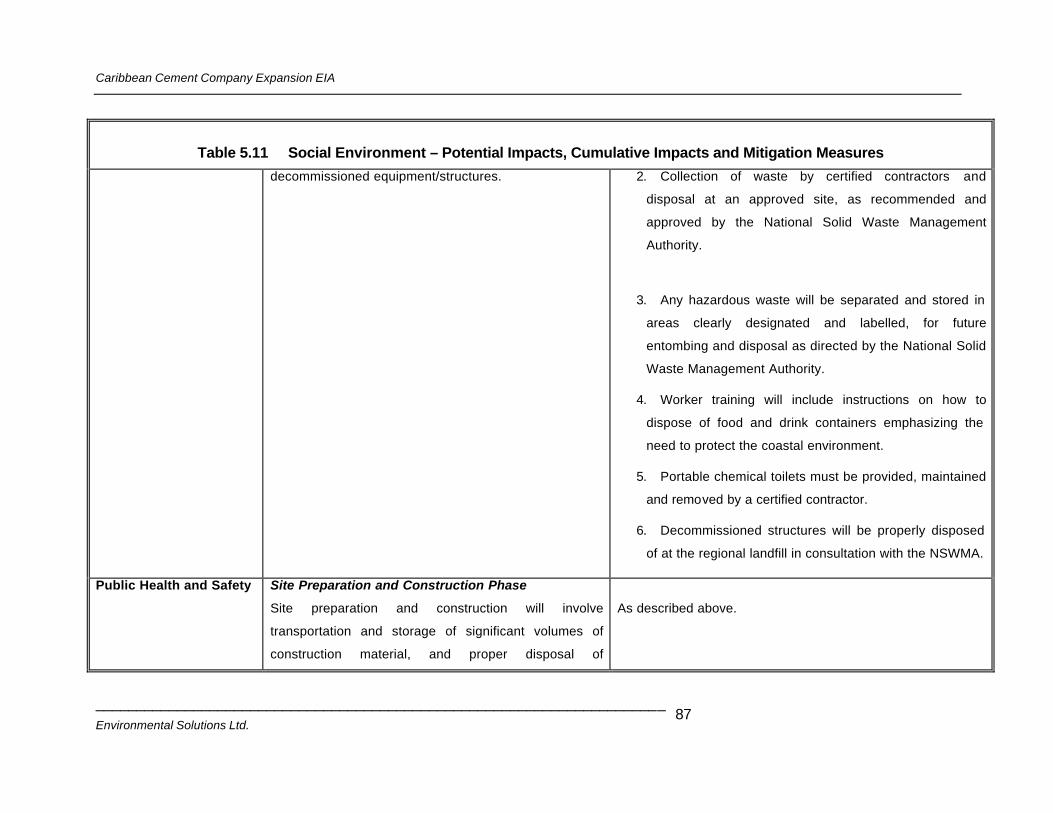
Caribbean Cement Company Expansion EIA
______________________________________________________________________ Environmental Solutions Ltd.
87
Table 5.11 Social Environment – Potential Impacts, Cumulative Impacts and Mitigation Measures
decommissioned equipment/structures.
2. Collection of waste by certified contractors and
disposal at an approved site, as recommended and
approved by the National Solid Waste Management
Authority.
3. Any hazardous waste will be separated and stored in
areas clearly designated and labelled, for future
entombing and disposal as directed by the National Solid
Waste Management Authority.
4. Worker training will include instructions on how to
dispose of food and drink containers emphasizing the
need to protect the coastal environment.
5. Portable chemical toilets must be provided, maintained
and removed by a certified contractor.
6. Decommissioned structures will be properly disposed
of at the regional landfill in consultation with the NSWMA.
Public Health and Safety Site Preparation and Construction Phase
Site preparation and construction will involve
transportation and storage of significant volumes of
construction material, and proper disposal of
As described above.
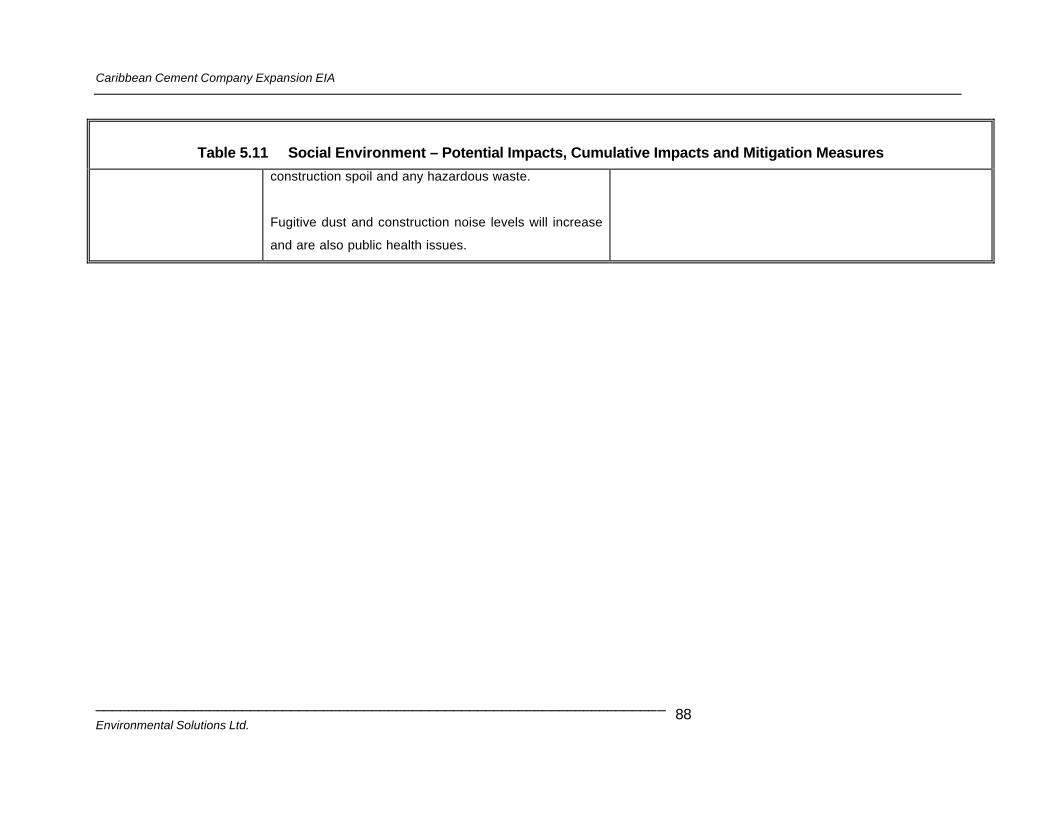
Caribbean Cement Company Expansion EIA
______________________________________________________________________ Environmental Solutions Ltd.
88
Table 5.11 Social Environment – Potential Impacts, Cumulative Impacts and Mitigation Measures
construction spoil and any hazardous waste.
Fugitive dust and construction noise levels will increase
and are also public health issues.
Caribbean Cement Company Expansion EIA
______________________________________________________________________ Environmental Solutions Ltd.
89
6.0 CONSIDERATION OF ALTERNATIVES
6.1 ALTERNATIVE SITE
Selection of an alternative site was not an option for Carib Cement as the project involved
improvement of process technology and production efficiency within the existing footprint. In
addition, siting of Carib Cement was informed initially by proximity to raw materials and shipping
access.
6.2 NO ACTION ALTERNATIVE
The proposed project seeks to improve energy efficiency and to implement pollution abatement
measures. The description of existing air quality (Section 4.2) and the air quality analysis (Air
Quality Assessment, Section 5.1 and Dispersion Model, Section 5.2) clearly demonstrated the
need for improved air quality within the sphere of influence of the Cement plant. The NRCA (Air
Quality) Regulations, the Public Health Act and the Clean Air Act (Section 3.2) require that
pollutants that compromise air quality be reduced or eliminated, and therefore “no action” is not a
desirable alternative.
6.3 CLOSURE OF CARIB CEMENT AND IMPORTATION OF CEMENT
The closure of Carib Cement’s operations is not a viable option, as the negative impacts will be
great. There will be a loss of employment, not only within the plant, but also in raw material
supply (quarries) and transport. Carib Cement is a significant contributor to GDP, both directly
and indirectly and also pays significant taxes to the Government of Jamaica.
There is a high demand for cement in Jamaica. Importation of cement to replace that
manufactured by Carib Cement will increase foreign exchange spending and increase trade
imbalances. Not only does cement manufacture reduce foreign exchange spending, it makes use
of mineral resources already existing in the country. Presently, thee are cement shortages in
over half of the states in the U.S.A. as well as the Middle East, Asia and Europe. This has lead
to cement prices doubling in many of these districts. A local cement industry is now seen as
strategic to national development in all of these territories.
Caribbean Cement Company Expansion EIA
______________________________________________________________________ Environmental Solutions Ltd.
90
7.0 DEVELOPMENT OF ENVIRONMENTAL MANAGEMENT AND MONITORING
PLAN
Once the permit is granted for the proposed project, and before site preparation and construction
activities begin, the project developers will submit an Environmental Management and Monitoring
Plan to NEPA, if requested by the agency. The aim of the Environmental Management and
Monitoring Plan is to ensure compliance with relevant legislation, implementation of the mitigation
measures and long-term minimization of negative environmental impacts.
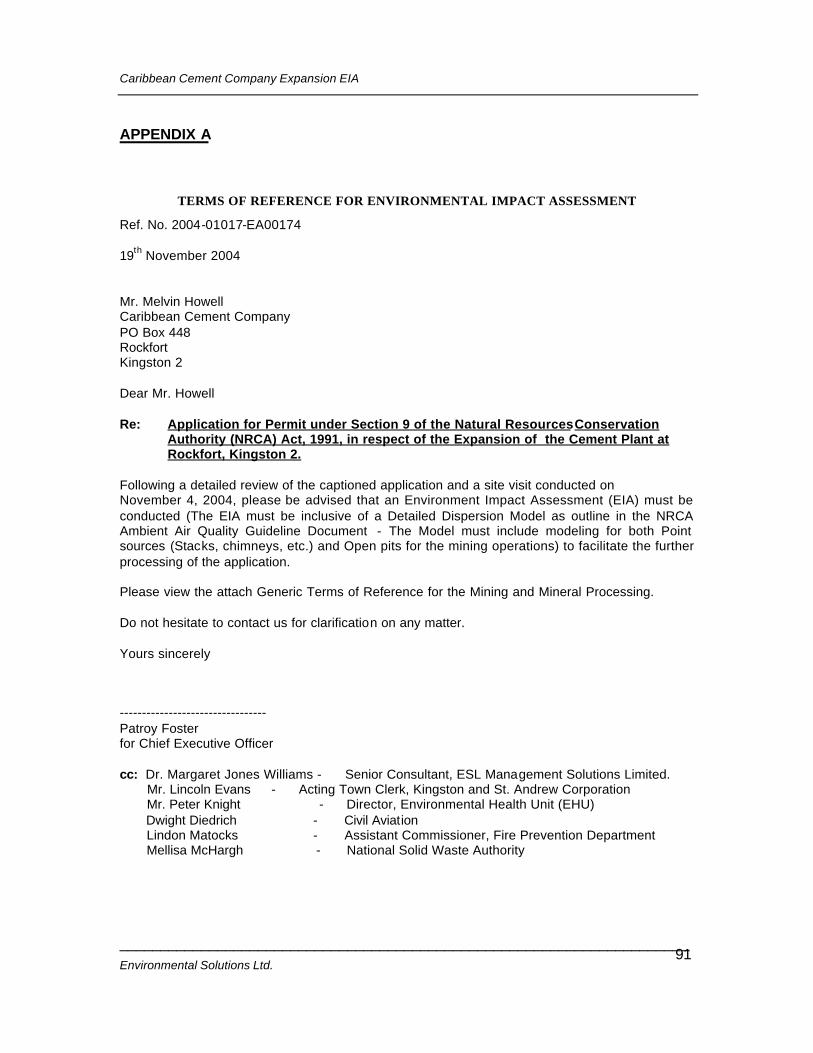
Caribbean Cement Company Expansion EIA
______________________________________________________________________ Environmental Solutions Ltd.
91
APPENDIX A
TERMS OF REFERENCE FOR ENVIRONMENTAL IMPACT ASSESSMENT Ref. No. 2004-01017-EA00174 19th November 2004 Mr. Melvin Howell Caribbean Cement Company PO Box 448 Rockfort Kingston 2 Dear Mr. Howell Re: Application for Permit under Section 9 of the Natural Resources Conservation
Authority (NRCA) Act, 1991, in respect of the Expansion of the Cement Plant at Rockfort, Kingston 2.
Following a detailed review of the captioned application and a site visit conducted on November 4, 2004, please be advised that an Environment Impact Assessment (EIA) must be conducted (The EIA must be inclusive of a Detailed Dispersion Model as outline in the NRCA Ambient Air Quality Guideline Document - The Model must include modeling for both Point sources (Stacks, chimneys, etc.) and Open pits for the mining operations) to facilitate the further processing of the application. Please view the attach Generic Terms of Reference for the Mining and Mineral Processing. Do not hesitate to contact us for clarification on any matter. Yours sincerely
--------------------------------- Patroy Foster for Chief Executive Officer cc: Dr. Margaret Jones Williams - Senior Consultant, ESL Management Solutions Limited. Mr. Lincoln Evans - Acting Town Clerk, Kingston and St. Andrew Corporation Mr. Peter Knight - Director, Environmental Health Unit (EHU) Dwight Diedrich - Civil Aviation Lindon Matocks - Assistant Commissioner, Fire Prevention Department Mellisa McHargh - National Solid Waste Authority

Caribbean Cement Company Expansion EIA
______________________________________________________________________ Environmental Solutions Ltd.
92
Caribbean Cement Company Expansion EIA
______________________________________________________________________ Environmental Solutions Ltd.
93
REFERENCES
Adams, C.D., 1972. Flowering Plants of Jamaica. University of the West Indies, Mona. Air Tox Environmental Company, 1997. Stack Test Report, prepared for Jamaica Private Power Company (JPPC). Davis and Associates, 1999. Ambient Air Quality Guideline Document, prepared for the National Resources Conservation Authority (NRCA) Downer A. and R. Sutton. 1990. Birds of Jamaica – A Photographic Field Guide. Cambridge University Press. Entech Engineering Inc, 2001. Emissions Tests Report, prepared for Jamaica Public Service. Environmental Solutions Ltd. 2001.Environmental Impact Assessment – Kingston Harbour Coast Road Project Phase 3. Grossman, D.H., S. Iremonger and D.M. Muchoney. 1991. Jamaica: A Rapid Ecological Assessment Phase 1. The Nature Conservancy. Jamaica Government (Survey Department) 1984. !:50,000 Map Series, Metric Edition, Sheet 18. Directorate of Overseas Surveys, UK. Plog, Barbara, 1988. Fundamentals of Industrial Hygiene. National Safety council, USA Smith Shirley, S. 2004. Chemistry of South Negril River Pollution Assessment Study. MPhil Thesis, University of the West Indies, Kingston, Jamaica