environmental impact assessment environmental...
TRANSCRIPT

Environmental Impact Assessment
&
Environmental Management Plan For
Sangrah Limestone Mine (*FINAL REPORT*)
Area – 8.05.55 Ha (Non Forest), Village – Sangrah, Tehsil - Renukaji at Sangrah,
District - Sirmour, State - Himachal Pradesh, India.
khasra nos. 2433/2363/1979/14/2 & other , Topo sheet No. 53 F/6,
Latitude 30º41’12.53” to 30º41’24.15” & Longitude 77º26’9.2” to 77º26’22.98”
Purpose: - Environment Clearance for Production of 81053 MT/Year of Limestone
July, 2014
Prepared by :-
WOLKEM CONSULTANCY SERVICES
(A Division Of Wolkem India LTD.)
Accredited BY QCI –NABET for Mining of mineral
(Open cast & Underground ) category “A” , Sr. in
the QCI/NABET list 168 as on 5th
May ,2014
NABL:- Wolkem India Limited, Certificate No T
2016, Issue date 06/06/2013 & Valid until
05/06/2015
E- 101, Madri Industrial Area, Udaipur,
Pin No. 313003 ,Rajasthan
Phone No. 294-6452067, FAX : 294-2491826
E-mail:- [email protected]
Mobile No. 09829100193
Lessee :
Shri Virender Kumar Walia
Village & Post – Dadahu, Tehsil –
Renukaji at Sangrah ,District Sirmour ,Pin
Code -173025, Himachal Pradesh
mail [email protected]
Phone No :- 01702-223995
Mobile No :- 9418023995

Environmental Impact Assessment & Environment Management Plan
For Sangrah Limestone Mine
Village- Sangrah, Tehsil – Renukaji, at Sangrah, Dist. Sirmour, Himachal Pradesh
INDEX
S.NO. DETAILS OF THE PROJECT PAGE NO
1 Action taken report on Terms of Reference i- ix
2 Executive Summary of project in English & Hindi language X-XIi
3 EIA/EMP Report 1-112
4 Questnnaire 113-147
5 Annexures
6 Plates

CONTENTS
S. No DESCRIPTION PAGE No.
1.0.0 CHAPTER – I - Introduction 1-5
1.1.0 Purpose of the project 1
1.2.0 Identification of project and project proponent 1
1.3.0 Profile of the project proponent and background 1
1.4.0 Brief description of the project 1-2
1.5.0 Importance to the country 2
1.6.0 Infrastructure facilities 2-3
1.7.0 Environment Impact Study 3
1.8.0 Objectives of Environmental Management Plan 3
1.9.0 Legal status of project 3-4
1.10.0 Steps for preparation of EIA/EMP 4-5
2.0.0 CHAPTER –II - Project Description 6-20
2.1.0 Type of project 6
2.2.0 Need of the project / use of the mineral 6
2.3.0 Location 6
2.4.0 Topography & Drainage pattern 6
2.5.0 Geology 7-8
2.6.0 Exploration 8
2.7.0 Method of estimation of reserves 8-9
2.8.0 The grade-wise reserves of limestone 9-10
2.9.0 Mineral Beneficiation 10
2.10.0 Mining 10-13
2.11.0 Drilling & Blasting 13-14
2.12.0 Conceptual Mining Plan 14-15
2.13.0 Land use 15-16
2.14.0 Reclamation 16-17
2.15.0 Stacking of Mineral Rejects and Disposal of Waste 17-18
2.16.0 Extent of mechanization 19
2.17.0 Utilities & proposed site facilities 19-20
3.0.0 CHAPTER – III - Description of the Environment 21-59
3.1.0 Introduction 21
3.2.0 Methodology 21
3.3.0 Study area at a glance 21-23
3.4.0 Topography & Drainage 23
3.5.0 Meteorology 23-24
3.6.0 Ambient Air Quality 25-27
3.7.0 Noise Environment 27-39
3.8.0 Water Environment 39-42
3.9.0 Land Environment 43-44
3.10.0 Soil Environment 44-45
3.11.0 Biological Environment 45-51
3.12.0 Socio Economic Environment in core zone & buffer zone 51-59
4.0.0 Chapter-IV - Anticipated Environment Impacts and Mitigation Measures 60-84
4.1.0 Introduction 60

4.2.0 Air Environment 60-65
4.3.0 Noise & Vibration 65-69
4.4.0 Water Environment 69-71
4.5.0 Land Environment 71-74
4.6.0 Solid Waste Management 74
4.7.0 Afforestation programme 75-76
4.8.0 Biological Environment 76
4.9.0 Socio-Economic status 76-77
4.10.0 Disaster Management Plan 77-78
4.11.0 Environmental Risks 78
4.12.0 Occupational risks and arrangements proposed 78-80
4.13.0 Impact on health 80
4.14.0 Safety 80
4.15.0 Environmental Impact Matrix 81-84
5.0.0 CHAPTER –V - Analysis Of Alternatives (Technology & Site) 85-86
5.1.0 Analysis of alternatives (Technology & Site) 85-86
6.0.0 CHAPTER – VI - Environmental Monitoring Programme 87-88
6.1.0 Monitoring schedule and parameters 87
6.2.0 Health Environmental & Environmental monitoring schedule 87-88
6.3.0 Equipments for Environment restoration plan 88
6.4.0 Data Analysis & Reporting Schedule 88
6.5.0 Organization 88
7.0.0 CHAPTER – VII - Additional Studies 89-101
7.1.0 Public consultation 89-94
7.2.0 Social impact assessment and R & R action plans 94
7.3.0 Risk assessment and safety management plan 94-101
8 .0.0 CHAPTER – VIII - Project Benefits 102-103
8.1.0 Improvement in physical infrastructure 102
8.2.0 Improvement in social infrastructure 102
8.3.0 Employment potential 102-103
8.4.0 Salary structure 103
8.5.0 Other tangible benefits 103
9.0.0 CHAPTER –IX - Environmental Cost Benefit Analysis 104-106
9.1.0 Financial provisions 104
9.2.0 Funds for flora and fauna management 104
9.3.0 Environment cost 105
9.4.0 Expenditure incurred on village development programme 105-106
9.5.0 Budget for future village development programme 106
9.6.0 Marketing 106
9.7.0 Economic viability 106
10.0.0 CHAPTER – X - Environment Management Plan 107-108
10.1.0 Introduction 107
10.2.0 Monitoring and feedback system 107
10.3.0 Organizational structure 107
10.4.0 EMP 108
10.5.0 scope and responsibility of the environmental department 108

10.6.0 Environment Management Policy 108
11.0.0 CHAPTER – XI- Summary And Conclusion 109-110
11.1.0 Summary 109-110
11.2.0 Conclusion 110
12.0.0 CHAPTER – XII- Disclosure of the consultant engaged 111-112
12.1.0 Disclosure of the consultant engaged 111-112
-------------
LIST OF TABLES
Table No. Particular Page No.
1.1 Mining lease coordinates 1-2
1.2 Year wise production details since 1994 2
2.1 The existing land use pattern 6
2.2 Tectono – Stratigraphic domains of Lesser Himalayan Tectogen 7
2.3 Estimation of Proved, Probable & Possible Reserves 8
2.4 Reserves and Resources of limestone 9
2.5 Grade wise distribution of mineral reserves 10
2.6 Chemical analysis of Dolomite limestone 10
2.7 Production & development for first 5 years 13
2.8 Proposed Drilling and Blasting Design 14
2.9 Computation of year wise production, waste & stripping ratio 15
2.10 Land use pattern 16
2.11 Afforestation in the mining lease area during life of the mine 16-17
2.12 Afforestation on adjacent land purchased / proposed 17
2.13 Generation of top soil and over-burden waste for 5 years 17-18
2.14 Stacking of Top Soil and Waste Dump in External Dumps 18
2.15 Extent of mechanization 19
2.16 Specifications of machineries used and proposed to be used 19
2.17 Peak Water Requirement 19
2.18 List of manpower 20
3.1 Study area at a glance 21-23
3.2 Ambient Air Quality Monitoring Station 25
3.3 Noise monitoring station 27
3.4.1-9 Results of Noise level 29-37
3.5 Ambient Noise Level 38
3.6 Ambient Noise Quality Standard 38
3.7 Details of traffic density 39
3.8 Description of Ground Water Sampling Locations 40-41
3.9 Description of Surface Water Sampling Locations 41
3.10 Surface water flow pattern 42
3.11 Land use of Study Area 43
3.12 Land Use Pattern (Lease Area) 43-44
3.13 Soil Monitoring Stations 44
3.14 Reserve forests & sanctuary 45
3.15 List of flora in core Zone 46
3.16 List of flora in buffer zone 46-48
3.17 List of crops & vegetables 48

3.18 List of fauna 49-51
3.19 The distribution of population in study area 56
3.20 Distribution of population by social structure 56
3.21 Distribution of literate and literacy rates 57
3.22 The occupational structure of the study area 57
3.23 Educational facilities in the study areas 58
3.24 Health Facilities 58
3.25 Details of human settlement and population in the Tehsils 59
3.26 Distribution of male and female and literacy in Tehsils 59
3.27 Live stock population 59
4.1 Emission Factor Suspended Particulate Matter (≤30µm) 61
4.2 Area Source Dimensions 62
4.3 Predicted 24hourly Concentration of PM (≤30µm) at AAQM 63
4.4 Showing Noise level of mine after prediction effect 65-66
4.5 Activity Linked Noise 66
4.6 Permissible Exposure Noise Limits as per CPCB norms 68
4.7 Land use 71-72
4.8 Land use pattern pre mining, mining operations 72
4.9 Land utilized at the end of 5th
year 72
4.10 Post Mining land use of core zone with environment management 73
4.11 Afforestation in the mining lease area during life of the mine 75
4.12 Afforestation on adjacent land purchased / proposed 75
4.13 Environmental risk & mitigative measures 78
4.14 Occupational risks and arrangements 78-80
4.15 Impacts on Health 80
4.16 Environmental parameters, possible impacts & anticipated nature of impact 81-82
4.17 The Parameter weight age with or without control measures 83
4.18 Environmental Impact Matrix without Control Measures 84
4.19 Environmental Impact Matrix with Control Measures 84
5.1 Process flow sheet 85-86
6.1 Monitoring schedule and parameters 87
7.1 INITIAL HAZARD IDENTIFICATION, RISK, ASSESSMENT AND PRIORITIZATION 96
7.2 IDENTIFYING MECHANISMS CONTRIBUTING PRINCIPAL HAZARDS AND RANKING 96-97
7.3 CONTROL MEASURES & PROCEDURES FOR RESPECTIVE MECHANISMS CONTRIBUTING HAZARDS 97-101
8.1 Employment Potential 102-103
9.1 Funds for flora and fauna management plan 104
9.2 Environment Cost 105
9.3 Expenses from year 1998-2011 105-106
9.4 Budget for future village development programme 106
12.1 Disclosure of consultants engaged 111-112
--------------
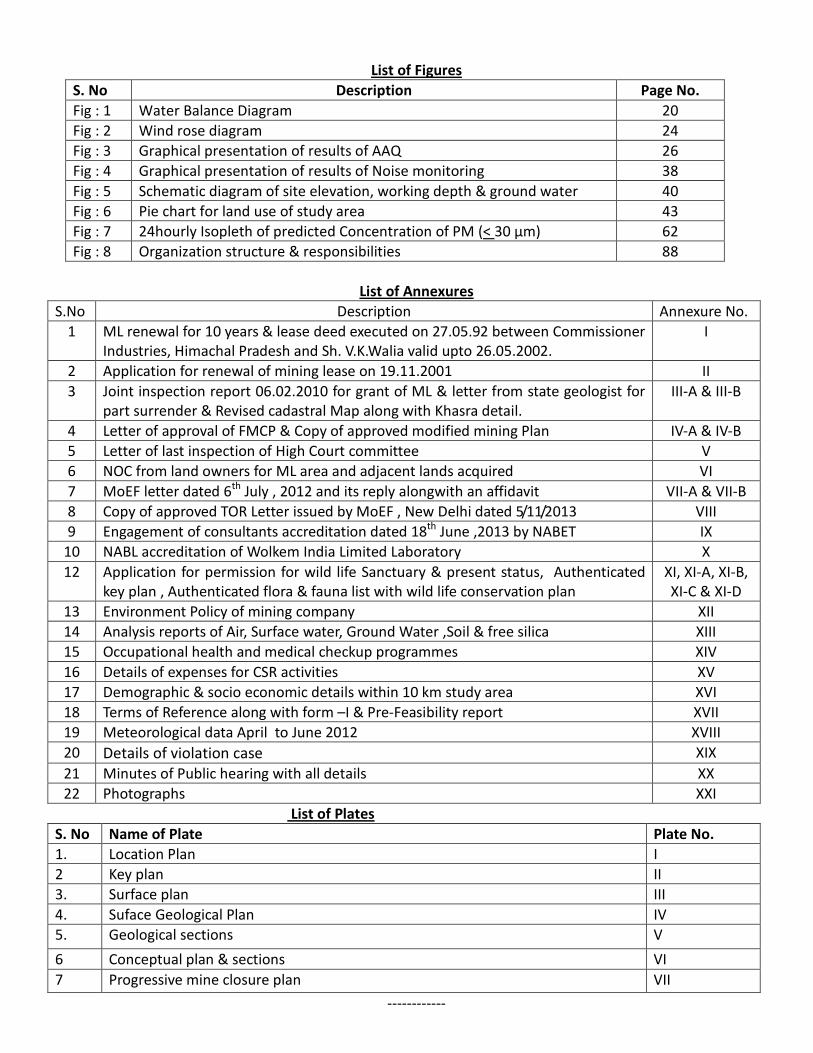
List of Figures
S. No Description Page No.
Fig : 1 Water Balance Diagram 20
Fig : 2 Wind rose diagram 24
Fig : 3 Graphical presentation of results of AAQ 26
Fig : 4 Graphical presentation of results of Noise monitoring 38
Fig : 5 Schematic diagram of site elevation, working depth & ground water 40
Fig : 6 Pie chart for land use of study area 43
Fig : 7 24hourly Isopleth of predicted Concentration of PM (< 30 µm) 62
Fig : 8 Organization structure & responsibilities 88
List of Annexures
S.No Description Annexure No.
1 ML renewal for 10 years & lease deed executed on 27.05.92 between Commissioner
Industries, Himachal Pradesh and Sh. V.K.Walia valid upto 26.05.2002.
I
2 Application for renewal of mining lease on 19.11.2001 II
3 Joint inspection report 06.02.2010 for grant of ML & letter from state geologist for
part surrender & Revised cadastral Map along with Khasra detail.
III-A & III-B
4 Letter of approval of FMCP & Copy of approved modified mining Plan IV-A & IV-B
5 Letter of last inspection of High Court committee V
6 NOC from land owners for ML area and adjacent lands acquired VI
7 MoEF letter dated 6th
July , 2012 and its reply alongwith an affidavit VII-A & VII-B
8 Copy of approved TOR Letter issued by MoEF , New Delhi dated 5/11/2013 VIII
9 Engagement of consultants accreditation dated 18th
June ,2013 by NABET IX
10 NABL accreditation of Wolkem India Limited Laboratory X
12 Application for permission for wild life Sanctuary & present status, Authenticated
key plan , Authenticated flora & fauna list with wild life conservation plan
XI, XI-A, XI-B,
XI-C & XI-D
13 Environment Policy of mining company XII
14 Analysis reports of Air, Surface water, Ground Water ,Soil & free silica XIII
15 Occupational health and medical checkup programmes XIV
16 Details of expenses for CSR activities XV
17 Demographic & socio economic details within 10 km study area XVI
18 Terms of Reference along with form –I & Pre-Feasibility report XVII
19 Meteorological data April to June 2012 XVIII
20 Details of violation case XIX
21 Minutes of Public hearing with all details XX
22 Photographs XXI
List of Plates
S. No Name of Plate Plate No.
1. Location Plan I
2 Key plan II
3. Surface plan III
4. Suface Geological Plan IV
5. Geological sections V
6 Conceptual plan & sections VI
7 Progressive mine closure plan VII
------------
WCS : EIA/EMP
1
1.0.0 CHAPTER - I
INTRODUCTION
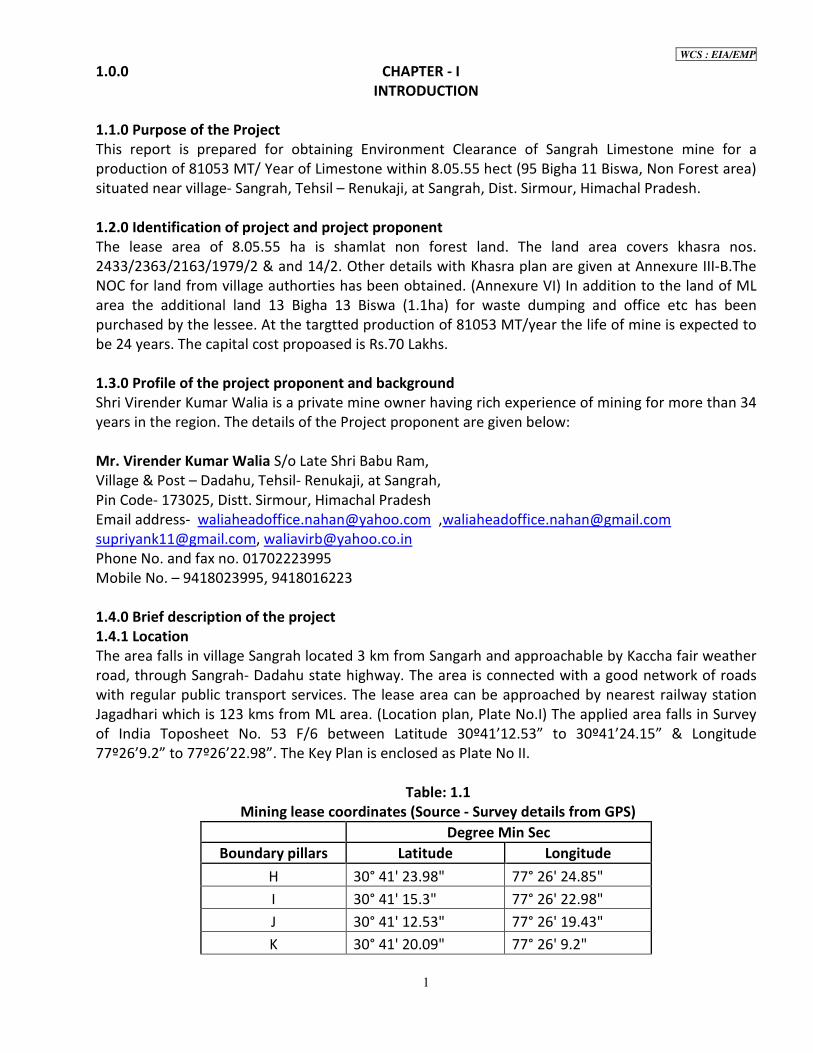
1.1.0 Purpose of the Project
This report is prepared for obtaining Environment Clearance of Sangrah Limestone mine for a
production of 81053 MT/ Year of Limestone within 8.05.55 hect (95 Bigha 11 Biswa, Non Forest area)
situated near village- Sangrah, Tehsil – Renukaji, at Sangrah, Dist. Sirmour, Himachal Pradesh.
1.2.0 Identification of project and project proponent
The lease area of 8.05.55 ha is shamlat non forest land. The land area covers khasra nos.
2433/2363/2163/1979/2 & and 14/2. Other details with Khasra plan are given at Annexure III-B.The
NOC for land from village authorties has been obtained. (Annexure VI) In addition to the land of ML
area the additional land 13 Bigha 13 Biswa (1.1ha) for waste dumping and office etc has been
purchased by the lessee. At the targtted production of 81053 MT/year the life of mine is expected to
be 24 years. The capital cost propoased is Rs.70 Lakhs.
1.3.0 Profile of the project proponent and background
Shri Virender Kumar Walia is a private mine owner having rich experience of mining for more than 34
years in the region. The details of the Project proponent are given below:
Mr. Virender Kumar Walia S/o Late Shri Babu Ram,
Village & Post – Dadahu, Tehsil- Renukaji, at Sangrah,
Pin Code- 173025, Distt. Sirmour, Himachal Pradesh
Email address- [email protected] ,[email protected]
[email protected], [email protected]
Phone No. and fax no. 01702223995
Mobile No. – 9418023995, 9418016223
1.4.0 Brief description of the project
1.4.1 Location
The area falls in village Sangrah located 3 km from Sangarh and approachable by Kaccha fair weather
road, through Sangrah- Dadahu state highway. The area is connected with a good network of roads
with regular public transport services. The lease area can be approached by nearest railway station
Jagadhari which is 123 kms from ML area. (Location plan, Plate No.I) The applied area falls in Survey
of India Toposheet No. 53 F/6 between Latitude 30º41’12.53” to 30º41’24.15” & Longitude
77º26’9.2” to 77º26’22.98”. The Key Plan is enclosed as Plate No II.
Table: 1.1
Mining lease coordinates (Source - Survey details from GPS)
Degree Min Sec
Boundary pillars Latitude Longitude
H 30° 41' 23.98" 77° 26' 24.85"
I 30° 41' 15.3" 77° 26' 22.98"
J 30° 41' 12.53" 77° 26' 19.43"
K 30° 41' 20.09" 77° 26' 9.2"

WCS : EIA/EMP
2
L 30° 41' 24.15" 77° 26' 16.12"
M 30° 41' 22.84" 77° 26' 16.5"
N 30° 41' 23.77" 77° 26' 19.24"
O 30° 41' 22.18" 77° 26' 18.1"
P 30° 41' 23.09" 77° 26' 20.58"
Q 30° 41' 20.98" 77° 26' 19.14"
R 30° 41' 21.44" 77° 26' 21.48"
The application for renewal is pending for a lease period of 20 years (27.05.2002 to 26.05.2022) with
State Government. (Annexure-II) Modified mining Plan for M.L area 8.05.55 ha was approved by IBM
vide order no. 614(2) FMCP-9/11-DDN dated 05.07.2012. (Annexure IV-A)
1.4.2 Past performance of mine
Year wise production details since 1994 are given below in 1.2.
Table: 1.2- Year-wise production
S.No. Year Production in Tonnes
1 1994-1995 20435.000
2 1995-1996 48430.000
3 1996-1997 34687.000
4 1997-1998 35921.000
5 1998-1999 41361.000
6 1999-2000 63342.600
7 2000-2001 48216.000
8 2001-2002 36037.000
9 2002-2003 22410.500
10 2003-2004 34072.000
11 2004-2005 26832.000
12 2005-2006 34116.000
13 2006-2007 38004.000
14 2007-2008 33396.000
15 2008-2009 24606.000
16 2009-2010 23390.000
17 2010-2011 4065.500
18 2011-2012 10752.000
19 2012-2013 Nil
1.5.0 Importance to the country
It is a site specific mining project and good quality limestone is occurring in this area. The most
important and common use of limestone is in the manufacture of cements. Limestone, either directly
or on calcinations of lime also finds extensive use in metallurgical, chemical, sugar, glass, textiles and
other industries. The area being remote, the population living in the surrounding would find a source
of livelihood.
1.6.0 Infrastructure Facilities

WCS : EIA/EMP
3
1.6.1 Road:- The area is about 3 km by road away from Sangarh. The area is approached by Tar road
from Nahan – Dadahu (Renukaji) - Sangarh route.
1.6.2 Water:- No water supply system exists in the area. Drinking water and water for other purpose
is brought from water spring outside lease area. Drinking water is stored in clean covered earthen
pots and kept near working faces.
1.6.3 Electricity:- The surrounding villages are electrified. The mine is being worked in one shift (i.e.
general shift) only, so lighting arrangement is at present made. In care working schedule undergoes a
change, necessary lighting arranagments would be made.
1.6.4 Education
(i) Primary and Junior High school is at village Sangrah which is about 3 km from ML area.
(ii) High school and Intermediate Colleges are at village Sangrah which are about 1km crow fly and 3
km by road respectively from the ML area.
(iii) Higher Education is available at Sangrah, which is about 3 km by Pacca Road.
1.6.5 Medical:- Government dispensary is at Sangrah which is about 3 km from ML area.
1.6.6 Post and telegram: - Nearest Post Office with Telephone facility is in village Sangrah which is 3
kms from the lease area.
1.6.7 Rail head: - The nearest Railway station is Jagadhri at a distance of 125 km. on Saharanpur-
Ambala broad gauge line.
1.6.8 Airport: - The nearest airport is at Dehradoon which is about 150 Km from mine.
1.7.0 Environment Impact Study
Wolkem Consultancy Services, A Division of Wolkem India Limited, Udaipur, Rajasthan was assigned
the job of EIA and preparation of EMP. The study was conducted within 10 km radius from the mine.
The application of Terms of Reference was submitted to MoEF vide letter dated 22/2/2012 in the
prescribed format (Form-1 with project feasibility report) for scoping and prescribing Terms of
Reference (ToR) so that detailed EIA study for obtaining environment clearance could be under
taken.(Annexure XVII) As the mine continued production of limestone, MoEF grouped this project
under violation case. After needful was done by the project proponent, MoEF released ToR vide letter
No. J-11015 /83/2012-IA.II (M) dated 5th
November 2013. (Annexure VIII)
1.8.0 Objectives of Environmental Management Plan
The main objectives are listed below:
� To describe and assess the prevailing baseline environmental and socio-economic condition of the
study area through baseline studies and secondary data collection.
� To describe methodology of mining including equipment based on IBM approved mining plan.
� To determine impacts of the project on the environment, ecology, workers and community.
� To determine mitigation measures for the impacts identified.
� For mitigation of impact, recommend an Environmental Management Plan (EMP) with action
plans and budget.
1.9.0 Legal status of project
1.9.1 The proposal is for renewal of mine lease which fell due in May, 2002 for
production of 81,053 TPA of limestone. It is a violation case as the mine has been operating
after the ML fell due for renewal without obtaining requisite environmental clearance. The
mine is reported to be closed since January, 2012. Mine lease area is 8.0555 ha. No forestland is
involved in the project, however, Renuka Tiger Sanctuary is at a distance of about 8.5 km
from the mine lease.(Annexure XI-B) Mine working will be opencast mechanized involving

WCS : EIA/EMP
4
drilling and blasting. It was stated by the proponent that the earlier ToRs were obtained on
31.10.2008, however, due to various changes undergone in the project, a fresh ToRs is sought.
1.9.2 Violation case:- It is a violation case as the mine has been operating after the ML fell due for
renewal and enhanced production without obtaining requisite prior environmental clearance. The
mine is reported to be closed since January, 20I2. Since it is a violation case , Ministry of Environment
& Forest vide letter no J-11015/83/2012-IA-II (M) dated 6 July 2012 has advised project proponent to
submit Environment related policy along with a written commitment in the form of a formal
resolution to ensure that in future Environment protection act will not be violeted. (Annexure No VII
A)Accordingly a resolution along with affidavit was submiited to MoEF on dated 18.08.2012. Further
SPCB, HP vide letter no 2050-53 dated 22.12.2012 has issued show cause notice. In view of the action
taken by project proponent.(AnnexureVII-B)ToR was approved by MoEF vide letter No. J-
11015/86/2012-IA.II(M) dated 5th
Novmember 2013.
Further Himachal Pradesh Pollution Control Board filed the prosecution report in the Court of Chief
Judicial Magistrate, Sirmaur, Himachal Pradesh on 02.07.2013 vide Case No. 26/3 of 2013 to take
cognizance of offence by the said court under section 15 of Environment (Protection) Act, which has
been committed by the offending project and the affidavit dated 09.009.2013 stating that such
violations of Environment (protection) Act, 1986 will not be repeated in the future has been
submitted and the same have been taken on record.The above case is since been disposed &
punishment awarded by the Court of L.D Chief Judicial Magistrate, Sirmaur, Himachal Pradesh for
compliances dated 16/5/2014. (A Copy enclosed as annexure No XIX)
1.9.4 Renuka Ji Wildlife Sanctuary :- The RenukaJi Wild Life Sanctuary falls within 10 Km Zone from
M.L area ,The matter was taken with the principal Chief Conservator of Forests ,(Wild Life) –Cum-
CWLW ,Himachal Pradesh ,Shimla who gave the following observations vide letter dated 30th
April
,2011.
“As per field report ,the proposed site of the limestone mine area do not fall within jurisdiction of
RenukaJi wild life Sanctuary .However ,it is reported that aerial distance of the proposed limestone
mine area from RenukaJi Wildlife Sanctuary is 8.5 Km and 24 Kms from road .It is further reported
that as per field report ,there is no habitat of wild animals in the vicinity of this limestone mine and
moreover the mine site is located at a considerable distance from Lion safari & wild life sanctuary .”
These recommendations were resubmitted along with the revised format of Government of India
,Ministry of Environment & Forest (Wild life Division), Circular No .F 6-10/2011WI dated 15/3/2011 by
Project proponent to DCF , RenukaJi Forest Division (Wild Life)District Sirmour, Himachal Pradesh who
in turn forward it to Chief Wildlife Warden ,Shimla ,Himachal Pradesh Vide letter No 1540-41 dated
30th
July,2012 for using required Clearance .The proposal was accepted and approved by the SBWL
for recommendation to the National Wild Life Board ,Government of India dated 20th
January ,2014
(Annexure XI)
1.10.0 Preparation of EIA/EMP
The project proponent has taken action for preparation of EIA/EMP.
1. Applied for TOR on dated 21.02.2008 which was approved vide letter no J-11015/99/2008 –IA.II
(M) on dated 31.10.2008 by MoEF, New Delhi.

WCS : EIA/EMP
5
2. Since the lease area falls within 10 km aerial distance form Renuka Wild Life Sanctuary permission
from Principal Chief Conservator of forest was sought vide letter dated 27.7.2009.
3. While the Principal Chief Conservator of forest has concurred vide letter no WL (Misc.) -
73/Mining/Vol.V/784 dated 29/4/2011. Instructions were given vide circular F.No. 6-10/2011 WL
dt. 15.03.2011 for seeking permission from National Board for Wildlife. Which was complied vide
application.(Annexure XI-A)
4. Joint committee visited the area on 06/02/2010 and decided to reduce mining lease area of
9.12.62 hects (108 Bigha 5 Biswa) to 8.05.55 hects (95 Bigha 11 Biswa) and advised to surrender
1.07.07 hect (12 Bigha 14 Biswa) because of standing plantation .Thus the present mining lease
area is reduced to 8.05.55 hect.
5. The state government advised to surrender 1.07.07 (12 Bigha 14 Biswa) and to submit final mine
closure plan and modified mining plan for retained area of 8.05.55 hects ( 95 Bigha 11 Biswa) vide
letter no.Udhyog-Bhu(Khani-4) major-56/2001-475 dated 11.4.2012
6. Final Mine closure Plan for 1.07.07 hects (12 bigha 14 biswa) was approved by COM north zone
vide letter no. 614(2)/FMCP-9/11-DDN dated 5/07/2012.
7. Modified mining Plan was approved with PMCP for the revised area by IBM on 07.09.2012.
8. Notwithstanding change in the M.L area from 9.12.62 hect to 8.05.55 hect, Application for revised
ToR was submitted on dated 20th
Feb.2012. MoEF vide letter dated 6th
July,2012 advised to submit
an affidavit for violation as per office memorandum no. J- 11013/41/2006- IA.II (I) dated 16th
Nov.
2010 which was complied with on 18.08.2012.
9. In the 27th
meeting of the Expert Appraisal Committee for Environmental Appraisal of Mining
Projects of the Ministry of Environment and Forests held on May 23-25, 2012 at MoEF the
committee gave the violation. The draft ToR was uploaded on MoEF website hence pending receipt
of final ToR was undertaken. Baseline study was undertaken from April 2012 to June 2012.
10. After compling with violations conditions by project proponent MoEF released ToR vide letter No
J-11015 /86/2012-IA. II (M) dated 5th
Novmember 2013.
11. After taking necessary action on ToR the present EIA/EMP was prepared for submission to HSPCB
for arranging publich consulatation.
12. Submission of application for public hearing through lesee with Draft EIA /EMP & Executive
summary (English& Hindi), copies to MOEF New Delhi, with necessary fee Rs. 5000/-.
13. As per notification of MoEF, New Delhi dated 14/09/2006 & notice was published for
Environment Clerance in two news papers (Amar Ujala & Daily post India) on dated 14th
February,2014 by Himachal Pradesh Pollution Control Board fixed public hearing on 22/03/2014.
14. Public hearing presentation was made on 22/03/2014 at 11.00 A.M near Village Borli, Tehsil
Sangrah, District Sirmour, Himachal Pradesh.
15. The authentic minutes of Public hearing from The Member Secreatary, Himachal Pradesh
Pollution Control Board, Shimla dated 5th
July, 2014 were received by the lessee on 14th
July, 2014
& details are enclosed as Annexure No XX.
16. The final EIA /EMP as per approved TOR is prepared including detailed study of mining
technology, waste dump management and back filling practices, flora & fauna management plan,
wild life conservation plan, hydro-geological study, socio economic study of agriculture workers,
reclamation practices based on TOR and public hearing issues with the questionnaire for mining
projects.
---------

WCS : EIA/EMP
6
2.0.0 CHAPTER – II
PROJECT DESCRIPTION
2.1.0 Type of Project
This is a mining project to produce mineral Limestone @ 81053 TPA by open cast mechanized mining
method. Revised MP/PMCP to match with the UNFC reserves and increased production target
was approved by IBM vide letter no 614 (2)/MP-B-284/08-DDN, dated 07.09.2012.(Annexure No IV.B)
It is to be highlighted that the current mining plan was prepared during 2011-12 and approved by
IBM on dated 07.09.2012. The year wise projections of five year period (2012-17) was done for
production of mineral ,waste ,reclamation and all other inputs & out-puts. As EC was not available, no
physical activity commenced .Hence as and when mining commences the first year projection would
be same as that of planned 2012-13 period and subsequent period would be accordingly shifted.
2.1.1 Land use
Table: 2.1 - The Existing Land use pattern
Type of land use Area
(Hect)
Ownership/
Occupancy
Village, Tehsil, District State
Non Forest
Shamlati land (Ghasni)
95 Bigha & 11 Biswa.
(Nakabil Charand)
8.05.55
Samlatpatti
2433/2363/2163/1
979/2 & and 14/2
Village: Sangrah
Tehsil : Renuka ji at Sangrah,Distt. :
Sirmour ,State : Himachal Pradesh .
Total 8.05.55
2.2.0 Need for the project / use of the mineral
This is a project which produces important raw material for cement plant, iron industry, paper
industry, sugar mills, limekiln and chemical industries. The project would improve the living standards
of the inhabitants in the surrounding area as there is a paucity of industries.
2.3.0 Location
The area falls in village Sangrah which is about 3 km from Sangarh, approachable by Kaccha fair
weather road on Sangrah- Dadahu state highway. The area is connected with a good network of
roads with regular public transport services.
2.4.0 Topography & Drainage
2.4.1 The ML area is a part of hilly terrain of Himachal Pradesh covered with steep hills of shiwalik
range.The general slope of the area is towards East to North West steeply sloping from 250 to 40
0.
The topography of the area is rough and rugged. The highest altitude recorded within the area is
1914 mRL near southeast corner of the ML near pillar “D” and the lowest contour is 1700 mRL near
pillar “K” at North West corner of ML. The area is drained by the seasonal water flowing from top of
the hill down the slope towards north west and joins on western side Garag Ka Khalla and further
flows Palor Ka Khalla at a distance of 4km which further flows down to Giri river flowing at about 6.5
km distance.
WCS : EIA/EMP
7
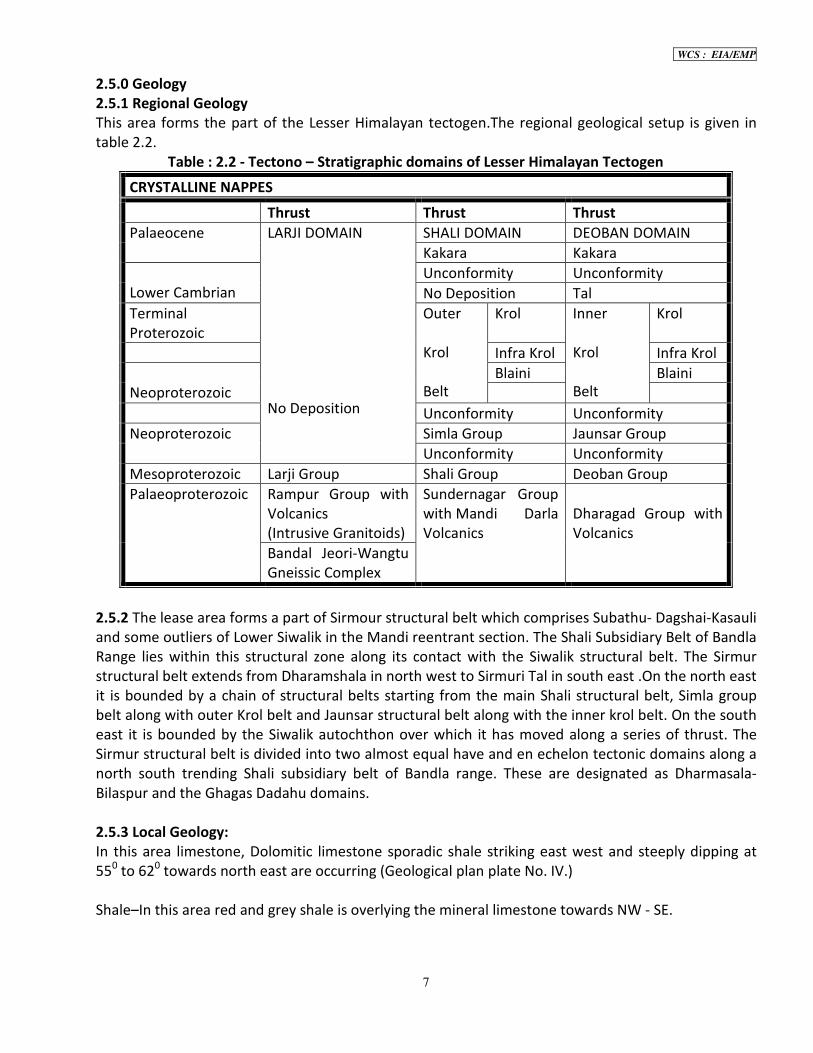
2.5.0 Geology
2.5.1 Regional Geology
This area forms the part of the Lesser Himalayan tectogen.The regional geological setup is given in
table 2.2.
Table : 2.2 - Tectono – Stratigraphic domains of Lesser Himalayan Tectogen
CRYSTALLINE NAPPES
Thrust Thrust Thrust
Palaeocene LARJI DOMAIN
No Deposition
SHALI DOMAIN DEOBAN DOMAIN
Kakara Kakara
Lower Cambrian
Unconformity Unconformity
No Deposition Tal
Terminal
Proterozoic
Outer
Krol
Belt
Krol Inner
Krol
Belt
Krol
Infra Krol Infra Krol
Neoproterozoic
Blaini Blaini
Unconformity Unconformity
Neoproterozoic Simla Group Jaunsar Group
Unconformity Unconformity
Mesoproterozoic Larji Group Shali Group Deoban Group
Palaeoproterozoic Rampur Group with
Volcanics
(Intrusive Granitoids)
Sundernagar Group
with Mandi Darla
Volcanics
Dharagad Group with
Volcanics
Bandal Jeori-Wangtu
Gneissic Complex
2.5.2 The lease area forms a part of Sirmour structural belt which comprises Subathu- Dagshai-Kasauli
and some outliers of Lower Siwalik in the Mandi reentrant section. The Shali Subsidiary Belt of Bandla
Range lies within this structural zone along its contact with the Siwalik structural belt. The Sirmur
structural belt extends from Dharamshala in north west to Sirmuri Tal in south east .On the north east
it is bounded by a chain of structural belts starting from the main Shali structural belt, Simla group
belt along with outer Krol belt and Jaunsar structural belt along with the inner krol belt. On the south
east it is bounded by the Siwalik autochthon over which it has moved along a series of thrust. The
Sirmur structural belt is divided into two almost equal have and en echelon tectonic domains along a
north south trending Shali subsidiary belt of Bandla range. These are designated as Dharmasala-
Bilaspur and the Ghagas Dadahu domains.
2.5.3 Local Geology:
In this area limestone, Dolomitic limestone sporadic shale striking east west and steeply dipping at
550 to 62
0 towards north east are occurring (Geological plan plate No. IV.)
Shale–In this area red and grey shale is overlying the mineral limestone towards NW - SE.

WCS : EIA/EMP
8
Limestone bands of high grade and low grade and dolomitic limestone bands lies in contact with
shale striking NW - SE. In this area about 320 m long limestone band is outcropping at the surface and
the width is varying from 170 m towards northwest and 150m towards south east. The limestone
band is locally grey to dark grey in colour and having sulphurous odour, dull fractured surface with
elephantic weathering. The mineralized rocks show colour bending. In the low grade limestone band
two high grade bands of 10m to 15m thickness along the strike NE-SW are observed . The mineralized
band is grey to dirty white, massive and hard.
2.6.0 Exploration
2.6.1 Details of Exploration done
During the past lease period the mine was in operation by mechanised opencast method forming the
benches from RL 1920m to 1732mRL. The height of the benches varied from 18m to 10m. Three pits
were developed along the strike in limestone bands in NE - SW direction. The pits were developed at
different altitude from RL 1920m to 1910m, from RL 1876 to 1841m and 1821m to 1732m RL the
geological sections have been drawn along all pits , Pit no. 2 face shows that from RL 1885 to 1870 m,
shale is exposed and from 1870 to 1840 m , mixed grade limestone is exposed. In pit no. 3, from
RL1825 to 1732 m mixed grade limestone is exposed. In pit no. 1, from 1920 to 1908 m, shale is
exposed and from RL 1908 to 1890m mixed limestone is exposed.(Plate No. III)
2.6.2 Topographic Surveying
The topographical plans has been prepared on the scale of 1:1000 with 5m contour interval (Plate
No.III).
2.6.3 Geological Mapping
A surface geological plan on 1:1000 scale was prepared with all surface feature alongwith Geology.
(Plate No.IV &V)
2.7.0 Method of estimation of reserves:
2.7.1 On the basis of past mining in the area following parameters have been considered for the
estimation of reserves:
1. The surface outcrop and mining done in last 33 years has given a high confidence on the
continuation of limestone mineralization. Since limestone is occurring all along the hill from RL
1914.27m to RL 1700m and strike length is well exposed , 40 m dip extension is covered under
proved category & 10m below proved category is taken as probable category limestone reserves . The
X sectional method of reserves estimation was been followed.
Table: 2.3- Estimation of Proved, Probable & Possible Reserves
Section Proved (mRL) Probable (mRL)
A – A’ 1690 m 1680 m
B – B’ 1740 m 1730 m
C – C’ 1790 m 1780 m
D – D’ 1800 m 1850 m
2. On the past experience of mining it is concluded that it is feasible to excavate limestone with
minimum excavation of overlying shale.

WCS : EIA/EMP
9
3. The proved & feasible reserves are considered as economically viable.
4. During past mining the recovery in limestone has been obtained as 75% and in waste 25%.
5. Where in overlying shale mining is not possible because of the optimum pit limits, the reserves
are considered as pre-feasible resources.
6. Tonnage factor in limestone considered is 2.5.
7. The reserves have been assessed,keeping in view the threshold values fixed by CG vide IBM
notification dated 16/10/2009 and CCOM circular no. 3/2010 for different grades. The threshold
values for limestone considered by IBM are CaO- 34% (min) and MgO 4% (max.)
2.7.2 Indicated Mineable reserves by slice plan/ level plan method
• The ultimate pit limit has been made considering average slope of 45 to 460 and height & width of
bench 10m with bench slope of 700.
• Safety zone of 7.5m has been left all along the lease boundary.
• The mineral limestone as exposed from surface to the 30m to 40m below the surface in particular
section is considered as proved in G1 category. The mineral limestone within the ultimate pit limit is
also considered as proved in G1 category.
• The limestone 10m below the proved category is considered as probable (G2).
• The geological sections at a distance of 100m has been drawn.
• The mineable reserves have been estimated on the basis of cross sectional method by taking cross
sectional area as shown in the section and multiplied by length of influence to calculate the total
volume of excavation. The bulk density has been considered as 2.5 for calculating tonnage of
mineral and waste.
Table : 2.4 - Reserves and Resources of limestone
Classification Code Limestone
Total Mineral Resources (A + B) 7321620
A. Mineral Reserve
1. Proved Mineral Reserve 111 1910378
2. Probable Mineral Reserve 121 0
2. Possible Mineral Reserve 122 0
Sub total (A) 1910378
B. Remaining Resources
1. Feasibility Mineral Resource 211 0
2. Pre feasibility Mineral Resource 221 1111138
3. Pre feasibility Mineral Resource 222 110625
4. Measured Mineral Resource 331 3062004
5. Indicated Mineral Resource 332 1127475
6. Inferred Mineral Resource 333 0
7.Reconnaissance Mineral Resource 334 0
Sub total (B) 5411242
Total (A+B) 7321620
2.8.0 The grade-wise reserves of limestone
Limestone (90-93% CaCO3)( 20%) Chemical and sugar industry 1464325 tonnes
Limestone (80-85% CaCO3) (55 %) Steel and lime industry 4026891 tonnes
Limestone (18-23% MgO) (25%) Glass and soap industry 1830404 tonnes

WCS : EIA/EMP
10
Table: 2.5 -Grade wise distribution of mineral reserves
UNFC Limestone Chemical & sugar
Industries (20%)
Steel & Lime
Industries (55 %)
Glass & soap industries
(25%)
90-93% CaCo3 80-85% CaCo3 18-23% MgO
111 1910378 382076 1050708 477594
221 1111138 222228 611126 277784
222 110625 22125 60844 27656
331 3062004 612401 1684102 765501
332 1127475 225495 620111 281869
total 7321620 1464325 4026891 1830404
Table : 2.6- Chemical analysis of Dolomite limestone
S.No Parameters 1/HG/S/HP 2/HG/S/HP 3/HG/S/HP 4/HG/S/HP 5/HG/S/HP
1 Brightness on EPM (60
Mesh) %
82.10 79.60 44.80 48.80 38.10
2 LOI % 43.42 43.50 45.51 45.16 24.74
3 AIR % 0.22 0.34 0.12 0.42 40.46
4 CaO % 54.88 54.88 42.56 43.40 28.28
5 CaCO3 % 98.0 98.0 76.0 77.50 50.50
6 MgO % 0.70 0.70 11.0 10.50 1.40
7 MgCO3 % 1.40 1.40 22.00 21.00 2.80
8 R2O3 % 0.26 0.18 0.75 0.39 4.70
9 Fe2O3 % 0.0201 0.0149 0.0130 0.0147 2.989
10 Al2O3 % 0.24 0.17 0.74 0.38 1.71
Analysis of mineral limestone and overburden samples has been done in Wolkem India laboratory at
Udaipur which is approved by NABL.
2.9.0 Mineral Beneficiation
Sorting sizing dressing & breaking shall be carried out manually. If any kind of impurities shall be
observed within limestone lumps, it shall be broken with hammer and dressed manually and stacked
separately. On physical examination (on the basis of whiteness), different grade of limestone shall be
stacked on the benches & loaded on to the trucks/dumpers. The mineral for which additional control
is required would be transported to crushing plant situated outside the ML at a distance of 10km
where crushing and screening and further sorting is done and marketed grades are made.
2.10.0 Mining
2.10.1 Present method of working
The deposit is being exploited by mechanized opencast method of mining. The mining operations and
excavation are presently carried out by drilling upto depth of 1.5-2.0 mts with the help of jack
hammers, followed by blasting and excavation with the help of JCB. The present machinery used are
jack hammers, compressors and JCB.
Development of pit – 1 & 2
A- An approach road has been constructed from village satrorika, connecting the top of the mine (RL
1922). This road has been constructed partly within ML about 250m long with a width of 6 to 8m

WCS : EIA/EMP
11
in shale and partly in lime stone zone. This road will be used for mining for upper pit & further pit
can be developed down below.
B- Another approach road has been taken from junction of village satrorika to connect exp.
Magazine and middle pit (pit II) & from this road two benches have been connected with ramps.
C- For pit- 3 at lower level-
An approach road from junction of Sangrah / Dadhuu high way has been constructed to connect pit-3
which is at lower altitudes and 5 benches have been formed.
The present status of mining pit -1
Size of the pit RL from – to No. of benches Avg. slope
2.50m x 8 m (Road) 1926 m to 1911 m 1 35-40°
The present status of mining pit - 2
Size of the pit RL from – to No. of benches Avg. slope
35 x 40 1876 m to 1860 m 1 35 – 400
45 x 10 1860 m to 1846 m 1 35 – 400
The present status of mining pit - 3
Size of the pit RL from – to No. of benches Avg. slope
40 x 10 1816 m to 1805 m 1 35 – 400
32 x 10 1805 m to 1780 m 1 35 – 400
60 x 20 1780 m to 1763 m 1 35 – 400
60 x 25 1763 m to 1750 m 1 35 – 400
45 x 40 1750 m to 1733 m 1 35 – 400
Bench height varies from 13m to 25m as the topography of the area is very steep 300 to 40
0. The
maintenance of benches and construction of road to the benches is very difficult. The mine is being
worked by semi-mechanised method using dozer and excavator with Shallow hole drilling by jack
hammer and blasting. The mineral is manually loaded on the trucks and transported to the plant
situated at 8 – 10 km distance.
The generation of waste varied from 20 to 25% and has been dumped along the slopes partly in
overlying shale and partly on mineralized land and also for construction of road and ramps. Part of
the waste dump area has been reclaimed by afforestation and has been surrendered as per the
advice of forest department.
The details of present status of waste dump are given below in ML area :
Size of the dump RL from – to Avg. slope
Waste dump Avg. ht.
A 60m x 70m 1743 - 1705 32m 300
B 70m x 90m 1841 - 1786 55m 300
2.10.2 Proposed Mining Method
It is proposed to develop existing two pits only i.e.pit no.1 and pit no. 3. According to the occurrence
of mineral and topography of the land it is proposed to develop pits in NW – SE direction by forming
benches of 10m ht and width of 10m, slope of 700. The gradient of the road and ramp proposed is 1
in 10 however at places because of topography it may not be possible to maintain the slope of 1 in

WCS : EIA/EMP
12
10. It is also proposed to have all benches a separate road or ramps but it may not be possible to
have a separate road or ramp on every bench. In that case a sub bench will be made and mineral will
be hauled on the haulage bench manually .Due to steep topography the bench and road will be same
at places so that the topography can be negotiated for reaching to the next higher bench for further
advancement. At places for maintaining road and ramps proper cutting and filling will also be done by
making a support wall so that in all the cases safety can be ensured.
The pit no. 1 is approachable by Kaccha road coming from Satroriki Dhar- sangrah village which is
located on the extreme southeast margin of the lease area and is on the higher altitude.
Pit no. 2 is located in the middle of lease area and is at the lower altitude than the pit no. 1. The pit
no. 1 is proposed to be developed in a manner that in next 5 years it will merge with pit no. 2.
The pit no. 3 which is located on the extreme northern margin of lease area at the lower most
altitude of the terrain. Construction of approach road from Pit no.1 to pit no. 3 is not possible
because of terrain, time and cost. It can be approached only by another Kaccha road coming from
Sangrah-Renukaji. This pit is inaccessible from the upper altitude and is far away from pit no. 1 and 2.
In present situation pit no. 3 is proposed to be developed from the lower horizon to upper in a
expanding fashion longitudinally which will facilitate availability and quality of all grades of mineral
and also a suitable low gradient road system for movement of vehicles and equipments. Physically
the surrounding area proposed to be developed for pit no. 3 is some what flat, low gradient terrain
and suitable for such expansion.
The mining will be by open cast, fully mechanized method by using wagon drill for blast holes and 1.2
cubic mts bucket excavator and rock breaker for excavation and loading. On the mining faces mineral
will be manually sized to 8” boulders. Sorted mineral / graded mineral will be loaded in to the
dumpers / trucks for transportation to the crushing plant situated outside M.L area mine. The inter
burden waste comprising of shale / phylite will be loaded in to the dumpers by excavator and will be
transported to the dumping site adjacent to the ML area.
Justification for waste stacking outside ML area
• Limited availability of space within ML area.
• Steep topography and rehandling of dumps due to overall mineralization in the area.
• Compliance of observations of high court committee which is discussed in detail in para 7(b).
Pit design
The mining is proposed by forming of benches of 10 mtr height and width more than 10m. The
proposal has been made to systematize the present working .For Necessary permission, application
has been submitted to Director Mines Safety, Gaziabad (under regulation 106 (2) b of MMR 1960) on
21.11.2011.
Slope of the benches
• Slope of the benches will be maintained 70 o
with the horizontal.
• Overall pit slope 300 and ultimate pit slope 45
0.
• Direction – NW – SE. Benches will be along contour.
• The advancements of the faces are towards NE – SW.

WCS : EIA/EMP
13
2.10.3 Year wise production for mining plan period
Table : 2.7- Production & development for first 5 years
Year Deposit No. Waste Rock
(m3)
Limestone mineral
(MT) ROM
Waste Rock to
Min. ratio
(M3/MT)
Ist Pit No.I 10995 45380 0.24
(2012 – 13)
Pit No.3 4331 32485 0.13
Sub total 15326 77865 0.19
Daily production
280 working days
54.74 278.09 0.19
II nd Pit No.I 10909 46174 0.24
(2013 – 14)
Pit No.3 2750 20625 0.13
Sub total 13659 66799 0.20
Daily
production280
working days
48.78 238.57 0.20
IIIrd Pit No.I 7415 38074 0.19
(2014 – 15)
Pit No.3 4025 30188 0.13
Sub total 11440 68262 0.17
Daily production
210 working days
40.86 243.79 0.17
lVth Pit No.I 9343 45323 0.21
(2015 – 16)
Pit No.3 3637 27277 0.13
Sub total 12980 72600 0.18
Daily
production280
working days
46.36 259.29 0.18
Vth Pit No.I 1782 13365 0.13
(2016 – 17)
Pit No.3 8463 67688 0.13
Sub total 10245 81053 0.13
Daily
production280
working days
36.59 289.48 0.13
Grand total Pit No.I 40444 188316 0.21
Pit No.3 23206 178263 0.13
Sub total 63650 366579 0.17
Daily
production280
working days
45.50 261.84 0.17
2.11.0 Drilling & Blasting
This mine is being worked by open cast semi- mechanized mining method using jack hammer drilling
but now proposed to do drilling by wagon drill and jack hammer drilling.

WCS : EIA/EMP
14
Table : 2.8 - Proposed Drilling and Blasting Design
Rock
type
Dia & type of
drill machine
Length
of
blast
hole
Bur-
den
Spac
-
ing
Type of
explosiv
es used
% of
charg
e
Qty.of
explos-
ives
used/
hole
Powder
factor
obtained
(1) (2) (3) (4) (5) (6) (7) (8) (9)
Limestone
&
dolomitic
limestone
Crawl drill
(wagon drill)
machine 104
mm dia. Using
extension drill
pipes of 2
meter length
Using
compressor
HP450/ XAH
210 at 10 kg
per cm2
10.5m 3 m. 3 m. Slurry
explosiv
e
+C(83m
m)
ANFO
OR
Booster
(100
gm)
ANFO
15%
85%
0.5%
99.5
%
2.7 kg
20 kg
=====
22kg
0.100
kg
22 kg
10
Secondary
drilling
32 mm dia
integral drill
steels/extensi
on drill steels
with jack
hammer drills
using chisel
bit or cross bit
1.5
0.9
m
0.9
m
Slurry
expl. of
25 mm
dia.
ANFO
30%
70%
0.14 kg
0.33 kg
0.47 kg
5
2.12.0 Conceptual Mining Plan
Ultimate pit limits have been marked leaving 7.5m wide strip along the boundary. Final conceptual
plan is being prepared considering this lease period and the life of the mine as 25 years because the
generation of waste will be very high, availability of land for waste dumping is not available and for
mining of 19.1 lac tonne overburden generated will be 3 lac cu. m. which has to be stacked outside
the mining lease area in external dump and partly backfilled in the mining pits. The quality in the area
is very poor and will not permit purchase of land outside the mining lease as well as re-handling of
waste etc.(Plate No VI& VII)
Computation of over burden & inter burden waste and mineral limestone during lease period.
Mineable area
(sqm)
Limestone tonnage
(MT)
Waste (cu.m) Str ratio waste in cu.m
/ tonne of mineral
6.00 1910378 303413 0.16

WCS : EIA/EMP
15
Future Exploration
In future further exploration will be done to prove graded reserves and improve economic viability.
Proposed mining during life of mine
Table : 2.9 - Computation of year wise production, generation of waste and stripping ratio
Block No. Mineable area
(ha)
Mineral
production
Waste Ratio
1-5 year (2002 - 07) - - - -
6-10 year (2008-12) - - - -
11-15 year (2013-
2017)
366579 63650
0.17
16-20 year (2018-
2022)
405000 68850
0.17
Total 6.00 771579 132500 0.17
Upto the end of mine life
Block No. Mineable area
(ha)
Mineral
production
Waste Ratio
2002-2022 6.00 771579 132500 0.17
2023-2027 6.00 405000 68850 0.17
2028-2032 6.00 405000 59319 0.15
2033-2037 6.00 328799 42744 0.13
Grand total 1910378 303413 0.16
Site for disposal of waste rock
The area of waste dumping identified within ML area 0.65 ha, outside ML area 0.50 ha (alongwith
water drains and retaining wall) is sufficient for waste stacking upto 2017. Further 2.0 ha land is
required outside the ML for life of the mine for which the efforts are made / will be made.
Block year Within ML (ha) Outside ML (ha)
2013-2017 0.65 0.5 (alongwith water drains & retaining wall)
2018-2022 0 1.0
2023-2027 0 1.0
2028-2032 Backfilling (0.5 ha) 0
2033-2037 Backfilling (0.5 ha) 0
2.13.0 The land use pattern pre mining and required during mining and also end land use is given
below:
Land use pattern pre mining, mining operations (during life of mine & post mining at the end of
conceptual period)

WCS : EIA/EMP
16
Table : 2.10 - Land use pattern
At the beginning
of the mining
Area
(ha)
During lease period Area
(ha)
Reclamation at the
end of the lease
period
Area
(ha)
Gair mumkin
Land
0 Mining with road &
ramps
6.50 Afforestation on
ultimate benches &
road – ramps
5.50
Samlati land 8.05.55 Dumps (waste) 0.65 Back filling &
afforestation
1.00
Infrastructures 0.022 Afforestation on waste
dump area
0.65
Green Belt 0.8835 Green belt 0.8835
Afforestation on area
vacated by
infrastructure
0.022
Sub Total
(Afforestation)
8.05.55
Sub Total ( area
used)
8.05.55
Area not disturbed 0
Area not disturbed 0
Total 8.05.55 Total 8.05.55 Total : 8.05.55
Outside ML area 0.6 hect area is taken for construction of office & connecting road.
2.14.0 Reclamation
Reclamation is proposed by afforestation on ultimate benches / back filling / and area vacated by
road and infrastructures over 8.05.55 ha land during life of the mine. But during lease period only
green belt development will be possible because even area covered by dumping will be used as
road and ramp for mining pits.
Table : 2.11 - Afforestation in the mining lease area during life of the mine
Year wise
plantation
Location Area in
hectares
No. of
plants
No. of
species
% survival
expected
Remarks
Existing on
2011 – 12
Waste dumps 1.00 600 10 585 Area
surrendered
Sub total 1.00 600 10 585
2013 – 17 Green belt 0.8835 883 10 70%
2018 – 22 - 0 0 0 0
2023 – 27 - 0 0 0 0
2028 – 32 - 0 0 0 0
2033 – 37 Afforestation on ultimate
benches
5.5 5500 10 70%
Backfilling and
afforestation
1.0 1000 10 70%

WCS : EIA/EMP
17
Afforestation on waste
dump
0.65 650 10 70%
Afforestation on area
vacated by infrastructure
0.022 22 10 70%
Sub total 8.05.55 8055 10 70%
Table : 2.12 -Afforestation on adjacent land purchased / proposed
Year wise plantation Location Area in
hectares
No. of
plants
No. of
species
% survival
expected
Existing as on 2012 Waste dumps 0.20 Grass Plantation
Surface 0.25 200 10 150%
Sub total 0.45 200 10 150%
2013-17 Waste dumps 0 0 0 0
2018-22 Waste dumps 0.50 500 10 70%
2023-27 Waste dumps 1.00 1000 10 70%
2028-32 Waste dumps 1.00 1000 10 70%
Total 2.50 2500 10 70%
In addition to above plantation is proposed on 0.2 hect. govt. waste land subject to consent of village
panchayat.
2.15.0 Stacking of Mineral Rejects and Disposal of Waste
There is no top soil generation. The shale within dolomitic, limestone is occurring as inter burden
waste.
Table: 2.13 - Generation of top soil and over-burden waste for 5 years
Year Deposit No. Top Soil (m3) Waste Rock (m3)
2012 – 13 Pit No.1 0 10995
Pit No.3 0 4331
Sub Total 0 15326
Daily production 280 working days 0 54
2013 – 14 Pit No.1 0 10909
Pit No.3 0 2750
Sub Total 0 13659
Daily production 280 working days 0 49
2014 – 15 Pit No.1 0 7415
Pit No.3 0 4025
Sub Total 0 11440
Daily production 280 working days 0 41
2015 – 16 Pit No.1 0 9343
Pit No.3 0 3637
Sub Total 0 12980
Daily production 280 working days 0 47
2016 – 17 Pit No.1 0 1782
Pit No.3 0 8463
Sub Total 0 10245

WCS : EIA/EMP
18
Daily production 280 working days 0 37
Grand Total Pit No.1 0 40444
Pit No.3 0 23206
Sub Total 0 63650
Daily production 280 working days 0 38
2.15.1 Land chosen for disposal of waste with proposed justification
The proposal of dumping sites are based on the location of pits, identification of non mineralized
zones and gradient of the area.
Two dumping sites for handling and dumping of waste generated from both the pits are proposed.
One is in the ML area and another outside the ML area. Since both the pits lies far away from each
other and lies at extreme altitude differences, we have proposed separate dumps for both the pits as
to reduce the handling cost of the waste. For waste generated during excavation of pit no. 1 the
dump site proposed lies near the pit on non mineralized shale area. This dump site will only be
utilized for dumping of waste generated from pit no.1 because it is inaccessible from pit no.3 due to
topography and access.Near pit no. 3, no suitable non mineralized land is available to accommodate
waste generated from development of pit no.3. So the land chosen for dumping is outside the ML
area near pit no.3 and is easily accessible as compared for subsequent period about 2.0 hectare land
will be purchased outside the mining lease area and backfilling will be done in the mining lease area.
Stacking of inter burden in external dump and back filling.The manner in which stacking of inter
burden is proposed has been shown in five year plan.
Stacking of Top soil:- No top soil will be generated.
Table : 2.14 - Stacking of Top Soil and Waste Dump in External Dumps
Waste Dump Stack
Pit No. Stack No. Length
(m)
Spread
(m)
Area
(m2)
Height
(m)
Cu.M.
Pit 1 (within ML) WD 1
2012 –
13
Terrace-I (1865 mRL) 60 8 480 10 4400
Terrace-II (1875 mRL) 80 8 640 10 6400
2013 –
14
Terrace-III (1885 mRL) 110 8 880 10 8800
Terrace-IV (1888 mRL) 160 4 - 3 1920
2014 –
15
Terrace-IV (1895 mRL) 160 7 1120 7 7840
2015 –
16
Terrace-V (1904 mRL) 140 8 - 9 10080
2016 –
17
Terrace-V (1905 mRL) 140 12 1680 1 1680
Total 4800 41120

WCS : EIA/EMP
19
2.16.0 Extent of Mechanization
Table : 2.15 – Extent of mechanization
Activities
Removal of top soil, if any By manual labour / excavator
Drilling By wagon drill / jack hammer
Blasting High explosive / ANFO
Excavation and removal of OB By excavator
Excavation of mineral limestone By excavator
Breaking of mineral limestone in 8” size By rock breaker / manual labour
Sorting & grading of mineral limestone By manual labour
Transportation of mineral from pit head to plant By dumpers / trucks
Loading of waste on to the dumper By excavator
Unloading of waste at dumping site By dumper
Table : 2.16- Specifications of machineries used and proposed to be used
Machine Model Make Nos. in use Required
Wagon drill (I) 83mm dia (Bit) IR 0 1
Portable Compressor 180 cfm 1 1
Portable compressor 400 cfm 0 1
Jack hammers 2 2
Heavy Earth Moving Machinery
Hyd. Excavators JCB 4cx 1 1
Rock breaker JCB 4cx 0 1
Rear Dumper 10-12 mt capacity 1 2
Dumper 18 tonne capacity 2 7
Jeep 1 1
2.17.0 Utilities & Proposed Site Facilities -
2.17.1 Utilities:
Water: No water supply system exists in the area. Drinking water and water for other purpose is
brought from water spring outside lease area. Drinking water is stored in clean covered earthen pots
and kept near working faces.
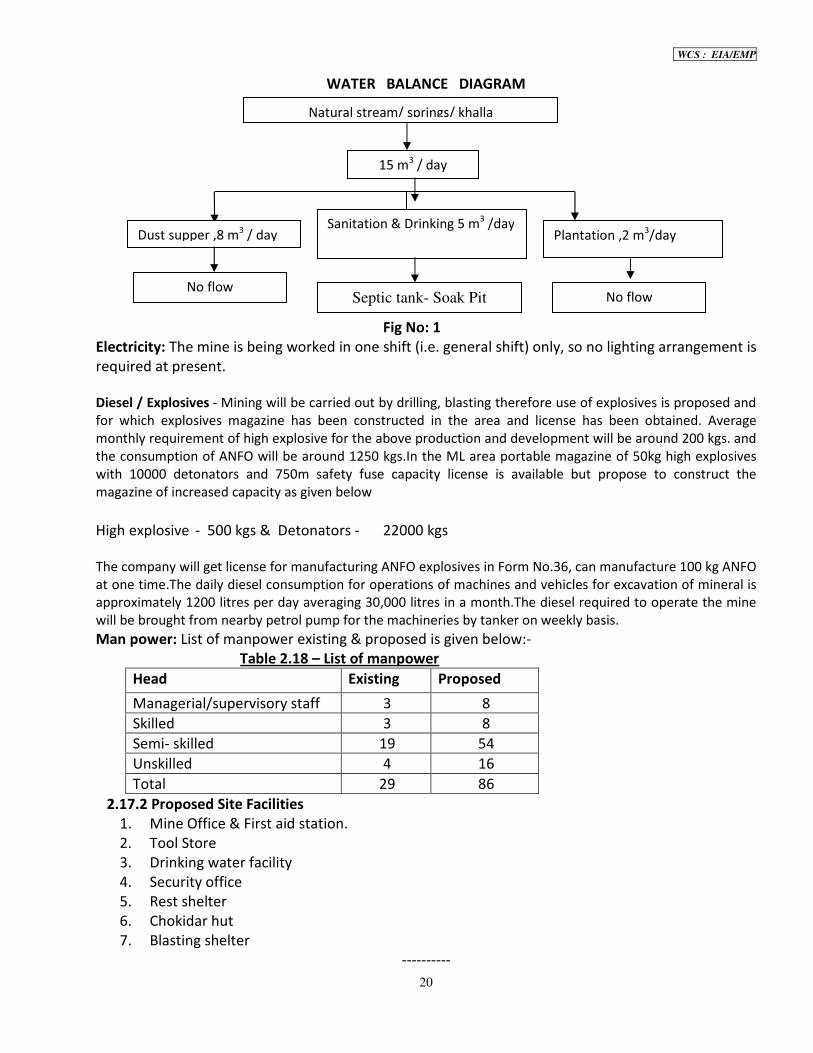
Table: 2.17 Peak Water Requirement
Purpose Peak demand
Drinking 5 m3/day
Dust Suppression 8 m3/day
Plantation 2 m3/day
Total 15 m3/day
WCS : EIA/EMP
20
WATER BALANCE DIAGRAM
Fig No: 1
Electricity: The mine is being worked in one shift (i.e. general shift) only, so no lighting arrangement is
required at present.
Diesel / Explosives - Mining will be carried out by drilling, blasting therefore use of explosives is proposed and
for which explosives magazine has been constructed in the area and license has been obtained. Average
monthly requirement of high explosive for the above production and development will be around 200 kgs. and
the consumption of ANFO will be around 1250 kgs.In the ML area portable magazine of 50kg high explosives
with 10000 detonators and 750m safety fuse capacity license is available but propose to construct the
magazine of increased capacity as given below
High explosive - 500 kgs & Detonators - 22000 kgs
The company will get license for manufacturing ANFO explosives in Form No.36, can manufacture 100 kg ANFO
at one time.The daily diesel consumption for operations of machines and vehicles for excavation of mineral is
approximately 1200 litres per day averaging 30,000 litres in a month.The diesel required to operate the mine
will be brought from nearby petrol pump for the machineries by tanker on weekly basis.
Man power: List of manpower existing & proposed is given below:-
Table 2.18 – List of manpower
Head Existing Proposed
Managerial/supervisory staff 3 8
Skilled 3 8
Semi- skilled 19 54
Unskilled 4 16
Total 29 86
2.17.2 Proposed Site Facilities
1. Mine Office & First aid station.
2. Tool Store
3. Drinking water facility
4. Security office
5. Rest shelter
6. Chokidar hut
7. Blasting shelter
----------
Natural stream/ springs/ khalla
15 m3 / day
Dust supper ,8 m3 / day
Sanitation & Drinking 5 m3 /day
0.5 m3 / day
Plantation ,2 m3/day
Septic tank- Soak Pit No flow
No flow

WCS : EIA/EMP
21
3.0.0 CHAPTER - III
DESCRIPTION OF THE ENVIRONMENT
3.1.0 Introduction
This chapter provides an overview of the environmental baseline conditions within the
proposed project area that might be affected by the proposed activities. The environmental
baseline survey included collection of primary and secondary data.
3.2.0 Methodology
1. Based on the approved modified mining plan and PMCP as well as TOR a study of the project
area(Core & buffer zone) has been made by functional area experts.
2. Collection, Collation, synthesis & interpretation of Secondary data for Meteorology, Ecology &
Biodiversity, Socio economic status, Surface & Ground water, land slides zone for sirmour
district etc.
3.Collection of primary data for Ambient air quality, Noise, Ground water and surface water
quality, Soil quality, Land use pattern, Ecology & Biodiversity , Socio-economic conditions,
details of Sensitive areas such as forests, sanctuaries, places of historical, archeological and
tourist importance etc. is done on the following basis:
a. Selection of location & type of primary data to be collected based on approved ToR.
b. Sampling & analysis from NABL accredited lab, involving team of Lab persons andFAE’s.
4. Interpretation of baseline data collected to ensure reliability based on primary & secondary
data.
3.3.0 Study Area at a Glance
The study area includes the villages of Tehsil Renukaji at Sangrah District Sirmour (HP) within
radius of 10 km from mine.
Table No : 3.1 - Study area at a Glance
General Particulars
Study area (10 km radius) 314 sq. km.
Village, Tehsil, District , State Renukaji at Sangrah , Sirmour, H.P
Latitude (N) 30º41’12.53” and 30º41’24.15”
Longitude (E) 77º26’9.2” to 77º26’22.98”
Toposheet No 53F/6
Elevation Max elevation are 1914.27mRL & Min. 1700 mRL .
Seismic Zone IV Zone
Demography as per census of 2001 year
Total Population 25783
Total Male 13084
Total Female 12699
Total Literate 13199
Male Litertate 7834
Female Literate 5375
Total Household 4219
Climatology

WCS : EIA/EMP
22
Max Temperature 30°
Min Temperature -2°
Relative Humidity 80%
Total Rainfall 1660 mm average rainfall
Station: Sirmour
Year Rainfall in mm
2008 1422.1
2009 974.9
2010 1903.9
2011 1624.9
2012 1099.5
Existing land use (agriculture, non- agriculture, grazing, forest, water bodies)
Areas Name Aerial distance from (in km)
Core Zone Buffer Zone
National
Park/Sanctuary
Renuka Wildlife
Sanctuary
NIL 8.5 km
Biosphere Reserve /
Tiger Reserve /
Elephant Reserve / any
other Reserve
NIL
NIL
NIL
Forest (RF / PF /
unclassified)
Reserved Forest NIL
S.N
o
Name &
type of
Distanc
e in Km. 1. Renuka RF 8.5
2. Ungar RF 7.0
3. Dada RF 0.01
4. Lajuwah
RF
7.0
5. Ghaton
RF
6.5
6. Charag RF 8.0
7 Arat RF 8.0
8 Gairari RF 5.5
9 Ghatlog
RF
4.5
10. Manal RF 8.5
11 Coker RF 9.5
12 Gawahi
RF
9.0
13 Kufar RF 8.5
Habitat for migratory
birds
NIL NIL NIL

WCS : EIA/EMP
23
3.4.0 Topography & Drainage
3.4.1 The ML area is a part of hilly terrain of Himachal Pradesh covered with steep hills of
shiwalik range.The general slope of the area is towards East to North West steeply sloping
from 250 to 40
0. The topography of the area is rough and rugged. The highest altitude recorded
within the area is 1914 mRL near southeast corner of the ML near pillar “D” and the lowest
contour is 1700 mRL near pillar “K” at North West corner of ML. The area is drained by the
seasonal water flowing from top of the hill down the slope towards north west and joins on
western side Garag Ka Khalla and further flows Palor Ka Khalla at a distance of 4km which
further flows down to Giri river flowing at about 6.5 km distance.
3.5.0 Meteorology
3.5.1 Site Specific meteorology
The meteorology data was collected for summer season of the year 2012-13.(Annexure No
XVIII). The meteorological station was installed on top of the site office of sangrah mine. The
sampling frequency maintained was hourly for all parameters except cloud cover for a period of
three months from 1.04.2012 to 30.06.2012 (Pre monsoon).On the basis of meteorological data
wind rose diagram were plotted which shows that the predominant wind direction is NNW to
SE (Fig 2).
Corridor for animals of
schedule I & II of the
Wildlife (Protection)
Act, 1972
NIL NIL NIL
Archaeological sites
* Notified
* Others
NIL NIL NIL
Defense Installation NIL NIL NIL
Industries / Thermal
Power Plants
NIL NIL NIL
Other Mines Sangrah mine of
lease area 8.05.55
ha consist of
shamlati land
Bhootmarhi and a few
small mining areas in
operation.
Water bodies Polar ka Khala
(seasonal)
Nil
Within 10 km radius
of buffer zone
Garag Ka Khala Nil -do-
Giri River Nil 6.5 km
Environmentally
polluted Critical areas
NIL NIL NIL

WCS : EIA/EMP
24
Fig No: 2

WCS : EIA/EMP
25
3.6.0 Ambient Air Quality
To establish the ambient air quality the studies were carried out during summer season
of the year 2012-13.
3.6.1 Location & selection of Ambient Air Sampling Stations
The locations of the ambient air quality monitoring stations were established after studying the
predominant wind direction, nearby settlements, the coverage factor & ecological sensitive
areas etc. in the study area and also the core zone
(mine site). The monitoring stations are covering upwind, downwind, crosswind, core zone, hab
itations and sensitive areas .Total nine sampling stations were established in entire study area.
While the locations are given in Table 3.2,the results of ambient air quality are incorporated in
Annexure no XIII.
As per TOR one monitoring station (A2, Sangrah Renukaji PWD road) was made available within
500 m of the mine lease in the pre-dominant downwind direction.
Table: 3.2 - Ambient Air Quality Monitoring Station
3.6.2 Sampling Frequency
The frequency of monitoring was one sample 24 hourly, twice a week at each station for one
seasons in a year except monsoon season.
3.6.3 Parameters monitored & Analytical methods followed for ambient air quality The
parameters monitored were Particulate Matter (PM10), Suspended particulate matter (SPM),
Sulphur Dioxide (SO2), and Oxides of Nitrogen (NOx).
� The village station was selected on the top of house above 3 m from ground level and away
from tall buildings to ensure open space on all sides.
� For traffic pollution, station selected is 3 m above the street level on tar road.
� The station selected is representative of the area for which monitoring is done.
S.
No
Station Location Distance
from M.L
Dire-
ction
Latitude Longitude
1 A1 Core zone
(Sanghara M.L area)
- - 30º 41’ 31.6” 77º 26’ 12.3”
2 A2 Sanghara Renuka Ji
PWD road (Near
Dada RF boundary)
0.50 WSW 30º 41’ 16.1” 77º 25’ 45.3”
3 A3 Bhootmari lease 2.60 E 30º 41’ 35.8” 77º 27’ 59”
4 A4 Kundwari Village 3.42 ENE 30º 41’ 56.5” 77º 28’ 28.4”
5 A5 Barag Village 3.46 ESE 30º 41’ 11.7” 77º 28’ 26.8”
6 A6 Renuka sanctuary
boundary
8.70 SSE 30º 36’ 50.4” 77º 27’ 47.6”
7 A7 Kaith Village 3.50 SSW 30º 39’ 32.1” 77º 25’ 49”
8 A8 Koriyana Village 2.60 N 30º 42’ 57.6” 77º 26’ 29.3”
9 A9 sangrah Village 1.71 WNW 30º 41’ 53.6” 77º 25’ 9.3”

WCS : EIA/EMP
26
� Equipment, reagents, filter papers and other accessories as per NABL standards are used.
� During monitoring cross checking of the reading are done.
� Samples are collected, stored & transported to WCS lab as per the standard procedure.
The samples for PM10 were collected by Respirable dust sampler operated at maximum rate of
1.5 cu. m./min. and concentrations were determined gravimetrically on 24 hours basis for a
three months.
Sulphur-dioxide, Nitrogen Oxides and Carbon Monoxide measurement were done as per
Modified West & Gaeke Method, Modified Jacob & Hochheiser Method and IS:5182 (Part-X)
1976 respectively.
Fig No: 3 - Graphical presentation of results of Ambient Air Quality

WCS : EIA/EMP
27
3.6.4 Observations
1. At all air ambient station PM10, SPM, SO2 and NOx are within the prescribed limit of CPCB
for respective categories.
2. The 98th
percentile value for concentration of PM10 in the ambient air at all locations is
within the prescribed limit.
3. Free silica in PM10 is negligible.
3.7.0 Noise Environment
To establish the Noise level the studies were carried out during summer season of the
year 2012-13.
3.7.1 Location & Selection of Noise Sampling Stations
The noise level monitoring in the study area was done at the same place of ambient air
environment monitoring locations. Sampling locations were selected on the basis of, eco-
sensitive areas, habitation & meteorological parameters e.g. wind speed, wind direction,
temperature and Humidity levels as these parameters influence the propagation of sound as
well as density of sound waves.
Table : 3.3 - Noise monitoring stations
3.7.2 Sampling Frequency
Hourly collection of noise data was done during summer season 2012-13.
3.7.3 Parameters & Methodology
Measured noise level displayed as a function of time provides a useful scheme for describing
the acoustical climate of a community. Noise level were recorded hourly for daytime and night
time separately at each station and were computed for equivalent noise level for day and for
night separately.
S.
N
o
Station Location Distance
from
M.L
Direction Latitude Longitude
1 N1 Core zone (Sanghara
M.L )
- - 30º 41’ 31.6” 77º 26’ 12.3”
2 N2 Sanghara Renuka Ji
PWD road (Near Dada
RF boundary)
0.50 WSW 30º 41’ 16.1” 77º 25’ 45.3”
3 N3 Bhootmari 2.60 E 30º 41’ 35.8” 77º 27’ 59”
4 N4 Kundwari Village 3.42 ENE 30º 41’ 56.5” 77º 28’ 28.4”
5 N5 Barag Village 3.46 ESE 30º 41’ 11.7” 77º 28’ 26.8”
6 N6 Renuka sanctuary
boundary
8.70 SSE 30º 36’ 50.4” 77º 27’ 47.6”
7 N7 Kaith Village 3.50 SSW 30º 39’ 32.1” 77º 25’ 49”
8 N8 Koriyana Village 2.60 N 30º 42’ 57.6” 77º 26’ 29.3”
9 N9 sangrah Village 1.71 WNW 30º 41’ 53.6” 77º 25’ 9.3”

WCS : EIA/EMP
28
Equivalent noise level is a single number descriptor for describing time, varying noise levels. The
equivalent noise level is defined as mathematically Leq = 10 Log Σ fi10LI/10.
Where fi = Time fraction for which constant sound level ‘Li’ was present
Monitoring time for which sound level were recorded
Noise levels i.e. Leq (day) and Leq (night) for each station in core zone and buffer zone has been
measured by Lutron SL - 4001. Noise level meter. Hourly equivalent for pre monsoon season for
day & night separately has been recorded and the average pre monsoon data is given below:
L10 - Sound pressure level exceeding 10 percent of the monitoring time. This roughly gives
the maximum RMS level.
L90 - Sound pressure level exceeding 90 percent of the monitoring time. This represents the
background noise level.
Leg - The energy equivalent sound level equals the constant sound level whose acoustic
energy is equivalent to the acoustic energy of a fluctuating sound over some time interval.
Leg is defined by the following expressing:
Leg = 10 log ( ∑ f1 10 Li/10
) ……………………………………………………….. (1)
Where, f1 is, the fraction of the time the constant level Li is present.
Ldn - Day-night energy equivalent sound level. Ldn is defined by the following expression.
Ldn = 10 log { 1/24 [ 15 ( 10 L day/10
) + 9 ( 10 ( L night + 10) / 10)
] } …………. (2)
3.7.4 Results of Noise level – Noise level recorded are represented in the table below:

WCS : EIA/EMP
29
Table No : 3.4.1 - Day Core zone ( Sanghara M.L area) (N1)
S. No. Location Time L10 L50 L90 Leq
1 N-1 6-7 47.2 46.3 42.5 46.7
2 N-1 7-8 49.1 47 43.2 47.6
3 N-1 8-9 50.2 48.3 44.5 48.8
4 N-1 9-10 57.6 52.3 48.5 53.7
5 N-1 10-11 58.3 53.4 49.6 54.7
6 N-1 11-12 58.1 54.1 50.3 55.1
7 N-1 12-13 62.1 58.4 54.6 59.3
8 N-1 13-14 56.6 52.4 48.6 53.5
9 N-1 14-15 60.2 56.1 52.3 57.1
10 N-1 15-16 61.4 58.3 54.5 59.1
11 N-1 16-17 62 58.1 54.3 59.1
12 N-1 17-18 61.7 56.9 53.1 58.1
13 N-1 18-19 60.9 53.4 49.6 55.5
14 N-1 19-20 58.2 52.3 48.5 53.9
15 N-1 20-21 56.3 50.3 46.5 51.9
Leq Day 54.3
Night
S. No. Location Time L10 L50 L90 Leq
1 N-1 21-22 49.6 46.4 42.6 47.2
2 N-1 22-23 48.6 45.3 41.5 46.1
3 N-1 23-24 47.3 44.9 41.1 45.5
4 N-1 24-1 46.5 44.8 41 45.3
5 N-1 1-2 46.3 43.8 40 44.5
6 N-1 2-3 45.2 43.4 39.6 43.9
7 N-1 3-4 44.3 43.2 39.4 43.6
8 N-1 4-5 45 44 40.2 44.4
9 N-1 5-6 45.3 44.4 40.6 44.8
Leq Night 45.0
Leq = L50 + [(L10 – L90)2/60)]
Day-Night Sound Level (Ldn) = 10 log {1/24 [15 (10Lday/10
) + 9 (10(Lnight + 10)/10)
]}
Ldn 54.576

WCS : EIA/EMP
30
Table No : 3.4.2 - Day Sanghara Renuka Ji PWD road (Near Dada RF boundary) (N2)
S. No. Location Time L10 L50 L90 Leq
1 N-2 6-7 46.8 44 40.2 44.7
2 N-2 7-8 49.2 46.1 42.3 46.9
3 N-2 8-9 50.3 48 44.2 48.6
4 N-2 9-10 53.4 50.1 46.3 50.9
5 N-2 10-11 57.9 54.4 50.6 55.3
6 N-2 11-12 58.9 55.1 51.3 56.1
7 N-2 12-13 61.3 56.1 52.3 57.5
8 N-2 13-14 59.8 57.1 53.3 57.8
9 N-2 14-15 58.6 57.9 54.1 58.2
10 N-2 15-16 58.2 56.7 52.9 57.2
11 N-2 16-17 58.4 56.4 52.6 57.0
12 N-2 17-18 56.8 54 50.2 54.7
13 N-2 18-19 54.5 51.4 47.6 52.2
14 N-2 19-20 53.8 50.3 46.5 51.2
15 N-2 20-21 53.1 49.7 45.9 50.6
Leq Day 53.3
Night
S. No. Location Time L10 L50 L90 Leq
1 N-2 21-22 47.2 45 41.2 45.6
2 N-2 22-23 46.8 44.8 41 45.4
3 N-2 23-24 46.5 43.8 40 44.5
4 N-2 24-1 45.2 43.3 39.5 43.8
5 N-2 1-2 44.5 42.3 38.5 42.9
6 N-2 2-3 44.2 43.3 39.5 43.7
7 N-2 3-4 44 42.4 38.6 42.9
8 N-2 4-5 44.1 43.2 39.4 43.6
9 N-2 5-6 44.5 43.5 39.7 43.9
Leq Night 44.0
Leq = L50 + [(L10 – L90)2/60)]
Day-Night Sound Level (Ldn) = 10 log {1/24 [15 (10Lday/10
) + 9 (10(Lnight + 10)/10)
]}
Ldn 53.559

WCS : EIA/EMP
31
Table No : 3.4.3 - Day (Bhootmari lease) (N3)
S. No. Location Time L10 L50 L90 Leq
1 N-3 6-7 48.9 45.9 42.1 46.7
2 N-3 7-8 51.3 48 44.2 48.8
3 N-3 8-9 54.6 49.4 45.6 50.8
4 N-3 9-10 55.4 52.4 48.6 53.2
5 N-3 10-11 58 54 50.2 55.0
6 N-3 11-12 61.5 58.4 54.6 59.2
7 N-3 12-13 62.7 56.2 52.4 58.0
8 N-3 13-14 55.3 49.3 45.5 50.9
9 N-3 14-15 58.4 52.7 48.9 54.2
10 N-3 15-16 57.2 54.4 50.6 55.1
11 N-3 16-17 55.4 55.8 52 56.0
12 N-3 17-18 58.9 56.1 52.3 56.8
13 N-3 18-19 56.4 53.9 50.1 54.6
14 N-3 19-20 55.2 52.5 48.7 53.2
15 N-3 20-21 52.6 50.1 46.3 50.8
Leq Day 53.5
Night
S. No. Location Time L10 L50 L90 Leq
1 N-3 21-22 50.2 46.1 42.3 47.1
2 N-3 22-23 48.9 45.8 42 46.6
3 N-3 23-24 48.1 45.1 41.3 45.9
4 N-3 24-1 47.8 44.4 40.6 45.3
5 N-3 1-2 47.2 44 40.2 44.8
6 N-3 2-3 45.2 43.4 39.6 43.9
7 N-3 3-4 44.2 43.2 39.4 43.6
8 N-3 4-5 43.2 42.9 39.1 43.2
9 N-3 5-6 45 44.1 40.3 44.5
Leq Night 45.0
Leq = L50 + [(L10 – L90)2/60)]
Day-Night Sound Level (Ldn) = 10 log {1/24 [15 (10Lday/10
) + 9 (10(Lnight + 10)/10)
]}
Ldn 54.141

WCS : EIA/EMP
32
Table No : 3.4.4 - Day (Kundwari Village ) (N4)
S. No. Location Time L10 L50 L90 Leq
1 N-4 6-7 47.8 45 41.2 45.7
2 N-4 7-8 48 46.4 42.6 46.9
3 N-4 8-9 50.6 48.3 44.5 48.9
4 N-4 9-10 54.3 51.4 47.6 52.1
5 N-4 10-11 55 52.7 48.9 53.3
6 N-4 11-12 54.9 53.3 49.5 53.8
7 N-4 12-13 56 54 50.2 54.6
8 N-4 13-14 57 54.9 51.1 55.5
9 N-4 14-15 56.7 54.1 50.3 54.8
10 N-4 15-16 53.8 51.9 48.1 52.4
11 N-4 16-17 54 51 47.2 51.8
12 N-4 17-18 53.4 50.1 46.3 50.9
13 N-4 18-19 52.6 48.8 45 49.8
14 N-4 19-20 50.9 48 44.2 48.7
15 N-4 20-21 49.5 46.3 42.5 47.1
Leq Day 51.1
Night
S. No. Location Time L10 L50 L90 Leq
1 N-4 21-22 46.3 44.8 41 45.3
2 N-4 22-23 46.2 44.1 40.3 44.7
3 N-4 23-24 46.1 43.9 40.1 44.5
4 N-4 24-1 45.5 43.3 39.5 43.9
5 N-4 1-2 45 42.8 39 43.4
6 N-4 2-3 44 42.3 38.5 42.8
7 N-4 3-4 44.2 42.8 39 43.3
8 N-4 4-5 44.9 44.3 40.5 44.6
9 N-4 5-6 45.6 44.6 40.8 45.0
Leq Night 44.2
Leq = L50 + [(L10 – L90)2/60)]
Day-Night Sound Level (Ldn) = 10 log {1/24 [15 (10Lday/10
) + 9 (10(Lnight + 10)/10)
]}
Ldn 52.505

WCS : EIA/EMP
33
Table No : 3.4.5 - Day (Barag Village) (N5)
S. No. Location Time L10 L50 L90 Leq
1 N-5 6-7 48.9 46.3 42.5 47.0
2 N-5 7-8 49.5 46.8 43 47.5
3 N-5 8-9 51.3 48.4 44.6 49.1
4 N-5 9-10 54.2 51.3 47.5 52.0
5 N-5 10-11 53.8 52.1 48.3 52.6
6 N-5 11-12 55 53.4 49.6 53.9
7 N-5 12-13 57 54.1 50.3 54.8
8 N-5 13-14 56.8 53.6 49.8 54.4
9 N-5 14-15 57 54.1 50.3 54.8
10 N-5 15-16 55 52 48.2 52.8
11 N-5 16-17 54 51.1 47.3 51.8
12 N-5 17-18 53 49.8 46 50.6
13 N-5 18-19 52.6 49 45.2 49.9
14 N-5 19-20 52 47.9 44.1 48.9
15 N-5 20-21 49.3 47.3 43.5 47.9
Leq Day 51.2
Night
S. No. Location Time L10 L50 L90 Leq
1 N-5 21-22 46.5 44.8 41 45.3
2 N-5 22-23 46 44.3 40.5 44.8
3 N-5 23-24 46 44 40.2 44.6
4 N-5 24-1 45.8 43.4 39.6 44.0
5 N-5 1-2 45.6 43.2 39.4 43.8
6 N-5 2-3 45.5 42.2 38.4 43.0
7 N-5 3-4 45 43 39.2 43.6
8 N-5 4-5 44.6 43.5 39.7 43.9
9 N-5 5-6 46.3 44 40.2 44.6
Leq Night 44.2
Leq = L50 + [(L10 – L90)2/60)]
Day-Night Sound Level (Ldn) = 10 log {1/24 [15 (10Lday/10
) + 9 (10(Lnight + 10)/10)
]}
Ldn 52.577

WCS : EIA/EMP
34
Table No : 3.4.6 - Day (Renuka sanctuary boundary) (N6)
S. No. Location Time L10 L50 L90 Leq
1 N-6 6-7 48.6 46 42.2 46.7
2 N-6 7-8 49.6 47.1 43.3 47.8
3 N-6 8-9 50.3 48.1 44.3 48.7
4 N-6 9-10 52.3 50.6 46.8 51.1
5 N-6 10-11 54.6 52.5 48.7 53.1
6 N-6 11-12 55 52.3 48.5 53.0
7 N-6 12-13 54.3 53.9 50.1 54.2
8 N-6 13-14 56 54.7 50.9 55.1
9 N-6 14-15 55.4 53.1 49.3 53.7
10 N-6 15-16 54 52.7 48.9 53.1
11 N-6 16-17 53.4 51.3 47.5 51.9
12 N-6 17-18 53 50.3 46.5 51.0
13 N-6 18-19 50 48.3 44.5 48.8
14 N-6 19-20 49.6 47.8 44 48.3
15 N-6 20-21 49.8 47.4 43.6 48.0
Leq Day 51.0
Night
S. No. Location Time L10 L50 L90 Leq
1 N-6 21-22 46.3 44 40.2 44.6
2 N-6 22-23 46 43.9 40.1 44.5
3 N-6 23-24 45.6 43.3 39.5 43.9
4 N-6 24-1 44.6 42.2 38.4 42.8
5 N-6 1-2 44 42 38.2 42.6
6 N-6 2-3 45 43.2 39.4 43.7
7 N-6 3-4 44.5 43.8 40 44.1
8 N-6 4-5 44.3 43.9 40.1 44.2
9 N-6 5-6 45 44.1 40.3 44.5
Leq Night 43.9
Leq = L50 + [(L10 – L90)2/60)]
Day-Night Sound Level (Ldn) = 10 log {1/24 [15 (10Lday/10
) + 9 (10(Lnight + 10)/10)
]}
Ldn 52.301

WCS : EIA/EMP
35
Table No : 3.4.7 - Day (Kaith Village) (N7)
S. No. Location Time L10 L50 L90 Leq
1 N-7 6-7 48.6 46.1 42.3 46.8
2 N-7 7-8 49.7 46.9 43.1 47.6
3 N-7 8-9 50.3 48 44.2 48.6
4 N-7 9-10 51.8 50.1 46.3 50.6
5 N-7 10-11 55.6 52.3 48.5 53.1
6 N-7 11-12 54.8 52.8 49 53.4
7 N-7 12-13 56.9 54 50.2 54.7
8 N-7 13-14 57.6 55 51.2 55.7
9 N-7 14-15 54.7 52.3 48.5 52.9
10 N-7 15-16 56.4 52.5 48.7 53.5
11 N-7 16-17 54.8 52.8 49 53.4
12 N-7 17-18 53.6 52 48.2 52.5
13 N-7 18-19 52.4 50.3 46.5 50.9
14 N-7 19-20 50.4 49.8 46 50.1
15 N-7 20-21 49.8 48.1 44.3 48.6
Leq Day 51.5
Night
S. No. Location Time L10 L50 L90 Leq
1 N-7 21-22 46.9 45.4 41.6 45.9
2 N-7 22-23 47 45.1 41.3 45.6
3 N-7 23-24 46.9 44.4 40.6 45.1
4 N-7 24-1 46.5 44 40.2 44.7
5 N-7 1-2 46.3 43.3 39.5 44.1
6 N-7 2-3 45.2 42.2 38.4 43.0
7 N-7 3-4 45 42 38.2 42.8
8 N-7 4-5 44.6 43.4 39.6 43.8
9 N-7 5-6 45.7 44.1 40.3 44.6
Leq Night 44.4
Leq = L50 + [(L10 – L90)2/60)]
Day-Night Sound Level (Ldn) = 10 log {1/24 [15 (10Lday/10
) + 9 (10(Lnight + 10)/10)
]}
Ldn 52.812

WCS : EIA/EMP
36
Table No : 3.4.8 - Day (Koriyana Village) (N8)
S. No. Location Time L10 L50 L90 Leq
1 N-8 6-7 48.9 46.1 42.3 46.8
2 N-8 7-8 49.3 46.6 42.8 47.3
3 N-8 8-9 50.3 47.3 43.5 48.1
4 N-8 9-10 50.6 48.7 44.9 49.2
5 N-8 10-11 54.3 50.3 46.5 51.3
6 N-8 11-12 56.3 52.4 48.6 53.4
7 N-8 12-13 55.8 53.6 49.8 54.2
8 N-8 13-14 56.4 54.2 50.4 54.8
9 N-8 14-15 55.3 52.4 48.6 53.1
10 N-8 15-16 54.3 52 48.2 52.6
11 N-8 16-17 53.9 51.4 47.6 52.1
12 N-8 17-18 52.3 49.7 45.9 50.4
13 N-8 18-19 50.2 48.1 44.3 48.7
14 N-8 19-20 50.9 47.4 43.6 48.3
15 N-8 20-21 49.6 46.4 42.6 47.2
Leq Day 50.5
Night
S. No. Location Time L10 L50 L90 Leq
1 N-8 21-22 46.5 44.8 41 45.3
2 N-8 22-23 46 44.1 40.3 44.6
3 N-8 23-24 45.8 43.9 40.1 44.4
4 N-8 24-1 45.6 43.3 39.5 43.9
5 N-8 1-2 45.2 43.1 39.3 43.7
6 N-8 2-3 45 42.4 38.6 43.1
7 N-8 3-4 44.6 42.2 38.4 42.8
8 N-8 4-5 44.3 43.2 39.4 43.6
9 N-8 5-6 45.6 44 40.2 44.5
Leq Night 44.0
Leq = L50 + [(L10 – L90)2/60)]
Day-Night Sound Level (Ldn) = 10 log {1/24 [15 (10Lday/10
) + 9 (10(Lnight + 10)/10)
]}
Ldn 52.158

WCS : EIA/EMP
37
Table No : 3.4.9 - Day (Sanghara Village) (N9)
S. No. Location Time L10 L50 L90 Leq
1 N-9 6-7 48.1 46.6 42.8 47.1
2 N-9 7-8 49.8 47.8 44 48.4
3 N-9 8-9 52.2 49.4 45.6 50.1
4 N-9 9-10 53.6 51 47.2 51.7
5 N-9 10-11 51.3 52.4 48.6 52.5
6 N-9 11-12 56 54 50.2 54.6
7 N-9 12-13 58 54.2 50.4 55.2
8 N-9 13-14 54.5 49.4 45.6 50.7
9 N-9 14-15 55.1 52.5 48.7 53.2
10 N-9 15-16 54.6 51 47.2 51.9
11 N-9 16-17 56.3 52.4 48.6 53.4
12 N-9 17-18 54.8 51.3 47.5 52.2
13 N-9 18-19 52.6 50.3 46.5 50.9
14 N-9 19-20 51.6 48.8 45 49.5
15 N-9 20-21 48.6 47.8 44 48.2
Leq Day 51.3
Night
S. No. Location Time L10 L50 L90 Leq
1 N-9 21-22 48 45.1 41.3 45.8
2 N-9 22-23 46.5 44.3 40.5 44.9
3 N-9 23-24 46 44 40.2 44.6
4 N-9 24-1 45.5 43.3 39.5 43.9
5 N-9 1-2 44.9 42.4 38.6 43.1
6 N-9 2-3 45.2 43.2 39.4 43.8
7 N-9 3-4 45.3 44 40.2 44.4
8 N-9 4-5 46.3 44.8 41 45.3
9 N-9 5-6 47.3 45.1 41.3 45.7
Leq Night 44.6
Leq = L50 + [(L10 – L90)2/60)]
Day-Night Sound Level (Ldn) = 10 log {1/24 [15 (10Lday/10
) + 9 (10(Lnight + 10)/10)
]}
Ldn 52.845

WCS : EIA/EMP
38
Table: 3.5 - Ambient Noise Levels
S.
NO
LOCATIONS ENVIRON-
MENTAL
SETTINGS
AERAGE
DAY NOISE
LEVEL (DBA)
AVERAGE
NIGHT
NOISE
LEVEL
(DBA)
DAY TIME
6.00 AM TO
10.00 PM )
STANDARDS
( LEQ IN DBA)
NIGHT TIME
10.00 PM TO
6.00AM )
STANDARDS
( LEQ IN DBA)
Ldn
N1 Core zone Lo
(Sanghara M.L
area)
CORE 54.3 45.0 75 70 54.576
N2 Sanghara Renuka Ji
PWD road (Near
Dada RF boundary)
BUFFER 53.3 44.0 55 45 53.559
N3 Bhootmari BUFFER 53.5 45.0 75 70 54.141
N4 Kundwari Village BUFFER 51.1 44.2 55 45 52.505
N5 Barag Village BUFFER 51.2 44.2 55 45 52.577
N6 Renuka sanctuary
boundary
BUFFER 51.0 43.9 55 45 52.301
N7 Kaith Village BUFFER 51.5 44.4 55 45 52.812
N8 Koriyana Village BUFFER 50.5 44.0 55 45 52.158
N9 Sanghara Village BUFFER 51.3 44.6 55 45 52.845
Fig No: 4 - Graphical Presentation of noise level
Table No: 3.6 Ambient Noise Quality Standard
Area
Code
Category of area Limits in db (A) Leq
Day time Night Time
A Industrial area 75 70
B Commercial area 65 55
C Residential area 55 45
D Silence zone 50 40
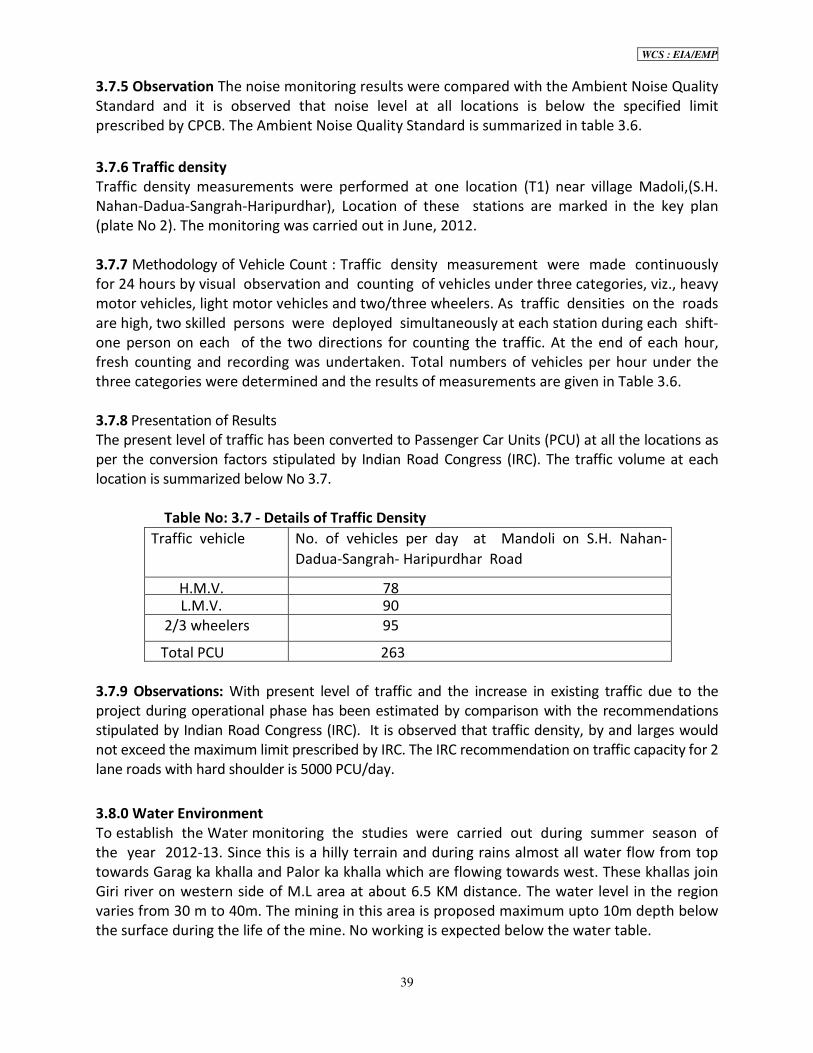
WCS : EIA/EMP
39
3.7.5 Observation The noise monitoring results were compared with the Ambient Noise Quality
Standard and it is observed that noise level at all locations is below the specified limit
prescribed by CPCB. The Ambient Noise Quality Standard is summarized in table 3.6.
3.7.6 Traffic density
Traffic density measurements were performed at one location (T1) near village Madoli,(S.H.
Nahan-Dadua-Sangrah-Haripurdhar), Location of these stations are marked in the key plan
(plate No 2). The monitoring was carried out in June, 2012.
3.7.7 Methodology of Vehicle Count : Traffic density measurement were made continuously
for 24 hours by visual observation and counting of vehicles under three categories, viz., heavy
motor vehicles, light motor vehicles and two/three wheelers. As traffic densities on the roads
are high, two skilled persons were deployed simultaneously at each station during each shift-
one person on each of the two directions for counting the traffic. At the end of each hour,
fresh counting and recording was undertaken. Total numbers of vehicles per hour under the
three categories were determined and the results of measurements are given in Table 3.6.
3.7.8 Presentation of Results
The present level of traffic has been converted to Passenger Car Units (PCU) at all the locations as
per the conversion factors stipulated by Indian Road Congress (IRC). The traffic volume at each
location is summarized below No 3.7.
Table No: 3.7 - Details of Traffic Density
Traffic vehicle No. of vehicles per day at Mandoli on S.H. Nahan-
Dadua-Sangrah- Haripurdhar Road
H.M.V. 78 L.M.V. 90
2/3 wheelers 95
Total PCU 263
3.7.9 Observations: With present level of traffic and the increase in existing traffic due to the
project during operational phase has been estimated by comparison with the recommendations
stipulated by Indian Road Congress (IRC). It is observed that traffic density, by and larges would
not exceed the maximum limit prescribed by IRC. The IRC recommendation on traffic capacity for 2
lane roads with hard shoulder is 5000 PCU/day.
3.8.0 Water Environment
To establish the Water monitoring the studies were carried out during summer season of
the year 2012-13. Since this is a hilly terrain and during rains almost all water flow from top
towards Garag ka khalla and Palor ka khalla which are flowing towards west. These khallas join
Giri river on western side of M.L area at about 6.5 KM distance. The water level in the region
varies from 30 m to 40m. The mining in this area is proposed maximum upto 10m depth below
the surface during the life of the mine. No working is expected below the water table.
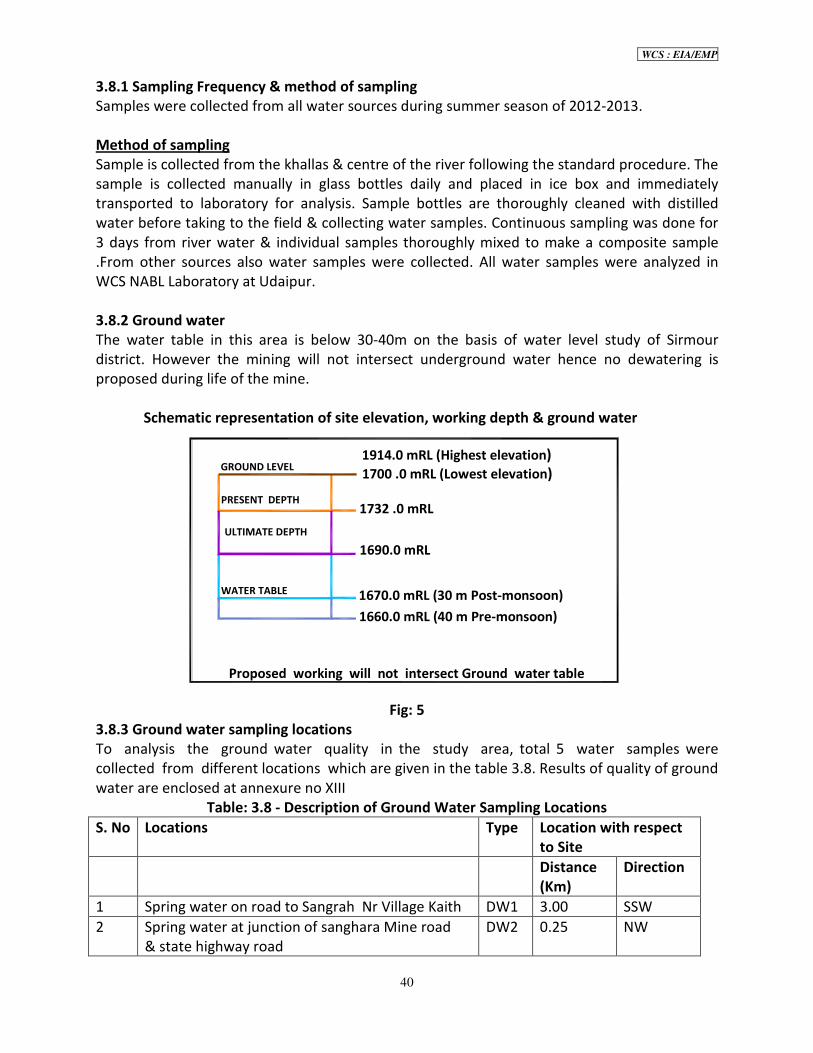
WCS : EIA/EMP
40
3.8.1 Sampling Frequency & method of sampling
Samples were collected from all water sources during summer season of 2012-2013.
Method of sampling
Sample is collected from the khallas & centre of the river following the standard procedure. The
sample is collected manually in glass bottles daily and placed in ice box and immediately
transported to laboratory for analysis. Sample bottles are thoroughly cleaned with distilled
water before taking to the field & collecting water samples. Continuous sampling was done for
3 days from river water & individual samples thoroughly mixed to make a composite sample
.From other sources also water samples were collected. All water samples were analyzed in
WCS NABL Laboratory at Udaipur.
3.8.2 Ground water
The water table in this area is below 30-40m on the basis of water level study of Sirmour
district. However the mining will not intersect underground water hence no dewatering is
proposed during life of the mine.
Schematic representation of site elevation, working depth & ground water
Fig: 5
3.8.3 Ground water sampling locations
To analysis the ground water quality in the study area, total 5 water samples were
collected from different locations which are given in the table 3.8. Results of quality of ground
water are enclosed at annexure no XIII
Table: 3.8 - Description of Ground Water Sampling Locations
S. No Locations Type Location with respect
to Site
Distance
(Km)
Direction
1 Spring water on road to Sangrah Nr Village Kaith DW1 3.00 SSW
2 Spring water at junction of sanghara Mine road
& state highway road
DW2 0.25 NW
1660.0 mRL (40 m Pre-monsoon)
1670.0 mRL (30 m Post-monsoon) WATER TABLE
1690.0 mRL
ULTIMATE DEPTH
1700 .0 mRL (Lowest elevation) GROUND LEVEL
PRESENT DEPTH 1732 .0 mRL
1914.0 mRL (Highest elevation)
Proposed working will not intersect Ground water table
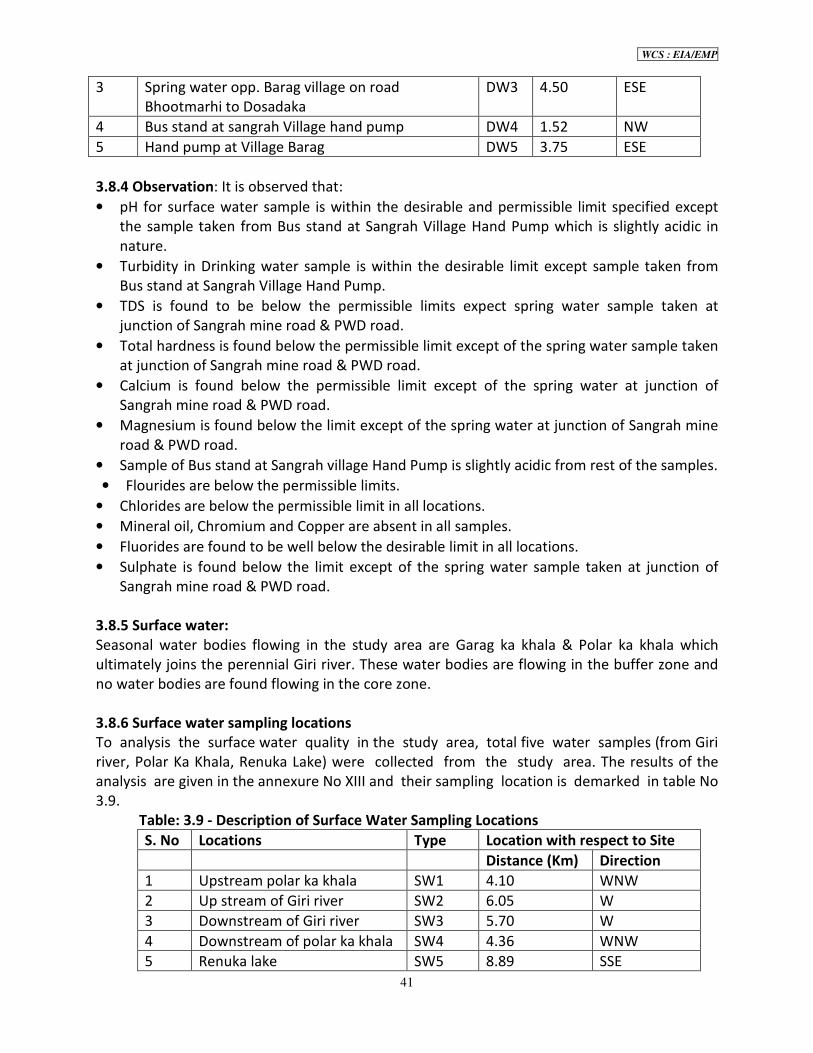
WCS : EIA/EMP
41
3 Spring water opp. Barag village on road
Bhootmarhi to Dosadaka
DW3 4.50 ESE
4 Bus stand at sangrah Village hand pump DW4 1.52 NW
5 Hand pump at Village Barag DW5 3.75 ESE
3.8.4 Observation: It is observed that:
• pH for surface water sample is within the desirable and permissible limit specified except
the sample taken from Bus stand at Sangrah Village Hand Pump which is slightly acidic in
nature.
• Turbidity in Drinking water sample is within the desirable limit except sample taken from
Bus stand at Sangrah Village Hand Pump.
• TDS is found to be below the permissible limits expect spring water sample taken at
junction of Sangrah mine road & PWD road.
• Total hardness is found below the permissible limit except of the spring water sample taken
at junction of Sangrah mine road & PWD road.
• Calcium is found below the permissible limit except of the spring water at junction of
Sangrah mine road & PWD road.
• Magnesium is found below the limit except of the spring water at junction of Sangrah mine
road & PWD road.
• Sample of Bus stand at Sangrah village Hand Pump is slightly acidic from rest of the samples.
• Flourides are below the permissible limits.
• Chlorides are below the permissible limit in all locations.
• Mineral oil, Chromium and Copper are absent in all samples.
• Fluorides are found to be well below the desirable limit in all locations.
• Sulphate is found below the limit except of the spring water sample taken at junction of
Sangrah mine road & PWD road.
3.8.5 Surface water:
Seasonal water bodies flowing in the study area are Garag ka khala & Polar ka khala which
ultimately joins the perennial Giri river. These water bodies are flowing in the buffer zone and
no water bodies are found flowing in the core zone.
3.8.6 Surface water sampling locations
To analysis the surface water quality in the study area, total five water samples (from Giri
river, Polar Ka Khala, Renuka Lake) were collected from the study area. The results of the
analysis are given in the annexure No XIII and their sampling location is demarked in table No
3.9.
Table: 3.9 - Description of Surface Water Sampling Locations
S. No Locations Type Location with respect to Site
Distance (Km) Direction
1 Upstream polar ka khala SW1 4.10 WNW
2 Up stream of Giri river SW2 6.05 W
3 Downstream of Giri river SW3 5.70 W
4 Downstream of polar ka khala SW4 4.36 WNW
5 Renuka lake SW5 8.89 SSE

WCS : EIA/EMP
42
3.8.7 Interpretation- It is observed that
• pH for surface water sample is within the desirable and permissible limit specified .
• Turbidity in surface water sample is within the desirable limit.
• TDS is found to be below the permissible limits except at the downstream of Jagar &
Barwane ka Khala.
• Total hardness is found below the permissible limit except upstream polar ka khala &
Renuka Lake.
• Calcium is found below the permissible limit except upstream polar ka khala.
• Magnesium is found below the limit except upstream polar ka khala & Renuka Lake.
• sample from downstream to Giri River is very much alkaline. Remaining samples are
moderately alkaline.
• Chlorides are below the permissible limit in all locations.
• Mineral oil, Chromium and Copper are absent in all samples.
• Fluorides are found to be well below the desirable limit in all locations.
• Sulphate is found below the limit except upstream polar ka khala & Renuka Lake.
3.8.8 Conclusion: Water from hand pumps / public spring waters is potable and meets drinking
water standard. In some wells fluoride is observed which is within the norms. The water is
suitable for human consumption. Water samples of jogar ka khala and barwane ka khala shows
slightly high dissolved solids and hardness with high sulphates. This shows efficient control
measures for silt control would be required.
3.8.9 Drainage pattern
Seasonal nallahs like Barwane ka khala, Jagar ka khala, Garag ka Khala, Polar ka khala flows
within the study area which ultimately drains into giri river.Water drainage pattern of Jagar Ka
Khala & Giri river has been prepared during study period of summer 2012 as shown in table
below:
Table No : 3.10 - Surface water flow pattern
Jagar ka khala
S.NO Locations Length Width Depth Time (Sec) Flow M3/hr
1 Jagar Ka Khalla parallel
to Giri river
20 m 3 m 0.3 m 15.0 4320
Giri river
S.NO Locations Length Width Depth Time (Sec) Flow M3/hr
1 Junction of Jagar Ka
khala & Giri river
20 m 40 m 1.5 m 12.0 360000
3.8.10 Interpretation
During mining activities and transportation of mineral and muck, dust generated may be mixed
with surface runoff water and during rains flow into khallas and giri river.There by rising bed
level. The river beds can be laterally expanded due to sedimentation, changing the dimensions
of streams & river bed, giving rise to water logging, flooding and other secondary
environmental damages like changes in aquatic flora & fauna, etc in the surroundings of
streams .This is required to be checked in core zone itself.

WCS : EIA/EMP
43
3.9.0 Land Environment
3.9.1 Land use of Study Area (Buffer Zone)
Based on the study of Survey of India toposheets followed with ground verification the total
land of the study area is divided into five categories as given in table No 3.11 and fig 6 below:
Table No: 3.11 - Land use of Study Area
S. No. Category Area (in ha) % Area cover
1 Reserve forest 4287.68 13.65 %
2 Open jungle 587.02 1.87 %
3 Agriculture land 10521.19 33.49 %
4 Govt. waste land 15781.79 50.23 %
5 Water Bodies 238.24 0.76 %
Total land 31415.92 100%
Fig No: 6 – Land use of the study area
3.9.2 Land use of Lease area (Core Zone)
The land use pattern of core zone is shown in table No 3.12.
Table No 3 .12 - Land Use Pattern (Lease Area)
S. No. Type of land use Present
land use
(Ha)
At the end of
5th year (Ha)
At the end of
lease period
(Ha)
1 Area of excavation 0.8866 2.99 6.50
2 Storage for top soil 0 0 0
3 Waste dump 0.5260 0.89 0.65
4 Mineral/sub grade storage 0 0 0
5 Infrastructure (workshop,
administrative building etc.)
0.022 0.022 0.022
6 Roads 0.3105 0.3105 0
7 Railways 0 0 0
8 Green belt 0 0.8835 0.8835
9 Tailing pond 0 0 0
10 Effluent treatment plant 0 0 0
11 Mineral separation plant 0 0 0

WCS : EIA/EMP
44
12 Township area 0 0 0
13 Others (to be specified) safety
zone
0 0 0
Total 1.7451 5.096 8.0555
14
Area which will remain
untouched
6.3104 2.9595 0
Total 8.05.55 8.05.55 8.05.55
Out side ML:
S. No. Type of land use Present
land use
At the end of
5th year
At the end of
lease period
1 Waste dump 0.20 0.70 2.70
2 Infrastructure (workshop,
administrative building etc.)
0.10 0.10 0.10
3 Roads 0.50 0.50 0.50
4 Green belt 0.25 0.25 0.25
Total 1.05 1.55 3.55
3.10.0 Soil
The soil sampling & analytical studies were carried out during summer season of year 2012-13.
The soil cover in the high attitudes is very thin because of rocky nature of area. During rain fine
particles of rocks are brought down which settles on slopes, valley and depressions in low lying
areas. The soil cover in low-lying areas enables the local inhabitants in agricultural activities.
3.10.1 Location of Soil Sampling Stations
The soil samples were collected at six locations as per details given in table No 3.13. The results
of physical and chemical parameters determined in Wolkem Laboratory, Udaipur are given in
annexure No .XIII.
Table No: 3.13 - Soil Monitoring Stations
Station code Station name Description Location with respect to site
Distance (Km) Direction
S1 Top soil Sangrah Mining area - -
S2 Over burden Sangrah Mining area - -
S3 Rajana Village Ag. Land 2.55 SSE
S4 Barag village Ag. Land 3.98 ESE
S5 Borli Village Ag. Land 1.18 WSW
S6 Nerabag Village Ag. Land 2.20 SE
3.10.2 Methodology
Soil samples were collected manually & kept in container tube so that ground conditions
remain till the samples are analysized. Five points were selected and at each location one kg soil
was collected upto 30 cm depth. All five soil samples were mixed to make one homogeneous
composite sample. Coning and Quartering method was used to reduce soil sample quantity to
½ kg. Soil sample is packed in PVC polythene bags and after proper tagging the information
sheet it was sent to Lab. Results of soil analysis are enclosed as annexure no XIII

WCS : EIA/EMP
45
3.10.3 Observation
The colour of the soil is grayish brown in buffer zone. The sample analysis suggests that the soil
is mostly alkaline in nature. Since the soil is generated from decomposed weathered limestone
rock hence the calcium and magnesium contents are high in the soil samples collected. The soils
are fine to moderately textured and the porosity is quite high i.e. around 50%. Since no
significant soil is found in the mineralized area, no reclamation of soil is proposed. Hence
negligible impact is predicted due to mining of limestone on the fertility of soil.
3.11.0 Biological environment
3.11.1 The flora & fauna species were studied with the help of Forest department & Renuka
Wild life Sanctuary range officer, Block officer & other field staff. The information was also
collected on the vernacular names and uses of plants made by local inhabitants as well as fauna
details also collected by the survey team. Details of type of flora, botanical name, family &
fauna of the area have been studied. The secondary data so collected were also verified by the
field survey.
3.11.2 Forest type in the study area
A nested quadrate technique was used for sampling the vegetation. The size and number of quadrates
needed were determined using the species area curve (Mishra,1968) and the running mean method
(Kershaw,1973). Summarization of previously used methods and recommendations led to the use of
more than often (10x10m) quadrates laid out for sampling the tree stratum and 1x1m quadrates for
herbs, grasses and seedlings of tree species less than 1.3cm dbh (diameter at Breast height), at different
altitudinal gradients using maps. However, for examining the shrub species 3x3m sample plots were laid
out. The enumeration of the vegetation done during present survey is described here under. The
vegetation data collected for phyto sociological information were quantitatively analyzed for density,
frequency and abundance according to Curtis and McIntosh (1950).
3.11.3 Reserve Forests, National Parks and Sanctuaries: While in the core zone no reserve
forest, sanctuary exist, in the study area RF exists details of which are given in table 3.14 Since
Renuka Wild life Sanctuary falls within the buffer zone area & lies 8.5 kms crow fly from lease
area, An application under Wildlife Protection Act 1972 for granting necessary permissions was
submitted .Wildlife department has provided the authenticated map on dated 30.4.11.
Table : 3.14 – Reserve forests & sanctuary
S.No Name and Type Distance in Km.
1. Renuka Reserved Forest 8.5
2. Ungar Reserved Forest 7.0 3. Dada Reserved Forest 0.01 4. Lajuwah Reserved Forest 7.0 5. Ghaton Reserved Forest 6.5 6. Charag Reserved Forest 8.0
7 Arat Reserved Forest 8.0 8 Gairari Reserved Forest 5.5
9 Ghatlog Reserved Forest 4.5 10. Manal Reserved Forest 8.5 11 Coker Reserved Forest 9.5 12 Gawahi Reserved Forest 9.0
13 Kufar Reserved Forest 8.5 Source- Key Plan

WCS : EIA/EMP
46
3.11.4 Flora and Fauna
Table : 3.15 List of flora in core Zone
S.No Botanical Name Common Name
1 Shorea robusta Sal
2 Callistemon viminalis Bottle brush
3 Azardiracta indica Neem
4 Bauhinia variegate Kachnar
5 Cassia fistula Amaltas
6 Nyctanthes arbortristis Harsingar
7 Eucalyptus tereticornis Eucalyptus
8 Ficus glomerta Gular
9 Ficus religiosa Pipal
About 90 plant species are found in the buffer zone & Renuka sanctuary. These plant species
are used for medicinal, timber, fuel, wood, fodder, ornamental, agricultural tools, thatching,
fencing, etc.
Table : 3.16 – List of flora in buffer zone S.
No
Loca Name Botanical name Habit Edible Fodder Fuel
wood
Medicinal Timber Ornam-
ental 1 Khair Acacia catechu Tree + + +
2 Bel Aegle marmelos Tree + +
3 Safed Siris Albizia lebbeck Tree + + +
4 Chhal Anogeissus latifolia Tree + +
5 Kachnar Bauhinia vahlii Tree + + 6 Chakera Bauhinia spp Tree + +
7 Amaltas Cassia fistula Tree + + + 8 Khirk Celtis australis Tree + + + +
9 Lasoora Cardio dichotoma Tree +
10 Shisham Dalbergia sissoo Tree + +
11 Bans Dendrocalam Tree
12 Ambla Emblia officinalis Tree
13 Timbl Ficus roreburghii Tree +
14 Anzir Ficus palmata Tree +
15 Gular Ficus glomerata Tree
16 Pipal Ficus religiosa Tree + +
17 Bihul Grewia optiva Tree + +
18 Akhrot Juglans regia Tree
19 Jhingan ------ Tree
20 Kamela Mallotus philippensis Tree + +
21 Aam Mangnifera indica Tree + + + +
22 Drek Melia azedarach Tree + + +
23 Shahtoot Morus alba Tree + +
24 Tootri Morus serrata Tree
25 Har Shingar Nyctanthus
arbortristis
Tree +
26 Khajoor Phoenix Humilis Tree +
27 Kainth Pyrus pashia Tree + + +
28 Robinia Robinia pseudoacacia Tree
29 Baunsh Salix alba Tree
30 Semal Bombax ceiba Tree
31 Sal Shorea robusta Tree + +
32 Jamun Syzygium cumini Tree + + +

WCS : EIA/EMP
47
33 Sain Terminalia tomentosa Tree + + +
34 Bahera Terminalia bellirica Tree + +
35 Ber Zizyphus jujuba Tree + +
36 Rita Sapindus mukrossi Tree +
37 Toon Cedrela toona Tree
38 Bottle brush Callistemon viminates Tree
39 Eucalyptus Eucalyptus tereticornis Tree
40 Jamun Syzygium cumini Tree + + +
41 Deodara Cedrus deodara Tree
42 Chir Pinus roxburghii Tree + +
43 Ban Quercus leucotrichophora Tree
44 Basutri Adathoda Vesica Shrubs & Herbs + +
45 Raamban Agava American Shrubs & Herbs
46 Kawar patta
arronspod
ainssliaea aptera Shrubs & Herbs
47 Ageli Anemone obtusiloba Shrubs & Herbs 48 Cahmbus
caabraplant
Arisaema wallichianum Shrubs & Herbs
49 Chaturi
/Kasmal
Berberis asiatica Shrubs & Herbs +
50 Kasmali Berberis chitra Shrubs & Herbs +
51 Bhang Cannabis sativa Shrubs & Herbs + +
52 Karaunda Carissa opaca Shrubs & Herbs + + 53 Dhatura Datura suaveolens Shrubs & Herbs +
54 Siaru Debregeasia hypoleuca Shrubs & Herbs
55 Thor Euphorbia roylena Shrubs & Herbs
56 Mehandu Dodonea viscasa Shrubs & Herbs
57 Bichu buti Gerardiana heterophylla Shrubs & Herbs
58 Ban nimbu Glycosmis pentaphylla Shrubs & Herbs
59 Kathi Indigofera geradiana Shrubs & Herbs
60 Ban chameli Jasminum officinale Shrubs & Herbs
61 Ban chameli Jasminum humili Shrubs & Herbs
62 Kesu /Phul Lantana camara Shrubs & Herbs
63 Gandhelu Murraya koenigaii Shrubs & Herbs + +
64 Bhekhel Punica granatum Shrubs & Herbs + + 65 Kuja Rosa sericea Shrubs & Herbs
66 Pathar tod Sexifraga ligulta Shrubs & Herbs
67 bantamaku Solanum indicum Shrubs & Herbs + 68 Bantamakoo Solanum verbassicifolium Shrubs & Herbs 69 Banna Vitex negundo Shrubs & Herbs +
70 Dub Cynodon dactylon Herbs + + 71 Besharm Ipomea quomoclit Herbs +
72 Kukuwa Utrica dioica Herbs + + 73 Darab Cynodon dactylon Herbs + +
74 Dhan Woodfordia floribunda Shrubs & Herbs + 75 Angla Acacia pennata Climber
76 Maljan Bauhinia vahlii Climber + +
77 Garoli Clematis buchananiana Climber 78 Kauni bel Clematis Montana Climber
79 Saragbel Cuscata reflexa Climber 80 Kural /tardi Dloscorea deltoids Climber 81 Bisa /Kural Hedra hear Climber
82 Safedbel Porana paiculatua Climber 83 Bulgulab Rosa macheta Climber
84 Ranabel Vitis paruifalia Climber
85 Ghas Bromus Spp Grass 86 Dhelu Chrysopog Nmainttalius Grass
87 Bach Asorur calamustta Grass

WCS : EIA/EMP
48
88 Patera Tichha elephen Grass
89 Babad grass Eulaliopsis binnata Grass
90 Dhola grass Chrisopogon fulvus Grass The following crops & vegetables are grown in limited agriculture land 10.0 Km radius. Table No : 3.17 list of crops & vegetables
S.No Botanical Name Common Name
1 Triticum aestivum Wheat
2 Oxyza saliva Paddy
3 Brassoco comoistris Mustard
4 Seamays Corn
5 Sacchorum officinorim Sugar cane
Vegetables
6 Brassica oleraces Cabbage
7 Solaunum melongena Brinjal
8 Capsicum annuum Chilli
9 Chaseolus vulgoris Bean
10 Lucopersicum esculentum Tomato
11 Spinacea oleracea Palak
12 Solanum tuberosum Potato
13 Zingber officinale Ginger
3.11.5 FAUNAL STUDY (TERRESTRIAL FAUNA)
Ground surveys were carried out by trekking core and buffer zone for identification of
important animal groups such as birds, mammals and reptiles inhabiting the area.
For mammals sampling Information on recent sightings / records of mammals by the villagers
and locals was also collected from these areas. Trails which are currently under use can be
identified by following evidences:
By seeing fresh pugmarks.
By seeing fresh scrape marks on ground.
By seeing fresh fecal material, droppings, urine marks etc.
By seeing fresh landering (on tress along the path)
Above methods are applicable for following species –
S. No. Method Species for with applicable
1. Fresh pugmark Panther, lesser cats, porcupine, langur
2. Fecal material present on berm of path Panther
3. Urine marks Langur, hare
4. Lardering Leopard
5. Dropping below huge trees Langur
For birds sampling: - To record the species of birds observed with the help of binoculars; field
guides and forest department.
For ‘Reptiles’ sampling: - to record the species of reptiles with the help of binoculars; field
guides and forest department.

WCS : EIA/EMP
49
3.11.6 The fauna in 10.0 Km the radius zone is as follows
Table No 3.18 List of fauna
S.
No
Common Name Zoological Name Schedule Migratory Occurrence
Mammals
1 Samber Cervus unicolor III Sanctuary
2 Spotted Deer Axis axis III Sanctuary
3 Barking Deer Muntiacus muntjak III Sanctuary
4 Ghoral Naemorhedus goral III Sanctuary
5 Rhesus maeaque Macaca mulatta II Sanctuary
6 Langur Presptisen entellus II Sanctuary
7 Jackal Canis aureus II Sanctuary
8 Jungle cat Felis chaus II Sanctuary
9 Indian hare Lepus nigricollis IV Sanctuary
10 Himalayan Plam Civet Paguma larvata II Sanctuary
11 Mongoose Herpest edwardii IV Sanctuary
12 Sqoorrel Fanamulers Sanctuary
13 Common yellow Scotophillus heaithi Sanctuary
14 Himalayan black bear Selenarctos thibetanus II Sanctuary
15 Leopard Panther pardus I Sanctuary
16 Asiatic lion Panthera leo persicus I Sanctuary
17 Black buck Antilope cervicapra I
18 Ibex Capra ibex
BIRDS
1 Jungle Babbler Turdoides striata IV Sanctuary
2 Black partridge Melanoperdix nigra IV Sanctuary
3 Blue jay Cyanocitta cristata IV Sanctuary
4 Common Coots Fulica atra IV √ Sanctuary/Lake
5 Common Mynas Acridotheres tristis IV Sanctuary
/nature
6 Drongos Dicrurus macrocercus IV Sanctuary
7 Hill crow Corvus brachyrhynchos IV Sanctuary
8 Green Pigeon Treron pompadora Sanctuary
9 Paradisefly gatpher Eutrichomyias rowleyi Sanctuary
10 Secret minivet Pericrocotus flammeus IV Sanctuary
11 White Checked bulbul Pycnonotus leucogenys IV Sanctuary
12 White Breasted
waterhen
Amaurornis phoenicurus Sanctuary
13 Red vented Bulbul Pycononotus cafer V Sanctuary/nature
14 Purple sun Bird Cinnyris asiaticus Sanctuary
15 Turtle doves Z. macroura IV Sanctuary
16 Crested Kingfisher Megacerayl lugubris IV √ Sanctuary
17 Common Kingfisher Alcedo atthis IV √
18 Red billed magpie Urocissa erythrorhyncha IV Sanctuary, R/F

WCS : EIA/EMP
50
19 Red walted lopwing Vanellus indicus Sanctuary
20 Magpies robin Copsychus saularis IV Sanctuary
21 Yellow Billed magpie Pica nuttalli IV Sanctuary
22 Red handed
Himalayan
Sanctuary
23 Yellow Warblers Dendroica petechia Sanctuary
24 Rose ringed parakeet Psittacula krameri IV Sanctuary
25 Night Jar Caprimulgus europaeus Sanctuary
26 Striated Starling Aplonis striata IV Sanctuary
27 Red jungle fowl Gallus sonnerati III Sanctuary
28 Spotted dare Sanctuary
29 Whistling thrush Myophonus horsfieldii IV Sanctuary
30 laughing thrush Paradisaea minor IV Sanctuary
31 Little egret Egretta garzetta IV √ Sanctuary / River
32 Owl Bubo bubo IV Sanctuary
33 Koel Endybnamys scolopacea IV Sanctuary
34 Blue Rock Pigeon Columba livia IV Dadahu
35 Swallows Sanctuary
36 Golden orial Oriolus oriolus Sanctuary
37 Indian Weaver bird Ploceus philippinus Sanctuary
38 Cheel Haliaetus Leucogaster I
39 Vulture Gyps indicus I
40 House crow Corvus spendens IV
41 Parrot Psittacula himalayana IV Sanctuary
42 Pahari bulbul Pycnonotus jocosus IV Sanctuary
43 Chakor Alectoris graeca Study area
44 Laughing Dove Streptopelia senegalensis IV √ Sanctuary
45 Great Cormorant Phalacrocorax carbo IV √ River
46 Little Cormorant Phalacrocorax niger IV √ River
47 Great Egret Casmerodius albus IV √ River
48 Black Kite Milvus migrans All over
49 House Sparrow Passer domesticus IV study area
50 Black Bulbul Hypsipetes leucocephalus IV Sanctuary
51 Himalayan Bulbul Pyconotus leucogenys IV All over
52 Cheer pheasant Catreus wallichii I Sanctuary
AMPHIBIAN
1 Tortoise Geochelone elegans IV
2 Frog Rana tigrina IV
REPTILES
1 Himalayan Tiger Sanctuary
2 Common Ind. Croote Sanctuary
3 Indian Cobra Naja naja II Sanctuary /
fields
4 Indian contno Varanus monitor II Sanctuary /

WCS : EIA/EMP
51
(Monitor) Lizard fields
5 Indian Garden Lizard
Calotes versicolor All over
6 Himalayan Rock
Agama
Laudakia himalayana All over
7 Russell’s Viper Vipera russelii II Rocky slopes
FISH
1 Muhasho - Sanctuary
2 Mirrorcrap Cyprinus carpio Sanctuary
3 Gooch - Sanctuary
4 Eale - Sanctuary
3.11.7 Conservation and management plan, Management Level Approach, Awareness
programme, Funds for flora and fauna management plan, evaluation & monitoring, monitoring
arrangement of flora and fauna in detail are described in wild life conservation plan placed as
Annexure No XI-D.
3.12.0 Socio Economic Environment in core zone & buffer zone
The socio-economic survey was conducted during the period 2011-12. The economic conditions
in villages prior to start of mining activities were very poor. Most of people were below the
poverty line. The major segment of occupation was agriculture followed by direct and indirect
employment in mines nearby.
3.12.1 Demography and Socio-Economics
The growth of mining sector and infrastructure developments in and around the agriculture
dominant areas, villages and towns is bound to create its impact on the socio-economic aspects
of the local population of the area experiencing development. The impacts may be positive or
negative depending upon the developmental activity. To assess the anticipated impacts of the
mining growth on the socio-economic aspects of people, it is necessary to study the existing
socio-economic status of the local population, which will be helpful for making efforts to
further improve the quality of life in the area under study. For the above purpose the required
data has been collected from various secondary sources and analyzed.
3.12.2 Methodology Adopted for the Study
The methodology adopted for the study is based on the following:
• Review of secondary data, such as District Primary Census Statistical Hand Book of Sirmour
district, 2001 within the study area around the existing mine (Annexure No XVI)
• Conducting Focus Group discussions in the villages for eliciting the general information of the
study area, to support or supplement the information collected through secondary and primary
surveys and filled socio economic survey formats.
3.12.3 Review of Demographic and Socio-Economic Profile - 2001
The sociological aspects of this study include human settlements, demography, social status
such as Scheduled Castes and Scheduled Tribes and literacy levels besides infrastructure
facilities available in the study area. The economic aspects include occupational structure of

WCS : EIA/EMP
52
workers. The information on socio-economic aspects of the study area has been collected from
secondary sources, which mainly include District Primary Census Handbook 2001 Sirmour
districts and the latest census records available at the village level. Socio economic status based
on primary study in core zone & buffer zone (10.0 Km area) was done. During study period FAE
& his team filled Formats and discussed with villagers, local government officials. The details
are summarized below.
1. Types of family
Single Small Joint Joint +
0 40 60 0
0% 40% 60% 0%
A household is usually a group of persons who normally live together and take their meals from
common kitchen unless the exigencies of work prevent any of them from doing so. Persons in
household may be related or unrelated or a mix of both. 60% families are joint and 40% families
are nuclear. The people are interested to live in joint family.
2. Caste of the family
General OBC SC ST
48 04 48 0
48% 4% 48% 0%
3. Educational standard of family members.
5th
standard 6th
– 10th
10-12th
Graduates Post Graduates
21 47 16 12 4
21% 47% 16% 12% 4%
The highest education standard of family members is 6th
-10th
class which is present in 47%
families.
4. Types of house
As per buffer zone study of the area 3 types of housing structures are observed.
1) Pucca house made up of stone/brick and cement with concrete roof.
2) Kuccha house, are the houses made up of stone and mud with slate roof.
3) Mixed houses that are made up of stone/brick with cemented walls and slate/tin
roofs
Kacha Mix Pakka
32 35 33
32% 35% 33%
35% families have both types of house kachha and pacca in the 10.0 Km study area.
5. Electricity in the houses
Availability no availability
96 04
96% 4%
The 10.00 K.M study area is 100% electrified but only 4% families are unable to pay electricity
bill so they have not taken the electricity connection.

WCS : EIA/EMP
53
6. Source of drinking water for family members.
From
municipality
Well Tube well River Natural source
29 4 0 19 48
29% 4% 10% 19% 48%
48% families are taking drinking water from natural sources & 29 % from municipality
7. Source of income: - Agriculture is the main occupation of the people of the study area and
also the primary and most important source of income. Overall socio-economic study shows
that the region has a very good nutrient rich alluvium soil with high fertility. Most of the area
falling in the submergence zone has a well developed irrigation system with water channels
drawn from the natural springs through the pipes. Sprinklers can also be seen in many of the
villages. Due to steep slope mostly terrace farming is carried out. The people of the region
cultivate two crops/year. Wheat, Maize and Paddy are the major cereal crops of the region with
ginger, potato, tomato, garlic and Chilly are the main cash crop of the region. Most of the
local villagers are depending on the agricultural, mining activities, Construction & animal
husbandry. Average income of the family is Rs 3000-3500 / month .The average size of the
family is 5 to 7 persons.
8. Health: - The health status of the local villagers is good as only 26 % of the total population
suffer from seasonal diseases.
9. Migration: - Most of the Local villagers are engaged in the mining works but 14 % persons are
going outside the native place for employment.
10. Living standard: - The economic condition in 10.0 km buffer zone, prior to start of mining
activities, was below average. Most of people were below the poverty line. After start of mining
the average income has increased many folds which is reflected by their living standard,
construction of Pacca building & increased number of vehicles, L P Gas, mobile phone in the
area.
11. Public buildings, places of worship and monuments:-
There are no houses, public building, temples & historical places within the M.L area. Temples,
schools & public buildings are more than 1.0 Km away from the M.L area and seen in villages
Nera Baga & Bharwana.
12. Animals husbandry:- Normally local villagers depend upon Cows, Buffalo, Sheep & goat .
Villagers are generating daily income from these animals.
13. Savings:- Due to mining Local villagers are engaged in the mining activities There living
standard has increased due to employment and total 42 % families within 10.0 km study area
are saving money.
14. Family assets:-For assessing the family condition as per movable (material) assets
information has been taken from the MAFs. It shows that People own television sets, tape,

WCS : EIA/EMP
54
radio, LPG connections and refrigerator. But few individuals populations have two wheeler and
4 wheeler vehicles.
15. Information on agricultural situation (land holding size, cropping pattern, productivity, net
return etc: - In the 10.0 K M area -40 % land is used for agriculture.
16. Expenditure Pattern: - Expenditure pattern has a direct link with the socio-economic status
of a person. As a part of socio-economic study (SES) the information about the item wise
expenditure has also been collected. Though most of the respondents were not in position to
provide accurate information about the expenditure pattern, several queries were made about
their income and income sources to arrive at monthly income It is observed that the major
expenses are made on food, clothing, housing, feast and festivals, medical aid, education etc.
Due to geographical conditions the study areatake average of two crop in a year. The wheat,
Maize are the important cereal crops of the region and they are enough for at least for their
daily consumption. The people of the area also grow cash crops like Chilies, Potato, Garlic and
Ginger which are the most important source of their income. The common crops and vegetables
grown are detailed below:
17. Dependency on Natural Resources
In rural area, especially in hills which are very rich in natural resources people are dependent
on them to carry out their daily work. Forest, Giri river, Nallas & springs with its tributaries
play major role in the study area in day to day work. They depend largely on forests for fuel and
fodder. As per the household survey carried out, all people go to the forest for collection of fuel
wood & fodder. The yield of crop per hectare is given below for the nearby area within buffer
zone:
a- Wheat - 3.6 tones / ha
b- Maize - 4.8 tones/ha
c- Ginger - 4.8 tones/ha
d- Potato - 4.8 tones/ha
e- Chillies - 0.7 tones/ha.
S.No Common Name
1 Wheat
2 Paddy
3 Mustard
4 Corn
5 Sugar cane
Vegetables
6 Cabbage
7 Brinjal
8 Chilli
9 Bean
10 Tomato
11 Palak
12 Potato
13 Ginger

WCS : EIA/EMP
55
Irrigation: - Rainfall is the most important source of water supply for the agriculturists. The
traditional method of carrying water from the rivers/ nallas to field is through guls (channels)
cut along the contour of the land. A small temporary dam is laid across the stream to divert the
water into gul .The cultivators themselves provide sources for irrigation. The government have
also helped them financially to construct individual or community guls (Channels), Hauz and
small reservoirs for irrigation .
18 Financial status of the land owners
Prior to mining they were depending on
1. Cultivation
2. Cattles for milk
3. work outside as construction labour
4. Agriculture labour
19 Awareness and Opinion about the project
• The respondents from almost all the villages are aware about this project activity.
• The respondents have mixed view about the project. Most of the respondents have opinion
that due to existing project activity, economy of the villages will be improved and some of them
have a fear about the increased solid waste ,change in water quality , noise & vibration ,Air
pollution and change in soil quality in the environment which may damage the crop yield. Some
fear that water shortage in the region will increase due to the requirement of water and other
associated activities.
• Due to existing project, the respondents from the surrounding villages show favorable
opinion about activity as it may lead to increase in infrastructural facilities, job opportunities
and business opportunities.
• The educated youths opined that the management will give preference to them/ local
people for employment as per their educational ability.
Attitude of study area families
Questions Yes (%) No (%) Do you know about the Mining in the area? 95.0 5.00 Are you in favour of Mining 88.0 12.00
20 Family Structure – Type and size of the study area
The family size and structure is a powerful means of socialization and an agency of informal
social control. An average family consists of the husband, wife and their unmarried children.
The size of family is confined one to fifteen members only. In terms of mean average family has
4-7, say five members only. As per 2001 census the study area consisted of 25783 persons. The
distribution of population in the study area is given below. The males and females constitute
50.91% and 49.09 % of the study area population, respectively (Census 2001).
Human Settlement: The study area comprises 60 villages with population of about 25783
(Male- 13084 & female – 12699) and number of households are 4219. (According to the Census
Book – 2001).

WCS : EIA/EMP
56
Table No 3.19 The distribution of population in study area is presented below.
Particulars 0-03 Km 03-07 Km 7-10 Km 0-10 Km
No. of Households 1144 1806 1269 4219
Male Population 3749 5473 3862 13084
Female Population 3593 5322 3784 12699
Total Population 7342 10795 7646 25783
Male Population(0-6 Years) 738 878 589 2205
Female Population (0-6 Years) 690 920 600 2210
Total Population (0-6 Years) 1428 1798 1189 4415
Average Household Size 6.4 5.9 6.0 601
% Of males to the total Population 50.91 51.07 50.69 50.91
% of females to the total Population 49.09 48.93 49.31 49.09
Sex Ratio (no of females per 1000
males)
958 972 979 970
The configuration of male and female indicates that the males constitute about 50.91 % and
females 49.09 % of the total population as per 2001 census records. The sex ratio i.e. the
number of females per 1000 males on an average is 970 females as per 2001 census in the
study area.
3.12.4 Caste Categories
Social stratification on the basis of caste is very much prevalent in our society from the
date back to the history. In the mountainous region, the population from general/upper
castes is richer than SCs in terms of land and livestock from days back to the times of local
kingdoms. As per the classification under our constitution castes are divided into 4 major
groups i.e., General, SC, ST and OBC as per their social status. No schedule tribe family exists in
the area .Most of the population follow Hindu religion.
Table No 3.20 Distribution of population by social structure
Particulars 0-3 km 3-7 km 7-10 km 0-10 km
Schedule caste 3634 4763 3226 11623
% to the total population 49.50 44.12 42.19 45.08
Schedule Tribes 0 0 1 1
% to the total population 0.00 0.00 0.01 0.003
Total SC and ST population 3634 4763 3227 11624
% to total population 49.50 44.12 42.20 45.083
3.12.5 Literacy Levels
The study area experiences a considerably low literacy rate of 51.19% (2001). The distribution
of literate and literacy rate in the study area is tabulated below.

WCS : EIA/EMP
57
Table No 3.21 Distribution of literate and literacy rates
Particulars 0-03 km 03-07 km 07-10 km 0-10 km
Male population 3749 5473 3862 13084
Female population 3593 5322 3784 12699
Total population 7342 10795 7646 25783
Male population (0-6years) 738 878 589 2205
Female population (0-6 years) 690 920 600 2210
Total population (0-6 years ) 1428 1798 1189 4415
Male literates 1983 3353 2488 7824
Female literates 1292 2337 1746 5375
Total literates 3275 5690 4234 13199
Male literacy rate (%) 65.86 72.97 76.01 71.92
Female literacy rate (%) 44.54 53.09 54.86 51.24
Total literacy rate (%) 55.38 63.24 65.57 61.77
The male literacy i.e. the percentage of literate males to the total males of the study area works
out to be 71.92 % in 7-10 km radius and lowest 65.86 % in 0-3 km radius. The female literacy
rate, which is an important indicator for social change, is observed to be 51.24 % in the study
area as per 2001 census records. The main workers works are 44.09% of the total population.
The marginal workers and non-workers constitute 15.90% and 40.00 % of the total population
respectively. The distribution of workers by occupation indicates that the non-workers are the
predominant population. The occupational structure of the study area is given below.
Table No 3.22
Particulars 0-3 km 03-07 km 07-10 km 0-10 km
Total population 7342 10795 7646 25783
Total workers 4425 6524 4520 15469
Work participation rate (%) 60.27 60.44 59.12 60.00
Total main workers 3267 4891 3212 11370
% of main workers to total population 44.50 45.31 42.00 44.09
Marginal workers 1158 1633 1308 4099
% of marginal workers to total population 15.77 15.13 17.11 15.90
Non-workers 2917 4271 3126 10314
% of non- workers tit ital population 39.73 39.56 40.88 40.00
3.12.6 Infrastructure Facilities
The infrastructure and amenities available in the area denotes the economic well being of the
region. The study area as a whole possesses poor to moderate level of infrastructure facilities.
However, in comparison with the facilities available in other parts of the districts, this area
enjoys higher level of amenities like education, health, drinking water, electrification, transport
and communication network. A review of infrastructure facilities available in the area has been
done based on the information.

WCS : EIA/EMP
58
3.12.7 Educational Facilities
In order to make the education profile more informative the MAPs have been grouped into
eight educational categories i.e., illiterate, literate, primary, HS, Intermediate, Graduate/PG,
others (includes technical education such as Hotel Management, Poly technique, ITI etc.) and
those below the age of 5 years. The general trend in the MAVs (Marginal Affected Villages)
shows that the younger population is almost 100 % literate, whereas the majority of illiterates
are in the 60+ age group.The educational facilities are evenly distributed in the area. In all,
there are 48 primary schools, 12 Middle Schools, 4 secondary schools and 2 adult literacy
centers in the study area. The available educational facilities in the area as per 2001 district
handbook are given below.
Table No 3.23 Educational facilities in the study areas
Sr. No. institution Total
1 Primary schools 48
2 Middle schools 12
3 Secondary schools or matriculation 4
4 Adult literacy class/ centre 2
3.12.8 Health and nutritional status
Health status of the people, in general, determine the average expectation of life, number of
persons in the productive age group, production, productivity, earning capacity,
employment and family welfare. The determinant factors of health status include food,
nutrition, hygiene, medical facilities, and socio-cultural implications of health, environmental
aspects, education and psychology . The health status is manifested in general in the form of
prevalent infant mortality rate, life expectancy, morbidity, maternal mortality, level of fertility
and mortality etc. Besides this, the health status is connected to the hygienic conditions and
nutritional status of the person concerned. The hygienic condition can be understood in terms
of personal hygiene, domestic hygiene, environmental hygiene and the community hygiene
while the nutritional status denote the quality and quantity of the staple food, pulses, oil seeds,
milk products, vegetable, flesh food and drinks.
The information gathered in regard of the general appearance of the MAP, their hygienic
conditions and also of the dietary pattern shows that on an average MAP is living in a hygienic
and healthy condition. Thus their health statuses is good. Generally, the people suffer from
minor problems like eye and skin ailments and normal cold and fever. Proper medical aid
facilities do not exist. Mostly the people have deep faith in their ages old health care
practices. Health facilities in the study area is given below in table No 3.22
Health Facilities -Table No 3.24
Sr.
no.
institution Number of institutions in study area
1 Primary Health center 2
2 Community Health Workers 6
3 Health center 1
4 Medical facilities 9
5 Primary health center sub centers 2
Source :- District census hand book of Sirmour 2001

WCS : EIA/EMP
59
Table No 3.25- Details of human settlement and population in the Tehsils are given below
S.
No
Name of
Tehsils
House
hold
Population Schedule cast Literacy
Male Female Total Male Female Total Male Female Total
1 Dadahu(S.T) 2900 7858 7580 15438 2546 2413 4959 5409 3915 9324
2 Pachhad(T) 8745 23842 22178 46020 9414 8750 18164 18421 13488 31909
3 Renuka(T) 6271 20521 19601 40122 8548 8296 16844 11282 7353 18635
Table No 3.26- Distribution of male and female and literacy in Tehsils
S No. Name of Tehsil Population % Literacy %
Male Female Male Female
1 Dadahu(S.T) 50.90 49.10 58.01 41.99
2 Pachhad(T) 51.81 48.19 57.73 42.27
3 Renuka(T) 51.15 48.85 60.54 39.46
3.12.9 Live stock population as per 2001-02
The livestock is the major part of the economy of rural areas as they depend on them for milk,
wool, meat, ploughing and transportation. Same is the case for the people of surrounding
villages.
Table No 3.27
Cattles 31 on every 100 population
Poultary population 54 on every1000 population
Comparatively there are no significant social problem exists in the study area.
----------------
WCS : EIA/EMP
60
4.0.0 CHAPTER IV
ANTICIPATED ENVIRONMENT IMPACTS AND MITIGATION MEASURES
4.1.0 INTRODUCTION
Opencast mining activity causes some adverse impacts on the surrounding environment unless
proper environmental management plan is adopted. Selecting suitable sites for mining and also
adopting all the guidelines prescribed by the ministry of Environment and Forest can minimize the
major impacts. In this chapter, an attempt has been made to quantify the possible environmental
impacts and recommend mitigation measures to improve the environment.
4.2.0 AIR ENVIRONMENT
4.2.1 The air dispersion modelling study for the Sangrah Limestone Mine was carried out to assess
the possible impact on air quality with respect to suspended particulate matter.The mining
operations will be mechanized, involves shallow drilling by jack hammers, blasting, JCB excavator and
dumper combination for loading and transportation. The wastes will be dumped in the non-
mineralized zone within the mining lease area.
4.2.2 Dispersion Model Details
The impact of suspended particulate matter on ambient air quality from of the proposed soapstone
mine was modelled using US EPA ISCST3 - Industrial Source Complex – Short Term Model (Version
02035). The ISCST3 model is capable of handling multiple sources, including point, volume, area and
open pit source types. However, in the present scope the model was used for area source type
because of the operations on and above the ground.
4.2.3 Area
The ISC AREA source algorithms were used to model low level releases with no plume rise from the
topsoil and over burden storage piles. The ISC uses a numerical integration approach for modelling
impacts from area sources.
4.2.4 Model Input Parameters
Meteorological Data ,The hourly micro-meteorological parameters were recorded near the proposed
mining site continuously for three months through April 2012 to June 2012. Besides the site specific
hourly meteorological parameters like wind direction, wind speed, ambient temperature, additional
derived parameters like atmospheric stability and mixing height were also applied in the model.
Other parameters were estimated or obtained from the secondary sources as discussed below:
4.2.5 Atmospheric Stability Classes
The required hourly Pasquill – Gifford Stability Classes were determined using Turner’s method and
solar isolation as per the provisions described by Central Pollution Control Board1, Delhi. The
reference longitude and latitude for the estimation of solar insulation were 77o26’10” and 30
o41’23”
respectively.
4.2.6 The mixing height information for the above mentioned location was obtained from the mixing
height contours publication by India Meteorological Department.

WCS : EIA/EMP
61
4.2.7 Source Data
The activities identified resulting in to air pollution is mainly blasting, drilling and material handling.
These activities primarily generate suspended particulate matters. The source of gaseous emissions
will be from the blasting, excavator, compressors and dumpers on the site. Considering that the
excavator, compressor and dumpers will comply with the ‘pollution under control’ norms, dispersion
modelling of gaseous emissions was excluded in the study.
As per the mining plan, the identified areas of emissions within the mining lease area were:
• Mining Zone
• Overburden Stockpile
• Road Transfer Network
The review of mining operation specifies the following source/point of suspended particulate matter
emissions which were considered in the preparing the emission inventory for the modelling study –
1. Drilling
2. Blasting
3. Overburden Removal
4. Material Handling
5. Wind Erosion of Stockpile Surfaces
4.2.8 Emission Factors/Inventory
The emission factor relating to the above sources are given in Table 4.1. The calculation details are
enclosed.
Table: 4.1 - Emission Factor Suspended Particulate Matter (≤30µm)
There will be 280 working days in a year and the mining activities will be carried out in a single shift of
8 hours during daytime – the variable emission rate options were used accordingly.
4.2.9 Modelling Scenarios
The following conditions were considered as the worst case scenario while estimating the load factor
in the model inputs
• Mining Activity: The mining activities include drilling, blasting, overburden removal and material
handling i.e. loading, transfer and unloading. Since these activities are proportional to the mine
production, the year with maximum estimated production out of initial five years. For the
modelling, the peak production of 289 tonnes per day was assumed and the maximum quantity of
generated waste per day was considered to be 57 tonnes.
Activities Suspended Particulate Matter (≤30µm) emission factor
Blasting 69.71006 kg/blast
Drilling 0.59000 kg/hole
Material Handling OB 0.00242 kg/t
Limestone 0.03695 kg/t
Transportation Dumper 2.02103 kg/KVT
Wind Erosion OB 0.04947 kg/m2/year

WCS : EIA/EMP
62
• OB Stockpile: The dimensions of the full scale stockpiles of overburden at the end of the fifth year
were considered to calculate particulate matter generated due to wind erosion.
• Transportation: The transportation network within the mining lease area was considered as area
source instead of the line source because of the close mess and continuous movement of the
vehicles on these roads.
The dimensions considered for the above area sources in the model are given in Table 4.2
Table: 4.2 - Area Source Dimensions
Area Length, m Width, m
pitA 150.00 35.00
pitB 150.00 45.00
OB DumpA 140.00 50.00
OB DumpB 150.00 70.00
Road 500.00 10.00
Blasting 8.00 7.50
Drill 3.00 3.00
4.2.10 Results and Discussions
The modelling results and isopleths are presented below:
The estimated 24hourly maximum ground level concentration of PM (≤30µm) was 15µg/m3at 500m
in South east with respect to mining zone. The isopleth of the predicted particulate concentration
because of the collective operations within the mining zone is shown in Figure below .The 24hrly
incremental GLC of PMat the ambient air quality stations are presented in Table below.
Fig No : 7 - 24hourly Isopleth of Predicted Concentration of PM (≤30µm)
Rerli BorliGarag nala
Palor K
a Kh
ala
V
V
V
V
V
V
VV
V
V
V
V
V
V
V
V
V
V
V
V
V
8.5
0Km
.
Sangrah
Kalth
Barag
Khundwari
DADARF
Koriyana
Jainchha
Ganog
Nerabeg
Rajana
Bagh
Sainj
Jabrog
Banithian
Andheri
Kashlog
Koti
Bhatan
Gatlog
Palor
? A4
?A7
?A3
?A8
? A5?A2
?A9

WCS : EIA/EMP
63
Table:4.3- Predicted 24hourly Concentration of PM (≤30µm) at Ambient Air Quality Monitoring
Stations because of Mining Activities
Station Code Predicted Particulate
Matter (≤30µm), µµµµg/m3
Measured 95%tile
PM10 Conc., µµµµg/m3
A1 4.38 69.7
A2 1.54 69.8
A3 0.10 69.3
A4 0.04 67.7
A5 0.07 71.6
A6 0.03 72.5
A7 0.07 68.7
A8 0.05 68.6
A9 0.33 71.1
4.2.11 Conclusions
It is evident from that the major sources of particulate matter emission are blasting and
transportation within the mining lease area. However, blasting contributes significant amount of
particulate matter into the atmosphere but the impact due to haul road transportation was found to
be comparatively significant. This is because of the limited intermittent blasting (max one) in a day.
While interpreting the model results, please be advised that the predications were made based on
the worst case scenarios which are unlikely to occur during the mining period. Further, the
considered emission factors applied to the uncontrolled emissions and therefore the applying dust
suppression control measures especially to the haul roads will further reduce the particulate
concentration in real-time.
The predicted concentrations are Suspended Particulate Matters2 having particle size ≤30µm, which
includes PM10 fractions; therefore, the PM10 concentration will be less than the predicted
concentrations.
Emission Factor/Inventory Calculation Sheet Year s 5.0
Wor king Days/year 280.0
Wor king Hour s/day 8.0
Dr ill hour s/day 5.0
Tot al Hour s/year 11200.0
2 PM10 modelling requires minimum one year meteorological data.

WCS : EIA/EMP
64
Material Handling
Mean vehicle speed 8 km/h
Road surface silt loading 8.5 g/m2
Drop distance 0.5 m
Mean vehicle weight 14 tons
Avg distance travelled within mining area 27 km/day/vehicle
Moisture Content 10 %
Vehicle Gross Mass 20 tons
Blasting
Area blasted 60 m2/day
Depth of blast holes 10.5 m
Quantity of ANFO 85 kg/day
Number of blast 1 per day
Drilling
Drilling (Jackhammer) 20 hole/day
Drilling (Wagon) 5.4 hole/day
Overburden
OB Quantity 57 tons per day
OB Silt Content 5 %
OB Density 1.55 kg/m3
OB Moisture Content 1.4 %
Topsoil
Topsoil Quantity 0 tons per day
Topsoil Silt Content 30 %
Topsoil Density 1.15 kg/m3
Topsoil Moisture Content 8 %
Mineral
Mineral Quantity 289 tons per day
Mineral Silt Content 2 %
Mineral Density 1.4 kg/m3
Mineral Moisture Content 0.2 %
Meteorology
number of rainy days with measurable >0.25mm 75.5 day
mean wind speed 2.6 m/s
Time in the year with unobstructed wind speed >19.3km/h 2.47 %
Machine Power (total)
Dumpers 4015 HP
JCBs 130 HP
Jack Hammers 15 HP
Wagon drillers 15 HP
Area Length Width Height
pitA 150.00 35.00 70.00
pitB 150.00 45.00 30.00
OB DumpA 140.00 50.00 10.00
OB DumpB 150.00 70.00 10.00
Road 500.00 10.00 0.00
Blasting 8.00 7.50 0.00
Drill 3.00 3.00 0.00
Dimension, m
Blasting pitA 69.71 kg/day
Drilling pitA 14.99 kg/day
Material Handling Topsoil pitA 0.00 kg/day
OB pitA 0.14 kg/day
Limestone pitA 10.70 kg/day
Transportation Dumper 54.57 kg/day
Erosion OB 2.41 kg/day
pitA = active mining zone

WCS : EIA/EMP
65
4.2.12 Anticipated impacts
Ambient air quality measured in the core & buffer zone is reflection of mining activities not due to
Sangrah limestone mine alone but also due to concurrent mining and other activities of the buffer
zone, traffic on the road passing through the ML and other activities in the adjacent villages.
However, the mining activities are not going to cause any adverse impact since the incremental
increase and predicted PM10 at the nearby villages are within the norms of the residential area.
4.2.13 Control measures
Following are the control measures proposed:
(i) Wet drilling is proposed to reduce the dust generated from it.
(ii) Water sprinkling will be done on haul roads, waste dumps so that dust will be settled down,
and will reduce generation of dust.
(iii) The breaking of minerals will be done manually and since the mineral is also moist practically
there will be negligible dust generation.
(iv) Transportation of mineral will be done on Tarred road and trucks will be covered by tarpaulin
which will reduce air pollution, predicted.
(v) Regular maintenance of machinery and vehicle will be done to check the excess emissions. A
system of regular overhauling of dumper & excavators, after specified hours of working shall
be evolved and observed to avoid generation of obnoxious fumes.
(vi) Greenbelt with tall trees are planted. It will absorb the particulates and reduce the
concentration of SO2, NOx .
(vii) Plantation in safety Zone will also protect the soil from wind erosions.
(viii) Cultivation of grasses on dumps will reduce wind erosion.
(ix) Personnel protective equipments will be provided even to the women workers also who are
facing dust during loading & unloading of minerals
4.3.0 Noise & vibration
4.3.1 Mining activities, locations, used equipments, type of equipment, schedule of operations like
drilling, blasting, excavation, breaking of mineral, loading of mineral & OB, transportation of mineral
& o/B & unloading of O/B has been discussed in detail in mining plan approved by IBM and
accordingly plans have been prepared.The cumulative impact of operations of machines for noise &
vibration in the area will not be concentrated at one place, all machines will not be operated at a
time, the impact of noise & vibration will not be on all the places at a time.
Table: 4.4 - Showing Noise level of mine after prediction effect
S.
No
Sample site Distance
s in K.M
Directio
ns
Ground
level noise
dB(A)
Noise
emission in
dB(A)
Remarks
1 Bhootmari ---- ---- 54.141 2-3 Will reduce due to
attenuation
practices & wind
dispersion etc.
2 PWD road near Barag
Village
0.50 SSE 52.577 1-2
3 Sanghara lease area 2.50 W 54.576 1
4 Kundwari Village 0.52 NNE 52.505 1
5 Sanghara to Renuka
Ji PWD road
3.27 WSW 53.559 1

WCS : EIA/EMP
66
6 Renuka sanctuary
boundary
8.65 S 52.301 1
7 Kaith Village 4.83 SW 52.812 1
8 Koriyana Village 3.15 NW 52.158 1
9 Sangrah Village 2.50 W 52.845 1
Table No. 4.5 Activity Linked Noise
S.
No
Activity Source Location Timing /
duration
Noise
(dBA)
Exposure Mitigative
measures
1 Drilling Wagon drill (1)
& compressor
(2), Jack
Hammer (2)
Within pit
(staggered)
6-7 hours 75-80
(max)
Drill operators
& helpers
with ear muffs
2 Blasting Blasting
material, ANFO
detonators (25
holes/day)
Within pit
(staggered)
1/2 hour/ rest
hour/day time
75-80
(max)
Blaster &
blaster helpers
with ear muffs
3 Excavation Excavator (1) /
JCB(1), dumper
(5)
Within pit
(staggered)
7 hous with
intermittent
break
75-80
(max)
Excavator /
dumper
operator
/helper
with ear muffs
4 Breaking of
mineral
Rock
breaker/manual
breaking (900
tonne/day)
Within
/outside
Staggered
6-7 hours
60-65
(max)
Face workers with ear muffs
5 Loading of
mineral &
OB
Truck/dumper/
excavator/JCB
(1000
tonne/day)
Within pit
(staggered)
short 70-75 Loader
operator
/dumper
operator/help
er
with ear muffs
6 Transportat
ion of
mineral &
overburden
Truck/dumper
(15)
Road/
staggered
intermittent 70-75 Truck &
dumper
operator &
helper
Cabins in
machines /
supporting
belts
7 unloading
of O/B
Truck/dumper
(40 cum/day)
Dumping
site
Short/intermitte
nt
70-75 Spotter/dump
er operator
with ear muffs
All the above activities will not be concentrated at one place therefore the noise generated will
reduce. Hours of operation of all the machineries will also be not more than 7 hours and activities will
be staggered further the persons subjected to noise level will not receive noise pollution
continuously.
4.3.2 Model for Sound Wave Propagation during Operation:- For an approximate estimation or
dispersion of noise in the ambient air from the point source, a standard mathematical model for
sound wave propagation is used. The noise generated by equipment decrease with increased
distance from the source due to wave divergence. An additional decrease in sound pressure level
with distance from the source is expected due to atmospheric effect or its interaction with objects in
the transmission path.

WCS : EIA/EMP
67
For hemispherical sound wave propagation through homogenous loss free medium, one can estimate
noise levels at various locations, due to different sources using model based on first principles, as per
the following equation:
Lp2=Lp1-20Log (r2 / r1) – AE - AM (1)
Where,
Sound Lp2 and Lp1 are the Sound Pressure Levels (SPL) at points located at a distances of r2 and r1
from the source. AE & AM are attenuations due to Environmental conditions (E) and Machine
correction (M). The combined effect of all the sources can be determined at various locations by the
following equation.
Lp(total) = 10Log (10 (Lpa)/10
+ 10(Lpa)/10
+ ((Lpa)/10
+ .............. ) (2)
Where Lpa, Lpb, Lpc
are noise pressure levels at a point due to different sources.
Machine Correction (AM):-The background noise level, when the machine is not in operation should
be determined at one or more locations while conducting the test. The readings at each location,
with the machine in operation should exceed the background levels by at least 10 dB in each pressure
level of interest. If the difference is less than 10 dB, correction should be applied. If the difference
between the measured sound and the background sound in any sound pressure level if less than 3 dB
a valid measurement of the machine cannot be made. In order to reduce background noise to
acceptable levels, it may be necessary to acoustically treat the equipment.
Environmental Correction (AE)
The equivalent sound pressure level can be calculated from the measured sound pressure level (Leg
measured ) = (Leg measured ) – K1 – K2
Where,
K1 = Factor for the background noise correction. The correction was not applied in this modeling
exercise, as it was not possible to measure the background noise levels by putting off machines.
Hence, it was considered as zero.
K2 = Environmental correction
Since the workings are scattered and also the operation of machineries are not continuous therefore,
impact due to mining and allied activities will not increase more than 5-10 Leq within the mining
lease and the impact in nearby villages will be negligible.
4.3.3 Industrial Noise Standards:-The OSHA has recommended permissible noise exposure limit for
Industrial worker which is based on 90 dB (A) for 8 hours exposure a day. The limits are given below:

WCS : EIA/EMP
68
Table: - 4.6 Permissible Exposure Noise Limits as per CPCB norms
Total time of exposure per day
in hours
Noise level in dB (A)
8 90
6 92
4 95
3 97
2 100
1 105
½ 110
¼ 115
The workers are not exposed to the above limits as prescribed by CPCB. Potential construction noise
impact can be minimized or avoided by imposing a combination of the following good site practices:
4.3.4 Grounds of impact
• Use of equipments and vehicles during the operations.
• Jack hammer and compressor will generate noise during drilling. Jack hammer & wagon drill
operators will also be subjected to vibration.
• Blasting will lead to the generation of noise and Vibrations. There is no building likely to be
effected by ground vibration generated due to blasting. Use of explosive at a time will also be less
and therefore vibration generated due to blasting will be minimum.
• Movement of vehicles at the time of transportation will generate noise. The operations of
machineries will be subjected to vibration
4.3.5 Identification & Assessment of Impacts –
These activities will not cause much problem as there is no human settlements within the lease area
and in close proximity to the lease area and other mitigative measures are proposed. The noise and
vibrations generated are short term and periodic and are within permissible limits. Hence, there will
be no impact due to noise level on hearing.
4.3.6 Mitigative Measures
• We are proposing plantation on both sides of road passing from mining lease area which will
provide noise barriers for point sources and line sources.
• Rock breaker is also proposed to reduce frequency of blasting.
• Cabins in machines & isolation of equipments.
• Quaterly monitoring of noise level will be done at the stations identified. Regular medical
examination of workers for audiometery as well as general health check ups will be done for the
operators of the machineries so that any impact due to vibrations of the machineries etc can be
detected.
• Use of PPE like ear muffs etc. by workers (women’s also) on duty will be ensured.
• Proper and timely maintenance of machines excavator, transport vehicle will help to check and
reduce sound nuisance as much as possible.

WCS : EIA/EMP
69
• Controlled blasting techniques will be used. Blasting will be carried out once in a day time for
very small duration, i.e. for few seconds only. Muffling will be adopted to reduce the impacts of
blasting.
• Proper mitigations will be taken to avoid wild animals, coming near the mining activities in search
of water and food. Fodder and water for these wild animals will be made available, away from the
mining areas.
4.3.7 Mitigative measures are proposed to avoid the following circumstances
� Due to noise & vibration it may affect the habitation, maturation of surrounding Biodiversity.
� As there is scarcity of water in the jungle (Renukaji wild life sanctuary which is about 8.5 km from
the lease area) so wild animals may come out in search of water & may be affected due to noise &
vibration and also may be hunted.
� It may affect health hazards of the workers and surrounding living creatures causing deafness in
ear, mental & physical imbalance in the body due to noise & vibration.
4.4.0 Water environment:- Assessment of the adverse impact and indicate the proposed mitigating
steps to abate the likely adverse impact relating to the following:
4.4.1 Impact on Water Environment
Surface water Flow
• Surface run off water through the mining pits, waste dumps, top soil stacks is likely to cause land
erosion & take silts with it to the surface water sources like polar ka khala, Garag ka Khala & Giri
River due to which silts are likely to be accumulated over the nalla & river beds. However there
will be no impact as the Limestone does not contain any toxic substance which can directly harm
to the Biotic or Abiotic components of the environment.
• Rising of nalla bed/ river bed may increase highest flood level.
• Water quality - The water will pass through broken lithlogical units, waste dump & its quality is
likely to affect. The OB and mineral are naturally occurring minerals and are nontoxic and
therefore there will be no toxicity in water.
Ground water flow
• People of the area does not depend on ground water, mining will be much above ground water
table. Since, water table which is deep i.e 30 m below the lowest working RL & mining will be
carried out much above the water table & therefore there will be no impact on ground water.
• The baseline study done for water flow & surface water quality does not show any impact of mining
and allied activities on water quality and quantity.
4.4.2 Mitigation measures
I- Garland Drainage/Earthen Mound:- In open cast mining pits as well as on dumps it is necessary that
the rainwater falling outside the edge limit of the working areas should not be allowed to enter into
the pit and workings. Therefore it is proposed to develop garlands drains for proper drainage of water
and a set of garland drainages will be made in the mining as shown in Plate No. VI. The water will be
accumulated at the lower most gradient by constructing siltation tanks/ loose stone check dams
which will act as siltation tank & water reservoir in the buffer zone. Silts will be regularly cleared from
the siltation pond / check dams.

WCS : EIA/EMP
70
ii- Surface Water :- Surface water is not likely to be affected since the nallas will be left as it is and will
neither be blocked nor diverted. All water drains from the pits will be constructed in such a way that
the water is drained to nallas through check dams before joining the main flow. The surface run off
water will be diverted away from mining pits and dumps through garland drains and water drains. No
natural water stream is disturbed.
iii- Erosion of land of mining pits and external dump :
In this area of steep topography the speed of run of water is very high and therefore, there is
possibility of land erosion of mining pits and external dumps in the form of land slides bench
collapses, bench failures .But the pits are designed to disallow the flow of rain water in the pits, and
safety precautions will be taken by disallowing the entry of workers during the rains . proper retaining
walls and parapet walls are proposed to control and counter the effect of rain water.
Proper drainage of water, benching & terracing of dumps will reduce land slides . At the toe of the
dump retaining walls will be provided so that erosion will be minimized. To reduce the speed of water
gully plugs will be constructed at appropriate places.
The ground water in hilly terrain goes very deep and does not have relevance. No spring occurs near
the mining pits and dumps. The expected depth of water table in this area is more than 50 m. The
depth of mining operations are very limited and ground water will not be intersected during mining.
4.4.3 Precautionary measures proposed for drainage courses
In this area there is one perennial Giri river & seasonal nallas like Garag ka khalla & polar ka khalla.
Due to mining activities it is anticipated that over burden and mineral fines flowing with water may
cause siltation and affect the flow of drainage courses in nallah. Mining activity and degradation of
land and subsequent flow of water is likely to disturb the drainage course. The quality of water
flowing in these drainages will also get affected.
Therefore to safeguard the existing drainages following precautions are proposed.
• Garland drains are proposed surrounding the mining pits, waste dumps and back filled areas. Even
vertical water drains are proposed so that from one bench to another bench water flows in a
controlled manner without causing the sliding of benches, dump, terraces, etc. Even during rains
these drainages will be regularly cleaned from the silts so that there is no obstruction to flow of
water.
• Mining activities are so planned that no drainage will be disturbed; a safety zone for each drainage
of 10-15 m will be left on both sides.
• The mining pits will be properly benched; and waste dumps will be properly terraced with
retaining walls at the toe so that there is no land slide during the rains.
• The benches of mining pits, terraces of waste dumps will have grass plantation during the rains
and if possible local cultivators will be allowed to grow vegetables and other seasonal crops so that
it will also reduce the land degradation and will provide additional income to the local people.
Cultivated land reduces the soil erosion and this aspect will be utilized for reducing the soil erosion
and also the effect of siltation on drainages.
• The over burden and mineral is non toxic and therefore not have any effect on quality of water
flowing in these drains.

WCS : EIA/EMP
71
• Check dams are already constructed so that speed of water flowing during rains does not increase
abruptly to cause land slide and degradation of land and these check dams will also works for
settlement of the silts before the clean water flows out of the lease area.
• Regular monitoring of quality of water and surface water flow in these drainages isproposed to
take care of adverse impact due to mining because these nallas ultimately fall in river Giri and
therefore along with silt.
• The other mines like bhootmarhi etc are operating in this area and water from several drainages /
nallas coming out of the other M.L areas in the rainy season ultimately falls in Giri river .Therefore,
there are possibilities of silts flowing to Giri river increasing nallah bed. Efforts are is required to
clear the silts during the rains and also after the rains.
• Regular monitoring of water quality / suspended particals in water during the rains will be made.
4.5.0 Land Environment
4.5.1 Upto the end of first five years, 5.0955 ha of the land will be degraded due to mining & allied
activities. The breakup of the land to be used due to mining & allied activities at the end of 5th
year
and end of lease period along with the existing scenario is given in table below.
Table – 4.7 Land use
S. No. Type of land use Present land
use
At the end of
5th year
At the end of
lease period
1 Area of excavation 0.8866 2.99 6.50
2 Storage for top soil 0 0 0
3 Waste dump 0.5260 0.89 0.65
4 Mineral/sub grade storage 0 0 0
5 Infrastructure (workshop,
administrative building etc.)
0.022 0.022 0.022
6 Roads 0.31 0.31 0
7 Railways 0 0 0
8 Green belt 0 0.8835 0.8835
9 Tailing pond 0 0 0
10 Effluent treatment plant 0 0 0
11 Mineral separation plant 0 0 0
12 Township area 0 0 0
13 Others (to be specified) safety
zone
0 0 0
Total 1.7446 5.0955 8.0555
14
Area which will remain
untouched
6.3104 2.96 0
Total 8.0555 8.0555 8.0555

WCS : EIA/EMP
72
Out side ML
S. No. Type of land use Present land
use
At the end of
5th year
At the end of lease
period
1 Waste dump 0.20 0.70 2.70
2 Infrastructure (workshop,
administrative building etc.)
0.10 0.10 0.10
3 Roads 0.50 0.50 0.50
4 Green belt 0.25 0.25 0.25
Total 1.05 1.55 3.55
Table:- 4.8 Land use pattern pre mining, mining operations (During life of mine & post mining at the
end of conceptual period)
At the
beginning of
the mining
Area
(ha)
During life of the
mine
Area
(ha)
Reclamation at the end of
life of the mine
Area
(ha)
Gair mumkin
Land
0 Mining with road &
ramps
6.50 Afforestation on ultimate
benches & road – ramps
5.50
Shamlati land 8.0555 Dumps (waste) 0.65 Back filling & afforestation 1.00
Infrastructures 0.022 Afforestation on waste
dump area
0.65
Green Belt 0.8835 Green belt 0.8835
Afforestation on area
vacated by infrastructure
0.022
Sub Total ( area
used)
8.0555 Sub Total (Afforestation) 8.0555
Area not disturbed 0 Area not disturbed 0
Total 8.0555 Total 8.0555 Total : 8.0555
Outside ML area we have obtained permission after grant of mining lease for construction of
approach road to the pit and construction of office complex which is about 0.6 hect.
Table : 4.9 Land utilized at the end of 5th
year (Area in ha)
Activity
Present Advancement Total
Mining 0.8866 2.1034 2.99
Road & ramps 0.3105 - 0.3105
Waste dump 0.5260 Vacated 0.286 ha = 0.6500 0.89
Infrastructure 0.022 - 0.022
Green belt 0 0.8835 0.8835
Total 1.7451 3.6369 5.096
Area not disturbed 6.3104 4.4186 2.9595
Total ML area (hect.) 8.05.55 8.05.55 8.0555
The waste dump area advancement would be 0.650 ha in first five years. However 0.286 ha area of
earlier dumps would be vacated and therefore net addition of 0.364 ha would be done for dumping.
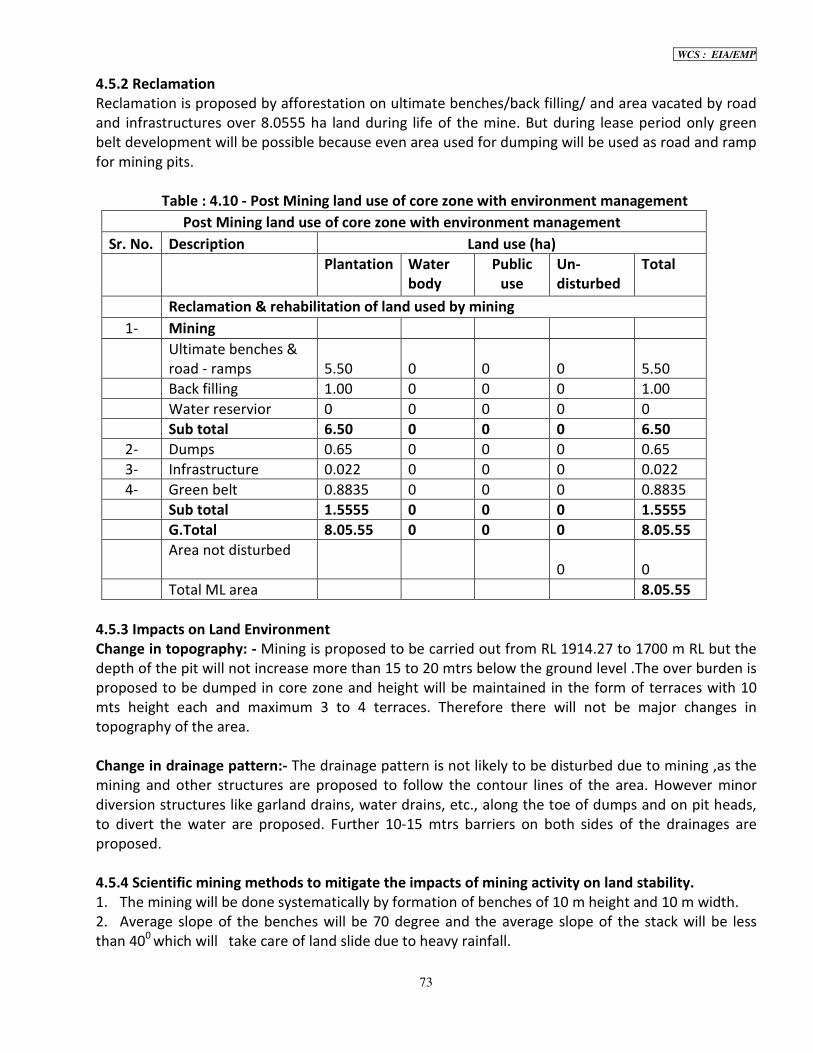
WCS : EIA/EMP
73
4.5.2 Reclamation
Reclamation is proposed by afforestation on ultimate benches/back filling/ and area vacated by road
and infrastructures over 8.0555 ha land during life of the mine. But during lease period only green
belt development will be possible because even area used for dumping will be used as road and ramp
for mining pits.
Table : 4.10 - Post Mining land use of core zone with environment management
Post Mining land use of core zone with environment management
Sr. No. Description Land use (ha)
Plantation Water
body
Public
use
Un-
disturbed
Total
Reclamation & rehabilitation of land used by mining
1- Mining
Ultimate benches &
road - ramps 5.50 0 0 0 5.50
Back filling 1.00 0 0 0 1.00
Water reservior 0 0 0 0 0
Sub total 6.50 0 0 0 6.50
2- Dumps 0.65 0 0 0 0.65
3- Infrastructure 0.022 0 0 0 0.022
4- Green belt 0.8835 0 0 0 0.8835
Sub total 1.5555 0 0 0 1.5555
G.Total 8.05.55 0 0 0 8.05.55
Area not disturbed
0 0
Total ML area 8.05.55
4.5.3 Impacts on Land Environment
Change in topography: - Mining is proposed to be carried out from RL 1914.27 to 1700 m RL but the
depth of the pit will not increase more than 15 to 20 mtrs below the ground level .The over burden is
proposed to be dumped in core zone and height will be maintained in the form of terraces with 10
mts height each and maximum 3 to 4 terraces. Therefore there will not be major changes in
topography of the area.
Change in drainage pattern:- The drainage pattern is not likely to be disturbed due to mining ,as the
mining and other structures are proposed to follow the contour lines of the area. However minor
diversion structures like garland drains, water drains, etc., along the toe of dumps and on pit heads,
to divert the water are proposed. Further 10-15 mtrs barriers on both sides of the drainages are
proposed.
4.5.4 Scientific mining methods to mitigate the impacts of mining activity on land stability.
1. The mining will be done systematically by formation of benches of 10 m height and 10 m width.
2. Average slope of the benches will be 70 degree and the average slope of the stack will be less
than 400
which will take care of land slide due to heavy rainfall.

WCS : EIA/EMP
74
3. During rains, emergency gauge will be maintained for proper drainages of water & cleaning of
silts.
4. The waste rocks dumping will also be done by formation of terraces which will be subsequently
vacated.
5. The land required for mining and allied activities will be used gradually.
6. During rainy season the grasses are cultivated on unbroken area. Therefore there will be no
substantial impact on agriculture / grazing due to use of land.
7. Development of land suitable for grasses / fruit trees which will be beneficial during and after
closure of the mines.
4.5.5 Erosion of water dumps
To arrest erosion of dump, the following steps would be taken.
1. Construction of retaining wall at the toe of the dump
2. Construction of the water garlands at the top of the dump.
3. The average slope of the stack will be less than 400
and however it will be terraced with 10m
height and width more than 10m.
4. During rains grasses will be planted on dumps. In mining pits cultivation will continue
therefore, there will be no land erosion.
6. The species proposed covers local species and therefore the land will not have any impact on
biodiversity and forest cover.
4.5.6 Agreement for use of Shamlati land –
1. After mining land will be made suitable for cultivation and will be handed over to owners.
2. Providing employment to Shamlati land holders.
3. Payment of yearly rent.
4.6.0 Solid Waste Management
4.6.1 The waste generated in mine is a solid waste which is non hazardous .The mining waste would
be dumped both inside & outside lease area in the dumps created for the purpose which would be re-
handled and backfilled in the void created due to mining.
4.6.2 Preventive measures:
1. Refuse - Instead of buying new containers, bags, bottles from the market, use the ones that are
already available.
2. Reuse - Do not throw away the soft drink cans, the bottles, paper. Alternately, you can store them
and sell it to the kabariwalla who takes these for recycling. Reuse the plastic bags for many other
purposes, which can be used over and over again.
3. Recycle- Segregate your wastes so that non-perishable wastes are easily collected and taken for
recycling.
4. Reduce- Reduce the generation of unnecessary waste.
5. Electronic waste generated from mine office will be stacked & disposed properly.
6. Oil separation arrangement will be made at the work shop so that grease & oil is separated from
water used in maintaining of vehicles. Drained out oil and grease is also disposed properly.
7. Septic tank or soak pit is proposed so that water do not flow into the surrounding nalla.

WCS : EIA/EMP
75
4.7.0 Afforestation programme
In this area there is limitation for afforestation since the land is mostly agricultural and they have
agriculture as only means of their livelihood. The project proponent is already engaged with
plantation work since several years in consultation with panchayat and forest department and keeping
suitable provisions for etc.
Table : 4.11 Afforestation in the mining lease area during life of the mine
Year wise
plantation
Location Area in
hectares
No.
of
plant
s
No. of
specie
s
% survival
expected
Remarks
Existing on
2011 – 12
Waste dumps 1.00 600 10 585 Area
surrendered
Sub total 1.00 600 10 585
2013 –
2017
Green belt 0.8835 883 10 70%
2018 –
2022
- 0 0 0 0
2023 –
2027
- 0 0 0 0
2028 –
2032
- 0 0 0 0
2033 –
2037
Afforestation on ultimate
benches
5.5 5500 10 70%
Backfilling and afforestation 1.0 1000 10 70%
Afforestation on waste
dump
0.65 650 10 70%
Afforestation on area
vacated by infrastructure
0.022 22 10 70%
Sub total 8.05.55 8055 10 70%
Table: 4.12 - Afforestation on adjacent land purchased / proposed
Year wise plantation Location Area in
hectares
No. of
plants
No. of
species
% survival
expected
Existing as on 2012 Waste dumps 0.20 Grass Plantation
Surface 0.25 200 10 150%
Sub total 0.45 200 10 150%
2013-17 Waste dumps 0 0 0 0
2018-22 Waste dumps 0.50 500 10 70%
2023-27 Waste dumps 1.00 1000 10 70%
2028-32 Waste dumps 1.00 1000 10 70%
Total 2.50 2500 10 70%
The project proposes to do plantation on 0.2 hect. govt. waste land every year, if the land is allotted
by panchayat for plantation.

WCS : EIA/EMP
76
Species to be planted
1. Local species:- Beul, Chakara, Gorial, Pears, Kimnu, Diam, Katheru, Ban, Singhar, Dhaula, Kunja,
Bhukumber, Kingora, Kathi Sison & Pdera.
2. Fruits plants: Aam, Amrud, Anjeer, Anar, Bore, Jamoon, Papita, Banana, Custered Apple.
3. Grass for dump stabilization: Gloria Phenesis, Dhaman, Local Grasses
4. Flowering Plants:Bogan bell, Rose, Gulmohar, Kaner, Raliya,
Post plantation care:
This will include the following measures
• Protection from grazing and fire.
• Watering at least once a week during dry spells.
• Manuring.
• Weeding three times in the first and twice a year, during the subsequent two years & soil working.
• Replacement of causalities.
• Protection from pests.
• This post plantation care will be undertaken at least for three years after the plantation.
4.8.0 Biological Environment: Loss of forest resource, economically important plants, medicinal
plants and threat to rare and endangered species due to deforestation: Since the entire land is
shamlat land therefore, there will be no loss to forest growth. No tree will be felled due to mining and
allied activities.
4.8.1 Mitigation measures to compensate the loss of forest cover and impact on wild life
• The plant species proposed for greenbelt development along PWD road, patches etc will include
local species, fruit plants, forestry plants suitable for fuel wood, timber, animal life and grasses
suitable for cattle’s.
• As per the records of forest department the wild life in the area will get suitable food chain due to
plantation and implementation of wild life conservation plan.
• Wild life conservation plan has also been provided with a capital cost of Rs 3.00 lac and annual
recurring cost of Rs. 3.70 lac and placed at Annexure XI D. Which will be implemented and regular
monitoring is proposed as advised by Forest and Wildlife Department by submission of half yearly
progress report and subsequent inspection by Forest Department & MoEF.
• There will be no impact on biodiversity, wildlife habitat, migratory corridors, migratory avi-fauna,
rare and endangered species, medicinal plants etc due to mining activities since there is no forest
grown in the core zone.
4.9.0 Socio-Economic status
4.9.1 There is no inhabitation within the mining lease area. Hence neither village nor any part of the
village will be disturbed during the whole life of the mine. The mining and associated activities offer
opportunities of employment to the people living in surrounding. The increased employment
opportunity would also add to the purchase power and ultimately culminate in improved living.

WCS : EIA/EMP
77
4.9.2 Community development programmes
The Owner is regularly participating in village development programme which include –
• Aid to schools
• Free distribution of books & uniforms to the students.
• Construction of rooms, toilets & other facilities for school.
• Medical camps - Free distribution of medicines, expansion of dispensaries etc
• Construction of water tanks near water stream and connecting tanks by pipelines to nearby
villages for supply of water.
• Training & awareness programmes on improved farming practices / afforestation programmes.
• Plantation programme in villages
• Assistance for Pesticides /Seeds/ Vermi compost/ Fertilizer
• Free distribution of plants & also assistance in plant maintenance watering etc. in nearby houses as
an afforestation programme.
The above programmes are proposed to continue in future as well for which suitable provision in
budget is made.
4.9.3 R & R plans
In the absence of inhabitants in core zone no effective plan of R & R is required .However the project
proponent is already taking several steps for community development.
4.9.4 Socio economic Management plan
Socio-economic environment will have positive impact due to the mining project in the area.
These are;
• The mining in the area will create rural employment.
� Social welfare programme like provision of medical facilities, water supply, recreational amenities
for the employees as well as for nearby villagers.
4.10.0 Disaster Management Plan
4.10.1 All types of industries face certain types of hazards which can disrupt normal activities
abruptly.
The disaster could be due to fires, inundation, failure of machinery, explosion etc. The following
natural/industrial problems may be encountered during the mining operations:
1. Mine accidents
2. Fire
3. Land slides
4. Earthquakes
5. Due to cloud bursts / heavy rainfall / nallas/rivers may flow to the maximum extend causing flood
like situation to the villages / houses / hutments constructed along the river/nalla banks.
4.10.2 All emergency situations in the areas whether these are incidental to mining or otherwise
need following arrangements:
• Emergency procedure / management plan should be readily available and should come into force
without wasting time and to assist district administration / police / medical authorities of the
area.

WCS : EIA/EMP
78
• Withdrawal of persons from the affected areas.
• Siren / signals to inform the surrounding population likely to be effected by emergency.
• To provide emergency facilities available at the mines at such time.
4.11.0 Environmental Risks
Any likely risk on surrounding environment needs mitigation .In table below risk involved & mitigation
measures required are deliberated.
Table: 4.13 Environmental risk & mitigative measures
Risk Mitigation measures
Earth quakes may cause
sliding of benches / slopes /
external dumps.
Proper benching, terracing on dumps stabilization of dumps is
essential.
Impact on surface water
bodies
No diversion of water bodies, regular cleaning of silts.
Surface drainage pattern
Speed of flow of water in the mining area should be reduced by
construction of gully plugs and check dams on hill slopes .
Land slides Vibration due to blasting in the nearby areas is likely to cause
land slide therefore controlled blasting is essential.
Increased traffic / traffic in
the night
The capacity of the road in hilly areas should be adequate to
take increase traffic. As far as possible traffic in the night should
be avoided .
Noise & vibration The area is very much sensitive for flora & fauna. Activities in
the night should be avoided , blasting should be minimized .
Deforestation Alternative source of fuel wood should be provided . So as to
reduce load of forest due to increase fuel wood consumption.
4.12.0 Occupational risks and arrangements proposed
4.12.1 The details are given in table No 4.14
Table 4.14 - Occupational risks and arrangements proposed
S. No. Source/ Location Provisions Proposed Protective equipments
Proposed
1 Fire
A Due to Oil & lubricant
store
1. Fire extinguishers foam and dry
powder type along with fire buckets
2. Covered store
3. To prepare emergency
organization for all risk hazards.
4- Formation of safety committee.
5. Monthly meeting and review.
6. Follow up action on issues of
Already suggested

WCS : EIA/EMP
79
B Electricity
Fire & shock
1. Proper earthling.
2. Over load protection & automatic
trip devices fitted.
3. Fire extinguishers CO2 type with
buckets sand etc.
4. Artificial respiration arrangement.
5. First aid and ambulance facility.
6. To prepare emergency
organization for all risk hazards.
7- Formation of safety committee.
8. Monthly meeting and revue.
Use of hand gloves and
testers.
C Explosives magazine 1- Fire extinguishers foam and dry
power type along with fire buckets
provided.
2- Covered magazine
3. Separate storage for detonators &
high explosive.
4. Chowkidar cabin
5. Lightning arrester
Use of hand gloves and
shoes without iron
nails.
D Hazards due lightning 1 Lightning arrester with proper
earthing system at high places
explosive magazines etc.
2. To prepare emergency
organization for all risk hazards.
3- Formation of safety committee.
4. Monthly meeting and revue.
5. Follow up action on issues of
safety & health.
Lightning arrester to
be regularly tested.
2 Explosives
A Use of explosive Appointment of competent and
qualified blasters & following rules as
per MMR, 1961 for use. of explosives
Hands gloves, use of
ear muffs and dust
respirators. Use of
blasting shelters for
taking shelters.
B Ground vibration Ground vibration study & to do
blasting accordingly.
N.A.
C Flying fragments Withdrawal of persons before
blasting from safety zone. Use of
blasting, flags and siren.
N.A.
3 Fall of sides / stones
A At Mining faces Working as per MMR,1961 Use of helmets, shoes,
knee caps goggles etc.
B Dumps Proper terracing, stabilization &
water drains.
N.A.
4 Working on high
benches
Use of safety belts and rope.
N.A.

WCS : EIA/EMP
80
5
Movement of trucks &
dumpers on road in
hilly areas
Proper gradient parapet walls
adequate lighting, reversing siren,
proper maintenance of trucks etc.
N.A.
6 Welding & workshop
activities
Provisions of MMR, 1961 Hand loves, welding
shields etc.
7 Failure of high pressure
equipments
Pressure gauges & un-loader valves
on compressors
N.A.
8 Improper illumination
in the night shift
Illumination standards as per DGMS
circular.
N.A.
9 Dust & noxious fumes Standards as per DGMS & CPCB Use of dust mask
10 Noise pollution Standards as per DGMS & CPCB Use of ear muff / plug.
11
Water pollution Standards as per ISI & proper
arrangement for water drainage
siltation control and use of bleaching
powder during rains.
N. A.
4.13.0 Impact on health
The details are given in table below.
Table: 4.15 Impacts on Health
Type of dieses Causes Protective measures
Lung diseases Inhalation of dust Suppression of dust and protective equipments
Stomach diseases Water pollution Proper treatment of water & regular analysis
Night blindness Bad illumination Proper lighting
Hearing
Working at high
noise areas
Measures to suppress noise, and protective
equipments
Body ache Ground Vibration Provision of Safety belt in operating machines
4.14.0 Safety:
4.14.1 For the management of the safety a pit safety committee is proposed to be formed with the
following members
Mines Manager 1
Forman / Mining mate (O/C) 1
Work men inspector 1
Machinery Operators (O/C) 1
Tipper operator (O/C / surface) 1
Face workers (O/C) 2
4.14.2 Functions of the pit Safety Committee
1- To Identify the risks at the mining faces, dumps, road and surface Structures.
2- To identify the unsafe acts.
3- To Identify the unsafe places
4- To identify unsafe practices.
5- To Identify whether protective equipments provided / used or not.
6- To suggest corrective measures.

WCS : EIA/EMP
81
4.15.0 Environmental Impact Matrix
4.15.1 A number of techniques have been developed for the presentation of overall impact
evaluation results. In the present study "Matrix Method" technique is being adopted for the
evaluation of impact of the proposed mines on Environment. "Matrix Method" basically incorporates
a list of project activity along with a checklist of environmental conditions that may be affected. The
entries in the Matrix can be either qualitative or quantitative estimates of these Cause and Effect
relationships.
Table : 4.16– Environmental parameters, possible impacts and anticipated nature of impact
Sr.
No.
Environmental
Parameters
Possible
Effects/Impacts
Anticipated
Nature/Degree of
Impact
Remarks
Without
Control
Measures
With
Control
Measures
1. Land Use
Acquiring land (-) low (-) low -Pillar construction for
marking
Generation of waste
rocks & creation of
dumps
(-) Mod. (-) low -Planned waste disposal
2. Mining (-) max. (-) max.
3. Ecology &
Forest
Uprooting of trees is
not involved for mining
/dumping
(-) low (+ )max -Compensatory forestation
Existing trees are not
likely to be effected
due to mining
(-) low (+) low -Additional trees shall be
planted
A good number of
trees will be planted by
the lessee to improve
vegetation and to
improve visual impact
& social economy
-- (+) Green belt development:
4. Air Quality
Generation of dust
during drilling ,
blasting, loading,
transportation,
unloading and other
mining activities and
emission of gases by
vehicles and mining
machineries.
Movement of trucks
within ML & outside
ML.
(-) Mod. (-) low -Wet drilling, Water
sprinkling at mining faces,
dumps, roads will suppress
the dust generated.
-Regular maintenance and
monitoring of machines and
vehicles to keep emissions
within limits.

WCS : EIA/EMP
82
5. Major Surface
Water course
Drainage pattern of
the nallahs flowing in
the area may be
affected
(-) Mod (-) Low No diversion of major
drainages, Construction of
check dams and siltation
tank.
6. Ground Water Changes may occur in
ground water table
0 0 - Water table is 30 mtr below
the existing working and
therefore, there will be no
dewatering.
7. Water quality Pollution of surface
water due to waste
rock disposal
Rain water flow
through pits , dumps
roads, carries fines
with it
(-) Mod.
(-) low
-Construction of retaining
walls, garland drainage,
check dam etc.
-Silts will be removed and
surface water shall be used
in plantation/ agriculture.
8. Noise
Likely impact due to
generation of noise
and vibration by
drilling blasting,
machinery and
Vehicular movement.
(-) Mod. (-) low -Regular Maintenance of
vehicles, maintenance of
roads , proper blasting
technique , charge pattern
and maintenance of
machines
-Use of ear plugs/ear muffs
9. Health Dust generation Noise
& vibration due to
mining can cause
diseases in workers.
(-) Mod. (-) Low -Periodic medical checkup
- Control measures like water
sprinkling for dust
suppression.
10. Population /
migration
No population will be
migrated.
(-) Low (+) Mod.
11. Employment Employment of local
people
(+) low (+) Mod. -More employment
generation
12. Literacy Literacy increases from
industrial exposure
(+) Low (+) Mod. -Literacy in workers and
nearby population will
increase
13. Services Creation of
infrastructure
Medical facilities
Cultural and other
events
(+) Low (+) Mod. -Regular medical checkup of
employees will help to
identify and control the
diseases
-Participation of
management will further
boost social activities
14. Aesthetic
Value
Aesthetic value of the
area will be decreased
due to mining and
waste disposal
(-) Mod (+) Low -Land reclamation will be
done
-Plantation will increase the
aesthetic value of the waste
land

WCS : EIA/EMP
83
4.15.2 From the above table, it will be observed that all the project activities when operated without
control measures, have negative impacts on various environmental parameters except employment,
literacy and services. On providing control measures, the negative impact on most of the
environmental parameters will be improved and controlled. However, the negative impacts are of
temporary nature and at the end of mining all the negative impacts will become positive.
4.15.3 Quantitative Environmental Impact Matrix :- On the basis of anticipated impacts of the mines
on the various environmental parameters as discussed in the preceding paragraphs, an
Environmental Impact Analysis (EIA) is carried out through a graded matrix system. The effect of
various activities on the environment is ranked on a scale of 1 to 4 to arrive at the impact value.
Degree of Impact Impact Value
1. Appreciable impact (low) 1.0
2. Significant impact (Mod.) 2.0
3. Major impact 3.0
4. High impact 4.0
The impact value may be positive or negative depending on beneficial or detrimental.
The each environmental parameter has been assigned weightage.
Table : 4.17 The Parameter weight age with or without control measures
Sr. No. Environmental Parameters Weight-age
1. Land Use 125
2. Ecology & Forest 150
3. Air Quality 100
4. Major Surface Water course 75
5. Ground Water 75
6. Water quality 100
7. Noise 75
8. Health 100
9. Population / migration 50
10. Employment 75
11. Literacy 50
12. Services 50
13. Aesthetic Value 50
Depending on the activities of the mine and the impact on the environmental parameters the
environmental values will be assigned. The sum total of environmental values depending on the
activities assessed will be environmental score which will be positive or negative. The environmental
weightage when multiplied with the score will give the total impact score. The sum total of the
impact score will decide the status of environment on project:
1. Upto (-) 1000 No appreciable impact on environment
2. (-)1000 to (-) 2000 Appreciable impact on environment,
but no injuries in general.
Mitigation measures important.
3. (-) 2000 to (-) 3000 Significant impact on environment
4. (-) 3000 to (-) 4000 Major injurious impact on environment. Site
selection to be reconsidered.

WCS : EIA/EMP
84
5. (-) 4000 and above Alternative site to be considered.
Table : 4.18 - Environmental Impact Matrix without Control Measures
Table : 4.19 - Environmental Impact Matrix with Control Measures S.
No
Environmental
Parameters
Weight
-age
Project Activities Score Weighted
score Site
prepa-
ration
Mine
Construc-
tion
Mineral /OB
excavation
Mineral
/OB
transport-
tation
OB
dumping/
Waste rock
disposal
Industrial
complex
Land
reclam-
ation
Affores-
tation
Commu-
nity
develop-
ment
1. Land Use 125 - - -2 -1 -1 -0 +1 +1 - -2 -250
2. Ecology &
Forest 150 - - -1 -1 -1 - +1 +1 - -1 -150
3. Air Quality 100 - - -2 -1 -1 - - +1 - -3 -300
4. Major Surface
Water course 75 - - -1 - -1 - +1 - - -1 -75
5. Water quality 100 - - -1 - -1 - +1 +1 - -0 -0
6. Noise 75 - - -1 -1 -1 -0 - +1 - -1 -75
7. Health 100 - - -2 -1 -1 - - +1 +1 -2 -200
8. Population/
migration 50 - - -1 - - - +1 +1 +3 +4 +200
9. Employment 75 - - +2 +2 +1 0 - +1 +1 +6 +450
10. Literacy 50 - - +1 +1 +1 0 - +1 +2 +5 +250
11. Services 50 - - +1 +1 +1 0 - +1 +1 +4 +200
12. Aesthetic Value 50 - - -1 -1 -1 - - +1 +1 -1 -50
Total 0
It is observed (study activities without control measures) that when the project is operated without
control measures the score is (-) 2650 and when it is considered with the proposed EMP the score
shall be (-) 250. As given above, the project when operated with prescribed control measures, would
prove to be eco-friendly.
S.
No
Environmental
Parameters
Weigh-
tage
Project Activities Score Weig
hted
score
Site
prepa-
ration
Mine
Constru-
ction
Mineral /
OB
excavation
by opencast.
Mineral /
OB
transport-
tation
OB
dumping/
Waste rock
disposal
Industrial
complex
Land recla-
mation
Affores-
tation
Commu-
nity
develop-
ment
1. Land Use 125 - - -2 -1 -2 - - - - -5 -625
2. Ecology &
Forest 150 - - -1 -1 -1 - - - - -3 -450
3. Air Quality 100 - - -2 -1 -1 - - - - -4 -400
4. Major Surface
Water course 75 - - -1 - -1 - - - - -2 -150
5. Ground Water 75 - - 0 - 0 - - - - 0 -0
6. Water quality 100 - - -1 - -1 - - - - -2 -200
7. Noise 75 - - -2 -1 -1 - - - - -4 -300
8. Health 100 - - -2 -1 -1 -1 - - - -5 -500
9. Population/
migration 50 - - -1 - - - - - - -1 -50
10. Employment 75 - - +2 +2 - +2 - - - +6 +450
11. Literacy 50 - - +1 +1 - +1 - - - +3 +150
12. Services 50 - - +1 +1 - +1 - - - +3 +150
13. Aesthetic Value 50 - - -1 -1 -1 - - - - -3 -150
Total -
2075
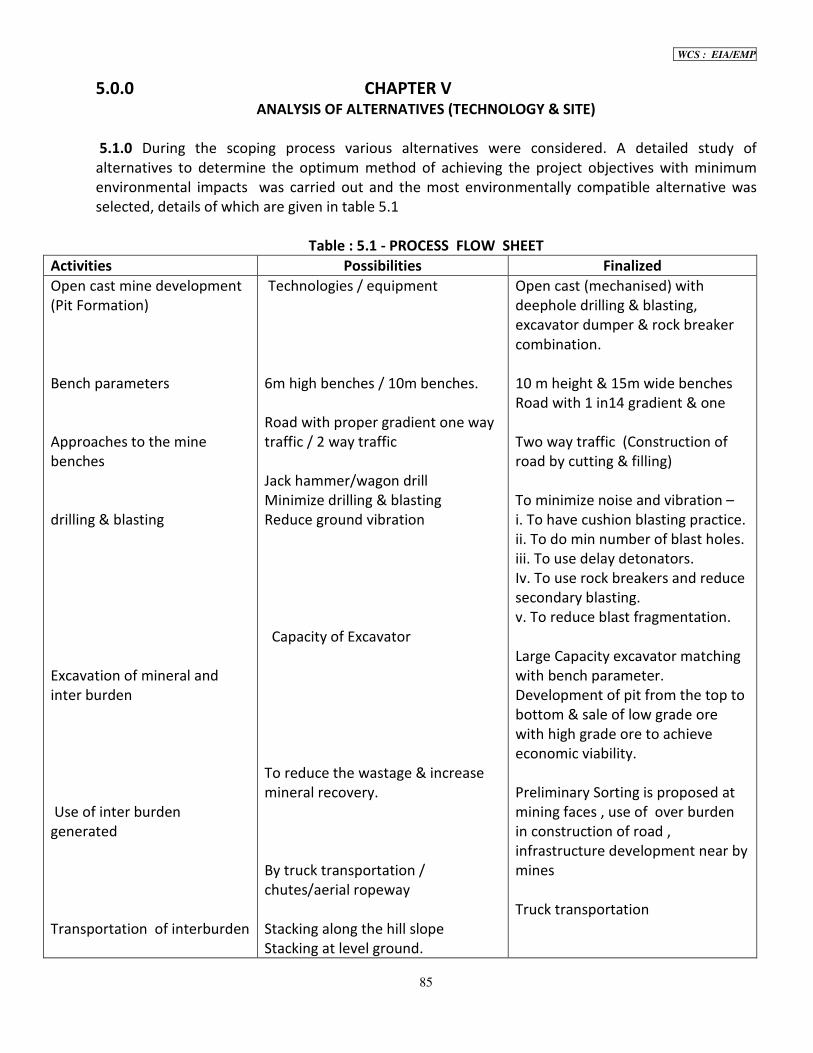
WCS : EIA/EMP
85
5.0.0 CHAPTER V ANALYSIS OF ALTERNATIVES (TECHNOLOGY & SITE)
5.1.0 During the scoping process various alternatives were considered. A detailed study of
alternatives to determine the optimum method of achieving the project objectives with minimum
environmental impacts was carried out and the most environmentally compatible alternative was
selected, details of which are given in table 5.1
Table : 5.1 - PROCESS FLOW SHEET
Activities Possibilities Finalized
Open cast mine development
(Pit Formation)
Bench parameters
Approaches to the mine
benches
drilling & blasting
Excavation of mineral and
inter burden
Use of inter burden
generated
Transportation of interburden
Technologies / equipment
6m high benches / 10m benches.
Road with proper gradient one way
traffic / 2 way traffic
Jack hammer/wagon drill
Minimize drilling & blasting
Reduce ground vibration
Capacity of Excavator
To reduce the wastage & increase
mineral recovery.
By truck transportation /
chutes/aerial ropeway
Stacking along the hill slope
Stacking at level ground.
Open cast (mechanised) with
deephole drilling & blasting,
excavator dumper & rock breaker
combination.
10 m height & 15m wide benches
Road with 1 in14 gradient & one
Two way traffic (Construction of
road by cutting & filling)
To minimize noise and vibration –
i. To have cushion blasting practice.
ii. To do min number of blast holes.
iii. To use delay detonators.
Iv. To use rock breakers and reduce
secondary blasting.
v. To reduce blast fragmentation.
Large Capacity excavator matching
with bench parameter.
Development of pit from the top to
bottom & sale of low grade ore
with high grade ore to achieve
economic viability.
Preliminary Sorting is proposed at
mining faces , use of over burden
in construction of road ,
infrastructure development near by
mines
Truck transportation

WCS : EIA/EMP
86
Place of stacking site of
interburden
Breaking/sizing of mineral
Sorting of mineral/stacking of
mineral & subgrade mineral.
To acquire suitable land.
To be filled on low lying areas for
land development.
Manual / rock breaker
To do within ML/ outside ML.
Stacking along hill slope minimized.
Stacking at level ground will be
preferred.
Development of colonies, house
complex, infrastructure
development. Construction of
houses / stone crushers on back
filled & dump areas.
Use of rock breaker & crushing &
sorting of simultaneous
To install crushing & sorting plant
outside the mining lease area.
Loading of mineral Manual / JCB JCB
Transportation of mineral
from pits to processing plant
Aerial rope way / trucks Finally by trucks after construction
of road
Land reclamation Land reclamation by plantation /
backfilling/ water reservoir
After completely mineral is
excavated, the plantation can be
done on higher altitude benches
and backfilling low lying areas.
Possibility of water reservoir is not
there.
Afforestation Within ML on non mineralized area
and after land maturity
afforestation possible.
Afforestation planning to be done
on govt. waste land/ van panchayat
land outside the ML area
simultaneous with mining.
Employment Local persons Local persons as per availability
Site services. Existing site services in villages will
be used
Existing site services in villages will
be used
Requirement of water Springs & nallas will be used which
is sufficient
Springs & nallas will be used which
is sufficient
Power Not required for mining Not proposed
Fuel Consumption of fuel is minimum
will be brought from nearest petrol
pump.
No additional provision made.
Land acquisition Temporary/ permanent Annual compensation to samalati is
proposed and the end of mining
land will be developed in
consultation with local samalatis
and will be handed over to
Samalati’s for grazing of animals.
--------------

WCS : EIA/EMP
87
6.0.0 CHAPTER VI
ENVIRONMENTAL MONITORING PROGRAMME
6.1.0 Monitoring schedule and parameters
To evaluate the effectiveness of environmental management programme, regular monitoring
of the important environmental parameters will be taken up after approval of EIA. The
schedule, duration and parameters to be monitored are shown as under:
Table : 6.1 - Monitoring schedule and parameters
Sl. Description of parameters Schedule & duration of monitoring
1. Air Quality One sample 24 hourly.
1 sample per day, 2 days per week & 12
weeks per season and 3 seasons per year
except Monsoon season.
a. In the vicinity of the mine (PM10, SPM, CO, SO2,
NOx) core and buffer zone.
2. Water Quality :
a. Water quality of surface water (suspended
solids in nallas & rivers will also be monitored
with other parameters).
Ground water quality (All parameters as per
GSR 422(E) dated 19.5.93 under Environment
Protection act. 1986 and Drinking water must
conform to Drinking water standard IS:
10500:1991
Once in a season for 4 seasons in a year.
b Water flow pattern for surface water bodies. Four season every year.
3. Ambient Noise Level Once in a season for 3 seasons in a year.
4. a) Inventory of flora (Tree plantation, survival etc.
b) Growth of faunal species in the area
Once in 2 years in project monitoring area.
5. Soil Quality Once in two year on all reclaimed areas.
6. Socio-economic condition of local population,
physical survey
Once in two years.
The details of Samples location are given in Chapter-III.
6.2.0 Health Environmental & Environmental monitoring schedule.
i) Medical examinations:
The following medical examinations are recommended:
1- X-ray of chest to exclude pulmonary TB, etc.
2- Lung function test
3- Audiometer test to find deafness
4- Urine test, blood test, blood sugar etc.
5- Eye test
ii) Schedules: - The following schedule for medical checkup is recommended:
Persons working as operators in the mine pit : Once in 3 year
Persons working as worker & supervisory Staff : Once in 5 year
Persons working outside mine pit : Once in 5 years
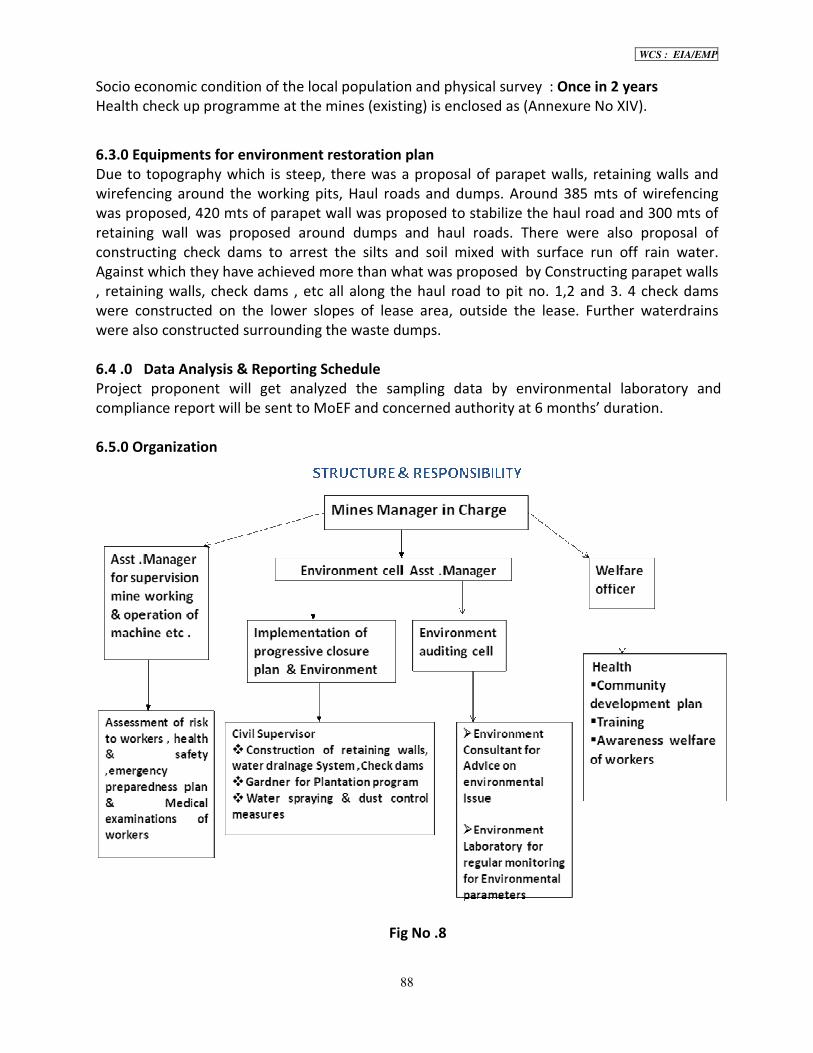
WCS : EIA/EMP
88
Socio economic condition of the local population and physical survey : Once in 2 years
Health check up programme at the mines (existing) is enclosed as (Annexure No XIV).
6.3.0 Equipments for environment restoration plan
Due to topography which is steep, there was a proposal of parapet walls, retaining walls and
wirefencing around the working pits, Haul roads and dumps. Around 385 mts of wirefencing
was proposed, 420 mts of parapet wall was proposed to stabilize the haul road and 300 mts of
retaining wall was proposed around dumps and haul roads. There were also proposal of
constructing check dams to arrest the silts and soil mixed with surface run off rain water.
Against which they have achieved more than what was proposed by Constructing parapet walls
, retaining walls, check dams , etc all along the haul road to pit no. 1,2 and 3. 4 check dams
were constructed on the lower slopes of lease area, outside the lease. Further waterdrains
were also constructed surrounding the waste dumps.
6.4 .0 Data Analysis & Reporting Schedule
Project proponent will get analyzed the sampling data by environmental laboratory and
compliance report will be sent to MoEF and concerned authority at 6 months’ duration.
6.5.0 Organization
Fig No .8

WCS : EIA/EMP
89
7.0.0 CHAPTER – VII
Additional studies 7.1.0 Public Consultation.
(a) Date of Advertisement
(b) Newspapers in which the advertisement appeared
(c) Date of public hearing (DD/MM/YYYY)
(d) Public Hearing Panel chaired by & members present
S. No. Name Designation
1 Shri Manmohan Sharma Addl. Deputy Commissioner
2 Shri Suresh Bhardwaj Mining officer ,Sirmour
3 Shri Avinash Sharda R.O ,HPPCB , Paonta Sahib
4 Shri Ashok Verma Assti . Director ,Fisheries ,Sirmour
5 Shri Sunil Sharma R.T.O Sirmour
6 Shri Harbans Singh S.D.M. Sangrah
7 Atul Parmar AEE,HPSPCB Paonta Sahib
(e) No. of people attended the public hearing meeting
and number of people from the lease area.
(f) Summary/details of public hearing in tabular form.
Proceedings of the public hearing of Sangrah Limestone Mine of M/s V.K.Walia (Area 8.05.55
Hectare) for an annual production of 81,053 MT, organized by Himachal Pradesh State
Pollution Control Board on 22nd
March, 2014.
At the outset Shri Avinash Kumar Sharda, Executive Engineer, Himachal Pradesh State Pollution
Control Board has welcomed all officials and general public in public hearing meeting and
informed that in accordance with the Notification No USC/1533 dated 14/09/2006 of
Government of India for any work /project involving more than 5 Ha land, pollution control
board has to organize locally public hearing and recorded views and objections of people are
required to be sent to concerned department. He further said that this public hearing is
organized in connection with giving permission for Sangrah Limestone Mine (area-8.05.55ha) of
81,053 Metric tonne annual production to Shri Virendra Kumar Walia. He invited all present to
speak without fear and hesitation on earlier mining /management as well as the proposed
expansion programme of mine and place before chairman their views, objections
,apprehensions and suggestions. He also requested the mine management to inform all about
the earlier mining activities as well as proposed planning for mine. Thereafter, the
representative of mine management gave details on the technicalities of the activities and
general information about mine. The mine representatives have further informed that mining
activities in mine would be undertaken during day time in accordance with the guidelines
issued by the Environment department. The equipment deployed for mining would have only
temporary noise and will not cause any pollution .Besides after closure of mines, in the
14th
February, 2014
22/03/2014
0 148
Amar Ujala & Daily post India

WCS : EIA/EMP
90
surrounding, land, plantation /afforestation would be done. The Chairman specially requested
general public to place their views on renewal /expansion of Sangrah Limestone Mine from
Environment protection angle without any fear before the public forum. He assured that
views/objections expressed by speakers would be forwarded to the Government, as it is.
Thereafter in public hearing the following persons expressed their views which were answered
and commented by the officials of Pollution Control Board and mine management, details of
which are as follows.
S.
No.
Name ,address and Comments Reply from Mine Management and
Comments of Pollution Control Board
1. Shri Tapinder Singh Chauhan, Pardhan, Gram
Panchayat Sangrah, during Public hearing
informed that local persons were earlier engaged
in mine and after its closure the local persons for
livelihood are leaving the place causing financial
loss. He observed that earlier mining was done
on scientific lines & mine management was
extending all possible support from time to time
to local people. He conveyed his agreement for
restart of mining activity.
Mine management assured that mining
would be taken up in accordance with the
standards set by Pollution Control Board
in the specified areas and it would be
their endeavor to always extend
assistance to local villagers.
2. Shri. Ram Lal Sharma, Ex. Pardhan, Gram
Panchayat, Borli, During public hearing informed
that mine is very important for the region as
commencement of mining would generate
employment opportunities, improvement in
economic conditions of people & eradication of
unemployment. Shri Sharma Observed that the
mining should be done in this region after taking
into account full protection of environment
besides employment to local persons as much as
possible.
Mine management assured that mining
would be taken up in accordance with the
standards set by Pollution Control Board
in the specified areas and it would be
their endeavor to always extend
assistance to local villagers.
3. Shri. Satya Nand Bhardwaj, Member Renuka
Development Board observed that closure of
mine has resulted in migration of local youth for
employment to other places causing financial
loss. He further observed that due to operations
of mines there is no damage to environment &
therefore gave consent to start mining.
The mine management assured that for
mining work local people would be given
employment on priority.
4. Shri. Sunil Sharma, Tikkri Village, Observed
during public hearing that due to closure of mine
the local youth has to migrate for employment to
other places & workers have no jobs. While
emphasizing that due to mining there is no
damage to environment he conveyed agreement
for resumption of mining.
The mine management assured that for
mining work local people would be given
employment on priority.
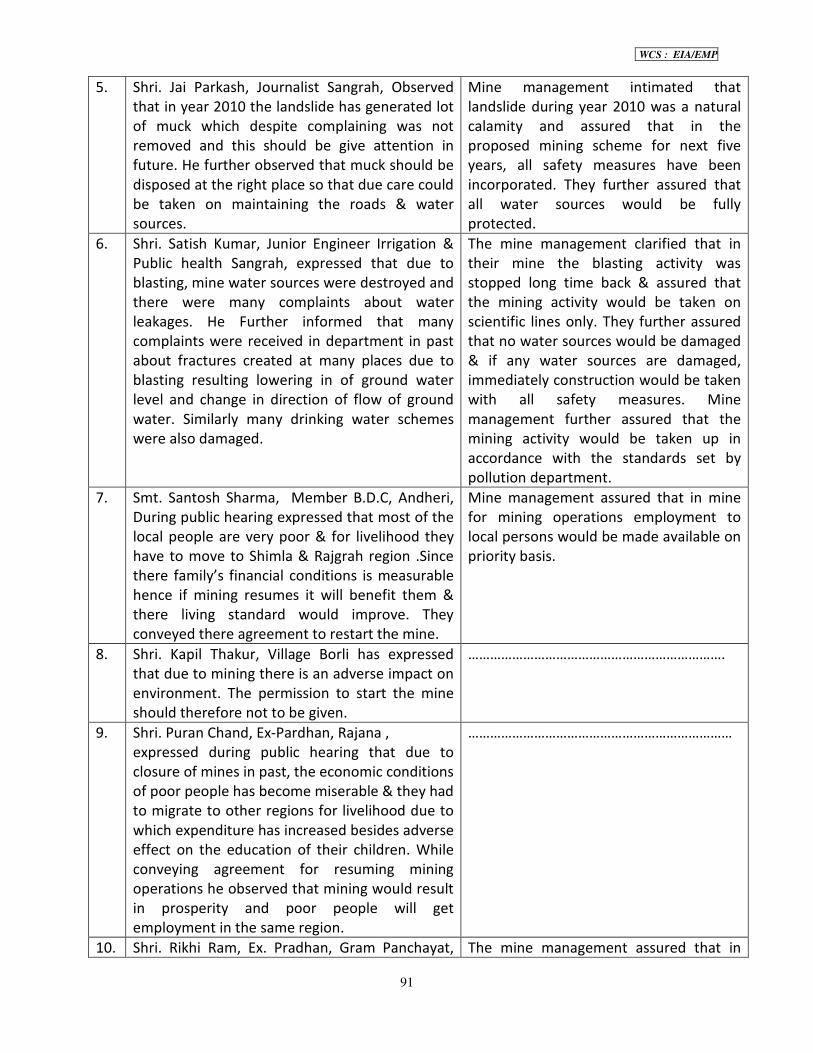
WCS : EIA/EMP
91
5. Shri. Jai Parkash, Journalist Sangrah, Observed
that in year 2010 the landslide has generated lot
of muck which despite complaining was not
removed and this should be give attention in
future. He further observed that muck should be
disposed at the right place so that due care could
be taken on maintaining the roads & water
sources.
Mine management intimated that
landslide during year 2010 was a natural
calamity and assured that in the
proposed mining scheme for next five
years, all safety measures have been
incorporated. They further assured that
all water sources would be fully
protected.
6. Shri. Satish Kumar, Junior Engineer Irrigation &
Public health Sangrah, expressed that due to
blasting, mine water sources were destroyed and
there were many complaints about water
leakages. He Further informed that many
complaints were received in department in past
about fractures created at many places due to
blasting resulting lowering in of ground water
level and change in direction of flow of ground
water. Similarly many drinking water schemes
were also damaged.
The mine management clarified that in
their mine the blasting activity was
stopped long time back & assured that
the mining activity would be taken on
scientific lines only. They further assured
that no water sources would be damaged
& if any water sources are damaged,
immediately construction would be taken
with all safety measures. Mine
management further assured that the
mining activity would be taken up in
accordance with the standards set by
pollution department.
7. Smt. Santosh Sharma, Member B.D.C, Andheri,
During public hearing expressed that most of the
local people are very poor & for livelihood they
have to move to Shimla & Rajgrah region .Since
there family’s financial conditions is measurable
hence if mining resumes it will benefit them &
there living standard would improve. They
conveyed there agreement to restart the mine.
Mine management assured that in mine
for mining operations employment to
local persons would be made available on
priority basis.
8. Shri. Kapil Thakur, Village Borli has expressed
that due to mining there is an adverse impact on
environment. The permission to start the mine
should therefore not to be given.
…………………………………………………………….
9. Shri. Puran Chand, Ex-Pardhan, Rajana ,
expressed during public hearing that due to
closure of mines in past, the economic conditions
of poor people has become miserable & they had
to migrate to other regions for livelihood due to
which expenditure has increased besides adverse
effect on the education of their children. While
conveying agreement for resuming mining
operations he observed that mining would result
in prosperity and poor people will get
employment in the same region.
………………………………………………………………
10. Shri. Rikhi Ram, Ex. Pradhan, Gram Panchayat, The mine management assured that in

WCS : EIA/EMP
92
Bawanal Kakhog, expressed that mining should
restart which will help employment to youth of
the region and unemployment would be
removed besides efforts should be made to stop
noise pollution and check dams should be
constructed for protection of streams in the
region. He further expressed that the mine
management should necessarily undertake
adequate plantation in mines region . He
conveyed agreement to restart mining.
mine for mining activity, employment to
local people would be given on priority
basis and to check noise pollution proper
equipment would be deployed besides
constructions of check dams, as required.
11. Shri. Yogender Kapila, Journalist Sangrah,
observed that due to mining, environment,
crops, natural water sources are damaged. While
he agreed that mine gives employment but it
generates lot of dust which pollutes air & even
animals fodder is affected. Mine management
does not give dress to worker and even
reasonable wages are not given.
Besides, for safety purpose helmet etc, are not
provided. Every year during rainy season in mine
area the roads are blocked ,because from mine
area, the muck along with water flows towards
low regions in fields/villages and settles due to
which the problem of over silting aroses. He
particularly mentioned about village lagnu where
from mine area much along with water have
flown and settled in the fields due to which it has
become difficult to take up agriculture.
Mine management recalled that the mine
has been operating since year 1978 in the
region and has not damaged any water
sources. To stop the muck produced
during mining operations for safety
purpose, crate ware walls were
constructed. Besides for safety of
workers, safety equipment were made
available. To stop dust 15000 Liter water
is planned for frequent sprinkling. In
addition the periodical measurement of
dust content in air would be taken. They
further informed that for environment
protection, a committee has been
constituted which would periodical assess
damage and take necessary action. It was
further assured that due to mining
operations if road are blocked, for
removing the blockades immediate
action would be taken so as to avoid any
inconvenience to people.
The specific issues emphasized are summarized here in after:-
No specific issues were raised against the renewal of mining activity by the local public however
the people spoke during course of public hearing were satisfied with the working of the mine as
far as protection of environment, generating employment and up-liftment of socio economic
conditions by providing assistance etc. In addition to this the specific issues during the public
hearing by the local public are tabulated herewith as below.
S. No Issues raised Remarks on the issues raised
1 Non operation of the mine has resulted
into financial crisis and unemployment to
local people
Whenever the mine restarts locals will be
suitably accommodated
2 Due to non operation of the mines the
locals have to migrate to other areas for

WCS : EIA/EMP
93
employment
3 The mining in the past has resulted in the
damage of water sources and water supply
schemes and the complaints in such cases
should be addressed immediately
The management has expressed concern
about such issues however in future
mining will be done as per the approved
mining plan. The issues shall be redressed
in proper way and at the earliest
4 During heavy rains the muck transports to
the state Highway along with storm water
resulting into the stoppage of vehicular
traffic and needs to be checked
immediately through a provision of check
dams & retaining walls
The management has already provided
retaining walls around the muck disposal
areas and check dams in the nallahas and
in future these measures will be
strengthened further particularly the
height of the check dams near to the road
shall be raised to avoid any spillage of
debris on the road.
5 Due to the dust generated because of the
mining activities the grasslands for grazing
of cattle get damaged
The management informed that there is
as provision of 15 KLD water for sprinkling
purpose which will reduce the dust to a
large extent .
6 The proponent should carry out more and
more plantation was asked to contain soil
erosion
The Management agreed to the proposal
and further informed that plantation of
different species of tress shall be
continued.
7
The management should take care for
safety to the workers by providing them
safety equipment i.e helments ,safety
The management ensured that all safety
equipment shall be provided besides
creating a safety cell which will monitor.
Shri Avinash Kumar Sharda, Executive Engineer, Himachal Pradesh State Pollution Control
Board, once again urged that anyone having any doubt can indicate without hesitation. Besides
while repeating the suggestions and objections presented during public hearing he informed
that the proposals of mining of 81,053 tonnes annually of limestone by M/s V.K.Walia for
Sangrah Limestone Mine covering 8.05.55 ha area has by and large been endorsed by people
and a few persons have expressed their objections. Further the management representative
responded to the objections and also gave assurances during public hearing. Since no
suggestion/objection was further forthcoming, the permission of chairman to conclude the
public hearing was sought.
The Chairman recalled that the forum of public hearing of Himachal Pradesh State Pollution
Control Board is provided to hear the public views and only specific subject and environment
protection should be given more attention and expressed happiness that the people are quite
alert about environment. He further observed that for development, environmental balance
should be maintained and the natural resources should be exploited in a manner that the
future generations are not affected adversely on environment and natural resources point of
view. He observed that business units like Sangrah Mines & Minerals should be fully aware of
their social responsibilities and must take necessary steps from time to time, for welfare and

WCS : EIA/EMP
94
development of local people. He reiterated that the valuable suggestions and objection
received during public hearing would be as such sent to the Government of India.
Minutes of public hearing is enclosed here with as annexure No XX.
7.2.0 Social impact assessment and R & R action plans
• There is no inhabitation within the mining lease area. Hence neither village nor any
inhabitant of the village will be disturbed during the entire life of the mine.
• The mining and associated activities offer opportunities of employment to the people living
in surroundings.
• The increased employment opportunity would also add to the purchase power and ulitimatly
culminate in improved living.
• Although no inhabitants in core zone are living, yet the project proponent is already taking
several steps for community developmentin in the region.
7.3.0 Risk assessment and safety management Plan:
Risk assessment has been done covering following aspects: possible danger due to failure of
mine benches, terraces of external dumps, accident due to blasting & use of explosives,
operation of mining machineries, transportation trucks etc.
7.3.1 Hazard identification and risk assessment:
• To identify risks which need maximum attention and the options for achieving risk reduction.
• To identify which risks need careful ongoing management, the nature of ongoing
management as well as the indicators that show that the risk is being managed.
• To identify triggers which might be used to monitor that hazard and initiate remedial action if
elimination is not feasible.
7.3.2 Identification of hazards:
This should be done by using:
i- Past experience of accident and occurrences at the mines
ii- Work process evaluation.
iii- Consultation with employees
iv- Safety statistic for this and other mines in surrounding mines.
7.3.3 Risk ranking: - The process of risk ranking is carried out by considering both the likelihood
of the occurrence of each hazard and the potential consequence should the hazard occur. Each
shall be estimated by engineering principle to enable the risk ranking to be carried out. The
risks are ranked according to the level of risk i.e. the highest risk to the lowest risk. The risk of
any hazard is dependent upon the change that will be occur (likelihood) and the impact of an
occurrence (consequence).
The risk score = likelihood x consequence
Consequence is the size of the loss or damage. In terms of health and safety, it is the degree of
harm that could be caused to people exposed to the hazard, the potential severity of injuries or
ill health and or the number of people who could be potentially affected. It should be
remembered that consequence of a hazard need not only be in terms of safety criteria but

WCS : EIA/EMP
95
could also be in terms of a money loss, incurred costs, loss of production, environmental
impacts as well as public outrage.
Likelihood is the change that the hazard might occur
In some cases personnel are only exposed to the hazard for part of the time. A more detailed
analysis can be carried out of the risk ranking by taking this into consideration. Replacing
likelihood by exposure (% time personnel are present) and probability (chance that they will be
harmed)
Risk score = probability x exposure x consequence
The values used for likelihood, consequence, exposure or probability need to be agreed by the
risk assessment team. Risk ranking can be determined by qualitative and quantitative means.
Risk ranking process:
Scale for consequence:
• Several dead 5
• One dead 1
• Significant chance for fatality 0.3
• One permanent disability/ 0.1
Less change of fatality
• Many lost time injuries 0.01
• One lost time injury 0.001
• Small injury 0.0001
Scale for exposure:
• Continuous 10
• Frequent ( daily) 5
• Seldom (weekly) 3
• Unusual (monthly) 2.5
• Occasional (yearly) 2
• Once in five years 1.5
• Once in ten years 0.5
• Once in 100 years 0.02
Scale for probability:
• May well be expected 10
• Quite possible 7
• Unusual but possible 3
• Only remotely possible 2
• Conceivable but unlikely 1
• Practically impossible 0.5
• Virtually impossible 0.1
Based on the above guidelines hazard identification and risk assessment have been done
alongwith interse priorities as step -1.

WCS : EIA/EMP
96
On the above guidelines the mechanism contributing principle hazards and ranking have been
done as step- 2.
The control measures and procedure for respective mechanism contributing hazards have been
tabulated as step- 3.
STEP 1 ,TABLE : 7.1 -INITIAL HAZARD IDENTIFICATION, RISK, ASSESSMENT AND PRIORITISATION
S.
NO
DESCRIPTION OF HAZARD CONSEQUENCE PROBABILITY EXPOSURE TOTAL
RISK
1 FIRES 1 1 0.5 0.5
2 USE OF EXPLOSIVE 0.3 3 0.5 0.45
3 MACHINERY 0.3 2 5 3
4 OPEN CAST WORKINGS 1 2 5 10
5 DUMPS 0.3 1 2 0.6
6 SHORTAGE OF SKILLED PERSONS / DEPLOYMENT OF
UNSKILLED
0.3 3 5 4.5
7 POOR SUPERVISION 0.3 3 5 4.5
8 LACK OF AWARENESS 0.3 3 2 1.8
9 EMPLOYMENT OF CONTRACTORS WORKERS 0.3 3 2 1.8
STEP 2,TABLE : 7.2 -IDENTIFYING MECHANISMS CONTRIBUTING PRINCIPAL HAZARDS AND RANKING :
S.NO MAJOR HAZARD MECHANISM CONS. PROB. EXPO. RISK
1. FIRE EXPLOSIVES MAGAZINE 0.1 1 5 0.5
2- USE OF
EXPLOSIVE
NOT TAKING PROPER SHELTER 5 3 5 75
PERSONS NOT WITHDRAWN FROM DANGER ZONE. 5 3 5 75
SEARCHING OF SOCKETS / MISFIRED SHOT / 0.3 2 5 3
PROPER HANDLING OF EXPLOSIVES. 5 2 5 50
3 MACHINERY MAINTENANCE SCHEDULES NOT FOLLOWED 0.3 7 10 21
BY PASSING PROTECTIVE DEVICES 5 3 5 75
UNSKILLED OPERATORS 5 2 5 50
MOVING PARTS OF THE MACHINERIES 1 7 5 35
MOVEMENT OF MACHINERIES AT MINING FACES 1 7 5 35
MOVEMENT OF TRUCKS & DUMPERS IN HILLY AREAS 5 7 5 175
FAILURE OF BRAKES 1 7 5 35
OVER SPEEDING 1 7 5 35
REVERSALS 1 7 5 35
4 OPEN CAST
WORKINGS
FAILURE OF BENCHES / WORKING ON STEEP SLOPES 5 2 5 50
WORKING ON HIGH BENCHES 0.3 3 5 4.5
FALL OF STONES AND SIDES 0.3 7 5 10.5
SCATTERED LOOSE BOULDERS ON WORKING FACES 0.1 10 5 5
WORKING OF MANPOWER AND MACHINERIES NEAR EACH
OTHER.
0.3 2 5 3
BREAKING OF BOULDERS BY MANUAL LABOURERS 0.1 10 5 5
STEEPS GRADIENT OF THE ROADS, CURVES AND BENDS 0.3 3 5 4.5
DRILLING ON HIGH BENCHES 5 3 5 75
LOADING OF TRUCKS BY MANUAL LABOURERS 0.0001 10 5 0.005
5 DUMPS FAILURE OF SLOPES BY FLOWING RAIN WATER 5 3 2.5 37.5

WCS : EIA/EMP
97
DUMPING OF OVERBURDEN BY TIPPERS 1 10 10 100
6 SHORTAGE OF
SKILLED PERSONS
/ DEPLOYMENT
OF UNSKILLED
ABSENTEEISM 1 1 5 5
TRAINING NOT DONE AS PER REQUIREMENT. 1 7 5 35
MANPOWER SANCTION NOT AS PER REQUIREMENT 1 7 5 35
EXAMINATION FOR WORKMANSHIP CERTIFICATE NOT DONE
REGULARLY
1 0.5 5 2.5
7 POOR
SUPERVISION
NEGLIGENCE / LACK OF COMMITMENT 5 3 5 75
NOT HAVING PROPER KNOWLEDGE /EXPERIENCE 5 3 5 75
INADEQUATE TRAINING. 0.3 3 2 1.8
SHORTAGE OF SUPERVISORS. 5 7 5 175
8 LACK OF
AWARENESS
NON EXISTENCE OF DOCUMENTED PROCEDURES. 0.3 2 5 3
IMPROPER / INADEQUATE TRAINING 0.3 2 5 3
IMPROPER COMMUNICATION 0.1 7 5 3.5
INADEQUATE PUBLICITY /OBJECTIVE NOT EXPLAINED. 1 3 5 15
9 EMPLOYMENT
OF
CONTRACTORS
WORKERS
TRAINING OF CONTRACTOR WORKERS . 5 2 10 100
PROPER DEPTT. SUPERVISION. 5 2 10 100
STEP 3,TABLE: 7.3 -CONTROL MEASURES & PROCEDURES FOR RESPECTIVE MECHANISMS CONTRIBUTING
HAZARDS
FIRES
MECHANISM CONTROL RELEVANT
STATURE
PROCEDURE EXISTING
PROCEDURE
Y/N
RESPONSIBLE
PERSONS
EXPLOSIVES
MAGAZINE
PROPER CLEANING & MAINTAIN SAFE
DISTANCE .
EXPLOSIVE
RULE
Y MAGAZINE IN-
CHARGE
USE OF EXPLOSIVES / BLASTING
NOT TAKING
PROPER SHELTER
MONITOR THE EFFICACY OF TAKING
SHELTER.
MINES RULE
62, 63 &
MMR REG.
164
DRILLING &
BLASTING
PROCEDURE.
Y MINING MATE /
BLASTER
PERSONS NOT
WITHDRAWN
FROM DANGER
ZONE.
MARK THE DANGER ZONE
POSTING OF PROPER GUARDS BEFORE
BLASTING.
SAIRONS BEFORE BLASTING.
MINES RULE
62, & MMR
REG. 164
BLASTING
PROCEDURE .
Y MINING MATE /
BLASTER

WCS : EIA/EMP
98
SEARCHING OF
SOCKETS /
MISFIRED SHOT /
EXAMINATION OF BLASTING SIDE
AFTER BLASTING AND BEFORE START
OF DRILLING IN EVERY SHIFT.
PROPER DEALING OF MISFIRED
SHORTS .
MMR 166,
167 & 168
PROCEDURE
FOR DEALING
WITH MISFIRE
& SOCKETS.
BLASTING
Y
Y
MINING MATE,
BLASTER &
MINES
FOREMAN
BLASTER &
BLASTING
FOREMAN PROPER
HANDLING OF
EXPLOSIVES.
EXPLOSIVES NOT BE USED BY
UNAUTHORIZED AND UNQUALIFIED
PERSONS.
MMR REG.
158 (1),(2),(3)
& (4) , 161 ,
162
PROCEDURE
FOR HANDLING
OF EXPLOSIVE.
Y ASST. MANAGER
& BLASTING
FOREMAN.
MACHINERY
MECHANISM CONTROL RELEVANT
STATURE
PROCEDURE EXISTING
PROCEDURE
Y/N
RESPONSIBLE
PERSONS
MAINTENANCE
SCHEDULES NOT
FOLLOWED
IMPLEMENT, MONITOR & / OR TAKE
CORRECTIVE ACTION FOR NON
COMPLIANCE .
MMR REG.
2(9), 2 (15),
172
ISO-9001
PROCEDURE
DP/BK/MNT/
7.5.1 ISO
9001 WORK
INSTRUCTION
WI/BK/MNT
1-15
Y MANAGER /
FOREMAN
BY PASSING
PROTECTIVE
DEVICES
STOP MACHINE IF PROTECTIVE DEVICE
IS NOT FUNCTIONING.
MMR REG.
2(9), 2 (15),
117
ISO-9001
PROCEDURE
DP/BK/MNT/
7.5.1 ISO
Y MANAGER /
FOREMAN
UNSKILLED
OPERATORS
STOP MACHINE IF SKILLED OPERATOR
IS NOT PRESENT TRAIN MORE
DGMS TECH.
CIR, (1)/1989
UNSAFE
PRACTICES ACT
Y MANAGER /
FOREMAN
MOVING PARTS
OF THE
MACHINERIES
FENCE MOVING PARTS OF MACHINE
& DON'T ALLOW PEOPLE WEARING
LOOSE DRESSES.
MMR REG.
174, 176
UNSAFE
PRACTICES ACT
& STANDING
Y MANAGER /
FOREMAN
MOVEMENT OF
MACHINERIES AT
MINING FACES
NOT TO ALLOW THE WORKING OF
MAN AND MACHINERIES AT ONE
PLACE.
ISOLITE THE AREAS BY SUITABLE
FENCING.
PROPER SUPERVISION.
MMR REG.
176
ISO-9001
WORK
INSTRUCTION
WI/BK/MIN/
03
Y MANAGER /
FOREMAN
MOVEMENT OF
TRUCKS &
DUMPERS IN
HILLY AREAS
PROVIDE PROPER GRADED ROADS OF
PROPER WIDTH AND MINIMUM
TURNING ETC.
ONE WAY TRAFFIC PREFERABLE
MMR REG.
176, DGMS
TECH. CIR. NO.
1 / 1989
ISO-9001
WORK
INSTRUCTION
WI/BK/MIN/
03
.
Y MANAGER /
FOREMAN
FAILURE OF
BRAKES
REGULAR CHECKING AND INSPECTION
OF BRAKES .
PROVIDE DOUBLE BRAKING SYSTEM .
MMR REG.
176, DGMS
TECH. CIR. NO.
1 / 1989
ISO-9001
PROCEDURE
DP/BK/MNT/
7..5.1
Y MANAGER /
FOREMAN
OVER SPEEDING AVOID OVER SPEEDING. DGMS TECH. ISO-9001 Y MANAGER /

WCS : EIA/EMP
99
TRAFFIC SIGNALS ON ROAD TO BE
PROVIDED.
CIR NO. 1 /
1989
WORK
INSTRUCTION
WI/BK/MIN/
1-15
FOREMAN
REVERSALS AUTOMATIC REVERSING HORNS TO
BE PROVIDED ON DUMPERS.
PROVIDE SUPERVISION BY SPORTERS
DGMS TECH.
CIR NO. 1 /
1989
ISO-9001
WORK
INSTRUCTION
WI/BK/MIN/
1-15
Y MANAGER /
FOREMAN
OPEN CAST WORKINGS
MECHANISM CONTROL RELEVANT
STATURE
PROCEDURE EXISTING
PROCEDURE
Y/N
RESPONSIBLE
PERSONS
FAILURE OF
BENCHES /
WORKING ON
STEEP SLOPES
TO MAINTAIN BENCHES AS PER
SAFETY REGULATIONS.
REGULAR INSPECTIONS FOR BENCH
FAILURES AT THE BEGINNING OF THE
SHIFT AND DURING THE SHIFT BY
COMPETENT PERSONS.
MMR REG.
106 2(B)
WORK
PROCEDURE
FOR SAFETY IN
OPENCAST
WORKING , ISO
9001
PROCEDYURE
DP/BK/MIN/
7.1
Y ASST.
MANAGER,
MINES
FOREMAN,
WORKING ON
HIGH BENCHES
TO PROVIDE SAFETY BELTS AND
ROPES OR SUITABLE FENCING TO
PREVENT FALLING OF PERSONS FROM
HIGH BENCHES.
MMR REG.
106 2(B)
WORK
PROCEDURE
REG. WORKING
ON HIGH
BENCHES. ISO
9001 WORK
INSTRUCTION
NO.
WI/BK/MIN/
01,02 & 03
Y ASST. MANAGER
FALL OF STONES
AND SIDES
NOT WORKING ON THE FACES ONE
ABOVE ANOTHER.
WITHDRAWL OF PERSONS WORKING
ON THE NEXT BENCH DOWN BELOW
BEFORE ANY WORK REGARDING
DRESSING, CLEANING ETC. IS DONE
ON HIGHER BENCH .
MMR REG.
106 2(B), 111,
117
WORK
PROCEDURE
FOR SAFETY IN
OPENCAST
WORKING
Y ASST. MANAGER
FOREMAN,
SCATTERED
LOOSE BOULDE-
RS ON
WORKING
FACES
CLEAN WORKING FACES AT THE END
OF EVERY SHIFT .
MMR REG.
106 2(B), 117,
118
WORK
PROCEDURE
FOR SAFE-
FETY IN
OPENCAST
WORKING
Y ASST. MANAGER
FOREMAN
WORKING OF
MANPOWER
AND
MACHINERIES
TO TOTALLY STOP BY PROVIDING
FENCING / BEARER BETWEEN
MANUAL AND MACHINE WORKING
FACE .
MMR REG.
106, 2(B) ,
ISO 9001
PROCEDURE
DP/BK/MIN/
7.1
Y ASST. MANAGER

WCS : EIA/EMP
100
NEAR EACH
OTHER.
BREAKING OF
BOULDERS BY
MANUAL
LABOURERS
USE PROPER SLADGE HAMMERS FOR
BREAKING .
USE OF PROTECTIVE GOGALS AND
KNEE CAPS AND SAFETY HELMAT
WHILE BREAKING THE BOULDERS.
MMR REG.
118
ISO 9001
PROCEDURE
DP/BK/MIN/
7.1
Y ASST. MANAGER
STEEPS
GRADIENT OF
THE ROADS
,CURVES AND
BENCHES
PROPER LAYOUT OF ROADS.
ONE WAY TRAFFIC.
DGMS TECH.
CIRE NO. 1 /
1989
AS PER
REGULATION &
STANDING
ORDER.
Y ASST. MANAGER
DRILLING ON
HIGH BENCHES
USE SAFETY BELTS AND ROPES WHILE
DRILLING.
MMR REG.
106 2(B), 118
WORK
PROCEDURE
FOR OPENCAST
WORKING
Y ASST. MANAGER
LOADING OF
TRUCKS BY
MANUAL
LABOURERS
REMOVE LABOURERS FOR NEARBY
AREAS .
USE PROTECTIVE HELMETS
MMR REG.
118,
ISO
PROCEDURE
NO.
DP/BK/PQD/
7.5.5
Y ASST. MANAGER
MECHANISM CONTROL RELEVANT
STATURE
PROCEDURE EXISTING
PROCEDURE
Y/N
RESPONSIBLE
PERSONS
DUMPS
FAILURE OF
SLOPES BY
FLOWING RAIN
WATER
TO PROVIDE PROPER DRAINAGE
SYSTEM BEFORE RAINS.
REGULAR CLEANING OF DRAINS
AFTER EVERY HEAVY RAINS.
DGMS TECH.
CIR. NO.
1/1989,
MMR REG.
1995 & 96,
WATER
DRAINAGE PLAN
PRE MONSOON
& MONSOON
AUDIT.
Y ASST. MANAGER
DUMPING OF
OVERBURDEN
BY TIPPERS
NOT TO DUMP O/B AT THE EDGE
TO PROVIDE STOP BLOCK AT THE
EDGE.
TO DUMP THE O/B AT LEAST 2MTR.
WITHIN THE EDGE.
TO REMOVE PERSONS FROM THE TOE
OF THE DUMPS AND DUMPS SLOPES
DGMS TECH.
CIR. NO. 1/
1989
WORK
PROCEDURE
OVERBURDEN
DUMPING
AUDITING OF
DUMPING
PROCEDURE.
Y ASST. MANAGER
MECHANISM CONTROL RELEVANT
STATURE
PROCEDURE EXISTING
PROCEDURE
Y/N
RESPONSIBLE
PERSONS
POOR SUPERVISION
NEGLIGENCE /
LACK OF
COMMITMENT
MONITORING MOTIVATION &
ENFORCEMENT OF DISCIPLINE.
MMR REG.
41, 42, 46,47,
116
ISO 9001
PROCEDURE
DP/BK/-
MIN/7.1
Y MINES
MANAGER /
FOREMEN
NOT HAVING
PROPER
KNOWLEDGE
TRAINING & FEED BACK.
MMR REG.
41, 42, 46,47,
116
ISO 9001
PROCEDURE
DP/BK/-
Y MINES
MANAGER /
FOREMEN

WCS : EIA/EMP
101
/EXPERIENCE MIN/6.2.2
INADEQUATE
TRAINING.
TRAINING & FEED BACK.
MMR REG.
41, 42, 46,47,
116
ISO 9001
PROCEDURE
DP/BK/-
MIN/7.1
Y MINES
MANAGER /
FOREMEN
SHORTAGE OF
SUPERVISORS.
RECRUITMENT, TRANSFER & TRAIN
TO BECOME COMPETENT.
MMR REG.
41, 42, 46,47,
116
ISO 9001
PROCEDURE
DP/BK/-
MIN/7.1
Y MINES
MANAGER /
FOREMEN
MECHANISM CONTROL RELEVANT
STATURE
PROCEDURE EXISTING
PROCEDURE
Y/N
RESPONSIBLE
PERSONS
LACK OF AWARENESS
NON EXISTENCE
OF
DOCUMENTED
PROCEDURES.
DOCUMENT ALL PROCEDURES &
ISSUE TO CONCERNED PERSONS.
MMRS REG.
42
ISO 9001 &
14001
EXISTING
Y MINES
MANAGER /
FOREMEN
IMPROPER /
INADEQUATE
TRAINING
TRAINING & FEED BACK.
- - ISO 9001
PROCEDURE
DP/BK/VT/6.
2.2
Y MINES
MANAGER /
FOREMEN
IMPROPER
COMMUNICATIO
N
DETAILED WRITTEN
COMMUNICATION EITHER BY LETTER
OR ON NOTICE BOARD.
- ISO 9001 &
14001
EXISTING
Y MINES
MANAGER /
FOREMEN
INADEQUATE
PUBLICITY
/OBJECTIVE NOT
EXPLAINED.
EXPLAIN THE OBJECTIVE.
- ISO 9001 &
14001
EXISTING
Y MINES
MANAGER /
FOREMEN
MECHANISM CONTROL RELEVANT
STATURE
PROCEDURE EXISTING
PROCEDURE
Y/N
RESPONSIBLE
PERSONS
EMPLOYMENT OF CONTRACTORS WORKERS
TRAINING OF
CONTRACTOR
PERSONS.
PROPER TRAINING & FEED BACK MVTR 1996
RULE 6 TO 11
ISO 9001
PROCEDURE
DP/BK/VT/6.
2.2
Y MINES
MANAGER /
FOREMEN
-----------

WCS : EIA/EMP
102
8.0.0 CHAPTER VIII
PROJECT BENEFITS
8.1.0 Improvement in physical infrastructure:
• Infrastructure facilities like communication facilities, construction of roads and buildings etc., for
the project will be helpful for the nearby villages.
• Regular movement of trucks between mines and Sangrah will also provide additional facility for
nearby population for going to market and returning back.
• We are proposing fruit trees and local species in Van Panchayat land suitable for fuel wood and
also fodder for the local population. Therefore at the end of mining the area will be a source of
income for nearby poor people.
• The afforestation programme provided will improve forestry activities in the reclaimed area which
will be suitable for not only fauna of the area but also cattle population.
8.2.0 Improvement in social infrastructure:
• We are making provision for expenses on scholarships, books and stationary, school uniform and
tuition fee for the needy students.
• Small land farmers who do not have adequate income from their land will find alternative
employment at the mine.
• We are going to provide employment to unskilled male and female worker.
• Regular medical checkups of the surrounding population and the record keeping will be helpful in
increasing their health standards.
• Vocational training will be provided before employment of surrounding workers.
• The proposal will help in increasing the income level of the local population as a result of indirect
employment.
• This will also help in the health and education awareness of the general public.
• The increased transportation and communication facilities will provide additional facility for
storage of milk, transportation to the far off places for the local population.
• The community development programmes which will be enforced after proper feedback from the
people will take care of their needs as to co-operative societies for milk and milk products, wool
and woolen made products and will take a shape of cottage industry in the area.
8.3.0 Employment Potential:
List of manpower proposed department wise and category wise for production of 81,053 tonne/
annum of Limestone is given below:-
Table: 8.1 – Employment Potential
Head Category Existing Proposed
Managerial /
supervisory staff
Mining Engineer cum Mines Manager
1st
class certified
- 1
Mines foreman 1 1
Mining mate cum blaster 1 2
Mechanical Engineer (part time) - 1
Mechanical foreman - 1
Vocational training officer (part time) - 1

WCS : EIA/EMP
103
Geologist part time 1 1
Sub Total : 3 8
Skilled Operators for excavator - 2
Compressor operator 1 2
Wagon drill operator - 1
Dumper operator 1 2
Dozer operator 1 1
Sub Total : 3 8
Semi- skilled Drillers jack hammer 2 4
Wagon drill helpers - 2
Excavator helper / spoter - 2
Mechanic - 1
Mechanic helper - 1
Record and register keeper 1 2
Security guards 1 1
Mining workers Opencast 15 40
Gardner / Mali - 1
Sub Total : 19 54
Unskilled Mineral sorting labour 3 10
Environment – for construction of
retaining walls water drains etc. and
plantation work.
1 3
Sub Total 4 13
G. Total 29 83
8.4.0 Salary structure:
Present salary structure applicable for unskilled, semi-skilled and skilled workers will be as per
payment of Wages Act and Central (Rules) applicable in the state of Himachal Pradesh from time to
time.
8.5.0 Other tangible benefits
• The mining of limestone and dolomite in the region would usher in setting up of down stream
industries helping in both direct & indirect employment.
• The mineral Limestone is used in paper, cement & other industries as raw material which would
help in growth of such industries.
• The government will be benefited by way of levies and duties.
----------

WCS : EIA/EMP
104
9.0.0 CHAPTER IX
ENVIRONMENTAL COST BENEFIT ANALYSIS
9.1.0 Financial provisions
9.1.1 Capital cost for mining & environment
1. Purchase of machineries Rs. 45 lakh.
2. Road & ramps construction Rs. 5 lakh
3. Development of office shed, workshop, magazine Rs. 5 lakh
4. Preparation of mining plan & other permissions financial assurance – Rs. 15 lakh.
Total Rs. 70 lakh
9.1.2 Operating cost
1. Staff salary Rs. 50/- PMT
2. Drilling and blasting Rs. 30/- PMT
3. Excavation & handling of waste Rs. 100/- PMT
4. Mineral sorting / sizing Rs, 40/- PMT
5. Environment control measures Rs. 20/- PMT
6. Community development programmes Rs.20/- PMT
7. Royalty dead rent and taxes Rs. 80/- PMT
8. Compensation to samlat Rs. 15/- PMT
9. Transportation of mineral to plant Rs. 40/- PMT
9.2.0 Funds for flora and fauna management plan:
Table: 9.1 – Funds for flora & fauna management
S. No Description Rs. in lakhs
A Capital cost
1 Afforestation program 1.00
2 Artificial nests, feeding and watering arrangement For birds 0.50
3 Construction of water holes & check dams etc. 1.50
Total amount 3.00
B Yearly maintenance cost
1 Afforestation program 1.50
a Development of strips for riparian species 0.50
b Tree plantation ,& other places on barren hills in consultation with the
Panchayat & forest department
0.50
c Habitat for grazing animals will be developed at suitable location in
consultant with Panchayat
0.50
2 Awareness program, Sign boards, cultural program to create awareness for
flora & fauna
0.50
3 Feeding and watering arrangements for birds & wild life etc 0.50
4 Vaccination program for cattle 0.20
5 Constrcution of Gaushala 0.50
Total amount 3.70

WCS : EIA/EMP
105
9.3.0 Environment Cost (Budget for environmental and occupational health activities)
Table: 9.2
S.
No.
Capital cost Annual recurring cost
Existing Proposed Existing Proposed
1 Pollution Control (Separately provide
break-up)
a Protective works for waste dump
management including construction of
retaining wall/ water drains, terraces &
maintenance of check dams etc.
NIL 3.0 1.0 1.5
2 Pollution Monitoring (Separately provide
break-up)
a Staff Salaries NIL -------- 1.0 2.0
b Environment monitoring studies NIL 1.0 0.5 1.5
3 Occupational Health ----- 0.5 0.5
4 Green Belt
a Mine NIL 1.0 0.25 0.5
b Township NIL 0 0 -
5 Reclamation / Rehabilitation of mined
out area
NIL 2.5 0.5 1.0
6 Others (specify)
a Awareness and training programme &
celebration of safety and environment
week.
NIL ---- 0.25 0.5
b Fauna management NIL 0.5 0.25 0.5
c Protective Equipments NIL 1.0 0.50 1.0
Total 9.00 4.75 9.0
9.4.0 Expendture incurred on village development programme so far is as follows
Table – 9.3 Expenses from year 1998-2011 (Bhootmarhi & sangrah)
YEAR Amount in Rs .
Payments of the Year 1998 425000.00
Payments of the Year 1999 60000.00
Payments of the Year 2000 40000.00
Payments of the Year 2001 40000.00
Payments of the Year 2002 75000.00
Payments of the Year 2003 40000.00
Payments of the Year 2004 114525.00
Payments of the Year 2005 112043.00
Payments of the Year 2006 46000.00
Payments of the Year 2007 305000.00
Payments of the Year 2008 361000.00

WCS : EIA/EMP
106
Payments of the Year 2009 230000.00
Payments of the Year 2010 128000.00
Payments of the Year 2011 50000.00
Total 2026568.00
Details of expenses are enclosed as Annexue No XV.
9.5.0 Budget for future village development programme is given in table No 9.4
Table No: 9.4 Budget for next five years
S
No.
Programme Yearly amount
Proposed (Rs.in lacs).
1- Aids in school in surrounding villages
Subsidy for salary of teachers.
Scholarship to the needy students.
Free distribution of books & uniforms to the students.
Construction of rooms/ toilets & other facilities for school.
1.00
2- Medical camps - Free distribution of medicines, aids in hospitals,
dispensaries in form of extension, construction and supply of equipments.
0.50
3 Construction of water tanks near water stream and connecting tanks by
pipelines to nearby villages for supply of water.
1.0
4 Subsidy for fuel saving devices solar cooker, gas cylinders, kerosene oil etc to
the employees/ local people within the lease area.
1.0
5 Training & awareness programmes on improved farming practices /
afforestation programmes
0.5
6 Plantation programme in villages/ Van Panchayat & payment of salary to
Forest Security Guards.
1.0
7 Assistance for Pesticides /Seeds/ Vermi compose/ Fertilizer 0.25
8 Free distribution of plants & also assistance in plant maintenance watering
etc. in van panchayat / nearby houses etc as a afforestation programme.
0.25
Total : 5.50/ Year
9.6.0 Marketing – This mine would produce all grades of Limestone for which there is a ready market.
9.7.0 Economic viability – The cost of production will take care of capital investment and also sale
value of the mineral based on the experience of mining in similar type of deposit in this area.
----------

WCS : EIA/EMP
107
10.0.0 CHAPTER – X
ENVIRONMENT MANAGEMENT PLAN
10.1.0 Introduction
The environmental management must be integrated into the process of mine planning so that
ecological balance of the area is maintained and adverse effects are minimized. Environmental
Management Plan (EMP) requires multidisciplinary approach. EMP can further be modified/
upgraded time to time by taking advice from experts in the respective fields (forests, soil chemistry,
ground water etc.), during the course of mining. EMP covers all phases of the project considering the
impacts with mitigation measures and monitoring programme.
10.2.0 Monitoring and Feedback System
In the previous chapters different aspects of project, baseline data on environment, environment
impact assessment, environment management plan, and monitoring programmes including
measurement methodologies frequency etc. have been discussed.
In this chapter the administrative aspects of implementation procedure for conditions of grant of
environmental clearance, performance, appraisal, and correction of methodology including
monitoring and feedback system in different aspects are dealthwith.
In this project a team of qualified personnel including mining engineer, environment engineer,
mechanical engineer, welfare officer, horticuluturist are provided Number of other welfare activities
including health check up etc are planned to be outsourced as per the environment policy of the
campany.
10.3.0 The Organizational structure proposed is given below:
Fig No : 8

WCS : EIA/EMP
108
10.4.0 EMP should essentially include monitoring programs and management control strategies for
minimizing the adverse impacts:- Subsidence , land slides & disturbance of the land use pattern of the
area and land reclamation & rehabilitation programme besides implementation of provisions of mine
closure plan.
• Implementing the provisions of environment management plan, for control of air pollution, water
quality, noise level, vibration, soil quality, water table etc.
• Implementing the provisions of waste dump management, top soil management etc.
• Biological reclamation of the area and management of flora & fauna
• Socio-economic and cultural environment
• Community development programmes, health and safety of the persons affected by the mining
project, rehabilitation programme etc.
10.5.0 The scope and responsibility of the environmental department headed by a competent
person/ engineer will be as follows:
• Monitoring the programme of implementation according to the schedules fixed.
• Maintaining the records in suitable formats of performance in daily, weekly, monthly and yearly
basis for all activities.
• Carrying out regular surveys and updating the plans and records.
• Analysis of data.
• Interaction between concerned departments and to obtain expert guidance where necessary.
• To prepare the scope of modifications alteration and change.
• Training and awareness on mining and environment technology.
• Submitting the half yearly report to Ministry of Environment and Forest, Pollution Control Board,
Central Ground Water Board for compliance of environment clearance.
• For better functioning of the system formation of committees like Pit Safety Committee,
Environment Committee, Socio Environment committee, and these committees shall be formed
with the composition of mining staff, environmental experts, local representative from
Panchayats or senior citizen of the area, the government authorities, and such committees shall
meet at least twice a year. Sub committee may also be formed wherever necessary to increase
the frequency of coordination.
10.6.0 Environment Management Policy
The company has an environment management Policy. It includes environmental objective,
mechanism to be installed for achieving environmental objectives, environment monitoring
programmes, structure & responsibility (as discussed above), training & awareness programmes,
mine owner responsibilities and follow up programme , reporting system etc as discussed in detail in
Environment Management Policy placed at annexure no XII.
----------
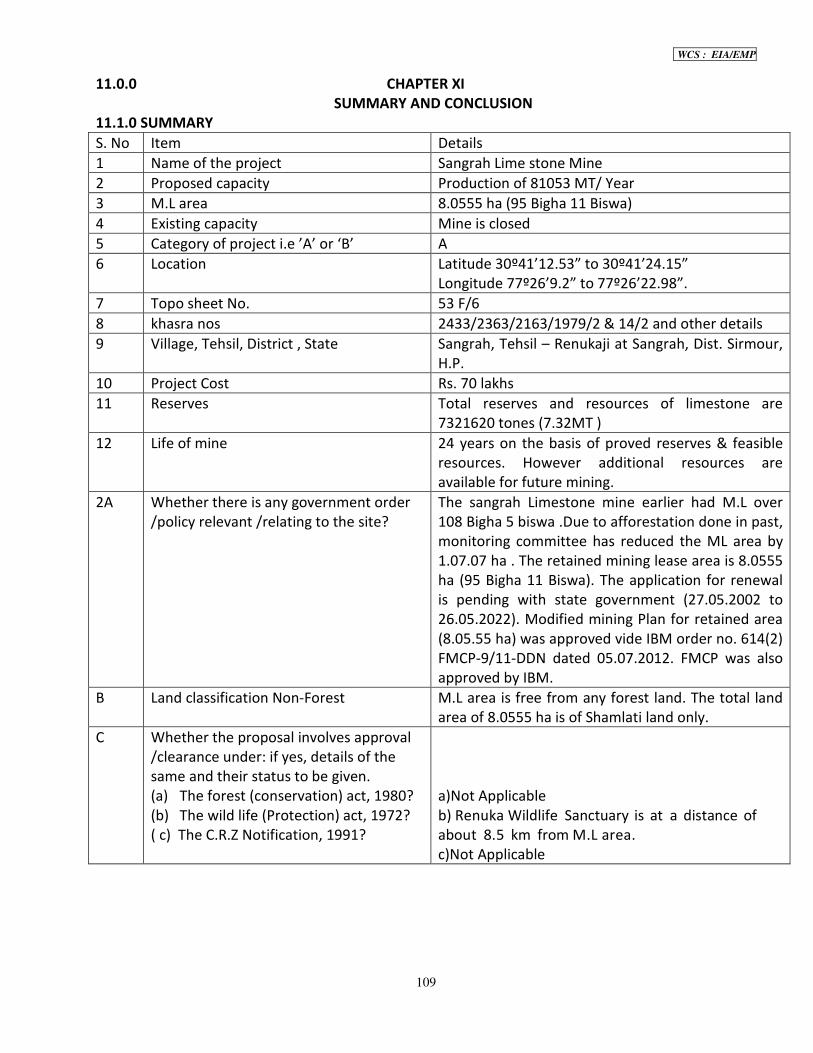
WCS : EIA/EMP
109
11.0.0 CHAPTER XI
SUMMARY AND CONCLUSION
11.1.0 SUMMARY
S. No Item Details
1 Name of the project Sangrah Lime stone Mine
2 Proposed capacity Production of 81053 MT/ Year
3 M.L area 8.0555 ha (95 Bigha 11 Biswa)
4 Existing capacity Mine is closed
5 Category of project i.e ’A’ or ‘B’ A
6 Location Latitude 30º41’12.53” to 30º41’24.15”
Longitude 77º26’9.2” to 77º26’22.98”.
7 Topo sheet No. 53 F/6
8 khasra nos 2433/2363/2163/1979/2 & 14/2 and other details
9 Village, Tehsil, District , State Sangrah, Tehsil – Renukaji at Sangrah, Dist. Sirmour,
H.P.
10 Project Cost Rs. 70 lakhs
11 Reserves Total reserves and resources of limestone are
7321620 tones (7.32MT )
12 Life of mine 24 years on the basis of proved reserves & feasible
resources. However additional resources are
available for future mining.
2A Whether there is any government order
/policy relevant /relating to the site?
The sangrah Limestone mine earlier had M.L over
108 Bigha 5 biswa .Due to afforestation done in past,
monitoring committee has reduced the ML area by
1.07.07 ha . The retained mining lease area is 8.0555
ha (95 Bigha 11 Biswa). The application for renewal
is pending with state government (27.05.2002 to
26.05.2022). Modified mining Plan for retained area
(8.05.55 ha) was approved vide IBM order no. 614(2)
FMCP-9/11-DDN dated 05.07.2012. FMCP was also
approved by IBM.
B Land classification Non-Forest M.L area is free from any forest land. The total land
area of 8.0555 ha is of Shamlati land only.
C Whether the proposal involves approval
/clearance under: if yes, details of the
same and their status to be given.
(a) The forest (conservation) act, 1980?
(b) The wild life (Protection) act, 1972?
( c) The C.R.Z Notification, 1991?
a)Not Applicable
b) Renuka Wildlife Sanctuary is at a distance of
about 8.5 km from M.L area.
c)Not Applicable

WCS : EIA/EMP
110
3. Detail of uses of mineral Lime Stone LD & Non- LD in different Industries & Applications.
The uses of above limestone resources in different industries are established.
These are:
1. Steel & Lime Industries (55 %)
2. Glass & soap industries (25%)
3. Chemical & sugar Industries (20%)
4. Environment Clearance status: - ToR approved by MoEF vide letter No J-11015 /86/2012-IA. II (M)
dated 5th
November, 2013.EIA /EMP are under preparation for public consultation through HPCB.
Public hearing arranged by Himachal Pradesh State Pollution Control Board on 22nd
March, 2014.
11.2.0 CONCLUSION
This mining project is planned to produce mineral Limestone suitable for various industries like
cement, iron, Limekiln, etc. using environment friendly and appropriate mining and mineral
beneficiation technology.
Implementation of mining projects would generate employment to locals to the extent of 86 persons.
In addition it would generate indirect employment and pamper establishment of down stream
industry.
Training and awareness activities supplemented by community development programmes will
improve the overall environment and life style of the inhabitants.
Green belt development would be done and workers would be motivated for plantation not only in
mining lease area but also in govt. waste land / Panchayat land. The local population will be
encouraged to plant fodder / fruit trees/ fuel wood so that their dependence on forest is reduced.
The adequate technology, environmental strategy etc have been planned which will maintain the
ecological balance and also ensure health & safety of the persons.
…………….

WCS : EIA/EMP
111
12.0.0 CHAPTER XII
DISCLOSURE OF CONSULTANTS ENGAGED
12.1.0 Wolkem Consultancy Services (A Division of Wolkem India Limited) has been associated with
mineral /mining projects located in Rajasthan, Uttarakhand, Tamil Nadu, Kerala for Wollastonite,
Calcite, Limestone, China Clay and Soapstone deposits.
The Wolkem Consultancy Services (WCS) is accredited by NABET under “A”Category for Sectors
namely 1) Mining of minerals including Opencast /underground mining, 2) Mineral beneficiation
including pelletisation & 3)Pesticides industry and pesticide specific intermediates (excluding
formulations).
WIL laboratory is fully equipped with sophisticated equipments. It is accredited by NABL (Certificate
No T -2016). It is also recognised by Rajasthan State Pollution Control Board.
During Last seven years of formation of WCS number of mineral projects for Mining plan /scheme,
Environment Clearance have been taken which were approved by statutory authorties.
Table: 12.1
Nature of consultancy Name and address of the
consultant
Brief resume of the consultant organization
including approvals, if any (NABL/ DGMS/
IBM/ NRBPT/ MOEF/ CPCB / others etc), Give
ref No.
EIA/EMP Wolkem Consultancy
Services.(A Division of
Wolkem India Ltd.)E-101,
MIA, Udaipur,Phone No.
0294-6452067
NABET & MoEF approval letter enclosed at
Annexure-IX.
Environmental
monitoring& analysis
Environmental laboratory
division,
Wolkem India Limited, E-
102, MIA, Udaipur ,
Rajasthan
NABL accredited letter enclosed at Annexure-
X.
The Laboratory is also recognized by Rajasthan
state pollution control board.
Modified Mining Plan By Wolkem limited RQP No. RQP/UDP/ 330/2007/B valid upto
24.10.2017.
EIA COORDINATOR Wolkem consultancy
services
Mr. P.M. Jain, (in house) Approved for mining
projects by NABET for “A” category.
Mr. K.P. Agrawal (in house) Approved for
Mining projects by NABET for “A” category.
Dr. S.K Yadav & Mr. Maheep Kapoor,
associated.
FUNCTIONAL AREA EXPERTS :

WCS : EIA/EMP
112
Geology Wolkem Consultancy
Services
Mr. Manoj Bhatnagar, in house Approved by
NABET for “A” category.
Mr. K.P. Agrawal, in house Approved by NABET
for “A” category.
Noise & vibration Wolkem Consultancy
Services
Mr. P.M.Jain, in house Approved by NABET for
“A” category.
Soil conservation Wolkem Consultancy
Services
Dr. S. K. Yadav, in house Approved by NABET
for “A” category.
Mr. Maheep Kapoor in house Approved by
NABET for “B” category.
Hydro geology, ground
water & water
conservation
Wolkem Consultancy
Services
Mr. Manoj Bhatnagar, in house Approved by
NABET for “A” category.
Mr. K.P. Agrawal, in house Approved by NABET
for “A” category.
Ecology & Biodiversity Wolkem Consultancy
Services
Mr. Maheep Kapoor, in house Approved by
NABET for “A” category.
Socio economics Wolkem Consultancy
Services
Mr. N.S. Chundawat, in house approved by
NABET for “B” category.
Air pollution,
prevention, monitoring
& control
Wolkem Consultancy
Services
Mr. P.M. Jain, in house Approved by NABET for
“A category.
Mr. Vikram Reger, in house AFAE approved
under B category.
Mr. Manish Kumawat, in house AFAE approved
under B category.
Water pollution,
prevention, monitoring &
control
Wolkem Consultancy
Services
Mr. K.P. Agrawal in house Approved by NABET
(Only Mining) for “A” category.
Mr. Vikram Reger & Mr. Manish Kumawat, in
house AFAE
Land use Wolkem Consultancy
Services
Mr. K.P. Agrawal in house Approved by NABET
for “A” category.
Risk assessment &
hazard management
Wolkem Consultancy
Services
Mr. P.M.Jain, in house Approved by NABET
(Only Mining) for “A” category.
Solid waste & hazardous
waste management
Wolkem Consultancy
Services
Mr. P.M.Jain, in house Approved by NABET
(Only Solid waste- Mining) for “A” category.
Ambient air quality
impact prediction.
Wolkem Consultancy
Services
Mr. K.V. Ramesh, Empanelled FAE, approved
by NABET for “B” category.
Mr. Vikram Reger & Mr. Manish Kumawat, in
house AFAE
Other Experts
Geologists Mr. Mahesh Kumar Khedekar & Manish Vairagi
Surveyor Mr. Imam basha
Autocad draftsman Mr. Sunil Sharma, Bhupendra Jhalora
Software & other facilities available – Data Mine ,Autocad , Civil 3 D , Aermod software , GIS , Plotter

WCS : EIA/EMP
113