environmental impact assessment of mining · pdf fileenvironmental impact assessment of mining...
TRANSCRIPT
ENVIRONMENTAL IMPACT ASSESSMENT OF MINING RELATED DEWATERING ACTIVITIES USING INTEGRATED INSAR, OPTICAL REMOTE SENSING AND
PUMPING DATA
Tsehaie Woldai*, Jim Taranik International Institute for Geo-Information Science and Earth Observation (ITC), Hengelosestraat 99, PO Box 6, 7500
AA Enschede, The Netherlands ([email protected]) Arthur Brant Laboratory for Exploration Geophysics, Mackay School of Earth Sciences and Engineering, Dept.
University of Nevada, Reno, Nevada 89557-0138, USA ([email protected])
Commission VII, WG VII/2
KEY WORDS: Interferometric SAR, EIA, Subsidence, Dewatering, Mining ABSTRACT: Open pit mining sometimes intercepts highly permeable zones, with resulting high inflows of water into the excavation area. This remains a major problem in the mining industry and requires constant monitoring throughout the mining operation and beyond. In this paper, the environmental impact of an open-pit mining with intensive dewatering activities is assessed using Interferometric SAR. We use differential InSAR observations integrated with optical remote sensing images, groundwater pumping and site geologic and soil datasets to model and interpret hydrologically induced subsurface volume stain (volumetric shrinkage) distributions associated with the dewatering operation. Analysis of numerous DInSAR pairs spanning the period 1993 to 2001, reveals the abrupt appearance of these deformation signals to intervals of a few to several months. The ground deformation signals can be seen in all the interferograms used, thus ruling out the possibility of any atmospheric propagation changes which can be linked to a specific radar image. Along a section through the anomaly, we relate the modelled volume stain to dewatering associated changes in the groundwater levels at monitoring wells.
1. INTRODUCTION Dewatering is a significant engineering design component and on-going operational cost at most large scale open pit and underground mining operations. In most developed nations, the mine dewatering plan, expected environmental consequences and proposed monitoring procedures are carefully delineated in a government required environmental impact statement (EIS). Despite the significant investments in these studies and monitoring, as dewatering progresses, unanticipated geologic variations may lead to non-uniform dewatering responses of the upper aquifer layers. These non-uniform lateral responses and associated strain concentration, on occasion, may lead to shallow centimetre scale subsidence, fault reactivation and/or earth fissures.
To maintain a dry pit during mining, an array of deep wells are installed surrounding the mine and pumped at high rates to locally depress the groundwater level below the deepest level of mining operations conducted at any time. This mine dewatering operation however, can have a negative impact on the surrounding terrain. It can lead to land surface disturbance. Surface structures may be damaged by tilting or lowering of the land surface as a result of ground subsidence. The latter requires constant monitoring throughout the mining operation and beyond. Conventional ground-based subsidence monitoring makes use of digital levels and GPS with a height resolution of a few millimetres on a point-by-point basis. The method allows the precise monitoring of land subsidence at the selected grid of
points, but for large areas, the technique has some limitations; it is time consuming, labour intensive, involve higher cost and rely on sparse sampling network. Differential interferometric synthetic aperture radar (DInSAR) on the other hand, is cost-effective and offers a unique means of mapping ground surface deformation and assessing its impact on the terrain. In this study, actual surface deformation signals associated with groundwater pumping is investigated in order to demonstrate that InSAR is a suitable tool for environmental impact assessment (EIA) of ground surface deformation in mining related dewatering activities. We focused our study in the Pipeline Mine; an ongoing open pit gold mine located in the southwest side of the Crescent Valley (Fig.1)., along the Cortez/Battle Mountain trend in north-central Nevada, USA. Accessibility to the study area is via Nevada State Highway 306, that extends southward from U.S. Interstate 80; both of which are paved roads. The climate in the study area is characterized by low precipitation, high evapotranspiration and extreme daily variations in temperature. Over the last ten years, an average monthly precipitation ranging from 0 to 9 cm with an average annual precipitation of 22 cm is recorded at CGM’s meteorological stations (U.S. Department of Interior, 1999; Geomega, 2002a). Most of the precipitation is in the months of November through May. June through October is generally dry, although thunderstorms can create wet periods. The average monthly temperatures range from -5º C in December to almost 39º C in July (McCusker, 2004). Soils in this area are fragile and easily disturbed, and may not recover from disturbance on their own (Zones, 1961).
191
The International Archives of the Photogrammetry, Remote Sensing and Spatial Information Sciences. Vol. XXXVII. Part B7. Beijing 2008
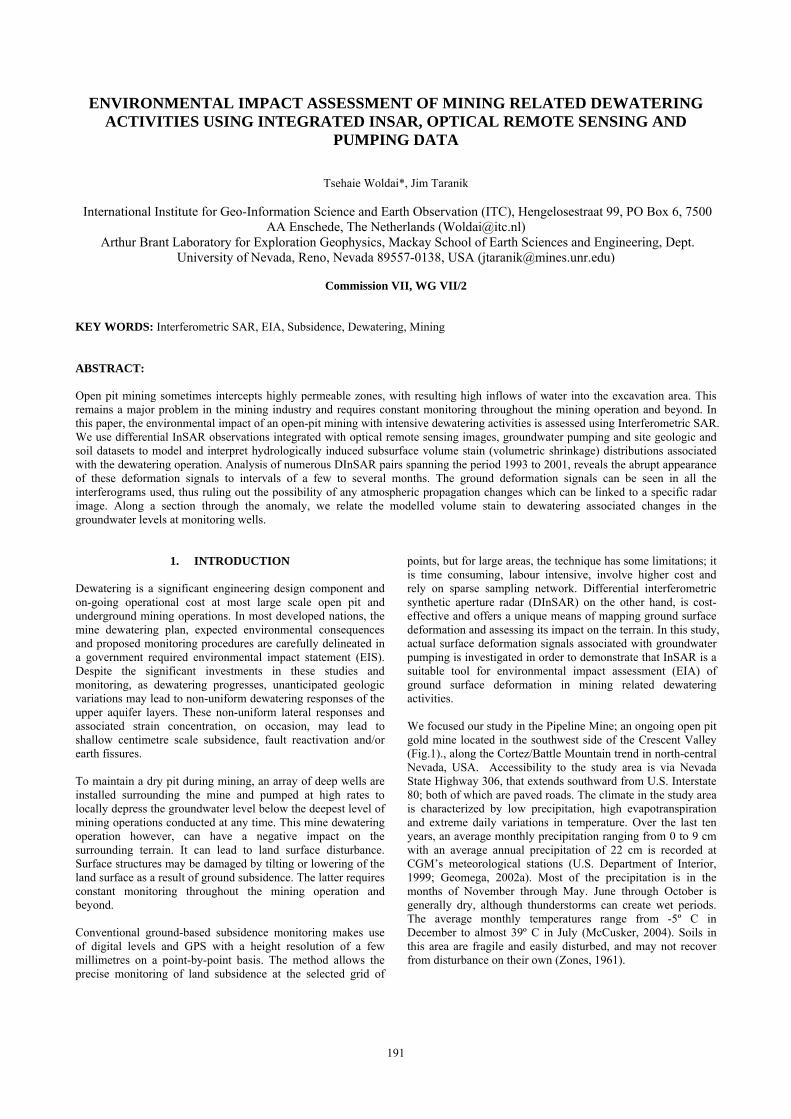
Figure 1. Location of the study area: a) modified after Amec (2004) and b) Landsat TM data of 1991 (VNIR bands 1, 2 and 3 in RGB
order) representing the Crescent Valley and surroundings where the current investigation is undertaken. This study area was selected primarily because it exhibited a very usable dewatering deformation response in the available InSAR data and the accessibility of suitable public domain daily groundwater data (NDWR, 2005) including geological/soil/mining information and EIA reports (Bureau of Land Management, 2000a, AMEC, 2004) to allow an assessment of the site and help place the results in context. The area is also well suited for the application of InSAR, because of its arid environment. In addition, Landsat TM and ASTER datasets were applied for understanding the spatial properties of landforms including: delineating of the open-pit area, waste dumps, infiltration area and other land-use patterns.
2. INTERFEROMETRIC SYNTHETIC APERTURE
RADAR The application of InSAR in Earth science and environmentally related problems has rapidly receiving much attention thanks to the spectacular results achieved in various fields, some of which include: the monitoring of land subsidence (Fielding et al. 1998; Galloway et al. 1998; Hoffmann et al. 2001; Massonnet et al. 1997;), the construction of high accuracy Digital Elevation Models (DEM's) of the Earth's surface (Zebker and Goldstein, 1986; Zebker et al., 1992) and EIA of mining subsidence (Chung et al., 2004). Although most applications published to date have been to high-rate deformation fields over short time periods, it has recently been shown (Amelung et al., 1999, Wright and Stow 1999; Wegmüller et al., 2000) that low-rate
deformation fields such as those originating from dewatering activities in mining operations can be imaged over time periods of one or more years depending on orbital baseline distances, vegetation cover and the climate of the region imaged (Woldai et al., 2008 in Press). 1.2 Raw data selection and processing We used raw unprocessed ERS1/ERS2 SAR scenes (Tracks 442, Frame 2799) in this study (see Table 1). The scenes comprise of C-band images (56.6mm wavelength), spanning the period 1991 to 2002, and collected in descending mode, VV polarized radar operating from an altitude of 785km with a mean look angle of 23º. In the selection of the interferometric pairs, we used 6 interferograms with the smallest perpendicular baseline (Bperp) component of up to 300m, although two images with Bperp between 330m and 400m were found useful. We also concentrated on orbit pairs of different time spans (less than 4 years) in order to capture short- and long-term deformation signals. These were processed intro interferograms using the Repeat Orbit Interferometry Package (ROI PAC) software V2.2.2 developed at the Jet Propulsion Laboratory and the California Institute of Technology (JPL/Caltech). Topographic effects were removed from the interferograms using Space Shuttle Radar Topography Mission (SRTM) 30 meter digital elevation models (DEM). Resulting interferograms were geo-referenced with in ROI_PAC to the UTM, North American Datum 27 and a subsection surrounding the Pipeline Mine was extracted for analysis.
192
The International Archives of the Photogrammetry, Remote Sensing and Spatial Information Sciences. Vol. XXXVII. Part B7. Beijing 2008
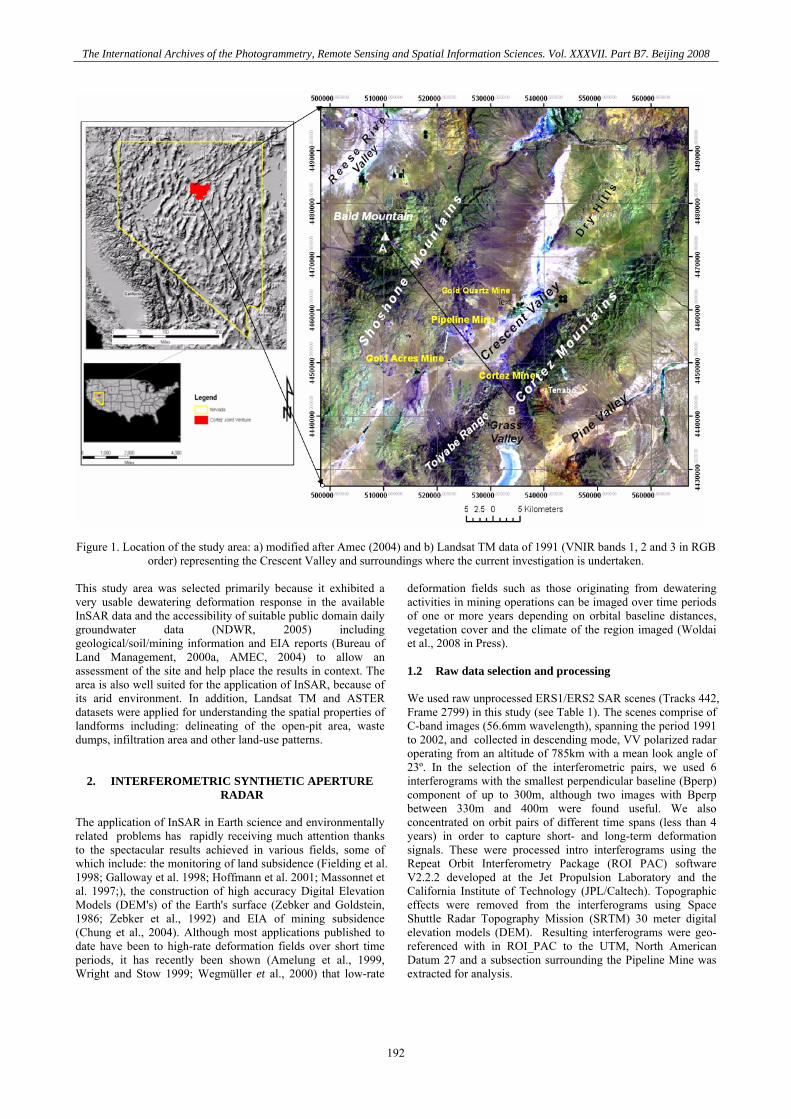
Table 1. Raw ERS SAR data used for the study area. Table 2. ERS SAR pairs used in the study area 2.2 Results and analysis The InSAR-generated pairs of the study area for the period August 23, 1993 to November 15, 2001 (see Table 2) show at least three areas of coherent signals indicating inflation and deflation. These signals are located in the Crescent Valley (Fig. 2); in the area surrounding the Pipeline Mine (denoted as A), the Frome infiltration site (denoted as B) and the Attenburg hill area (denoted as C). One cycle of phase difference (0-2π; 1 fringe) corresponds to 28mm of change in radar line-of-sight (LOS, range) displacement, or 31mm of vertical ground displacement (subsidence or uplift). The fringe colour patterns as shown in Fig.2 effectively form a surface relief contour image representing “height” change over a specific time period. Horizontal travel into or out of an apparent ground subsidence bowl is inferred from the sequence of interferogram fringe colours in that direction. A short horizontal traverse crossing any segment of the Blue-Green-Yellow-Red colour sequence (referred to as the warming colour sequence) moves locally in the direction of increasing range displacement representing subsidence (a negative phase cycle). Travel across a reverse colour-order segment (referred to as cooling colour sequence) moves locally in the direction of decreasing range displacement might represent uplift. A circular subsidence bowl, hence, is indicated by concentric colour rings with a consistent warming colour sequence oriented toward its centre. The applicability of the above interpretation assumes vertical surface movement dominates over horizontal. Notably, an interferogram actually reveals a map of the change in range (distance) from the satellite to the ground. Commonly, as in this study, the viewing angle is near vertical (about 23 degree), which results in vertical sensitivity at least 2.4 times greater than the horizontal. Additionally, subsidence and inflation can only be defined as apparent and relative, as the zero change datum has to be estimated from the fringe pattern and geologic context. We also note that tracing and interpreting the fringe pattern is often not possible in all areas of the interferogram. In some areas, fringes colours may be closely-spaced or are absent and in other areas they are obscured by short wavelength ground de-correlation noise. The ground displacements signal in A (see Fig. 2) extends up-to 15km by 15km in length in a northwest and northeast direction. Although the maximum subsidence within P2, P3 and P5 as shown in Fig.2 exceeds 85-100mm of range increase (between three to three and half colour fringes), the subsidence within Pairs 4 and 6 is restricted to 28- 40mm (around one to one and half fringe) between the north-eastern margin and the Pipeline Mine. The deformation in A is manifested in all the interferograms used, thus ruling out the possibility of any atmospheric propagation change which can be linked to a specific radar image.
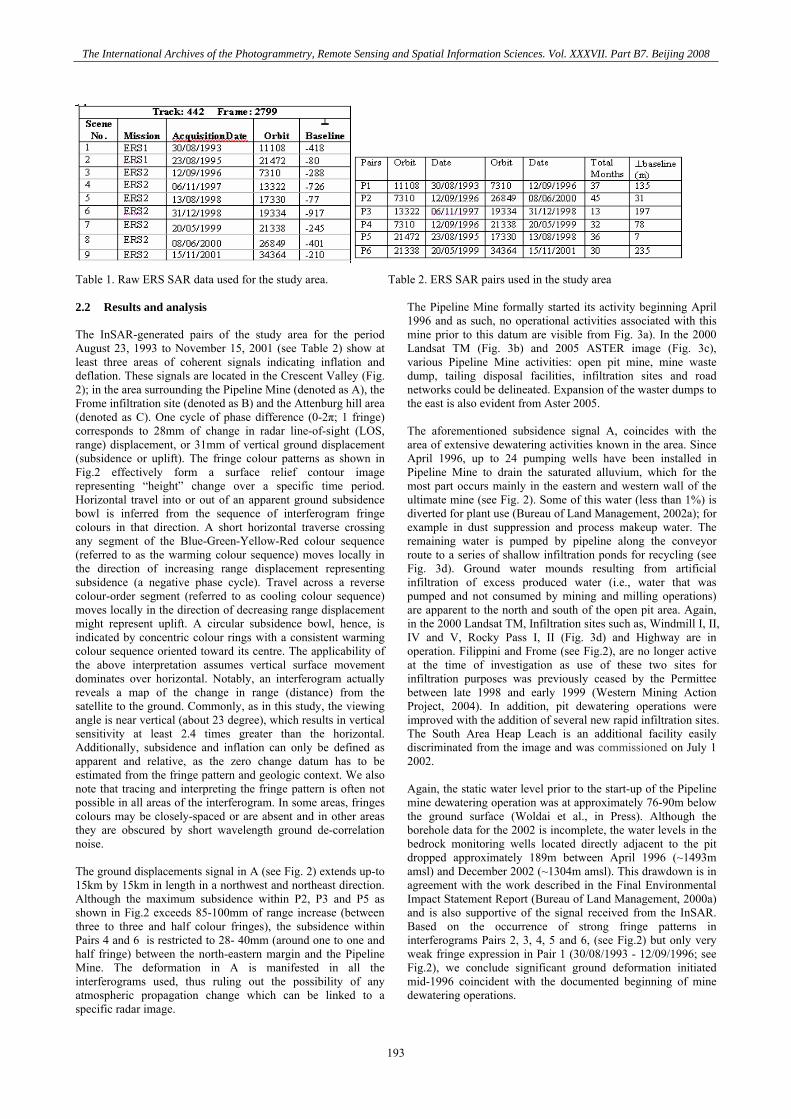
The Pipeline Mine formally started its activity beginning April 1996 and as such, no operational activities associated with this mine prior to this datum are visible from Fig. 3a). In the 2000 Landsat TM (Fig. 3b) and 2005 ASTER image (Fig. 3c), various Pipeline Mine activities: open pit mine, mine waste dump, tailing disposal facilities, infiltration sites and road networks could be delineated. Expansion of the waster dumps to the east is also evident from Aster 2005. The aforementioned subsidence signal A, coincides with the area of extensive dewatering activities known in the area. Since April 1996, up to 24 pumping wells have been installed in Pipeline Mine to drain the saturated alluvium, which for the most part occurs mainly in the eastern and western wall of the ultimate mine (see Fig. 2). Some of this water (less than 1%) is diverted for plant use (Bureau of Land Management, 2002a); for example in dust suppression and process makeup water. The remaining water is pumped by pipeline along the conveyor route to a series of shallow infiltration ponds for recycling (see Fig. 3d). Ground water mounds resulting from artificial infiltration of excess produced water (i.e., water that was pumped and not consumed by mining and milling operations) are apparent to the north and south of the open pit area. Again, in the 2000 Landsat TM, Infiltration sites such as, Windmill I, II, IV and V, Rocky Pass I, II (Fig. 3d) and Highway are in operation. Filippini and Frome (see Fig.2), are no longer active at the time of investigation as use of these two sites for infiltration purposes was previously ceased by the Permittee between late 1998 and early 1999 (Western Mining Action Project, 2004). In addition, pit dewatering operations were improved with the addition of several new rapid infiltration sites. The South Area Heap Leach is an additional facility easily discriminated from the image and was commissioned on July 1 2002. Again, the static water level prior to the start-up of the Pipeline mine dewatering operation was at approximately 76-90m below the ground surface (Woldai et al., in Press). Although the borehole data for the 2002 is incomplete, the water levels in the bedrock monitoring wells located directly adjacent to the pit dropped approximately 189m between April 1996 (~1493m amsl) and December 2002 (~1304m amsl). This drawdown is in agreement with the work described in the Final Environmental Impact Statement Report (Bureau of Land Management, 2000a) and is also supportive of the signal received from the InSAR. Based on the occurrence of strong fringe patterns in interferograms Pairs 2, 3, 4, 5 and 6, (see Fig.2) but only very weak fringe expression in Pair 1 (30/08/1993 - 12/09/1996; see Fig.2), we conclude significant ground deformation initiated mid-1996 coincident with the documented beginning of mine dewatering operations.
193
The International Archives of the Photogrammetry, Remote Sensing and Spatial Information Sciences. Vol. XXXVII. Part B7. Beijing 2008
Figure 2. Interferometric pairs of the study area (see P1, P2, P3, P4, P5 and P6 in Table 2) showing characteristic surface deformation
patterns resulting from dewatering activities in the Pipeline Mine and surroundings. Circular subsidence bowls are indicated by concentric colour rings with a consistent warming or cooling colour sequences oriented toward the centre at A, B and C. See Table 2
for Pairs [P1-P6}.
Figure 3. Pipeline Mine area showing: a) the 1991 Landsat TM (prior to the start-up of the Pipeline mining activities), b) the 2000 Landsat TM data and c) ASTER data of 2005. In the 1991 image only the Golden Acres Mine and its waste dumps are visible. An asphalt road connecting this mine with the Cortez Mine is seen running in a NW-SE direction while other roads run NNW-SSE and NNE-SSW. Coarser and finer grained alluvial fans show typical dark to light grey colour. In b) the Pipeline open pit, waste dumps and tailing are visible. By this time, many infiltration sites are in operation and some of these are visible in d). In c) a clear expansion of the mine site is evident. d)
194
The International Archives of the Photogrammetry, Remote Sensing and Spatial Information Sciences. Vol. XXXVII. Part B7. Beijing 2008
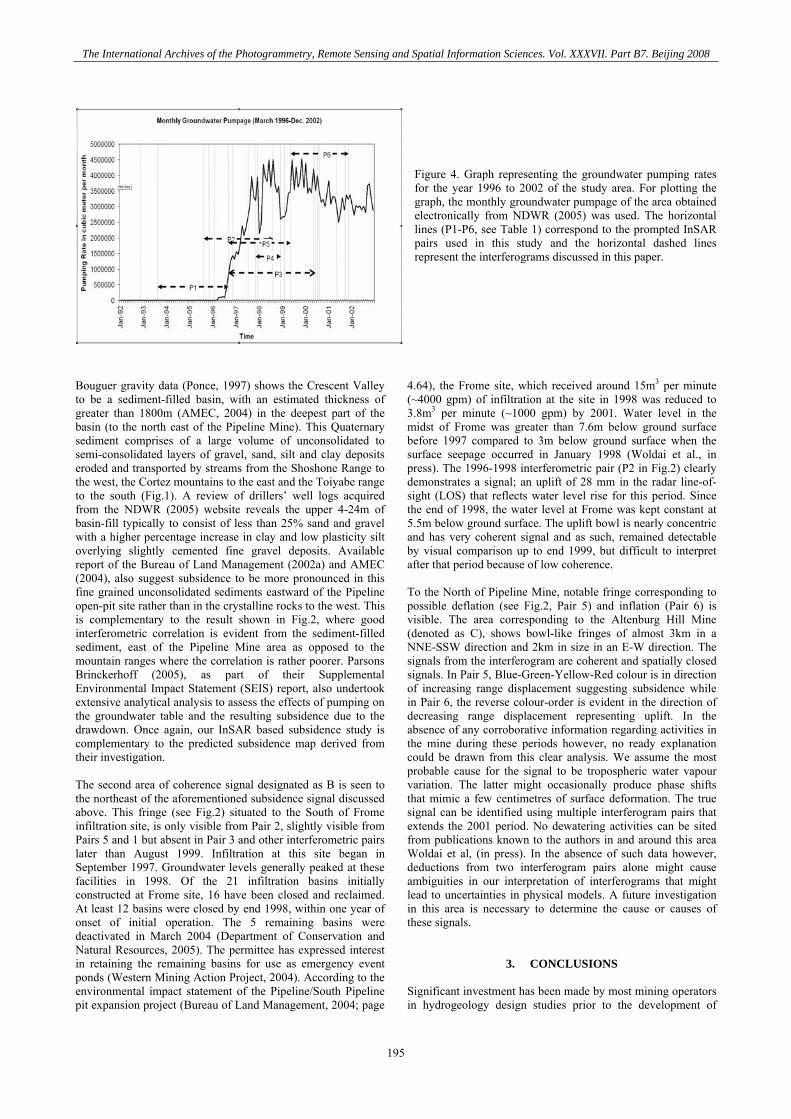
Figure 4. Graph representing the groundwater pumping rates for the year 1996 to 2002 of the study area. For plotting the graph, the monthly groundwater pumpage of the area obtained electronically from NDWR (2005) was used. The horizontal lines (P1-P6, see Table 1) correspond to the prompted InSAR pairs used in this study and the horizontal dashed lines represent the interferograms discussed in this paper.
Bouguer gravity data (Ponce, 1997) shows the Crescent Valley to be a sediment-filled basin, with an estimated thickness of greater than 1800m (AMEC, 2004) in the deepest part of the basin (to the north east of the Pipeline Mine). This Quaternary sediment comprises of a large volume of unconsolidated to semi-consolidated layers of gravel, sand, silt and clay deposits eroded and transported by streams from the Shoshone Range to the west, the Cortez mountains to the east and the Toiyabe range to the south (Fig.1). A review of drillers’ well logs acquired from the NDWR (2005) website reveals the upper 4-24m of basin-fill typically to consist of less than 25% sand and gravel with a higher percentage increase in clay and low plasticity silt overlying slightly cemented fine gravel deposits. Available report of the Bureau of Land Management (2002a) and AMEC (2004), also suggest subsidence to be more pronounced in this fine grained unconsolidated sediments eastward of the Pipeline open-pit site rather than in the crystalline rocks to the west. This is complementary to the result shown in Fig.2, where good interferometric correlation is evident from the sediment-filled sediment, east of the Pipeline Mine area as opposed to the mountain ranges where the correlation is rather poorer. Parsons Brinckerhoff (2005), as part of their Supplemental Environmental Impact Statement (SEIS) report, also undertook extensive analytical analysis to assess the effects of pumping on the groundwater table and the resulting subsidence due to the drawdown. Once again, our InSAR based subsidence study is complementary to the predicted subsidence map derived from their investigation. The second area of coherence signal designated as B is seen to the northeast of the aforementioned subsidence signal discussed above. This fringe (see Fig.2) situated to the South of Frome infiltration site, is only visible from Pair 2, slightly visible from Pairs 5 and 1 but absent in Pair 3 and other interferometric pairs later than August 1999. Infiltration at this site began in September 1997. Groundwater levels generally peaked at these facilities in 1998. Of the 21 infiltration basins initially constructed at Frome site, 16 have been closed and reclaimed. At least 12 basins were closed by end 1998, within one year of onset of initial operation. The 5 remaining basins were deactivated in March 2004 (Department of Conservation and Natural Resources, 2005). The permittee has expressed interest in retaining the remaining basins for use as emergency event ponds (Western Mining Action Project, 2004). According to the environmental impact statement of the Pipeline/South Pipeline pit expansion project (Bureau of Land Management, 2004; page
4.64), the Frome site, which received around 15m3 per minute (~4000 gpm) of infiltration at the site in 1998 was reduced to 3.8m3 per minute (~1000 gpm) by 2001. Water level in the midst of Frome was greater than 7.6m below ground surface before 1997 compared to 3m below ground surface when the surface seepage occurred in January 1998 (Woldai et al., in press). The 1996-1998 interferometric pair (P2 in Fig.2) clearly demonstrates a signal; an uplift of 28 mm in the radar line-of-sight (LOS) that reflects water level rise for this period. Since the end of 1998, the water level at Frome was kept constant at 5.5m below ground surface. The uplift bowl is nearly concentric and has very coherent signal and as such, remained detectable by visual comparison up to end 1999, but difficult to interpret after that period because of low coherence. To the North of Pipeline Mine, notable fringe corresponding to possible deflation (see Fig.2, Pair 5) and inflation (Pair 6) is visible. The area corresponding to the Altenburg Hill Mine (denoted as C), shows bowl-like fringes of almost 3km in a NNE-SSW direction and 2km in size in an E-W direction. The signals from the interferogram are coherent and spatially closed signals. In Pair 5, Blue-Green-Yellow-Red colour is in direction of increasing range displacement suggesting subsidence while in Pair 6, the reverse colour-order is evident in the direction of decreasing range displacement representing uplift. In the absence of any corroborative information regarding activities in the mine during these periods however, no ready explanation could be drawn from this clear analysis. We assume the most probable cause for the signal to be tropospheric water vapour variation. The latter might occasionally produce phase shifts that mimic a few centimetres of surface deformation. The true signal can be identified using multiple interferogram pairs that extends the 2001 period. No dewatering activities can be sited from publications known to the authors in and around this area Woldai et al, (in press). In the absence of such data however, deductions from two interferogram pairs alone might cause ambiguities in our interpretation of interferograms that might lead to uncertainties in physical models. A future investigation in this area is necessary to determine the cause or causes of these signals.
3. CONCLUSIONS Significant investment has been made by most mining operators in hydrogeology design studies prior to the development of
195
The International Archives of the Photogrammetry, Remote Sensing and Spatial Information Sciences. Vol. XXXVII. Part B7. Beijing 2008
dewatering plan. The critical details of where ground surface deformation might develop however can never be fully foreseen. In this study, InSAR integrated with groundwater pumping, site geologic and soil data was used to demonstrate its capability for ground surface deformation and EIA studies in and around an on-going open-pit Pipeline mine with intensive dewatering operations for the period 1996-2001. Although, the magnitude and temporal occurrence of land subsidence for the study area are not well known; data been sparse and accuracy varying, the InSAR-generated images, clearly demonstrate the capability of InSAR in successfully detecting subsidence and uplift at the very least to an accuracy of a few centimeter using the 35-day repeat SAR data and radar interferometric techniques under favourable environmental conditions. We assume, the high percentage of fine clay soil, classified as hydro-sensitive and known to exhibit shrink and swell characteristics underlying most of the mine area added to the groundwater pumping of such magnitude to induce subsurface volumetric shrinkage resulting in land subsidence. The fact that fringes in this area are only evident from the post-1996 InSAR pairs also suggest the most probable source of horizontal strains to be differential subsidence resulting from ongoing mine dewatering of the alluvial aquifer. The results of the integration of multi-temporal differential InSAR with Landsat TM, ASTER including groundwater pumping, rock and soil data in a GIS also provide evidences that InSAR can offer a relatively inexpensive means of assessing the environmental impact of dewatering driven effects around on-going open-pit mine site and surroundings with a potential time lag of less than six months to a year. We hope our example study makes the wider remote sensing community more aware of the InSAR method’s capabilities in dewatering applications.
ACKNOWLEDGEMENTS This work was supported by the Arthur Brant Laboratory for Exploration Geophysics, University of Nevada Reno. The European Space Agency ERS 1/2 raw SAR scenes were provided through the Western North American InSAR (WInSAR) research consortium. ERS 1 /2 satellite orbits were obtained from the Delft Institute for Earth-Oriented Space Research, The Netherlands. The 1996-2004 Electronic copies of the groundwater pumped to the infiltration were received from the Nevada Division of Water Resources. JPL’s ROI_PAC Research Interferometry package was used to prepare the interferograms.
REFERENCES References from Journals: Amelung, F., Galloway, D.L., Bell, J.W., Zebker, H.A. and Laczniak, R.J., 1999. Sensing the ups and downs of Las Vegas: INSAR reveals structural control of land subsidence and aquifer-system deformation. Geology, 27(6), pp.483–486. Fielding, E.J., Blom, R.G. & Goldstein, R.M., 1998. Rapid subsidence over oil fields measured by SAR interferometry. Geophysical Research Letters, 25, pp. 3215-3218. Galloway, D.L., Hudnut, K.W., Ingebritsen, S.E., Philips, S.P., Peltzer, G., Rogez, F. & Rosen, P.A., 1998. Detection of aquifer system compaction and land subsidence using interferometric
synthetic aperture radar, Antelope Valley, Mojave Desert, California. Water Resources Research, 34, pp. 2573-2585. Hoffmann, J., Zebker, H.A., Galloway, D.L. and Amelung, F., 2001. Seasonal subsidence and rebound in Las Vegas Valley, Nevada, observed by synthetic aperture radar interferometry. Water Resources Research, 37, pp. 1551-1566. Massonnet, D., Holzer, T. & Vadon, H., 1997. Land subsidence caused by the East Mesa Geothermal Field, California, observed using SAR interferometry. Geophysical Research Letters, 24, pp. 901-904. Woldai, Tsehaie, Oppliger, Gary and Taranik, Jim, 2008. Monitoring dewatering induced subsidence and fault reactivation using InSAR, International Journal of Remote Sensing (in Press). Wright, P. & Stow, R., 1999. Detecting mining subsidence from Space. International Journal of Remote Sensing, 20, pp. 1183-1188. Zebker, H.A., and Goldstein, R.M., 1986. Topographic mapping from interferometric synthetic aperture radar observations. Journal of Geophysical Research, 91(B5), pp. 4993-4999. References from Other Litreature: AMEC, 2004. Summary of risk assessment, ground subsidence and earth fissure evaluation, Pipeline/South Pipeline Project, Cortez Gold Mines, Lander County, Nevada (January 7, 2004), USA. Bureau of Land Management, 2000a. South Pipeline final Environmental Impact Statement, Battle Mountain Field Office, Battle Mountain, Nevada (February 2000), USA. _______2002a. Pipeline/South Pipeline heap leach facility in the South Pipeline Project, Final EIS, Battle Mountain District Office, Battle Mountain, Nevada, USA. _______2004. Pipeline/South Pipeline Pit Expansion Project, Final Supplemental Environmental Impacts Statement (December 2004), Battle Mountain Field Office, Nevada, USA. Chang, Hsing-Chung, Ge Linlin, Rizos Chris, 2004. Environmental Impact Assessment of Mining Subsidence by Using Spaceborne Radar Interferometry, 3rd FIG Regional Conference, Jakarta, Indonesia, October 3-7, 2004, 13 pp. Geomega. 2002a. Pipeline / South Pipeline Pit Expansion Project Baseline Characterization Report. Prepared for Cortez Gold Mines. September 13, 2002. McCusker, Robert T. (2004). Geological Policy Document on the Robertson Property, Lander County,Nevada, U.S.A., Prepared for Coral Gold Corporation. Parsons Brinckerhoff, 2005. Carlin Corridor Impact Assessment, submitted to Lander County (April 2005), Nevada, USA. Ponce, D. A., (1997). Gravity Data of Nevada, U.S. Department of the Interior, U.S. Geological Survey Digital Data Series Dds-42, Menlo Park, California U.S. Department of Interior (1999). South pipeline project draft environmental impact statement, NV 64-93-001P (96-2A), NV
196
The International Archives of the Photogrammetry, Remote Sensing and Spatial Information Sciences. Vol. XXXVII. Part B7. Beijing 2008
063-EIS98-014. Battle Mountain, NV: Bureau of Land Management. Wegmüller, U., Strozzi, T., Werner, Ch., Wiesmann, A., Benecke N., and Spreckels, V., 2000. Monitoring of mining-induced surface deformation in the Ruhrgebiet with SAR Interferometry, Proc. IGARSS’00, Honolulu, 7/2000. Zebker, H. A., Villasenor, J. and Madsen, S. N., 1992. Topographic Mapping from ERS-1 and SEASAT Radar Interferometry, Proc. of the 1992 Int. Geosci. and Remote Sens. Symp., Houston, TX, 387- 388, 1992(b) Zones, C.P., 1961. Ground-water potentialities in the Crescent Valley, Eureka and Lander Counties, Nevada: U.S. Geological Survey Water-Supply Paper 1581, 50 p. References from websites: Department of Conservation and Natural Resources, 2005.
Pipeline Infiltration Project Investigat. Division of Environmental Protection, State of Nevada, www.ndep.nv.gov/admin/pip05.htm (accessed 15 March 2005)
NDWR (Nevada Division of Water Resources), 2005.
(www.water.nv.gov) (accessed 12 April 2005). Western Mining Action Project, 2004. Complaint and Request
for Investigation, Pipeline Infiltration Project, 13p., at: http://ndep.nv.gov/docs_04/pip_investigation_rpt0305.pdf (accessed: December 21, 2004).
197

The International Archives of the Photogrammetry, Remote Sensing and Spatial Information Sciences. Vol. XXXVII. Part B7. Beijing 2008
198