environmental indicators for agriculture - oecd · environmental indicators for agriculture ... and...
TRANSCRIPT
0020001t1.fm Page 1 Thursday, November 16, 2000 8:58 AM
Environmental Indicatorsfor Agriculture
Methods and Results
EXECUTIVE SUMMARY
2001
ORGANISATION FOR ECONOMIC CO-OPERATION AND DEVELOPMENT
������������� ��������������������������� ��� ���������������������������� ����������� ����������� ������� ���������� ��� �������� ��� ��� �������� ���� ������ ��� ��������� ��� ���� �� � ����� ����������!�"
������������� �����������������
��������� ������������������������������ � �����������������������!������
������������ ������������ �������
���� #���� ��� ��� ���� �������� ��� �$� %��& ���'������ ����� ���� �� ��� �����' �� �������� � ��� ����������������& ���'������������������#����#��������$���
���� ��� ����������������
���� �������� ��� ���'� ��&��� ���'��� ��#� �� �� ��#� � &���� �$� %��& ���'������ �(��# ����� ����& ���'����������'���
�������� "����#�����������������������������
���� ����������
���� ����� ���� � ���!���� # �������� ���' �$� ���� ���� ��#� �)���'�� ��#� ��� �� '���� ��� �����& ���'�������&�� �$������� ���������� � ���� ����� ���# �$�������� ����������!��������� ��� ���� ���������#����� ����������� ���� �����
��������� ����$������"��������������%�������������
�������������'� ������#��������������������&�� �$"
����!������"����� �������������� � �������#�� &�����*�'��������#���� ���������� � ���)�����#��������"���������$�����%���"���� ����!�������� ����� �)����� � ���)�����������#������ ������!������
������&' ��������������������������������
������& ���'������ '���������$� ��������"
����&����'���( )���*���������(����%���'���( +���%��������,-������.�������������� /���.����0�1���2����������2���
�������� ��0��3� ����� � �$� �&��� +��� �$��� ! ��� �����)� ,�� ������� ��#� ���� � $���� ������ �&� ������ ���������� �''�� ��#� �� �� �� ��������� &����(� !� ��� ���� ��� #�!����#�#� ����� ��� ����$�� ���'� ���������$� %��& ���'������ �# ������!��� �����"� �www.oecd.org/agr/env/indicators.htm� ������� �� �������������#���#�����$���� ��!��� ���
-������.���� ��������!�����������$� %��& ���'������ �# ������!��*�����$������!��� ����/��)����0 ��������� ����'�� ����������������$� %��& ���'������ �# ������!��*�������& � ������!��� �������������"
1�& ������ �������� � �����#���& ���'����� & � �����2$� ������� ������������������ ��2�#��%���������34334���� ������5��,���������'� �"��1�& ������ �6���#���$���������"��7�88�����+4��+�94�,:���������("��7�88�����++�8��,����
3
© OECD 2000
FOREWORD
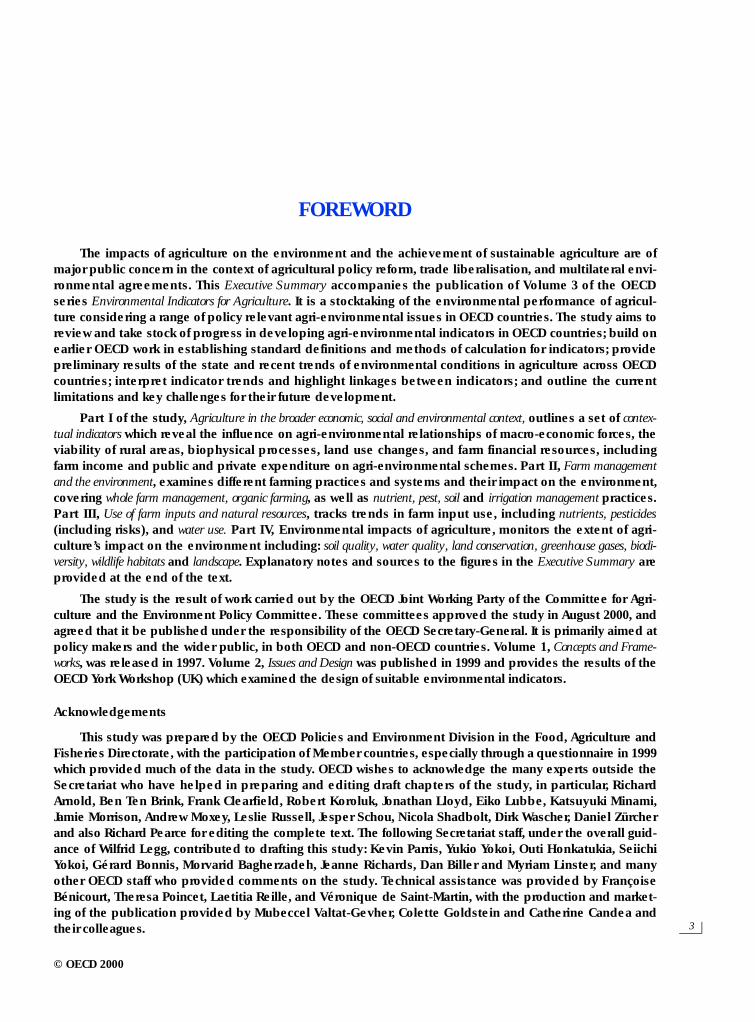
The impacts of agriculture on the environment and the achievement of sustainable agriculture are ofmajor public concern in the context of agricultural policy reform, trade liberalisation, and multilateral envi-ronmental agreements. This Executive Summary accompanies the publication of Volume 3 of the OECDseries Environmental Indicators for Agriculture. It is a stocktaking of the environmental performance of agricul-ture considering a range of policy relevant agri-environmental issues in OECD countries. The study aims toreview and take stock of progress in developing agri-environmental indicators in OECD countries; build onearlier OECD work in establishing standard definitions and methods of calculation for indicators; providepreliminary results of the state and recent trends of environmental conditions in agriculture across OECDcountries; interpret indicator trends and highlight linkages between indicators; and outline the currentlimitations and key challenges for their future development.
Part I of the study, Agriculture in the broader economic, social and environmental context, outlines a set of contex-tual indicators which reveal the influence on agri-environmental relationships of macro-economic forces, theviability of rural areas, biophysical processes, land use changes, and farm financial resources, includingfarm income and public and private expenditure on agri-environmental schemes. Part II, Farm managementand the environment, examines different farming practices and systems and their impact on the environment,covering whole farm management, organic farming, as well as nutrient, pest, soil and irrigation management practices.Part III, Use of farm inputs and natural resources, tracks trends in farm input use, including nutrients, pesticides(including risks), and water use. Part IV, Environmental impacts of agriculture, monitors the extent of agri-culture’s impact on the environment including: soil quality, water quality, land conservation, greenhouse gases, biodi-versity, wildlife habitats and landscape. Explanatory notes and sources to the figures in the Executive Summary areprovided at the end of the text.
The study is the result of work carried out by the OECD Joint Working Party of the Committee for Agri-culture and the Environment Policy Committee. These committees approved the study in August 2000, andagreed that it be published under the responsibility of the OECD Secretary-General. It is primarily aimed atpolicy makers and the wider public, in both OECD and non-OECD countries. Volume 1, Concepts and Frame-works, was released in 1997. Volume 2, Issues and Design was published in 1999 and provides the results of theOECD York Workshop (UK) which examined the design of suitable environmental indicators.
Acknowledgements
This study was prepared by the OECD Policies and Environment Division in the Food, Agriculture andFisheries Directorate, with the participation of Member countries, especially through a questionnaire in 1999which provided much of the data in the study. OECD wishes to acknowledge the many experts outside theSecretariat who have helped in preparing and editing draft chapters of the study, in particular, RichardArnold, Ben Ten Brink, Frank Clearfield, Robert Koroluk, Jonathan Lloyd, Eiko Lubbe, Katsuyuki Minami,Jamie Morrison, Andrew Moxey, Leslie Russell, Jesper Schou, Nicola Shadbolt, Dirk Wascher, Daniel Zürcherand also Richard Pearce for editing the complete text. The following Secretariat staff, under the overall guid-ance of Wilfrid Legg, contributed to drafting this study: Kevin Parris, Yukio Yokoi, Outi Honkatukia, SeiichiYokoi, Gérard Bonnis, Morvarid Bagherzadeh, Jeanne Richards, Dan Biller and Myriam Linster, and manyother OECD staff who provided comments on the study. Technical assistance was provided by FrançoiseBénicourt, Theresa Poincet, Laetitia Reille, and Véronique de Saint-Martin, with the production and market-ing of the publication provided by Mubeccel Valtat-Gevher, Colette Goldstein and Catherine Candea andtheir colleagues.
FRONTMATTER1 Page 3 Thursday, November 16, 2000 4:16 PM
Environmental Indicators for Agriculture: Methods and Results
4
0020001t1.fm Page 4 Thursday, November 16, 2000 8:58 AM
HIGHLIGHTS
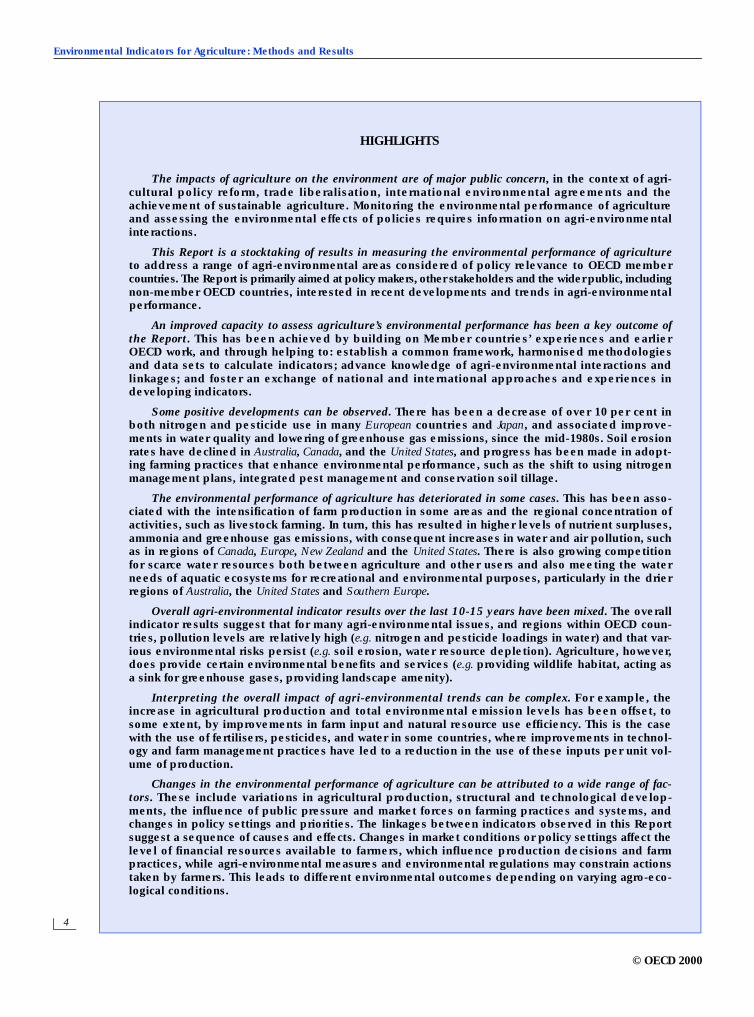
The impacts of agriculture on the environment are of major public concern, in the context of agri-cultural policy reform, trade liberalisation, international environmental agreements and theachievement of sustainable agriculture. Monitoring the environmental performance of agricultureand assessing the environmental effects of policies requires information on agri-environmentalinteractions.
This Report is a stocktaking of results in measuring the environmental performance of agricultureto address a range of agri-environmental areas considered of policy relevance to OECD membercountries. The Report is primarily aimed at policy makers, other stakeholders and the wider public, includingnon-member OECD countries, interested in recent developments and trends in agri-environmentalperformance.
An improved capacity to assess agriculture’s environmental performance has been a key outcome ofthe Report. This has been achieved by building on Member countries’ experiences and earlierOECD work, and through helping to: establish a common framework, harmonised methodologiesand data sets to calculate indicators; advance knowledge of agri-environmental interactions andlinkages; and foster an exchange of national and international approaches and experiences indeveloping indicators.
Some positive developments can be observed. There has been a decrease of over 10 per cent inboth nitrogen and pesticide use in many European countries and Japan, and associated improve-ments in water quality and lowering of greenhouse gas emissions, since the mid-1980s. Soil erosionrates have declined in Australia, Canada, and the United States, and progress has been made in adopt-ing farming practices that enhance environmental performance, such as the shift to using nitrogenmanagement plans, integrated pest management and conservation soil tillage.
The environmental performance of agriculture has deteriorated in some cases. This has been asso-ciated with the intensification of farm production in some areas and the regional concentration ofactivities, such as livestock farming. In turn, this has resulted in higher levels of nutrient surpluses,ammonia and greenhouse gas emissions, with consequent increases in water and air pollution, suchas in regions of Canada, Europe, New Zealand and the United States. There is also growing competitionfor scarce water resources both between agriculture and other users and also meeting the waterneeds of aquatic ecosystems for recreational and environmental purposes, particularly in the drierregions of Australia, the United States and Southern Europe.
Overall agri-environmental indicator results over the last 10-15 years have been mixed. The overallindicator results suggest that for many agri-environmental issues, and regions within OECD coun-tries, pollution levels are relatively high (e.g. nitrogen and pesticide loadings in water) and that var-ious environmental risks persist (e.g. soil erosion, water resource depletion). Agriculture, however,does provide certain environmental benefits and services (e.g. providing wildlife habitat, acting asa sink for greenhouse gases, providing landscape amenity).
Interpreting the overall impact of agri-environmental trends can be complex. For example, theincrease in agricultural production and total environmental emission levels has been offset, tosome extent, by improvements in farm input and natural resource use efficiency. This is the casewith the use of fertilisers, pesticides, and water in some countries, where improvements in technol-ogy and farm management practices have led to a reduction in the use of these inputs per unit vol-ume of production.
Changes in the environmental performance of agriculture can be attributed to a wide range of fac-tors. These include variations in agricultural production, structural and technological develop-ments, the influence of public pressure and market forces on farming practices and systems, andchanges in policy settings and priorities. The linkages between indicators observed in this Reportsuggest a sequence of causes and effects. Changes in market conditions or policy settings affect thelevel of financial resources available to farmers, which influence production decisions and farmpractices, while agri-environmental measures and environmental regulations may constrain actionstaken by farmers. This leads to different environmental outcomes depending on varying agro-eco-logical conditions.
© OECD 2000
Highlights
5
0020001t1.fm Page 5 Thursday, November 16, 2000 8:58 AM
These results need to be seen in a broader context. For most OECD countries agriculture’s role inthe national economy is small, but in terms of the use of natural resources is significant, accountingfor around 40 per cent of total land use and 45 per cent of water use. Where agricultural productionhas increased by around 15 per cent, resulting mainly from improvements in productivity with capi-tal replacing labour helped by new technologies. The higher production has been achieved fromincreasing yields as the total agricultural land area has decreased, by 1 per cent, and the use ofwater has risen, by over 5 per cent. Agricultural employment has declined by about 8 per cent,while the farm population has aged. Farm numbers have declined with a corresponding increase infarm size.
OECD agriculture continues to be characterised by high support, which currently accounts forabout 36 per cent of total farm receipts, although there are wide variations in the level, composi-tion and trends in support among countries and commodities. Where agricultural and trade policieshave caused distortions in market input and output price signals, in some cases this has led toenvironmental damage. Policy reform should help improve agriculture’s environmental perfor-mance but in some cases could reduce environmental benefits. As part of the reform process and inresponse to public pressure, many countries have introduced agri-environmental and environmen-tal measures to help achieve environmental goals.
For some agri-environmental areas there is incomplete knowledge and data to establish trends.Information is incomplete, for example, concerning the degree of groundwater pollution or rate ofdepletion resulting from agricultural activities, and the human health and environmental risks asso-ciated with the use of pesticides. In other cases the linkages between different indicators areunderstood but are not easy to measure, such as between changes in farm management practicesand environmental outcomes, or attributing the relative impact of agriculture and other activities,for example, on water pollution. Also for a number of areas, notably agriculture’s impact onbiodiversity, habitats and landscape, the understanding and measurement of these impacts is stillat a preliminary stage of research, partly because of the high costs associated with monitoringprogrammes.
The future challenge to developing agri-environmental indicators is to meet the objectives of provid-ing information on the current state and changes in the conditions of the environment in agricul-ture; and using indicators for policy monitoring, evaluation, and forecasting. This requiresimproving the analytical soundness and measurability of indicators, especially by overcoming con-ceptual and data deficiencies, and providing a better interpretation of indicator trends. This couldcontribute to understanding the linkages between indicators (e.g. water use, management and pric-ing) and to examining the synergies and trade-offs between the economic, social and environmen-tal dimensions of sustainable agriculture. Developing a core set of integrated OECD agri-environmental indicators, complemented as necessary by other indicators, could help to achievethese objectives.
© OECD 2000
Environmental Indicators for Agriculture: Methods and Results
6
0020001t1.fm Page 6 Thursday, November 16, 2000 8:58 AM
BACKGROUND AND SCOPE OF THE REPORT
1. Objectives
The main objectives of the Report are to:
• review and take stock of progress in developing indicators across OECD countries;
• build on earlier OECD work in establishing standard definitions and methods of calculation;
• provide preliminary results of the state and recent trends of environmental conditions in agricul-ture across OECD countries;
• interpret indicator trends and highlight linkages between indicators; and,
• outline limitations and the key challenges for the future development of indicators.
2. Developing the indicators
Developing the OECD agri-environmental indicators has involved five steps outlined below (seealso the OECD agri-environmental indicator website: http://www.oecd.org/agr/env/indicators.htm).
Identifying policy relevant issues which indicators should address
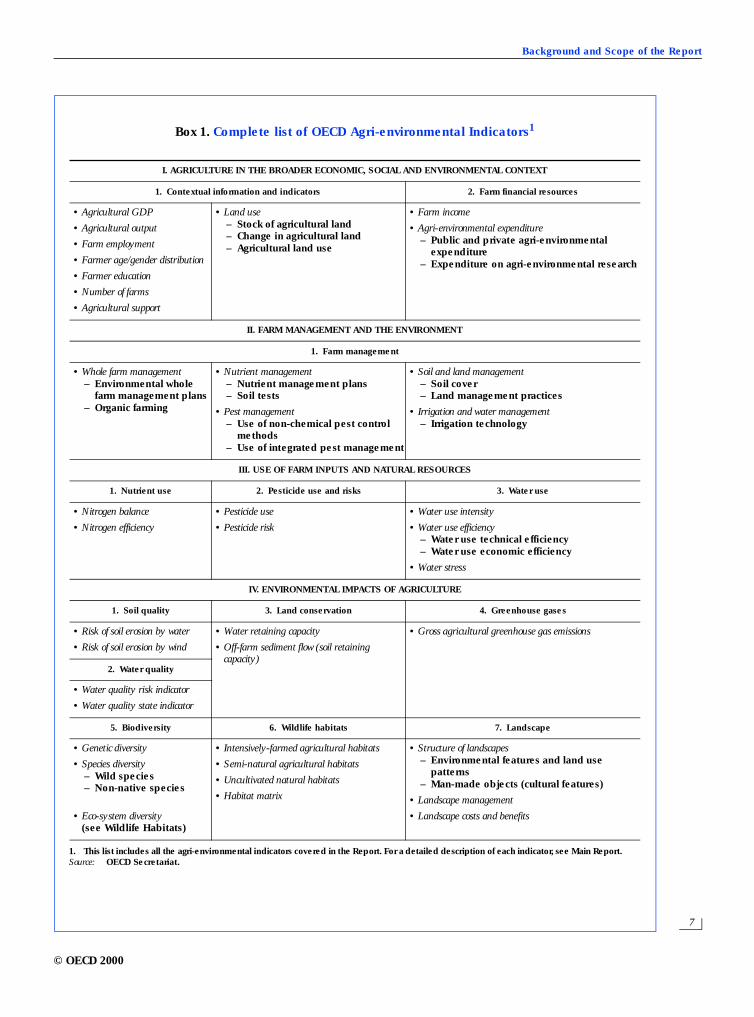
The choice of the agri-environmental issues and indicators, shown in Box 1, has been made byOECD Member countries as the current priority areas to address. This represents a consensus that hasemerged among OECD countries, building on their experience in developing indicators for policy pur-poses, as outlined in the OECD Reports: Environmental Indicators for Agriculture – Volume 1: Concepts andFramework (1997) and Volume 2: Issues and Design (1999). The choice of indicators, however, is an evolvingprocess depending on changing societal pressures and political choices (see also the OECD agricultureand environment website: http://www.oecd.org/agr/policy/ag-env).
Developing a common framework to structure the development of indicators
A common framework is used by OECD to structure the process of developing indicators. The Driv-ing Force-State-Response (DSR) framework identifies: driving force indicators, focusing on the causes of change inenvironmental conditions in agriculture, such as changes in farm management practices and the use offarm inputs; state indicators, highlighting the effects of agriculture on the environment, for example,impacts on soil, water, and biodiversity; and response indicators covering the actions taken to respond tothe changes in the state of the environment, such as variations in agri-environmental research expendi-ture. The DSR models builds on the Pressure-State-Response framework used by OECD to develop itsenvironmental indicators (see OECD, Towards Sustainable Development Environmental Indicators, 1998, Paris,and also the OECD environmental indicators website: http://www.oecd.org/env/indicators/index.htm).
Establishing indicator definitions and methods of measurement
The indicators measure the relationship between primary agriculture and the environment, thusexcluding the agro-food chain (e.g. pesticide manufacturing, food processing) and the impact of changesin the environment on agriculture (e.g. impact of climate change on agriculture). While they cannot beconsidered as indicators of “sustainability”, many indicators can be useful inputs for illustrating theenvironmental dimension of sustainable agriculture. Some attention is given to the economic and socialdimensions of sustainable agriculture in the context of farm financial resources and rural viability (seealso the OECD sustainable development initiative website: http://www.oecd.org/subject/sustdev).
Collecting data and calculating indicators
The main basis for the data sources and indicator calculations shown in the Report are derivedfrom OECD Member country responses to a Agri-environmental Indicator Questionnaire in 1999. The
© OECD 2000
Background and Scope of the Report
7
0020001t1.fm Page 7 Thursday, November 16, 2000 8:58 AM
Box 1. Complete list of OECD Agri-environmental Indicators1
1. This list includes all the agri-environmental indicators covered in the Report. For a detailed description of each indicator, see Main Report.Source: OECD Secretariat.
I. AGRICULTURE IN THE BROADER ECONOMIC, SOCIAL AND ENVIRONMENTAL CONTEXT
1. Contextual information and indicators 2. Farm financial resources
• Agricultural GDP • Land use– Stock of agricultural land– Change in agricultural land– Agricultural land use
• Farm income
• Agricultural output • Agri-environmental expenditure– Public and private agri-environmental
expenditure– Expenditure on agri-environmental research
• Farm employment
• Farmer age/gender distribution
• Farmer education
• Number of farms
• Agricultural support
II. FARM MANAGEMENT AND THE ENVIRONMENT
1. Farm management
• Whole farm management– Environmental whole
farm management plans– Organic farming
• Nutrient management– Nutrient management plans– Soil tests
• Soil and land management– Soil cover– Land management practices
• Pest management– Use of non-chemical pest control
methods– Use of integrated pest management
• Irrigation and water management– Irrigation technology
III. USE OF FARM INPUTS AND NATURAL RESOURCES
1. Nutrient use 2. Pesticide use and risks 3. Water use
• Nitrogen balance • Pesticide use • Water use intensity
• Nitrogen efficiency • Pesticide risk • Water use efficiency– Water use technical efficiency– Water use economic efficiency
• Water stress
IV. ENVIRONMENTAL IMPACTS OF AGRICULTURE
1. Soil quality 3. Land conservation 4. Greenhouse gases
• Risk of soil erosion by water • Water retaining capacity • Gross agricultural greenhouse gas emissions
• Risk of soil erosion by wind • Off-farm sediment flow (soil retaining capacity)
2. Water quality
• Water quality risk indicator
• Water quality state indicator
5. Biodiversity 6. Wildlife habitats 7. Landscape
• Genetic diversity • Intensively-farmed agricultural habitats • Structure of landscapes– Environmental features and land use
patterns– Man-made objects (cultural features)
• Species diversity– Wild species– Non-native species
• Semi-natural agricultural habitats
• Uncultivated natural habitats
• Habitat matrix • Landscape management
• Eco-system diversity (see Wildlife Habitats)
• Landscape costs and benefits
© OECD 2000
Environmental Indicators for Agriculture: Methods and Results
8
0020001t1.fm Page 8 Thursday, November 16, 2000 8:58 AM
Questionnaire provided information on the basic data and related indicators currently available orbeing developed in countries. However, the coverage and quality of responses varied, because certainareas are of little relevance to some countries and the systematic collection of basic data and construc-tion of indicators has only begun recently in many countries. The Report has also drawn on OECD workon environmental data (see OECD, Environmental Data Compendium 1999, Paris), and the OECD WorkingGroup on Pesticides development of pesticide risk indicators (see the OECD Working Group on Pesti-cides website: http://www.oecd.org/ehs/pest_rr.htm). Also information and data has been obtained from exter-nal sources, such as FAO.
Interpreting indicators trends
The indicators should be viewed as an integrated preliminary set, with caution needed in inter-preting trends in individual indicators, for a number of reasons discussed below.
• Definitions and methodologies for calculating of indicators are standardised in most cases (e.g. the nitrogenuse balance definition), but not all (e.g. definitions of organic agriculture vary). Also, calculatingthe indicators are at different stages of development, with work on some areas having a longerbackground of research, such as nutrient use and soil quality, while for other areas, such as biodi-versity, wildlife habitats and landscape, work is at a very early stage.
• Data quality and comparability have been expressed as far as possible in terms of the consistency,coherence and harmonisation of data across different indicators, but deficiencies remain such asthe absence of data series, variability in data coverage and questions related to data sources.
• Spatial aggregation of indicators is at the national level. Because national averages can mask signifi-cant variations at the regional level, where possible the Report highlights the possibility ofdeveloping regionally disaggregated indicators.
• Trends and ranges in indicators are important for comparative purposes across countries rather thanabsolute levels for many indicators, especially as local, site specific conditions vary considerablywithin and across countries. Absolute levels, however, are significant where they are aboveclearly defined scientific limits (e.g. nitrates in water).
• Contribution of agriculture to specific environmental impacts is sometimes difficult to isolate, especially forissues such as water quality, where the impact of other economic activities is significant(e.g. industry) or the natural state of the environment itself contributes to pollutant loadings(e.g. the water may contain high levels of naturally occurring salts).
• Direction of change of the indicators is unambiguous in terms of the impact on the environment of anincrease or decrease in the specific indicator (e.g. changes in agricultural greenhouse gas emis-sions). However, for some indicators it is not always clear what constitutes an environmentalimprovement or deterioration (e.g. changes in landscape indicators).
• Baselines, threshold levels and targets for indicators are not used to assess indicator trends in the Report,but some explanation is provided especially where changes diverge significantly from overallOECD average trends.
Many of the limitations of interpreting agri-environmental indicators apply to other indicators. Forexample, there can be wide variations around national averages of socio-economic indicators(e.g. employment), and methodological and data deficiency problems are also not uncommon (e.g. wealthdistribution). Also work on agri-environmental indicators began quite recently compared with the muchlonger history of developing economic indicators, such as gross domestic product. Capturing the interfacebetween the biophysical environment and human activities through indicators, is also often more complexthan monitoring trends in socio-economic phenomena, while some agri-environmental outputs and effectsare also not valued in markets and are not easily measured in physical terms (e.g. landscape).
© OECD 2000
0020001t1.fm Page 9 Thursday, November 16, 2000 8:58 AM
Part I
AGRICULTURE IN THE BROADER ECONOMIC, SOCIAL AND ENVIRONMENTAL CONTEXT
1. CONTEXTUAL INFORMATION AND INDICATORS
2. FARM FINANCIAL RESOURCES
Environmental Indicators for Agriculture: Methods and Results
10
0020001t1.fm Page 10 Thursday, November 16, 2000 8:58 AM
1. CONTEXTUAL INFORMATION AND INDICATORS
To set the discussion on agri-environmental indicators in this Report in a broader economic, socialand environmental context, this Chapter examines the impact on agri-environmental relationships ofeconomic forces, societal preferences, environmental processes, and land use changes.
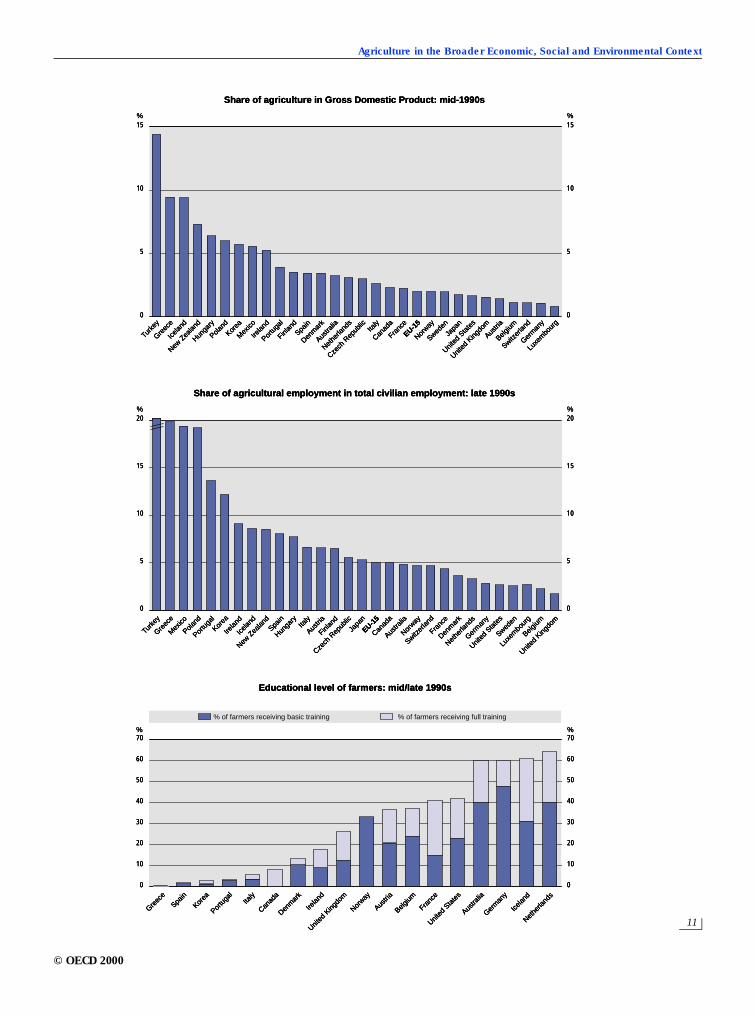
Economic forces shape the performance of the agricultural sector and its role in the national econ-omy. Agriculture’s contribution to gross domestic product is under 4 per cent for most OECD countries, with therole of agriculture in the economy declining in all countries during the last decade. The real value of agri-cultural output has risen for most countries over the past 10 years attributed to higher production, the lat-ter almost entirely due to increases in productivity.
Nevertheless, over a 30-year period the value of output has declined, mainly because of adecrease in real commodity prices. Trends in real net farm incomes from agricultural activities have beenvariable over the last 10 years, rising for many countries but sharply declining over recent years in somecases, largely reflecting changes in macro-economic conditions, farm costs and support levels.
The growing world demand for food and industrial crops will continue to present a challenge to world agri-cultural production, especially as some of the future demand will continue to be met by OECD cerealand livestock product exporters. But the future expansion in production may heighten the pressure onthe environment through intensification and growth in farm output, particularly for exporting countries.
Agricultural employment as a share of total employment is now less than 7 per cent for most OECDcountries, and the age distribution of farmers often shows a major share to be over 55 years old. There arevery few countries where the majority of new entrants into agriculture are less than 35 years old. Ayounger, well-educated workforce is more likely to be able to respond rapidly to changing economicand environmental conditions. In addition, there are only a small number of countries where more than40 per cent of farmers receive even basic agricultural training.
Farm numbers have declined in most OECD countries with a corresponding increase in farm size, lead-ing to the concentration of production in a small number of larger farms. The share of small farms in totalfarm numbers is, at the same time, increasing. Research suggests that the trend toward increasing farmsize usually entails field consolidation with the loss of boundary features, as well as intensification ascapital replaces labour and the use of inputs per hectare increases.
Changes in farm structures have been influenced by technological developments, some of which havedamaged the environment, such as the use of certain pesticides. An increasing focus in research of newtechnologies relates to eco-efficiency and environmentally cleaner technologies, which can increase profitabilityand reduce environmental harm, for example precision farming.
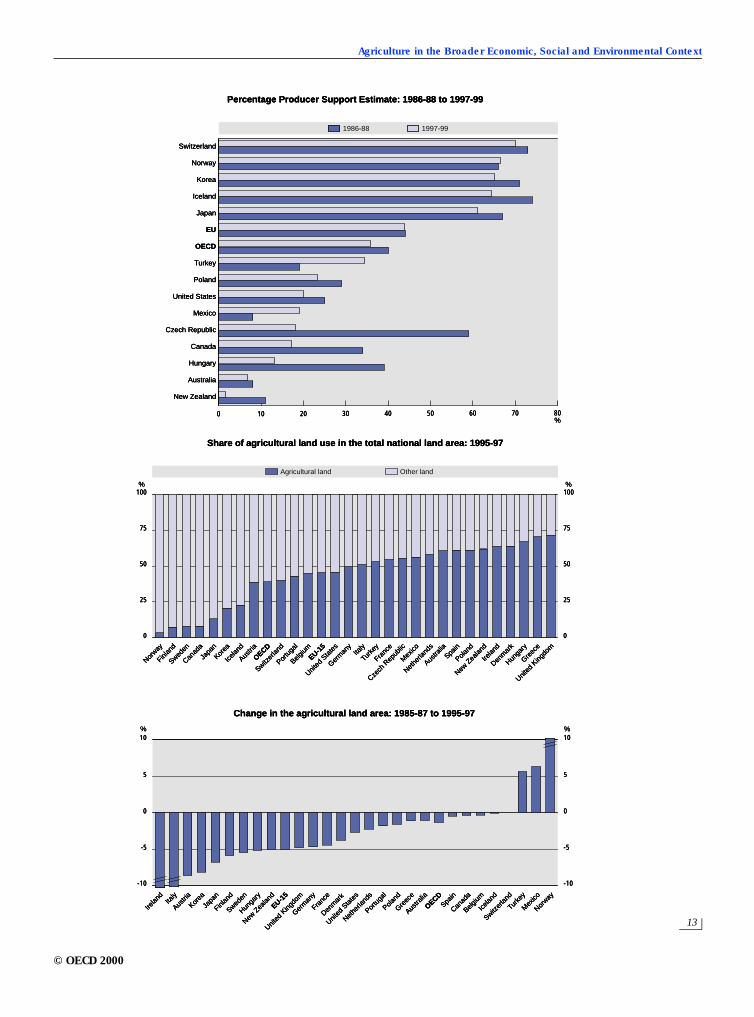
Agricultural and trade policies in many cases have caused environmental harm by distorting price sig-nals through, for example, linking support to agricultural commodities and encouraging farming on envi-ronmentally fragile land, and lowering the costs of inputs, such as energy and water. Support to OECDagriculture is high, but with wide variations in the level, composition and trends among countries andcommodities. OECD average share of support to producers in total gross farm receipts, the percentageproducer support estimate (PSE), has declined from 40 to 36 per cent between 1986-88 to 1997-99.
The reform of agricultural policies should improve the allocation of resources and reduce the negativeimpacts of agriculture on the environment, but reform can also lower performance where agriculture isproviding environmental benefits. As part of the reform process OECD countries have introduced mea-sures to address environmental issues, mainly focusing on altering farm management practices and land usepatterns incompatible with achieving environmental goals.
There is at present insufficient information to provide a full assessment of these changes, but whilesome improvements have been made, they have been more costly than would have been the casewithout production enhancing policies. Also, the negative environmental impacts resulting from farmingstill remain at relatively high levels in many cases.
© OECD 2000
Agriculture in the Broader Economic, Social and Environmental Context
11
0020001t1.fm Page 11 Thursday, November 16, 2000 8:58 AM
20
10
5
0
%20
10
5
0
%
15 15
15
10
5
0
%15
10
5
0
%
% %70
60
50
0
40
30
20
10
70
60
50
0
40
30
20
10
Share of agricultural employment in total civilian employment: late 1990s
Turk
ey
Greec
e
Icelan
d
New Z
ealan
d
Hunga
ry
Poland
Korea
Mex
ico
Irelan
d
Portu
gal
Finlan
dSpa
in
Denm
ark
Austra
lia
Nethe
rland
s
Czech
Rep
ublic
Italy
Canad
a
Franc
e
EU-15
Norway
Sweden
Japa
n
United
Sta
tes
United
King
dom
Austri
a
Belgium
Switzer
land
Germ
any
Luxe
mbo
urg
Share of agriculture in Gross Domestic Product: mid-1990s
Turk
ey
Greec
e
Icelan
d
New Z
ealan
d
Hunga
ry
Poland
Korea
Mex
ico
Irelan
d
Portu
gal
Finlan
dSpa
in
Denm
ark
Austra
lia
Nethe
rland
s
Czech
Rep
ublic
Italy
Canad
a
Franc
e
EU-15
Norway
Sweden
Japa
n
United
Sta
tes
United
King
dom
Austri
a
Belgium
Switzer
land
Germ
any
Luxe
mbo
urg
Educational level of farmers: mid/late 1990s
% of farmers receiving basic training
Greec
e
Icelan
d
Korea
Irelan
d
Portu
gal
Spain
Denm
ark
Austra
lia
Nethe
rland
sIta
ly
Canad
a
Franc
e
Norway
United
Sta
tes
United
King
dom
Austri
a
Belgium
Germ
any
% of farmers receiving full training
20
10
5
0
%20
10
5
0
%
15 15
15
10
5
0
%15
10
5
0
%
% %70
60
50
0
40
30
20
10
70
60
50
0
40
30
20
10
Share of agricultural employment in total civilian employment: late 1990s
Turk
ey
Greec
e
Icelan
d
New Z
ealan
d
Hunga
ry
Poland
Korea
Mex
ico
Irelan
d
Portu
gal
Finlan
dSpa
in
Denm
ark
Austra
lia
Nethe
rland
s
Czech
Rep
ublic
Italy
Canad
a
Franc
e
EU-15
Norway
Sweden
Japa
n
United
Sta
tes
United
King
dom
Austri
a
Belgium
Switzer
land
Germ
any
Luxe
mbo
urg
Share of agriculture in Gross Domestic Product: mid-1990s
Turk
ey
Greec
e
Icelan
d
New Z
ealan
d
Hunga
ry
Poland
Korea
Mex
ico
Irelan
d
Portu
gal
Finlan
dSpa
in
Denm
ark
Austra
lia
Nethe
rland
s
Czech
Rep
ublic
Italy
Canad
a
Franc
e
EU-15
Norway
Sweden
Japa
n
United
Sta
tes
United
King
dom
Austri
a
Belgium
Switzer
land
Germ
any
Luxe
mbo
urg
Educational level of farmers: mid/late 1990s
% of farmers receiving basic training
Greec
e
Icelan
d
Korea
Irelan
d
Portu
gal
Spain
Denm
ark
Austra
lia
Nethe
rland
sIta
ly
Canad
a
Franc
e
Norway
United
Sta
tes
United
King
dom
Austri
a
Belgium
Germ
any
% of farmers receiving full training
© OECD 2000
Environmental Indicators for Agriculture: Methods and Results
12
0020001t1.fm Page 12 Thursday, November 16, 2000 8:58 AM
Societal preferences affect agriculture and the environment across a range of issues. There is growingpublic concern about agriculture’s impact on the environment in terms of reducing pollution and enhancing bene-fits, mainly in response to rising incomes, increasing leisure time, heightened public knowledge ofthese issues, and the desire for the space offered by rural areas.
Rural viability relates to issues such as farmer age structures, educational and managerial skills, andaccess to key services. The retention of a skilled workforce in rural areas and having an appropriate ruralcommunity infrastructure, will affect the capacity of farming to adjust and manage their enterprises tochanging economic and environmental conditions and the sustainability of agriculture.
Environmental processes relate to the interaction between agriculture and natural environmentalprocesses. Particularly relevant in this respect, is that farming forms a part of the ecosystem rather thanbeing external to it, unlike most other economic activities. Agri-environmental relationships are oftencomplex, site specific and non-linear, with a wide range of biophysical conditions within and acrossOECD countries, reflecting, for example, variations in climate, soils, availability of water resources, andland use patterns.
Land use changes represent the integrating element between the economic, societal and environ-mental influences on agriculture. For most OECD countries agricultural land occupies over 50 per cent ofthe total land area, with only a small reduction in area over the past 10 years, mainly through agricul-tural land being converted to forests in marginal farming areas. The change of marginal farming land toother land uses has raised concerns related to the associated harmful environmental and socio-economic impacts in some countries, but equally the conversion of this land may enhance its biodiver-sity and related amenity values.
The pattern of agricultural land use change within countries has mainly involved a growing share of per-manent pasture in agricultural land, largely because of the adoption of land diversion schemes.Changes in farm land use from arable crops to pasture, more to less intensive cropping systems, and interms of different cropping patterns can have major environmental effects, such as through altering soilerosion rates.
© OECD 2000
Agriculture in the Broader Economic, Social and Environmental Context
13
0020001t1.fm Page 13 Thursday, November 16, 2000 8:58 AM
10
0
-5
% %
5
-10
10
0
-5
5
-10
% %100
75
50
25
0
100
75
50
25
0
0 10 20 30 40 50 60 70 80%
1997-991986-88
Share of agricultural land use in the total national land area: 1995-97
Agricultural land Other land
Turk
ey
Greec
e
Icelan
d
New Z
ealan
d
Hunga
ry
Poland
Korea
Mex
ico
Irelan
d
Portu
gal
Finlan
dSpa
in
Denm
ark
Austra
lia
Nethe
rland
sIta
ly
Canad
a
Franc
e
EU-15
Norway
Sweden
Japa
n
United
Sta
tes
United
King
dom
Austri
a
Belgium
Switzer
land
Germ
any
OECD
Czech
Rep
ublic
Percentage Producer Support Estimate: 1986-88 to 1997-99
Change in the agricultural land area: 1985-87 to 1995-97
Turk
ey
Greec
e
Icelan
d
New Z
ealan
d
Hunga
ry
Poland
Korea
Mex
ico
Irelan
d
Portu
gal
Finlan
dSpa
in
Denm
ark
Austra
lia
Nethe
rland
sIta
ly
Canad
a
Franc
e
EU-15
Norway
Sweden
Japa
n
United
Sta
tes
United
King
dom
Austri
a
Belgium
Switzer
land
Germ
any
OECD
Switzerland
Norway
Korea
Iceland
Japan
EU
OECD
Turkey
Poland
United States
Mexico
Czech Republic
Canada
Hungary
Australia
New Zealand
10
0
-5
% %
5
-10
10
0
-5
5
-10
% %100
75
50
25
0
100
75
50
25
0
0 10 20 30 40 50 60 70 80%
1997-991986-88
Share of agricultural land use in the total national land area: 1995-97
Agricultural land Other land
Turk
ey
Greec
e
Icelan
d
New Z
ealan
d
Hunga
ry
Poland
Korea
Mex
ico
Irelan
d
Portu
gal
Finlan
dSpa
in
Denm
ark
Austra
lia
Nethe
rland
sIta
ly
Canad
a
Franc
e
EU-15
Norway
Sweden
Japa
n
United
Sta
tes
United
King
dom
Austri
a
Belgium
Switzer
land
Germ
any
OECD
Czech
Rep
ublic
Percentage Producer Support Estimate: 1986-88 to 1997-99
Change in the agricultural land area: 1985-87 to 1995-97
Turk
ey
Greec
e
Icelan
d
New Z
ealan
d
Hunga
ry
Poland
Korea
Mex
ico
Irelan
d
Portu
gal
Finlan
dSpa
in
Denm
ark
Austra
lia
Nethe
rland
sIta
ly
Canad
a
Franc
e
EU-15
Norway
Sweden
Japa
n
United
Sta
tes
United
King
dom
Austri
a
Belgium
Switzer
land
Germ
any
OECD
Switzerland
Norway
Korea
Iceland
Japan
EU
OECD
Turkey
Poland
United States
Mexico
Czech Republic
Canada
Hungary
Australia
New Zealand
© OECD 2000
Environmental Indicators for Agriculture: Methods and Results
14
0020001t1.fm Page 14 Thursday, November 16, 2000 8:58 AM
2. FARM FINANCIAL RESOURCES
Context
Financial resources are a key driving force behind farmers’ actions, but are not directly related toenvironmental performance. The relationship between farm financial resources and environmental out-comes is complex, as farms can remain profitable at the expense of environmental degradation, at leastover the medium term. Profitable farms, however, can better afford to take the environment intoaccount in their investment and farm management decisions.
The availability of financial resources influences farming practices; the ability to acquire new tech-nologies; as well as the type, level and intensity of input use and of production. They also affect thedegree of adoption of environmentally benign production methods, including farmers’ attitude towardsenvironmental risks; rates of structural adjustment, including farm amalgamation; and the exit and entryof farmers into the sector.
The two main sources of farm financial resources in OECD countries include returns from the mar-ket and government support (farm household income can also include non-farm sources of income).The type and level of support provided to farmers varies widely across the OECD. Since the late 1980smany countries have introduced agri-environmental measures, and land diversion schemes with envi-ronmental objectives, mainly aimed at: changing farming practices (e.g. raising environmental awarenessthrough farm advisory services or voluntary farm groups); developing agri-environmental research(e.g. on soil carbon changes); providing payments to farmers for reducing environmental damage(e.g. animal waste treatment facilities) and enhancing environmental services (e.g. laying hedgerows). Inaddition, farmers also have to comply with environmental standards and regulations, especially withregard to the use of pesticides and inorganic fertilisers.
Indicators and recent trends
OECD indicators on farm financial resources reflect the financial health of the farm and cover twoareas: first, net farm income from agricultural activities, and second, public and private agri-environmentalexpenditure, including agri-environmental research expenditure.
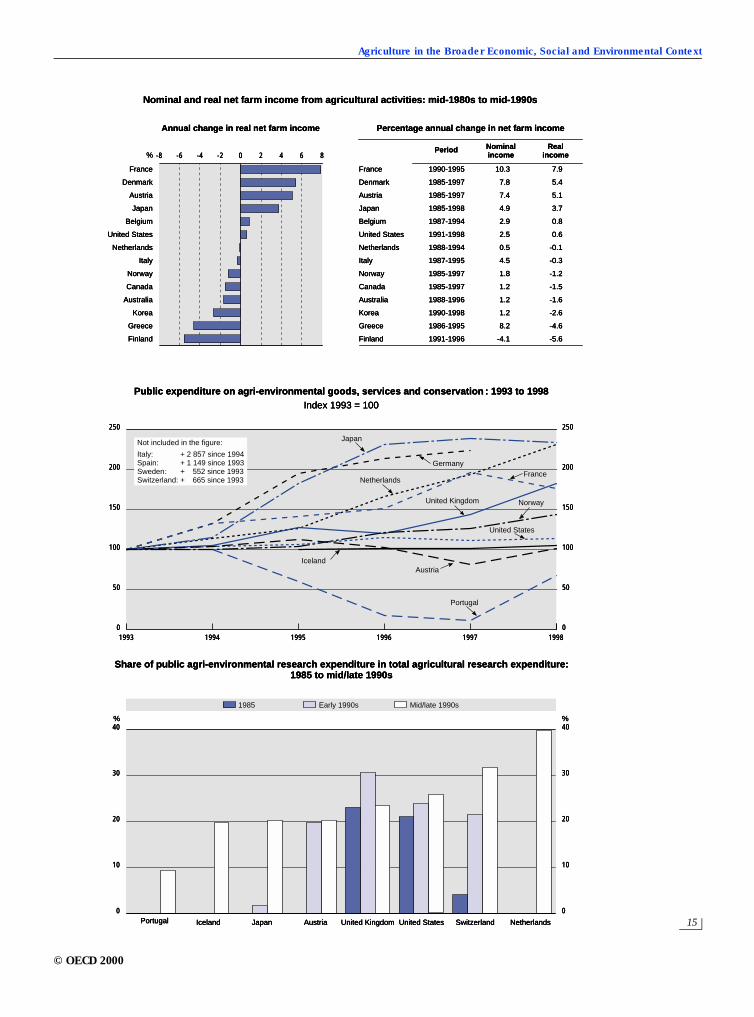
Net farm income is calculated as the difference between gross output and all expenses, includingdepreciation at the farm level. While nominal net farm incomes have risen for most OECD countriesover the past 10 years, the performance in real terms has been variable and over recent years net farmincomes have sharply declined for some countries. Agricultural households also obtain a substantialshare of their income from non-agricultural activities in many countries, and in some countries the totalaverage income of agricultural households exceeds that of non-agricultural ones.
Public and private agri-environmental expenditure is aimed at both mitigating the negative impacts of agri-culture on the environment and also enhancing the benefits. For a large number of OECD countriesthere has been a very rapid increase in public agri-environmental expenditure over the 1990s, associ-ated with the introduction of many new environmental measures related to agriculture. The use of thisexpenditure varies widely across countries, reflecting differences in agri-environmental concerns andpriorities.
A significant share of public agricultural research expenditure in many countries is spent on addressingagri-environmental concerns, and in some cases this share has been increasing since the mid-1980s.While in a few countries private agri-environmental expenditure is important, there is little systematic collec-tion of this expenditure data.
© OECD 2000
Agriculture in the Broader Economic, Social and Environmental Context
15
0020001t1.fm Page 15 Thursday, November 16, 2000 8:58 AM
-8 8-6 -4 -2 0 2 4 6%
250
0
200
150
100
50
250
0
200
150
100
50
1993 19981994 1995 1996 1997
% %40
0
30
20
10
40
0
30
20
10
Nominal and real net farm income from agricultural activities: mid-1980s to mid-1990s
France
Denmark
Austria
Japan
Belgium
United States
Netherlands
Italy
Norway
Canada
Australia
Korea
Greece
Finland
Annual change in real net farm income
France 1990-1995 10.3 7.9
Denmark 1985-1997 7.8 5.4
Austria 1985-1997 7.4 5.1
Japan 1985-1998 4.9 3.7
Belgium 1987-1994 2.9 0.8
United States 1991-1998 2.5 0.6
Netherlands 1988-1994 0.5 -0.1
Italy 1987-1995 4.5 -0.3
Norway 1985-1997 1.8 -1.2
Canada 1985-1997 1.2 -1.5
Australia 1988-1996 1.2 -1.6
Korea 1990-1998 1.2 -2.6
Greece 1986-1995 8.2 -4.6
Finland 1991-1996 -4.1 -5.6
Percentage annual change in net farm income
Period Nominalincome
Realincome
Public expenditure on agri-environmental goods, services and conservation : 1993 to 1998Index 1993 = 100
Not included in the figure:
Italy: + 2 857 since 1994Spain: + 1 149 since 1993Sweden: + 552 since 1993Switzerland: + 665 since 1993
Japan
Germany
NetherlandsFrance
United Kingdom Norway
United States
IcelandAustria
Portugal
Share of public agri-environmental research expenditure in total agricultural research expenditure:1985 to mid/late 1990s
Mid/late 1990sEarly 1990s
Portugal Iceland Japan Austria United Kingdom United States Switzerland Netherlands
1985
© OECD 2000

0020001t1.fm Page 17 Thursday, November 16, 2000 8:58 AM
Part II
FARM MANAGEMENT AND THE ENVIRONMENT
1. FARM MANAGEMENT
Environmental Indicators for Agriculture: Methods and Results
18
0020001t1.fm Page 18 Thursday, November 16, 2000 8:58 AM
1. FARM MANAGEMENT
Context
Environmental conditions and farming systems vary within and across OECD countries and, conse-quently, best farm management practices vary from one region to another. Farm management decisionsare influenced by environmental regulations, agricultural support measures, investments in research,education and extension services and site-specific environmental conditions. Information on farm man-agement practices, and how these practices affect the environment and meet compulsory, regulatory orvoluntary standards, is an important tool for policy makers.
There can be trade-offs in implementing environmentally sound management practices. Reducingsoil erosion, for example, whereby farmers move from conventional to reduced or no-tillage in crop pro-duction, can be achieved if weeds are controlled with herbicides. An environmental side-effect of thesepractices is a likely change in water movement in the soil, with no-tillage leading to increasing infiltra-tion and percolation of nutrients such as nitrate to the water table compared with conventional tillage.In addition, the increase in herbicide use may cause pesticide leaching. Thus, the objective of loweringsoil erosion through no-tillage may lead to some negative environmental effects.
Indicators and recent trends
Farm management indicators have the potential to help policy makers take into account the link-ages and trade-offs between different management practices and their impact on the environment,including: whole farm management involving the overall farming system; and farm management aimedat specific practices related to nutrients, pests, soils, and irrigation.
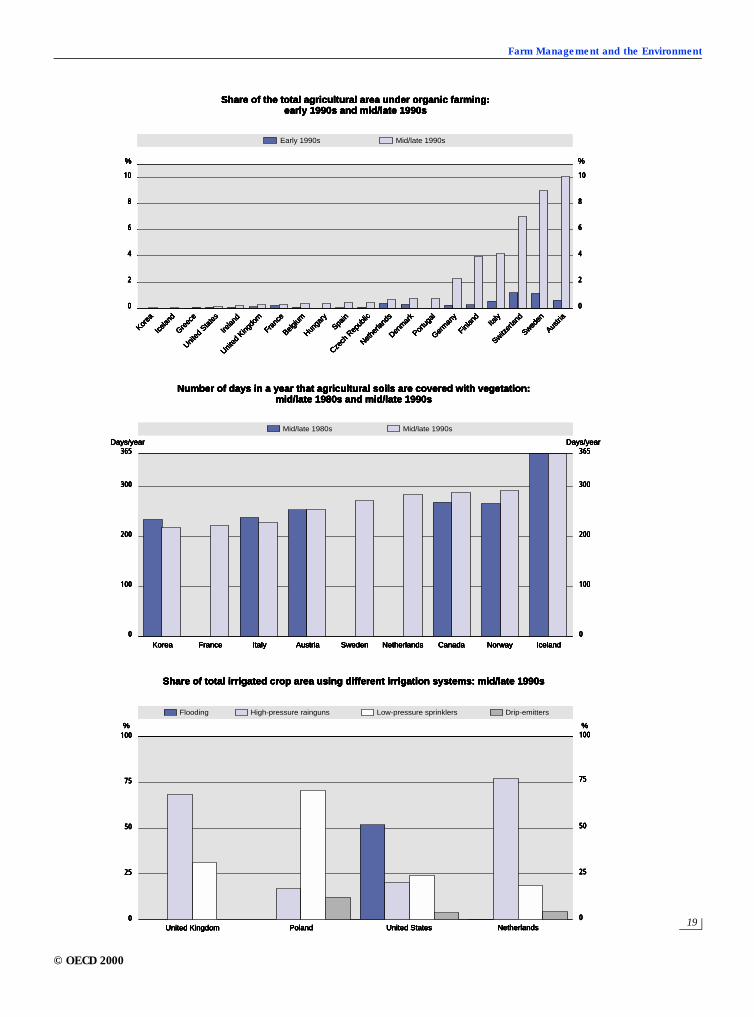
Concerning whole farm management indicators, the share of farms with environmental whole farm plans isincreasing, but cross-country data is limited. Also the share of agricultural area under organic farming hasincreased significantly over the past ten years, but from a very low base and with wide variations amongOECD countries. Many countries now encourage conversion to and maintenance of organic farming byproviding financial compensation to farmers for any losses incurred during conversion.
Nutrient management indicators include the share of farms with nutrient management plans and thefrequency of soil nutrient tests. Although many countries have developed nutrient management plans,there is little quantitative information available, however, and soil tests are conducted in most OECDcountries at regular intervals.
Pest management indicators measure the share of cultivated agricultural area that is not treated withpesticides and the share of cultivated agricultural area under integrated pest management. Based onlimited information, for a few countries it appears both practices have been used more widely duringthe 1990s.
Soil and land management indicators measure the number of days in a year that the soil is coveredwith vegetation. The greater the cumulative soil cover, the greater the protection from soil erosion, com-paction and run-off and the contribution, in general, to biodiversity. Many OECD countries have policyinitiatives to increase soil cover and promote environmental land management practices. In a numberof countries, soil cover days have increased since the mid-1980s and now exceed 250 days per year, butin a few countries days of soil cover has decreased.
Irrigation and water management indicators measure the share of irrigation water applied by differentirrigation technologies, from the least efficient methods (e.g. flooding) to technologies (e.g. drip-emitters) that use water more efficiently. For the few countries where information on changes in irriga-tion technologies exist, this suggests a shift toward technologies that use water more efficiently. More-over, water is not considered a scarce resource in many OECD countries and consequently issuesrelated to irrigation efficiency are of less importance in those countries.
© OECD 2000
Farm Management and the Environment
19
0020001t1.fm Page 19 Thursday, November 16, 2000 9:34 AM
%
10
8
6
4
2
0
10
8
6
4
2
0
%
365
300
200
100
0
365
300
200
100
0
100
75
50
25
0
100
75
50
25
0
% %
Share of the total agricultural area under organic farming:early 1990s and mid/late 1990s
Greec
e
Icelan
d
Hunga
ry
Korea
Irelan
d
Portu
gal
Finlan
dSpa
in
Denm
ark
Nethe
rland
sIta
ly
Franc
e
Sweden
United
Sta
tes
United
King
dom
Austri
a
Belgium
Switzer
land
Germ
any
Czech
Rep
ublic
Early 1990s Mid/late 1990s
Number of days in a year that agricultural soils are covered with vegetation:mid/late 1980s and mid/late 1990s
Korea France Italy CanadaAustria
Mid/late 1980s Mid/late 1990s
Days/year Days/year
Norway IcelandSweden Netherlands
Share of total irrigated crop area using different irrigation systems: mid/late 1990s
United Kingdom Poland United States
Flooding High-pressure rainguns
Netherlands
Low-pressure sprinklers Drip-emitters
%
10
8
6
4
2
0
10
8
6
4
2
0
%
365
300
200
100
0
365
300
200
100
0
100
75
50
25
0
100
75
50
25
0
% %
Share of the total agricultural area under organic farming:early 1990s and mid/late 1990s
Greec
e
Icelan
d
Hunga
ry
Korea
Irelan
d
Portu
gal
Finlan
dSpa
in
Denm
ark
Nethe
rland
sIta
ly
Franc
e
Sweden
United
Sta
tes
United
King
dom
Austri
a
Belgium
Switzer
land
Germ
any
Czech
Rep
ublic
Early 1990s Mid/late 1990s
Number of days in a year that agricultural soils are covered with vegetation:mid/late 1980s and mid/late 1990s
Korea France Italy CanadaAustria
Mid/late 1980s Mid/late 1990s
Days/year Days/year
Norway IcelandSweden Netherlands
Share of total irrigated crop area using different irrigation systems: mid/late 1990s
United Kingdom Poland United States
Flooding High-pressure rainguns
Netherlands
Low-pressure sprinklers Drip-emitters
© OECD 2000

0020001t1.fm Page 21 Thursday, November 16, 2000 8:58 AM
Part III
USE OF FARM INPUTS AND NATURAL RESOURCES
1. NUTRIENT USE
2. PESTICIDE USE AND RISKS
3. WATER USE
Environmental Indicators for Agriculture: Methods and Results
22
0020001t1.fm Page 22 Thursday, November 16, 2000 8:58 AM
1. NUTRIENT USE
Context
Inputs of nutrients, such as nitrogen and phosphorus, are essential to agricultural production, andintegral to raising productivity. At the same time, a surplus of nutrients in excess of immediate cropneeds can be a source of potential environmental damage to surface and ground water (eutrophication),air quality (acidification) and contribute to global warming (greenhouse effect). If soils are farmed andnutrients not replenished, this can lead to declining soil fertility and may impair agricultural sustainabil-ity through“soil mining” of nutrients.
Many OECD countries have established goals to reduce nutrient emissions from agriculture.These are closely linked to the need for agriculture to comply with national standards for nitrate andphosphate emissions into aquatic environments. A number of international conventions and agree-ments also have the objective of limiting and reducing transboundary emissions into the environ-ment, including nutrient emissions from agriculture into surface and ground water, marine waters andthe atmosphere.
Indicators and recent trends
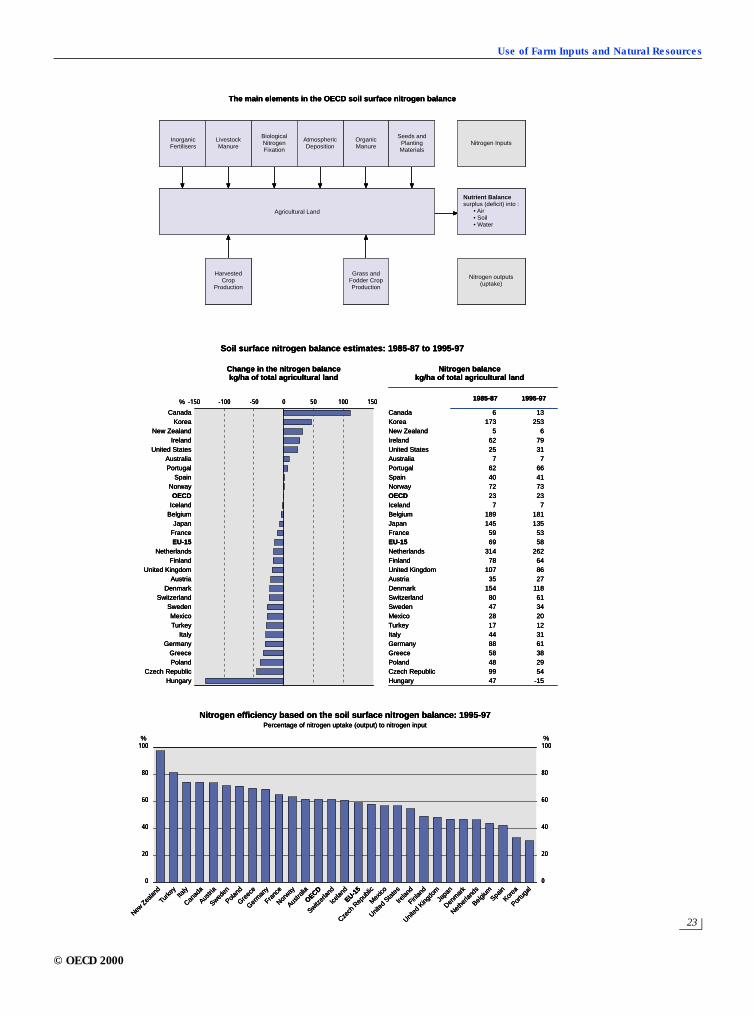
The OECD soil surface nitrogen balance indicator measures the difference between the nitrogen availableto an agricultural system (inputs, mainly from livestock manure and chemical fertilisers) and the uptakeof nitrogen by agriculture (outputs, largely crops and forage). A persistent surplus indicates potentialenvironmental pollution, while a persistent deficit indicates potential agricultural sustainability prob-lems.
The indicator provides information on the potential loss of nitrogen to the soil, the air, and to sur-face or groundwater. However, nitrogen loss through the volatilisation of ammonia to the atmospherefrom livestock housing and stored manure is excluded from the calculation.
The trend with regard to surpluses in national nitrogen soil surface balances over the last decade isdownward or constant for most OECD countries, which suggests that the potential environmental impactfrom agricultural nitrogen emissions is decreasing or stable. Some countries with a relatively high nitro-gen surplus have reported significant reductions, although for a few countries surpluses have risen.
The spatial variation of nitrogen surpluses within a country can be considerable. Regional data sug-gests that even in countries with a relatively low national nitrogen surplus, nitrate pollution is experi-enced in some localities, while soil nutrient deficits occur in others.
A second nutrient use indicator, the efficiency of nitrogen use in agriculture, measures the physicalnitrogen input/output ratio. This indicator has shown an improvement in nitrogen use efficiency formost countries over the past decade. However, there is considerable variation across countries inthe efficiency of using nitrogen in agriculture, and in some cases the efficiency of nitrogen use hasdeteriorated.
© OECD 2000
Use of Farm Inputs and Natural Resources
23
0020001t1.fm Page 23 Thursday, November 16, 2000 8:58 AM
-150 150-100 -50 0 50 100% 1985-87 1995-97
% %100
60
20
0
40
80
100
60
20
0
40
80
The main elements in the OECD soil surface nitrogen balance
Agricultural Land
InorganicFertilisers
LivestockManure
BiologicalNitrogenFixation
AtmosphericDeposition
OrganicManure
Seeds andPlantingMaterials
HarvestedCrop
Production
Grass andFodder CropProduction
Nitrogen Inputs
Nutrient Balancesurplus (deficit) into :
• Air• Soil• Water
Nitrogen outputs(uptake)
Soil surface nitrogen balance estimates: 1985-87 to 1995-97
Nitrogen balancekg/ha of total agricultural land
Change in the nitrogen balancekg/ha of total agricultural land
Canada 6 13Korea 173 253New Zealand 5 6Ireland 62 79United States 25 31Australia 7 7Portugal 62 66Spain 40 41Norway 72 73OECD 23 23Iceland 7 7Belgium 189 181Japan 145 135France 59 53EU-15 69 58Netherlands 314 262Finland 78 64United Kingdom 107 86Austria 35 27Denmark 154 118Switzerland 80 61Sweden 47 34Mexico 28 20Turkey 17 12Italy 44 31Germany 88 61Greece 58 38Poland 48 29Czech Republic 99 54Hungary 47 -15
CanadaKorea
New ZealandIreland
United StatesAustraliaPortugal
SpainNorwayOECD
IcelandBelgium
JapanFranceEU-15
NetherlandsFinland
United KingdomAustria
DenmarkSwitzerland
SwedenMexicoTurkey
ItalyGermany
GreecePoland
Czech RepublicHungary
Nitrogen efficiency based on the soil surface nitrogen balance: 1995-97Percentage of nitrogen uptake (output) to nitrogen input
OECD
Canad
a
Austra
lia
Norway
Turk
ey
Austri
aIta
ly
Poland
Sweden
Icelan
d
Germ
any
Franc
e
Greec
e
Switzer
land
EU-15
Czech
Rep
ublic
Mex
ico
United
Sta
tes
Irelan
d
Finlan
d
United
King
dom
Japa
n
Denm
ark
Nethe
rland
s
Belgium
Spain
Korea
Portu
gal
New Z
ealan
d
© OECD 2000
Environmental Indicators for Agriculture: Methods and Results
24
0020001t1.fm Page 24 Thursday, November 16, 2000 8:58 AM
2. PESTICIDE USE AND RISKS
Context
Agricultural pesticides contribute to agricultural productivity but also pose potential risks tohuman health and the environment. The risks vary greatly depending on pesticide’s inherent toxicity (orhazard) and exposure. Exposure to a pesticide depends on the way it is applied and its mobility andpersistence in the environment.
Pesticide use by farmers depends on a multitude of factors, such as climatic conditions, the compo-sition and variety of crops, pest and disease pressures, farm incomes, pesticide cost/crop price ratios,pesticide policies and management practices. Pesticide indicators are potentially a useful tool to helppolicy makers monitor and evaluate policies and also provide information concerning human and envi-ronmental pesticide risks.
All OECD countries have a regulatory system that assesses pesticides prior to their release for sale,to ensure they do not pose unacceptable risks to the environment and public above nationally agreedthresholds. A number of countries have also set targets to reduce the total quantity of agricultural pesti-cides used over a given time period. In addition, policies to reduce risk, and other measures like pesti-cide taxes, are being used in some countries, to reduce the environmental and health impacts ofpesticide use.
Indicators and recent trends
OECD is developing two kinds of indicators. One shows pesticide use trends over time based onsales and/or use data in terms of active ingredients. The other indicator tracks trends in pesticide risksby combining information on pesticide hazard and exposure with pesticide use data and information onthe conditions that might affect risks. Pesticide use indicators are simpler, but because the policies ofOECD member countries aim ultimately to reduce risks, it is important to develop the more complexbut highly policy relevant indicators of risk trends.
Overall the trend in pesticide use over the last decade has remained constant or declined in mostOECD countries, although for a few countries use has increased. The reduction can be explained partlyby changing crop prices, greater efficiency of pesticide use as a result of improvements in pest manage-ment practices and technology, and government policies aimed at both improving pest managementpractices, and in some cases targeting a reduction in pesticide use.
There is evidence to suggest an increasing efficiency in the use of pesticides for some OECD coun-tries, with the volume of crop production over the past 10-12 years increasing more rapidly than pesti-cide use. For a considerable number of countries, however, annual changes in pesticides use appear tobe closely correlated with fluctuations in annual crop production trends.
The close correlation between trends in pesticide use and risks estimated by a few OECD coun-tries, over a period of 10 or more years suggest that pesticide risks to human health and the environ-ment can be reduced by reducing the use of particular chemicals. Caution is required, however, inlinking trends in pesticide use with changes in risks. This is because a change in pesticide use is notalways equivalent to a change in risks, especially with the development of more targeted pesticides,and because different pesticides pose different types and levels of risks.
Preliminary results of OECD work on pesticide risk indicators for the aquatic environment show thatdifferent indicator methods can produce different pesticide risk trends, even when using the same dataon pesticide risks and use.
© OECD 2000
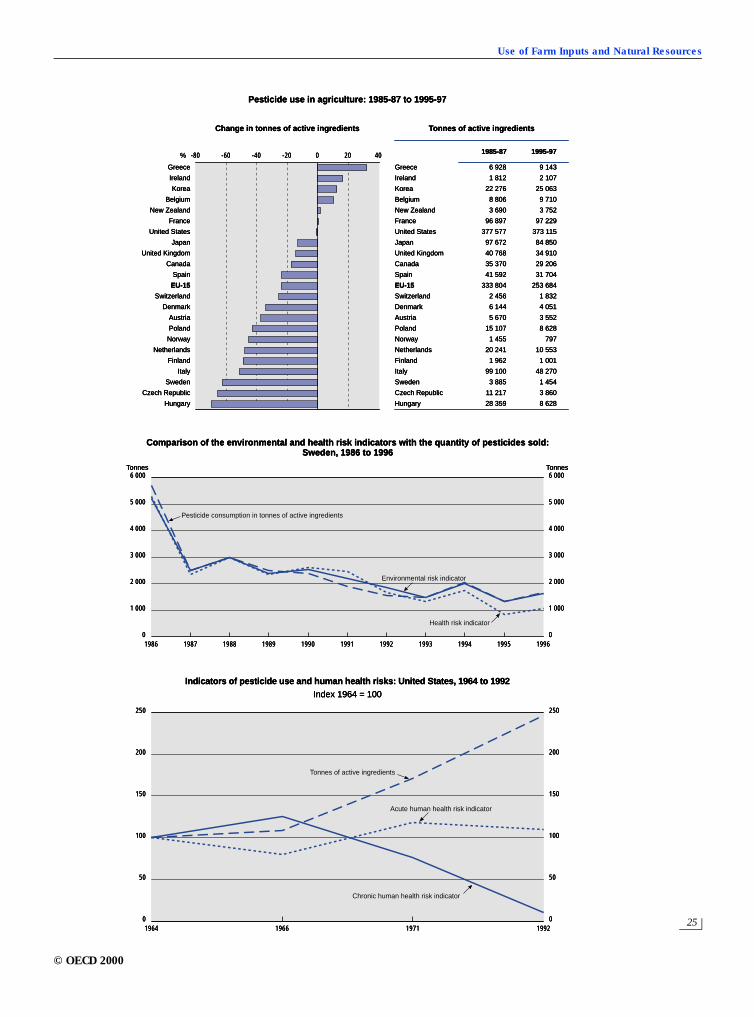
Use of Farm Inputs and Natural Resources
25
0020001t1.fm Page 25 Thursday, November 16, 2000 8:58 AM
6 000
19860
5 000
4 000
3 000
2 000
1 000
6 000
0
5 000
4 000
3 000
2 000
1 000
1987 1988 1989 1990 1991 1992 1993 1994 1995 1996
1964 19921966 1971
250
0
200
150
100
50
250
0
200
150
100
50
-80 40-60 -40 -20 0 20% 1985-87 1995-97
Tonnes of active ingredients
Pesticide use in agriculture: 1985-87 to 1995-97
Change in tonnes of active ingredients
Greece 6 928 9 143
Ireland 1 812 2 107
Korea 22 276 25 063
Belgium 8 806 9 710
New Zealand 3 690 3 752
France 96 897 97 229
United States 377 577 373 115
Japan 97 672 84 850
United Kingdom 40 768 34 910
Canada 35 370 29 206
Spain 41 592 31 704
EU-15 333 804 253 684
Switzerland 2 456 1 832
Denmark 6 144 4 051
Austria 5 670 3 552
Poland 15 107 8 628
Norway 1 455 797
Netherlands 20 241 10 553
Finland 1 962 1 001
Italy 99 100 48 270
Sweden 3 885 1 454
Czech Republic 11 217 3 860
Hungary 28 359 8 628
Greece
Ireland
Korea
Belgium
New Zealand
France
United States
Japan
United Kingdom
Canada
Spain
EU-15
Switzerland
Denmark
Austria
Poland
Norway
Netherlands
Finland
Italy
Sweden
Czech Republic
Hungary
Pesticide consumption in tonnes of active ingredients
Environmental risk indicator
Health risk indicator
Comparison of the environmental and health risk indicators with the quantity of pesticides sold:Sweden, 1986 to 1996
Tonnes Tonnes
Indicators of pesticide use and human health risks: United States, 1964 to 1992Index 1964 = 100
Tonnes of active ingredients
Acute human health risk indicator
Chronic human health risk indicator
6 000
19860
5 000
4 000
3 000
2 000
1 000
6 000
0
5 000
4 000
3 000
2 000
1 000
1987 1988 1989 1990 1991 1992 1993 1994 1995 1996
1964 19921966 1971
250
0
200
150
100
50
250
0
200
150
100
50
-80 40-60 -40 -20 0 20% 1985-87 1995-97
Tonnes of active ingredients
Pesticide use in agriculture: 1985-87 to 1995-97
Change in tonnes of active ingredients
Greece 6 928 9 143
Ireland 1 812 2 107
Korea 22 276 25 063
Belgium 8 806 9 710
New Zealand 3 690 3 752
France 96 897 97 229
United States 377 577 373 115
Japan 97 672 84 850
United Kingdom 40 768 34 910
Canada 35 370 29 206
Spain 41 592 31 704
EU-15 333 804 253 684
Switzerland 2 456 1 832
Denmark 6 144 4 051
Austria 5 670 3 552
Poland 15 107 8 628
Norway 1 455 797
Netherlands 20 241 10 553
Finland 1 962 1 001
Italy 99 100 48 270
Sweden 3 885 1 454
Czech Republic 11 217 3 860
Hungary 28 359 8 628
Greece
Ireland
Korea
Belgium
New Zealand
France
United States
Japan
United Kingdom
Canada
Spain
EU-15
Switzerland
Denmark
Austria
Poland
Norway
Netherlands
Finland
Italy
Sweden
Czech Republic
Hungary
Pesticide consumption in tonnes of active ingredients
Environmental risk indicator
Health risk indicator
Comparison of the environmental and health risk indicators with the quantity of pesticides sold:Sweden, 1986 to 1996
Tonnes Tonnes
Indicators of pesticide use and human health risks: United States, 1964 to 1992Index 1964 = 100
Tonnes of active ingredients
Acute human health risk indicator
Chronic human health risk indicator
© OECD 2000
Environmental Indicators for Agriculture: Methods and Results
26
0020001t1.fm Page 26 Thursday, November 16, 2000 8:58 AM
3. WATER USE
Context
In some regions in OECD countries agriculture is facing increasing competition for surface andgroundwater from urban and industrial demands. Also there is a growing recognition to meet environ-mental needs through allocations of water for the environment and protection of down-stream impactsfrom agricultural pollution. Even so, for some OECD countries the issue of water use is not a policy con-cern because they are richly endowed with water resources.
Governments have traditionally invested in the development of irrigation schemes for the pur-poses of national and regional development. This often involved a substantial subsidy to establish andmaintain irrigation systems and the consequent underpricing of water to agriculture. A number of OECDcountries are beginning to seek more efficient and effective use of water in agriculture, by movingtowards a full-cost recovery system of water pricing, as a means of adequately valuing water as an inputto agricultural production.
Indicators and recent trends
OECD is developing three indicators related to agriculture’s use of surface and groundwater: firstthe intensity of water use by agriculture relative to other users in the national economy; second themeasurement of the technical (volume) and economic (value) efficiency of water use on irrigated land;and third a water stress indicator to gauge the extent to which diversions or extractions of water fromrivers are impacting on aquatic ecosystems.
The share of agriculture in total national water utilisation is high for most OECD countries, with thesector currently accounting for nearly 45 per cent of total OECD water utilisation, and over 60 per centfor nine OECD countries. While utilisation levels are far below available water resources for most coun-tries, for more arid regions the utilisation intensity of water, especially by agriculture, is a much highershare of available resources. In these situations agriculture has to compete with other users for scarceavailable water resources.
Even where competition for water resources between agriculture and other sectors is less pro-nounced, the growing need to meet recreational and environmental demands for water may requirethat agriculture improves its efficiency of water use.
Information on the technical or economic efficiency of irrigation water use across OECD countries isextremely limited. Since the early 1980s there has been a continuous upward trend in water use for irri-gation in many OECD countries, associated with the increase in the irrigated land area. The expansionin the irrigated area has been mainly encouraged by government investment in irrigation infrastructureand an irrigation water subsidy. The price of water paid by farmers in many OECD countries is substan-tially below that paid by industrial and household users, even when differences in water quality and thecosts of water conveyancing systems between agriculture and other users are taken into account.
There is relatively little information on the extent or trends in water stress caused by diverting sur-face water from rivers for agricultural use. Also very few OECD countries define and monitor flow ratesfor rivers subject to diversion of water for agricultural use. In part, this lack of information highlights formany OECD countries that water stress caused by agricultural diversions from rivers is not a concern.Where flow rates are defined and measured, this is to help allocate inter-provincial river flows or trans-boundary flows.
© OECD 2000
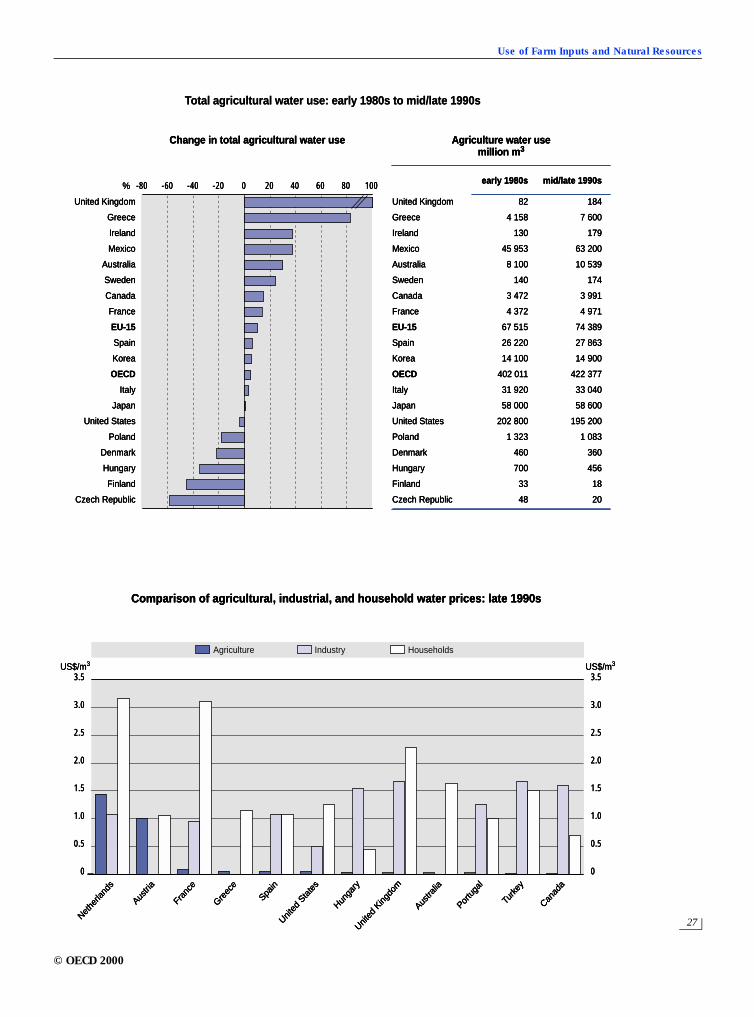
Use of Farm Inputs and Natural Resources
27
0020001t1.fm Page 27 Thursday, November 16, 2000 8:58 AM
-80 100-60 -40 -20 0 20% 40 60 80
3.5
0
3.0
2.5
2.0
1.5
1.0
0.5
3.5
0
3.0
2.5
2.0
1.5
1.0
0.5
Comparison of agricultural, industrial, and household water prices: late 1990s
Agriculture water usemillion m3
Change in total agricultural water use
United Kingdom
Greece
Ireland
Mexico
Australia
Sweden
Canada
France
EU-15
Spain
Korea
OECD
Italy
Japan
United States
Poland
Denmark
Hungary
Finland
Czech Republic
United Kingdom 82 184
Greece 4 158 7 600
Ireland 130 179
Mexico 45 953 63 200
Australia 8 100 10 539
Sweden 140 174
Canada 3 472 3 991
France 4 372 4 971
EU-15 67 515 74 389
Spain 26 220 27 863
Korea 14 100 14 900
OECD 402 011 422 377
Italy 31 920 33 040
Japan 58 000 58 600
United States 202 800 195 200
Poland 1 323 1 083
Denmark 460 360
Hungary 700 456
Finland 33 18
Czech Republic 48 20
early 1980s mid/late 1990s
US$/m3 US$/m3
Industry HouseholdsAgriculture
Nethe
rland
s
Austri
a
Fran
ce
Greec
e
Spain
United
Sta
tes
Hunga
ry
United
King
dom
Austra
lia
Portu
gal
Turk
ey
Canad
a
-80 100-60 -40 -20 0 20% 40 60 80
3.5
0
3.0
2.5
2.0
1.5
1.0
0.5
3.5
0
3.0
2.5
2.0
1.5
1.0
0.5
Comparison of agricultural, industrial, and household water prices: late 1990s
Agriculture water usemillion m3
Total agricultural water use: early 1980s to mid/late 1990s
Change in total agricultural water use
United Kingdom
Greece
Ireland
Mexico
Australia
Sweden
Canada
France
EU-15
Spain
Korea
OECD
Italy
Japan
United States
Poland
Denmark
Hungary
Finland
Czech Republic
United Kingdom 82 184
Greece 4 158 7 600
Ireland 130 179
Mexico 45 953 63 200
Australia 8 100 10 539
Sweden 140 174
Canada 3 472 3 991
France 4 372 4 971
EU-15 67 515 74 389
Spain 26 220 27 863
Korea 14 100 14 900
OECD 402 011 422 377
Italy 31 920 33 040
Japan 58 000 58 600
United States 202 800 195 200
Poland 1 323 1 083
Denmark 460 360
Hungary 700 456
Finland 33 18
Czech Republic 48 20
early 1980s mid/late 1990s
US$/m3 US$/m3
Industry HouseholdsAgriculture
Nethe
rland
s
Austri
a
Fran
ce
Greec
e
Spain
United
Sta
tes
Hunga
ry
United
King
dom
Austra
lia
Portu
gal
Turk
ey
Canad
a
© OECD 2000

0020001t1.fm Page 29 Thursday, November 16, 2000 8:58 AM
Part IV
ENVIRONMENTAL IMPACTS OF AGRICULTURE
1. SOIL QUALITY
2. WATER QUALITY
3. LAND CONSERVATION
4. GREENHOUSE GASES
5. BIODIVERSITY
6. WILDLIFE HABITATS
7. LANDSCAPE
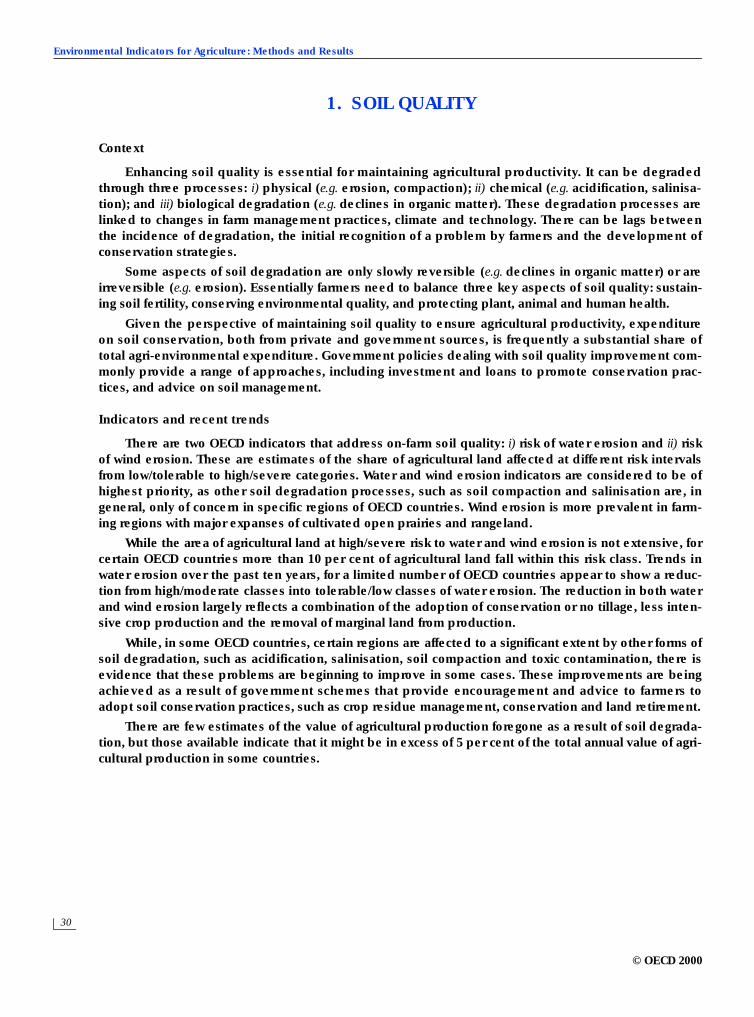
Environmental Indicators for Agriculture: Methods and Results
30
0020001t1.fm Page 30 Thursday, November 16, 2000 8:58 AM
1. SOIL QUALITY
Context
Enhancing soil quality is essential for maintaining agricultural productivity. It can be degradedthrough three processes: i) physical (e.g. erosion, compaction); ii) chemical (e.g. acidification, salinisa-tion); and iii) biological degradation (e.g. declines in organic matter). These degradation processes arelinked to changes in farm management practices, climate and technology. There can be lags betweenthe incidence of degradation, the initial recognition of a problem by farmers and the development ofconservation strategies.
Some aspects of soil degradation are only slowly reversible (e.g. declines in organic matter) or areirreversible (e.g. erosion). Essentially farmers need to balance three key aspects of soil quality: sustain-ing soil fertility, conserving environmental quality, and protecting plant, animal and human health.
Given the perspective of maintaining soil quality to ensure agricultural productivity, expenditureon soil conservation, both from private and government sources, is frequently a substantial share oftotal agri-environmental expenditure. Government policies dealing with soil quality improvement com-monly provide a range of approaches, including investment and loans to promote conservation prac-tices, and advice on soil management.
Indicators and recent trends
There are two OECD indicators that address on-farm soil quality: i) risk of water erosion and ii) riskof wind erosion. These are estimates of the share of agricultural land affected at different risk intervalsfrom low/tolerable to high/severe categories. Water and wind erosion indicators are considered to be ofhighest priority, as other soil degradation processes, such as soil compaction and salinisation are, ingeneral, only of concern in specific regions of OECD countries. Wind erosion is more prevalent in farm-ing regions with major expanses of cultivated open prairies and rangeland.
While the area of agricultural land at high/severe risk to water and wind erosion is not extensive, forcertain OECD countries more than 10 per cent of agricultural land fall within this risk class. Trends inwater erosion over the past ten years, for a limited number of OECD countries appear to show a reduc-tion from high/moderate classes into tolerable/low classes of water erosion. The reduction in both waterand wind erosion largely reflects a combination of the adoption of conservation or no tillage, less inten-sive crop production and the removal of marginal land from production.
While, in some OECD countries, certain regions are affected to a significant extent by other forms ofsoil degradation, such as acidification, salinisation, soil compaction and toxic contamination, there isevidence that these problems are beginning to improve in some cases. These improvements are beingachieved as a result of government schemes that provide encouragement and advice to farmers toadopt soil conservation practices, such as crop residue management, conservation and land retirement.
There are few estimates of the value of agricultural production foregone as a result of soil degrada-tion, but those available indicate that it might be in excess of 5 per cent of the total annual value of agri-cultural production in some countries.
© OECD 2000
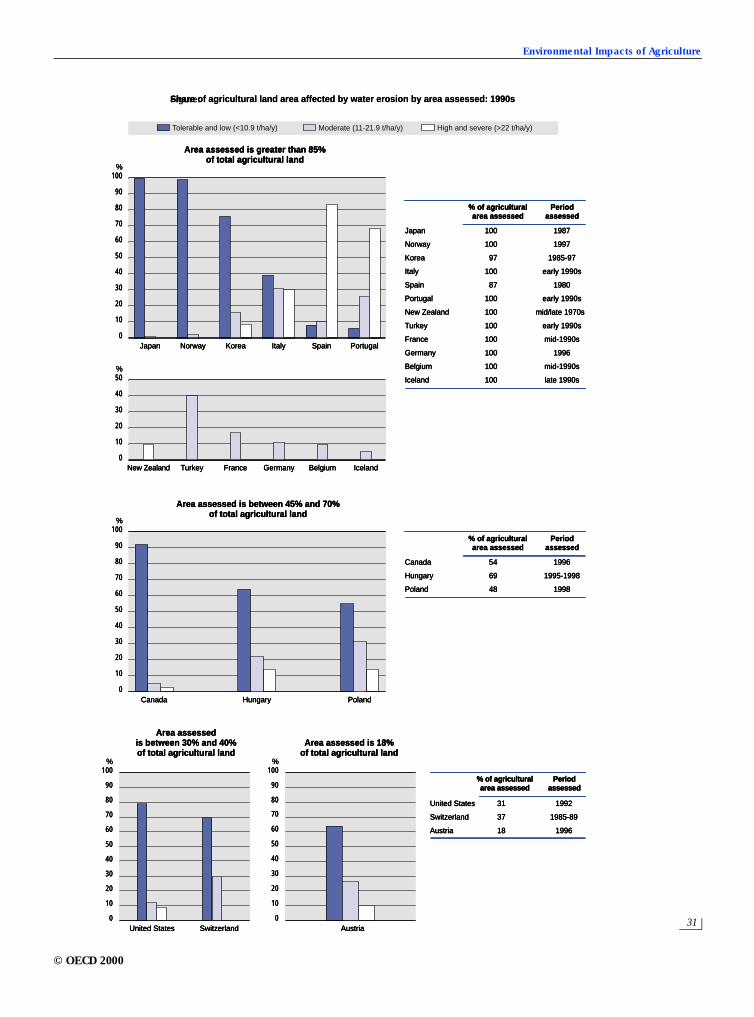
Environmental Impacts of Agriculture
31
0020001t1.fm Page 31 Thursday, November 16, 2000 8:58 AM
%100
%100
0
70
60
50
40
30
20
10
0
70
60
50
40
30
20
10
80
90
80
90
%100
0
90
80
70
60
50
40
30
20
10
%50
0
30
20
10
40
%100
0
90
80
70
60
50
40
30
20
10
Figure:
Moderate (11-21.9 t/ha/y) High and severe (>22 t/ha/y)Tolerable and low (<10.9 t/ha/y)
Area assessedis between 30% and 40%of total agricultural land
Area assessed is 18%of total agricultural land
United States 31 1992
Switzerland 37 1985-89
Austria 18 1996
% of agriculturalarea assessed
Periodassessed
United States Switzerland Austria
Area assessed is greater than 85%of total agricultural land
Japan Norway Korea Italy Spain Portugal
New Zealand Turkey France Germany Belgium Iceland
Canada 54 1996
Hungary 69 1995-1998
Poland 48 1998
Area assessed is between 45% and 70%of total agricultural land
% of agriculturalarea assessed
Periodassessed
Canada Hungary Poland
Japan 100 1987
Norway 100 1997
Korea 97 1985-97
Italy 100 early 1990s
Spain 87 1980
Portugal 100 early 1990s
New Zealand 100 mid/late 1970s
Turkey 100 early 1990s
France 100 mid-1990s
Germany 100 1996
Belgium 100 mid-1990s
Iceland 100 late 1990s
% of agriculturalarea assessed
Periodassessed
%100
%100
0
70
60
50
40
30
20
10
0
70
60
50
40
30
20
10
80
90
80
90
%100
0
90
80
70
60
50
40
30
20
10
%50
0
30
20
10
40
%100
0
90
80
70
60
50
40
30
20
10
Share of agricultural land area affected by water erosion by area assessed: 1990s
Moderate (11-21.9 t/ha/y) High and severe (>22 t/ha/y)Tolerable and low (<10.9 t/ha/y)
Area assessedis between 30% and 40%of total agricultural land
Area assessed is 18%of total agricultural land
United States 31 1992
Switzerland 37 1985-89
Austria 18 1996
% of agriculturalarea assessed
Periodassessed
United States Switzerland Austria
Area assessed is greater than 85%of total agricultural land
Japan Norway Korea Italy Spain Portugal
New Zealand Turkey France Germany Belgium Iceland
Canada 54 1996
Hungary 69 1995-1998
Poland 48 1998
Area assessed is between 45% and 70%of total agricultural land
% of agriculturalarea assessed
Periodassessed
Canada Hungary Poland
Japan 100 1987
Norway 100 1997
Korea 97 1985-97
Italy 100 early 1990s
Spain 87 1980
Portugal 100 early 1990s
New Zealand 100 mid/late 1970s
Turkey 100 early 1990s
France 100 mid-1990s
Germany 100 1996
Belgium 100 mid-1990s
Iceland 100 late 1990s
% of agriculturalarea assessed
Periodassessed
© OECD 2000
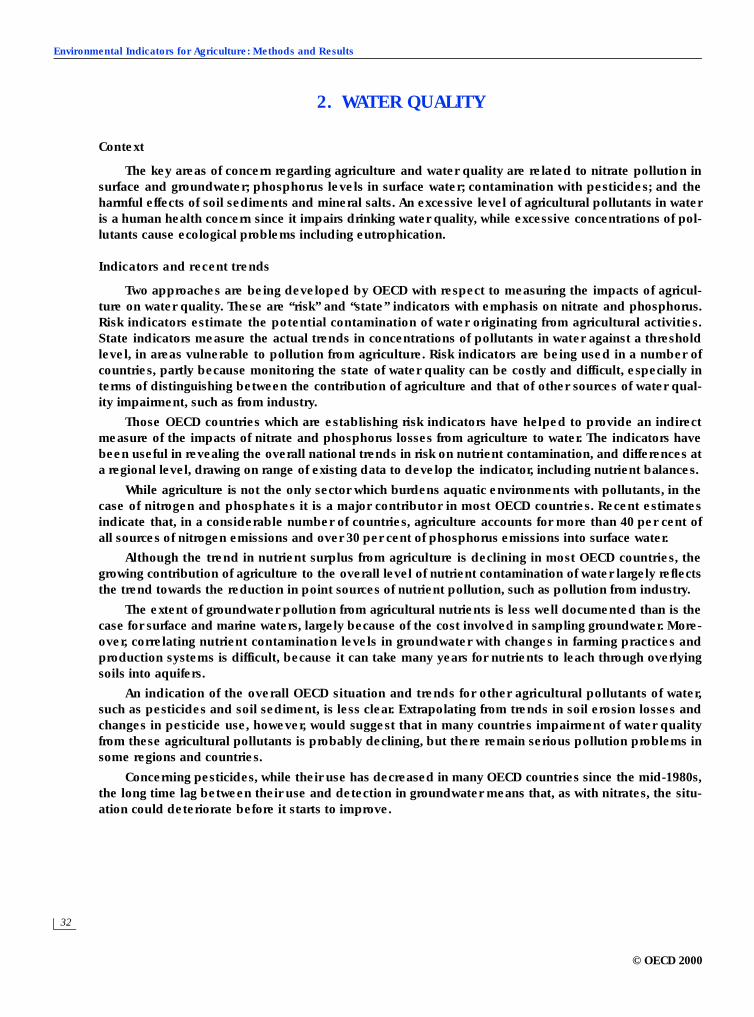
Environmental Indicators for Agriculture: Methods and Results
32
0020001t1.fm Page 32 Thursday, November 16, 2000 8:58 AM
2. WATER QUALITY
Context
The key areas of concern regarding agriculture and water quality are related to nitrate pollution insurface and groundwater; phosphorus levels in surface water; contamination with pesticides; and theharmful effects of soil sediments and mineral salts. An excessive level of agricultural pollutants in wateris a human health concern since it impairs drinking water quality, while excessive concentrations of pol-lutants cause ecological problems including eutrophication.
Indicators and recent trends
Two approaches are being developed by OECD with respect to measuring the impacts of agricul-ture on water quality. These are “risk” and “state” indicators with emphasis on nitrate and phosphorus.Risk indicators estimate the potential contamination of water originating from agricultural activities.State indicators measure the actual trends in concentrations of pollutants in water against a thresholdlevel, in areas vulnerable to pollution from agriculture. Risk indicators are being used in a number ofcountries, partly because monitoring the state of water quality can be costly and difficult, especially interms of distinguishing between the contribution of agriculture and that of other sources of water qual-ity impairment, such as from industry.
Those OECD countries which are establishing risk indicators have helped to provide an indirectmeasure of the impacts of nitrate and phosphorus losses from agriculture to water. The indicators havebeen useful in revealing the overall national trends in risk on nutrient contamination, and differences ata regional level, drawing on range of existing data to develop the indicator, including nutrient balances.
While agriculture is not the only sector which burdens aquatic environments with pollutants, in thecase of nitrogen and phosphates it is a major contributor in most OECD countries. Recent estimatesindicate that, in a considerable number of countries, agriculture accounts for more than 40 per cent ofall sources of nitrogen emissions and over 30 per cent of phosphorus emissions into surface water.
Although the trend in nutrient surplus from agriculture is declining in most OECD countries, thegrowing contribution of agriculture to the overall level of nutrient contamination of water largely reflectsthe trend towards the reduction in point sources of nutrient pollution, such as pollution from industry.
The extent of groundwater pollution from agricultural nutrients is less well documented than is thecase for surface and marine waters, largely because of the cost involved in sampling groundwater. More-over, correlating nutrient contamination levels in groundwater with changes in farming practices andproduction systems is difficult, because it can take many years for nutrients to leach through overlyingsoils into aquifers.
An indication of the overall OECD situation and trends for other agricultural pollutants of water,such as pesticides and soil sediment, is less clear. Extrapolating from trends in soil erosion losses andchanges in pesticide use, however, would suggest that in many countries impairment of water qualityfrom these agricultural pollutants is probably declining, but there remain serious pollution problems insome regions and countries.
Concerning pesticides, while their use has decreased in many OECD countries since the mid-1980s,the long time lag between their use and detection in groundwater means that, as with nitrates, the situ-ation could deteriorate before it starts to improve.
© OECD 2000
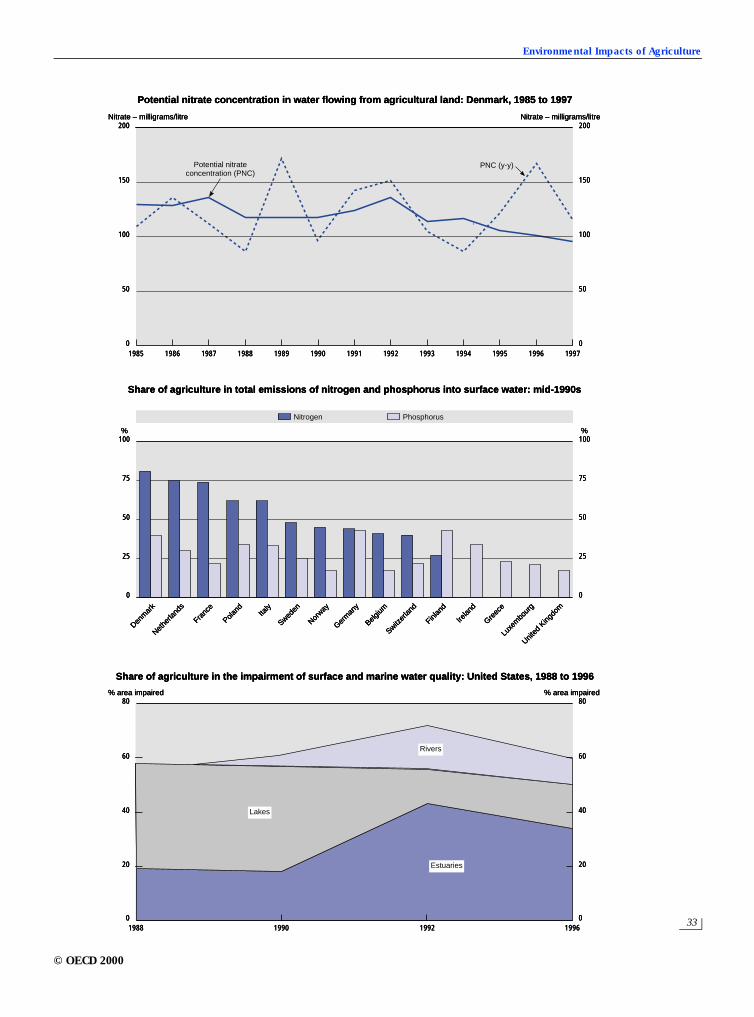
Environmental Impacts of Agriculture
33
0020001t1.fm Page 33 Thursday, November 16, 2000 8:58 AM
1985 1986 1987 1988 1989 1990 1991 1992 1993 1994 1995 1996 1997
200
150
100
50
0
200
150
100
50
0
% %100
75
50
25
0
100
75
50
25
0
80
1988 1990 1992 1996
60
40
20
0
80
60
40
20
0
Potential nitrate concentration in water flowing from agricultural land: Denmark, 1985 to 1997
PNC (y-y)
Nitrate – milligrams/litre Nitrate – milligrams/litre
Potential nitrateconcentration (PNC)
Share of agriculture in total emissions of nitrogen and phosphorus into surface water: mid-1990s
Nitrogen Phosphorus
Greec
e
Poland
Irelan
d
Finlan
d
Denm
ark
Nethe
rland
sIta
ly
Franc
e
Norway
Sweden
United
King
dom
Belgium
Switzer
land
Germ
any
Luxe
mbo
urg
Share of agriculture in the impairment of surface and marine water quality: United States, 1988 to 1996
% area impaired
Rivers
Lakes
Estuaries
% area impaired
© OECD 2000
Environmental Indicators for Agriculture: Methods and Results
34
0020001t1.fm Page 34 Thursday, November 16, 2000 8:58 AM
3. LAND CONSERVATION
Context
The availability of land and water resources is basic to all agricultural activity. Agriculture is oftenthe major user of both of these resources, which can affect the flow of surface water and the loss of soilsediment from agricultural land. Appropriate land use, combined with environmentally sound soil andwater management practices can help to reduce the peak flow of surface water and loss of soilsediment.
Damage caused by off-farm sediment flows is important in many OECD countries, but especially inregions where there are alternate periods of drought, which limits soil vegetation cover, followed byheavy rainfall. For countries with steep and rapid rivers and experiencing heavy rainfall, a high priorityis placed on flood and landslide prevention, the consequences of which can be costly to the economy.
Indicators and recent trends
An important consideration for policy makers is to take into account the risks that are increased ormitigated by certain land use and management practices in agriculture. The measurement of such risks,can contribute to better decision-making to promote or moderate changes in land use, and appropriatemanagement practices. Two indicators are being developed by OECD to address land conservationissues, first, the water retaining capacity of agriculture, and second, the off-farm soil sediment flow fromagriculture.
The water retaining capacity indicator measures the quantity of water that can be retained in the shortterm in agricultural soil, as well as on agricultural land, and by agricultural irrigation or drainage facili-ties. This indicator shows how much water a given area of land can hold taking into account differencesin land use, soil types, management practices and other relevant factors. A decrease in water retainingcapacity implies a greater potential risk of flooding.
The indicator of the water retaining capacity of agricultural land mainly reflects differences in landuse, which vary in their capacity to retain water. There is at present a lack of information on soil typesand management practices, which would help to improve the sensitivity of the indicator. On the basis ofthis more limited appraisal of agricultural water retaining capacity, however, most OECD countries haveexperienced a decrease, and only a few an increase, in water retaining capacity over the last decade.
The off-farm sediment flow indicator measures the quantity of soil erosion sediments delivered to off-farm areas as a result of agricultural soil erosion. The focus of this indicator is on the mitigation of soilerosion through land use and management practices, rather than just the measurement of soil erosionitself. It is not possible to show the trend of this indicator across OECD countries as the approach needsto be harmonised and data deficiencies overcome.
Some estimates, however, of the annual monetary cost of the damage to rivers, lakes and reservoirsincurred through soil sediment removal off-farm and damage to the recreational, transport and environ-mental functions associated with many water courses, suggest these costs are high. Evidence fromrelated indicators on soil management and soil erosion would suggest that the rate of soil sedimentflows from agricultural land to off-farm areas, especially water courses, might be decreasing for somecountries.
© OECD 2000
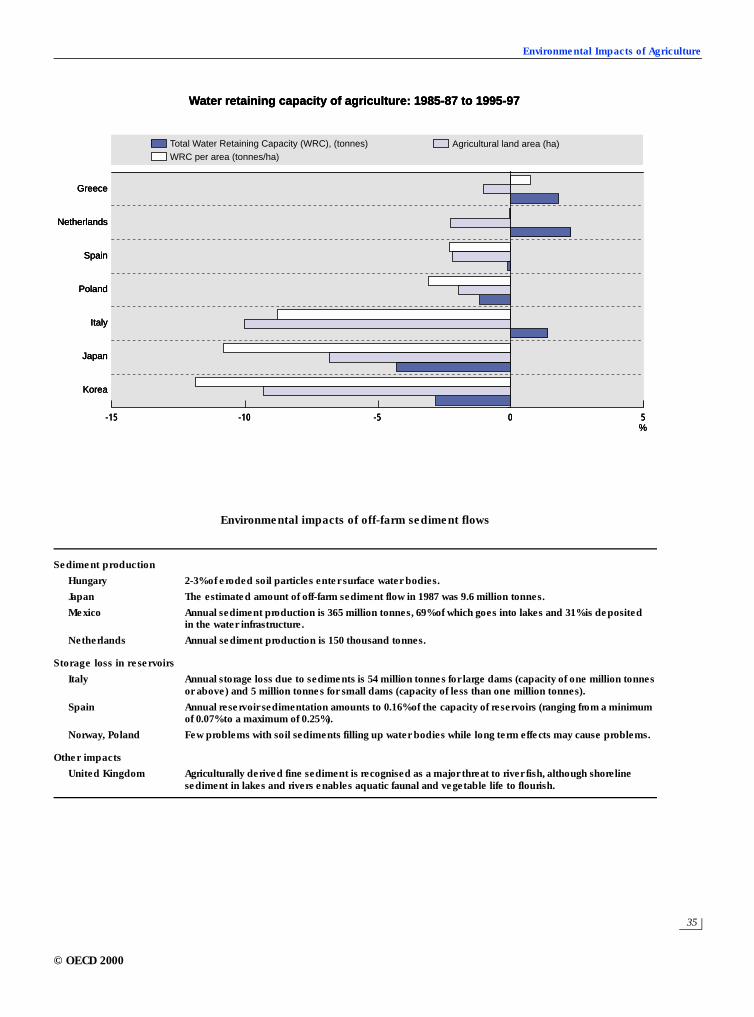
Environmental Impacts of Agriculture
35
0020001t1.fm Page 35 Thursday, November 16, 2000 8:58 AM
-15 -10 -5 0 5%
Water retaining capacity of agriculture: 1985-87 to 1995-97
Total Water Retaining Capacity (WRC), (tonnes) Agricultural land area (ha)WRC per area (tonnes/ha)
Greece
Netherlands
Spain
Poland
Italy
Japan
Korea
-15 -10 -5 0 5%
Water retaining capacity of agriculture: 1985-87 to 1995-97
Total Water Retaining Capacity (WRC), (tonnes) Agricultural land area (ha)WRC per area (tonnes/ha)
Greece
Netherlands
Spain
Poland
Italy
Japan
Korea
-15 -10 -5 0 5%
Water retaining capacity of agriculture: 1985-87 to 1995-97
Total Water Retaining Capacity (WRC), (tonnes) Agricultural land area (ha)WRC per area (tonnes/ha)
Greece
Netherlands
Spain
Poland
Italy
Japan
Korea
Environmental impacts of off-farm sediment flows
Sediment production
Hungary 2-3% of eroded soil particles enter surface water bodies.
Japan The estimated amount of off-farm sediment flow in 1987 was 9.6 million tonnes.
Mexico Annual sediment production is 365 million tonnes, 69% of which goes into lakes and 31% is deposited in the water infrastructure.
Netherlands Annual sediment production is 150 thousand tonnes.
Storage loss in reservoirs
Italy Annual storage loss due to sediments is 54 million tonnes for large dams (capacity of one million tonnes or above) and 5 million tonnes for small dams (capacity of less than one million tonnes).
Spain Annual reservoir sedimentation amounts to 0.16% of the capacity of reservoirs (ranging from a minimum of 0.07% to a maximum of 0.25%).
Norway, Poland Few problems with soil sediments filling up water bodies while long term effects may cause problems.
Other impacts
United Kingdom Agriculturally derived fine sediment is recognised as a major threat to river fish, although shoreline sediment in lakes and rivers enables aquatic faunal and vegetable life to flourish.
© OECD 2000
Environmental Indicators for Agriculture: Methods and Results
36
0020001t1.fm Page 36 Thursday, November 16, 2000 8:58 AM
4. GREENHOUSE GASES
Context
It is now widely believed that the increased atmospheric concentration of greenhouse gases(GHGs) is contributing to the process of climate change and global warming. Most OECD countries,under the 1994 United Nations Framework Convention on Climate Change, committed themselves tostabilise emissions of GHGs at 1990 levels by 2000, and further agreed to implement the 1997 KyotoProtocol, which specified the levels of emissions for the target period 2008 to 2012.
It is not only the contribution of agriculture in the climate change process, but also the impact ofclimate change on agriculture that is of concern to farmers and policy makers. Monitoring the role ofagriculture as a source and sink for GHGs is of importance to policy makers, in view of the need forcountries to assess domestic strategies, and to meet international obligations to reduce GHG emis-sions. Data on the specific contribution of agriculture as both a source and sink of GHG in relation to cli-mate change, relative to other sectors in the economy, can help to develop appropriate policies.
Indicators and recent trends
The greenhouse gas indicator measures the gross agricultural emissions of three gases: carbondioxide (CO2), methane (CH4) and nitrous oxide (N2O), expressed in CO2 equivalents. The share of agri-culture in OECD total national gross GHG emissions in CO2 equivalents is below 10 per cent, althoughfor methane and nitrous oxide agriculture contributes a major share in the emission of these gases,about 40 and 60 per cent, respectively. For a few OECD countries the contribution to national total GHGemissions is above 20 per cent, which is largely a reflection of the greater importance of the agriculturalsector in the economies of these countries.
Livestock farming and the use of inorganic fertilisers are key sources of methane and nitrous oxidegases. The trend in agricultural emissions of GHGs has declined since the early 1990s for most OECDcountries. This is mainly explained by a reduction in cattle numbers and the use of fertilisers. For a fewcountries GHG emissions have been rising, because of an overall expansion in crop and livestock pro-duction.
The work to date on agricultural GHG indicators focuses on emissions, because as yet there are nosystematic estimates of agriculture’s role as a sink for GHGs across OECD countries. Agriculture’s capac-ity as a GHG sink is enhanced by improvements in management practices, such as tillage practices,crop cover and residue management.
The development of a comprehensive net GHG balance indicator would address both GHG emis-sions and removals. A number of OECD countries have begun to measure soil carbon fluxes and agricul-ture’s capacity to act as a GHG sink. Research in Canada, for example, shows that net CO2 emissions fromagricultural soils in Canada have been considerably reduced by converting from conventional tillage tono-till systems, increasing cover cropping and improving crop residue management practices.
A study in France calculated net CO2 emissions from changes in agricultural land use. Overall theFrench research showed emissions exceeded removals, with an increase in CO2 by converting grasslandto other uses and clearing forests, while agricultural land left uncultivated acted as a CO2 sink.
© OECD 2000
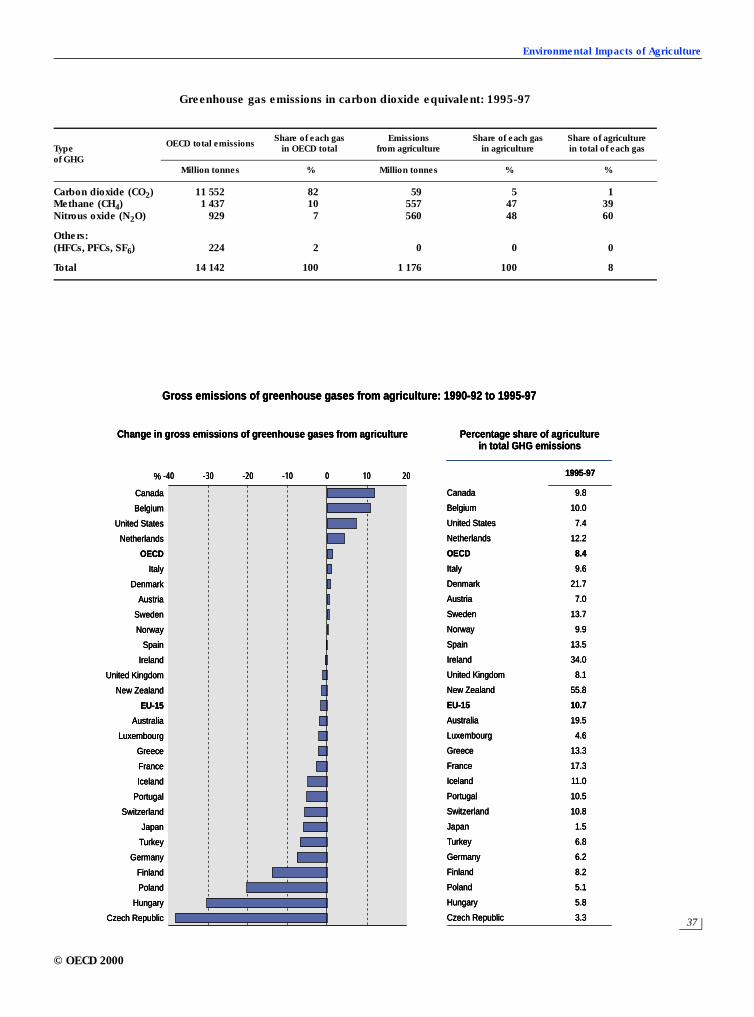
Environmental Impacts of Agriculture
37
0020001t1.fm Page 37 Thursday, November 16, 2000 8:58 AM
Greenhouse gas emissions in carbon dioxide equivalent: 1995-97
Type of GHG
OECD total emissionsShare of each gas
in OECD totalEmissions
from agricultureShare of each gas
in agricultureShare of agriculture in total of each gas
Million tonnes % Million tonnes % %
Carbon dioxide (CO2) 11 552 82 59 5 1Methane (CH4) 1 437 10 557 47 39Nitrous oxide (N2O) 929 7 560 48 60
Others:(HFCs, PFCs, SF6) 224 2 0 0 0
Total 14 142 100 1 176 100 8
-40 -30 -20 -10 0 10 20 1995-97%
Gross emissions of greenhouse gases from agriculture: 1990-92 to 1995-97
Canada 9.8
Belgium 10.0
United States 7.4
Netherlands 12.2
OECD 8.4
Italy 9.6
Denmark 21.7
Austria 7.0
Sweden 13.7
Norway 9.9
Spain 13.5
Ireland 34.0
United Kingdom 8.1
New Zealand 55.8
EU-15 10.7
Australia 19.5
Luxembourg 4.6
Greece 13.3
France 17.3
Iceland 11.0
Portugal 10.5
Switzerland 10.8
Japan 1.5
Turkey 6.8
Germany 6.2
Finland 8.2
Poland 5.1
Hungary 5.8
Czech Republic 3.3
Percentage share of agriculturein total GHG emissions
Change in gross emissions of greenhouse gases from agriculture
Canada
Belgium
United States
Netherlands
OECD
Italy
Denmark
Austria
Sweden
Norway
Spain
Ireland
United Kingdom
New Zealand
EU-15
Australia
Luxembourg
Greece
France
Iceland
Portugal
Switzerland
Japan
Turkey
Germany
Finland
Poland
Hungary
Czech Republic
© OECD 2000
Environmental Indicators for Agriculture: Methods and Results
38
0020001t1.fm Page 38 Thursday, November 16, 2000 8:58 AM
5. BIODIVERSITY
Context
Agriculture as the human activity occupying the largest share of the total land area for nearly allOECD countries, plays a key role with regard to biodiversity which is highly dependent on land use. Theexpansion of farm production and intensification of input use are considered a major cause of the lossof biodiversity, while at the same time certain agro-ecosystems can serve to maintain biodiversity.Farming is also dependent on many biological services, such as the provision of genes to developimproved crop varieties and livestock breeds, crop pollination, and soil fertility provided by micro-organisms. In some cases non-native species cause damage to crops from alien pests and competitionfor livestock forage.
The main focus of policy actions in the area of biodiversity has been to protect and conserveendangered species and habitats, but some countries have also begun to develop more holisticnational biodiversity strategy plans. These plans usually incorporate the agricultural sector in biodiver-sity conservation. At the international level a range of agreements are also important in the context ofagriculture and biodiversity, most notably, the International Convention on Biological Diversity.
Indicators and recent trends
A number of biodiversity indicators are being established by OECD within the general frameworkof genetic, species and ecosystem diversity (the latter is covered under Wildlife Habitat indicators).The indicators provide a coherent, but initial, picture of biodiversity in relation to agriculture.
Concerning genetic diversity, three indicators cover the diversity of crop varieties and livestockbreeds used by agriculture. Overall these indicators reveal that diversity has increased for many OECDcountries since the mid-1980s, in terms of the share of varieties/breeds in total crop production/live-stock numbers. This suggests agriculture has improved its resilience to environmental changes throughdiversifying the number of varieties/breeds used in production.
A fourth genetic diversity indicator provides information on the extent of genetic erosion and lossof agricultural plants and livestock. While information on genetic erosion or loss is incomplete, evi-dence for a limited number of countries suggests significant losses and/or the endangerment of loss ofgenetic resources in agriculture over recent decades. The collections in genebanks, however, in generalcontinue to grow, both public and private collections.
Indicators for species diversity cover trends in population distributions and numbers of: i) wildlife spe-cies dependent on or affected by agriculture, and ii) non-native species threatening agricultural produc-tion and agro-ecosystems.
While information on the impact of agriculture on wild species is limited for many OECD countries, itappears agricultural land provides an important habitat area for the wildlife that remains following theconversion to agricultural land use, but especially birds, vascular plants and some invertebrates, suchas butterflies. Also, the population trends of wildlife species using agricultural land as habitat indicatein most cases a reduction over the past decade. This represents the continuation of a longer-term trend,although the decline has slowed or even reversed over recent years in some countries. Even so consid-erable numbers of wildlife species using agricultural land as habitat are under threat of being lost.
For non-native species, there is no systematic time series available across OECD countries, althoughtheir harmful effects on agricultural production and agro-ecosystems are reported for many countries.There has been a long history of non-native species introductions across countries, with the extent ofeconomic losses to farming and damage to native biodiversity from their introduction varying widely.
© OECD 2000
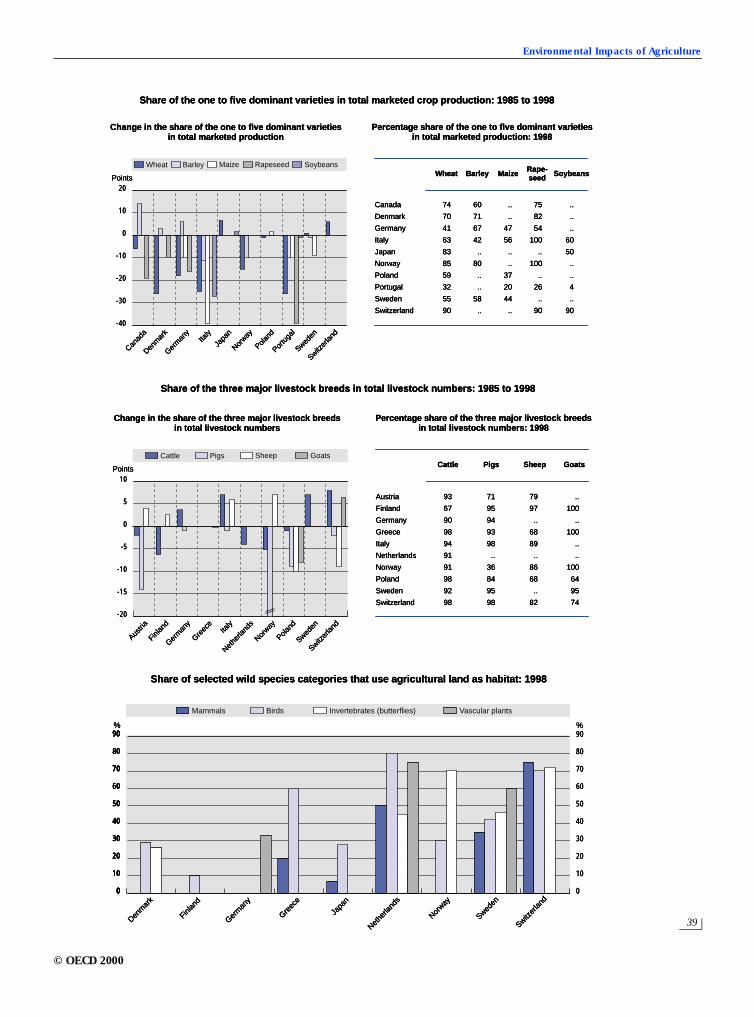
Environmental Impacts of Agriculture
39
0020001t1.fm Page 39 Thursday, November 16, 2000 8:58 AM
20
10
0
-10
-20
-30
-40
10
5
0
-5
-10
-15
-20
%90
80
70
60
50
40
30
20
10
0
%90
80
70
60
50
40
30
20
10
0
90
80
70
60
50
40
30
20
10
0
Wheat
Canada 74 60 .. 75 ..
Denmark 70 71 .. 82 ..
Germany 41 67 47 54 ..
Italy 63 42 56 100 60
Japan 83 .. .. .. 50
Norway 85 80 .. 100 ..
Poland 59 .. 37 .. ..
Portugal 32 .. 20 26 4
Sweden 55 58 44 .. ..
Switzerland 90 .. .. 90 90
Percentage share of the one to five dominant varietiesin total marketed production: 1998
Barley Maize Rape-seed Soybeans
Wheat Barley Maize Rapeseed Soybeans
Change in the share of the one to five dominant varietiesin total marketed production
Points
Canad
a
Denm
ark
Germ
any
Italy
Japa
n
Norway
Poland
Portu
gal
Sweden
Switzer
land
Share of the one to five dominant varieties in total marketed crop production: 1985 to 1998
Percentage share of the three major livestock breedsin total livestock numbers: 1998
Cattle Pigs Sheep Goats
Change in the share of the three major livestock breedsin total livestock numbers
Points
Austri
a
Finlan
d
Germ
any
Greec
eIta
ly
Nethe
rland
s
Norway
Poland
Sweden
Switzer
land
Share of the three major livestock breeds in total livestock numbers: 1985 to 1998
Austria 93 71 79 ..
Finland 67 95 97 100
Germany 90 94 .. ..
Greece 98 93 68 100
Italy 94 98 89 ..
Netherlands 91 .. .. ..
Norway 91 36 86 100
Poland 98 84 68 64
Sweden 92 95 .. 95
Switzerland 98 98 82 74
Cattle Pigs Sheep Goats
Switzer
land
Sweden
Norway
Nethe
rland
s
Japa
n
Greec
e
Germ
any
Denm
ark
Finlan
d
Share of selected wild species categories that use agricultural land as habitat: 1998
Mammals Birds Invertebrates (butterflies) Vascular plants
20
10
0
-10
-20
-30
-40
10
5
0
-5
-10
-15
-20
%90
80
70
60
50
40
30
20
10
0
%90
80
70
60
50
40
30
20
10
0
90
80
70
60
50
40
30
20
10
0
Wheat
Canada 74 60 .. 75 ..
Denmark 70 71 .. 82 ..
Germany 41 67 47 54 ..
Italy 63 42 56 100 60
Japan 83 .. .. .. 50
Norway 85 80 .. 100 ..
Poland 59 .. 37 .. ..
Portugal 32 .. 20 26 4
Sweden 55 58 44 .. ..
Switzerland 90 .. .. 90 90
Percentage share of the one to five dominant varietiesin total marketed production: 1998
Barley Maize Rape-seed Soybeans
Wheat Barley Maize Rapeseed Soybeans
Change in the share of the one to five dominant varietiesin total marketed production
Points
Canad
a
Denm
ark
Germ
any
Italy
Japa
n
Norway
Poland
Portu
gal
Sweden
Switzer
land
Share of the one to five dominant varieties in total marketed crop production: 1985 to 1998
Percentage share of the three major livestock breedsin total livestock numbers: 1998
Cattle Pigs Sheep Goats
Change in the share of the three major livestock breedsin total livestock numbers
Points
Austri
a
Finlan
d
Germ
any
Greec
eIta
ly
Nethe
rland
s
Norway
Poland
Sweden
Switzer
land
Share of the three major livestock breeds in total livestock numbers: 1985 to 1998
Austria 93 71 79 ..
Finland 67 95 97 100
Germany 90 94 .. ..
Greece 98 93 68 100
Italy 94 98 89 ..
Netherlands 91 .. .. ..
Norway 91 36 86 100
Poland 98 84 68 64
Sweden 92 95 .. 95
Switzerland 98 98 82 74
Cattle Pigs Sheep Goats
Switzer
land
Sweden
Norway
Nethe
rland
s
Japa
n
Greec
e
Germ
any
Denm
ark
Finlan
d
Share of selected wild species categories that use agricultural land as habitat: 1998
Mammals Birds Invertebrates (butterflies) Vascular plants
© OECD 2000
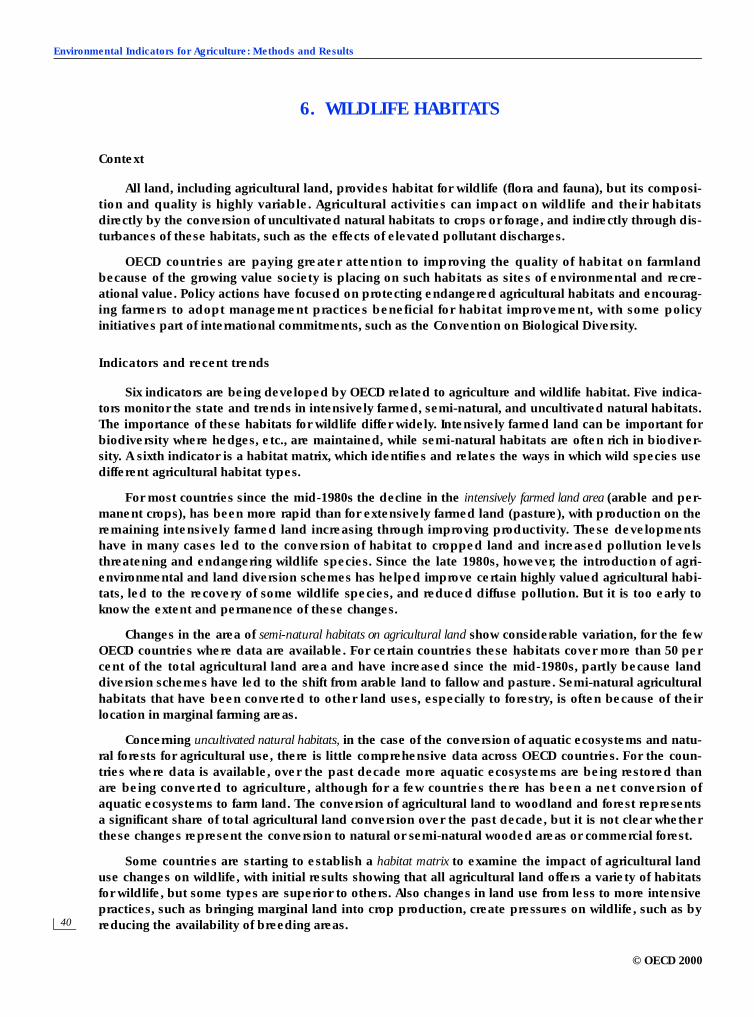
Environmental Indicators for Agriculture: Methods and Results
40
0020001t1.fm Page 40 Thursday, November 16, 2000 8:58 AM
6. WILDLIFE HABITATS
Context
All land, including agricultural land, provides habitat for wildlife (flora and fauna), but its composi-tion and quality is highly variable. Agricultural activities can impact on wildlife and their habitatsdirectly by the conversion of uncultivated natural habitats to crops or forage, and indirectly through dis-turbances of these habitats, such as the effects of elevated pollutant discharges.
OECD countries are paying greater attention to improving the quality of habitat on farmlandbecause of the growing value society is placing on such habitats as sites of environmental and recre-ational value. Policy actions have focused on protecting endangered agricultural habitats and encourag-ing farmers to adopt management practices beneficial for habitat improvement, with some policyinitiatives part of international commitments, such as the Convention on Biological Diversity.
Indicators and recent trends
Six indicators are being developed by OECD related to agriculture and wildlife habitat. Five indica-tors monitor the state and trends in intensively farmed, semi-natural, and uncultivated natural habitats.The importance of these habitats for wildlife differ widely. Intensively farmed land can be important forbiodiversity where hedges, etc., are maintained, while semi-natural habitats are often rich in biodiver-sity. A sixth indicator is a habitat matrix, which identifies and relates the ways in which wild species usedifferent agricultural habitat types.
For most countries since the mid-1980s the decline in the intensively farmed land area (arable and per-manent crops), has been more rapid than for extensively farmed land (pasture), with production on theremaining intensively farmed land increasing through improving productivity. These developmentshave in many cases led to the conversion of habitat to cropped land and increased pollution levelsthreatening and endangering wildlife species. Since the late 1980s, however, the introduction of agri-environmental and land diversion schemes has helped improve certain highly valued agricultural habi-tats, led to the recovery of some wildlife species, and reduced diffuse pollution. But it is too early toknow the extent and permanence of these changes.
Changes in the area of semi-natural habitats on agricultural land show considerable variation, for the fewOECD countries where data are available. For certain countries these habitats cover more than 50 percent of the total agricultural land area and have increased since the mid-1980s, partly because landdiversion schemes have led to the shift from arable land to fallow and pasture. Semi-natural agriculturalhabitats that have been converted to other land uses, especially to forestry, is often because of theirlocation in marginal farming areas.
Concerning uncultivated natural habitats, in the case of the conversion of aquatic ecosystems and natu-ral forests for agricultural use, there is little comprehensive data across OECD countries. For the coun-tries where data is available, over the past decade more aquatic ecosystems are being restored thanare being converted to agriculture, although for a few countries there has been a net conversion ofaquatic ecosystems to farm land. The conversion of agricultural land to woodland and forest representsa significant share of total agricultural land conversion over the past decade, but it is not clear whetherthese changes represent the conversion to natural or semi-natural wooded areas or commercial forest.
Some countries are starting to establish a habitat matrix to examine the impact of agricultural landuse changes on wildlife, with initial results showing that all agricultural land offers a variety of habitatsfor wildlife, but some types are superior to others. Also changes in land use from less to more intensivepractices, such as bringing marginal land into crop production, create pressures on wildlife, such as byreducing the availability of breeding areas.
© OECD 2000
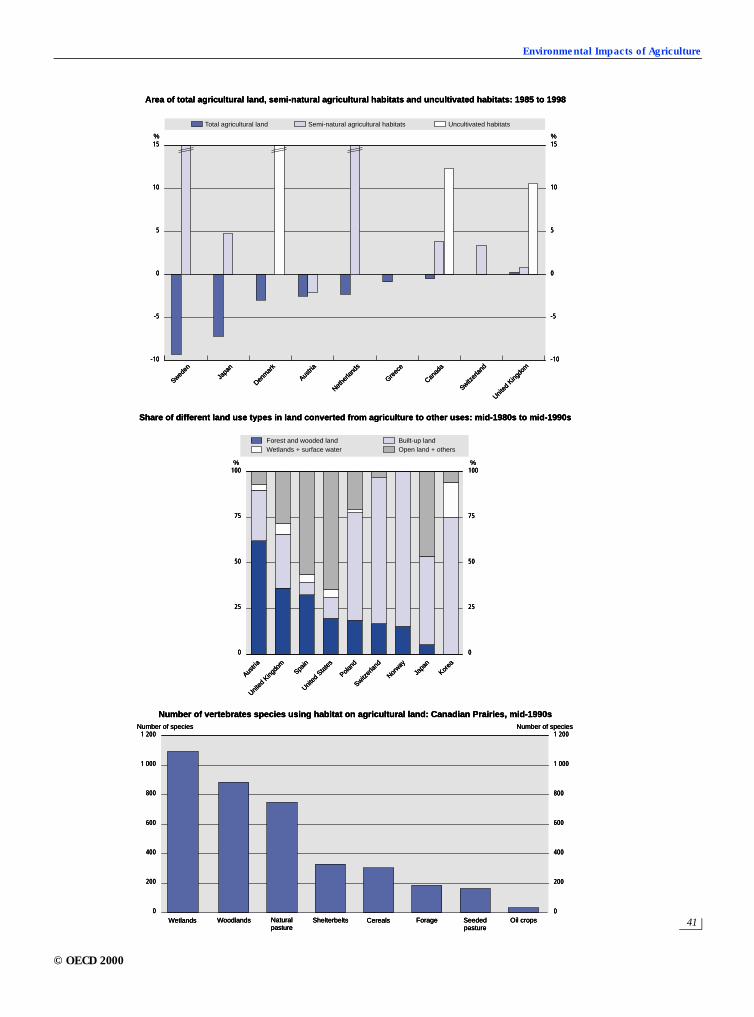
Environmental Impacts of Agriculture
41
0020001t1.fm Page 41 Thursday, November 16, 2000 8:58 AM
15%
10
5
0
-5
-10
15
10
5
0
-5
-10
%
1 200
1 000
800
600
400
200
0
1 200
1 000
800
600
400
200
0
75
50
25
75
50
25
%100 100
%
0 0
Area of total agricultural land, semi-natural agricultural habitats and uncultivated habitats: 1985 to 1998
Total agricultural land Semi-natural agricultural habitats Uncultivated habitats
Sweden
Japa
n
Denm
ark
Austri
a
Nethe
rland
s
Greec
e
Canad
a
Switzer
land
United
King
dom
Share of different land use types in land converted from agriculture to other uses: mid-1980s to mid-1990s
Austri
a
United
King
dom
Spain
United
Sta
tes
Poland
Switzer
land
Norway
Japa
n
Korea
Forest and wooded land Built-up landWetlands + surface water Open land + others
Number of vertebrates species using habitat on agricultural land: Canadian Prairies, mid-1990s
Wetlands
Number of species Number of species
Woodlands Naturalpasture
Shelterbelts Cereals Forage Seededpasture
Oil crops
© OECD 2000
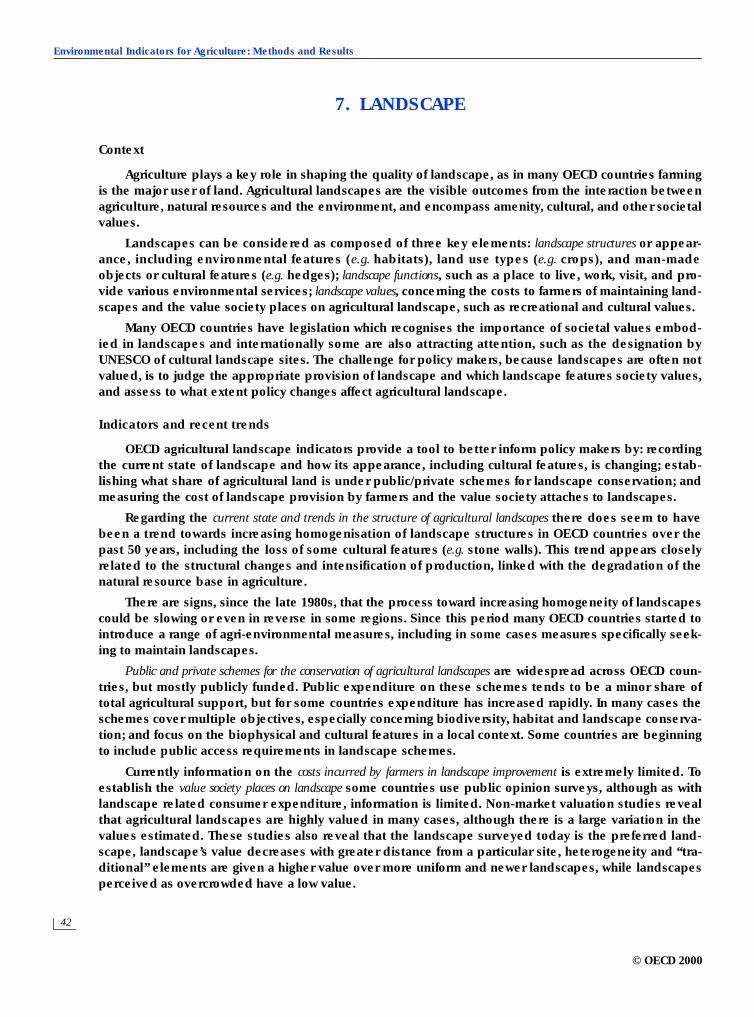
Environmental Indicators for Agriculture: Methods and Results
42
0020001t1.fm Page 42 Thursday, November 16, 2000 8:58 AM
7. LANDSCAPE
Context
Agriculture plays a key role in shaping the quality of landscape, as in many OECD countries farmingis the major user of land. Agricultural landscapes are the visible outcomes from the interaction betweenagriculture, natural resources and the environment, and encompass amenity, cultural, and other societalvalues.
Landscapes can be considered as composed of three key elements: landscape structures or appear-ance, including environmental features (e.g. habitats), land use types (e.g. crops), and man-madeobjects or cultural features (e.g. hedges); landscape functions, such as a place to live, work, visit, and pro-vide various environmental services; landscape values, concerning the costs to farmers of maintaining land-scapes and the value society places on agricultural landscape, such as recreational and cultural values.
Many OECD countries have legislation which recognises the importance of societal values embod-ied in landscapes and internationally some are also attracting attention, such as the designation byUNESCO of cultural landscape sites. The challenge for policy makers, because landscapes are often notvalued, is to judge the appropriate provision of landscape and which landscape features society values,and assess to what extent policy changes affect agricultural landscape.
Indicators and recent trends
OECD agricultural landscape indicators provide a tool to better inform policy makers by: recordingthe current state of landscape and how its appearance, including cultural features, is changing; estab-lishing what share of agricultural land is under public/private schemes for landscape conservation; andmeasuring the cost of landscape provision by farmers and the value society attaches to landscapes.
Regarding the current state and trends in the structure of agricultural landscapes there does seem to havebeen a trend towards increasing homogenisation of landscape structures in OECD countries over thepast 50 years, including the loss of some cultural features (e.g. stone walls). This trend appears closelyrelated to the structural changes and intensification of production, linked with the degradation of thenatural resource base in agriculture.
There are signs, since the late 1980s, that the process toward increasing homogeneity of landscapescould be slowing or even in reverse in some regions. Since this period many OECD countries started tointroduce a range of agri-environmental measures, including in some cases measures specifically seek-ing to maintain landscapes.
Public and private schemes for the conservation of agricultural landscapes are widespread across OECD coun-tries, but mostly publicly funded. Public expenditure on these schemes tends to be a minor share oftotal agricultural support, but for some countries expenditure has increased rapidly. In many cases theschemes cover multiple objectives, especially concerning biodiversity, habitat and landscape conserva-tion; and focus on the biophysical and cultural features in a local context. Some countries are beginningto include public access requirements in landscape schemes.
Currently information on the costs incurred by farmers in landscape improvement is extremely limited. Toestablish the value society places on landscape some countries use public opinion surveys, although as withlandscape related consumer expenditure, information is limited. Non-market valuation studies revealthat agricultural landscapes are highly valued in many cases, although there is a large variation in thevalues estimated. These studies also reveal that the landscape surveyed today is the preferred land-scape, landscape’s value decreases with greater distance from a particular site, heterogeneity and “tra-ditional” elements are given a higher value over more uniform and newer landscapes, while landscapesperceived as overcrowded have a low value.
© OECD 2000
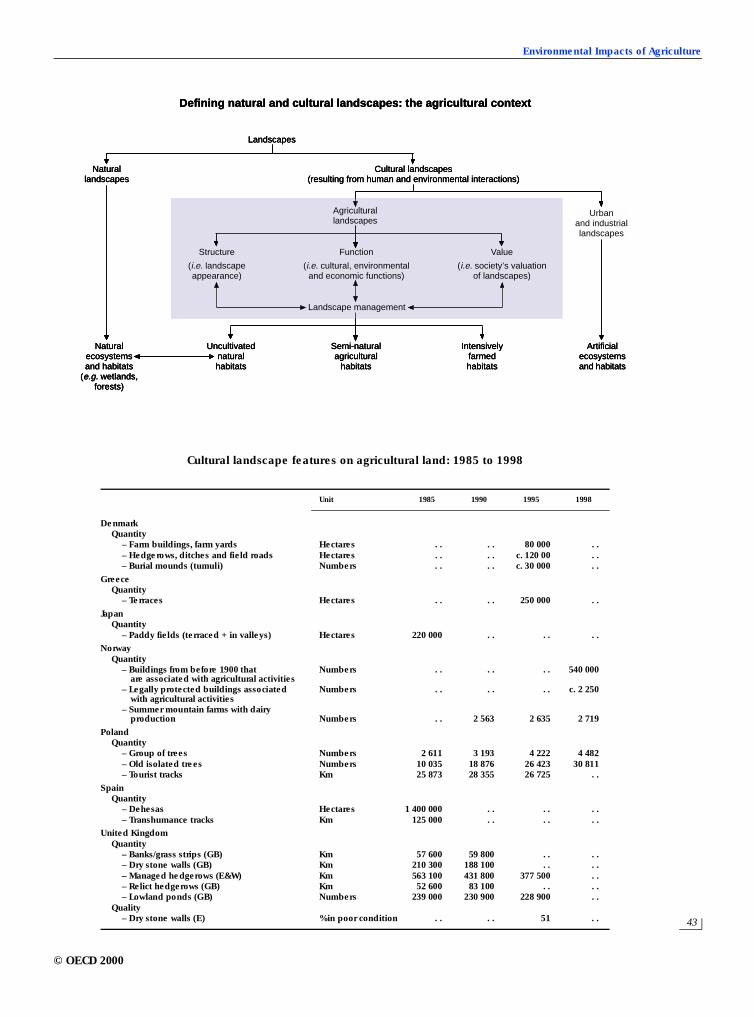
Environmental Impacts of Agriculture
43
0020001t1.fm Page 43 Thursday, November 16, 2000 8:58 AM
Defining natural and cultural landscapes: the agricultural context
Landscapes
Naturallandscapes
Naturalecosystemsand habitats
(e.g. wetlands,forests)
Cultural landscapes(resulting from human and environmental interactions)
Agriculturallandscapes
Urbanand industriallandscapes
Structure
(i.e. landscapeappearance)
Function
(i.e. cultural, environmentaland economic functions)
Value
(i.e. society’s valuationof landscapes)
Landscape management
Uncultivatednaturalhabitats
Semi-naturalagricultural
habitats
Intensivelyfarmedhabitats
Artificialecosystemsand habitats
Cultural landscape features on agricultural land: 1985 to 1998
Unit 1985 1990 1995 1998
DenmarkQuantity
– Farm buildings, farm yards Hectares . . . . 80 000 . .– Hedgerows, ditches and field roads Hectares . . . . c. 120 00 . .– Burial mounds (tumuli) Numbers . . . . c. 30 000 . .
GreeceQuantity
– Terraces Hectares . . . . 250 000 . .
JapanQuantity
– Paddy fields (terraced + in valleys) Hectares 220 000 . . . . . .
NorwayQuantity
– Buildings from before 1900 that are associated with agricultural activities
Numbers . . . . . . 540 000
– Legally protected buildings associated with agricultural activities
Numbers . . . . . . c. 2 250
– Summer mountain farms with dairy production Numbers . . 2 563 2 635 2 719
PolandQuantity
– Group of trees Numbers 2 611 3 193 4 222 4 482– Old isolated trees Numbers 10 035 18 876 26 423 30 811– Tourist tracks Km 25 873 28 355 26 725 . .
SpainQuantity
– Dehesas Hectares 1 400 000 . . . . . .– Transhumance tracks Km 125 000 . . . . . .
United KingdomQuantity
– Banks/grass strips (GB) Km 57 600 59 800 . . . .– Dry stone walls (GB) Km 210 300 188 100 . . . .– Managed hedgerows (E&W) Km 563 100 431 800 377 500 . .– Relict hedgerows (GB) Km 52 600 83 100 . . . .– Lowland ponds (GB) Numbers 239 000 230 900 228 900 . .
Quality– Dry stone walls (E) % in poor condition . . . . 51 . .
© OECD 2000
45
0020001t1.fm Page 45 Thursday, November 16, 2000 8:58 AM
EXPLANATORY NOTES TO FIGURES
General notes
Readers requiring more detailed background data and information to the figures shown in thisExecutive Summary should consult the accompanying main report published by OECD (2001) under thetitle: Environmental Indicators for Agriculture Volume 3: Methods and Results,Publications Service, Paris,France, or visit the OECD web site at www.oecd.org/agr/env/indicators.htm.
The 30 OECD Member countries include: Australia, Austria, Belgium, Canada, Czech Republic, Den-mark, Finland, France, Germany, Greece, Hungary, Iceland, Ireland, Italy, Japan, Korea, Luxembourg,Mexico, Netherlands, New Zealand, Norway, Poland, Portugal, Slovak Republic, Spain, Sweden, Switzer-land, Turkey, United Kingdom and United States. The Slovak Republic became an OECD Member coun-try in 2000, and was not included in the preparation of this Report. The Commission of the EuropeanCommunities takes part in the work of the OECD.
I.1. Contextual Information and Indicators
Share of agriculture in Gross Domestic Product: mid-1990sAgriculture as a percentage of total Gross Domestic Product (GDP), including hunting, forestry and fishing.Source: OECD Secretariat; European Commission (1999).
Share of agricultural employment in total civilian employment: late 1990sEmployment in agriculture as a percentage of total civilian employment, including hunting, forestry andfishing. For Turkey, percentage equals 42%. The values refer to 1998 data, except 1997 for Greece andPortugal, and 1995 for Luxembourg.Sources: OECD Secretariat; European Commission (1999).
Educational level of farmers: mid-/late 1990sShare of farmers by educational attainment levels. “Full training” includes any training course for at leasttwo years after school at an agricultural college, such as that completed at a university; “basic training”includes any training course completed after school at an agricultural college, such as an agriculturalapprenticeship. Data for Spain, Denmark, United Kingdom, Germany and Netherlands refer to 1990. Nodata are available for basic training in Canada. Full training and basic training are aggregated in Norway.Sources: OECD Agri-environmental Indicators Questionnaire, 1999; Commonwealth of Australia (1998).
Percentage Producer Support Estimate: 1986-88 to 1997-99The Producer Support Estimate (PSE) is an indicator of the annual monetary value of gross transfersfrom consumers and taxpayers to agricultural producers, measured at farm gate level, arising from pol-icy measures which support agriculture, regardless of their nature, objectives or impacts on farm pro-duction or income. The percentage PSE measures the share of support to producers in total gross farmreceipts. For EU and OECD, the values of the then respective member countries are presented in 1986-88 (EU:12, OECD:24) and 1997-99 (EU:15, OECD:29).Source: OECD (2000a).
© OECD 2000
Environmental Indicators for Agriculture: Methods and Results
46
0020001t1.fm Page 46 Thursday, November 16, 2000 8:58 AM
Share of agricultural land use in the total national land area: 1995-97Share of agricultural land use in total national land area. “Agricultural land” includes permanent pas-ture, arable and permanent crops but excludes forest and woodland, urban areas, infrastructure, openland, etc. The value of Belgium includes Luxembourg.Source: FAO Database, 1999.
Change in agricultural land area: 1985-87 to 1995-97Percentage change in agricultural land area, as defined above. Percentages equal –23% Ireland, –12%Italy, close to zero for Iceland, equal to zero for Switzerland, and +14% for Norway. Data cover the Czechpart of former Czechoslovakia, with 1985-87 refer to 1980-82. Value for Belgium includes Luxembourg.Data for 1985-87 cover western and eastern Germany.Source: FAO Database, 1999.
I.2. Farm Financial Resources
Nominal and real net farm income from agricultural activities: mid-1980s to mid-1990sThe annual change in real farm income defined as difference between the real value of farm income(receipts from agricultural production, rents, interest and other revenues) and the real value of farmcosts (marketing expenses, purchases of inputs, rates, taxes, interest and other charges and wages paidby the business). For France, United States, Korea and Finland, mid-1980s refer to early 1990s.Sources: EUROSTAT (1998a); OECD (1995a); OECD (1995b); OECD (1998a).
Public expenditure on agri-environmental goods, services and conservation: 1993 to 1998Public expenditure on agri-environmental goods and services, excluding research expenditure. ForSweden, programmes co-financed by EU are included from 1995 onwards. For Iceland, only includesexpenditure on soil conservation and 1995 = 100. Portugal 1994 = 100.Source: OECD Agri-environmental Indicators Questionnaire, 1999.
Share of public agri-environmental research expenditure in total agricultural research expendi-ture:1985 to mid-/late 1990sShare of public agri-environmental research expenditure in total agricultural research expenditure.Early 1990s data refer to 1991 (United Kingdom, United States and Switzerland), 1993 (Japan), 1994(Austria); and mid/late 1990s data refer to 1995 (United Kingdom), 1996 (United States), 1997 (Switzerlandand Portugal), 1998 (Austria, Iceland, Japan and Netherlands)Source: OECD Agri-environmental Indicators Questionnaire, 1999.
II. Farm Management and the Environment – Farm Management
Share of the total agricultural area under organic farming: early 1990s and mid-/late 1990sShare of agricultural area under organic farming. Early 1990s data for Hungary, Iceland, Korea and Portugalnot available. Data for the United States are taken from Welsh (1999).Sources: OECD Agri-environmental Indicators Questionnaire, 1999; EEA (1998); Welsh (1999).
Number of days in a year that agricultural soils are covered with vegetation: mid-/late 1980s andmid-/late 1990sNumber of days in a year that soil is covered with vegetation. For Austria, data refer to 1994 and 1997.For Canada, mid/late 1980s data refer to 1981. For Sweden and Netherlands, data are not available formid/late 1980s.Source: OECD Agri-environmental Indicators Questionnaire, 1999.
Share of total irrigated crop area using different irrigation systems: mid-/late 1990sShare of irrigation water applied by flooding, high-pressure rainguns, low-pressure sprinklers and drip-emitters. For United Kingdom, calculations are based on the number of holdings using irrigation anddata on drip-emitters are not available.Source: OECD Agri-environmental Indicators Questionnaire, 1999.
© OECD 2000
Explanatory Notes to Figures
47
0020001t1.fm Page 47 Thursday, November 16, 2000 8:58 AM
III.1. Nutrient Use
The main elements in the OECD soil surface nitrogen balancePrincipal nitrogen inputs and nitrogen outputs (uptake) in the soil surface nitrogen balance calculation.Livestock manure excludes nitrogen losses through volatilisation of ammonia from livestock housingand stored manure.Source: OECD Secretariat.
Soil surface nitrogen balance estimates: 1985-87 to 1995-97Nitrogen balance (surplus/deficit) per unit area. While the calculations have been derived from usingan internationally harmonised methodology, described in the previous figure, nitrogen conversioncoefficients can differ between countries, which may be due to a variety of reasons. For example, dif-fering agro-ecological conditions, varying livestock weights/yield, and differences in the methodsused to estimate these coefficients. For Czech Republic, 1985-87 data refer to the Czech part of theformer Czechoslovakia. For Germany as well as EU-15 and OECD, data include eastern and westernGermany for the whole period 1985-97. For OECD, data refer to OECD average of all Member coun-tries, excluding Luxembourg. Data refer to EU-15 average for the whole period 1985-97, excludingLuxembourg. For Iceland, 1995-97 data refer to 1995.Source: OECD (2001).
Nitrogen efficiency based on the soil surface nitrogen balance: 1995-97Nitrogen use efficiency measured as the percentage of total nitrogen uptake (output) to the total nitro-gen available (input). Hungary is not included in the figure. See also notes to previous figure.Source: OECD (2001).
III.2. Pesticide Use and Risks
Pesticide use in agriculture: 1985-87 to 1995-97Pesticide use in agriculture as percentage change in tonnes of active ingredients. Some caution isrequired in comparing trends across countries because of differences in data definitions and coverage.For Denmark, France, Greece, Netherlands, Norway, Portugal, Spain, Sweden and Switzerland, “use”data refer to “sales” data. Data for 1985-87 average refer to: 1986-87 average for Greece, Korea andSpain; 1985 for New Zealand; 1985-86 average for Austria; 1987 for Italy; 1998 for Ireland and Switzerland;and 1989 for Czech Republic. Data for 1995-97 average refer to: 1994-95 average for Hungary; 1991-93average for United States; 1994 for Canada and 1997 for New Zealand. Data for EU exclude Germany andPortugal, and for Belgium include Luxembourg. The following countries are not included in the figure:Australia (data series only exist in value terms), Germany, Iceland and Mexico (time series are not avail-able), Portugal (data are only available from 1991); and Turkey (data are not available from 1993).Sources: OECD Environmental Data Compendium, 1999; EUROSTAT (1998b); Holland and Rahman (1999).
Comparison of the environmental and health risk indicators with the quantity of pesticides sold:Sweden, 1986 to 1996Comparison of the environmental and health risk indicators with the quantity of pesticides sold inSweden. For convenience, the scale of the risk indicators has been adjusted to match the scale of pesti-cide use measured in tonnes of active ingredients.Source: Swedish National Chemical Inspectorate.
Indicators of pesticide use and human health risks: United States, 1964 to 1992A comparison of pesticide use measured in tonnes of active ingredients with the chronic and acutepotential risk indicators. Chronic risk indicator reveals the potential human health risk from a chronicexposure to pesticides, reflecting the long-term safety/toxicity of pesticides to humans. Acute risk indi-cator reveals the potential human health risk from an acute exposure to pesticides, based on ingestionof active ingredients over a short period. Estimates include maize, soybeans, wheat, cotton, sorghum,rice, groundnuts, potatoes, other vegetables, citrus and apples.Source: USDA (1997).
© OECD 2000
Environmental Indicators for Agriculture: Methods and Results
48
0020001t1.fm Page 48 Thursday, November 16, 2000 8:58 AM
III.3 Water Use
Total agricultural water use: early 1980s to mid-/late 1990sTrends in agricultural water use. “Agricultural water use” includes water abstracted from surface andgroundwater, and return flows (withdrawals) from irrigation for some countries, but excludes precipita-tion directly onto agricultural land. For UK, England and Wales only, percentage equals 124%. ForGreece, Australia, Spain, Italy and Finland, values refer to irrigation water use, as data for total agricul-tural water use are not available. EU-15 excludes Austria, Belgium, Germany, Luxembourg, Netherlands,Portugal and, in addition for OECD, Iceland, New Zealand, Norway, Portugal, Switzerland and Turkey,because relevant data are not available.Source: OECD Environmental Data Compendium, 1999.
Comparison of agricultural, industrial and household water prices: late 1990sWater prices for agriculture, industry and household. Some caution is required in comparison becausewater supplied to agriculture is usually of lower quality than provided to households and, sometimes,industry, while the capital costs of water conveyance systems are generally lower for agriculture than forother users. Prices shown are median values for each category and in most countries prices for agricul-ture refer to those applied in specific regions.Sources: OECD (1999a); OECD (1999b); OECD (1999c); OECD (2000b).
IV.1. Soil Quality
Share of agricultural land area affected by water erosion: 1990sShare of agricultural land affected by water erosion. There are differences in agricultural land areasassessed, and the time period covered. The classification of soil erosion categories used in this figure isnot necessarily that used by countries because categories were changed to aid comparison. For Italy,Portugal, Turkey and Belgium, values apply to potential/susceptible risk of erosion. Germany refers toEast Germany.Sources: OECD Agri-environmental Indicators Questionnaire, 1999, except for: Belgium: Bomans et al.(1996), Canada: Adapted from McRae et al. (2000), France: IFEN (1997), Italy: Italian Ministry of Environ-ment (1993), New Zealand: OECD (1996), and United States: USDA (1996a).
IV.2. Water Quality
Potential nitrate concentration in water flowing from agricultural land: Denmark, 1985 to 1997Potential Nitrate Concentration (PNC) is based on a thirty-year average of net precipitation (1961-90);and PNC (y-y) is based on year-to-year figures of net precipitation. Calculated precipitation minusactual evaporation is used as an estimate of net precipitation.Source: Schou and Kyllingsbæk (1999).
Share of agriculture in total emissions of nitrogen and phosphorus into surface water: mid-1990sShare of agriculture in total emissions of nitrogen and phosphorus into surface water, e.g. rivers, lakes.Data for nitrogen emissions are not available for Ireland, Greece, Luxembourg and United Kingdom.Sources: Belgium: van Gijseghen and Kolder (1996, p. 122); Denmark: Christensen et al. (1994, p. 67-69),and EEA (1998, p. 201); France: OECD (1997, p. 59), and IFEN (1997, p. 9); Finland: Statistics Finland (1999,p. 19); Germany: EEA (1998, p. 201), and Werner (1997); Greece, Ireland, Luxembourg and United Kingdom:EEA (1998), OECD (1998b), Romstad et al. (1997), and Simonsen (1996); Italy and Portugal: EEA (1996);Netherlands: The Netherlands’ Ministry of Agriculture, Nature Management and Fisheries (1995, p. 8);Norway: OECD (1993, p. 53), and Johnsen (1993, p. 400); Sweden: Ministry of Agriculture (2000, unpublished);Switzerland: Swiss Agency for the Environment, Forests and Landscape (2000, unpublished).
Share of agriculture in the impairment of surface and marine water quality: United States, 1988 to 1996Figure shows agriculture’s contribution to water pollution, from all sources (e.g. soil sediment, nitrogen,phosphorus, pesticides, etc.) for the one-third of the nation’s water bodies assessed to be below desig-nated water quality standardsSources: USDA (1996a, 1996b, 1997).
© OECD 2000
Explanatory Notes to Figures
49
0020001t1.fm Page 49 Thursday, November 16, 2000 8:58 AM
IV.3. Land Conservation
Water retaining capacity of agriculture: 1985-87 to 1995-97Percentage change of water retaining capacity (WRC) of agricultural land. Where the WRC coefficients(WRC per unit area) for certain land use types are not available or specified, those proposed by Japanare used. WRC of agricultural facilities are not included in the calculation.Sources: OECD Agri-environmental Indicators Questionnaire, 1999.
Environmental impacts of off-farm sediment flowsAd hoc data related to off-farm sedimentation in rivers, lakes and reservoirs in OECD countries.Sources: OECD Agri-environmental Indicators Questionnaire, 1999; United Kingdom EnvironmentAgency (1998).
IV.4. Greenhouse Gases
Greenhouse gas emissions in carbon dioxide equivalent: 1995 to 97Greenhouse gas emission in carbon dioxide (CO2) equivalent. Korea and Mexico are not included. ForCO2, 1996 data for EU countries; 1995 data for the others (Australia, Austria, the Czech Republic, Hungary,Japan, New Zealand, Poland, Switzerland, Turkey and United States are not included in the calculation).CO2 emission in agriculture covers fossil fuel combustion only (fossil fuel combustion in forestry and fish-eries is included for non-EU countries). For methane (CH4) and nitrous oxide (N2O), 1996-97 average forPoland and Sweden; average of 1995 and 1997 for Turkey; 1994-96 average for Australia, Belgium, Greece,Hungary, Ireland and Netherlands; and 1993-94 average for Portugal. For “Others”, i.e. hydrofluorocarbons(HFCs), perfluorocarbons (PFCs) and sulphur hexafluoride (SF6), 1995 data are used except 1994 forGermany (Hungary, Ireland, Luxembourg, Poland, Portugal, Spain and Turkey are not included, and onlypartial emissions data are included for Australia, Austria, Denmark, Finland, Greece, Iceland, Japan,Sweden and the United Kingdom).Sources: OECD Secretariat; UNFCCC (1999); EUROSTAT (1997); Turkish Ministry of Environment (1998).
Gross emissions of greenhouse gases from agriculture: 1990-92 to 1995-97Percentage change in gross emissions greenhouse gases from agriculture. Korea and Mexico are notincluded. For 1995-97 data, see notes above. 1990-92 data refer to: 1990 data for Finland, Italy, Luxembourgand Sweden; and average of 1990 and 1992 for CH4 and N2O in Poland and Turkey.Sources: OECD Secretariat; UNFCCC (1999); EUROSTAT (1997); Turkish Ministry of Environment (1998).
IV.5. Biodiversity
Share of the one to five dominant varieties in total marketed crop production: 1985 to 1998Percentage change in the share of the one to five dominant varieties in the total marketed productionfor selected crops. Figure shows, for Canada and Wheat for example, that for 3 wheat varieties theirshare in total production declined by 6% points from 80% in 1985 to 74% in 1998 (number shown in theattached table). 1985 data refer to 1990 for Portugal. 1998 data refer to: 1990 for Canada, 1995 for Polandand for Forage in Denmark. “Wheat” refers to winter wheat for Denmark, Germany, Norway and Sweden;“Barley” refers to spring barley for Denmark and Sweden; and “Rapeseed” refers to spring rapeseed forDenmark.Source: OECD Agri-environmental Indicators Questionnaire, 1999.
Share of the three major livestock breeds in total livestock numbers: 1985 to 1998Percentage change in the share of the three major livestock breeds in total livestock numbers. Theshare in 1998 is shown in the table. Figure shows, for Austria and Cattle for example, that for 3 breeds ofcattle their share in total cattle numbers declined by 2% points from 95% in 1985 to 93% in 1998 (numbershown in the attached table). Values beyond the range of this Figure are: –54% (pigs, Norway). 1985 datarefer to: 1987 for Pigs in Germany; and 1990 for Goats and Horses in Greece, and for Cattle in Norwayand Sweden. 1998 data refer to: 1995 for Cattle and Horses in Austria; and 1997 for Canada, and Cattleand Pigs in Germany.Source: OECD Agri-environmental Indicators Questionnaire, 1999.
© OECD 2000
Environmental Indicators for Agriculture: Methods and Results
50
0020001t1.fm Page 50 Thursday, November 16, 2000 8:58 AM
Share of selected wild species categories that use agricultural land as habitat: 1998Percentage share of selected wildlife species categories that predominantly use agricultural land ashabitat. This figure should be interpreted with care, as definitions of the use of agricultural land as habi-tat by wild species can vary. Species can use agricultural land as “primary” habitat (strongly dependenton habitat) or “secondary” habitat (uses habitat but is not dependent on it).Source: OECD Agri-environmental Indicators Questionnaire, 1999.
IV.6. Wildlife Habitats
Area of total agricultural land, seem-natural agricultural habitats and uncultivated habitats: 1985 to 1998Percentage change in the areas of total agricultural land, seem-natural agricultural habitats and unculti-vated habitats. “Uncultivated habitats” refer to uncultivated natural habitats on and/or bordering agri-cultural land, e.g. woodlands, small rivers and wetlands, but for some countries includes farmyards, farmbuildings, etc. Values beyond the range of this Figure are: 33% (semi-natural habitats, Sweden), 21%(uncultivated habitats, Denmark), and 547% (semi-natural habitats, Netherlands). 1985 data refer to1984 for United Kingdom, and 1986 for Canada; 1998 data refer to 1997 for Austria.Source: OECD Agri-environmental Indicators Questionnaire, 1999.
Share of different land use types in land converted from agricultural to other uses: mid-1980s tomid-1990sShare of different land use types in the total area of land converted from agricultural use. “Forest andwooded land” refer to those on and/or bordering agricultural land. “Built-up land” covers mainly landused for urban or industrial development and transport infrastructure, e.g., roads. “Surface water” coversmainly small ponds, lakes and diverted rivers. “Others” refer to land not used for any of the above uses,such as barren land, exposed rocks and for some countries, e.g. Japan, farmland abandoned but not for-ested. Data for wetlands not available for Switzerland, Norway and Japan; data for forests not availablefor Korea; and other land for Norway.Source: OECD Agri-environmental Indicators Questionnaire, 1999.
Number of vertebrate species using habitat on agricultural land: Canadian Prairies, mid-1990sThe addition of species using the Canadian Prairies as a primary and secondary habitat for five activi-ties, i.e. reproduction, feed, cover, wintering and staging (birds only). Vertebrates, including birds, mam-mals, amphibians and reptiles.Source: Adapted from Neave and Neave (1998).
IV.7. Landscape
Defining natural and cultural landscapes: the agricultural contextNatural and cultural landscapes in agricultural context. The shaded area shows the main field of interestfor OECD Agricultural Landscape Indicators.Source: OECD Secretariat and personal communication with Dr. Hans-Peter Piorr (Centre for AgriculturalLandscape and Land Use Research, Müncheberg, Germany).
Cultural landscape features on agricultural land: 1985 to 1998Denmark includes 14th and 15th century churches as cultural landscape features in agricultural areas,also hedgerows in Denmark, as measured in terms of area rather than length, as they usually consist of3-7 rows of trees and large bushes. Dehesas (in Spain) refer to wooded pastures and open grassland,used for grazing, crop cultivation and forest products. Symbols in the columns of United Kingdom are:E: England, W: Wales, GB: Great Britain. For Norway, number of farms that own or have a share in moun-tain farming are determined from the applications made for production subsidies for summer-mountainfarming with dairy production with a minimum of 4 weeks. For United Kingdom, data for 1985 and 1995refer respectively to 1984 and 1996, except 1993 for dry stone walls; the data on length of linear featuresand number of ponds are net figures.c.: circa; ..: not available.Sources: Norwegian Grain Corporation (unpublished); OECD Agri-environmental IndicatorsQuestionnaire, 1999.
© OECD 2000
51
0020001t1.fm Page 51 Thursday, November 16, 2000 8:58 AM
BIBLIOGRAPHY
Bomans, E., L. Vanongeval, H. Vandendriessche and M. Geypens (1996), Development of an Agricultural Soil Quality Indicator, Ministry of The Flemish Community, Environment and Infrastruc-ture Department, Environment, Nature, Land and Water Management Administration, Brussels, Belgium.
Christensen, N., H. Paaby and J. Holten-Andersen (1994),Environment and Society Environment and Society – A Review ofEnvironmental Development in Denmark, National Environmental Research Institute, Technical Report No. 108, Min-istry of the Environment, Roskilde, Denmark.
Commonwealth of Australia (1998), Sustainable Agriculture – Assessing Australia’s Recent Performance, A Report to the SCARM [Standing Committee onAgriculture and Resource Management] of the National Collaborative Project on Indicators for Sustainable Agri-culture, SCARM Technical Report No. 70, CSIRO Publishing, Victoria, Australia.
EEA [European Environment Agency] (1996), Water Quality of Large Rivers, European Topic Centre on Inland Waters, Topic Report 4, Copenhagen, Denmark.
EEA (1998), Europe’s Environment – the Second Assessment, Office for Official Publications of the European Communities, Luxembourg.
European Commission (1999), Agriculture, Environment, Rural Development: Facts and Figures – A Challenge for Agriculture. Available on the EU web-siteat: http://europa.eu.int/comm/dg06/envir/report/en/index.htm.
EUROSTAT [Statistical Office of the European Communities] (1997), Carbon Dioxide Emissions from Fossil Fuels, Statistical Office of the European Communities, Luxembourg.
EUROSTAT (1998a), Income of the Agricultural Households Sector, 1997 Report, Luxembourg.
EUROSTAT (1998b), Pesticide Use in the EU, Statistics in Focus Environment, No. 3, Luxembourg.
Holland, P and A. Rahman (1999), Review of Trends in Agricultural Pesticide Use in New Zealand, MAF Policy Technical Paper 99/11, Ministry of Agricultureand Forestry, Wellington, New Zealand. Available at: http://203.97.170.4/MAFnet/index.htm [Site A-Z > T > Techni-cal Papers].
IFEN [Institut français de l’environnement] (1997), Agriculture et environnement: les indicateurs, 1997-1998 édition, Orléans, France.
Italian Ministry of Environment (1993), Report on the State of the Environment in Italy, Istituto Poligrafico e Zecca dello Stato, Rome, Italy.
Johnsen, F.H. (1993), “Economic analysis of measures to control phosphorus run-off from non-point agricultural sources”, EuropeanReview of Agricultural Economics, Vol. 20, No. 4, pp. 399-418.
McRae, T., C.A.S. Smith and L.J. Gregorich (eds) (2000), Environmental Sustainability of Canadian Agriculture – Report of the Agri-Environmental Indicator Project, Agriculture andAgri-Food Canada, Ottawa, Ontario, Canada.
Neave, P. and E. Neave (1998), Agroecosystem Biodiversity Indicator – Habitat Component: Review and Assessment of Concepts and Indicators of Wildlife and Hab-itat Availability in the Agricultural Landscape – Concept Paper, Report No. 26, Agri-Environmental Indicator Project, Agri-culture and Agri-Food Canada, Regina, Canada.
OECD (1993), Environmental Performance Reviews – Norway, Paris, France.
OECD (1995a), “A Review of Farm Household Incomes in OECD Countries” in OECD, Adjustment in OECD Agriculture – Issues andPolicy Responses, Paris, France.
© OECD 2000
Environmental Indicators for Agriculture: Methods and Results
52
0020001t1.fm Page 52 Thursday, November 16, 2000 8:58 AM
OECD (1995b), A Review of Farm Household Incomes in OECD Countries, General Distribution document [OECD/GD(95)97], Paris,France. Available at: http://www.oecd.org/ [Documentation > 1995 > Reference Components > OCDE > OCDE/GD].
OECD (1996), Environmental Performance Reviews – New Zealand, Paris, France.
OECD (1997), Environmental Performance Reviews – France, Paris, France.
OECD (1998a), Agricultural Policy Reform: Stocktaking of Achievements, A discussion paper for the meeting of the OECD Committeefor Agriculture at Ministerial level prepared under the responsibility of the Secretary-General, 5-6 March, Paris,France. Available at http://www.oecd.org/agr/ministerial.
OECD (1998b), Workshop on the Sustainable Management of Water in Agriculture: Issues and Policies – The Athens Workshop: Case Studies, GeneralDistribution document, Paris, France. Available on the OECD web-site at: http://www.oecd.org/agr/publications/index1.htm.
OECD (1999a), Agricultural Water Pricing in OECD Countries, General Distribution document [ENV/EPOC/GEEI(98)11/FINAL], Paris,France. Available on the OECD web-site at: http://www.oecd.org/env/docs/epocgeei9811.pdf.
OECD (1999b), Industrial Water Pricing in OECD Countries, General Distribution document [ENV/EPOC/GEEI(98)10/FINAL], Paris,France. Available on the OECD web-site at: http://www.oecd.org/env/docs/epocgeei9810.pdf.
OECD (1999c), Household Water Pricing in OECD Countries, General Distribution document [ENV/EPOC/GEEI(98)12/FINAL], Paris,France. Available on the OECD web-site at: http://www.oecd.org/env/docs/epocgeei9812.pdf.
OECD (2000a), Agricultural Policies in OECD Countries – Monitoring and Evaluation 2000, Paris, France.
OECD (2000b), Environmental Performance Reviews – Hungary, Paris, France.
OECD (2001), OECD National Soil Surface Nitrogen Balances – Preliminary Estimates 1985-1997, Paris, France, available on the OECDweb-site at: http://www.oecd.org/agr/env/indicators.htm.
OFEFP-OFAG (1998), Strategie pour reduire les emissions d’azote, [Strategy to reduce emissions of nitrates, in French only], SchriftenreiheUmwelt Nr 273, Office fédéral de l’environnement, des forêts et du paysage (OFEFP) et Office fédéral de l’agri-culture (OFAG), Berne, Switzerland.
Romstad, E., J.W. Simonsen and A. Vatn (eds) (1997), Controlling Mineral Emissions in European Agriculture – Economics, Policies and the Environment, CAB International Publish-ing, Wallingford, United Kingdom.
Schou, J.S. and A. Kyllingsbæk (1999), An Indicator of Water Contamination Risk with Nitrogen in Agriculture, Danish Institute of Agricultural and Fisheries Eco-nomics and Danish Institute of Agricultural Science, personal communication with the OECD Secretariat.
Simonsen, J.W. (ed.) (1996), Inventory on Mineral Pollution from Agriculture, EU concerted action “Policy measures to control environmentalimpacts from agriculture” (AIR3CT93-1164), Norwegian Agricultural Research Institute, Oslo, Norway.
Statistics Finland (1999), Finland’s Natural Resources and the Environment 1999, Ministry of the Environment, Helsinki, Finland.
The Netherlands Ministry of Agriculture, Nature Management and Fisheries (1995), Policy Document on Manure and Ammonia, Den Haag, The Netherlands.
Turkish Ministry of Environment (1998), National Report on Climate Change, Ankara, Turkey.
UNFCCC [United Nation Framework Convention on Climate Change] (1999), Report on National Greenhouse Gas Inventory Data from Annex I Parties for 1990 to 1997, National Communications from Par-ties Included in Annex I to the Convention, Greenhouse Gas Inventory Data, 1990-1997 [FCCC/SBI/1999/12], Generaldistribution paper presented at the Eleventh Session of the Subsidiary Body for Implementation, 25 October-5November, Bonn. Related searchable database is available on the UNFCCC web-site at: http://www.unfccc.de.
United Kingdom Environment Agency (1998), Sedimentation and Salmonids in England and Wales, Research and Development Technical Report P194, Bristol,United Kingdom.
© OECD 2000
Bibliography
53
0020001t1.fm Page 53 Thursday, November 16, 2000 8:58 AM
USDA (1996a), America’s Private Land − A Geography of Hope, Natural Resources Conservation Service, U.S. Department of Agricul-ture, Washington, D.C., United States.
USDA (1996b), Water Quality, Natural Resources Conservation Service, Resources Conservation Service, Resource ConservationAct (RCA) Issue Brief 9, Washington, D.C., United States.
USDA (1997), Agricultural Resources and Environmental Indicators, 1996-97, Economic Research Service, Natural Resources andEnvironment Division, Agricultural Handbook No. 712, U.S. Department of Agriculture, Washington D.C., UnitedStates.
van Gijseghem, D. and L. van Holder (1996), “Mineral Emissions from Agriculture,” pp. 119-130, in Simonsen, J.W. (ed.) (1996), Inventory on Mineral Pollution fromAgriculture, EU concerted action “Policy measures to control environmental impacts from agriculture” (AIR3CT93-1164), Norwegian Agricultural Research Institute, Oslo, Norway.
Welsh, R. (1999), The Economics of Organic Grain and Soyabean Production in the Midwestern United States, Policy Studies ReportNo. 13, Henry A. Wallace Institute for Alternative Agriculture, Greenbelt, Maryland, United States. Avail-able at: http://www.hawiaa.org/hawiall.htm.
Werner, W. (1997), “Implementation and Efficiency of Counter-measures against Diffuse Nitrogen and Phosphorus Input Ground-water and Surface Waters from Agriculture”, pp. 73-88, in Romstadet al. (eds) (1997), Controlling Mineral Emissions inEuropean Agriculture – Economics, Policies and the Environment, CAB International Publishing, Wallingford, UnitedKingdom.
© OECD 2000
OECD PUBLICATIONS, 2, rue André-Pascal, 75775 PARIS CEDEX 16
PRINTED IN FRANCE
(00 2000 1t 1 P) – No. 80975 2000
BACKMATTER7 Page 55 Thursday, November 16, 2000 11:37 AM