environmental justice analysis dallas county ,...
TRANSCRIPT
Background : In 1992 Paul Mohai and B. Bryant commented on environmental racism, as “more number of minority groups living closer
to the location of the pollutant sites because of their lesser ability to defend themselves due to poverty and political powerlessness”.
Objective: To analyze the Environmental justice issue in Dallas county to determine whether people of specific race are targeted
towards environmental racism.
ENVIRONMENTAL JUSTICE ANALYSIS – DALLAS COUNTY , TEXAS
Project by: Billakanti Ramakrishna, Department of Geography and Planning, University of Akron
Advanced GIS 3350 : 507-001, Dr. Linda Barrett, Instructor
Environmental Justice Analysis (EJA) : EPA defines environmental justice as “the fair treatment and meaningful involvement of all the
people regardless of race, color, national origin, or income with respect to the development, implementation, and enforcement of
environmental laws, regulations, and policies.”-Toxic Wastes and Race by Paul Mohai and Robin Saha
Data Source: The data required for the project like the locations of the Toxic release inventory sites (TRI), Permanent Industrial and
Hazardous waste sites (PIHW), Superfund sites and Municipal solid waste sites (MSW) is obtained from the Environmental Protection
Agency, A Base map form the North Texas Council of Governments and Socio Economic data from the American Census
Study Area: Dallas is the ninth largest metropolitan city in the United States, which
is the main economic center for the trade and commerce in Texas generating a lot
of revenue in the form of various activities which includes industries, commercial
centers etc. The population of Dallas is 1,240,499 with the density of 3623 persons
per square mile. Dallas is chosen as the study area because of its racial
characteristics which consists of 56.9% White population and 43.1% minority
population which includes Blacks, Asian, Native American, Pacific islanders and
from other races.
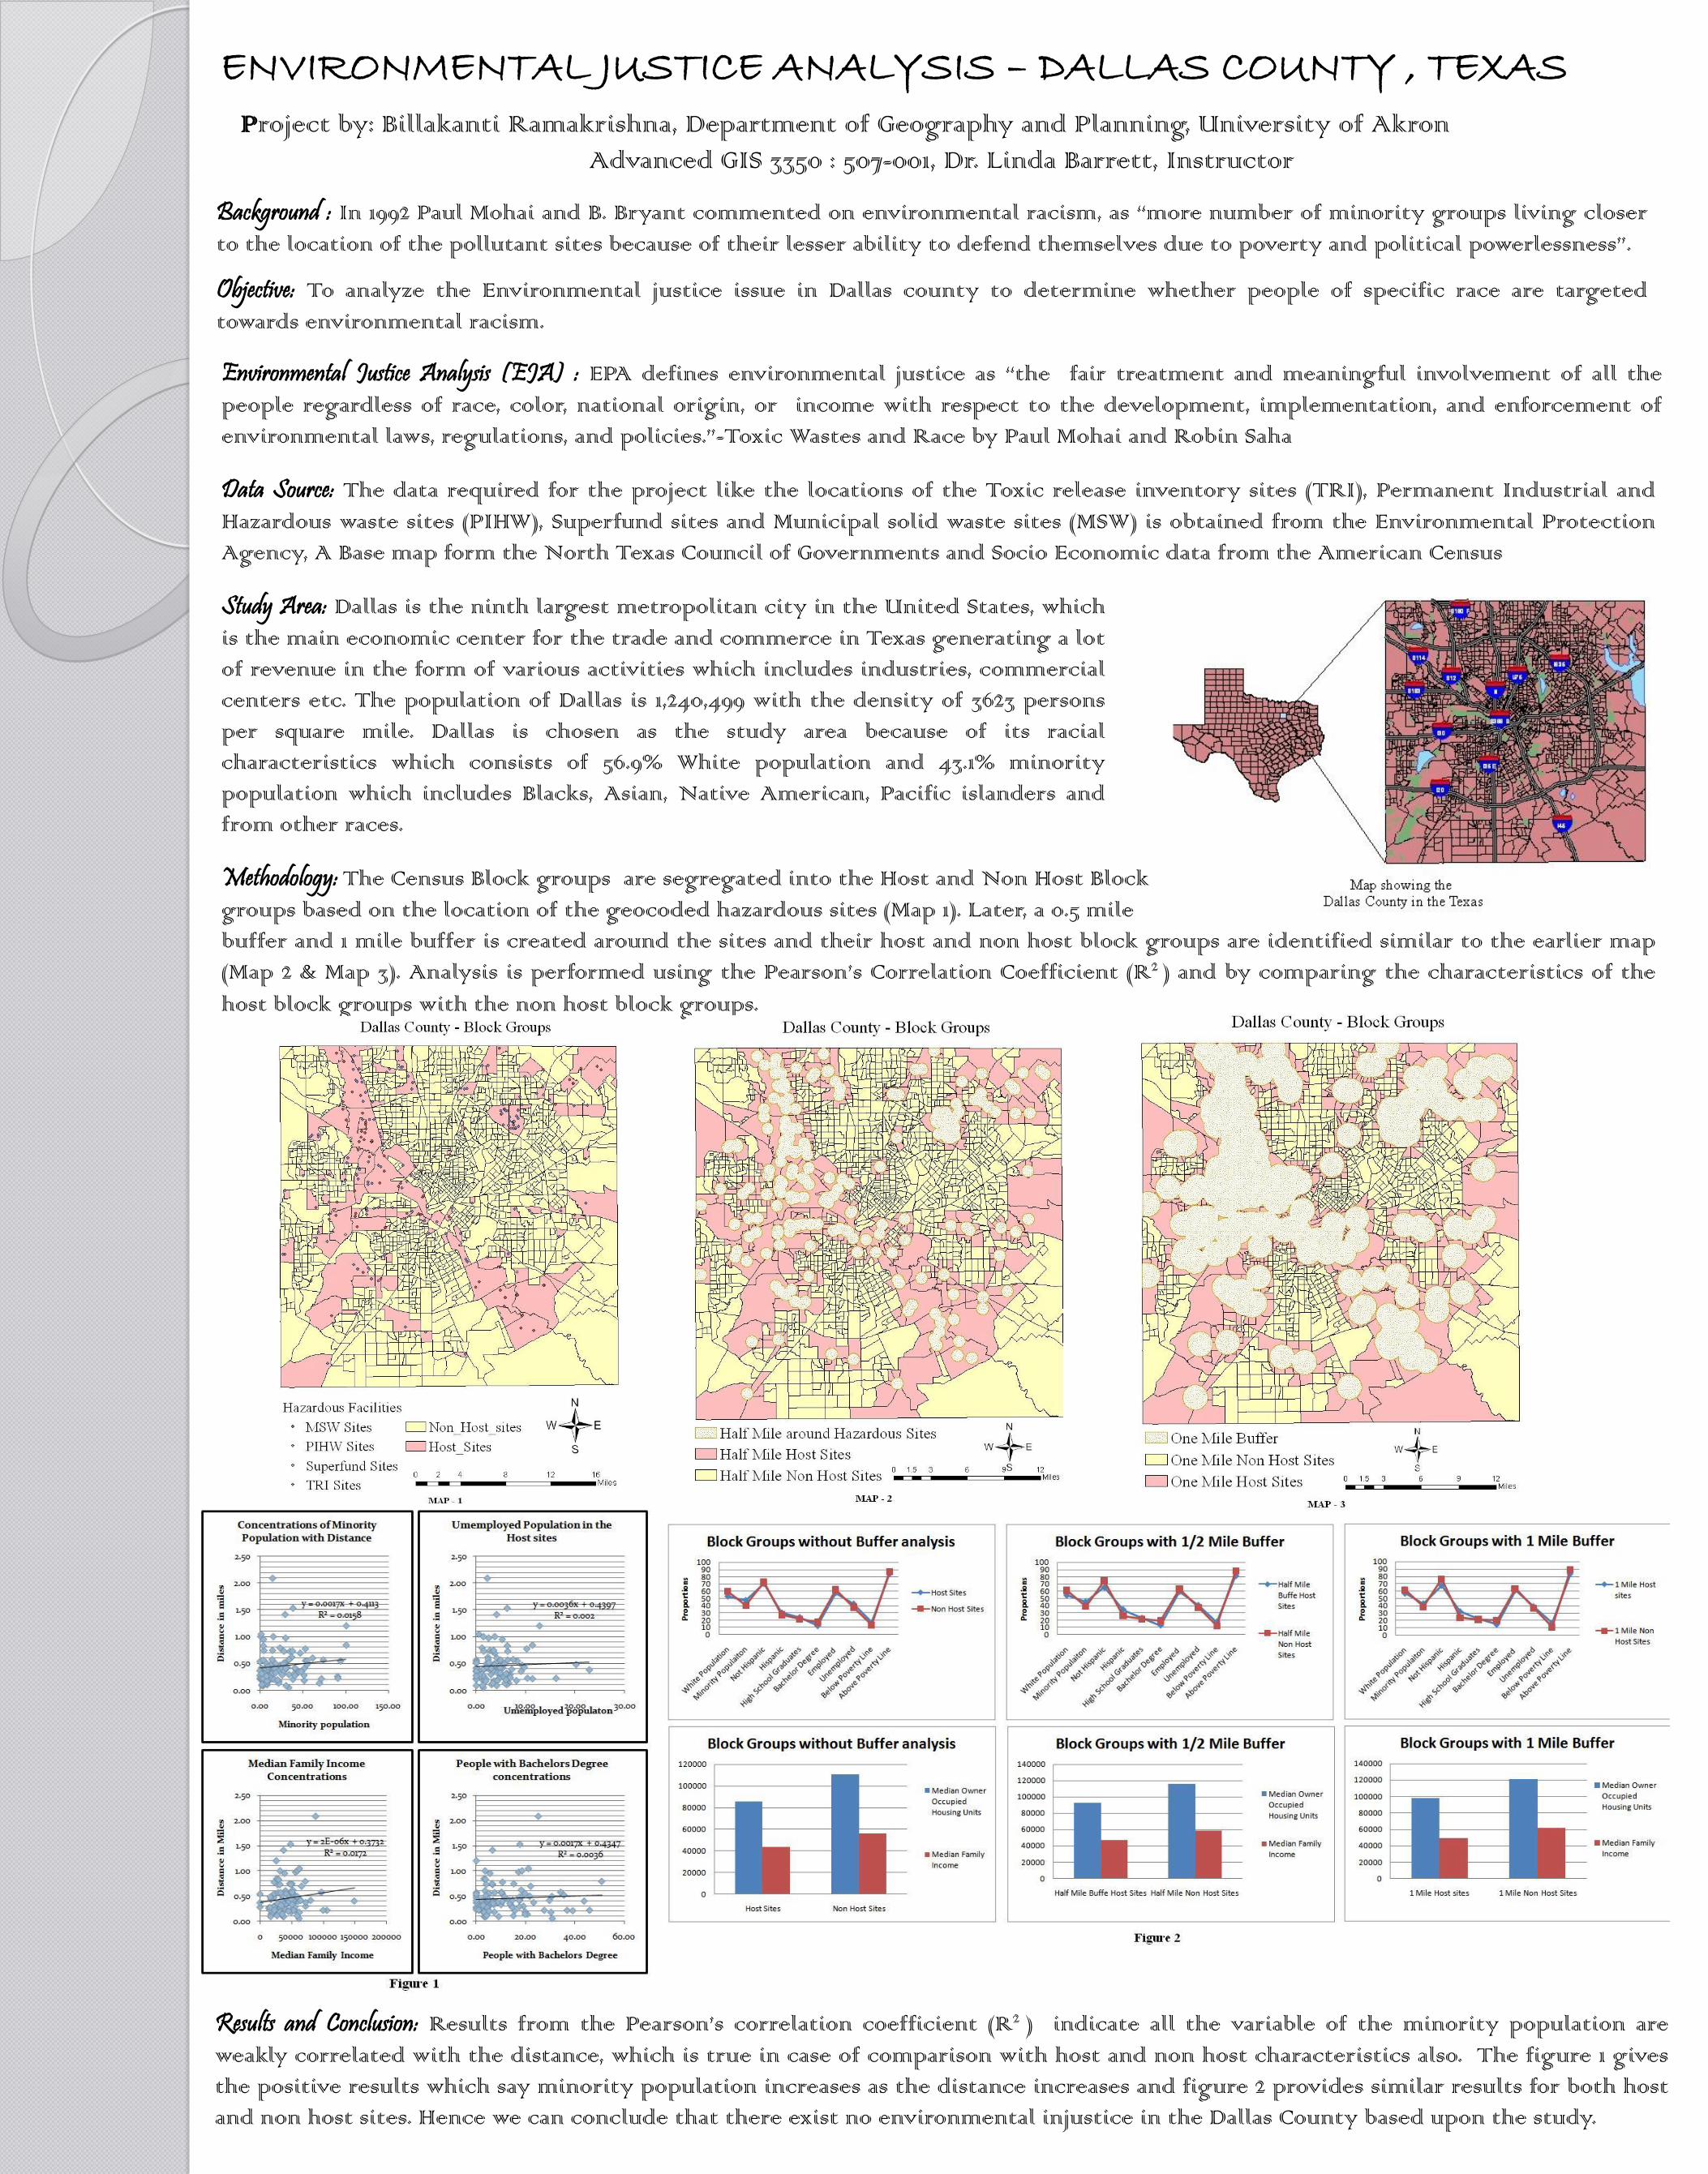
Methodology: The Census Block groups are segregated into the Host and Non Host Block
groups based on the location of the geocoded hazardous sites (Map 1). Later, a 0.5 mile
buffer and 1 mile buffer is created around the sites and their host and non host block groups are identified similar to the earlier map
(Map 2 & Map 3). Analysis is performed using the Pearson’s Correlation Coefficient (R2 ) and by comparing the characteristics of the
host block groups with the non host block groups.
Results and Conclusion: Results from the Pearson’s correlation coefficient (R2 ) indicate all the variable of the minority population are
weakly correlated with the distance, which is true in case of comparison with host and non host characteristics also. The figure 1 gives
the positive results which say minority population increases as the distance increases and figure 2 provides similar results for both host
and non host sites. Hence we can conclude that there exist no environmental injustice in the Dallas County based upon the study.