environmental outlook
TRANSCRIPT

OECD Environmental Outlook to 2050:The Consequences of Inaction
March 15, 2012

2
What is it?
• Projects demographic and economic trends to 2050, and their impacts on the environment without more ambitious policies = the “Baseline” scenario
• The “Baseline” scenario is…
– not an acceptable future
– calls for urgent action now to avoid the costs and consequences of inaction
• The Outlook examines policies that could change that picture for the better (via policy simulations)
• Joint economic-environment modelling by the OECD and the PBL Netherlands Environmental Assessment Agency
Environmental Outlook to 2050: Introduction

• Executive Summary
• 1. Introduction
• 2. Socioeconomic Development
• 3. Climate Change
• 4. Biodiversity
• 5. Freshwater
• 6. Health and Environment
• Annex on the Modelling Framework
3
Structure of the Report
Environmental Outlook to 2050

Note: values using constant 2010 purchasing power parity (PPP) exchange rates.Source: (OECD, 2012) OECD Environmental Outlook to 2050; output from ENV-Linkages.
4
Projections for real gross domestic product: Baseline, 2010-2050
0
50 000
100 000
150 000
200 000
250 000
300 000
350 000
2010 2015 2020 2025 2030 2035 2040 2045 2050
Bill
ions
of c
onst
ant 2
010
US
D
OECD BRIICS RoW US China India
SOCIO-ECONOMIC DEVELOPMENTS:World economy will nearly quadruple by 2050

Source: (OECD, 2012) OECD Environmental Outlook to 2050; output from ENV-Linkages.
5
CLIMATE CHANGE:GHG emissions to increase by 50% by 2050
0
10
20
30
40
50
60
70
80
90
2010 2015 2020 2025 2030 2035 2040 2045 2050
GtC
O2e
OECD AI Russia & rest of AI Rest of BRIICS ROW
GHG emissions by region, Baseline

Source: (OECD, 2012) OECD Environmental Outlook to 2050, Baseline projection using IMAGE model suite
6
CLIMATE CHANGE: Global temperature to increase by 3-6°C by 2100
CO2 atmospheric concentrations

CLIMATE CHANGE: Human and economic costs of more extreme weather events, crops & infrastructure at risk, etc.
7Source: (OECD, 2012). OECD Environmental Outlook to 2050; output from IMAGE model suite
Change in annual temperature between 1990 and 2050

Source: (OECD, 2012), OECD Environmental Outlook to 2005; output from IMAGE
8
HEALTH & ENV : Urban air pollution to become the top environmental cause of premature deaths by 2050
Global premature deaths from selected environmental risks: Baseline, 2010 to 2050
0.0 0.5 1.0 1.5 2.0 2.5 3.0 3.5 4.0
Particulate Matter
Ground-level ozone
Unsafe Water Supply and Sanitation*
Indoor Air Pollution
Malaria
Deaths (millions of people)
2010
2030
2050
* The region South Asia excludes IndiaSource: (OECD, 2012), OECD Environmental Outlook to 2050; output from IMAGE
9
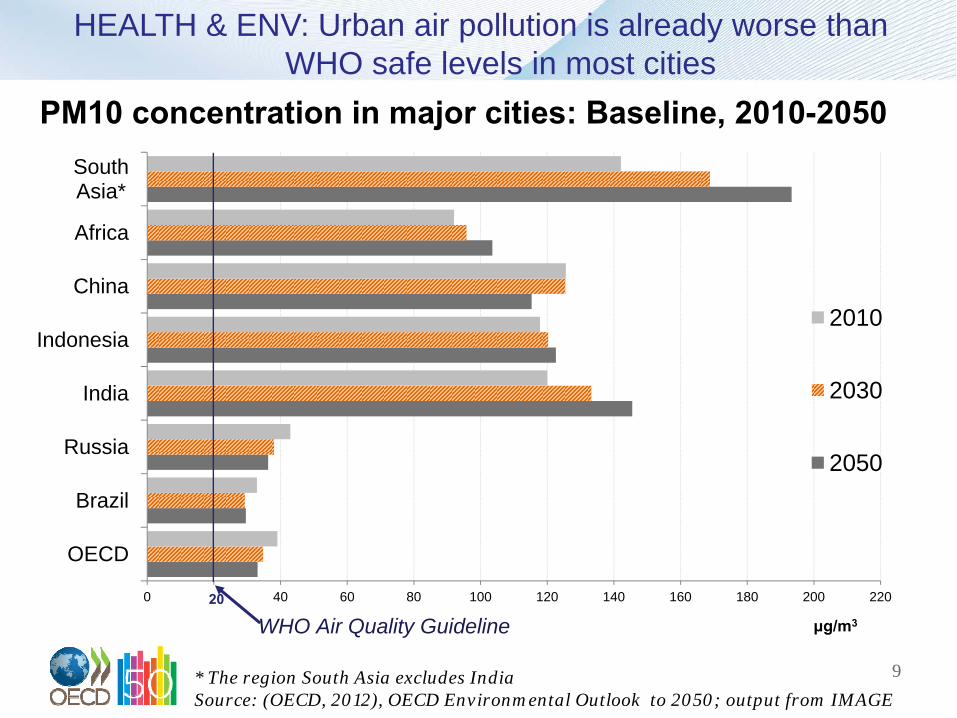
HEALTH & ENV: Urban air pollution is already worse thanWHO safe levels in most cities
0 20 40 60 80 100 120 140 160 180 200 220
OECD
Brazil
Russia
India
Indonesia
China
Africa
South Asia*
μg/m3
2010
2030
2050
WHO Air Quality Guideline20
PM10 concentration in major cities: Baseline, 2010-2050

Source: (OECD, 2012), OECD Environmental Outlook Baseline; output from IMAGE
10
0
1 000
2 000
3 000
4 000
5 000
6 000
2000 2050
World
Km3
electricity
manufacturing
livestock
domestic
irrigation
WATER: Global water demand to increase by 55% by 2050
Rapidly growing water demand from cities, industry and
energy suppliers will challenge water for irrigation to 2050.
Global water demand: Baseline scenario

WATER: In 2050, 4 out of 10 people will live inriver basins under severe water stress
1.61.6
1.31.3
3.2 Bn3.2 Bn
2050 (9.2 Bn)
People under no or low water stress
People under medium water stress
People under severe water stress
2000 (6.1 Bn)
3.9 Bn
1.4
3.9 Bn
Nearly half of the world population is projected to live under severe water stress in 2050
OECD BRIICS Rest of the world
2000
2050
= 200MM

Source: OECD Environmental Outlook Baseline; output from IMAGE12
WATER: Water pollution from urban sewage to increase 3-foldNitrogen effluents from wastewater: baseline
Source: (OECD, 2012), OECD Environmental Outlook to 2050; output from IMAGE13
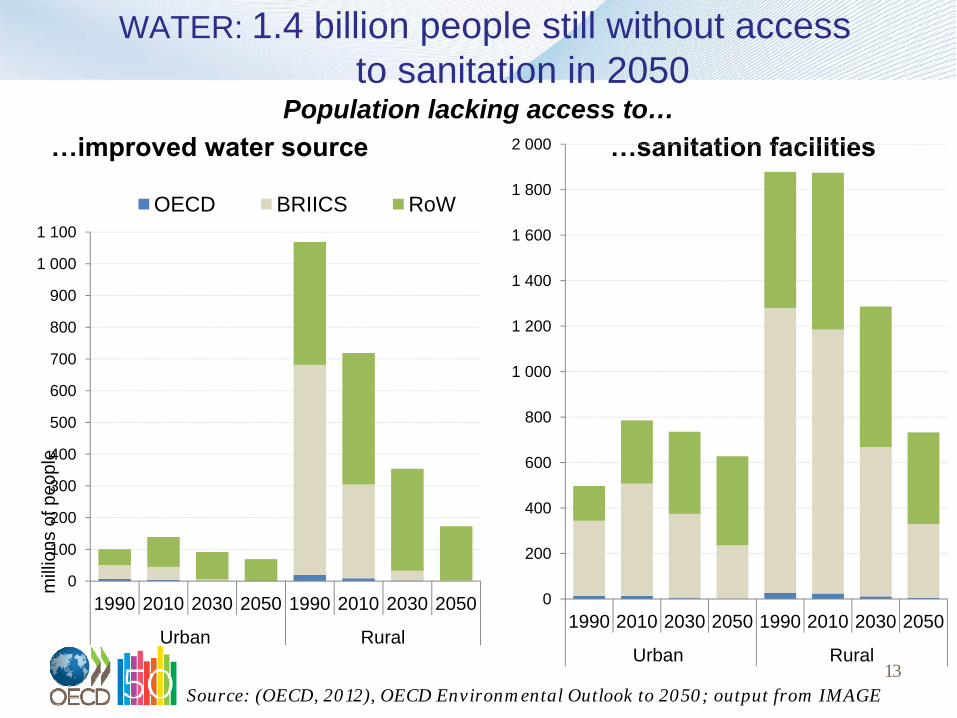
WATER: 1.4 billion people still without access to sanitation in 2050
…improved water source …sanitation facilities
0
100
200
300
400
500
600
700
800
900
1 000
1 100
1990 2010 2030 2050 1990 2010 2030 2050
Urban Rural
mill
ions
of p
eopl
e
OECD BRIICS RoW
0
200
400
600
800
1 000
1 200
1 400
1 600
1 800
2 000
1990 2010 2030 2050 1990 2010 2030 2050
Urban Rural
Population lacking access to…

Source: (OECD, 2012), OECD Environmental Outlook Baseline; output from IMAGE
14
0%
10%
20%
30%
40%
50%
60%
70%
80%
Nor
th
Am
eric
a
Eur
ope
Japa
n/K
orea
Aus
tralia
/NZ
Bra
zil
Rus
sia
Sou
th A
sia
Chi
na
Indo
nesi
a
Sou
ther
n A
frica RoW
Wor
ld
Mea
n sp
ecie
s ab
unda
nce
2010 2020 2030 2050
Terrestrial mean species abundance (MSA) by region: Baseline
BIODIVERSITY:Global biodiversity to decline by a further 10% by 2050

RoW = rest of the world. Infra+Encr+Frag = infrastructure, encroachment and ecosystem fragmentation Source: (OECD, 2012), OECD Environmental Outlook to 2050; output from IMAGE
15
BIODIVERSITY:Climate change is the fastest growing driver of lossEffects of different pressures on terrestrial MSA: Baseline
50%
60%
70%
80%
90%
100%
2010 2030 2050 2010 2030 2050 2010 2030 2050 2010 2030 2050
OECD BRIICS RoW World
MS
A
Infr+Encr+Frag
Climate Change
Nitrogen
Former Land-Use
Forestry
Pasture
Bioenergy
Food Crop
Remaining MSA0-

POLICY ACTION: Act now – because delay is costly
16
Delaying climate action would increase the global cost of GHG mitigation by nearly 50% by 2050, and could make it unaffordable
Real income in 2050 (% deviation from baseline)
-10%-9%-8%-7%-6%-5%-4%-3%-2%-1%0%
450 ppm Core 450 ppm delayed action
Source: OECD (2012), OECD Environmental Outlook to 2050, output from ENV-Linkages model
Optimal mitigation: 450ppm
Cancun pledges: Delayed action
17
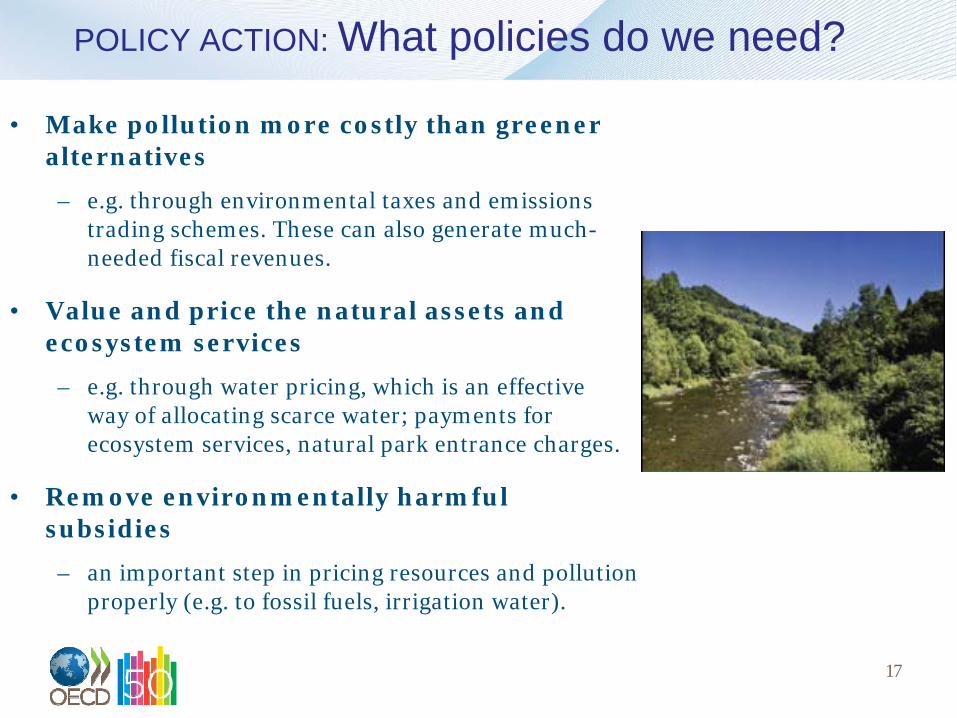
POLICY ACTION: What policies do we need?
• Make pollution more costly than greener alternatives
– e.g. through environmental taxes and emissions trading schemes. These can also generate much-needed fiscal revenues.
• Value and price the natural assets and ecosystem services
– e.g. through water pricing, which is an effective way of allocating scarce water; payments for ecosystem services, natural park entrance charges.
• Remove environmentally harmful subsidies
– an important step in pricing resources and pollution properly (e.g. to fossil fuels, irrigation water).

POLICY ACTION: Environmental taxesRevenues from environmentally related taxes in per cent of GDP1
Source: OECD-EEA database on instruments used for environmental policy, wwww.oecd.org/env/policies/database
1. Includes: taxes on energy products, vehicles, pollutants and natural resources, but Excludes: royalties and taxes on oil and gas extraction.

The importance of pricing: water conservation(% ownership against water fee structure)
Source: OECD (2011), Greening Household Behaviour: The Role of Public Policy

POLICY ACTION:Why make CO2 cheaper if you’re trying to make it scarcer?Impacts on GDP in 2050 of unilateral phase-out of fossil fuel consumer
subsidies in emerging and developing countries(% deviation from baseline)
(1) Middle East & Northern Africa (2) Other Asian, African and Latin American Emerging economies
Source : OECD (2012), OECD Environmental Outlook to 2050; OECD ENV-Linkages Model ; based IEA subsidies data for the year 2009

Note: This graph is based on an arithmetic sum of the individual support measures identified for a sample of21 OECD countries, i.e. the 24 OECD countries included in the inventory net of those countries for whichestimates have not been collected yet (Chile, Iceland and Luxembourg). It reflects the value of tax reliefmeasured under each jurisdiction’s benchmark tax treatment. The estimates do not take into accountinteractions that may occur if multiple measures were to be removed at the same time
Source: OECD (2011), Inventory of Estimated Budgetary Support and Tax Expenditures for Fossil Fuels.
POLICY ACTION: Fossil fuel support in OECD countries

22
POLICY ACTION: What policies do we need?
• Devise effective regulations and standards
– e.g. to safeguard human health and environmental integrity
– for promoting energy efficiency
• Encourage green innovation– e.g. by making polluting production and
consumption modes more expensive, and investing in public support for basic R&D
– e.g. attracting private sector investment
• Facilitate better consumer choices– e.g. through energy and water efficiency labelling,
organic food labels, information, etc.

Source: OECD (2010), The Invention and Transfer of Environmental Technologies
POLICY ACTION: Clear policy signals are needed to drive innovation
Patenting activity pre- and post-Kyoto Protocol’s adoption (3-year moving average, indexed on 1990=1.0)
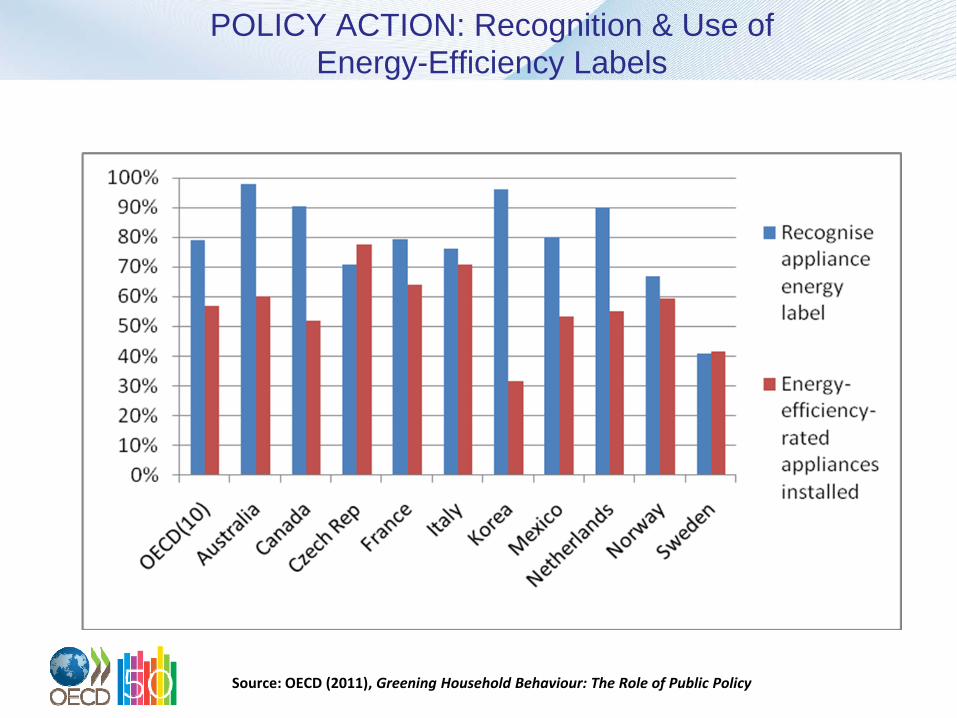
POLICY ACTION: Recognition & Use of Energy-Efficiency Labels
Source: OECD (2011), Greening Household Behaviour: The Role of Public Policy

25
POLICY ACTION: Mainstreaming Green Growth
• Maximise synergies and co-benefits– e.g. tackling local air pollution can cut GHG emissions while reducing
the economic burden of health problems
– e.g. climate policy can also help protect biodiversity if GHG emissions are reduced by avoiding deforestation.
• Integrating environmental objectives in economic and sectoral policies
– e.g. energy, agriculture, transport, development
– ensuring coherence with policies in these areas can have greater impacts than environmental policies alone.

www.oecd.org/environment/outlookto2050
More Information….