environmental performance and reporting
TRANSCRIPT
Environmental Performance and Reporting
A Study of How Scania Sales & Services Can Meet Increased Environmental Demands Hanna Fredriksson Caroline Krasse

Environmental Performance and Reporting
2
Copyright © Fredriksson, Hanna; Krasse, Caroline Department of Automatic Control Faculty of Engineering, Lund University Box 118 221 00 Lund Sweden Department of Business Administration School of Economics and Management, Lund University Box 7080 220 07 Lund Sweden Master Thesis, Technology Management – No. 175/2009
ISSN 1651-0100 ISRN LUTVDG/TVTM--09/5175--/SE
Scania Repro Södertälje 2009 Printed in Sweden

Environmental Performance and Reporting
3
Abstract
Title: Environmental Performance and Reporting – A Study of How
Scania Sales & Services Can Meet Increased Environmental Demands
Authors: Hanna Fredriksson – Master of Science in Land Management,
Major in Technology Management
Caroline Krasse – Master of Science in Business Administration, with Technology Management
Tutors: Niklas Jedeur-Palmgren – Head of Management Systems,
Scania CV AB
Charlotta Johnsson – Senior Lecturer, Department of Automatic Control, Lund Institute of Technology Carl-Henric Nilsson – Associate Professor, Department of Business Administration, Lund School of Economics and Management
Issue of study: Corporate Social Responsibility is today a recognised concept
companies have to act on in order to meet the stakeholders’ increased demands. An increased environmental debate in the society as well as increased regulations requires companies to focus on environmental questions to a greater extent than before. Companies need to control their environmental performance and focus on their significant environmental aspects in order to achieve improvements. To reach continuous improvements concerning the significant environmental aspects it is beneficial to connect them to key performance indicators.
Purpose: The purpose is to investigate what to measure and how to
control the environmental performance for Scania Sales & Services.
Method: The thesis is based on literature studies and empirical
researches. The empirical researches consist of qualitative interviews with specialists within the area of the thesis as well as field studies and questionnaires. This led the authors to the conclusion that a general work method for identification of a

Environmental Performance and Reporting
4
company’s significant environmental aspects and connecting them to key performance indicators does not exist. A work method was designed, which includes a Valuation Model. This was applied on Scania Sales & Services. The thesis consists of four questions, carried out and presented in order in this report.
Conclusions: Regarding reporting of environmental performance Scania
Sales & Services is neither ahead nor behind its competitors. The success factors identified through a benchmark analysis are management focus, responsibility and time. Also, when comparing with other companies the authors see a potential to further improve Scania’s communication regarding environmental performance.
When using the developed work method and the Valuation Model, chemicals, energy use and waste are considered to be Scania Sales & Services’ significant environmental aspects. From out of a global perspective these are important to follow up and control. The significant environmental aspects are connected to three key performance indicators;
Total number of chemicals used, of which number of chemicals that are listed in “the black- and grey list”
Energy use / Purchased hours Recycled waste / Purchased hours
When recommending how the environmental work should be handled organisationally, the authors see the success factors mentioned above as important. The initial focus should be on clarifying and addressing the responsibility. Likewise, it is important to integrate the environmental work throughout the organisation. To enable reporting and follow up of the environmental performance from the tactical to the strategic level the authors recommend the data to be transported via the database SandS HFM.
Keywords: Scania Sales & Services, workshops, corporate social
responsibility, environmental management system, key performance indicator, environmental performance, reporting, significant environmental aspects, Valuation Model

Environmental Performance and Reporting
5
Acknowledgements
The time of this thesis has come to its end and it is time to write our acknowledgements. The thesis has involved highly up to date issues and interesting challenges, which have really engaged the authors. For the possibility to write the thesis we are grateful and firstly would like to thank Scania. To our tutor at Scania, Niklas, the project has for us been a great experience. Thank you for always being supportive and for the trust and confidence you have shown us to create our own solutions. Once again, thank you. Elisabeth and Karin, you have given us new dimensions of our assigment, making us come to comprehensive solutions with focus on usability. We hope you find the thesis’ conclusions useful for improvements of S&S’s future environmental work. Thank you both for always being enthusiastic. Also, thank you Susanne, Gunnar and Lars, for teaching us about oils, carbon dioxides, workshops, regulations and commercial washes, but mostly for your great passion in these questions. To our tutors at Lund University, Carl-Henric and Charlotta, can you please continue coming with wise input during our next challenges? Thank you for always providing us with valuable information, always challenging us and for the three-way phone calls. Lastly, to all the other people that have helped us throughout the project – that are too many to mention by name – we would also like to say thank you. We appreciate all the help we have received no matter if it concerned information about GRI or the chance to drive a 25.5 meters long truck loaded with 60 tonnes. As mentioned above, the project has been a great experience and will hopefully contribute to continuous improvements for all parties involved. Stockholm, May 2009 Hanna Fredriksson Caroline Krasse

Environmental Performance and Reporting
6
Table of Contents
1 INTRODUCTION............................................................................................................ 9
1.1 SCANIA THE COMPANY .................................................................................................... 9 1.2 BACKGROUND OF THE MASTER THESIS ............................................................................. 10 1.3 PURPOSE .................................................................................................................... 11 1.4 QUESTION FORMULATION ............................................................................................. 11 1.5 DELIMITATIONS ........................................................................................................... 11 1.6 CONTENT OF CHAPTERS ................................................................................................ 12
2 METHOD .................................................................................................................... 14
2.1 THEORETICAL FOUNDATION ........................................................................................... 15 2.2 EMPIRICAL FOUNDATION ............................................................................................... 16 2.3 RELIABILITY ................................................................................................................. 18 2.4 VALIDITY .................................................................................................................... 18
3 THEORETICAL FOUNDATION ...................................................................................... 19
3.1 CORPORATE SOCIAL RESPONSIBILITY ................................................................................ 19 3.2 ENVIRONMENTAL MANAGEMENT SYSTEMS ....................................................................... 22 3.3 KEY PERFORMANCE INDICATORS ..................................................................................... 27
4 EXISTING ENVIRONMENTAL REPORTING AT SCANIA .................................................. 31
4.1 ENVIRONMENTAL REPORTING AT SCANIA .......................................................................... 31
5 QUESTION 1: BENCHMARK ........................................................................................ 34
5.1 INTRODUCTION BENCHMARK .......................................................................................... 34 5.2 FIRST PART: BY SCANIA REQUESTED COMPANIES ............................................................... 35 5.3 SECOND PART: COMMUNICATION OF ENVIRONMENTAL PERFORMANCE ................................. 40 5.4 TRENDS WITHIN SUSTAINABILITY REPORTING ..................................................................... 43
6 WORK METHOD FOR VALUATION AND CONTROL ...................................................... 46
6.1 WORK METHOD .......................................................................................................... 46 6.2 DEVELOPMENT OF THE VALUATION MODEL ...................................................................... 48 6.3 VALUATION MODEL – GLOBAL LEVEL ............................................................................... 50 6.4 VALUATION MODEL – LOCAL LEVEL ................................................................................. 52
7 QUESTION 2: ENVIRONMENTAL ASPECTS AND HOW TO CONTROL THEM ................. 53
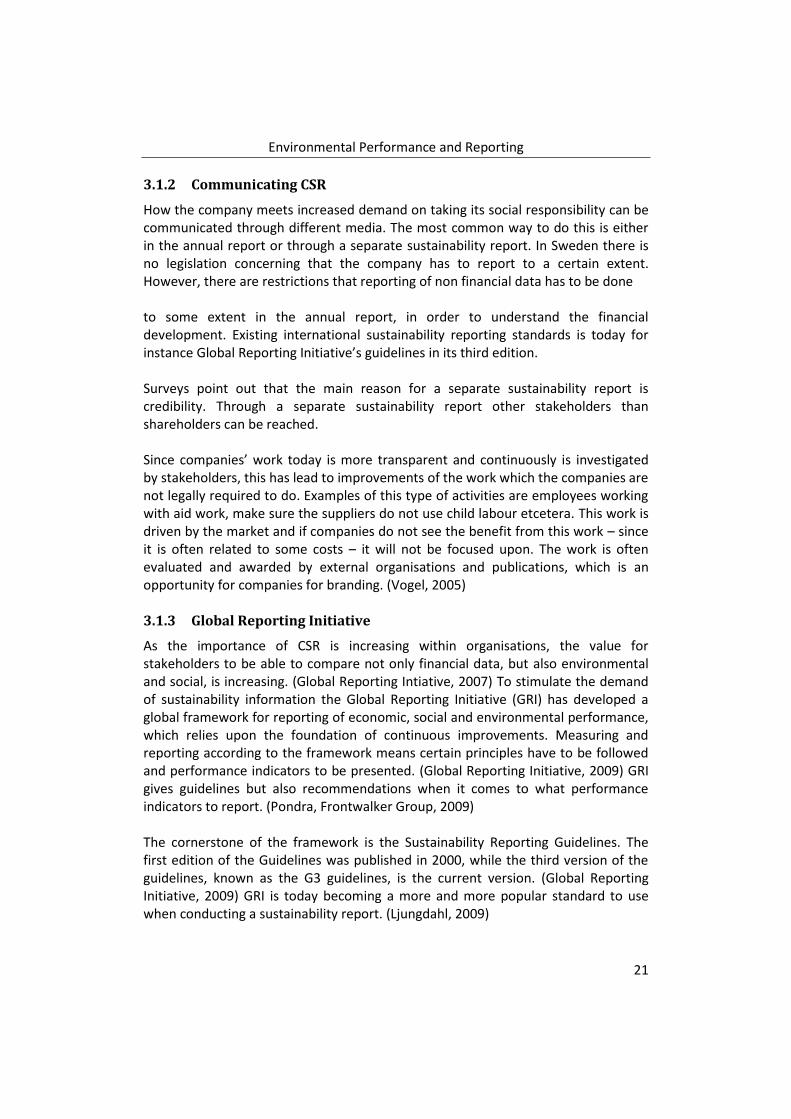
7.1 PART 1: ANALYSIS OF THE WORKSHOPS ........................................................................... 53 7.2 PART 2: RESULT OF THE VALUATION MODEL – GLOBAL LEVEL .............................................. 54 7.3 PART 3: CONTROL OF ENVIRONMENTAL ASPECTS ............................................................... 58
8 QUESTION 3: ORGANISATION .................................................................................... 68
8.1 PROPOSAL .................................................................................................................. 68

Environmental Performance and Reporting
7
9 QUESTION 4: SYSTEM ................................................................................................ 72
9.1 TACTICAL LEVEL TO STRATEGIC LEVEL ............................................................................... 72
10 DISCUSSION ............................................................................................................... 74
10.1 THE WORK METHOD AND VALUATION MODEL .................................................................. 74 10.2 THE QUESTIONNAIRE AS AN INDICATION ........................................................................... 75 10.3 EVALUATION OF KPI’S .................................................................................................. 76 10.4 REPORTING ................................................................................................................. 77 10.5 ORGANISATIONAL STRUCTURE ........................................................................................ 77 10.6 CURRENT SITUATION VERSUS THE FUTURE ......................................................................... 78
11 CONCLUSION ............................................................................................................. 79
12 WORD LIST ................................................................................................................. 81
13 LIST OF REFERENCES .................................................................................................. 83
14 APPENDICES ............................................................................................................... 88

Environmental Performance and Reporting
8
List of Figures Figure 1: Scania’s organisational structure ................................................................................ 9 Figure 2: Where Scania operates ............................................................................................... 9 Figure 3: How Scania’s core values, principles, methods and results are related ................... 10 Figure 4: Work method of the thesis. ...................................................................................... 14 Figure 5: The three core theories the thesis is based on. ........................................................ 15 Figure 6: Illustration of Triple Bottom Line. ............................................................................. 19 Figure 7: The Shewhart cycle ................................................................................................... 24 Figure 8: The PDCA cycle .......................................................................................................... 24 Figure 9: Line of argument through steering documents for environmental performance for the Industrial Operations. ........................................................................................................ 31 Figure 10: The work method developed by the authors. ......................................................... 47 Figure 11: Valuation Model – Global Level. To be used for determination of a company’s global environmental aspects. ................................................................................................. 51 Figure 12: Valuation Model – Local Level for determination of a company’s local significant environmental aspects. ............................................................................................................ 52 Figure 13: Input-output analysis of the workshops’ environmental aspects. .......................... 53 Figure 14: Illustration of the strategic, the tactical and the operational level at Scania. ........ 68
List of Tables Table 1: Explanation of the steps in the PDCA cycle ................................................................ 25 Table 2: Benchmark analysis on companies requested by Scania. .......................................... 38 Table 3: Benchmark analysis on companies awarded by FAR SRS or Deloitte for their sustainability reports. ............................................................................................................... 41 Table 4: Illustration of each parameter’s maximum score and the common denominator that underlies the multiplication of the score in the Valuation Model. .......................................... 50 Table 5: The environmental aspects identified for the workshops and a short explanation for each of them. ........................................................................................................................... 54 Table 6: Result of the Valuation Model – Global Level. Chemicals, Energy use and Waste are ranked as the three most important environmental aspects for Scania’s workshops. ............ 55 Table 7: Matching of Scania S&S’s significant environmental aspects against GRI’s performance indicators. ........................................................................................................... 58 Table 8: Benefits and drawbacks of possible denominators for Scania S&S’s environmental KPI’s. ......................................................................................................................................... 61
List of Diagrams Diagram 1: Total Sustainability Report Output by Country and External Assurance (% occurence in reports published) 2006-2008. ........................................................................... 44 Diagram 2: Total Sustainability Report Output by Country and Reference to GRI Reporting Guidelines (% occurrence in reports published) 2006-2008. ................................................... 44
List of Examples Example 1: KPI with the turnover as denominator. ................................................................. 62 Example 2: Illustration of how KPI is related to employees. .................................................... 66

Environmental Performance and Reporting
9
1 Introduction
This Master thesis is conducted with Scania CV AB as assignment initiator. Scania CV AB and the assignment are introduced in this chapter.
1.1 Scania the Company
Scania CV AB is a Swedish automotive company with a long history that dates back to 1891. The company develops, manufactures and sells vehicles, but also offers its customers service-related products and customer financing. The organisation structure can be viewed in Figure 1 below.
Scania operates in about 100 countries and has more than 35 000 employees (Scania CV AB, 2009). Where Scania operates can be viewed in Figure 2 below. The total operating income 2007 amounted to 12 164 MSEK (Scania CV AB, 2007).
Figure 1: Scania’s organisational structure (Scania CV AB, 2008 p. 18)
Figure 2: Where Scania operates (Scania CV AB, 2008 p. 17)

Environmental Performance and Reporting
10
The vision of the company is to be the leading company in its industry by creating lasting value for its customers, employees, shareholders and other stakeholders and the ambition is to supply the world’s most demanding customers with the most competitive and optimal solutions for their needs. In order to do this Scania’s leadership is strongly focused on values, principles and working methods. (Scania CV AB, 2009) Scania has three core values; Customer first, Respect for the individual and Quality. Based on these Scania is managed by principles and methods. The principles are a way of thinking, while the methods are a way of doing things. So, if the principles and the methods are followed – which means doing the right things right – the result will follow naturally (Jedeur Palmgren, 2009), illustrated in Figure 3. In line with the holistic mindset, focus is put on continuous improvements,
which is the most important part in Scania’s philosophy. (Scania CV AB, 2008) This thesis will focus on Scania Sales & Services (S&S) which is one of Scania’s five units illustrated in Figure 1. S&S consists of distributors, retailers and workshops. There are approximately 1500 workshops of which 450 are fully owned by Scania, referred to as their captive network. The workshops’ main assignment is to serve Scania’s rolling fleet. (Björnberg, 2009) How this can be done combined with an environmental focus is to be clarified throughout this Master Thesis, starting with its background description below.
1.2 Background of the Master Thesis
As the competition has increased over the years, it puts high pressure on companies to do more than the average company. This has led to that innovative companies do more than what is legally required when it comes to the social and environmental perspective. (Öhrlings Pricewaterhouse Coopers, 2008 p. 20) Scania is one company among others that has adapted this trend and is now looking for ways to improve their environmental work. One way to do this is to increase the control of its environmental performance throughout the organisation. (Bjelkesjö, et al., 2008) Focus on sustainability is something requested by the market and is today a factor that can affect the company value. The demand from the market has its origin in transparency, which means actually knowing what the company is doing. Transparency therefore means communicating not only what the organisations focus on, but also what they do not focus on and the reasons for that. (Larsson, 2009)
Figure 3: How Scania’s core values, principles, methods and results are related. (Scania CV AB, 2008 p. 12)

Environmental Performance and Reporting
11
At present, Scania is reporting its environmental performance for the Industrial Operations, which includes Research & Development, Production & Procurement and Franchise & Factory Sales illustrated in Figure 1. For instance it includes follow-up and reporting of energy use, water consumption and waste handling. The result of the environmental performance is shown in Scania’s annual report, Appendix I. The environmental data from the Industrial Operations is currently collected on a yearly basis. The next step for Scania is to expand the existing reporting of environmental performance to the S&S companies. This will lead to control and improvements of the environmental performance, as well as meeting the society’s increased demand on transparency. (Bjelkesjö, et al., 2008)
1.3 Purpose
The purpose is to investigate what to measure and how to control the environmental performance for Scania Sales & Services.
1.4 Question Formulation
In order to answer the purpose the following four questions need to be answered:
1) How do other companies work with environmental performance?
2) Investigation of environmental aspects and how to control them; (a) Which environmental aspects should be focused upon? (b) Which Key Performance Indicators are appropriate in order to control the environmental performance for the Sales & Service companies? 3) How should the environmental performance for Sales & Services be handled organisationally?
4) Which systems for handling the environmental data are available internally at Scania?
1.5 Delimitations
Regarding the investigation of what environmental data that should be reported this will be completed for the S&S companies with focus on the workshops, excluding distributors or retailers. This master thesis only focuses on the captive network, which means workshops fully owned by Scania. The workshops investigated are mainly located in Sweden and considered to be representative for a common workshop. To clarify the extent of what environmental performance that in this case is measured it is the activities performed within the

Environmental Performance and Reporting
12
workshop area. This means for instance the environmental impact of transports to and from the workshop are not included. When recommending how the environmental reporting matter should be handled within Scania, this will be more a general suggestion than a specific suggestion. This also means the recommendation will not be a specific department, but rather what it needs to consider. The ambition is to present an appropriate system for Scania how to report the environmental performance. The analysis will be focused on suggesting a well-functioning information flow in existing reporting systems rather than giving a detailed explanation of the systems that are available on the market. The question of finding an appropriate system is also delimitated to finding a potential system solution concerning only the reporting between the business units and group level. The main reason for this is the high number of different dealer systems between the business units and the workshops. This will be further developed in Chapter 9.
1.6 Content of Chapters
Chapter 2: Method The chapter explains the work method and the methodology of the thesis. Chapter 3: Theoretical Foundation The chapter presents theoretical studies within Corporate Social Responsibility, Environmental Management Systems and Key Performance Indicators, that have been the foundation for the thesis. Chapter 4: Existing Environmental Reporting at Scania The existing situation concerning environmental reporting for Scania Industrial Operations and Scania Sales & Services is described. Chapter 5: Benchmark In this chapter the benchmark analysis is presented; both the benchmark analysis performed on by Scania requested companies, but also the benchmark analysis performed on companies awarded for their sustainability reports. Chapter 6: Work Method for Valuation and Control This chapter explains the work method and the Valuation Model developed by the authors, since the authors during the project realised no general method exists for how to determine a company’s significant environmental aspects or how to control them.

Environmental Performance and Reporting
13
Chapter 7: Environmental Aspects and How To Control Them The work method and Valuation Model presented in Chapter 6 is in this chapter applied on Scania Sales & Services, in order to determine the global significant environmental aspects. Also, key performance indicators connected to the significant environmental aspects are developed. Chapter 8: Organisation This chapter discusses how the environmental work should be handled organisationally at Scania and what to consider. Chapter 9: System This chapter presents a recommendation of which system that may be suitable for the reporting of data from the tactical to the strategic level. Chapter 10: Discussion In this chapter additional aspects and reasoning the authors consider important are discussed. Chapter 11: Conclusion This chapter is a short summary of the result of the thesis and aims at answering the purpose. Chapter 12: Word List Chapter 13: List of References Chapter 14: Appendices

Environmental Performance and Reporting
14
2 Method
In this chapter the method of the thesis is explained, to ensure the validity and enable replication of the thesis. (Nyberg, 2000 p. 98). The purpose of this thesis has been relatively constant from the start phase to the end phase. This has contributed to a solid foundation and to a clear method over time. It has also been an advantage that clear delimitations were set together with the tutor at Scania during the initial phase of the project. The thesis is divided into four Question Formulations; these are carried out in order. The second question is predominant for the thesis. However, it is worth mentioning that the questions are perceived as equally important for Scania, but was needed to be preceded in order. All four questions follow a common pattern consisting of three phases during investigation; theoretical research, empirical research and analysis. The method is visually shown in Figure 4 below. In addition to the used method, the authors have during the process kept in mind continuous improvements, always asking: what can be done to outperform?
Figure 4 also gives a fair representation of how the questions are presented in this report. Firstly, a presentation of the theoretical foundation will give necessary knowledge about the subjects of the thesis. This is followed by Question 1, the Benchmark Analysis. Thereafter an overview of the present environmental performance and reporting at Scania is presented. Scania’s current situation leads to
Sum
ma
ry &
D
iscu
ssio
n
Em
pir
ica
l re
sear
ch
An
aly
sis
Question 2
Em
pir
ica
l re
sear
ch
An
aly
sis
Question 3
An
aly
sis
Em
pir
ica
l re
sear
ch
Question 4
Theoretical Research
Em
pir
ical
re
sear
ch
An
aly
sis
Question 1
The
ore
tica
l co
ntr
ibu
tio
n
Figure 4: Work method of the thesis.
Environmental Performance and Reporting
15
the next chapters that consist of empirical findings and analysis in the frames of Question 2, 3 and 4. The four questions are further discussed and summarised in the chapters’ of Discussion and Conclusion. Lastly, the as the theoretical contribution for this thesis is presented in Chapter 6 and further discussed in Chapter 10.1. To clarify, to enable replication and verify the result of the thesis, it is of importance to explain how the phases have been conducted. Therefore the Theoretical Foundation and Empirical Researches are presented below to describe what the authors have done and how.
2.1 Theoretical Foundation
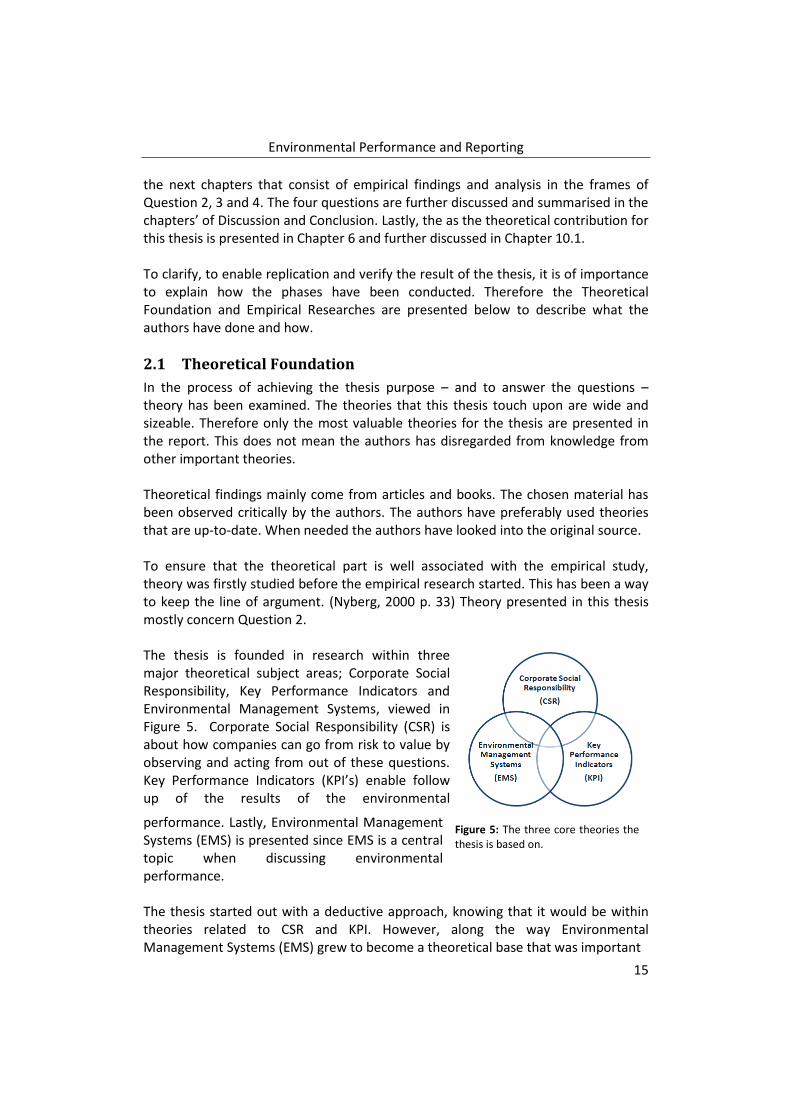
In the process of achieving the thesis purpose – and to answer the questions – theory has been examined. The theories that this thesis touch upon are wide and sizeable. Therefore only the most valuable theories for the thesis are presented in the report. This does not mean the authors has disregarded from knowledge from other important theories. Theoretical findings mainly come from articles and books. The chosen material has been observed critically by the authors. The authors have preferably used theories that are up-to-date. When needed the authors have looked into the original source. To ensure that the theoretical part is well associated with the empirical study, theory was firstly studied before the empirical research started. This has been a way to keep the line of argument. (Nyberg, 2000 p. 33) Theory presented in this thesis mostly concern Question 2. The thesis is founded in research within three major theoretical subject areas; Corporate Social Responsibility, Key Performance Indicators and Environmental Management Systems, viewed in Figure 5. Corporate Social Responsibility (CSR) is about how companies can go from risk to value by observing and acting from out of these questions. Key Performance Indicators (KPI’s) enable follow up of the results of the environmental
performance. Lastly, Environmental Management Systems (EMS) is presented since EMS is a central topic when discussing environmental performance. The thesis started out with a deductive approach, knowing that it would be within theories related to CSR and KPI. However, along the way Environmental Management Systems (EMS) grew to become a theoretical base that was important
Figure 5: The three core theories the thesis is based on.

Environmental Performance and Reporting
16
for the result. For this aspect the authors had an inductive approach. (Jacobsen, 2002 pp. 35-43) After empirical studies the authors identified the need to develop a new model since the models the theories offer today are not considered enough. The model that the authors developed is presented in Chapter 6 and is in the frames of Question 2. To reach verification of the model it was tested on the empirical world. The result is discussed in the chapter of Discussion. (Methodological Reflections, Extended Version, 1994 pp. 3-4)
2.2 Empirical Foundation
The thesis consists of qualitative characteristics. The Questions’ appearance is a proof of this, starting with the words How, What, Where and once more How (Nyberg, 2000 p. 101). The empirical study has been conducted through individual open interviews, group interviews and secondary data such as internal documents, annual reports, web sites etcetera. This has been done in order to get several perspectives of the problems. (Jacobsen, 2002 p. 191)
2.2.1 Primary Data
For the four Questions about 40 individual interviews have been conducted, which mainly have been of the type open individual interviews. The total number of interviews is relatively high, although in the aspect of that the interviews cover all of the thesis’ four questions the number of interviews per question is quite low. Open individual interviews has been suitable because of the relatively low number of interviews per question, but also because it has been of great interest to hear the individual’s opinions. The interviews have been conducted in different ways depending on the situation. As mentioned the major part has been open interviews, though with a determined goal of what to discuss. From the interviews the authors have received a lot of valuable information from skilled persons. Though, the significant information from the interviews for this thesis was subsidence the more interviews the authors conducted, which is common for qualitative approaches. (Jacobsen, 2002 pp. 160-163) Nevertheless, at some occasions semi-structured interviews have been held. This mainly concerned the interviews with the benchmark companies requested by Scania. The questionnaire used during the interviews can be viewed in Appendix II. Also, telephone interviews have been conducted with specialists in the subjects of the thesis, for example with specialists from Öhrlings Pricewaterhouse Coopers and from Lund University. Some of them have been structured, for which the questions can be viewed in Appendix III. However, the major part has been unstructured.

Environmental Performance and Reporting
17
Since the thesis’ result will effect several departments, if Scania wants to act on the recommendations, it has been necessary to conduct a few group interviews to discuss certain questions. This in order to clarify what is best for the group, not only for the individuals. (Jacobsen, 2002 p. 175) All interviews throughout the project have been written out fair and controlled by both of the thesis’ authors. This way possible misunderstandings have been exposed and thereafter discussed with the interviewed person (Nyberg, 2000 p. 106). Workshop Visits To reach an understanding of the workshops’ daily operations within the environmental perspective two longer visits at workshops were carried out. The authors were guided by employees with special skills of the workshops’ environmental work. This information has been very valuable during this project. Questionnaires Two types of questionnaires have been used. The purpose of the first questionnaire was to collect information about a “standard workshop”. The questionnaire was sent to seven workshops. The data from the questionnaires was compiled and carefully observed. This questionnaire can be viewed in Appendix IV. The second questionnaire was established to confirm the authors’ opinion about the stakeholders’ opinions about the different environmental aspects. The questionnaire was filled out by nine specialists within this area. The authors are aware of the risk that these persons are subjective. However, the specialists represent different areas which reduce the risk of an incorrect opinion of the general situation. The questionnaire can be viewed in Appendix V and is further discussed in Chapter 10.2. 2.2.2 Secondary Data
Documents Scania has much material of how the organisation should be handled; steering documents as well as informative documents. These have been of great use to understand how Scania is managed throughout the organisation. To understand and collect information about the companies that have been examined, for the Benchmark Analysis, sustainability/annual reports have been studied. The studied reports are from year 2007 since the reports for 2008 were not published at the time for the information search. Internet Empirical data have also been found through internet, mostly through studying online web pages and sustainability reports for the Benchmark Analysis. To gather interesting information for the thesis, internet has been an effective source.

Environmental Performance and Reporting
18
However, the authors have preferably collected information from sites that are well known and trusted.
2.3 Reliability
The authors’ primary attention was to establish a result that would be replicable. This is referred to as the reliability of the thesis. Since this thesis relies on what is understood during the conducted interviews there is a chance that these people’s opinions could change over time. The authors see this risk as possible, but since they have discussed the outcome of the interviews critically, changing opinions’ impact on the thesis’ outcome in considered as low. Many of the interviewed persons have been met with several times, which has been a way to avoid that the interviewed person would say something that is not true (Bell, 2006 p. 117).
2.4 Validity
Validity is important to consider since it indicates if what is asked for is actually being measured (Bell, 2006 p. 117). Firstly, the authors have at three occasions met the steering group at Scania of the project to discuss the result so far. Another action that has been taken to reach high validity is to send out a preliminary report to a selection of the interviewed persons. Through these validity checks the result the authors have identified has been confirmed. (Jacobsen, 2002 p. 257) To further ensure the validity triangulation has been used. As mentioned above, facts have been gathered from different employees and external specialists. Much of the information that this thesis is based upon is controlled through several interviews or through questionnaires. Studying documents has also been a suitable way to confirm what has been found through interviews. It has been the authors’ intention to confirm what has already been understood. This is what is referred to as triangulation and leads to a high validity of the thesis. (Jacobsen, 2002 p. 258)

Environmental Performance and Reporting
19
3 Theoretical Foundation In this chapter valuable theory for the thesis is explained. Theories this chapter will touch upon is Corporate Social Responsibility, Environmental Management Systems and Key Performance Indicators. Lastly, the authors identified a need for development of these theories. It resulted in a work method and a Valuation Model presented in Chapter 6.
3.1 Corporate Social Responsibility
Corporate Social Responsibility (CSR) can be equalised with words as corporate responsibility or sustainability. CSR related questions are not only focused on social aspects, but also on environmental and economic aspects – all from out of a sustainable perspective. CSR is a way for companies to build trustworthiness among stakeholders. To achieve trustworthiness organisations need to focus on competence, transparency, integrity and sympathy. Competence means not only to announce for how economic growth is reached, but also what is done regarding the environmental and social aspects. This is referred to as Triple Bottom Line (TBL), se Figure 6. TBL means not only reporting the common bottom line performance, but develop it to a line for social performance and a line for environmental performance. Transparency means to be open with how the company acts; the more open the company can be, the more trustworthiness can be achieved. Integrity is about doing things the right way, not fall for taking decisions outside of the company’s action plan. (Borglund, et al., 2009) During the 1980’s companies’ main focus was shareholder value, which later was expanded to include all stakeholders (Measuring Organizational Performance: Beyond the Triple Bottom Line, 2006 pp. 177-191). Satisfying all stakeholders need focus not only on economic value, but also on the environmental and social perspectives (Crane, o.a., 2004 s. 24). The environmental and social perspective that TBL ads to organisational measuring are often unique to each industry and are more complicated to quantify than the classical economic perspective. Therefore it is also harder for external stakeholders to relate to these facts. (Measuring Organizational Performance: Beyond the Triple Bottom Line, 2006 pp. 177-191) Another reason for why the CSR work has expended is the globalisation. Pressure on international companies comes from stakeholders all over the world. (Vogel, 2005)
Figure 6: Illustration of Triple Bottom Line. (Borglund, et al., 2009)

Environmental Performance and Reporting
20
The Environmental Aspect of CSR The environmental perspective includes handling the physical resources in a sustainable way and to reduce the impact on the environment. When measuring, evaluating and communicating it is today of importance for companies to also refer to the organisations’ impact on the environment. Other than increasing stakeholder value, a benefit when handling these issues in daily business is that risks can be proactively handled. This means risks to some extent can be avoided, though, if an accident occurs it can be handled before becoming public when it is too late and would hurt the company’s reputation. (Crane, o.a., 2004 s. 24) During 1990’s the pressure concerning handling of environmental questions increased from stakeholders. A company that acted upon this pressure and hired environmental managers could lead to a stronger position compared to its competitors that did not. Handling environmental questions effectively had the potential to become a competitive advantage. (Global Reporting Intiative, 2007) 3.1.1 CSR Increases Company Value
CSR related work can be viewed upon as something that is combined with future potential value. As the trend to work with these questions is increasing there are still companies that see sustainability reporting as something expensive and something that simply has to be done. Still, responsible investment management with sustainable investments is an area under development that is strongly advancing. Different companies have chosen to act on CSR in different ways. It both depends on to which extent external pressure affects the company, but also whether internal factors contribute. One interesting aspect is to find out how and if CSR work is connected to higher profitability. This is a subject that has been researched and where different conclusions have been drawn. When focusing on CSR related questions and communicating that these are important to the company and employees act from out of these, it can lead to higher profitability. Discussions concerning these questions might not eliminate risks, though lead to an increased control over risks within this area. Other conclusions drawn are that focus has to be in a fair amount on these questions in order to not communicate too high expectations. Also, when a company is profitable it leads to possibilities to work with environmental as well as social questions. The latter conclusion means companies do not become profitable after working with these aspects, but that they already are. (Öhrlings Pricewaterhouse Coopers, 2008 pp. 9-40)
Environmental Performance and Reporting
21
3.1.2 Communicating CSR
How the company meets increased demand on taking its social responsibility can be communicated through different media. The most common way to do this is either in the annual report or through a separate sustainability report. In Sweden there is no legislation concerning that the company has to report to a certain extent. However, there are restrictions that reporting of non financial data has to be done to some extent in the annual report, in order to understand the financial development. Existing international sustainability reporting standards is today for instance Global Reporting Initiative’s guidelines in its third edition. Surveys point out that the main reason for a separate sustainability report is credibility. Through a separate sustainability report other stakeholders than shareholders can be reached. Since companies’ work today is more transparent and continuously is investigated by stakeholders, this has lead to improvements of the work which the companies are not legally required to do. Examples of this type of activities are employees working with aid work, make sure the suppliers do not use child labour etcetera. This work is driven by the market and if companies do not see the benefit from this work – since it is often related to some costs – it will not be focused upon. The work is often evaluated and awarded by external organisations and publications, which is an opportunity for companies for branding. (Vogel, 2005) 3.1.3 Global Reporting Initiative
As the importance of CSR is increasing within organisations, the value for stakeholders to be able to compare not only financial data, but also environmental and social, is increasing. (Global Reporting Intiative, 2007) To stimulate the demand of sustainability information the Global Reporting Initiative (GRI) has developed a global framework for reporting of economic, social and environmental performance, which relies upon the foundation of continuous improvements. Measuring and reporting according to the framework means certain principles have to be followed and performance indicators to be presented. (Global Reporting Initiative, 2009) GRI gives guidelines but also recommendations when it comes to what performance indicators to report. (Pondra, Frontwalker Group, 2009) The cornerstone of the framework is the Sustainability Reporting Guidelines. The first edition of the Guidelines was published in 2000, while the third version of the guidelines, known as the G3 guidelines, is the current version. (Global Reporting Initiative, 2009) GRI is today becoming a more and more popular standard to use when conducting a sustainability report. (Ljungdahl, 2009)

Environmental Performance and Reporting
22
The benefit of basing the reporting on the GRI framework is above all to be able to benchmark the performance against laws and regulations as well as against organisational performance over time, or against other companies. Basing the reporting on GRI also renders it possible to communicate the sustainability work externally and to show stakeholders what the organisation actually does. (Global Reporting Initiative, 2009) When using the framework, the organisation can choose to report on different levels; A-, B- or C-level. A is the highest level, while C is the lowest. The difference in between the levels is not necessarily the amount of facts reported, but to what extent the company has considered what is relevant for them to report. This means that if a company chooses the A level, they need to investigate more performance indicators in the framework than companies that choose B or C level. This leads to that a company reporting on A level has better control of its total environmental performance than companies reporting on B or C level. (Ljungdahl, 2009) The reporting can be externally assured by a third party. If it is externally assured, the chosen level of the report is followed by a +, for example C+. (Global Reporting Initiative, 2009) Assuring the report has the same benefits as assuring the financial result, which among others is a confirmation of that the result is correct and not adjusted to satisfy the stakeholders. (Larsson, 2009)
3.2 Environmental Management Systems
Companies can choose varying attitudes when handling environmental aspects – all depending on whether they see it as a competitive advantage or not and thereby are willing to include the environmental questions in the daily operations. (Ammenberg, 2004 pp. 139-154) To handle internal needs as well as the stakeholders’ requirements, a systematic approach for environmental questions is needed. Therefore environmental management systems (EMS) have been developed, which is a framework for managing, measuring and evaluating an organisation’s environmental work. (Almgren, et al., 2003 p. 23) The two most dominating EMS standards are ISO 140011 and EMAS2. There is no unison background of the standards, but the development depends to a great extent of increased environmental regulations. ISO is an international standard, whilst EMAS is a European standard. (Ammenberg, 2004 pp. 155-160) Introducing EMS in an organisation is voluntary. Even though the overall purpose of adopting a standard is to improve the environmental work and reduce the negative environmental impact, an argument for following an environmental standard is the commercial profitability sound environmental management brings. The profitability
1 International Organization for Standardization
2 Eco-Management and Audit Scheme

Environmental Performance and Reporting
23
derives from resource efficiency, material- and energy flows as well as from image questions. (Ammenberg, 2004 p. 157) Commonly management focus on the economic aspects follows of an introduction of an EMS in an organisation. Therefore a report of the costs as well as the revenues that follows is often requested by management. Costs caused by EMS are time from the employees, consultancy fees, education, and costs for certification, registration and continuous audits, and material such as books and education material. The positive effects are harder to predict and sometimes to quantify. For instance they derive from better customer relations, new customers, better relations with municipals and other stakeholders and more engaged and efficiently working employees. Another positive effect is decreased costs due to less and better handled waste, reduced material use, less accidents (along with less bad publicity), less energy use etcetera. Overall the revenues are meant to exceed the costs. (Ammenberg, 2004 pp. 252-254) If an organisation follows either ISO or EMAS it can be certified, which is a proof of that the organisation fulfils the standard’s requirements and for the management that the environmental work is functioning. In order to be certified audits are needed. There are different types of audits; first party audit which is conducted with internal resources, second party audit which is conducted against companies that are related to the certified company (for instance a supplier) and third party audit which is conducted by an external independent party. Generally, the different types of audit are combined in an organisation since they might have varying purposes. (Almgren, et al., 2003 pp. 29-33) As mentioned above, the use of EMS aims at improving an organisation’s environmental work. Though, a central question for how EMS will be regarded and used in the future concern its trustworthiness. One of the risks is that companies will use an EMS unserious and as a commercial tool, rather than with the purpose of improving the environmental performance. Companies like this will do as little as possible and thereby devastate for the companies who, on the contrary, uses it seriously and as a strategic tool. (Ammenberg, 2004 p. 263) As for other management systems, EMS follows the Plan Do Check Act cycle (PDCA). The idea of using the PDCA cycle as a basis is that the organisations following the standards shall work systematically and structured. (Ammenberg, 2004 pp. 160-161) The PDCA cycle will be further presented below. 3.2.1 PDCA
The PDCA cycle is a model for continuous development of processes. The model is meant to be a continuous feedback loop so that the management can identify and

Environmental Performance and Reporting
24
Figure 8: The PDCA cycle (Balanced Scorecard Institute, 2009)
change the organisation and its processes. The focus of the continuous improvements was initially on production processes and therefore the improvements that the cycle was meant to visualise and develop were on production level. Nevertheless, the model can be used as well on business strategy level. The perception of the cycle originally came from Walter A. Shewhart. (Balanced Scorecard Institute, 2009) The PDCA cycle, initially named the Shewhart cycle, was based on four steps. Each of the steps is illustrated in Figure 7.
When Edward W. Deming, who was Shewhart’s friend and novice, during the 1950’s introduced the Shewhart cycle in Japan, he introduced it as the Shewhart cycle. (Deming, 1986 p. 87) Deming made a simplification of the Shewhart cycle which went into immediate use in Japan, though under the name of the Deming cycle. To illustrate the cycle of continuous improvements during his teaching Deming made a simplification of the model where he called the four steps PDCA, which stands for Plan, Do, Check, Act (see Figure 8). (Balanced Scorecard Institute, 2009) Each of the steps is briefly described in Table 1.
Figure 7: The Shewhart cycle (Deming, 1986 p. 87)

Environmental Performance and Reporting
25
3.2.2 ISO
As mentioned above, ISO 14001 is an international standard for environmental management built on the model PDCA. Regardless of area, ISO’s main principle is continuous improvements. In the 14001-standard it refers to continuous improvements for a company’s environmental performance. The standard is continuously reviewed and if needed revised. (Ammenberg, 2004 p. 158) In addition to the standard supporting documents and technical reports are available, for instance SS-ISO 14004:2004 which describes “General guidelines on principles, systems and supporting techniques” for the ISO 14001 standard. The standard does not tell the organisation direct guidelines or instructions what to do, but rather focuses on the fact that organisation continuously works with its environmental performance. The standard is built upon the five main components described briefly below, of which each component includes certain areas and requirements. (Swedish Standards Institute, 2004 pp. 10-15)
1. Environmental policy: The policy is developed by the top management and is the driver for the organisation’s environmental work. The policy should therefore reflect the management’s commitment and be well communicated to the organisation.
2. Planning: This component includes setting up processes for determination of the organisation’s environmental aspects as well as handling legal and other requirements. Also setting up of objectives, targets and programmes is included in this component.
3. Implementation and operation: Implementation and orientation is a wide component since it includes the aspect of resources, roles and authority which is central in order to perform a successful implementation of an EMS. It also includes handling of competence, training and awareness as internal communication and documentation.
4. Checking: This component includes follow-up of the environmental work, in the aspect of monitoring and measurement as well as evaluation, control and internal audits.
5. Management review: The management review should cover the scope of the EMS and is not necessarily conducted at once ,but can be completed over a period of time. (Swedish Standards Institute, 2004 pp. 16-24)
PDCA Explanation
PLAN Design or revise business process components to improve results
DO Implement the plan and measure its performance
CHECK Assess the measurements and report the results to decision makers
ACT Decide on changes needed to improve the process
Table 1: Explanation of the steps in the PDCA cycle (Balanced Scorecard Institute, 2009)

Environmental Performance and Reporting
26
An ISO-certification can either contain a certification for one unit or for several units that are included in the same organisation. The latter is an “umbrella-certification”, which means a certification for instance is sought from group level while the certificate includes the group as well as the group’s units. Though, in an umbrella-certification not only the group, but all of the units included in the certificate need to undergo audits on a regular basis. (Jedeur Palmgren, 2009) 3.2.3 Environmental Aspects
The existing EMS are based on the concept environmental aspects. According to EMAS and ISO environmental aspects are “elements of an organisation’s activities or products or services that can interact with the environment” (Swedish Standards Institute, 2004 p. 8). The purpose of the concept is to focus on an organisation’s operations in order to understand which activities that causes environmental impact and consequences. Since EMS are tools for management and control of an organisation’s significant environmental aspects a valuation of the environmental aspects have to be conducted in order to find the significant environmental aspects. How the identification and valuation of environmental aspects is completed is central, since this sets the direction of the organisation’s environmental work. (Ammenberg, 2004 p. 165) After the initial identification, analysis, categorisation and if possible quantification of a company’s environmental aspects the next step is the valuation. The valuation is meant to sort out the significant environmental aspects from the environmental aspects. The valuation mainly concerns the operational aspects and risks for accidents, mostly because the organisational aspects are hard to quantify and their environmental impact is hard to define. Both ISO and EMAS set up requirements of a systematic approach when evaluating the aspects, nevertheless, the standards do not offer a method for valuation. Since no accepted methods for valuation exists, this means every organisation has to set up its own model. (Ammenberg, 2004 pp. 181-183) Though, for the method for valuation of the environmental aspects it is important to set up certain criteria the method should have. Examples of common criteria for the method is first of all user friendliness, which means the method should be easy to understand, be a good tool for the judgment of environmental affects and also be time efficient. Secondly the model should be environmentally correct, meaning that the criteria should be well chosen considering the organisation’s environmental impact and also well chosen data for the aspects that are going to be followed up. A third common criterion is the scientific aspect, which brings up the reliability of the data, repeatability and transparency objectivity etcetera. (Ammenberg, 2004 pp. 184-185)

Environmental Performance and Reporting
27
3.3 Key Performance Indicators
There are three different types of performance measurements; Key Results Indicators (KRI), Performance Indicators (PI) and Key Performance Indicators (KPI). These are commonly used in a mixed way and generally viewed on as KPI’s. KRI’s show the result and the health of the organisation and are reported to the senior management team. PI’s tells you what to do. KPI’s point out what needs to be done and will be further described below. (Parmenter, 2007 pp. 1-17) The development in the area of financial control has left the focus on the past and more and more come to focus on the present and the future situation instead. It has gone from having a hierarchical focus to a customer- and process oriented focus, where the control is used as a tool for organisational development rather than just a snapshot of the current situation. In this process key performance indicators (KPIs) have come to play a large role. KPIs are commonly part of a financial model, such as Activity Based Costing (ABC), the Balance Scorecard (BSC) or Vale-Based Management (VBM). Though, KPIs do not necessarily have to be part of a model to be used, which is the reason why the following text focuses on what a KPI is, how it is developed and used. (Andersson, 2009) 3.3.1 What Is a Key Performance Indicator?
A KPI is a simplified picture of the situation. It is meant to illustrate a condition which we are interested in. According to Catasús et al a KPI can be described by the formula: KPI= interest/comparison base. (Catasús, et al., 2002 p. 2) The purpose of a KPI varies. It can have different functions depending on which situation it is used in or what that is a desired achievement. Certainly – and desirably – a KPI can fulfil more than one purpose at the same time. The purposes a KPI can have are commonly divided into the four areas of control, learning, mobilisation and rewarding. Regarding control, the most common feature of this type of KPI is that it tells or alarms about deviations from the normal situation. In order to be able to use this type of KPI a value for the “normal situation” is needed so that the deviation can be compared with something. Though, the organisational learning this type of KPI brings is limited. When it comes to learning, if a couple of KPIs are connected to each other they can be used for organisational learning. This way an organisational phenomenon can be discovered and adjusted.

Environmental Performance and Reporting
28
The purpose of mobilisation KPIs are that they should speak to our senses and thereby lead our actions in a certain direction. The primary purpose of this KPI is to make us think “before the action” rather than the purpose of follow-up and learning. This type of KPI is common at start-ups of companies, for instance in the work of becoming the number 1 on the market. Concerning the fourth purpose this requires KPIs that both are highly verifiable, which means they have to be able to measure, but also that they are hard to manipulate. Likewise it is important to consider potential side effects, since the KPIs will affect what the collaborators in the organisation will prioritise. To avoid side effects control KPIs can be developed. When developing this type of KPIs it is also important to firstly reflect on what the organisational goal is but also which developments phase the organisation is in. (Catasús, et al., 2002 pp. 19-29) Some KPIs are better than others – all depending on the purpose. However, even though a KPI fulfils all of the four purposes listed above there are better or worse ways to achieve this. In order to determine whether a KPI is optimal or not the following ideals should according to Catasús et al be considered: A limited number, Easy to understand, Easy to understand potential improvement, Relevant, Comparable, Interpretable, Apparent owner, Hard to manipulate, Easy to acquire data, Limited side effects, High precision in measurement. (Catasús, et al., 2002 pp. 31-40) 3.3.2 Structure for Development, Use and Evaluation of KPIs
The authors Bourne et al means that the existing theories developed about performance measurement discuss what issues should be measured and how, though lack the aspect of how the implementation should be conducted. Borne et al therefore suggests the implementation can be divided into three phases: (1) the design of the performance measures, (2) the implementation of the performance measures and (3) the use of the performance measures. (Designing, implementing and updating performance measurement systems, 2000 pp. 754-771) Important to bear in mind is that even though the design phase of performance measurements is finished the whole process is not yet brought to its end. The design process is a cognitive process, since it requires the customers’ and other stakeholders’ interests to be translated into business goals and suitable organisational performance measurements. The implementation process on the other hand, is quite mechanic and should be controlled by classical project management tools. Nevertheless, the most important is to continuously update the performance measurements in line with the organisational strategy, since this is what the performance measurements are based on.

Environmental Performance and Reporting
29
(1) System Design There are many thoughts about how KPIs should be designed, what should be included, what they shall reflect etcetera. However, the main aspect when designing KPIs is that they have to match the organisational context (Designing performance measures: a structured approach, 1997 pp. 1131-1152). A common way of designing KPI’s is evaluate an interest in relation to a comparison base, which is explained in the text above. (2) Implementation and Use of Measures During implementation and use of performance measurements and multidimensional measures there are many potential pitfalls. One of the first aspects to focus on how the organisation will react on a change of the reporting processes and also how organisational routines will be affected. It is of importance to be observant to potential obstacles or problems that can arise when starting to use performance measurements. Further, motivate the use of performance measurements in the “right way”, so that the organisation experiences the learning aspect of the performance measurements rather than the use as a tool for control. Also, the measurements should not only reflect conditions based on data and statistics, but also the non-material assets and their impact on the traditional and financial assets. An example of this is the employees’ and the customers’ attitude or perception of a service or suchlike. In order to influence the motivation and engagement for the steering system in the organisation goals related to achieved result should be set up. As a final point, the authors Skoog and Johansson suggests a reward system connected to the steering system should be set up. This, since the most important issue of all to create a successful steering system is that the management supports the system both in word an in acting. (Johansson, et al., 2001 pp. 77-78) (3) Evaluation of Measures To be able to analyse performance measurements it is important to know what the measurement is built up of and underlying factors. To completely understand the measurement the methodology is to break down the measurement into its smallest components and thereafter create knowledge about how organisational changes affect these components. (Catasús, et al., 2002 p. 46) For an organisation it is important to evaluate the performance measurements and their effects. One way to evaluate is to conduct a calculation, even though a calculation is a prediction of the future and therefore may not be fully precise. However, through a calculation the positive effects of a measurement can be

Environmental Performance and Reporting
30
weighed against the negative effects. In order to do this Catasùs et al states that first of all the organisation’s view of the connection between intervention and effect is needed. Secondly, how is the size of the effects going to be quantified? Thirdly, how is the effect going to be valued in financial terms? Lastly, which are the critical assumptions or qualifications? When these questions are answered a calculation can be carried out. (Catasús, et al., 2002 p. 76) 3.3.3 Environmental Key Performance Indicators
Management and reporting the environmental performance does not only benefit the environment, but can for instance lead to reduced costs in form of less usage of raw material, less waste handling with decreased tax costs as a result. To reach sustainability of a business it is essential to have control over the environmental impacts. To have control over environmental risks can affect investment decisions as well as customers, being more confident with the company’s transparency within these aspects. KPI’s simplify the understanding of environmental performance and is also a way to see how costs can be reduced as a result of an increased control. The link between financial performance and environmental performance is a great reason for implementing environmental KPI’s in the organisation. As for all KPI’s, environmental KPI’s also needs to stand for quantitative, relevance and comparability. (Trucost; Department for Environment Food and Rural Affairs, 2006) Using environmental KPI’s lead to control, but also to possibilities for identification of areas where improvements can be done. One definition that is used to visual environmental KPIs is:
Environmental KPI = Measure of Environmental Impact / Measure of Use An example of this is: Energy use / Working hour. (IVL Svenska Miljöinstitutet AB, 2009)

Environmental Performance and Reporting
31
4 Existing Environmental Reporting at Scania In this chapter the current environmental performance and reporting at Scania is presented for the Industrial Operations as well as for S&S.
4.1 Environmental Reporting at Scania
Presently, Scania’s work within environmental reporting is completed only for the Industrial Operations. Externally, this work is communicated through Scania’s Annual Report. To reach a further indication of Scania’s total environmental performance the reporting has to be expanded and also be completed for the remaining units viewed in Figure 1. A first step towards this is done by investigating the possibilities of reporting within S&S. (Bjelkesjö, et al., 2008) Another action towards this is applying the framework of GRI, which is a process that has started. (Hörnfeldt, 2009) The environmental reporting for Industrial Operations is structured from strategic level to operational level. Documents that support decisions from a higher level within the group are constituted and communicated throughout the concerned departments. (Olsson, et al., 2009) This work is to be clarified briefly below. 4.1.1 Environmental Reporting for Industrial Operations
The environmental reporting for the Industrial Operations originates essentially from Scania’s Environmental Policy3. From out of the policy the “Scania Environmental Objectives” for the Industrial Operations have been developed, which is a steering document the production units have to act upon. On a yearly basis, Scania’s Industrial Operations units, fill out questionnaires considering the specific units’ environmental performance which is thereafter sent to Scania CV AB. The specific data that is collected originates from the environmental objectives the units acts from, which means the work is well anchored from the strategic level to operational level within Scania. The flow between the steering documents is illustrated in Figure 9.
3 Scanias Environmental Policy 2007: Scania continuously improves the environmental performance of its
products, processes and services. Business demands and other requirements form the basis for improvement, where fulfilment of legislation is fundamental. Scania's environmental work is proactive, based on a life-cycle perspective and the principle of precaution.
Figure 9: Line of argument through steering documents for environmental performance for the Industrial Operations.
Environmental Policy
Environmental Objectives
Questionnaire
Scania Strategic Update
“One Pager”
Environmental KPI’s

Environmental Performance and Reporting
32
As the questionnaire is based on the objectives, Scania CV AB’s demands are included in the questionnaire. However, since the units always have to meet local rules and regulations as well, data is also measured locally which is not always reported to group level. At every unit there is one person who has the role as Environmental Coordinator. In the production units the environmental thinking is integrated in the daily operations and each unit is responsible for its own reporting. This is well aligned with Scania’s core values. A special function, Environmental Protection, within the unit Industrial Real Estate Services, is coordinating the data of the environmental performance for the Industrial Operations. 18 units’ reports are observed and confirmed by Environmental Protection on an annual basis. This work is done manually which is quite time consuming. However, a high quality of the final compiling is obtained since errors and deviations can be discovered. The data reported in the questionnaires is connected to KPI’s in the document called Strategic Update/”One Pager”. The document explains the business unit’s management strategy. The “One Pager” is well-known and the strategy and directives from the board has been implemented successfully with the document as a support in the daily work. (Olsson, et al., 2009) At present all of Scania’s production units are certified according to ISO 9001 and ISO 14 001 (Jedeur Palmgren, 2009). To reach further control over the production units’ environmental performance it is of importance to be able to influence this work. This is mainly done through Blue Rating, which is an evaluation program for the production units. (Webb, 2009) 4.1.2 Environmental Reporting for Sales & Services
Due to organisational changes within Scania, S&S has a relatively new structure. Back office like IT, Assistance and Education, is now support functions within S&S so that the business units, which include retailers and workshops, can focus on selling and services. (Af Sandeberg, 2009) Aligned with this, focus has also been on establishing steering documents for the organisation to follow. A “One Pager” for S&S, which is recently developed and communicated, is an example of a document. (Bjelkesjö, 2009) One document that has been present for some time is Dealer Operating Standard (DOS). DOS is a way for Scania to ensure that workshops can meet the customer requirements. The document consists of 14 different polices, where the fourteenth concerns how workshops should work with environmental performance. This means an increased focus on environmental performance for the workshops and it should be included in the daily work. To make sure that this document is followed Scania has DOS-generals which perform audits. (Lindström, 2009)

Environmental Performance and Reporting
33
To reach control over Scania’s entire environmental performance it is of importance to report what takes place within S&S. One of the actions to achieve this is the establishment of the document “Environment and Health & Work Environment within Sales and Services”4, where environmental aspects have been included. (Bjelkesjö, et al., 2009) The guidelines can be viewed in Appendix VII. Presently, no environmental data is reported from the S&S companies to group level. Though, the environmental aspects are considered from out of local restrictions, which mean the workshops follow and fulfil local requirements. For Swedish retailers this for example means reporting facts about chemical usage or handling of waste disposal to municipalities. (Erickson, 2009) Though, to reach the same outcome of environmental reporting within S&S as for P&P is more complicated due to the higher number of units; about 1500 units of which 450 are in the captive network. On the other hand, the units are smaller than and not as complex as the industrial units. What to focus on and what to measure for S&S is summarised in the “One Pager”, which is similar to the “One Pager” for P&P. (Björnberg, 2009) The Guidelines “Environment and Health & Work Environment within Sales and Services” can be compared to Environmental Objectives within P&P. However, since the document for S&S is produced separately it does not have the same connection as can be found within in P&P between the Strategic Plan and the Environmental Objectives. (Bjelkesjö, et al., 2009) For the S&S no unison decision regarding ISO certification for the workshops is taken. However, an investigation of S&S’s units showed that approximately 17% of the units are ISO 14 001 certified. (Bjelkesjö, 2009) Scania has considered certifying the workshops with an umbrella certification in the future (Jedeur Palmgren, 2009).
4 Internal name of the document: STD4338en

Environmental Performance and Reporting
34
5 Question 1: Benchmark In this chapter the conducted benchmark is presented. The benchmark consists of two parts. The first part is conducted on by Scania requested companies and has focus on how the companies work with environmental questions. The second part is conducted on companies awarded for their sustainability reporting, with focus on how other companies communicate environmental performance.
5.1 Introduction Benchmark
The first part is conducted on four companies; Toyota, Volkswagen, Statoil and OK-Q8. These four companies’ work with environmental performance has been compared with Scania Sales & Services’ environmental work. The reason for extending the requested part of the benchmark is that the actual work with environmental performance can differ from what is communicated. For example visits at Scania’s workshops show a structured way of dealing with the environmental questions, but this is fairly communicated externally. The second part of the benchmark analysis is conducted on best-in-class companies that all have been awarded for their sustainability reporting. Focus on the second part is what is communicated through their sustainability /annual reports. The benchmark analysis, both parts, is conducted by an evaluation of parameters based on the PDCA cycle5. Much work within the environmental perspective is structured with this as a starting point, for example the ISO standards (Swedish Standards Institute, 2004), which is used within Scania. Another reason is that continuous improvements are Scania’s philosophy, which is the concept of PDCA. From the steps Plan, Do and Act in the PDCA cycle parameters have been identified that the companies have chosen to communicate through their sustainability reports. However, no parameter in the benchmark is based on the step “Act” in the PDCA cycle, since this action includes decisions of changes needed to improve the processes, which is commonly not reported in the sustainability reports. The parameters are briefly presented below: PLAN
Communicated Environmental Strategy/Policy: Does an environmental strategy/policy exist? Has the work started? Does Management focus on these questions?
Quantified Environmental Goals: Are any targets for the environmental performance set? Does the company work for improvements?
Communicated Focus Areas: Does the company know what is important for its activities? About the focus areas the companies commonly have set up a
5 PDCA stands for Plan Do Check Act

Environmental Performance and Reporting
35
couple of areas which they from an environmental perspective will focus upon. These areas are generally the organisations’ aspects that have the largest environmental impact.
DO
Environmental Education for Employees: Does the strategic work become reality among the employees?
Separate Sustainability Report: Does the company want to signal additional information with a separate sustainability report? Is the company’s work with environmental questions intended for several stakeholders?
GRI Reporting: Are companies performing their sustainability work in the words of GRI? The benefit of using the GRI framework is among others that the companies easily can benchmark the organisational performance with respect to laws, norms, codes and others, but also commit to sustainable development. (Global Reporting Initiative, 2009)
DO/CHECK
Environmental Management Systems: Is the work structured and controlled through an EMS?
CHECK
Quantified Environmental Performance: Is the result followed up? If a company can communicate the environmental performance this means the company has an existing reporting of the performance in numbers and figures, which thereby enables follow-ups.
Financial Analysis of Environmental Work: Is the performance translated into financial figures?
The companies have been evaluated on the parameters on a colour scale, where green symbolises yes, yellow symbolises partly and red symbolises no.
5.2 First Part: By Scania Requested Companies
The purpose of the first benchmark, which was carried out on Toyota Sweden AB, VW Group Sverige AB, Svenska Statoil AB and OK-Q8 AB, is to analyse how far companies with service networks have come in their work with environmental performance. This benchmark is based on both interviews and material accessible on the web. The reason why Scania have chosen these four companies is mainly since the companies’ businesses include service networks, which is similar to the operations of S&S. Regarding Toyota Sweden AB and VW Group Sverige these have the same task as the retailers within S&S. For Svenska Statoil and OK-Q8 their service stations have the same task as the workshops within S&S. The service networks for these companies consist of many units, as for Scania. This is one challenge that Scania meets, and therefore of interest to look in to when benchmarking against other companies.

Environmental Performance and Reporting
36
Toyota Sweden AB Toyota Sweden is a marketing and sales company for the brands Toyota and Lexus in Sweden. (Toyota Sweden AB, 2009) One of Toyota’s five foundation pillars is being “Environmental Leader”, which since long time has put pressure on continuous improvements of the environmental performance at all units. In Toyota Sweden AB approximately 130 independent retailers are included. In order to be a certified Toyota retailer the Swedish office has developed “Toyota’s 8 Environmental Steps”, which are principles the retailer have to fulfil. Following Toyota’s principles corresponds to meeting approximately 75% of the ISO 14 001 standard. At present about 20% of the retailers are ISO 14 001 certified on a voluntary basis, while the remaining 80% are following the environmental principles. Though, the vision is that 100% of the retailers are ISO 14 001 certified6. Each retailer has one environmental coordinator. This person is responsible for the contact regarding environmental performance and reporting to the Swedish head office, but also attends yearly seminars and workshops for all of Toyota’s environmental coordinators in Sweden. The only data that Toyota Sweden currently reports to the Toyota Motor Europe is the environmental performance for the head office in Sundbyberg. Data reported is energy consumption, water consumption and paper consumption. However, in the near future the retailers will also be included in the environmental reporting to Toyota Motor Europe. The data reported from the retailers will be collected through an online form that is to be filled out by the environmental coordinators. Which data that is to be reported is decided on a global level. The next step for Toyota is to include environmental reporting for the retailers in the European Sustainability Report, which probably will be reality within a year’s time. (Boman, 2009) VW Group Sverige AB VW Group Sverige is a wholly-owned subsidiary company to Volkswagen AG and is the largest importer of cars on the Swedish market. The environmental work that has been conducted so far is the development of an environmental policy and environmental goals for the general agent. The environmental goals are followed up for the general agent and this unit is also certified by ISO 14 001. VW Group Sverige has about 180 distributors. A few of the distributors have chosen to certify their units by ISO 14 001. Also some environmental education, like eco-driving and safe handling of chemicals, is carried out for the distributors. The work with environmental performance and reporting for the distributors is something that VW Group Sverige has started thinking about, for example what is needed and how to perform it. (Elgtorp, 2009)
6 The certification should be per retailer – not through an “umbrella-certification” for all the
retailers in Sweden.

Environmental Performance and Reporting
37
Svenska Statoil AB Svenska Statoil is a provider of fuels with about 450 full-service stations on the Swedish market. At present the company has a structured reporting of accidents and “non-regular” activities from the stations, though, the reporting of normal conditions (such as monthly energy consumption) is not yet at place. The company has a communicated environmental policy and environmental goals that so far only are internally communicated. Statoil are today working with how to collect the data from the service stations and how to perform a valuable follow-up. (Falkenek, 2009) OK-Q8 AB OK-Q8 is Sweden’s largest petroleum company, with a service network consisting of about 900 service stations (OK-Q8 AB, 2009). The management of the company has decided to put focus on environmental questions. Environmental performance and reporting has been on the agenda for the past five years, though the environmental management systems and systems for collection of environmental data has been up and running for only two years. Previously, each service station had one environmental representative. This person mainly had the role of increasing the environmental knowledge and awareness at the station, and also reporting attitudes, rather than environmental numbers and figures, to group level. The environmental representatives largely contributed to the situation and awareness of today. Presently, data of for instance emissions, waste separation and environmental awareness, is collected from the stations, which is then followed up at group level. The data is the basis for the quantified environmental goals that is to be achieved. However, the environmental goals are poorly communicated to the stations even though the awareness of the importance of environmental questions is relatively high at this level. (Liljebladh, 2009) 5.2.1 Analysis Requested Companies
The benchmark focuses on Scania’s Sales & Services network, which is compared to the requested companies, all of them businesses that include some kind of service network. The benchmark does not include the companies’ production units. Below, Table 2 which evaluates the companies from out of the parameters earlier presented communicates a synoptic view of the present situation when it comes to work concerning environmental performance. Thereafter a clarification of the result will be presented from out of the parameters.

Environmental Performance and Reporting
38
Pro
jec
t In
itia
tor
Sc
an
ia
Sa
les
&S
erv
ice
s
To
yo
ta S
we
de
n
AB
VW
Gro
up
Sv
eri
ge
AB
Sv
en
sk
a S
tato
ilO
K Q
8
Ch
em
ica
ls,
Wa
ste
,
Oil
se
pa
rati
on
DO /
CHECK
En
viro
nm
en
tal E
du
ca
tion
fo
r E
mp
loye
es
GR
I R
ep
ort
ing
Eva
lua
tio
n P
ara
me
ters
Re
qu
es
ted
Be
nc
hm
ark
Co
mp
an
ies
Co
mm
un
ica
ted
Fo
cu
s A
rea
s
Se
pa
rate
Su
sta
ina
bili
ty R
ep
ort
Co
mm
un
ica
ted
En
viro
nm
en
tal
Str
ate
gy/
Po
licy
Qu
an
tifie
d E
nvi
ron
me
nta
l Go
als
Fin
an
cia
l An
aly
sis
of
En
viro
nm
en
tal W
ork
En
viro
nm
en
tal M
an
ag
em
en
t S
yste
ms
PLAN DO CHECK
Qu
an
tifie
d E
nvi
ron
me
nta
l Pe
rfo
rma
nc
e
Table 2: Benchmark analysis on companies requested by Scania.

Environmental Performance and Reporting
39
Of the interviewed companies Toyota can be said to be the absolute leader within the area of environmental performance and reporting. The company’s environmental work is well developed, which to a large extent originates from a strong management focus on environment. This as well as the fact that environmental data is collected on a yearly basis from the Swedish service network, implies an existing channel for the coming reporting is already set up. This will simplify the coming work. Though, OK-Q8 is also in the front line. Their environmental awareness is the reason for this. The main issues for OK-Q8 now are to handle the communication of environmental aspects, goals etcetera and secondly the development of a common system for collection of the data. (Liljebladh, 2009) Management Focus Common for Toyota Sweden and OK-Q8 is a management focus on the environmental aspects and a willingness to make the environmental questions, awareness and work an integrated part of the organisation as well as in the operational work. Responsibility Another common aspect of the two companies is the appointing of environmental coordinators at the stations, which means each station has one person responsible for the environmental questions. By addressing the responsibility to one person – instead of saying “it’s on everyone’s responsibility” – the environmental questions cannot be neglected, but are also integrated in the daily operations. Addressing the responsibility of reporting of environmental performance is something that also is requested by ISO 14001. (Webb, 2009) Time Toyota and OK-Q8 have been working with the environmental questions and reporting for their service stations during 5-10 years. To create knowledge and awareness among the employees at the stations is a long process that cannot be done in a short time. This has been one of the large issues for the companies, since the employees are the ones that have to get on the track in order to improve the environmental performance of the stations. Continuous reminders, knowledge and pressure as well as patience are the key words for awareness and engagement from the employees. Important to point out is also to get feedback on what is measured so that employees can be a part of this process and also have the possibility to affect the result. Regarding Scania’s position compared to the four interviewed companies, Scania S&S is neither best nor worst when it comes to environmental performance and reporting. As mentioned Toyota and OK-Q8 are the ones that Scania can learn from,

Environmental Performance and Reporting
40
especially within Management Focus, Responsibility and Time. Statoil and Scania are in a similar position, putting up a strategy for improving the work with environmental questions. For VW Group Sverige a lot of work is left to do since no environmental requirements at present are put on these (apart from local regulations). This is something that they are aware of. The work within S&S for environmental performance and reporting has already started by the development of environmental guidelines, which means the company is heading in the right direction. Besides, the units within the S&S are already fulfilling the local legislations, which means the next step is continuous improvements as well as reporting the work to group level.
5.3 Second Part: Communication of Environmental Performance
The purpose of the second part of the benchmark is to see how “best-in-class” companies regarding sustainability reporting communicate their environmental performance compared to Scania. The analysed companies have been rewarded by either FAR SRS or by Deloitte. The rewards are based on the companies’ entire sustainability report. However, this benchmark focuses only on evaluating the environmental part of the companies’ sustainability report (not the economic or social aspects). FAR SRS rewards sustainability reports in the three categories best listed company (Sandvik), best state-owned company (Vin & Spirit Group) and best privately owned (Alltransport i Östergötland and Folksam)7. Deloitte on the other hand, rewards the three best companies for their sustainability reports independent of the ownership structure, 2007 this was SAS, Stora Enso, Trelleborg and Holmen8. To clarify what is communicated for Scania CV AB as a group and what is communicated for Sales & Services in the annual report these aspects are shown separately in two columns of the valuation. The result of the benchmark analysis can be viewed in Table 3 below.
7 2007 the price for best privately owned was shared by the two companies Alltransport i
Östergötland and Folksam. 8 2007 the first price was shared by the two companies SAS and Stora Enso.

Environmental Performance and Reporting
41
Scan
ia C
V A
BSc
ania
Sale
s&Se
rvic
es
San
dvi
kV
in &
Sp
rit
Gro
up
Allt
ran
spo
rt i
Öst
erg
ötl
and
Folk
sam
SAS
Sto
ra E
nso
Tre
lleb
org
Ho
lme
n
Ener
gy u
se, O
rgan
ic
solv
ent,
Was
te
Mat
eria
l, En
ergy
,
Wat
er, B
iolo
gica
l
div
ersi
ty, E
mis
sio
ns,
Was
te
Ener
gy-
and
reso
urc
e ef
fici
ency
,
Org
anic
pro
du
cts,
Car
bo
n o
ffse
ttin
g
Emis
sio
ns,
En
ergy
,
Wat
er
Car
bo
n d
ioxi
de,
Oth
er G
reen
ho
use
gase
s
Emis
sio
ns
to a
ir a
nd
wat
er, W
aste
Mat
eria
l, En
ergy
use
, Use
of
Ch
emic
als
Emis
sio
ns
to a
ir a
nd
wat
er, W
aste
DO /
CHECKCHECKPLAN DO
Fin
anci
al A
nal
ysis
of
Envi
ron
men
tal W
ork
Envi
ron
men
tal M
anag
emen
t Sy
stem
s
GR
I Rep
ort
ing
Qu
anti
fied
En
viro
nm
enta
l Per
form
ance
Aw
ard
ed S
ust
ain
abili
ty R
epo
rts
20
07
by
Del
oit
teA
war
ded
Su
stai
nab
ility
Rep
ort
s 2
00
7 b
y FA
R S
RS
Eval
uat
ion
Par
amet
ers
Sep
arat
e Su
stai
nab
ility
Rep
ort
Co
mm
un
icat
ed E
nvi
ron
men
tal
Stra
tegy
/Po
licy
Envi
ron
men
tal E
du
cati
on
fo
r Em
plo
yees
Qu
anti
fied
En
viro
nm
enta
l Go
als
Co
mm
un
icat
ed F
ocu
s A
reas
Table 3: Benchmark analysis on companies awarded by FAR SRS or Deloitte for their sustainability reports.

Environmental Performance and Reporting
42
5.3.1 Analysis Awarded Companies
If comparing the reporting for Scania CV AB with the awarded companies it is approximately equivalent. All of the researched companies except Folksam have a developed environmental strategy/policy, quantified environmental goals, communicated focus areas as well as a quantification of environmental performance. This can be viewed in their sustainability reports. It is mainly the DO-parameters that differs Scania from the rewarded companies, since these for Scania are fairly communicated. One surprising aspect is the low reporting of environmental education for the employees. If a company claims to be interested in environment, education should be a natural way to spread knowledge and insight about the company’s environmental attitude and possible improvements internally. Still, this does seem to be a trend among the companies. Environmental education exists within Scania, but is not communicated (Hörnfeldt, 2009). If this would be communicated Scania would be step ahead of many of the awarded companies. GRI is a framework Scania has decided to adapt during 2009 and the work is under progress (Hörnfeldt, 2009). The fact that Scania has chosen to follow GRI should be communicated in the annual/sustainability report in order to show stakeholders their willingness to focus on not only economic aspects, but also on social and environmental. The trends within GRI are further presented below in Chapter 5.4. Many of the awarded companies have a separate sustainability reports. The fact that some does not indicates that this is not a requirement to perform a best-in-class sustainability report. It can as well be part of the annual report. Though, the intention should be to reach additional stakeholders by providing information about the environmental aspects. Environmental management system is an area the companies have adapted and typically communicate. The most common environmental standard among the evaluated companies is ISO 14 001. The reasons for using an EMS as well as how it is used vary, but what is common across the users is that they are devoted to continuous improvements of the environmental performance. Concerning the financial aspects of environmental performance the majority of the companies do not declare for neither investments nor costs or revenues related to the organisation’s environmental work. In the external reporting of the environmental performance Scania S&S is not included. So, when comparing what is communicated regarding environmental performance for S&S the reporting differ substantially from the awarded companies. Therefore, from a communication perspective there is a possibility for Scania to be

Environmental Performance and Reporting
43
able to make some improvements. When comparing what the environmental work for S&S is in Table 2 with what is communicated in Table 3, it can be seen that what is done is more than what is communicated. This means that Scania does not take full advantage of the chance to promote themselves for their environmental work. A development of the reporting firstly means reporting the work that is actually completed, this in order to give a true picture of the company and ongoing projects to its stakeholders. Even though environmental reporting for S&S’s workshops is not in place yet, Scania is actually better in this area than many other players. By communicating the work that is actually done – such as waste and chemical handling that fulfils local legislations, some existing environmental management systems certifications etcetera – stakeholders will get a fair picture of Scania as the responsible company it is as well as the employees at the workshops can view their contribution to the overall result. The majority of the awarded companies are heavy industries that during many years have been forced to control its environmental performance due to legal requirements. The reporting of environmental performance for these may therefore be easier since the control mechanism already exists within the organisation. For these companies the challenge now is to improve the environmental performance, but also to improve the reporting by for instance including the financial aspect. For Scania this is the challenge for the reporting of the Industrial Operations. However, for organisations which not have been legally required to report its environmental performance before, the first step is to obtain control of the environmental performance before starting to communicate it externally. This is the dilemma for Scania regarding its S&S units.
5.4 Trends within Sustainability Reporting
At present, sustainability reporting is an activity that in Sweden is mostly undertaken by large companies. The leaders in the field of sustainability reporting are companies with a long history of reporting – such as forestry, engineering, energy and transportation – a reporting which to some extent depends upon the legislations these companies are obliged to follow. The number of sustainability reports in Sweden 2007 had an all time high record, even though Sweden is still behind many other countries in Europe. (FAR SRS, Larsson, Lars-Olle, Öhrlings Pricewaterhouse Coopers, 2007) Among the reporting companies there has been an increase in the interest of the GRI Guidelines for Sustainability Reporting. Another trend is an increase in the number of externally independently assured sustainability reports, nevertheless this number is still very low. (FAR SRS, Larsson, Lars-Olle, Öhrlings Pricewaterhouse Coopers, 2007)The advantage of external assurances of the reports is about the

Environmental Performance and Reporting
44
same as for financial reports, which means the communicated material has been controlled and thereby has a higher degree of credibility. An externally assured sustainability report can therefore not be accused of only being a commercial material. (Larsson, 2009) The trends are summarised in Diagram 1 and 2 below.
Diagram 1: Total Sustainability Report Output by Country and External Assurance (% occurence in reports published) 2006-2008. (FAR SRS, Larsson, Lars-Olle, Öhrlings Pricewaterhouse Coopers, 2007)
Diagram 2: Total Sustainability Report Output by Country and Reference to GRI Reporting Guidelines (% occurrence in reports published) 2006-2008. (FAR SRS, Larsson, Lars-Olle, Öhrlings Pricewaterhouse Coopers, 2007)

Environmental Performance and Reporting
45
GRI, SustainAbility and KPMG has conducted a joint study which shows that 9 out of 10 readers of sustainability reports are influenced of the information in the material, of which 85% gains a more positive opinion of the company. This means sustainability reports help strengthen a company’s brand name. The fact that sustainability reporting contributes to a company’s value is strengthened by Professor Lars Hassel at Umeå School of Business and Åbo Business Academy who states that systematically working with CSR issues have an impact on a company’s value. (FAR SRS, Larsson, Lars-Olle, Öhrlings Pricewaterhouse Coopers, 2007) According to Lars-Olle Larsson sustainability reporting has only begun. As more and more companies adapt this, especially listed companies, the trend of GRI reporting will spread. The companies will realise GRI is not only a new way of reporting, but a management tool – a method to get a holistic view of the company and its economic as well as its social and environmental questions. If a company makes thorough and proper initial analyses and is willing to be transparent, then change and improvements will follow as a result. (Larsson, 2009)

Environmental Performance and Reporting
46
6 Work Method for Valuation and Control
During the process of answering Question 2 the authors realised a work method was required. Therefore the authors combined the studied theory with empirical findings which led to an overall work method and a Valuation Model for valuation of environmental aspects. The process and the model are presented in this chapter, but also further discussed in Chapter 10.1.
6.1 Work Method
After studying theory and achieving knowledge about companies’ way to meet the questions concerning environmental performance, the authors identified a need of a generally accepted and structured method for finding a company’s significant environmental aspects. Companies tend to put much effort into building their own model9, instead of adjusting a universal one. A common suggestion on the market would simplify companies’ work when it comes to environmental reporting of the significant aspects. The authors saw this as an interesting challenge and therefore developed a working method which includes a general model for valuation of a company’s environmental aspects. The work method is based on theoretical findings together with empirical findings. The three main subjects – CSR, EMS and KPI’s – has been the base and together form the model that the authors suggest companies to use when evaluating a company’s environmental aspects. The work method takes its starting point in the theory of CSR and the fact that excluding the environmental perspective from the everyday business is connected with possible risks. Focusing on these questions can increase value for companies and for the society as well. What the companies need to discuss is on what level the work should be performed that could be appropriate; in the end of the day they need to act upon their core business. It is important that the company does not communicate something that they cannot carry out; this could lead to too high expectations from stakeholders and impossibility to realise these (Öhrlings Pricewaterhouse Coopers, 2008). To be able to work with environmental questions it is beneficial to have an EMS, which leads to the next theory. EMS is a structured way of handling environmental questions and suggests companies to identify its significant environmental aspects. It is also important to find KPI’s that does not only measure, but also indicated how changes can be made. This part of the method that leads to the third theory is also
9 The authors have discussed this dilemma with Trelleborg AB, Alltransport i Östergötland AB
and Scania CV AB.

Environmental Performance and Reporting
47
important to consider. The performance indicators suggested by GRI might not be the most suitable for the company, depending on what business it performs. To find the proper KPI’s it is important to have a discussion on what would be suitable for the individual company. Combining these theories shape the foundation of the work method. It is a general method that can suit many different companies in different business, global as well as local. An overview of the working process and its use is presented in Figure 10.
Figure 10: The work method developed by the authors.
The method consists of three parts which shortly will be explained below: Part 1: Identification of the Company’s Environmental Aspects What is your company doing that can affect the environment? Analyse the company’s activities from out of an environmental perspective in order to find the environmental aspects. Step one will not be further explained in this thesis, but can for example be illustrated by an input-output analysis. Part 2: Valuation of the Company’s Environmental Aspects It is important for the company to focus on the right things. The Valuation Model is for global companies a two-step model, but for local companies a one-step model.
CSR
EMSKPI
Environmental performance is one part of the company’s sustainability and as important to communicate as economic and social performance.
A company’s environmental work is structured by the use of an EMS.
It important to control and measure to reach desired environmental performance, which can be achieved by KPI’s.
GRI
KPI’s
Valuation Model for valuation of environmental aspects in order to determine the significant environmental aspects so the company knows what to control and what to report.
Outcome of model shows what aspects to report. If following GRI, the framework suggests what to report about each aspect from the Valuation Model.
For internal control and follow up, but also to be able to communicate the environmental performance, KPI’s are developed from out of the outcome of the Valuation Model and what is decided to be reported according to GRI.
Analysis of activities Analyse the company’s activities from out of an environmental perspective, in order to identify the environmental aspects.
Basis
Part 1
Part 2
Part 3
Result Ranking
Environmental aspects in the
workshops
Sco
re E
nvi
ron
men
tal O
bje
ctiv
es
Mu
ltip
lied
Sco
re E
nvi
ron
men
tal O
bje
ctiv
es
Co
st
Vo
lum
e
Sco
re Im
po
rtan
ce
Mu
ltip
lied
Sco
re Im
po
rtan
ce
Sco
re o
pin
ion
s
Mu
ltip
lied
Sco
re S
take
ho
lder
s
Tota
l Sco
re
Ran
kin
g En
viro
nm
enta
l Asp
ects
- F
rom
mo
st t
o le
ast
imp
ort
ant
Energy use
Water use
Material
Chemicals
Emissions to air
Emissions to water and soil
Waste
Accidents
ISO 4.3.1.5 (c)
UN21 Importance Interested Parties
Global Environmental Objectives ISO 4.3.1.5 (a)

Environmental Performance and Reporting
48
The Valuation Model has been formed and tested as an ongoing process during the thesis. The development and how to use the Valuation Model is presented in this chapter, while it is applied on Scania in Chapter 7. Part 3: Development of KPI’s to Control the Significant Environmental Aspects It is not only important to know the company’s significant environmental aspects but also to control them so that improvements can be achieved. This is preferably achieved by connecting them to KPI’s. The KPI’s can also be connected to GRI since this is a useful framework for reporting that also can help the company to improvements in its environmental work.
6.2 Development of the Valuation Model
After Part 1 of the method is completed and the company has identified its environmental aspects, the Valuation Model will determine which of these that are considered as the company’s significant environmental aspects. How often a valuation of the company’s environmental aspects should be completed may depend on certifications or internal requirements, but is for instance completed once a year. The valuation parameters in the Valuation Model will now be explained. 6.2.1 UN21
The valuation of the environmental aspects has its starting point in relating the aspects to the global environmental objectives, UN 21. By relating the environmental aspects to the global environmental objectives it is visible how the environmental aspects identified for the company affect the global environment. To reach the global objectives, individuals as well as companies and the society have to take its responsibility, which is the reason for why this parameter is included in the Valuation Model. The reason for including these in the model is therefore to visualise how the company’s operations affect the environmental goals and what it should focus on in order to reduce the negative environmental impact and be part of the work in achieving the global environmental objectives. The environmental aspects are analysed on how they affect each of the global environmental objectives. This appraisal only needs to be conducted seldom since the result should not vary over the years as long as the company’s operations do not change dramatically or the objectives. If a global environmental objective is affected by the workshop’s environmental aspect it receives 1 point in the Valuation Model – if not it receives 0. This means the maximum score one of the company’s environmental aspects can get in the matching against the global environmental objectives is 14.

Environmental Performance and Reporting
49
6.2.2 ISO 14001
Thereafter the parameters in the evaluation are based on the standard SS-ISO 14004:2004, which recommends that Environmental criteria, Legal requirements and Interested parties should be considered when determining the significant environmental aspects. Therefore, the model and the valuation proceed from these three parameters. Environmental Criteria For the environmental criteria, the importance of the aspect will be evaluated by taking its relative cost and importance into account. This in order to show the aspects’ size and influence on the daily activities in the company. Each aspect is evaluated on a scale from 1 to 5 both concerning the cost and the volume. 1 represents low cost or volume and 5 represents high cost or volume. This means the maximum score for the importance of an environmental aspect is 10. Legal Requirements Legal requirements will take into account the scope of legislations related to the aspect. The more regulations the environmental aspect is surrounded by the more important is it to have control of it. Each aspect is evaluated on a scale from 1 to 5, where 1 represents low degree of regulations and 5 represents high degree of regulations. Interested Parties Regarding Interested parties, the valuation weighs stakeholders’ opinions about the environmental aspects. It is up to every company to determine which their stakeholders’ are. Depending on how high the knowledge about stakeholders’ opinions is among the users of the Valuation Model, the valuation can be completed in different ways; either by basing it on internal experience or by asking external specialists. The environmental aspects are valued on a scale from 1 to 5, where 1 represents modest societal discussion about environmental aspect and therefore less relevant to follow up while 5 represents intense societal discussion about environmental aspect and therefore more relevant to follow up. The Score As mentioned when explaining each of the parameters, each of them is valued from out of a scale. Since the scale varies across the parameters, in order to be able to compare the score for each parameter a common denominator has been set. Since the matching against the global environmental objectives has a maximum score of 14, the importance has a maximum value of 10 (5 for cost and 5 for

Environmental Performance and Reporting
50
volume), legal requirements has a maximum of 5 and finally the opinions from stakeholders has a maximum of 5, the common denominator for all of the parameters is 70. This is what underlies the multiplication of each of the parameters in order to find an equal and comparable result across the environmental aspects (See Table 4).
When all of the parameters – the global environmental objectives as well as ISO’s three criteria for determination – are evaluated and weighted against each other, the total score for each aspect will show which of the environmental aspects for the company that are selected as the significant environmental aspects. As mentioned before the Valuation Model is a two-step model for global companies while it is a one-step method for local companies. The steps are now to be explained – for local companies go directly to the Valuation Model for local companies.
6.3 Valuation Model – Global Level
This is the first step for global companies when evaluating their environmental aspects from out of a global perspective. However, important to mention is that in addition to the aspects valued as significant environmental aspects in this step, global companies also have to be aware that other environmental aspects may be of high importance at local level. Therefore the Valuation Model preferably also is recommended to be used at local level in order for the local departments to focus on what is important for them. The environmental aspects identified in the initial analysis of the activities, Step 1 of the work method, are to be filled in the left column. Each of the aspects will thereafter be individually evaluated. The following fields in this model should be filled out on a global level:
UN21 – Global Environmental Objectives Importance Stakeholders
ParameterMaximum
Score
Smallest common
denominator
Mutliplication factor
Global Environmental Objectives 14 70 5
Importance 10 70 7
Legal Requirements 5 70 14
Interested Parties 5 70 14
Table 4: Illustration of each parameter’s maximum score and the common denominator that underlies the multiplication of the score in the Valuation Model.

Environmental Performance and Reporting
51
Legal Requirements will not be considered in the global model since no common global regulations exist that companies have to follow. It is rather on the local level the regulations become an important aspect to consider in the operations. The Valuation Model is illustrated in Figure 11 below.
Figure 11: Valuation Model – Global Level. To be used for determination of a company’s global environmental aspects.
Re
sult
Ran
kin
g
Envi
ron
me
nta
l asp
ects
Score Environmental Objectives
Multiplied Score Environmental Objectives
Cost
Volume
Score Importance
Multiplied Score Importance
Score opinions
Multiplied Score Stakeholders
Total Score
Ranking Environmental Aspects - From most to least important
ISO
4.3
.1.5
(c)
UN
21
Imp
ort
ance
Inte
rest
ed
Par
ties
Glo
bal
En
viro
nm
en
tal O
bje
ctiv
esIS
O 4
.3.1
.5 (
a)

Environmental Performance and Reporting
52
6.4 Valuation Model – Local Level
This is the first step in the Valuation of environmental aspects for locally acting companies, while it is the second step for globally acting companies. Companies that belong to a global organisation should consider the significant aspects that the global model resulted in as important. In addition to those, it is essential to have control over the local conditions. Therefore, this local model should be used as well to identify the local significant environmental aspects. After Part 1 of the method is conducted the environmental aspects are to be filled out in the left column of the Valuation Model. For globally acting companies the environmental aspects identified in Part 1 will be the same on local level as on global level. It depends on what type of activities the company has. The following fields in this Valuation Model should be filled out:
UN 21 – Global Environmental Objectives (However, if the company is acting globally the weighting from the global valuation is included here when it is applied on the company’s local units. For company’s acting only on local level this parameter has to be evaluated as normal.)
Importance Legal Requirements Stakeholders
The Valuation Model is illustrated in Figure 12 below.
Figure 12: Valuation Model – Local Level for determination of a company’s local significant environmental aspects.
ISO 4.3.1.5 (b) ISO 4.3.1.5 (c) Result Ranking
Legal Requirements Interested Parties
Environmental aspects (Weighting from Global Model)
Co
st
Vo
lum
e
Scope Opinions
Global Environmental
ObjectivesISO 4.3.1.5 (a)
UN21 Importance

Environmental Performance and Reporting
53
7 Question 2: Environmental Aspects and How To Control Them
This chapter will follow the work method explained in the previous chapter and the Valuation Model (Global Level) will be applied on Scania Sales & Services in order to determine which environmental aspects that is important to control from out of a global perspective. Also, the result of the valuation is connected to how the environmental performance can be controlled.
7.1 Part 1: Analysis of the Workshops
Analysis of workshops at Scania resulted in an input-output analysis of aspects that affect the environment (see Figure 13). The analysis is built upon what happens within the workshop area, as mentioned earlier in the chapter Delimitations. The analysis lists eight aspects that have to be considered and dealt with. The aspects10 will be explained shortly below in Table 5 and are the following:
10
These aspects have been identified and discussed together with several employees at Scania, among others Karin Bjelkesjö, Lars Björnberg, Per Åke Lindström, Leif Ericson, Kenneth Persson, Anders Ericksson , Susanne Olsson and Gunnar Eriksson.
Emissions to air
Emissions to water and soil
Energy use
Water use
Material
Chemicals
Risks
Accidents
Waste
Emissions to air
Emissions to water and soil
Energy use
Water use
Material
Chemicals
Energy use
Water use
Material
Chemicals
Risks
Accidents
Waste
Figure 13: Input-output analysis of the workshops’ environmental aspects.

Environmental Performance and Reporting
54
Table 5: The environmental aspects identified for the workshops and a short explanation for each of them.
7.2 Result of the Valuation Model – Global Level
After valuating and filling out the parameters in the global model the result is that Chemicals, Energy use and Waste are considered as the significant environmental aspects for Scania’s workshops, which can be viewed in Table 6 on the next page.
Environmental aspects Explanation of aspect
Energy useEnergy is mainly used for lighting, ventilation and air conditioning,
compressors, commercial washes etcetera.
Water useWater is used in the commercial washes, but also in washing bays for
internal use at the workshops.
Material
Material includes all parts purchased by the workshop, excluding chemical
substances. For example material can include filters as well as screws and
paper.
ChemicalsChemicals includes all types of chemical substances used at the workshops,
for instance oils, lubricants, painting and solvents.
Emissions to airEmissions to air for instance originates from driving of engines, burning,
cooling or painting.
Emissions to water and soilEmissions to soil and water can for instance appear from a car wash or an
outdoor varnishing job where the colour is dripping on the ground.
WasteWaste includes the all “output” from the workshops, which for instance is
old parts picked out from vehicles, tins of paint, chemicals etcetera.
Accidents
Accidents include activities that differs from the normal operations and
affect the environment. This might for instance be a tanker that leaks
sulphuric acid on the workshop area.

Environmental Performance and Reporting
55
Re
sult
Ran
kin
g
Envi
ron
me
nta
l asp
ect
s in
th
e
wo
rksh
op
s
Protection of the atmosphere
Integrated approach to the planning and management of land resources
Combating deforestation
Managing fragile ecosystems: combating desertification and drought
Managing fragile ecosystems: sustainable mountain development
Promoting sustainable agriculture and rural development
Conservation of biological diversity
Environmentally sound management of biotechnology
Protection of the oceans, all kinds of seas, including enclosed and
semienclosed seas, and coastal areas and the protection, rational use and
development of their living resources
Protection of the quality and supply of freshwater resources: application of
integrated approaches to the development, management and use of water
resources
Environmentally sound management of toxic chemicals, including
prevention of illegal international traffic in toxic and dangerous products
Environmentally sound management of hazardous wastes, including
prevention of illegal international traffic in hazardous wastes
Environmentally sound management of solid wastes and sewage-related
issues
Safe and environmentally sound management of radioactive wastes
Score Environmental Objectives
Multiplied Score Environmental Objectives
Cost
Volume
Score Importance
Multiplied Score Importance
Score opinions
Multiplied Score Stakeholders
Total Score
Ranking Environmental Aspects - From most to least important
Ener
gy
use
11
00
00
00
00
00
00
21
04
37
49
4,8
67
12
62
Wa
ter
use
01
00
00
00
11
00
10
42
02
24
28
2,0
28
76
8
Ma
teri
al
01
00
00
00
00
00
10
21
05
49
63
3,1
44
11
74
Ch
emic
als
10
00
00
00
00
11
10
42
04
37
49
4,1
58
12
71
Emis
sio
ns
to a
ir1
00
00
00
00
10
00
02
10
11
21
44
,15
88
27
Emis
sio
ns
to w
ate
r a
nd
so
il0
00
00
00
01
10
01
03
15
11
21
43
,95
48
36
Wa
ste
10
00
00
00
00
01
10
31
54
48
56
3,3
47
11
83
Acc
iden
ts1
10
00
00
01
11
11
07
35
11
21
43
,85
31
02
5
Inte
rest
ed
Par
tie
s
ISO
4.3
.1.5
(c)
Glo
bal
En
viro
nm
en
tal O
bje
ctiv
es
UN
21
ISO
4.3
.1.5
(a)
Imp
ort
ance
Table 6: Result of the Valuation Model – Global Level. Chemicals, Energy use and Waste are ranked as the three most important environmental aspects for Scania’s workshops.

Environmental Performance and Reporting
56
How the authors have filled out the global model and the result of each parameter will now be explained: UN 21 – Global Environmental Objectives The matching against the environmental objectives was conducted by considering the global environmental objectives (UN21) and what they represent against the workshops’ environmental aspects. The matching was completed by the authors and also discussed together with Susanne Olsson who is working with Environmental Protection of Scania Industrial Operations. Regarding the aspect of Accidents, this was specially treated. The result was based on that every global environmental objective that was affected by another of the workshops’ environmental aspects also received 1 point on the aspect Accidents. The reason for this is that every aspect that affects the global environmental objectives may constitute a risk and therefore has to be handled so that it does not result in an accident. Importance The authors based the valuation on input from a combination of information sources; from people with knowledge about the workshops, the authors’ own visits at Scania workshops, information from the questionnaire11 and by talking to specialists. The valuation has also been discussed together with Lars Björnberg, Manager Facility Management at Scania, who has a large insight in the workshops and their operations. This is what underlies each environmental aspect’s score. Discussion of each aspects’ score is presented in Appendix VI. Interested Parties Since the Scania share is traded on the Swedish stock exchange, the stakeholders in the global model are viewed from out of a Swedish perspective. The opinions included and valued in this parameter are therefore based on comments from specialists that have deep knowledge about environmental performance and reporting. In order to find the stakeholders’ opinions and interest in what aspects that should be reported 9 persons with knowledge and experience within the area have valued the environmental aspects from out of a stakeholder perspective. The persons asked are representatives from the environmental departments at Lund University as well as from The Swedish Environmental Research Institute and Scania. The persons’ valuations can be viewed in Appendix V.
11
See Appendix IV. The questionnaire is also discussed in Chapter 10.

Environmental Performance and Reporting
57
7.2.1 Analysis of the Result from the Valuation Model – Global Level
As mentioned above the total outcome of the model shows that Chemicals, Energy use and Waste are considered as the workshops’ three most important environmental aspects, the significant environmental aspects so to say. As a further verification of the result, the outcome is also in line with the asked workshops’ opinions about what their own most significant environmental aspects are12. Regarding Chemicals this is an aspect that includes certain and often careful handling, for use as well as during waste handling. The aspect also brings restrictions about which chemicals that are accepted to use and which are not. Chemicals do not only require careful handling and is surrounded by large regulations, but is also a question with increasing importance in the societal discussion (Olsson, et al., 2009) (Falkenek, 2009). When it comes to energy, this is probably the aspect that the largest environmental societal debate at present revolves around. Control of the energy use is important from out of a stakeholder perspective and also something companies are expected to be able to describe. Therefore energy has received high scores in the model, even though the workshops may say the energy use most often is on a relatively low level viewed from the aspect that a workshop needs energy to be able to run its business. At the same time it would be incorrect not to follow up the workshops’ energy use, since S&S’s total use is quite large and thereby affects the climate and natural resources. The follow up of energy use includes both the volume consumed, but also what type of source the energy comes from. The third environmental aspect that should be focused on is Waste. As mentioned earlier on the amount of waste is closely related to amount of material used in a workshop. As an increased amount of material cannot be viewed on as negative since this is a source of income for the workshops. Nevertheless, it is of great importance to carefully take care of the waste that the use of material brings. Different types of waste require different types of handling or recycling. Regarding chemicals this is probably the environmental aspect that will require the most work from the workshops in order to find and be able to collect the requested information. Currently the workshops know how to handle the chemicals and which preferably not to use, but they do not have sufficient control of the volumes. For the aspects energy use and waste the supply of information is greater. Information of these aspects is commonly available either from the invoices or as a service provided from the suppliers, which means the problem is rather understanding the suppliers’ information correctly than a need to collect it.
12
This was the final question in the questionnaire (see Appendix IV) which was sent out to the workshops.
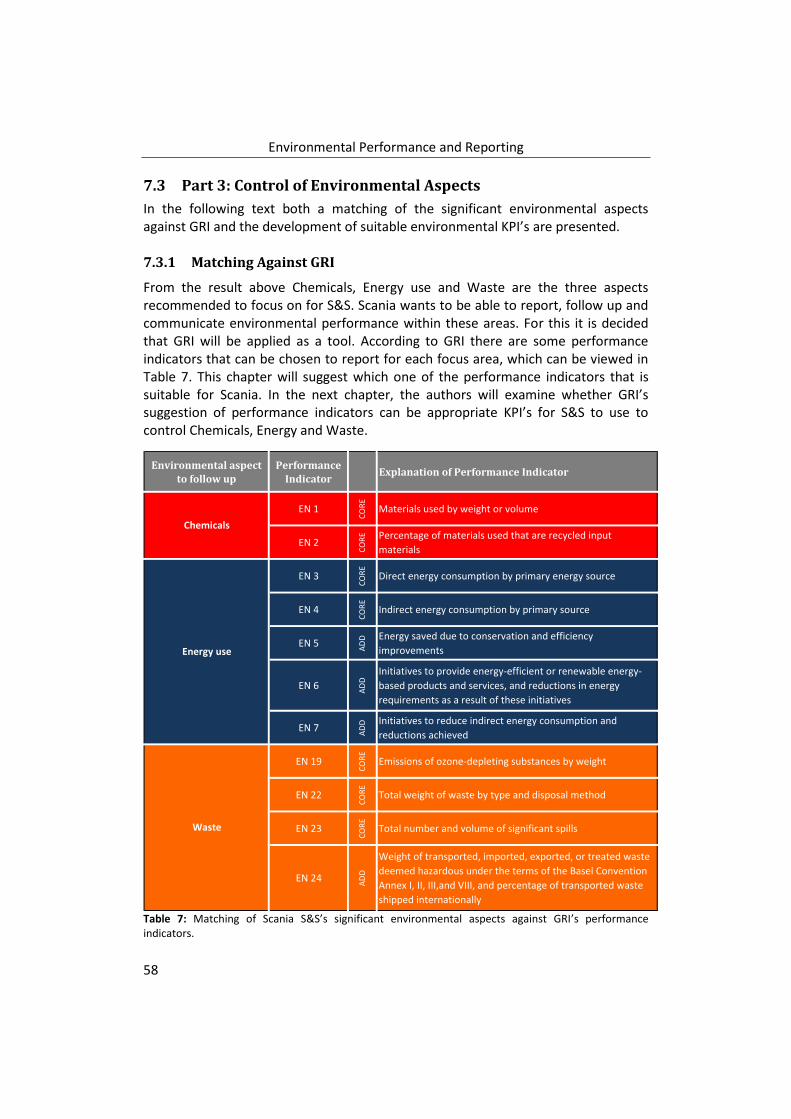
Environmental Performance and Reporting
58
7.3 Part 3: Control of Environmental Aspects
In the following text both a matching of the significant environmental aspects against GRI and the development of suitable environmental KPI’s are presented. 7.3.1 Matching Against GRI
From the result above Chemicals, Energy use and Waste are the three aspects recommended to focus on for S&S. Scania wants to be able to report, follow up and communicate environmental performance within these areas. For this it is decided that GRI will be applied as a tool. According to GRI there are some performance indicators that can be chosen to report for each focus area, which can be viewed in Table 7. This chapter will suggest which one of the performance indicators that is suitable for Scania. In the next chapter, the authors will examine whether GRI’s suggestion of performance indicators can be appropriate KPI’s for S&S to use to control Chemicals, Energy and Waste.
Table 7: Matching of Scania S&S’s significant environmental aspects against GRI’s performance indicators.
Environmental aspect
to follow up
Performance
IndicatorExplanation of Performance Indicator
EN 1
CO
RE
Materials used by weight or volume
EN 2
CO
RE Percentage of materials used that are recycled input
materials
EN 3
CO
RE
Direct energy consumption by primary energy source
EN 4
CO
RE
Indirect energy consumption by primary source
EN 5
AD
D Energy saved due to conservation and efficiency
improvements
EN 6
AD
D
Initiatives to provide energy-efficient or renewable energy-
based products and services, and reductions in energy
requirements as a result of these initiatives
EN 7
AD
D Initiatives to reduce indirect energy consumption and
reductions achieved
EN 19
CO
RE
Emissions of ozone-depleting substances by weight
EN 22
CO
RE
Total weight of waste by type and disposal method
EN 23
CO
RE
Total number and volume of significant spills
EN 24
AD
D
Weight of transported, imported, exported, or treated waste
deemed hazardous under the terms of the Basel Convention
Annex I, II, III,and VIII, and percentage of transported waste
shipped internationally
Energy use
Chemicals
Waste

Environmental Performance and Reporting
59
The column ”Explanation of performance indicators” in Table 7 is a short description of what to be reported for the specific performance indicator13. Depending on which of the performance indicators Scania decides to report, it affects what data to be collected from the workshops. This in turn means the workshops need to be able to follow up different aspects. For instance, if Scania decides to report performance indicator EN 1 for chemicals this means the workshops have to be able to specify which chemicals they presently are using and the weight/volume for each of them. As mentioned above the control of chemical use is presently not sufficient among the workshops, which in this case means the reporting requirements for EN 1 will not be fulfilled with the existing level of control. Therefore, the performance indicators Scania decides to report requires the management to carefully consider exactly what data that is needed from the workshops in order to fulfil the reporting requirements. At the same time, the management needs to understand that the requested data cannot be found immediately in the workshops. The management preferably has to consider how the data should be collected since many of the workshops will experience the same difficulties finding it. Concerning the performance indicators some of them are classified as core and some as additional. Depending on which level Scania decides to start the GRI reporting on varying number of performance indicators have to be reported. Notable is that the number of performance indicators required for the different reporting levels (A, B or C) imply the number of core performance indicators reported. This means the additional performance indicators that can be reported for the environmental aspects shown in Table 7 may be interesting to follow up, though not contribute to the basic number of performance indicators reported in order to reach the reporting levels’ requirements. 7.3.2 The Key Performance Indicator
During the initial discussion with Scania about environmental KPI’s for S&S a few KPI’s is what is requested – rather one really good than many that no one will use (Bjelkesjö, et al., 2008). This is also strengthened by literature about KPI’s, since too many KPI’s is ineffective. It is more beneficial for an organisation to decide on a few KPI’s that the organisation is controlled on and followed up on. Moreover, all of the
13
Further descriptions and explanations of the performance indicators can be found in GRI ‘s Indicator Protocol for Environment (http://www.globalreporting.org/NR/rdonlyres/67C7CAC8-43B0-4C42-BDA5-746385D76A8F/0/G3IndicatorProtocolEnvironmentalFSSSFinal.pdf)

Environmental Performance and Reporting
60
employees should be aware of these since they symbolise what is important for the organisation. The KPI can have various purposes; internal control and follow-up, as well as a tool for benchmark against other companies or a tool in the external communication. The purpose of the development of a KPI for S&S is to measure and control the environmental performance of the workshops, in order to be able to work with continuous improvements. (Bjelkesjö, 2009) The KPI developed for S&S will have the shape of a fraction, which means it includes a numerator and a denominator. This is aligned with what the theory about KPI’s in general as well as for environmental KPI’s suggests, Chapter 3.3. When developing a KPI it is important to seek a fraction where the numerator interplays with the denominator (Andersson, 2009). In this case, the numerator will be constituted by the significant environmental aspect that was determined earlier on in the global model for valuation of environmental aspects. For the denominator, on the other hand, various alternatives exist. In the text below a number of possible denominators for S&S are presented and evaluated. The fraction is illustrated by the formula below. KPI = Significant Environmental Aspect / Denominator
7.3.2.1 The Numerator
From the results presented above the workshops’ significant environmental aspects are now identified, which if following the authors’ previous reasoning will constitute the numerator in the KPI. Regarding Energy use and Waste these two environmental aspects are valuable and easy to use as numerators. The volume can be measured for both of these, which is beneficial since a decreased amount favours the environment. For Chemicals, on the other hand, the most important issue at present is firstly to get an overview of which chemicals that are used. For instance chemicals listed in Scania Black List or Scania Grey List14, which are lists of chemicals that should not be used, alternatively be limitedly used in a workshop for a repair (Scania Forum of Chemical Support, 2009). Secondly, it is of interest to get an overview of the number of chemicals used in the workshops. At present this number is high and it is common that workshops use many different chemicals even though it is not necessary. (Hörnfeldt, 2009) This leads to the conclusion that when following up chemicals it is not only of interest to measure the volume, as much as which chemicals that is used. Therefore the volume of chemicals is ineffective to use as a numerator in the
14
The lists normally goes under the common name of “the black- and grey list”

Environmental Performance and Reporting
61
present situation. One subject that would be more interesting to follow up is then rather the number of “black-or grey-listed” chemicals.
7.3.2.2 The Denominator
In Table 8 a compilation of possible denominators are presented. Each of the possible denominators is thereafter described in the text.
Turnover Measuring the turnover for a workshop on a monthly, quarterly or yearly basis is easy since these figures are already followed up in the financial system. The turnover is a good reflection of the result of the operations and also a measurement that increases as the organisation grows. Since the turnover is an established financial measurement the management has knowledge about this figure and can easily relate to it. Nevertheless, using the turnover may not be a stimulating measurement for the workshop employees since the turnover may seem far away from the daily operations they perform. Secondly, as much as the turnover is positively affected by booms, it is likewise affected by economic recessions. Business cycles therefore influence the turnover to a great extent and may result in a denominator that makes
Denominator Benefits Drawbacks
T urnover
- Good reflection of organisational result
- Existing data in current reporting system
- Well established measurement
- Easy for management to relate to
- Affected by business cycles
- May hide varying price levels
- Distant measurement for employees
Works hop area
- Constant figure
- Already existing figure
- Easy for employees to relate to
- Do not follow increased workshop
activity
- Static
Number of employees
- Easy for employees to relate to
- Create feeling for responsibility among
employees
- Increases as organisation grows
- Difficult to determine number of full-
time employees
O pening hours
- Easy to find out figure
- Relatively constant figure
- Reflects workshop activity
- Do not truly reflect workshop activity
- May be regulated by contracts
- Static
P urc has ed hours
- Existing data in current reporting system
- Quality assured figure
- Partly reflects productivity and efficiency
- Do not reflect efficiency fully
- No relation to invoiced hours
Number of jobs exec uted,
Number of c us tomer vis its- Signals level of activity
- Jobs/visits are not comparable due to
varying size
- No existing logging of this data
Table 8: Benefits and drawbacks of possible denominators for Scania S&S’s environmental KPI’s.

Environmental Performance and Reporting
62
the KPI look negative even though the environmental aspect has had a positive development. In the square below is an example illustrated, Example 1:
Example 1: KPI with the turnover as denominator.
Lastly, an increased turnover may not be a sign of an increased workshop activity since the turnover depends on the volume sold as well as on the price. This means even though the volume is constant an increase in price may positively affect the turnover. An increased turnover can therefore be said to hide varying price levels. Workshop Area The workshop area is measured in square meters (m2) and is a constant figure as long as no reconstructions of the workshop are made. Since the workshop area is constant it may serve as a good denominator. Also, the workshop area is a known figure which simplifies, since no “new” data needs to be collected from the workshops to find the denominator. Using the workshop area as a denominator may also be easy for the workshop employees to relate to since the workplace is a well known place for them and this is where they spend their time. However, a constant denominator does not reflect if the workshop operations increase. The negative aspect of a constant denominator can be illustrated by the following example: If the amount of work in the workshop doubles so will probably the amount of waste. Though, since the workshop area in this case will be constant the KPI will look negative even though the increase in jobs – which is positive for the organisation’s financial result – require an increased amount of waste in order to be able to perform the jobs. Number of Employees Number of employees can serve as a good denominator since it first of all is easy to relate to for the workshop employees. By setting number of employees as denominator it will probably create a feeling and also start a thinking process among
Assume the energy consumption for Year 1 is 100 MWh, while the turnover is 100 MSEK. This results in a KPI for Year 1 of:
100 MWh / 100 MSEK = 1 MWh/MSEK
Year 2 the energy consumption has decreased to 80 MWh and the turnover has decreased to a level of 60MSEK due to a large global economic recession. This leads to a KPI for Year 2 of:
80 MWh / 60 MSEK = 1.33 MWh/MSEK
This example is an illustration of the negative consequences using the turnover as denominator can bring, since the energy consumption in the example had decreased between Year 1 and Year 2 which should have been reflected in the KPI instead of illustrating the opposite.

Environmental Performance and Reporting
63
the workshop employees on how they can contribute to improved environmental performance. Number of employees is also a good figure since it grows with the organisation; if the number of jobs increases for instance more mechanics need to be hired. On the other hand it may be difficult to determine the number of employees given that not all of the employees work full-time. To solve this dilemma the figure should reflect number of full-time employees, which is done by dividing the total number of worked hours by 180015. Opening Hours Opening hours means the hours per week, month or quarter the workshop is open. This is a figure that is easy to find out, but for a workshop may vary across the year for instance due to general holidays. Using opening hours as a denominator may be positive since the figure can reflect how busy the workshop is – the higher demand from the customers the greater possibility to increase the opening hours. On the other hand, opening hours is static and do not reflect the degree of activity since the workshop may be open from out of a service perspective – regulated by a contract – even though it is not fully busy. The level of activity may for instance vary with business cycles, which means that the workshop may have a lower degree of activity during a period of time even though the opening hours are the same as before only to offer the customers the same service level. Purchased Hours The number of purchased hours refers to all hours paid to technicians (mechanics), including overtime, for a workshop. This means also hours paid to technicians that are not available for production – such as paid absence due to sickness, breaks etcetera – are included in the number purchased hours.16 This is a measurement that currently is followed up on a regular basis throughout the company. Besides, this figure is quality assured and is therefore reliable. Purchased hours is a measurement that may reflect a workshop’s efficiency and productivity since it is related to the workforce. However, since this measurement is not related to invoiced hours it does not fully reflect the efficiency since the number of invoiced hours should be equal to, or exceed, the purchased hours for full efficiency. Likewise, the number of purchased hours does not reflect a technician’s
15
Method for calculating the average number of employees according to Scania Financial Manual (p 78). Though, if the normal annual number of working hours for a full-time employee differs substantial (> 15 %) from 1 800 hours, the denominator may be adjusted accordingly. Contract-hired personnel are not included in the average number of employees. 16
Scania Financial Manual Appendix 1, KPI Definitions, Service Operations, pp 1-4

Environmental Performance and Reporting
64
efficiency; a new technician may perform a job slower than an experienced technician, which means the experienced can accomplish more jobs in the same time as the new technician. Lastly, number of purchased hours does not indicate whether a technician has a full schedule meaning he always has a repair to complete or not. Number of Jobs Executed, alternatively Number of Customer Visits The number of jobs executed or customer visits is a measurement that signals the level of activity in the workshop. Though, the size of the jobs varies widely, which means some jobs may take 30 minutes while others take 2 days. Therefore it is not truthful neither to compare jobs and jobs, or customers visits and customer visits. In addition, at present the number of jobs executed or customer visits is not logged in any administrative system related to the workshops (Björnberg, 2009). In this case Scania’s standard time manual17, which sets out standard times for repairs, could be useful to be able to compare different jobs. Yet, the standard times listed in the manual lack about 45% of the common repairs which makes the manual of no use in the case of a denominator for the environmental KPI. (Björnberg, 2009)
7.3.2.3 Recommended KPI’s
The significant environmental aspects, the numerators, as well as possible denominators have now been discussed. As mentioned before, when developing KPI’s the interplay between the numerator and the denominator is essential. The question is which combination of numerator and denominator that is useful to combine in order to find a few KPI’s that are efficient and fulfil the desired purpose of environmental KPI’s for S&S. The authors’ suggestion is the following KPI’s:
Total number of chemicals used, of which number of chemicals that are listed in “the black- and grey list”
Energy use / Purchased hours
17
Scania Standard Time Manual is used for workshop planning and also for defining fixed costs for repairs to customers.
Example: The average number of chemicals used in a workshop is 150 of which 10 are listed in “the black- and grey list”.
Example: The consumption for a workshop one year is 27 MWh. The number of purchased hours is 9000 (which equals to 5 full-time employees). The KPI is: 27 MWh / 9000 purchased hours = 3 KWh/purchased hour

Environmental Performance and Reporting
65
Recycled waste / Purchased hours
Number of Chemicals Used Listed in “the Black- and Grey List” As mentioned above, for chemicals the most interesting aspect at present is to decrease the number of chemicals used as well as the number of chemicals used listed in “the black- and grey list” among the workshops. Therefore, the authors suggests a KPI for chemicals that is not formed as a fraction (numerator and denominator), but rather a single value. The organisational goal should be to decrease these numbers. This KPI is hard to manipulate for the workshops; either they use the listed chemicals or they do not. Commonly, the awareness of which chemicals that are listed is high among the workshops (Kremsky, 2009), which makes it a good KPI that is easy for the workshops to follow up and understand. Energy use / Purchased hours Matching the total energy use against purchased hours is a KPI that can be compared to Industrial Operations’ KPI of Energy use per produced vehicle (Bjelkesjö, et al., 2009) This is an advantageous match since energy consumption indirectly is related to purchased hours; for instance all of the hours the mechanics spend at the work (and thereby equals to purchased hours) the lights in the workshop are on which requires energy. From out of a group level perspective, this is a KPI that is easy to collect and understand, largely since purchased hours already are followed up on a regular basis. Reversely, since purchased hours is data requested from the group, the workshops have control of this. For both levels of the organisation it is also easy to understand that a decreased value of the KPI is positive since it indicates a lower energy use. This actually applies no matter if it is viewed from the perspective of a decreased total energy use, or if it depends on a constant energy use but a larger amount of purchased hours. The latter example still indicates the energy consumption per purchased hour has decreased in the workshop, which is positive. Recycled waste / Purchased hours Regarding waste the most interesting question for Scania to follow up is not the total amount of waste, but rather how it is handled. Therefore the amount of recycled
Example: The total amount of recycled waste for a workshop during one year is 4500 kg. The number of purchased hours is 9000 (which equals to 5 full-time employees). The KPI is: 4500 kg / 9000 purchased hours = 0.5 kg recycled waste/purchased hour

Environmental Performance and Reporting
66
waste is interesting to follow up since a better KPI indicates a responsible way of handling the material a workshop actually uses. Also waste is matched against the denominator purchased hours. Using a common denominator for energy use as well as recycled waste is positive from the point of view that it is easy for the employees to have one number to relate to. As purchased hours indirectly indicate how many employees the workshop has18, it is for energy use as well as recycled waste, a KPI that relates to the employees. The employees therefore may feel a personal responsibility to improve the KPI’s results since it is related to them. An example is illustrated in the box below, Example 2:
Example 2: Illustration of how KPI is related to employees.
This implies using purchased hours as a denominator is positive for waste as well as for energy use. This since it is not only already followed up and a number the workshop knows, but also as it relates to the employees and can create personal awareness along with responsibility.
18
Since purchased equals hours paid to mechanics and a mechanic according to Scania Financial Guide on average works 1800 hours per year, it is possible to approximate how many employees that are working in a workshop (total number of purchased hours/1800 = number of employees)
Assume one workshop has a total amount of waste of 182,5 tonnes per year, which equals to 500 kg of waste per day. Assume that 50% of this is recycled, which gives us: 500 kg waste per day * 50% is recycled = 250 kg of recycled waste per day Assume the workshop has 25 employees. This results in a KPI of: 250 kg / 25 employees = 10 kg of recycled waste per employee and day Imagine you were the mechanic, then you know that if you would make sure that one extra kilogram of waste per day is recycled this gives us a total amount of recycled waste per day of: (10 kg + 1kg) x 25 employees = 275 kg of recycled waste per day This result in a KPI of: 275 kg / 500 kg = 55% of the waste is recycled The KPI has increased with 5% - from 50 to 55% of the waste is now recycled.

Environmental Performance and Reporting
67
7.3.3 Recommended Performance Indicators versus KPI’s
The performance indicators that GRI suggests when focusing on Chemicals, Energy and Waste are not the same as that the KPI’s that the authors recommend Scania to use for controlling its significant environmental aspects. This does not mean that GRI’s performance indicators are unnecessary information, some of them should be reported in order to reach a control over Scania’s operations. Though, the reason for using KPI’s is to achieve the ability to make changes – continuous improvements. For example, Scania could for Chemicals decide to report EN2, “Materials used by weight or volume”. This is important to have control of, so that the volume is not unnecessarily high. However, when the authors suggest KPI’s for this environmental aspects they also consider the possibility to achieve changes. At present Scania need to get control over and decrease the total number of chemicals as well as chemicals on the black and grey list, which therefore is suggested as a KPI. So, from the identified significant aspects, Scania needs to be in control of these areas. This is preferably completed with the by GRI suggested performance indicators. This without taking into consideration where Scania have the possibility to improve its performance. Scania need to communicate that they are in control of their identified significant environmental aspects, independent of the possibility to improve their performance. Exactly what the most important thing to follow up is and where Scania see potential to measure in order to achieve improvements is something that the KPI’s considers.

Environmental Performance and Reporting
68
8 Question 3: Organisation
How the responsibility for the environmental performance and reporting is to be handled within Scania is investigated in this chapter. How environmental performance and reporting should be handled internally is a question that is within the scope of this thesis. As brought up in the chapter of Delimitations the purpose is not that Question 3 should lead to recommending a specific function or amount of man hours, but rather a general suggestion of what to take into consideration for handling environmental reporting within the S&S. When examining how the environmental performance should be handled internally the classic illustration of an organisation will be used. It divides the organisation into a strategic, a tactical and an operational level. In the model the strategic level is represented by S&S, the tactical level by the business units and the operational level by the workshops when applying it on Scania (Figure 14). Different alternatives for how the environmental performance for S&S should be handled have been considered – alternatives including all of the levels in Figure 14, as well as alternatives including only the strategic and the operational level. However, in this report only the chosen alternative will be presented, which is that responsibility is needed on every level. The proposed alternative is a solution that is in line with how Scania is managed, its principles and methods. It is also in line with how other questions are handled within Scania.
8.1 Proposal
The alternative that is proposed for how this matter should be handled internally focuses on that responsibility needs to be addressed at every level. This is based on identified facts through interviews and workshop visits within Scania, but also through learnings from the benchmark analysis.
Group Level(S&S)
Workshop WorkshopWorkshop
STR
ATE
GIC
LEV
ELTA
CTI
CA
L LE
VEL
OP
ERA
TIO
NA
LLE
VEL
Business Unit
Figure 14: Illustration of the strategic, the tactical and the operational level at Scania.

Environmental Performance and Reporting
69
The benchmark analysis, presented in Chapter 5, identified some success factors for the participating companies’ work related to environmental performance. These have been of importance when discussing how environmental performance and reporting should be handled within S&S. The success factors identified are Management focus, Responsibility and Time. These have been considered and have led to following proposal. 8.1.1 Management focus
The benchmark analysis shows that if management requests information about the environmental performance these aspects become more prioritised among the employees. This would lead to better control of Scania’s activities and enable improvements of the performance. The improvements would be from an environmental perspective, but this often leads to economical benefits as well, for example lower energy use is combined with reduced costs. Management focus should originate from the strategic level to the tactical level and then on to the operational level, which means it permeates the whole organisation. The strategic level should point out the direction, while it is up to the business units and thereafter the workshops to further develop and adjust how to handle the environmental work at the specific unit. This is how Scania works with other main questions (Jedeur Palmgren, 2009). The environmental work should not be a side issue from the daily businesses. Making environmental work a side activity would indicate it is something that is not followed up as the financial performance, and therefore not as important. Management focus can be communicated by measuring the performance with KPI’s decided by the management. A recommendation of suitable environmental KPI’s for S&S has been discussed in Chapter 7.3.2. As mentioned the environmental KPI’s within the production is on a regular basis followed up, which has led to a communicated focus on the environmental performance. Using the “One Pager” within S&S in the same way as within Industrial Operations – which means letting the environmental KPI be a part of this – would be a good suggestion to show the employees that improvements of environmental performance is important for S&S as well. 8.1.2 Responsibility
To enable feedback, and thereafter actions, when it comes to environmental performance responsibility needs to be clarified. To give a general suggestion of how this can be handled internally, the aspect responsibility is explained from the top of the triangle, the strategic level, to the bottom which represents the workshops.

Environmental Performance and Reporting
70
Strategic Level At the strategic level the responsibility for environmental questions for S&S is currently divided between two different departments since the project is under development. The two departments are Business Strategy and Development and Scania Real Estate Services. It is not clear which of the participating departments that should run the questions permanently. Though, there is a wish to clarify the responsibility. (Bjelkesjö, et al., 2009) Without pointing out a specific department, it is clear that the questions will not be run by themselves and therefore the responsibility needs to be addressed. The responsibility on strategic level needs to be clear, so that the organisation knows where to search for information and also to gather the performance of the S&S companies throughout the world. One idea might be to have one department responsible for the strategic decisions for S&S’s environmental performance, while another should be responsible for including the environmental performance in the workshops’ daily activities and look after all the practical aspects. For the strategic level certain tasks has been identified. The owner of these questions should:
Focus on identifying persons responsible on tactical level and create awareness among them. This is a first step to increase the environmental questions within the organisation.
Run the question of which database the environmental data for the reporting should be included in.
Establish the guidelines “Environment and Health & Work Environment within Sales and Services” and set up environmental goals within the focus areas.
Clarify which documents that handled the environmental questions for the S&S organisation. Unify the work at the strategic level (e.g. DOS and Guidelines).
Start collecting environmental data on a regular basis from the tactical level. Follow up the performance and give feedback to the tactical level.
Initiate education for the employees at the tactical level. Communicate the work S&S are doing by including the environmental
performance in Scania’s annual report. Tactical Level At present, at the tactical level there is no unified way of addressing the environmental questions (Bjelkesjö, et al., 2009). It is important that this responsibility is well addressed so that the work on strategic level is efficient which is achieved if the responsibility is clarified. If this is not the case the strategic level would have to handle the environmental performance for 450 workshops instead of

Environmental Performance and Reporting
71
getting information from 100 business units. The responsibility at the tactical level should include handling of the specific business unit’s workshops and its environmental performance. When performance is controlled on tactical level instant feedback also can be delivered to workshops, in this way the chance for improvements and learning from each other will increase. Responsibility at the tactical level enables aggregation of data reported from workshops, analysis of this and thereafter feedback to the workshops. Having responsibility on tactical level also makes it easier to compare different workshops within the same regions, making it possible to learn from each other and identifying areas suitable for improvements. Responsibility on tactical level can also be seen as a control station of the data and its quality before it is sent to the strategic level. Operational Level In Sweden, at operational level currently environmental questions are addressed to quality managers. However, since there is no one from management at higher levels requesting information about the performance the improvements are hard to follow up. At operational level there is however much environmental data available. Responsibility for environmental performance on operational level is important since it is their task to communicate to the workshops’ employees what is important and aspects that can be improved. Since it is the workshops’ employees that influence the actual environmental performance they have to be highly involved. Equally important is communicating of what is being well done, which encourages to continuous improvements and initiatives from employees. 8.1.3 Time
Management focus, awareness and responsibility are implementations that need time. A good example is Toyota Sweden AB that has worked with implementation of environmental reporting from the workshops during a long period. The work has been constant and intense during this period, and the company is still working with improvements since they have not yet reached the target where they want their workshops to be. However, the company has come a long way in their environmental work and the data of the environmental performance reported from the workshops will probably be included in Toyota Europe’s Sustainability Report this year. Since this type of project will take time it is even more important for Scania to start today. Not doing all at once but starting with a few areas to follow up.

Environmental Performance and Reporting
72
9 Question 4: System
After studying what to report it is essential to see how it could be practically implemented. This chapter will focus on the reporting of environmental data from the tactical level to the strategic level. The S&S organisation was recently developed into today’s organisational appearance. The fact that business units and workshops have not been owned by Scania before makes this question complicated to answer in the matter of finding a common data reporting system from operational level to strategic level. The reason for this is that when Scania did not own their business units and workshops, the different countries developed their own reporting processes with varying dealer systems19. This means the dealer systems are different and the alternative to change globally into one common system is something that would take long time. (Jedeur Palmgren, 2009). Also, the owner of the data sent from operational level to tactical level and then on to the strategic level is solved differently depending on what business unit to examine. For example, some business units have a common accounting department for several workshops handling all the invoices for water use for example, while others have the accounting at workshop level. This also makes the picture more complicated. (Gustavsson V, 2009). Therefore Question 4 is delimitated to finding a potential system solution concerning only the reporting between the business units and group level, which means between the tactical level and the strategic level.
9.1 Tactical Level to Strategic Level
The reporting of the environmental performance for the Industrial Operations is currently completed through Excel files. The data in the Excel files is then aggregated, which includes an amount of manual work, before analysed. Even though the handling of Excel files for Industrial Operations is time consuming it is well functioning, not only since the reporting requires a certain degree of hand waving, but also since the number of reporting units is limited. (Olsson, et al., 2009) However, since the reporting from S&S includes a much higher number of reporting units, this method and the use of Excel files is an alternative that preferably should be avoided when it comes to reporting within S&S (Bjelkesjö, et al., 2008). Currently, the financial data is collected from the tactical level to the strategic level on a regular basis and therefore the way this data is transported could be an attractive way to transport environmental data as well. The financial data is reported
19
Dealer systems are systems used between the tactical and the operational level, which means between the business units and the workshops.
Environmental Performance and Reporting
73
in the system Hyperion Financial Management20 (HFM). HFM is an effective tool for collection and consolidation of the financial data. However, since HFM includes financial data it is determined that only data that is required for the annual report should be reported into this system. The reason for this is primarily because of security, given that a limited number of persons should have access to the financial figures. As HFM at present cannot give restricted access this means the department Group Financial Reporting, who has access to the database would have to take care of all data reported into HFM, which is not their task. Secondly, if any data could be reported into HFM there is a risk the amount of data would be too much to handle for the owner of the database. (Karlsson, 2009) Other data and good to know facts therefore have to be outside of this database. However, creating another database of HFM would be suitable. (Gustavsson, 2009) Other alternative system solutions the authors have come across is QPR-web21 and SIS22. QPR-web is a system for registration and audits, which is used for follow up of DOS by Scania’s auditors. SIS is a database for information about Scania’s workshops, retailers and distributors. (Boethius, 2009) However, with the knowledge the authors at present possess the alternative of SandS HFM is the recommended solution, which will be further presented below.
9.1.1 SandS HFM
Within S&S the department Business Control has the ambition of building a database with additional information about the S&S companies – data that cannot be found in the current database of HFM. The project is called SandS HFM, which is another database of HFM. In the end of this year, 2009, the first launches of the system will be set. This could be a suitable system for handling also the environmental data for S&S. Needed data can be collected from this database to for example evaluation or for the annual report. The data reported into the system is mostly figures, but longer text versions can also be uploaded through appendices. If the environmental data is to be reported into this application this has to be decided by the Scorecard Steering Group Board. The project group of SandS HFM needs to know what data that will be reported and how the data should be analysed after reported. (Af Sandeberg, 2009)
20
HFM is an application offered by Oracle. 21
Quality Profile Report 22
Scania Internal Service

Environmental Performance and Reporting
74
10 Discussion
In this chapter aspects will be discussed that are of importance to consider for reporting environmental performance. These have been observed along the development of this thesis and are by the authors considered essential to highlight.
10.1 The Work Method and Valuation Model
The work method’s first step, identify how the company affects the environment, can be conducted in several ways. The authors chose to think of the workshop from out of an input-output analysis. The result has been discussed with employees within Scania to make sure that nothing was forgotten. Other users might be more familiar with its company than the authors and if that is the case this step can seem unnecessary. Still, the authors see this step as an important initial phase, in order to start a discussion to clarify how the company’s activities affect the environment. The question is not if this step needs to be conducted or not, but rather how time consuming this step will be. The next step is to use the Valuation Model for identification of the significant environmental aspects. It is this step that EMS requires companies to be in control over and also have a systematic approach to. Likewise, this is the step that the authors see as their theoretical contribution, since reality lacks a general model. The model offers what EMS requires and its strength is that it is a general model for all businesses. However, it should be mentioned that the authors have only tested the model on Scania Sales & Services, but see no limitations for using it within other companies. When developing the method, especially the Valuation Model, the authors have tried hard to make it user friendly. This means it should be a good tool, easy to understand and time efficient. The authors can therefore argue the Valuation Model is a good tool, relatively easy to understand and time efficient. When applying the Valuation Model on Scania S&S the data used is gathered with regard to its reliability and validity. When choosing environmental criteria the authors have considered that companies’ have varying environmental impact. Therefore the different environmental aspects are matched against the surroundings’ requirements. 23 Lastly, the significant aspects are connected to KPI’s. The authors see this step more as a discussion for each company. It is complicated to find a general suggestion for how this discussion should be performed. It is much dependant on what kind of business it is, how the company controls its operations in other areas etcetera. Though, one very important aspect is to not stop after the Valuation Model, but to take the significant environmental areas towards improvements by connecting them
23
See Chapter 3.2.3

Environmental Performance and Reporting
75
to KPI’s. The choice to suggest three KPI’s and not more is based on Scania’s current situation. For companies that have come longer in their work with environmental reporting the number of key performance indicators might be higher. Important is to make sure that the KPI’s are used in order to reach improvements. During the application on Scania S&S the authors saw some possible improvements and made the necessary changes. Nevertheless, in the thesis only the final version of the Valuation Model is presented. From out of the result that the Valuation Model led to, the authors strongly believe it works.
10.2 The Questionnaire as an Indication
When applying the Valuation Model it was the authors’ intention to find an approximated average value for each environmental aspect for a representative workshop. These quantitative values would be used in the column for Importance, for Costs and Volume. To achieve information about a representative workshop a questionnaire (see Appendix IV) was sent to a number of workshops, mainly in Sweden but also in Estonia. The questionnaire was completed by the Quality/Environmental managers of the workshops. Out of eight questionnaires sent to workshops five were returned filled in by the workshops. The questionnaire considers cost and volume broken down for each of the identified environmental aspects. After collecting the questionnaires, compiling the data and analysing it, the authors also realised it was not possible to create a representative average value. The figures presented in the questionnaires by the workshops were not comparable due to varying types of workshops. For instance since some of the workshops include commercial washes while others do not, which logically affect the water consumption. Another issue that made it complicated to reach an average value is the fact that conditions vary due to geographic location and the Swedish figures are not representative for the global situation. Differences regarding operations and global conditions make it complicated to reach standard values for a workshop. For other companies that will use the global Valuation Model, this has to be considered if the column ”Importance” in the Valuation Model is not preferred to be based on experience but is desirably based on qualitative data. The authors noticed that the figures that the workshops filled in varied. Possible reasons are that not all of the figures were possible to find for the workshops, but also due to misunderstandings of what the questionnaire was asking for. The workshops therefore reported figures based on their own assumptions. The questions have to be shaped to avoid misunderstandings so that no own

Environmental Performance and Reporting
76
assumptions of what data that is to be filled in can be done. Explanations of what data to report as well as comments of the data from the workshops are important, so the data can be trusted and deviations understood. Through the questionnaire the authors achieved an opinion on how much the workshops know about their environmental performance, how much time it would take them to fill out the questionnaire and finally the willingness and attitude towards a future environmental reporting. For Scania Helsingborg it took two hours to fill out the form (Björnberg, 2009), this can serve as good practice. This indicates that there is much knowledge about environmental performance within the workshops, or at least there are high possibilities to collect these types of data. The difficulty is that the data currently only is used internally at the workshops. The access to data might differ at workshops that do not operate as the workshops do in Sweden. For the other workshops the time varied, probably dependant on both how easy it was to find the data but also the prioritisation from the Quality/Environmental managers. The authors believe that it was the lack of time that resulted in only a few received questionnaires.
10.3 Evaluation of KPI’s
The KPI’s developed for Scania S&S are considered to be easy to understand for employees at all levels within the organisation. Since the KPI’s are connected to the workshops’ significant environmental aspects they are relevant. Also, the KPI’s have potential to create improvements of the environmental performance of the workshops and can easily be compared between different business units/workshops. This means the most important criteria, according to the authors, successful KPI’s should have are achieved.24 The above made reasoning is an evaluation of the design of the KPI’s. However, after an implementation of the KPI’s in the organisation the authors recommends Scania to evaluate the use of the KPI’s. The purpose of Scania’s evaluation is to see if the KPI’s lead to the desired result and the organisation achieves the goals connected to the environmental KPI’s. As mentioned in the theory the KPI’s can be connected to a reward system. Though, if this is suitable for the organisation to do or not should be discussed by the management. Reward system as a steering tool can be effective, but the question in this case is rather if it is in line with Scania’s way of acting.
24
See Chapter 3.3.1

Environmental Performance and Reporting
77
10.4 Reporting
The authors have looked into the reporting from tactical level to strategic level, but how it can be solved between operational to tactical is something that needs to be further investigated. However, the authors have observed a few essential things that now will be discussed. Important concerning the workshops is to let them focus on customers and not on time consuming paperwork (Björnberg, 2009). Though, in order to reach an increased control on strategic level, of how environmental work is preceded, reporting needs to be done. Much information already exists at the workshops – it is however not yet requested by anyone and therefore not used to any gain. When now calling for further reporting from the workshops it is therefore essential to make an easy solution for reporting that will not require too much time and be simple to include in the daily operations. Data that comes from operational level to tactical level should be of value for the tactical level in order to reach improvements. Data that is further reported to strategic level should only concern data that is requested. The authors have during this project seen some indications of that unnecessary reporting is time consuming and connected with frustration that is easy to avoid. For the workshops it is important to understand as well as see what the reporting leads to. This may for instance be getting feedback on the workshop’s environmental performance compared to others – realising a workshop has improved an aspect, are “best in class” or have to change some routines to reach the same performance as others. Another way is to observe a decrease of costs, since a lower energy use leads to lower costs for energy. In addition the annual report should be communicated so that the workshop can see that its figures are included and presented to external stakeholders. These aspects are observed by the authors both internally and externally and are important create a positive attitude towards in order to reach the desired result.
10.5 Organisational Structure
The authors see the matter of addressing responsibility as a prioritised question. This is what initially needs to be focused on to make the project of environmental reporting successful. The responsibility needs to be addressed to a specific department or person. It has to be unmistaken who is responsible for the project or completing certain tasks and who the owner of the information is. The clearer the responsibility is, the more effective the implementation will be. The motivation for addressed responsibility is not only for the daily handling of environmental performance and a way to create responsibility. It is also a method to indicate the question’s importance. This way the question will not be separated from the core business, but be included in the everyday handling throughout the whole organisation.

Environmental Performance and Reporting
78
Another aspect to consider is the steering documents regarding environmental performance for S&S since these are the documents the organisation will act from. At present the line of argument between the documents is not fully clear as within Industrial Operations. Also, there is a risk that the documents will overlap, for instance “Environment and Health & Work Environment within Sales & Services” and DOS. Therefore it is important that the responsibility is addressed for clarifying the environmental documents and the purpose for each of them, so that there is a unison approach for the environmental work within S&S. Important to point out is that this project will take time. Changing people’s mindset and introducing new routines for environmental reporting will not be done in immediately, but be a gradual process. It is therefore important to be patient, work continuously and not give up to get involvement from everyone and create environmental awareness.
10.6 Current situation versus the Future
The recommendations for today imply a limited amount of data is going to be reported to the strategic level from operational level. This because the implementation of this work both requires new routines, but also the ability to secure the quality of the data. Nevertheless, as time goes by the routines will set and the environmental performance as well as reporting will hopefully improve. This means more data will be available and can be collected if needed. More data can be needed to internally investigate better alternatives for improved environmental performance. Also to communicate that Scania has control over its environmental performance and is a player on the market that values sustainability and therefore tries to find cost efficient solutions that are environmentally friendly. Regarding the communication the authors see potential for Scania to improve. Scania does a lot of good things – things that other companies communicate while Scania do not communicate it, for example environmental education for employees. The opinions about how much information that needs to be communicated and how much time that should be spent on communication varies. With regard to the industry Scania are operating on it is of even greater importance to communicate its environmental performance and awareness. This way stakeholders and potential customers will know that Scania, despite of Scania’s products negative environmental impact which is hard to avoid, Scania still makes the best of the situation and takes the role as a responsible and sustainable player on the market.

Environmental Performance and Reporting
79
11 Conclusion Compared to its competitors Scania is neither ahead nor behind regarding environmental reporting for its service network. Companies that are best in class at this area, for instance Toyota, have some success factors in common. The first is management focus on environmental questions which symbolises the importance of the area and creates awareness. The second success factor is responsibility dedicated to specific persons for the environmental questions throughout the organisation. Finally, time since changing mindsets and organisational routines cannot be done over night. Also, concerning communication of the environmental performance Scania can learn from other companies. From an environmental perspective Scania does many valuable things that is not communicated externally today. In order to meet today’s increased demands on communication and transparency Scania needs to improve its environmental communication, which also can contribute to the company’s value. In order to find the company’s environmental aspects the authors’ work method, which includes a Valuation Model, has been applied on Scania Sales & Services. The result is that chemicals, energy use and waste are considered to be the significant environmental aspects from out of a global perspective. These are for Scania important to follow up and control as a first step towards improved environmental performance for S&S. Observing chemicals, energy use and waste as the environmental aspects that are of interest for Scania to follow up internally on a global level, the authors recommend the following key performance indicators:
Total number of chemicals used, of which number of chemicals that are listed in “the black- and grey list”
Energy use / Purchased hours
Recycled waste / Purchased hours
The proposed key performance indicators will help the management to control the environmental performance and signals which environmental aspects that are of importance. Beside the key performance indicators, Scania needs to decide which of Global Reporting Initiative’s performance indicators to focus. When recommending how the environmental work should be handled organisationally, the authors see the success factors from the benchmark analysis as important; management focus, responsibility and time. The initial focus should be on clarifying and addressing the responsibility. The implementation of environmental

Environmental Performance and Reporting
80
reporting, along with other changes like implementation of key performance indicators, will not be conducted unless these matters are addressed at every organisational level. Likewise, it is important that these questions get management focus so that they will not be a side activity, but integrated in daily operations. The authors see time as an important issue as well. Since other companies are ahead of Scania regarding environmental reporting, it is important to begin with a few focus areas within a near future. This can be a start in order to achieve awareness – later on the focus can be expanded. How the data is transported from the operational level to the tactical level has not been considered in the thesis due to the high number of different dealer systems among the business units. However, from the tactical level to the strategic level the data is recommended to be transported through SandS HFM. This database is intended to include interesting data, other than the financial data currently reported in HFM, which is the reason it is a suitable solution for environmental data. This thesis is a foundation and a suggestion for how Scania can handle its environmental performance and reporting for its service network in the future. There are many aspects to include and a lot of work needed to reach the desired result. However, the recommendations from this thesis are a start of Scania Sales & Services’ environmental work, in order to contribute to continuous improvements and Scania’s position as a successful and sustainable automotive company.

Environmental Performance and Reporting
81
12 Word List Captive network: Workshops that are owned by Scania CV AB. CSR: Corporate Social Responsibility (see Chapter 3.1) DOS: Dealer Operating Standard. This is a standard that sets up requirements a workshop has to fulfil in order to be a certified Scania workshop. (Björnberg, 2009) Environmental aspects: Element of an organisation’s activities or products or services that can interact with the environment (Swedish Standards Institute, 2004 p. 8) Environmental Management System (EMS): Part of an organisation’s management system used to develop and implement its environmental policy and manage its environmental aspects (Swedish Standards Institute, 2004 p. 8) Environmental performance: Measurable results of an organisation’s management of its environmental aspects (Swedish Standards Institute, 2004 p. 8) Environmental reporting: Reporting of environmental performance, such as a workshop’s total energy consumption during one year. GRI: Global Reporting Initiative. A large multi-stakeholder network that has developed a reporting framework for sustainability reporting. (Global Reporting Initiative, 2009) Group level: The mother company Scania CV AB. Industrial operations: This equals to Scania’s units Production & Procurement, Research & Development and Franchise & Factory Sales. ISO: International Organization for Standardization. The world’s largest developer and publisher of international standards. (International Organization for Standards, 2009) KPI: Key Performance Indicator (see Chapter 3.3) One Pager: An internal Scania document that links the strategy to key performance indicators. (Jedeur Palmgren, 2009) PDCA: Plan Do Check Act – a model for continuous improvement processes (see Chapter 3.2.1)

Environmental Performance and Reporting
82
S&S: Scania Sales & Services, which is one of Scania’s five units. (see Figure 1) Service network: Retailers and workshops, managed by S&S, which serve Scania’s customers. Significant environmental aspect: This equals to the most important aspects of the identified environmental aspects. Sustainability reporting: Reporting of a company’s economic, social and environmental performance. (Hörnfeldt, 2009) Workshop: A service station that offer Scania’s customers services, such as repair of vehicle, washing of vehicle, parts selling etcetera.

Environmental Performance and Reporting
83
13 List of References
Af Sandeberg, Rutger. 2009. Business Controller, Scania CV AB. Södertälje, 20 April 2009.
Af Sandeberg, Rutger. 2009. Business Controller, Scania CV AB. Södertälje, 24 February 2009.
Almgren, R and Brorson, T. 2003. Miljörevision. Handbok för miljörevisorer och andra som är intresserade av miljöleding och miljörevision. s.l. : Green Business AB, 2003. Vol. First edition.
Ammenberg, J. 2004. Miljömanagement. Lund : Studentlitteratur, 2004.
Andersson, Per-Magnus. 2009. University Lecturer, Department of Business Administration, School of Economics and Management, Lund University. 27 March 2009.
Andersson, Per-Magnus. 2009. University Lecturer, Department of Business Administration, School of Economics and Management, Lund University. Lund, 22 January 2009.
Balanced Scorecard Institute. 2009. The Deming Cycle. [Online] 7 May 2009. http://www.balancedscorecard.org/TheDemingCycle/tabid/112/Default.aspx.
Bell, Judith. 2006. Introduktion till forskningsmetodik. s.l. : Narayana Ortega, 2006. Vol. 4th volume.
Bjelkesjö, Karin and Björnberg, Lars. 2009. Sales and Services, Scania CV AB. Södertälje, 18 February 2009.
Bjelkesjö, Karin. 2009. Manager, Scania CV AB. Södertälje, 7 May 2009.
Bjelkesjö, Karin. 2009. Manager, Scania CV AB. Södertälje, 29 May 2009.
Bjelkesjö, Karin, Hörnfeldt, Elisabeth and Jedeur Palmgren, Niklas. 2008. Södertälje, 20 November 2008.
Bjelkesjö, Karin, Hörnfeldt, Elisabeth and Jedeur-Palmgren, Niklas. 2009. Södertälje, 4 May 2009.
Björnberg, Lars. 2009. Manager Facility Management, Scania CV AB. Södertälje, 10 February 2009.
Björnberg, Lars. 2009. Manager Facility Management, Scania CV AB. Södertälje, 1 April 2009.
Björnberg, Lars. 2009. Manager Facility Management, Scania CV AB. Södertälje, 10 February 2009.
Björnberg, Lars. 2009. Manager Facility Management, Scania CV AB. Södertälje, 21 April 2009.
Environmental Performance and Reporting
84
Boethius, Daniel. 2009. Manager Franchise Standards and Volume Planning, Scania CV AB. Södertälje, 12 May 2009.
Boman, Liis. 2009. Personnel Manager Human Resources and Environment, Toyota Sweden AB. Stockholm, 3 March 2009.
Borglund, Tommy, De Geer, Hans and Hallvarsson, Mats. 2009. Värdeskapande CSR, Hur företag tar social ansvar. Falun : ScandBook, 2009.
Catasús, B, et al. 2002. Boken om nyckeltal. s.l. : Akademitryck AB, 2002.
Crane, Andrew och Matten, Dirk. 2004. Business ethics: A European Perspective. New York : Oxford University Press, 2004.
Deming, Edwards W. 1986. Out of the Crisis, MIT Center for Advanced Educational Services. s.l. : MIT Center for Advanced Educational Services, 1986.
Designing performance measures: a structured approach. Neely, Andy, et al. 1997. 11, s.l. : MCB University Press, 1997, International Journal of Operations & Production Management, Vol. 17.
Designing, implementing and updating performance measurement systems. Bourne, M, et al. 2000. 7, s.l. : MCB University Press, 2000, International Journal of Operations & Production Management, Vol. 20.
Elgtorp, Anna. 2009. Quality and Environmental Coordinator, VW Group Sverige AB. Södertälje, 18 February 2009.
Erickson, Anders. 2009. Workshop Manager, Scania Bilar Stockholm. Stockholm, den 25 February 2009.
Falkenek, Anita. 2009. Substitute Environmental Manager, Svenska Statoil AB. Stockholm, 17 February 2009.
FAR SRS, Larsson, Lars-Olle, Öhrlings Pricewaterhouse Coopers. 2007. European Sustainability Report Association Report for Sweden. s.l. : European Sustainability Report Association, 2007.
Global Reporting Initiative. 2009. [Online] 3 May 2009. http://www.globalreporting.org.
Global Reporting Initiative. 2009. GRI Application Levels. [Online] 6 May 2009. http://www.globalreporting.org/NR/rdonlyres/FB8CB16A-789B-454A-BA52-993C9B755704/0/ApplicationLevels.pdf.

Environmental Performance and Reporting
85
Global Reporting Intiative. 2007. The GRI's Sustainability Report - July 2004-June 2007. Amsterdam, The Netherlands : s.n., 2007.
Gustavsson V, Fredrik. 2009. Head of Financial Management Support, Scania CV AB. Södertälje, 16 April 2009.
Gustavsson, Per. 2009. System Administrator, Scania CV AB. Södertälje, 16 April 2009.
Hörnfeldt, Elisabeth. 2009. Corporate Environmental Affairs, Scania CV AB. Södertälje, 10 February 2009.
Hörnfeldt, Elisabeth. 2009. Corporate Environmental Affairs, Scania CV AB. Södertälje, 7 May 2009.
International Organization for Standards. 2009. International Standards for Business, Government and Society. [Online] 11 May 2009. http://www.iso.org/iso/about.htm.
IVL Svenska Miljöinstitutet AB. 2009. Rapport: Förslag till indikatorerför att beskriva företagets och branschers miljöprestanda. [Online] 3 May 2009. http://www3.ivl.se/rapporter/pdf/B1337.pdf.
Jacobsen, Dag Ingvar. 2002. Var, hur och varför?: Om metodval i företagsekonomi och andra samhällsvetenskapliga ämnen. Lund : Studentlitteratur, 2002.
Jedeur Palmgren, Niklas. 2009. Head of Management Systems, Scania CV AB. Södertälje, 6 February 2009.
Jedeur Palmgren, Niklas. 2009. Head of Management Systems, Scania CV AB. Södertälje, 17 April 2009.
Johansson, U and Skoog, M. 2001. Att mäta och styra verksamheten – modeller med fokus på icke-materiella resurser. s.l. : Uppsala Publishing House, 2001.
Karlsson, Elisabeth. 2009. Head of Group Financial Reporting, Scania CV AB. Södertälje, 20 April 2009.
Kremsky, Samuel. 2009. Franchise Research Specialist, Scania CV AB. Södertälje, 23 April 2009.
Larsson, Lars-Olle. 2009. Partner, Sustainable Business Solutions, Öhrlings Pricewaterhouse Coopers. Stockholm, 20 February 2009.
Larsson, Lars-Olle. 2009. Öhrlings Pricewaterhouse Cooeprs, GRI Seminar. Stockholm : 9, 9 March 2009.

Environmental Performance and Reporting
86
Liljebladh, Hans. 2009. Health, Environment and Safety Coordinator, OK-Q8 AB. Stockholm, 16 March 2009.
Lindström, Per Åke. 2009. Quality Coordinator, Scania Bilar Stockholm. Stockholm, 25 February 2009.
Ljungdahl, Fredrik. 2009. Assistant Professor Jönköping International Business School, Senior Manager Öhrlings Pricewaterhouse Coopers. Stockholm, den 24 February 2009.
Measuring Organizational Performance: Beyond the Triple Bottom Line. Hubbard, Graham. 2006. s.l. : John Wiley and Sons, December 2006, Business Strategy and the Environment.
Methodological Reflections, Extended Version. Nilsson, Carl-Henric. 1994. First Draft, 1994. Nyberg, Rainer. 2000. Skriv vetenskapliga uppsatser och avhandlingar:med stöd av internet och IT. 4th volume. Lund : Studentlitteratur, 2000.
OK-Q8 AB. 2009. [Online] 3 May 2009. http://www.okq8.se.
Olsson, Susanne and Eriksson, Gunnar. 2009. Environmental Protection - Production, Scania CV AB. Södertälje, 5 February 2009.
Parmenter, David. 2007. Key Performance Indicators. Hoboken New Jersey : John Wiley & Sons, 2007.
Pondra, Frontwalker Group. 2009. Hållbarhetsportalen. [Online] 5 May 2009. http://www.hallbarhetsportalen.se/OmH%C3%A5llbarhetsportalen/Till%C3%A4mpningar/H%C3%A5llbarhetsredovisningenligtGRI/tabid/89/Default.aspx.
Scania CV AB. 2009. [Online] 02 May 2009. http://www.scania.com.
Scania CV AB. 2009. About the Scania Group. [Online] 2 May 2009. http://www.scania.com/about/.
Scania CV AB. 2008. How Scania is Managed. Södertälje : s.n., 2008.
Scania CV AB. 2007. Scania Annual Report. Södertälje : s.n., 2007.
Scania Forum of Chemical Support. 2009. Scania Black List, Scania Grey List. Södertälje : Scania CV AB, 2009.
Swedish Standards Institute. 2004. SS-EN ISO 14001:2004, 2nd edition. 2004.
Toyota Sweden AB. 2009. [Online] 3 May 2009. http://www.toyota.se.

Environmental Performance and Reporting
87
Trucost; Department for Environment Food and Rural Affairs. 2006. Environmental Key Performance Indicators - Reporting Guidelines for UK Business. UK : Queens's Printer and Controller, 2006. PB 11321.
Webb, Per. 2009. Lead Auditor - Management System, Scania CV AB. Södertälje, 3 March 2009.
Vogel, David. 2005. The Market for Virtue, The Potential and Limits of Corporate Social Responsibility. [Online] 2005. http://books.google.com/books?hl=sv&lr=&id=zXKZLvrO9QwC&oi=fnd&pg=PR9&dq=corporate+social+responsibility&ots=RpLOybbOIM&sig=WaomIRFRggfu7R-xOvruemvIEto#PPR14.
Öhrlings Pricewaterhouse Coopers. 2008. CSR - från risk till värde. Hässleholm : Exakta i Hässleholm AB, 2008.

Environmental Performance and Reporting
88
14 Appendices
Appendix I: Environmental Reporting in the Annual Report 2007 for Scania Industrial Operations

Environmental Performance and Reporting
89
Appendix II: Interview Questions to Benchmark Companies Interview questions to Toyota Sweden AB, VW Group Sverige AB, Svenska Statoil AB and OK-Q8 AB.
1. How are you currently working with environmental performance and reporting?
Do you have an environmental policy? Commiunicated environmental goals? Follow up of goals? Certification of service units? Environmental education? Etcetera
2. What environmental data are you following up from your service
units?
Which are your environmental aspects? Significant environmental aspects? How have you chosen your significant environmental aspects? Benefits/Drawbacks of the aspects followed up? Etcetera
3. What is reported externally/ to the mother company/ internally?
What environmental performance/data is reported externally? How come you have chosen to communicate what is communicated? What are you obliged to report to the mother company? What are you following up internally? Etcetera
4. Which systems are you using for handling the environmental
reporting?
How are you handling the information/the data? What system are you using? One system or many? Etcetera
5. In today’s reporting, what is well functioning? What are your areas
of improvement?

Environmental Performance and Reporting
90
Appendix III: Questions to Specialists
1. How do companies work with sustainability reports?
2. Are there any companies you could recommend that is best-in-class when it comes to sustainability reports?
3. How can a company quantify financial benefits of working with its
sustainability?
4. How can the reporting of sustainability data be performed?
5. How are sustainability questions handled organisationally?
6. How is the implementation of a system for sustainability reporting completed?
7. Are any experiences you would like to share considering work related
to sustainability?
8. Further input?

Environmental Performance and Reporting
91
Appendix IV: Questionnaire to Workshops Questionnaire sent to a number of Scania’s workshops in order to get input (data) to the column “Importance” in the Global Valuation Model.
Please give information for the past full year (2008). If not possible please give the information available and specify which period it regards.
For all costs, please record them in local currency and exclusive of any VAT.
General Amount
Number of employees, total
Workshop area (m2)
Opening hours per week (h)
Accidents Amount
Have you had any near-accidents during the past
year?
Have you had any accidents during the past year?
Definition:
Near-accident - leakages and spillages without environmental
impact
Accident - leakages and spillages with environmental impact
Material use Amount Costs
Total turnover
Sales of vehicles
Workshop
Parts and other material
Chemical use Amount Costs
Oils / Lubricants (m3)
Paint / Solvents, (m3)
Other chemicals, (m3)
Total number of chemical products
Number of products containing substances listed in
the "Black" and "Grey" list (STD 4158/59).
Energy use Amount Costs
Electricity (MWh)
Municipal heating or district heating (MWh)
Heating oil (MWh)
Petroleum gas (MWh)
Other fuels (MWh)
Water use Amount Costs
Total use (m3)
Emissions to air Amount
Do you have any emissions to air? If yes, please
specify and quantify if possible.
Emissions to water Amount
Do you have any emissions to water and soil? If yes,
please specify and quantify if possible.
Waste Amount Costs
Total waste (ton)
If possible please specify the following:
Material re-use (ton)
Landfill (ton)
Hazardous waste (ton)
Which 3 aspects from your workshop has the biggest
effect on the environment?
For example: Water use, emissions to air and waste to landfill
Definition: Material re-use commonly is metals, plastic, paper incl cardboard, but can as well be certain waste oils.
Definition: Emission to water can come from car wash
Definition: Emissions can come from burning, cooling, painting
Conversion factors: 10,0 MWh/m3 oil
The purpose of this questionnaire is to get information of your knowledge about the environmental impact from your dealer operation. This is information to be
used for identifying significant environmental aspects for Scania's Sales & Services units.
Dealer name and location:
Comment
Comment
Comment
Comment
Comment
Comment
Comment
Other
Introduction
Comment
Comment
Conversion factors: 12,8 MWh/ton petroleum gas
(if possible specify amount in ton)

Environmental Performance and Reporting
92
Appendix V: Questionnaire to Specialists for Input to the Valuation Model The area the thesis investigates is environmental performance and reporting for Scania Sales & Services, which means the environmental work and reporting for Scania’s workshops. One of our tasks in this project is to investigate which the workshops’ significant environmental aspects are. In order to do this we have developed a Valuation Model, which among others is based on ISO 14004’s recommendations regarding criteria for evaluation of environmental aspects (ISO’s criteria are Importance, Legal Requirements and Interested Parties). We hope that you will contribute with input regarding the stakeholder perspective (Interested parties) by sharing your opinions about the environmental aspects listed below. Our wish is that you on a scale from 1 to 5 (where 1= small societal debate and less important to follow up, while 5= large societal debate and very important to follow up) grade the aspects. You should not relate your opinions to Scania’s operations – what we are interested in is your opinions from out of a Swedish societal perspective.
Energy use Water use Material use Chemical use Emissions to air Emissions to water and soil Waste Accidents (risk handling)
We would be grateful if you make a valuation of the environmental aspects by grading the aspect on the scale 1-5 and thereafter return the email to us. Feel free to comment your valuation.

Environmental Performance and Reporting
93
Opinions – Input to Valuation Model A compilation of the experienced persons’ opinions about the environmental aspects. The persons valued the aspects on a scale from 1 to 5, where 1 is the lowest and 5 the highest.
En
vir
on
me
nta
l A
spe
cts
Person 1
Lund University
Person 2
Lund University
Person 3
Lund University
Person 4
Lund University
Person 5
Lund University
Person 6
Lund University
Person 7
The Swedish Environmental
Research Institute
Person 8
The Swedish Environmental
Research Institute
Person 9
Scania CV AB
Average score
Ener
gy
use
54
55
45
55
54
,8
Wa
ter
use
22
21
32
14
12
,0
Ma
teri
al
43
23
42
34
33
,1
Ch
emic
als
53
35
53
44
54
,1
Emis
sio
ns
to a
ir4
44
45
25
54
,1
Emis
sio
ns
to w
ate
r a
nd
so
il3
53
54
34
43
,9
Wa
ste
33
33
35
34
33
,3
Acc
iden
ts4
35
33
54
52
3,8

Environmental Performance and Reporting
94
Appendix VI: Discussion of the Workshops’ Environmental Aspects Energy use (Cost 4, Volume 3): Energy is a requirement for the workshop and its activities. On annual basis it is a relatively high cost for a workshop, where lighting and ventilation probably contribute to the main consumption. The volume of energy use is hard to reduce, without either changing the basic conditions for a workshop (like turning off the lights) or spending money on investments to reduce the consumption. Nevertheless, the source of the energy can be considered in order to choose a more environmentally friendly alternative. Water use (Cost 2, Volume 2): Water is naturally an aspect that is more important for workshops that offer commercial vehicle washing than for workshops with only a washing bay for internal use. Generally, water is cheap since it in most countries is not a limited resource. At present the water consumption is though almost as low as it can be in order for the workshops to still be able to offer commercial washes. This is due to the high degree of water reuse, which is also a result of regulations. Material (Cost 5, Volume 4): Material represents one of the largest costs for a workshop. Material is considered a large volume, which also requires routines and space for handling. On the other hand, there is no aim to reduce the volume of material since this is the workshop’s core business – the more material it sells/uses, the higher profitability. Still, for example the type of purchased material should be considered since it may have varying environmental impact. Chemicals (Cost 4, Volume 3): Chemicals – mainly oils, greases, glycols and washer fluids – stand for a large cost for the workshops. The chemicals need bulk handling, which indicates how it is handled and the volume it concerns. Emissions to air (Cost 1, Volume 1): The existing emissions to air at workshops are hardly existing, but if mentioned presently originate from driving the vehicles around the workshop area, test-driving of engines or seldom from burning of waste oil. Emissions to air are therefore neither a cost nor stands for any volume in a workshop. Emissions to water and soil (Cost 1, Volume 1): In the normal case emissions to water and soil barely exist in a workshop. Though, this type of emissions may lead to costs if for instance a stated “allowed” level is exceeded. However, it is neither a cost nor any volume. Waste (Cost 4, Volume 4): Generally, the more material used in the workshop, the more waste needs to be taken care of. Waste brings costs for handling and also constitutes a large volume. Still, since an increased level of material is positive for

Environmental Performance and Reporting
95
the workshop’s financial result it is hard to argue for a decreased amount of waste since the volume of these two aspects follow each other. Accidents (Cost 1, Volume 1): Normally, the amount of accidents is quite low and therefore also the cost for handling them. Nevertheless, if an accident occurs it brings costs, for example costs for decontamination. (Björnberg, 2009)
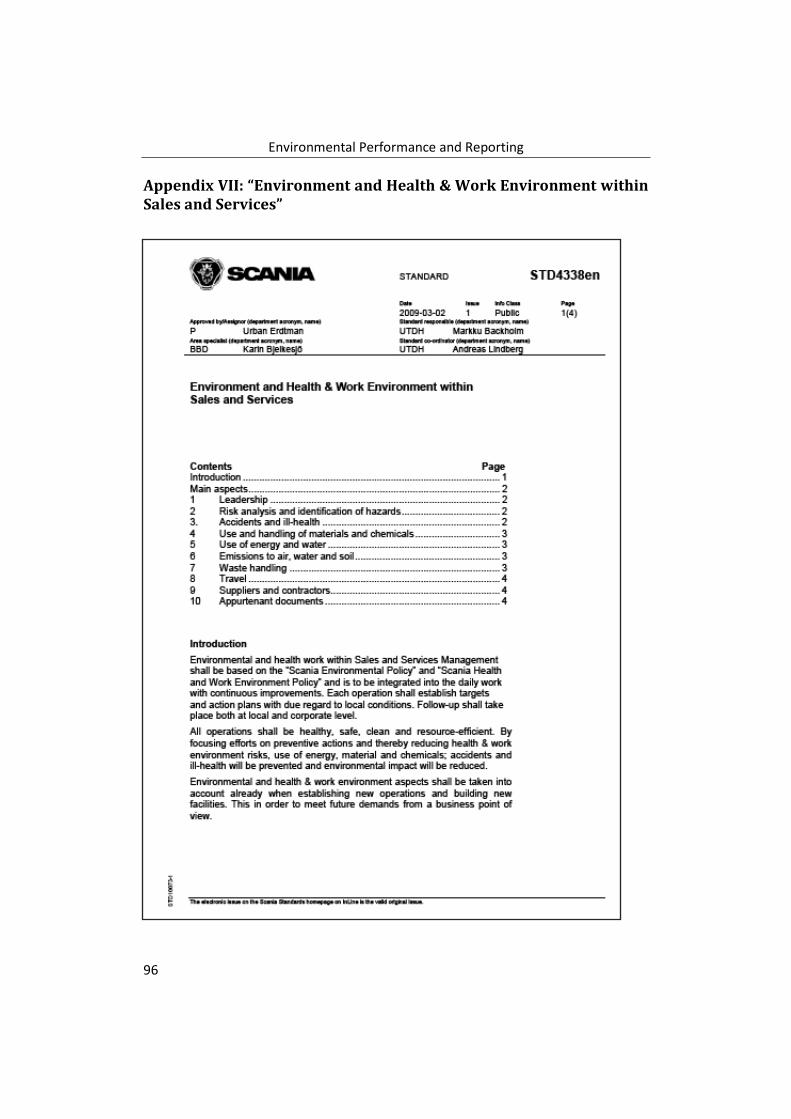
Environmental Performance and Reporting
96
Appendix VII: “Environment and Health & Work Environment within Sales and Services”

Environmental Performance and Reporting
97

Environmental Performance and Reporting
98

Environmental Performance and Reporting
99