environmental pollution and impact to public health
TRANSCRIPT
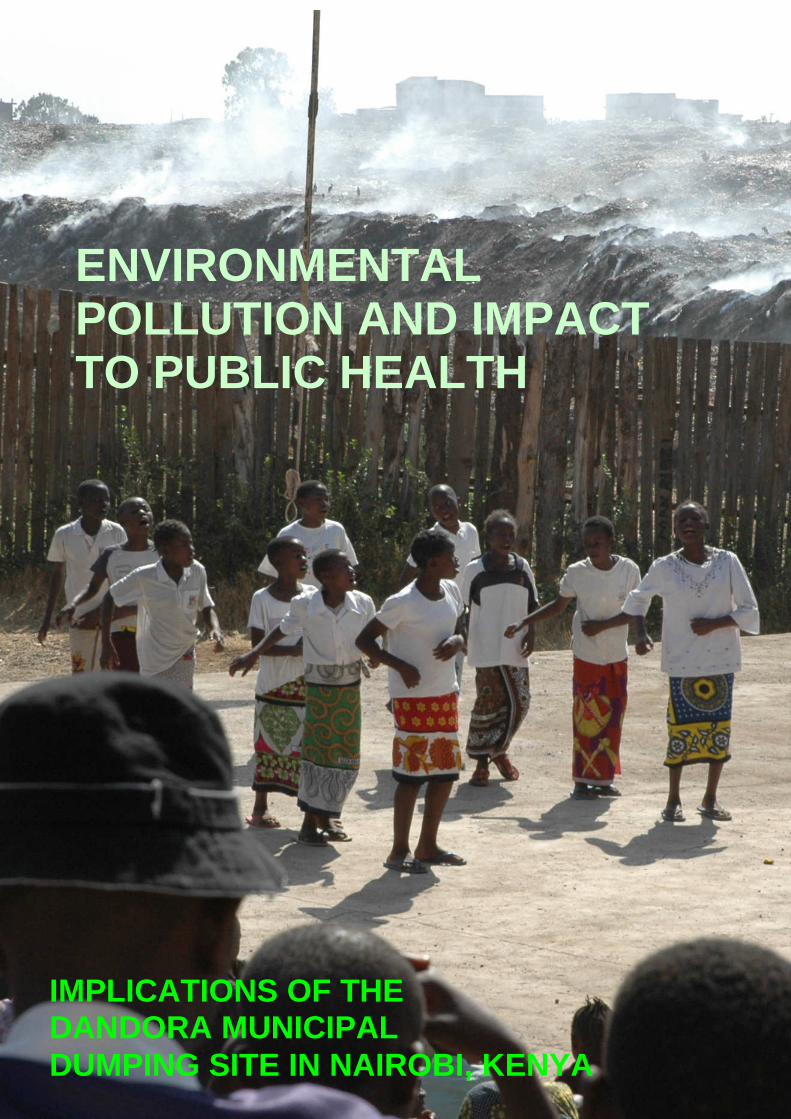
ENVIRONMENTAL POLLUTION AND IMPACT TO PUBLIC HEALTH
IMPLICATIONS OF THE DANDORA MUNICIPAL DUMPING SITE IN NAIROBI, KENYA

2
3
Environmental Pollution and Impact to Public Health; Implication of the Dandora Municipal Dumping Site in Nairobi, Kenya.
A PILOT STUDY REPORT NJOROGE G. KIMANI In cooperation with
THE UNITED NATIONS ENVIRONMENT PROGRAMME (UNEP)
Nairobi, Kenya, 2007

4
Cover Photo: Korogocho Children dancing during the Children day and inhaling toxic smokes from the Dandora dumpsite. Courtesy of Andrea Rigon Author/Editor: Njoroge G. Kimani, MSc Medical Biochemistry Clinical Biochemist/Principal Investigator Email: [email protected] In collaboration with; Rob De Jong and Jane Akumu United Nations Environment Programme (UNEP) Financial support for study made available by UNEP This document contains the original UNEP report. Kutoka Network has changed the layout and added some pictures with the only objective to facilitate the circulation of such an important document. Kutoka Network believes that this report is key for public health advocacy initiatives in Nairobi. For more information: www.kutokanet.com

5
Contents Acknowledgment 7 Executive Summary 8
CHAPTER 1 1 Introduction 9 1.1 Background Information 9 1.2 Solid Waste Management, Environmental Pollution and Impact to Public Health 10 1.2.1 Heavy metals 10 1.2.2 Persistent organic pollutants (POPs) 11 1.3 The Dandora Municipal Waste Dumping Site 12 1.4 Objectives of the Study 15 1.4.1 Broad objective 15 1.4.2 Specific objectives 15 1.5 Significance of the study 15
CHAPTER 2 2. Methodology and Results 16 2.1 Environmental Evaluation 16 2.1.1 Collection of soil samples and compost sample 16 2.1.2 Collection of water samples 16 2.1.3 Analysis of environmental samples 16 2.1.4 Results of environmental samples 17 2.2 Biomonitoring and Health Effects 20 2.2.1 Clinical evaluation 20 2.2.2 Collection of biological samples 22 2.2.3 Analysis of biological samples 22 2.2.4 Biological samples results 23 2.2.4.2 Urine samples 25
CHAPTER 3 3. Discussions and Conclusion 26 3.1 Discussions 26 3.2 Conclusions and recommendations 29
4. References 30
5. Annexures 31

6
List of Tables Table 1 Toxic Heavy Metals with established health effects 11 Table 2 Patients treated for respiratory tract abnormalities at the catholic Dispensary-Kariobangi 14 Box 1 Update of Table 2 (2009 data) 15 Table 3 Elemental concentration in soil samples from specific sampling sites 17 Table 4 Mean elemental concentration of soil samples from the Dandora/Korogocho/ 18 Table 5 Elemental concentration in Waithaka soil samples 18 Table 6 Heavy metal concentrations (ppm) in the study’s soil samples and soil standards 19 Table 7 Elemental concentration in the compost sample from the Dandora waste dumping site 19 Table 8 Elemental concentrations of water samples from Dandora /Korogocho /waste dumping 20 Table 9 Clinical presentations of children attended to at the St John Informal School Medical. 21 Table 10 Summary of Biochemistry investigations 23 Table 11 Haemoglobin levels in children at Korogocho 24 Table 12 Peripheral blood film results 24 Table 13 Blood lead levels 25 Table 14 Distribution of blood lead µg/dl levels by age. 25
List of Photographs Photograph 1 The Dandora Municipal Dumpsite burning at night 6 Photograph 2 An earth mover on site at the Dandora waste dumping site 12 Photograph 3 Smoke emanating from the Dandora waste dumping site hangs over residential 13 Photograph 4 Children scavenging for valuables at the Dandora waste dumping site 13 Photograph 5 A pig rests in the Nairobi River at the edge of the dumpsite 14 Photograph 6 The toxic smokes of the Dumpsite at the sunset 23
List of Figures Figure 1 Heavy metal concentrations in the study’s soil samples and soil standards 19 Figure 2 Distribution of Blood lead levels 25
List of Annexes Annexure 1 Sampling sites for soil and water samples at the Dandora waste dumping site 31 Annexure 2 Environmental samples; sampling and results 32 Annexure 3 Pesticides screen and polychlorinated biphenyls determination 34 Annexure 4 The Lead Care blood lead analyzer 35 Annexure 5 Biological samples results 36 Annexure 6 Blood lead levels for children at the St John Korogocho 39 Annexure 7 Topographical map of the Dandora waste dumping and its environs; circled area 40
ACKNOWLEDGMENT ●
7
Acknowledgement
The objectives of this study have been accomplished
through the concerted efforts by individuals,
institutions and organizations whose contributions
are greatly acknowledged and appreciated. In
particular, I am obliged to convey special thanks to:-
The United Nations Environment Programme
(UNEP) for proving the greatly needed financial
and logistical support.
Professor Eliud M. Njagi of School of pure and
applied sciences; Kenyatta University and Professor
Christine S. Kigondu of College of Health Sciences;
University of Nairobi; for their day to day guidance,
inspiration and support that was crucial to the
success of this study.
Rob de Jong and Jane Akumu both of UNEP who
played a key role in the conception, planning,
implementation and editing the report was an
immense contribution that provided a lot of
inspiration which enabled the completion of the
study despite the hardships encountered.
The religious Committee for antidumping
Dandora, The St. John Catholic Church-
Korogocho, Holy trinity Church-Kariobangi North,
Father Danielle Mosketti and the entire priesthood
of the Comboni Ministry for their various roles that
made this study a reality.
The staff and children of the St. John informal
School at Korogocho will always be remembered for
their unreserved participation in this study. Without
them, the results obtained would not have been
possible.
To the young men of Korogocho who accompanied
me and the study team during the field trips and
provided round the clock security and guidance
through the grounds of the dumping site and the
adjacent estates, your efforts will always be
remembered and greatly acknowledged.
Dr Loise Mutai and her team from the Kenyatta
National Hospital and all professional colleagues
who provided their support during the Medical
Camp at the St John Informal School.
Dr. Stephen K. Kimani of KARI the Consulting soil
Scientist and his assistants Mr. Peter Wakaba and
Mr. Nicholas Kungu for the big role they played in
collection, analysis and interpretation of analytical
results of environmental samples without which the
completion of this study would not have been
achieved.
Drs. Gatari J.M. and Maina D.M. of the Institute
of Nuclear Science for their unreserved advice and
support.
I am very grateful to the Laboratory staff of Kenya
Agricultural Research Institute (KARI) and Institute
of Nuclear Science who tirelessly worked to analyze
environmental samples and provide the much
needed results.
To all individuals who offered their precious time
and knowledge to the success of this work and in
regret of any omission that may have occurred, I
convey deep thanks to you for your contribution
and participation in whichever way to the benefits
of the environment and health of mankind
NGK

EXECUTIVE SUMMARY ●
8
We had anticipated some tough and worrisome findings, but the actual results are even more shocking than we had imagined at the outset.
Achim Steiner, UNEP Executive Director
Executive Summary
Environmental factors are a major contribution to
the global disease burden. According to the World
Health Organisation (WHO), a quarter of the
diseases afflicting mankind are as a result of
modifiable environmental risks. Most of the
environmentally related diseases are not easily
detected and may be acquired during childhood and
be manifested later in adulthood. As a result,
misdiagnosis and mismanagement of environmental
related illness may have occurred in numerous cases.
Indiscriminate handling and disposIndiscriminate handling and disposIndiscriminate handling and disposIndiscriminate handling and disposal of waste al of waste al of waste al of waste
from various industrial and domestic activities from various industrial and domestic activities from various industrial and domestic activities from various industrial and domestic activities
are major contributors of environmental are major contributors of environmental are major contributors of environmental are major contributors of environmental
pollutants that pose risks to human health. pollutants that pose risks to human health. pollutants that pose risks to human health. pollutants that pose risks to human health.
Although global, the problem of waste disposal is Although global, the problem of waste disposal is Although global, the problem of waste disposal is Although global, the problem of waste disposal is
more pronounced in the developing nations and more pronounced in the developing nations and more pronounced in the developing nations and more pronounced in the developing nations and
the socialthe socialthe socialthe social----econoeconoeconoeconomically underprivileged are most mically underprivileged are most mically underprivileged are most mically underprivileged are most
vulnerable. vulnerable. vulnerable. vulnerable.
The Dandora waste dumping site is a major disposal
site of waste generated from various activities in
Nairobi. There has been concern over the health
implications of this dumping site from numerous
quarters.
A pilot study was done to determine the impact A pilot study was done to determine the impact A pilot study was done to determine the impact A pilot study was done to determine the impact
to the environment and public health attributed to the environment and public health attributed to the environment and public health attributed to the environment and public health attributed
to the Dandora waste dumping site.to the Dandora waste dumping site.to the Dandora waste dumping site.to the Dandora waste dumping site.
Environmental samples (soil and water) were
analysed to determine contents and concentrations
of elements, polychlorinated biphenyls (PCBs) and
pesticides. Biological samples (blood and urine)
were analysed to determine several health indicators.
High levels of toxic heavy metals were noted in the Dandora soil samples. Health wise, 50% of the children were found to be having blood lead levels above 10 micrograms per deciliter of blood indicating exposure to high levels of environmental lead. The haematological system of most of the children is suppressed with 12.5% having haemoglobin levels below the normal ranges. The resuThe resuThe resuThe results obtained indicate high potential risk lts obtained indicate high potential risk lts obtained indicate high potential risk lts obtained indicate high potential risk
both to the environment and human health that both to the environment and human health that both to the environment and human health that both to the environment and human health that
can be attributed to the Dandora municipal can be attributed to the Dandora municipal can be attributed to the Dandora municipal can be attributed to the Dandora municipal
waste dumping site.waste dumping site.waste dumping site.waste dumping site. Further studies and
placement of appropriate intervention measures are
recommended.
Photograph 1 The Dandora Municipal Dumpsite burning at night. The toxic smokes are a 24 hours a day hazards for about 900,000 residents of the area. Courtesy of Andrea Rigon.

INTRODUCTION ●
9
Although environmentally related health problems affect people of all ages and from all sectors, children are more vulnerable than adults.
CHAPTER 1 1. Introduction
1.1 Background Information 1.1 Background Information 1.1 Background Information 1.1 Background Information
Global concern over the impact to public health
attributed to environmental pollution has increased
over the last three decades. At the United Nations
Conference on Environment and Development
(UNCED-1992), it was generally agreed that an
expanding human population coupled with
insufficient and inappropriate development results
to severe environmental health problems in both
developing and developed Nations.1 Living in
healthy environmental conditions has been
acknowledged as a key indicator towards attainment
of utmost human health. According to the World
Health Organisation (WHO), some 3.5 billion
people are exposed to high levels of air pollutants
which the World Bank defines as one of the four
critical Public Health problems worldwide.2 A
report by the WHO on the global disease burden
indicates that 24% of the disease burden is
attributable to environmental factors.
Key environmental factors mentioned to have Key environmental factors mentioned to have Key environmental factors mentioned to have Key environmental factors mentioned to have
great contribution to public health include great contribution to public health include great contribution to public health include great contribution to public health include
pollution of air, water and soil resulting to pollution of air, water and soil resulting to pollution of air, water and soil resulting to pollution of air, water and soil resulting to
potential exposure to chemical or biological potential exposure to chemical or biological potential exposure to chemical or biological potential exposure to chemical or biological
agents inagents inagents inagents in the form of toxic heavy metals, the form of toxic heavy metals, the form of toxic heavy metals, the form of toxic heavy metals,
endocrine disruptors, carcinogens or airborne endocrine disruptors, carcinogens or airborne endocrine disruptors, carcinogens or airborne endocrine disruptors, carcinogens or airborne
particulates. These environmental pollutants particulates. These environmental pollutants particulates. These environmental pollutants particulates. These environmental pollutants
contribute or worsen various ailments such as contribute or worsen various ailments such as contribute or worsen various ailments such as contribute or worsen various ailments such as
upper and lower respiratory tract abnormalities, upper and lower respiratory tract abnormalities, upper and lower respiratory tract abnormalities, upper and lower respiratory tract abnormalities,
cardiopulmonary diseases (diseases afcardiopulmonary diseases (diseases afcardiopulmonary diseases (diseases afcardiopulmonary diseases (diseases affecting the fecting the fecting the fecting the
heart and lungs), various forms of cancers, heart and lungs), various forms of cancers, heart and lungs), various forms of cancers, heart and lungs), various forms of cancers,
asthma, chronic obstructive pulmonary diseases asthma, chronic obstructive pulmonary diseases asthma, chronic obstructive pulmonary diseases asthma, chronic obstructive pulmonary diseases
(COPD), to mental and developmental (COPD), to mental and developmental (COPD), to mental and developmental (COPD), to mental and developmental
retardation.retardation.retardation.retardation.3333 4444
Although environmentally related health problems
affect people of all ages and from all sectors,
children are more vulnerable than adults.3 5 Among
children below five years, environmental related
illnesses are responsible for more than 4.7 million
deaths annually.6 The proportion of deaths related
to the environment in children aged between 0-14
years is 36%. 25% of deaths in developing nations
are related to environmental factors while in the
developed regions; only 17% of deaths are
attributed to the environment.3
The recognition on the great risk to children’s
health from the environment resulted to the WHO
appeal for a global movement to create healthy
environments at the World Summit on Sustainable
Development (WSSD) in Johannesburg 2002.7
This initiative has resulted to various conferences
and workshops highlighting issues concerning
children’s health and environment. In proceedings
of a Workshop on Children’s Health and the
Environment for African Paediatricians and Health
Care Providers organized by the UNEP, WHO and
International and the local Pediatricians Association
(IPA, KPA) in Nairobi in 2005, it was recognized
that in developing countries, the main
environmental problems affecting children are
exacerbated by poverty, illiteracy and malnutrition,
and include indoor and outdoor air pollution,
exposure to hazardous chemicals, accidents and
injuries. Furthermore, as countries become
industrialized, children become exposed to toxicants
commonly associated with the developed world,
creating an additional environmental burden of
disease.
Acute intoxication may cause easily discernable signs
and symptoms but which would be confused for
other illnesses while chronic exposure to low doses
of any particular toxin may not be suspected as most
of the effects are subclinical (cannot be diagnosed
easily by observation of clinical signs or symptoms).
Thus, it was observed that emphasis and training of

INTRODUCTION ●
10
o Domestic wasteDomestic wasteDomestic wasteDomestic waste is that waste that
originates from homes and may range from
remnants of/or expired foods to household
chemicals, various forms of packaging
materials, electrical instruments and
utensils,
o Industrial wasteIndustrial wasteIndustrial wasteIndustrial waste may consist of falloff or
unused chemicals/raw materials used in
manufacturing processes, expired products
and substandard goods,
o Agricultural wasteAgricultural wasteAgricultural wasteAgricultural waste may be chemicals
used as pesticides (herbicides and
fungicides) and unwanted agricultural
products,
o Hospital wasteHospital wasteHospital wasteHospital waste includes among others
packaging materials and containers, used
syringes and sharps, biological waste, and
pharmaceuticals.
The indiscriminate disposal and handling of waste, leads to environmental degradation, destruction of the ecosystem and poses great risks to public health.
medical personnel on the recognition, diagnosis and
management of environmentally related diseases is
required.4 8
1.2 Solid Waste Management, Environmental 1.2 Solid Waste Management, Environmental 1.2 Solid Waste Management, Environmental 1.2 Solid Waste Management, Environmental
Pollution and Impact to Public Health Pollution and Impact to Public Health Pollution and Impact to Public Health Pollution and Impact to Public Health
Solid waste is any non-fluidic/non-flowing
substance that has been identified to be of no use at
a particular point or source either as a raw material,
end product, expired products, containers or after
use remnants. Solid waste is generated from various
human activities such as domestic, hospital,
industrial and agricultural activities.
Depending on the source, the waste may be of no
risk, infectious, toxic or radioactive. Waste
generated from different sources is disposed of in
various ways and some may require special handling
and disposal. Most of the waste disposal systems
used includes landfills, dumping in a specified
location (waste dumping sites), burying in pits,
open air burning, incineration or discarding into
rivers and large water bodies (ocean and seas).
Waste management poses a great challenge due Waste management poses a great challenge due Waste management poses a great challenge due Waste management poses a great challenge due
to potential pollution of water sources, food to potential pollution of water sources, food to potential pollution of water sources, food to potential pollution of water sources, food
sources, land, air and vegetation. sources, land, air and vegetation. sources, land, air and vegetation. sources, land, air and vegetation.
The indiscriminate disposal and handling of waste,
leads to environmental degradation, destruction of
the ecosystem and poses great risks to public health.
Municipal waste dumping sites are designated places
where waste from various sources is deposited onto
an open hole or ground.
In most cases, due to lack of regulations and In most cases, due to lack of regulations and In most cases, due to lack of regulations and In most cases, due to lack of regulations and
proper disposal facilities in places generproper disposal facilities in places generproper disposal facilities in places generproper disposal facilities in places generating ating ating ating
waste, most of the waste is disposed off into waste, most of the waste is disposed off into waste, most of the waste is disposed off into waste, most of the waste is disposed off into
dumping sites. As such, different types of waste dumping sites. As such, different types of waste dumping sites. As such, different types of waste dumping sites. As such, different types of waste
find their way into a particular dumping site find their way into a particular dumping site find their way into a particular dumping site find their way into a particular dumping site
which exposes the surrounding community to which exposes the surrounding community to which exposes the surrounding community to which exposes the surrounding community to
various environmental hazards. various environmental hazards. various environmental hazards. various environmental hazards.
Municipal waste dumping sites have been
recognized as a major source of environmental
toxicants (ETs) that are of great risk to human
health.9 Major environmental pollutants from waste
dumping sites may include heavy metals and
persistent organic pollutants (high production
volume chemicals, polychlorinated biphenyls,
dioxins and furans).
1.2.1 Heavy metals 1.2.1 Heavy metals 1.2.1 Heavy metals 1.2.1 Heavy metals
Heavy metals are metallic elements that are present
in both natural and contaminated environments.
Heavy metals of public health concern include Lead,
Mercury, Cadmium, Arsenic, Chromium, Zinc,
Nickel and Copper. Heavy metals may be released
into the Environment from metal smelting and
refining industries, scrap metal dealers, plastic and
rubber industries, several consumer products and
burning of waste containing heavy metals. On
release to the air, the elements travel for large

INTRODUCTION ●
11
distances and are deposited onto the soil, vegetation
and water depending on their density. On
deposition, the heavy metals are not degraded and
persist in the environment for many years. Among
the heavy metals, lead is one of the most widely
distributed and largely found in municipal dumping
sites where lead containing waste is deposited or
burning of waste containing lead (e.g. plastics,
rubber, painted/ lead paint treated wood e.t.c.) is
done.
Heavy metaHeavy metaHeavy metaHeavy metals and their compounds have ls and their compounds have ls and their compounds have ls and their compounds have
different physical and chemical characteristics different physical and chemical characteristics different physical and chemical characteristics different physical and chemical characteristics
and poses diverse toxicological characteristics. and poses diverse toxicological characteristics. and poses diverse toxicological characteristics. and poses diverse toxicological characteristics.
Human beings get poisoned through inhalation, Human beings get poisoned through inhalation, Human beings get poisoned through inhalation, Human beings get poisoned through inhalation,
ingestion and skin absorption. Acute exposures ingestion and skin absorption. Acute exposures ingestion and skin absorption. Acute exposures ingestion and skin absorption. Acute exposures
to high levels cause nausea, anorexiato high levels cause nausea, anorexiato high levels cause nausea, anorexiato high levels cause nausea, anorexia, vomiting, , vomiting, , vomiting, , vomiting,
gastrointestinal abnormalities and dermatitis. gastrointestinal abnormalities and dermatitis. gastrointestinal abnormalities and dermatitis. gastrointestinal abnormalities and dermatitis.
Chronic exposures to heavy metals cause Chronic exposures to heavy metals cause Chronic exposures to heavy metals cause Chronic exposures to heavy metals cause
cumulative toxic effects which affect various cumulative toxic effects which affect various cumulative toxic effects which affect various cumulative toxic effects which affect various
systems in the body depending on the heavy systems in the body depending on the heavy systems in the body depending on the heavy systems in the body depending on the heavy
metal involved.metal involved.metal involved.metal involved.10101010
Major heavy metals known to be detrimental to
human health are presented in Table 1.
Table 1Table 1Table 1Table 1.... Toxic Heavy Metals with established health effects Toxic Heavy Metals with established health effects Toxic Heavy Metals with established health effects Toxic Heavy Metals with established health effects
Heavy Heavy Heavy Heavy
Metal Metal Metal Metal
Sources of Environmental Sources of Environmental Sources of Environmental Sources of Environmental
exposure exposure exposure exposure
Minimum Risk level Minimum Risk level Minimum Risk level Minimum Risk level Chronic exposure toxicity effects Chronic exposure toxicity effects Chronic exposure toxicity effects Chronic exposure toxicity effects
LeadLeadLeadLead11111111 Industrial and vehicular
emissions, paints and
burning of plastics, papers
etc
Blood lead levels below
10 micrograms per
decilitre of blood
Impairment of neurological development,
Suppression of the haematological system
(anaemia), Kidney failure,
immunosuppression etc.
MercuryMercuryMercuryMercury12121212 Electronics and plastic
waste, pesticides,
pharmaceutical and dental
waste
Below 10 micrograms
per deciliter of blood;
oral RfD 4mg/kg/day
Gastrointestinal and respiratory tract
irritation, renal failure, neurotoxic
CadmiumCadmiumCadmiumCadmium13131313 Electronic, plastics,
batteries-diet and water
Below 1 microgram per
decilitre of blood
Local irritation of the lungs and
gastrointestinal tract, kidney damage and
abnormalities of skeletal system
ArsenicArsenicArsenicArsenic14141414 Herbicides and pesticides,
electronics, burning of
waste containing the
element, contaminated
water
Oral exposure of
0.0003mg/kg/day
Inflammation of the liver, peripheral nerve
damage-neuropathy, cancer of liver, skin and
lungs, irritation of the upper respiratory
system-pharyngitis, laryngitis, rhinitis,
anaemia, cardiovascular diseases
1.2.2 Persistent organic pollutants (POPs) 1.2.2 Persistent organic pollutants (POPs) 1.2.2 Persistent organic pollutants (POPs) 1.2.2 Persistent organic pollutants (POPs)
These are long-lasting non-biodegradable organic
compounds that bio-concentrate in the food chain
especially fish and livestock and pose serious health
risks to human populations. They do not dissolve in
water but are readily stored in fatty tissue. These
substances accumulate in human fatty tissue and
may be passed to infants through breast milk.
Under the POPs treaty (the Stockholm Convention
on Persistent Organic Pollutants), chemicals such as
aldrin, dieldrin, dichlorodiphenyl-trichloroethane
(DDT), endrin, heptachlor, toxaphene, chlordane,
hexachlorobenzene, mirex (high production volume
chemicals and Pesticides:- Organochlorines,
Organophosphates, carbamates) and
polychlorinated biphenyl’s (polychlorinated
dibenzo-p-dioxins (PCDDs) and polychlorinated
dibenzofurans (PCDFs) are to be phased out and
eliminated.4,10,15,16,17
Polychlorinated biphenyl’s (PCBs) are synthetic
organic compounds that are either solids or liquids
and are colorless or light yellow. During production
of PCBs, highly toxic substances known as Dioxins
and Furans are produced. Polychlorinated dibenzo-
p-dioxins (PCDDs) and polychlorinated
INTRODUCTION ●
12
Some members of the research team developed respiratory and abdominal irritation and/or experienced long period of fatigue and inactivity due to exposure to this environment.
dibenzofurans (PCDFs) commonly referred to as
dioxins may also result from low combustion of
materials containing PCBs such as plastics, rubber
and paper products.
Human beings absorb PCBs, Dioxins and Furans Human beings absorb PCBs, Dioxins and Furans Human beings absorb PCBs, Dioxins and Furans Human beings absorb PCBs, Dioxins and Furans
by inhalation, ingestion and absorption through by inhalation, ingestion and absorption through by inhalation, ingestion and absorption through by inhalation, ingestion and absorption through
the skin. PCBs, PCDDs and PCDFs has been the skin. PCBs, PCDDs and PCDFs has been the skin. PCBs, PCDDs and PCDFs has been the skin. PCBs, PCDDs and PCDFs has been
associated with endocrine disruption (interfere associated with endocrine disruption (interfere associated with endocrine disruption (interfere associated with endocrine disruption (interfere
withwithwithwith the body’s hormonal signaling system), the body’s hormonal signaling system), the body’s hormonal signaling system), the body’s hormonal signaling system),
developmental toxicity, low IQ scores and risks developmental toxicity, low IQ scores and risks developmental toxicity, low IQ scores and risks developmental toxicity, low IQ scores and risks
of development of cancers.of development of cancers.of development of cancers.of development of cancers.4,5,16,174,5,16,174,5,16,174,5,16,17
1.3 The Dandora Municipal Waste Dumping 1.3 The Dandora Municipal Waste Dumping 1.3 The Dandora Municipal Waste Dumping 1.3 The Dandora Municipal Waste Dumping
Site Site Site Site
The Dandora Municipal waste dumping site is a
major dumping site located at the East of Nairobi in
Kenya. The dumping site is about 8 kilometers away
from the city centre and occupies about 30 acres of
land. Surrounding the dumping site, are the
Kariobangi North and Korogocho slums and low
income earners residential estates of Dandora and
Babadogo.
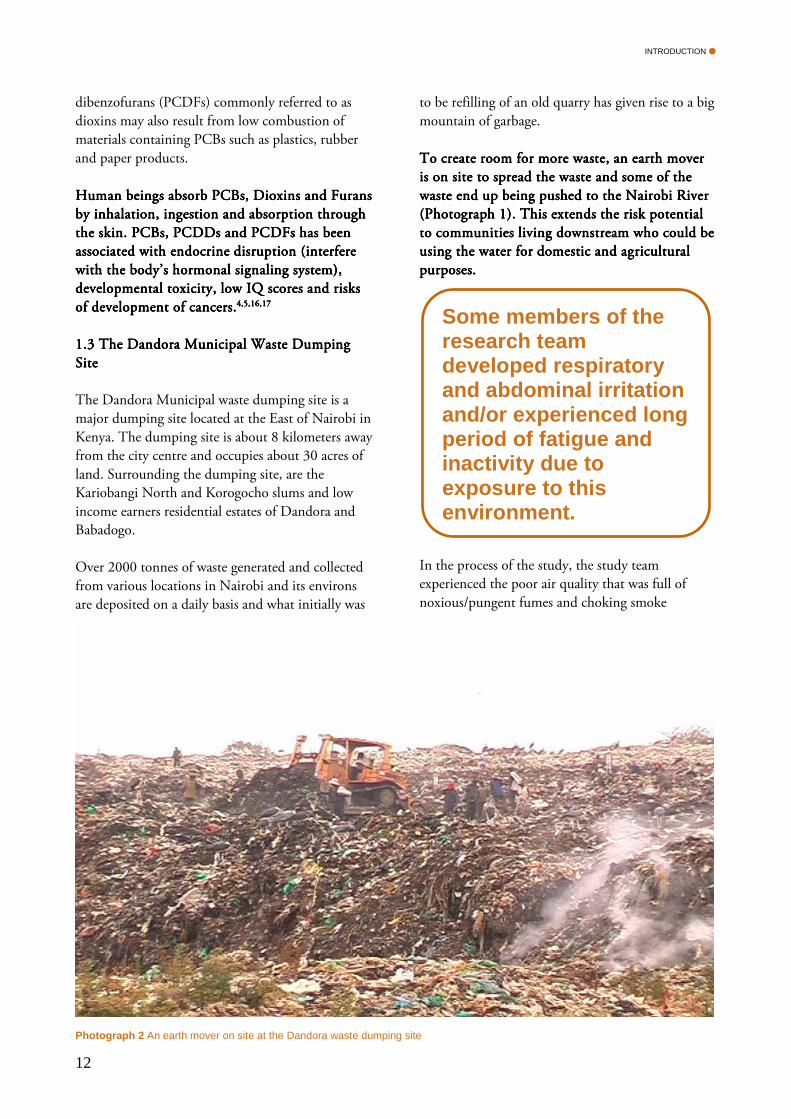
Over 2000 tonnes of waste generated and collected
from various locations in Nairobi and its environs
are deposited on a daily basis and what initially was
to be refilling of an old quarry has given rise to a big
mountain of garbage.
To creatTo creatTo creatTo create room for more waste, an earth mover e room for more waste, an earth mover e room for more waste, an earth mover e room for more waste, an earth mover
is on site to spread the waste and some of the is on site to spread the waste and some of the is on site to spread the waste and some of the is on site to spread the waste and some of the
waste end up being pushed to the Nairobi River waste end up being pushed to the Nairobi River waste end up being pushed to the Nairobi River waste end up being pushed to the Nairobi River
(Photograph 1). This extends the risk potential (Photograph 1). This extends the risk potential (Photograph 1). This extends the risk potential (Photograph 1). This extends the risk potential
to communities living downstream who could be to communities living downstream who could be to communities living downstream who could be to communities living downstream who could be
using the water for domestic ausing the water for domestic ausing the water for domestic ausing the water for domestic and agricultural nd agricultural nd agricultural nd agricultural
purposes. purposes. purposes. purposes.
In the process of the study, the study team
experienced the poor air quality that was full of
noxious/pungent fumes and choking smoke
Photograph 2 An earth mover on site at the Dandora waste dumping site

INTRODUCTION ●
13
Photograph 3 Smoke emanating from the Dandora waste dumping site hangs over residential estates at the background.
emanating from the dumping site as a result of
deliberate waste burning and methane fires. Most of
the time, the entire area is engulfed by crowds of
black smoke (photograph 2).
Some members of the research team developed
respiratory and abdominal irritation and/or
experienced long period of fatigue and inactivity
due to exposure to this environment.
Dumping at the site is unrestricted and industrial,
agricultural, domestic and medical wastes (especially
used needles) are seen strewn all over the dumping
site.
Movement into and out of the dumping site is
unrestricted and scores of people are on site
scavenging for food products and other valuables
that they later sell to others as a source of income
(photograph 3). Other people sort out the waste for
recycling and compost generation. The compost is
sold to potential customers for use in farming.
Several people reside inside the dumping site which
also harbors criminal elements. Domestic animals
such as pigs, cows and goats forage through the
waste for feeds.
Apart from the community around the dumping Apart from the community around the dumping Apart from the community around the dumping Apart from the community around the dumping
site being exposed to dangerous environmental site being exposed to dangerous environmental site being exposed to dangerous environmental site being exposed to dangerous environmental
pollutants in the environment and consumption pollutants in the environment and consumption pollutants in the environment and consumption pollutants in the environment and consumption
of contaminof contaminof contaminof contaminated foodstuff, people far off are also ated foodstuff, people far off are also ated foodstuff, people far off are also ated foodstuff, people far off are also
at risk of exposure by consumption of meat or at risk of exposure by consumption of meat or at risk of exposure by consumption of meat or at risk of exposure by consumption of meat or
poultry products as well as vegetables cultivated poultry products as well as vegetables cultivated poultry products as well as vegetables cultivated poultry products as well as vegetables cultivated
using compost from the site. using compost from the site. using compost from the site. using compost from the site.
Residents of Dandora, Korogocho and Kariobangi
estates, religious and non religious organizations, the
Health Ministry and other arms of the Government
have had concern over the possible risk to human
health that could be attributed to the dumping site.
Despite this, waste dumping continues unabated
and appropriate preventive measures that would
reduce the impact to the environment and human
health are yet to be undertaken.
According to records obtained from the Catholic
Church dispensary at Kariobangi, for the period
between 2003 and May 2006, an average 9121
people per annum had been treated for respiratory
tract related problems at the center. To many of the
residents and local health care providers, these
abnormalities are exacerbated by the environment
around the dumping site. The people are also at risk
of contracting blood borne diseases such as HIV
Photograph 4 Children scavenging for valuables at the Dandora waste dumping site.

INTRODUCTION ●
14
People far off are also at risk of exposure by consumption of meat or poultry products as well as vegetables cultivated using compost from the site.
and hepatitis through accidental injury by used
needles and other medical waste.
Table 2 shows records for the period between
January 2003 and May 2006 from the dispensary on
patients treated for respiratory tract problems at the
Catholic Church dispensary.
Although the need to move the dumping site away
from its current site has been recognized, the , the , the , the
biggest contributing factor to the poor biggest contributing factor to the poor biggest contributing factor to the poor biggest contributing factor to the poor
environment is tenvironment is tenvironment is tenvironment is the management of the dumping he management of the dumping he management of the dumping he management of the dumping
site.site.site.site.
While the relocation has been hampered by lack of a
suitable place for relocation on the one hand and
individuals who earn a living from the dumping site
on the other, the dumping of waste goes on
unregulated.
Even ifEven ifEven ifEven if the dumping is halted forthwith and the dumping is halted forthwith and the dumping is halted forthwith and the dumping is halted forthwith and
relocation effected, its long term effects will relocation effected, its long term effects will relocation effected, its long term effects will relocation effected, its long term effects will
continue to be felt by the communities living continue to be felt by the communities living continue to be felt by the communities living continue to be felt by the communities living
around as most of the toxic substances persist for around as most of the toxic substances persist for around as most of the toxic substances persist for around as most of the toxic substances persist for
long in the environment. long in the environment. long in the environment. long in the environment.
At the same time, in absence of appropriate At the same time, in absence of appropriate At the same time, in absence of appropriate At the same time, in absence of appropriate
knoknoknoknowledge on effects of dumping, lack of wledge on effects of dumping, lack of wledge on effects of dumping, lack of wledge on effects of dumping, lack of
policies regulating waste disposal and failure to policies regulating waste disposal and failure to policies regulating waste disposal and failure to policies regulating waste disposal and failure to
enhance any existing policies, relocation could enhance any existing policies, relocation could enhance any existing policies, relocation could enhance any existing policies, relocation could
result to a transfer of the problem to others who result to a transfer of the problem to others who result to a transfer of the problem to others who result to a transfer of the problem to others who
would encroach on the dumping site and failure would encroach on the dumping site and failure would encroach on the dumping site and failure would encroach on the dumping site and failure
to input preventive meato input preventive meato input preventive meato input preventive measures against adverse sures against adverse sures against adverse sures against adverse
effects both to the environment and public effects both to the environment and public effects both to the environment and public effects both to the environment and public
health. health. health. health.
This calls for urgent measures towards This calls for urgent measures towards This calls for urgent measures towards This calls for urgent measures towards
appropriate management of the dumping site. appropriate management of the dumping site. appropriate management of the dumping site. appropriate management of the dumping site.
Table 2Table 2Table 2Table 2.... Patients treated for respiratory tract Patients treated for respiratory tract Patients treated for respiratory tract Patients treated for respiratory tract
abnormalities at the catholic Dispensaryabnormalities at the catholic Dispensaryabnormalities at the catholic Dispensaryabnormalities at the catholic Dispensary----
KariobaKariobaKariobaKariobangi ngi ngi ngi
Month Month Month Month 2003 2003 2003 2003 2004 2004 2004 2004 2005 2005 2005 2005 2006 2006 2006 2006
January January January January 978 978 978 978 837 837 837 837 890 890 890 890 927 927 927 927
February February February February 901 901 901 901 868 868 868 868 803 803 803 803 701 701 701 701
March March March March 1023 1023 1023 1023 740 740 740 740 1257 1257 1257 1257 1375 1375 1375 1375
April April April April 895 895 895 895 831 831 831 831 940 940 940 940 851 851 851 851
May May May May 885 885 885 885 921 921 921 921 967 967 967 967 975 975 975 975
June June June June 1121 1121 1121 1121 856 856 856 856 1371 1371 1371 1371
July July July July 1090 1090 1090 1090 919 919 919 919 989 989 989 989
August August August August 986 986 986 986 581 581 581 581 1067 1067 1067 1067
September September September September 1111 1111 1111 1111 613 613 613 613 570 570 570 570
October October October October 956 956 956 956 782 782 782 782 1081 1081 1081 1081
November November November November 987 987 987 987 698 698 698 698 790 790 790 790
December December December December 65 65 65 65 534 534 534 534 752 752 752 752
Total Total Total Total 10998 10998 10998 10998 9180 9180 9180 9180 11477 11477 11477 11477 4829 4829 4829 4829
Monthly average Monthly average Monthly average Monthly average 917 917 917 917 765 765 765 765 956 956 956 956 966 966 966 966
Source: Medical records at the Catholic Church Dispensary at Kariobangi North 2003-2006
Photograph 5 A pig rests in the Nairobi River at the edge of the dumpsite. Animals eat toxic waste creating an health hazard for the humans consuming their meat. Courtesy of Andrea Rigon.

INTRODUCTION ●
15
oooo Evaluate the environmental impact of Evaluate the environmental impact of Evaluate the environmental impact of Evaluate the environmental impact of
the dumping site to the surrounding the dumping site to the surrounding the dumping site to the surrounding the dumping site to the surrounding
areas throareas throareas throareas through determination of the ugh determination of the ugh determination of the ugh determination of the
contents and concentrations of contents and concentrations of contents and concentrations of contents and concentrations of
elements, polychlorinated elements, polychlorinated elements, polychlorinated elements, polychlorinated
biphenyls/dioxins and pesticides in biphenyls/dioxins and pesticides in biphenyls/dioxins and pesticides in biphenyls/dioxins and pesticides in
environmental samples, environmental samples, environmental samples, environmental samples,
oooo Determine the effects of exposure and Determine the effects of exposure and Determine the effects of exposure and Determine the effects of exposure and
the health status of children through the health status of children through the health status of children through the health status of children through
clinical and laboratory analysis, clinical and laboratory analysis, clinical and laboratory analysis, clinical and laboratory analysis,
oooo Show a cause effect relationship of the Show a cause effect relationship of the Show a cause effect relationship of the Show a cause effect relationship of the
environmental pollutants and children’s environmental pollutants and children’s environmental pollutants and children’s environmental pollutants and children’s
health, health, health, health,
oooo Determine areas of focus and Determine areas of focus and Determine areas of focus and Determine areas of focus and
allocation of resources in allocation of resources in allocation of resources in allocation of resources in
implementation of a comprehensive implementation of a comprehensive implementation of a comprehensive implementation of a comprehensive
study.study.study.study.
1.4 Objectives of the Study 1.4 Objectives of the Study 1.4 Objectives of the Study 1.4 Objectives of the Study
1.4.1 Broad obje1.4.1 Broad obje1.4.1 Broad obje1.4.1 Broad objective ctive ctive ctive
Carry out a pilot study to establish impact to the Environment and Public Health that can be attributed to the Dandora waste dumping site.
1.4.2 Specific objectives 1.4.2 Specific objectives 1.4.2 Specific objectives 1.4.2 Specific objectives
1.5 Significance of the study 1.5 Significance of the study 1.5 Significance of the study 1.5 Significance of the study
Results obtained from this study will be integral in
providing more knowledge to health care providers
on environmental factors and their contribution to
ill health that will be an indicator to appropriate
intervention towards prevention and reduction of
the disease burden and cost to the health care
system. The information is also relevant to nonThe information is also relevant to nonThe information is also relevant to nonThe information is also relevant to non----
health authorities who influence policies with an health authorities who influence policies with an health authorities who influence policies with an health authorities who influence policies with an
impact to the environmentimpact to the environmentimpact to the environmentimpact to the environment such as the National
Environment Management Authority (NEMA), the
City Council and Ministries of
Planning/Development and Housing.
The findings will be part of UNEP’s database on the
environment and impacts to human health and will
be useful as an Africa case study. The study will also
be integral in providing information on the
availability and requirements in technology and
skills for carrying out major studies on
environmental and health issues within our setup.
A pilot study has been conducted at the environs A pilot study has been conducted at the environs A pilot study has been conducted at the environs A pilot study has been conducted at the environs
of Dandora waste dumping site on the of Dandora waste dumping site on the of Dandora waste dumping site on the of Dandora waste dumping site on the
environmental pollutants and children living at environmental pollutants and children living at environmental pollutants and children living at environmental pollutants and children living at
the neighbouring estates. the neighbouring estates. the neighbouring estates. the neighbouring estates.
UNEP funded and supported the study that was
conducted in collaboration with the St. John
Catholic Church in Korogocho. Health experts and
Scientists drawn from the University of Nairobi-
College of Health Sciences and Institute of Nuclear
Science, Kenyatta University-School of Pure and
Applied Sciences, Kenyatta National Hospital and
the Kenya Agricultural Research Institute played
various roles individually and collectively in
implementation of this study. This report details the
findings of the pilot study.
Box. 1 Update of Table 2Box. 1 Update of Table 2Box. 1 Update of Table 2Box. 1 Update of Table 2.... ((((2009 data2009 data2009 data2009 data).).).). Patients treated for respiratory tract Patients treated for respiratory tract Patients treated for respiratory tract Patients treated for respiratory tract
abnormalities at the catholic Dispensaryabnormalities at the catholic Dispensaryabnormalities at the catholic Dispensaryabnormalities at the catholic Dispensary----
Kariobangi.Kariobangi.Kariobangi.Kariobangi.
As it can be observeAs it can be observeAs it can be observeAs it can be observedddd by comparing these data by comparing these data by comparing these data by comparing these data
withwithwithwith Table 2., the situation in the area affected Table 2., the situation in the area affected Table 2., the situation in the area affected Table 2., the situation in the area affected
by the dumpsite has worsenby the dumpsite has worsenby the dumpsite has worsenby the dumpsite has worsened. Looking at the ed. Looking at the ed. Looking at the ed. Looking at the
monthly average, there is a shocking monthly average, there is a shocking monthly average, there is a shocking monthly average, there is a shocking 440%440%440%440% increase of patients between 2004 (765) and increase of patients between 2004 (765) and increase of patients between 2004 (765) and increase of patients between 2004 (765) and
2009 (3356). In the second part of 2009, 2009 (3356). In the second part of 2009, 2009 (3356). In the second part of 2009, 2009 (3356). In the second part of 2009,
dumping at Dandora Municipal Dumpsite has dumping at Dandora Municipal Dumpsite has dumping at Dandora Municipal Dumpsite has dumping at Dandora Municipal Dumpsite has
increased to unprecedented levels.increased to unprecedented levels.increased to unprecedented levels.increased to unprecedented levels.
MonthMonthMonthMonth 2009200920092009
March March March March 3015
April April April April 2382
May May May May 2999
June June June June 4116
July July July July 4894
August August August August 2731
Total (6months)Total (6months)Total (6months)Total (6months) 20137
Monthly averageMonthly averageMonthly averageMonthly average 3356335633563356
Source: Medical records at the Catholic Church Dispensary at Kariobangi North 2009

METHODOLOGY AND RESULTS ●
16
CHAPTER 2 2. Methodology and Results
2.1 Environmental Evaluation2.1 Environmental Evaluation2.1 Environmental Evaluation2.1 Environmental Evaluation
Environmental exposure assessment was done by
analysis of soil, compost and water samples collected
at the Dandora waste dumping site and its environs.
Soil samples were also taken from Waithaka (a
rural-urban estate of Nairobi) for the purpose of
comparison. A physical environmental assessment
was done at the Dandora waste dumping site and at
the covariate study area prior to the collection of
environmental samples to determine the locations
that were suitable for sampling. The sampling sites
at the Dandora waste dumping site were selected in
a cross-sectional way from a site adjacent to the St
John informal school in Korogocho, through the
dumping site and to a site at the periphery of the
dumping site next to Dandora Estate (Annexure 1).
2.1.1 Collection 2.1.1 Collection 2.1.1 Collection 2.1.1 Collection of soil samples and compost of soil samples and compost of soil samples and compost of soil samples and compost
sample sample sample sample
Soil samples were taken using a soil Auger in five
locations neighbouring the dumping site. Where
possible and depending on how deep the soil Auger
would go into the soil, the samples were obtained in
three profiles; i.e. of surface (0-20cm), 20-40cms
and 40-60cms. Surface soil sample was obtained at
site 1, profiles 0-20cms and 20-40cms were
obtained at sampling site number 3 and all three
profiles were obtained at sampling sites 2, 4 and 6.
A total of twelve soil samples were thus obtained
from the neighborhood of the dumping site. The
profiling was done to determine any difference in
deposition of elements based on depth. The
positions from which the soil samples were obtained
from this locality were marked using Geographical
Positioning System (GPS).
A single compost sample was taken from the
dumping site and two surface soil samples were
taken from Waithaka. Details of the soil sampling
are further indicated in annexure 2a.
2.1.2 Collection of water samples 2.1.2 Collection of water samples 2.1.2 Collection of water samples 2.1.2 Collection of water samples
Water samples were drawn from a slow flowing part
of the Nairobi River at a point bordering the
dumping site and from a water logged quarry
adjacent to the river. The water samples were
dispensed into appropriate plastic containers
(annexure 2a).
2.1.3 An2.1.3 An2.1.3 An2.1.3 Analysis of environmental samples alysis of environmental samples alysis of environmental samples alysis of environmental samples
The soil and water samples were sent to the Institute
of Nuclear Sciences laboratory at the University of
Nairobi (INS-UON) for elemental analysis and the
Kenya Plant Health Inspectorate Services (KEPHIS)
for pesticides screen and determination of the
concentration of polychlorinated biphenyls (PCBs).
2.1.3.1 Elemental concentration 2.1.3.1 Elemental concentration 2.1.3.1 Elemental concentration 2.1.3.1 Elemental concentration
Elemental concentrations were determined using an
Energy Dispersive X-Ray Fluorescent (EDXRF)
system. The EDXRF is a multi-elemental detector
that gives the concentration of various elements in a
single sample. The results obtained were reported in
parts per million (ppm).18
Cadmium was analysed using atomic absorption
spectrometry (AAS) at the Kenya Agricultural
Research Institute (KARI) since the EDXRF could
not determine the element as the source of the
EDXRF primary X-rays is made of cadmium. The
determination of cadmium was carried out
following the methods of soil analysis used at KARI.
2.1.3.1.1 Elemental concentration of soil 2.1.3.1.1 Elemental concentration of soil 2.1.3.1.1 Elemental concentration of soil 2.1.3.1.1 Elemental concentration of soil
samplesamplesamplesamples s s s
The soil samples for elemental analysis using
EDXRF system were individually homogenized by
physical mixing, air dried, grinded into fine particles
and made into pellets using cellulose as the soil
binder. Three pellets were prepared and analysed for
each soil sample. The mean elemental concentration
of the three pellets was taken as the final elemental
concentration.18

METHODOLOGY AND RESULTS ●
17
For the determination of Cadmium, surface soil
samples and below surface soil samples were pooled
and analysed as single samples respectively.
2.1.3.1.2 Elemental concentration of water 2.1.3.1.2 Elemental concentration of water 2.1.3.1.2 Elemental concentration of water 2.1.3.1.2 Elemental concentration of water
sample sample sample sample
Water samples for EDXRF were prepared by mixing
with sodium diethyldithiocarbamate (NaDDTC) to
precipitate the metal ions. On addition of 100
micrograms of cadmium to act as a carrier, 1.5%
Ammonium Pyroldine Dithiocarbonate (APDC)
was added to complex the free metal ions in the
solution. The precipitate formed was collected on a
0.45 micrometer nucleophore filter by vacuum
filtration which was then air dried and presented to
the EDXRF for analysis.18
2.1.3.2 Determination of pesticides and 2.1.3.2 Determination of pesticides and 2.1.3.2 Determination of pesticides and 2.1.3.2 Determination of pesticides and
polychlorinated biphenyls polychlorinated biphenyls polychlorinated biphenyls polychlorinated biphenyls
Two soil and two water samples were taken to the
Kenya plant health inspectorate for the
determination of pesticides (organochlorines,
organophosphates and carbamates) and
polychlorinated biphenyls using chromatographic
methods.
Soil samples for the determination of pesticides and
PCBs were prepared according to the KEPHIS
protocol and procedures for Gas Chromatography.
Preparation of water samples for the determination
of pesticides and PCBs was done according to the
KEPHIS protocol and procedures for Gas
Chromatography.
2.1.4 Results of environmental samples 2.1.4 Results of environmental samples 2.1.4 Results of environmental samples 2.1.4 Results of environmental samples
To ensure reliable results for the analysis of
environmental samples, the quality control and
assurance protocols according to respective
analyzing laboratories were followed. Appropriate
analytical systems calibration was done and quality
control materials were analysed prior to sample
analysis.
2. 1.4.1 Elemental concentration (ppm) in soil 2. 1.4.1 Elemental concentration (ppm) in soil 2. 1.4.1 Elemental concentration (ppm) in soil 2. 1.4.1 Elemental concentration (ppm) in soil
samples samples samples samples
The concentrations of : - Potassium (K), Calcium
(Ca), Titanium (Ti), Vanadium (V), Chromium
(Cr), Manganese (Mn), Iron (Fe), Copper (Cu),
Zinc (Zn), Arsenic (As), Mercury (Hg), Lead (Pb),
Rubidium (Rb), Selenium (Sr), Tholium (Th),
Zuridium (Zr) and Nubidium (Nb) in the soil
samples were obtained on analysis by the EDXRF
system.
Total elemental concentrations for trace elements
and heavy metals obtained for individual soil
samples from Korogocho/Dandora are as indicated
in annexure 2b. Table 3 presents the elemental
concentrations in soil samples obtained from
specific sampling sites at the neighborhood of the
dumping site. Cadmium (Cd) levels as obtained by
the AAS analysis are also included.
Table 3 Elemental concentration in soil samples Table 3 Elemental concentration in soil samples Table 3 Elemental concentration in soil samples Table 3 Elemental concentration in soil samples
from specific sampling sites from specific sampling sites from specific sampling sites from specific sampling sites of Dandora and of Dandora and of Dandora and of Dandora and
Korogocho Korogocho Korogocho Korogocho
♠
Actual results for the single sample profile analysed ♪
Mean of two sample profiles analysed §Mean of three sample profiles obtained
BDL- Below detection limit- Copper (Cu) - 15
ppm, Chromium (Cr)-70 ppm, Mercury (Hg)-15
ppm
* Analysis of pooled samples done by Atomic
absorption spectrometry (AAS)
The range and mean concentrations of elements in
the total soil sample from Dandora and Korogocho
are shown in Table 4. Among the heavy metals, Hg
Elemental concentration in Dandora soil Elemental concentration in Dandora soil Elemental concentration in Dandora soil Elemental concentration in Dandora soil
samples in ppm samples in ppm samples in ppm samples in ppm
EleEleEleEle
menmenmenmen
tstststs E1♠
E2§ E3
♪
E4§ E6
§
K 19000 22400 25250 21600 15866 Ca 51300 6566 15450 8833 15433 Ti 6000 5033 6450 5633 4767 Cr BDL 103 BDL 201 110 Mn 5900 3433 3900 4233 5233 Fe 46900 40800 58350 50066 37800 Cu 118 BDL 80 49 198 Zn 1150 280 770 360 312 Hg BDL BDL 18.6 BDL BDL Pb 185 66 453 560 68 As BDL BDL BDL BDL BDL
Cd* Surface- 52.9 Subsurface- 26.5

METHODOLOGY AND RESULTS ●
18
was detected in the second sample (20-40 Cms
depth) from sampling site number three. The rest of
the samples had Hg levels below the detection level
of 15 ppm. The concentration of Pb in the soil
samples ranged from 50-590ppm (mean of
264±229 ppm) and Pb was present in all soil
samples analysed. 42% (n = 5) of the soil samples
had levels above 400 ppm. Only one of the soil
samples had Pb levels of 50 ppm while the rest had
Pb concentrations above 60 ppm. The highest
concentration of heavy metals in the soil samples
was that of Zinc (Zn) of which the lowest and
highest concentrations were 175 and 1150 ppm
respectively with a mean concentration of 574±378
standard deviation. Cd levels (mean 40±18 ppm)
obtained for the surface and subsurface soil samples
were 52.9 and 26.5 ppm respectively.
Table 4 Mean total elemental concentration of Table 4 Mean total elemental concentration of Table 4 Mean total elemental concentration of Table 4 Mean total elemental concentration of
soil samples from Dandora/Korogocho soil samples from Dandora/Korogocho soil samples from Dandora/Korogocho soil samples from Dandora/Korogocho
ElementElementElementElement Range (ppm)Range (ppm)Range (ppm)Range (ppm) Mean (SMean (SMean (SMean (Standard tandard tandard tandard
deviation in deviation in deviation in deviation in
parenthesis) parenthesis) parenthesis) parenthesis)
K K K K 11200-27500 20758 (5499)
Ca Ca Ca Ca 4800 -51300 14558 (12764)
Ti Ti Ti Ti 3700 -7200 5433 (1176)
Cr Cr Cr Cr BDL - 272 157 (61)
Mn Mn Mn Mn 3000 -6600 4366 (1098)
Fe Fe Fe Fe 30600 -59200 45800 (9177)
Cu Cu Cu Cu BDL - 198 105 (58)
Zn Zn Zn Zn 175 -1150 462 (287)
Hg Hg Hg Hg BDL - 18.6 18.6
Pb Pb Pb Pb 50 - 590 264 (229)
Cd Cd Cd Cd 27 -53 40 (18)
Results for total elemental concentration in soil
samples obtained at Waithaka were as presented in
Table 5. The levels of Iron (Fe) were the highest at
57700 ppm. Cu, As and Hg were below detection
levels of the EDXRF system. The mean
concentration of Pb and Zn in the Waithaka soil
samples EC1 and EC2 were 34.5 and 133 ppm
respectively. The concentration of Cd in Waithaka
soil samples was not determined.
Table 5 ElemeTable 5 ElemeTable 5 ElemeTable 5 Elemental concentration in Waithaka ntal concentration in Waithaka ntal concentration in Waithaka ntal concentration in Waithaka
soil samples soil samples soil samples soil samples
Elements Elements Elements Elements EC1 EC1 EC1 EC1 EC2 EC2 EC2 EC2 Mean ± Standard Mean ± Standard Mean ± Standard Mean ± Standard
deviationdeviationdeviationdeviation
K K K K 10000 5670 7835± 3061
Ca Ca Ca Ca 5900 2700 4300± 2262
Ti Ti Ti Ti 6000 5300 5650± 495
Cr Cr Cr Cr 132 104 118± 20
Mn Mn Mn Mn 2900 1900 2400± 707
Fe Fe Fe Fe 57700 56500 57100± 848
Cu Cu Cu Cu BDL BDL BDL
Zn Zn Zn Zn 144 122 133±15.6
As As As As BDL BDL BDL
Hg Hg Hg Hg BDL BDL BDL
Pb Pb Pb Pb 35 34 34.5±0.7
2.1.4.1.1 Comparison of the concentration of 2.1.4.1.1 Comparison of the concentration of 2.1.4.1.1 Comparison of the concentration of 2.1.4.1.1 Comparison of the concentration of
heavy metals in Dandora/Korogocho and heavy metals in Dandora/Korogocho and heavy metals in Dandora/Korogocho and heavy metals in Dandora/Korogocho and
Waithaka soil samplesWaithaka soil samplesWaithaka soil samplesWaithaka soil samples and established soil and established soil and established soil and established soil
standardsstandardsstandardsstandards....
The concentrations of Pb, Hg, Cr, Zn and Cd
obtained for the soil samples from
Dandora/Korogocho/dumping site in comparison
to the concentration of soil standards of the
Netherlands and Taiwan, and elemental
concentration of soil samples from Waithaka are
indicated in Table 6 and Figure 1.
Heavy metals concentration in the soil samples from
the Dandora/Korogocho waste dumping site
significantly varied from the concentration in the
soil standards and soil samples from Waithaka.

METHODOLOGY AND RESULTS ●
19
Table 6 Heavy metaTable 6 Heavy metaTable 6 Heavy metaTable 6 Heavy metal concentrations (ppm) in the study’s soil samples and soil standards l concentrations (ppm) in the study’s soil samples and soil standards l concentrations (ppm) in the study’s soil samples and soil standards l concentrations (ppm) in the study’s soil samples and soil standards
§Tentative soil quality standards for Netherlands. 1
Reference value for good soil quality. 2 Limiting
value for soil quality having potential for harmful
effects on human health or the environment and
requiring further investigations.21
♪
Taiwan’s standard values to assess soil quality. A
The upper limit of the background concentration. B
The intervention level at which pollution control is
recommended.22
Figure 1 Heavy metal concentrations in the study’s soil samples and soil standards Figure 1 Heavy metal concentrations in the study’s soil samples and soil standards Figure 1 Heavy metal concentrations in the study’s soil samples and soil standards Figure 1 Heavy metal concentrations in the study’s soil samples and soil standards
2.1.4.2 Compost sample 2.1.4.2 Compost sample 2.1.4.2 Compost sample 2.1.4.2 Compost sample
Elemental concentrations of the compost sample
from the dumping site are indicated in Table 7.
Iron (Fe) was the element with the highest
concentration in the compost sample. Heavy metals
(Pb, Hg, Zn, Cd and Cu) were detected in high
levels in the compost sample of which Pb was the
highest at 13500 ppm while Hg was the lowest at
46.7 ppm. Arsenic was not detected in the compost
sample.
Table 7Table 7Table 7Table 7.... Elemental concentration in the compost Elemental concentration in the compost Elemental concentration in the compost Elemental concentration in the compost
sample from the Dandora waste dumping site sample from the Dandora waste dumping site sample from the Dandora waste dumping site sample from the Dandora waste dumping site
ElemeElemeElemeEleme
nts nts nts nts
Elemental Elemental Elemental Elemental
concentrations concentrations concentrations concentrations
in ppm in ppm in ppm in ppm
EleEleEleEle
menmenmenmen
ts ts ts ts
Elemental Elemental Elemental Elemental
concentrations concentrations concentrations concentrations
in ppm in ppm in ppm in ppm
K 19100 Cu 507
Ca 77000 Zn 2100
Ti 6100 Hg 46.7
Cr 689 Pb 13500
Mn 3500 As BDL
Fe 84800 Cd 1058
Heavy metal concentrations in the Heavy metal concentrations in the Heavy metal concentrations in the Heavy metal concentrations in the
study soil samples study soil samples study soil samples study soil samples
Reference values in soil Reference values in soil Reference values in soil Reference values in soil
standards standards standards standards
ElementElementElementElement
Dandora/ Korogocho
Waithaka Neths.§ Taiwan
♪
Cr BDL (< 70)-272 104-132 1001/250
2 100
A 400
B
Zn 175-1150 122-144 2001/500
2 120
A500
B
Cu BDL (< 15)-198 BDL (< 15) 501100
2 35
A200
B
Hg BDL (< 15)-18.6 BDL (< 15) 0.5122 0.29
A2B
Pb 50-590 35 501/150
2 50
A500
B
Cd 27-53 Not analysed 1152 2
A5B

METHODOLOGY AND RESULTS ●
20
• lack or inadequacy of blood lack or inadequacy of blood lack or inadequacy of blood lack or inadequacy of blood
(anaemia), (anaemia), (anaemia), (anaemia),
• yellowness of the eyes oyellowness of the eyes oyellowness of the eyes oyellowness of the eyes or skin r skin r skin r skin
(Jaundice) and hair changes, (Jaundice) and hair changes, (Jaundice) and hair changes, (Jaundice) and hair changes,
• inflammation of the lymph nodes inflammation of the lymph nodes inflammation of the lymph nodes inflammation of the lymph nodes
(Lymphadenopathy), (Lymphadenopathy), (Lymphadenopathy), (Lymphadenopathy),
• Swelling of body or limbs (oedema). Swelling of body or limbs (oedema). Swelling of body or limbs (oedema). Swelling of body or limbs (oedema).
• Disorders of the respiratory, Disorders of the respiratory, Disorders of the respiratory, Disorders of the respiratory,
cardiovascular (heart and blood cardiovascular (heart and blood cardiovascular (heart and blood cardiovascular (heart and blood
circulation) and neurological circulation) and neurological circulation) and neurological circulation) and neurological
(nervous ) systems, (nervous ) systems, (nervous ) systems, (nervous ) systems,
• Skin disorders, Skin disorders, Skin disorders, Skin disorders,
• Ear, Nose and Throat, Dental and Ear, Nose and Throat, Dental and Ear, Nose and Throat, Dental and Ear, Nose and Throat, Dental and
Ophthalmic (eye) status. Ophthalmic (eye) status. Ophthalmic (eye) status. Ophthalmic (eye) status.
2.1.4.3 Elemental concentration in water 2.1.4.3 Elemental concentration in water 2.1.4.3 Elemental concentration in water 2.1.4.3 Elemental concentration in water
samples samples samples samples
Table 8 indicates elemental composition of water
samples from Dandora/Korogocho/dumping site.
No elements were detected in the water sample
from the Nairobi river point of sampling but
manganese (Mn), iron (Fe) and copper (Cu) were
detected in low concentrations in the water sample
obtained from the pool. The levels of Cu obtained
were below a guideline value of 2mg/litre23 and the
Netherlands water quality standards.21
The elements (excluding copper) detected in the
water sample from the pool comprises the total
dissolved solutes (TDS) in water and no guideline
values have been developed for the TDS based on
possible health effects.
Table 8 Elemental concentrTable 8 Elemental concentrTable 8 Elemental concentrTable 8 Elemental concentrations of water ations of water ations of water ations of water
samples from Dandora /Korogocho /waste samples from Dandora /Korogocho /waste samples from Dandora /Korogocho /waste samples from Dandora /Korogocho /waste
dumping site dumping site dumping site dumping site
Elemental Elemental Elemental Elemental
concentration concentration concentration concentration
in Dandora in Dandora in Dandora in Dandora
water samples water samples water samples water samples
Reference values for Reference values for Reference values for Reference values for
water standards water standards water standards water standards
Elements Elements Elements Elements E21 E22 Neth.♪ WHO§
Mn Mn Mn Mn Not
detected
2.81 Not
established
Not
established
Fe Fe Fe Fe Not
detected
0.52 Not
established
Not
established
Cu Cu Cu Cu Not
detected
0.009 201/502 2
♪Tentative water quality standards for Netherlands.1
Reference value for good water quality. 2 limiting
value for water quality having potential for harmful
effects on human health or the environment and
requiring further investigations (VROM 1983).
§Guidelines for drinking water quality, 3rd edition.
Geneva, World Health Organisation 2004
(www.who.int/docstore/water-sanitation-
health/gdwq/updating/draftguidel/draftchap1.htm).
2.1.4.4 Results of PCBs and pesticides in 2.1.4.4 Results of PCBs and pesticides in 2.1.4.4 Results of PCBs and pesticides in 2.1.4.4 Results of PCBs and pesticides in
environmental samples environmental samples environmental samples environmental samples
No polychlorinated biphenyls and pesticides were
detected in the soil and water samples that were
presented for analysis (Annexure 3a).
2.2 Biomonitoring and Health Effects 2.2 Biomonitoring and Health Effects 2.2 Biomonitoring and Health Effects 2.2 Biomonitoring and Health Effects
The laboratory based assessment of human exposure
to environmental toxicants and determination of
effects to human health was done by analysis of
blood and urine samples obtained from children
and adolescents living at the neighborhoods of the
Dandora waste dumping site. A Medical Camp was
conducted in collaboration with Medical teams
from the Kenyatta National Hospital Pediatrics’
Department and the University of Nairobi Division
of Pediatrics and Child Health at the St. John
Catholic Church and Informal School in
Korogocho to facilitate the process.
2.2.1 Clinical evaluation 2.2.1 Clinical evaluation 2.2.1 Clinical evaluation 2.2.1 Clinical evaluation
328 Children and adolescents aged 2 to 18 years
were attended to at the medical camp. Male and
females comprised 48% (n=158) and 52% (n=170)
of the sample respectively. Demographic data (age,
sex, residence) and brief Medical histories of the
children were obtained from accompanying Parents
or Guardians. Appropriate clinical/physical
examination of the children was done and the
following presentation or manifestations were
recorded in a standard form:-
METHODOLOGY AND RESULTS ●
21
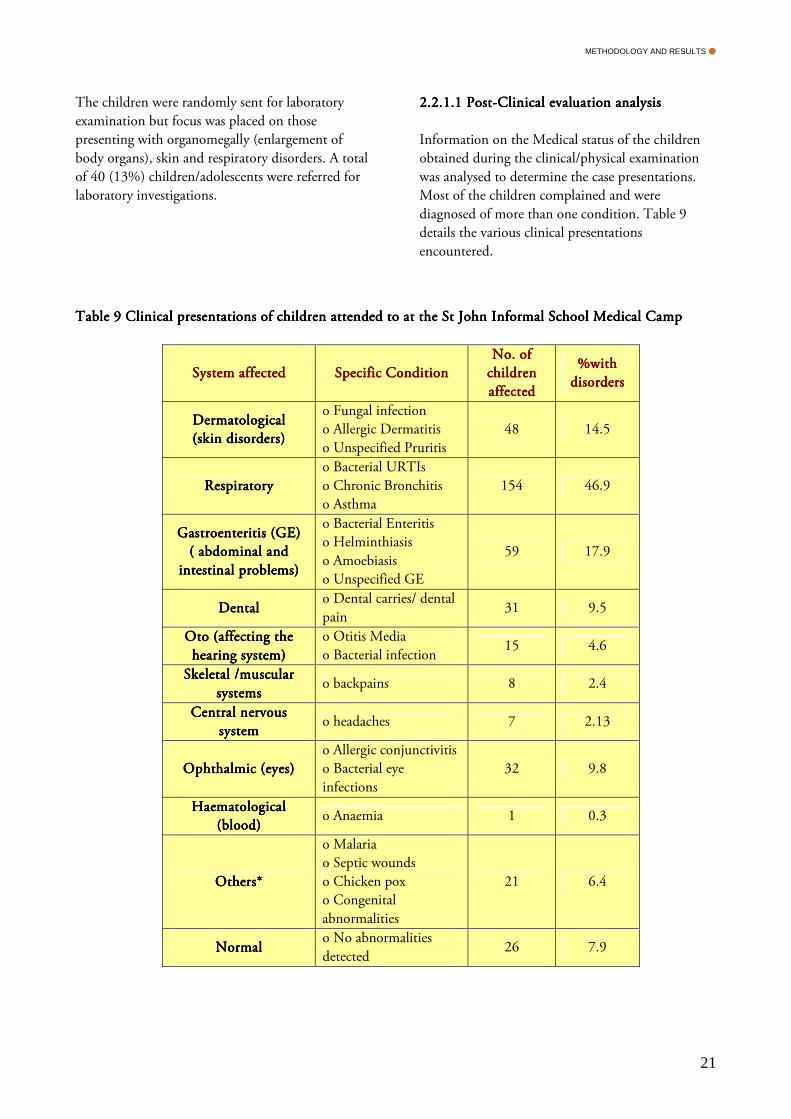
The children were randomly sent for laboratory
examination but focus was placed on those
presenting with organomegally (enlargement of
body organs), skin and respiratory disorders. A total
of 40 (13%) children/adolescents were referred for
laboratory investigations.
2.2.1.1 Post2.2.1.1 Post2.2.1.1 Post2.2.1.1 Post----Clinical evaluation analysis Clinical evaluation analysis Clinical evaluation analysis Clinical evaluation analysis
Information on the Medical status of the children
obtained during the clinical/physical examination
was analysed to determine the case presentations.
Most of the children complained and were
diagnosed of more than one condition. Table 9
details the various clinical presentations
encountered.
Table 9 Clinical presentations of children attended to at the St John Informal School Medical Table 9 Clinical presentations of children attended to at the St John Informal School Medical Table 9 Clinical presentations of children attended to at the St John Informal School Medical Table 9 Clinical presentations of children attended to at the St John Informal School Medical CampCampCampCamp
System affected System affected System affected System affected Specific Condition Specific Condition Specific Condition Specific Condition
No. ofNo. ofNo. ofNo. of
children children children children
affected affected affected affected
%with %with %with %with
disorders disorders disorders disorders
Dermatological Dermatological Dermatological Dermatological
(skin disorders) (skin disorders) (skin disorders) (skin disorders)
o Fungal infection
o Allergic Dermatitis
o Unspecified Pruritis
48 14.5
Respiratory Respiratory Respiratory Respiratory
o Bacterial URTIs
o Chronic Bronchitis
o Asthma
154 46.9
Gastroenteritis (GE) Gastroenteritis (GE) Gastroenteritis (GE) Gastroenteritis (GE)
( abdomi( abdomi( abdomi( abdominal and nal and nal and nal and
intestinal problems) intestinal problems) intestinal problems) intestinal problems)
o Bacterial Enteritis
o Helminthiasis
o Amoebiasis
o Unspecified GE
59 17.9
Dental Dental Dental Dental o Dental carries/ dental
pain 31 9.5
Oto (affecting the Oto (affecting the Oto (affecting the Oto (affecting the
hearing system) hearing system) hearing system) hearing system)
o Otitis Media
o Bacterial infection 15 4.6
SkeletalSkeletalSkeletalSkeletal /muscular /muscular /muscular /muscular
systems systems systems systems o backpains 8 2.4
Central nervous Central nervous Central nervous Central nervous
system system system system o headaches 7 2.13
Ophthalmic (eyes) Ophthalmic (eyes) Ophthalmic (eyes) Ophthalmic (eyes)
o Allergic conjunctivitis
o Bacterial eye
infections
32 9.8
Haematological Haematological Haematological Haematological
(blood) (blood) (blood) (blood) o Anaemia 1 0.3
Others* Others* Others* Others*
o Malaria
o Septic wounds
o Chicken pox
o Congenital
abnormalities
21 6.4
Normal Normal Normal Normal o No abnormalities
detected 26 7.9

METHODOLOGY AND RESULTS ●
22
2.2.2 Collection of biological samples 2.2.2 Collection of biological samples 2.2.2 Collection of biological samples 2.2.2 Collection of biological samples
Blood and urine samples were obtained from
children whose individual or parent/guardian
consent has been obtained.
2.2.2.1 Blood samples 2.2.2.1 Blood samples 2.2.2.1 Blood samples 2.2.2.1 Blood samples
10mls of blood samples were collected from each of
the children referred for laboratory investigations by
venepuncture (obtaining a blood sample by bleeding
from the veins). The blood samples were prepared
as follows:-
• 5mls were put into heparinized Vacutainers for
Clinical Biochemistry (biochemical changes due
to a disease or pathological process) studies.
• 5mls were put into EDTA Vacutainers for
Haematological (blood) studies and blood lead
levels determination.
• A drop of the blood sample in EDTA
Vacutainers was placed on a microscope slide
and spread to make a thin blood film for
peripheral blood film studies.
2.2.2.2 Urine samples 2.2.2.2 Urine samples 2.2.2.2 Urine samples 2.2.2.2 Urine samples
The participants were provided with appropriate
urine containers and requested to give samples of
urine.
2.2.3 Analysis of biological samples 2.2.3 Analysis of biological samples 2.2.3 Analysis of biological samples 2.2.3 Analysis of biological samples
2.2.3.1 Blood samples 2.2.3.1 Blood samples 2.2.3.1 Blood samples 2.2.3.1 Blood samples
Blood samples were analysed for Biochemistry
evaluation, Haematological evaluation and blood
lead levels.
2.2.3.1.1 Biochemistry analysis 2.2.3.1.1 Biochemistry analysis 2.2.3.1.1 Biochemistry analysis 2.2.3.1.1 Biochemistry analysis
Blood samples in heparinized Vacutainers were
centrifuged and plasma separated from the cellular
matter. The plasma was put in Cryovials and
dispatched for biochemistry analysis. Biochemical
studies done were to evaluate any derangement in
liver and renal functions.
Liver function tests done included: -
• Total protein,
• Albumin,
• Alanine and Aspartate Transaminases,
• lactate Dehydrogenase and
• Alkaline phosphatase.
Evaluation of renal function was done by
determining levels of
• Urea,
• Creatinine,
• Calcium and
• Inorganic phosphatases.
2.2.3.1.2 Haema2.2.3.1.2 Haema2.2.3.1.2 Haema2.2.3.1.2 Haematological studies tological studies tological studies tological studies
Haematological studies were done on blood samples
in EDTA Vacutainers to determine the status on
blood levels, cell morphology and adequacy. The
investigations entailed:-
• Red and white blood cell counts,
• haemoglobin levels determination and
• Peripheral blood film studies to
determine the percentage (differential
counts) of each of the white blood cells
(i.e. Neutrophils, lymphocytes,
Monocytes and Eosinophils) present
and morphology of red blood cells.
2.2.3.1.3 Blood lead levels deter2.2.3.1.3 Blood lead levels deter2.2.3.1.3 Blood lead levels deter2.2.3.1.3 Blood lead levels determination mination mination mination
Blood lead level determination was done using a
portable LeadCare blood lead testing system and
LeadCare blood lead testing kits manufactured by
ESA of Chelmsford, USA (Annexure 4). The
analyzer is electrically (AC) or battery (DC)
powered. The system carries out an automatic self
test to check its electronic functions every time it’s
turned on. Calibration was performed using a coded
calibration button supplied with the kits and quality
control samples were analysed prior to analysis of
the blood samples. Blood lead levels were
determined following the procedures for sample
analysis using the LeadCare blood lead analyzer
user’s guide.19

METHODOLOGY AND RESULTS ●
23
2.2.3.2 Urine samples 2.2.3.2 Urine samples 2.2.3.2 Urine samples 2.2.3.2 Urine samples
A general urinary screen was done using Ames
Multistix for urinalysis to determine the qualitative
concentrations of various urine constituents that
serves as indicators of underlaying problems.
Microalbumin and microalbumin/creatinine ratio
which are indicators of early and subclinical renal
damage were determined using Clinitec
Microalbumin strips and reader.
Photograph 6 The toxic smokes of the Dumpsite at the sunset. Courtesy of Andrea Rigon.
2.2.4 Biological samples results 2.2.4 Biological samples results 2.2.4 Biological samples results 2.2.4 Biological samples results
2.2.4.1 Blood samples 2.2.4.1 Blood samples 2.2.4.1 Blood samples 2.2.4.1 Blood samples
2.2.4.1.1 Biochemistry results 2.2.4.1.1 Biochemistry results 2.2.4.1.1 Biochemistry results 2.2.4.1.1 Biochemistry results
Clinical biochemistry results obtained for Total
protein, Albumin, Alanine Transaminase (ALT),
Aspartate Transaminase (AST), Alkaline
Phosphatase (ALP), Lactate Dehydrogenase (LD),
Calcium (Ca++ ), Inorganic Phosphates (pO42-), Urea
and Creatinine are presented in Table 10.
Biochemistry results obtained for individuals are
presented in Annexure 5a.
Table 10Table 10Table 10Table 10.... Summary of Biochemistry investigations Summary of Biochemistry investigations Summary of Biochemistry investigations Summary of Biochemistry investigations
Profile Analyte Reference
limit♠
% < lower reference limit
% > upper reference limit
Total Protein
66-87g/dl Nil Nil
Albumin 35-42g/dl Nil Nil AST 0-37U/L Nil 39.5% (n = 15) ALT 0-37U/L Nil 2.6% (n = 1) ALP 64-306U/l Nil 31.6% (n =12)
Liver function tests
LDH 190-360U/l 2.6% (n = 1) 18.4% (n = 7)
Ca++
2.02-2.60 Nil Nil
pO4
- - 0.84-1.65 Nil Nil
Urea 1.7-8.3 7.9 % (n =3) 2.6% (n = 1) Creatinine 60-120 Nil 2.6% (n = 1)
Na++
35-45mmol/l Nil Nil
K++
135-145mmol/l
Nil Nil
Renal function test
Microalbumin A:C
< 30mg/g Nil Nil

METHODOLOGY AND RESULTS ●
24
2.2.4.1.2 Haematology results 2.2.4.1.2 Haematology results 2.2.4.1.2 Haematology results 2.2.4.1.2 Haematology results
Haematological results obtained were those of blood
cell counts (RBCS, WBCs and platelets),
Haemoglobin (Hb) level and peripheral blood film
(PBF) studies. Haematological results presented
here are those of haemoglobin (Hb) levels and
peripheral blood film studies in Table 11 and Table
12 respectively. The reference range for normal
haemoglobin levels are 11 to 16 grams per deciliter
of blood and vary with sex and age with males
having higher Hb levels than females. The lowest,
highest and mean ± standard deviation (1SD) Hb
levels obtained for the total sample were 10.5, 15.1
and 12.6 ± 0.5 grams per deciliter of blood
respectively. Hb levels below the lower limit of the
reference range indicates low Hb for the individual
and hence anaemia. Males had the highest number
of individuals whose Hb levels were below the
reference range. Most of the teenagers (ages 12-
14yrs (42.8%) and 15-18yrs (100%)) had low Hb
levels. The peripheral blood film exhibited
microcytosis/hypochromasia of red blood cells
(varying sizes with majority of the cells being
smaller than normal and low staining) a feature of
anaemia and eosinophilia (high levels of
eosinophilic white blood cells) which is a
manifestation of allergy. Haematology results for
individuals are indicated in annexure 5b.
Table 11Table 11Table 11Table 11.... Haemoglobin levels in children at Korogocho Haemoglobin levels in children at Korogocho Haemoglobin levels in children at Korogocho Haemoglobin levels in children at Korogocho
Age of subject Age of subject Age of subject Age of subject
(years) (years) (years) (years)
Reference Reference Reference Reference
range range range range
No. of No. of No. of No. of
subjectssubjectssubjectssubjects
Subjects Hb range Subjects Hb range Subjects Hb range Subjects Hb range Mean Hb Mean Hb Mean Hb Mean Hb % < lower % < lower % < lower % < lower
refereferefereference limit rence limit rence limit rence limit
male 11.2-
14.3
5 11.1-14.1 12.7(1.1) 20 (n =1) 4444----7 7 7 7
female 11.3-
14.2
3 12.4-13.1 12.8(0.4) Nil
male 12.0-
14.8
2 11.5-12.4 12.0((0.6) 50 (n=1) 8888----11 11 11 11
female 11.5-
14.5
7 10.5-14.0 12.4(1.1) 14.2 (n = 1)
male 12.5-
15.0
14 11.5-15.1 12.1(2.8) 42.8 (n + 6) 12121212----14 14 14 14
female 11.6-
14.8
3 11.9-13.2 13.2(1.3) Nil
male 13.9-
16.3
6 13.0-13.6 13.2(0.2) 100 (n =6) 15151515----18 18 18 18
female 12.0-
15.0
Table 12Table 12Table 12Table 12.... Peripheral blood film results Peripheral blood film results Peripheral blood film results Peripheral blood film results
PBF studies PBF studies PBF studies PBF studies % of % of % of % of
childchildchildchildren ren ren ren
No. of No. of No. of No. of
children children children children
Normocytic/ normochromic ( red blood cells normal in size and staining in Normocytic/ normochromic ( red blood cells normal in size and staining in Normocytic/ normochromic ( red blood cells normal in size and staining in Normocytic/ normochromic ( red blood cells normal in size and staining in
peripheral blood film) peripheral blood film) peripheral blood film) peripheral blood film) 62.5 25
Microcytosis (smaller red blood cell’s size than the normal) Microcytosis (smaller red blood cell’s size than the normal) Microcytosis (smaller red blood cell’s size than the normal) Microcytosis (smaller red blood cell’s size than the normal) 35 14
hypochromasia (low red blood cell’s staining) hypochromasia (low red blood cell’s staining) hypochromasia (low red blood cell’s staining) hypochromasia (low red blood cell’s staining) 12.5 5
Eosinophilia (high numbers than normal of white blood cells referred to as Eosinophilia (high numbers than normal of white blood cells referred to as Eosinophilia (high numbers than normal of white blood cells referred to as Eosinophilia (high numbers than normal of white blood cells referred to as
eosinophils) eosinophils) eosinophils) eosinophils) 52.5 21

METHODOLOGY AND RESULTS ●
25
The results indicate excessive exposure to abnormal environmental lead levels which poses high risk to human health.
2.2.4.1.3 Blood lead levels results 2.2.4.1.3 Blood lead levels results 2.2.4.1.3 Blood lead levels results 2.2.4.1.3 Blood lead levels results
Table 13 shows blood lead levels obtained for
children at Dandora/ Korogocho.
50% of the children had50% of the children had50% of the children had50% of the children had levels equal to or levels equal to or levels equal to or levels equal to or
exceeding the internationally accepted action exceeding the internationally accepted action exceeding the internationally accepted action exceeding the internationally accepted action
levels of 10 micrograms per deciliter of blood.levels of 10 micrograms per deciliter of blood.levels of 10 micrograms per deciliter of blood.levels of 10 micrograms per deciliter of blood.
5% (n = 2) of the children had BLLs above 25
micrograms per deciliter and the actual blood lead
levels for the two were 29.4 and 32.1 micrograms
per deciliter of blood (µg/dl). The results indicate
excessive exposure to abnormal environmental lead
levels which poses high risk to human health.
Blood lead levels for each individual were as
indicated in annexure 6.
Table 13Table 13Table 13Table 13.... Blood lead levels Blood lead levels Blood lead levels Blood lead levels
Number of children 38
Lowest blood lead levels obtained 3.9
Highest blood lead levels obtained 32.1
Mean ±SD 12.3 ±6.9
% ≥ 10µg/dl 50%
(n=19)
% ≥ 15µg/dl 34%
(n=13)
% ≥ 20µg/dl 13% (n=5)
% ≥ 25µg/dl 5% (n=2)
2.2.4.1.3.1 Blood lead levels distribution by age 2.2.4.1.3.1 Blood lead levels distribution by age 2.2.4.1.3.1 Blood lead levels distribution by age 2.2.4.1.3.1 Blood lead levels distribution by age
Table 14 and figure 2 shows how the blood lead
levels are distributed amongst children living within
or at the neighborhood of the Dandora waste
dumping site age wise. The mean blood lead levels
in different age sets ranged from 9.0 ±6.1 (8-11
years) to 14.6 ±8.0 (12-14 years) µg/dl of blood.
The percentage of children having BLLs above levels
of concern in particular age sets indicates individuals
aged 12-14 years had the highest BLLs while
children aged 8-11 years had the lowest BLLs.
Table Table Table Table 14141414.... Distribution of blood lead µg/dl levels Distribution of blood lead µg/dl levels Distribution of blood lead µg/dl levels Distribution of blood lead µg/dl levels
by age by age by age by age
Figure 2 Distribution of Blood lead levels Figure 2 Distribution of Blood lead levels Figure 2 Distribution of Blood lead levels Figure 2 Distribution of Blood lead levels
2.2.4.2 Ur2.2.4.2 Ur2.2.4.2 Ur2.2.4.2 Urine samples ine samples ine samples ine samples
The general screen through urinalysis did not
indicate abnormal levels of the various urinary
contents that are indicators of extensive damage to
internal organs. Results of all parameters checked
through urinalysis were normal. Microalbumin
concentration was <30milligrams per gram and the
microalbumin/creatinine ratios were normal for all
the children.
Age Age Age Age
set set set set
(years) (years) (years) (years)
lowest lowest lowest lowest highest highest highest highest Mean Mean Mean Mean
± SD ± SD ± SD ± SD %%%%≥10 ≥10 ≥10 ≥10 %%%%≥15 ≥15 ≥15 ≥15 %%%%≥20 ≥20 ≥20 ≥20 %%%%≥25 ≥25 ≥25 ≥25
4444----7 7 7 7 6.2 17.5 10.5±
4.4 50 25 nil nil
8888----11 11 11 11 3.9 22.8 9.0
±6.1 37.5 12.5 12.5 nil
12121212----14 14 14 14 6.0 32.1 14.6
±8.0 56 37.5 18.8 12.5
15151515----18 18 18 18 4.9 20.6 12.8
±6.9 50 50 16.6 nil

DISCUSSIONS AND CONCLUSION ●
26
CHAPTER 3 3. Discussions and Conclusion
3.1 Discussions 3.1 Discussions 3.1 Discussions 3.1 Discussions
Soil and water samples from Dandora and
Korogocho were analysed to determine their
contents and concentrations of various elements,
polychlorinated biphenyls and pesticides. A
compost sample from the Dandora waste dumping
site was analysed to give an insight into the contents
of the decomposed and burnt out waste. For the
purpose of comparing the elemental contents and
concentration of the soil samples from
Dandora/Korogocho, soil samples from the
relatively unpolluted environment of Waithaka were
analysed.
The analysis of the environmental samples served to
determine the status of the environment around the
dumping site and thus an indicator of
environmental impact of waste disposal at the site.
The results obtained by analysis of both the
environmental and biological samples serves to
establish the relationship between the environment
and human health.
The soil’s elemental contents; ‘‘Potassium (K),
Calcium (Ca), Titanium (Ti), Vanadium (V),
Chromium (Cr), Manganese (Mn), Iron (Fe),
Copper (Cu), Zinc (Zn), Mercury (Hg), Lead (Pb)
and Cadmium (Cd)’’ obtained can be categorised
into: exchangeable metallic cations and
micronutrients (potassium, calcium, magnesium,
manganese, copper, iron and zinc) and toxic heavy
metals (mercury, lead, cadmium and chromium).
The heavy metals are of major concern as they are
known to be toxic to human, animals and plants
health even at low levels of exposure.
Due to their known toxicities, critical levels of heavy
metals concentrations have been established by
several authorities. The results obtained on the
concentration of the heavy metals were compared to
the soil standards used in the Netherlands and
Taiwan.
The acceptable levels of exposure to environmental
lead in soil based on the Netherlands and Taiwanese
standards for quality soil are 50 ppm while soil lead
levels that are a risk to human health have been
placed at 150 and 500 ppm respectively.
The WHO lead level for good soil standard is The WHO lead level for good soil standard is The WHO lead level for good soil standard is The WHO lead level for good soil standard is
100 ppm. Five (42 %) out of the twelve samples 100 ppm. Five (42 %) out of the twelve samples 100 ppm. Five (42 %) out of the twelve samples 100 ppm. Five (42 %) out of the twelve samples
analysed from Dandora/Korogocho had lead analysed from Dandora/Korogocho had lead analysed from Dandora/Korogocho had lead analysed from Dandora/Korogocho had lead
levels ranging from 417levels ranging from 417levels ranging from 417levels ranging from 417----547 ppm. These lead 547 ppm. These lead 547 ppm. These lead 547 ppm. These lead
levels are four times above thelevels are four times above thelevels are four times above thelevels are four times above the WHO standard WHO standard WHO standard WHO standard
and within the levels that pose a risk to human and within the levels that pose a risk to human and within the levels that pose a risk to human and within the levels that pose a risk to human
health as per the Netherlands and Taiwan’s health as per the Netherlands and Taiwan’s health as per the Netherlands and Taiwan’s health as per the Netherlands and Taiwan’s
standards indicating high levels of exposure.standards indicating high levels of exposure.standards indicating high levels of exposure.standards indicating high levels of exposure.
The concentration of lead in the compost sample
was 13500 ppm indicating the dumping site to be
source of the high lead levels in the surrounding
environment.
The concentrations of Mercury in almost all of
Dandora/Korogocho soil samples were below the
detection limit of 15 ppm of the EDXRF
measurement system used. However, potential for
exposure to unacceptable levels of mercury cannot
be ruled out as the detection limit of the analyzing
system is far much above the 2 ppm mercury limit
levels in soil that pose no risk to human health.
Likewise, the levels of 18.6 ppm that was obtained
for the soil sample from the banks of Nairobi River
and the levels that were obtained for the compost
sample although not representative of the whole
environment indicate possibility of exposure to high
levels of mercury. A true status can be established by
analysis of more samples and using more sensitive
equipment.
Results obtained for cadmium in the soil samples Results obtained for cadmium in the soil samples Results obtained for cadmium in the soil samples Results obtained for cadmium in the soil samples
from Dandora and Korogocho indicate the levels from Dandora and Korogocho indicate the levels from Dandora and Korogocho indicate the levels from Dandora and Korogocho indicate the levels
to be six times more than the critical levelsto be six times more than the critical levelsto be six times more than the critical levelsto be six times more than the critical levels
mentioned by the Dutch and Taiwanese mentioned by the Dutch and Taiwanese mentioned by the Dutch and Taiwanese mentioned by the Dutch and Taiwanese
authorities. authorities. authorities. authorities.
The higher concentration of cadmium levels in the
surface soil levels relative to those of subsurface

DISCUSSIONS AND CONCLUSION ●
27
Half of the children had blood lead levels exceeding the internationally accepted toxic levels.
samples indicate a recent increase in deposition of
cadmium containing waste. However, further soil
sampling and determination of cadmium in
biological samples is recommended to get a clearer
status.
The mean concentration of copper in the The mean concentration of copper in the The mean concentration of copper in the The mean concentration of copper in the
Dandora/Korogocho soil samples was twice and Dandora/Korogocho soil samples was twice and Dandora/Korogocho soil samples was twice and Dandora/Korogocho soil samples was twice and
thrice the reference value for good soil quality of thrice the reference value for good soil quality of thrice the reference value for good soil quality of thrice the reference value for good soil quality of
the Dutch and Taiwanese soil’s respectively.the Dutch and Taiwanese soil’s respectively.the Dutch and Taiwanese soil’s respectively.the Dutch and Taiwanese soil’s respectively.
The levels are above the natural range of copper in
soils which ranges from 7 to 80 ppm. In
comparison, the concentrations of copper in
Waithaka soil samples were below the detection
limit of 15 ppm.
The mean concentration of chromium in the soil
samples from the Dandora waste dumping site and
its environs was slightly above the critical soil levels
of the Dutch and Taiwan soil standards. Thus, the
results indicate little or no contamination of the
environment by chromium.
The mean concentration of Zinc in the
Dandora/Korogocho soil samples was above the
reference value for good soil quality of Dutch and
Taiwan soil standards respectively while the levels
were four times higher than soil samples from
Waithaka indicating excessive exposure.
Despite the levels of trace elements, micronutrients
and heavy metals that were obtained for the soil
samples, the levels of almost all of the elements
measured in soil samples are not reflected in the
water samples apart from the levels of total dissolved
solids (TDS-Mn and Fe) and copper that were
detected in the water sample from the pool in low
quantities. This could be attributed to the flowing
nature of the river and heavy cover of vegetation
over the stagnant water pool as well as the analytical
sensitivity of the measuring system. Further analysis
of more samples with application of more sensitive
system of measurement will indicate the true status.
Results of the post clinical evaluation of Results of the post clinical evaluation of Results of the post clinical evaluation of Results of the post clinical evaluation of
information collected on the children and information collected on the children and information collected on the children and information collected on the children and
adolescents living within the environs of the adolescents living within the environs of the adolescents living within the environs of the adolescents living within the environs of the
Dandora waste dumping site indiDandora waste dumping site indiDandora waste dumping site indiDandora waste dumping site indicated the cated the cated the cated the
highest incidence of diseases to be those highest incidence of diseases to be those highest incidence of diseases to be those highest incidence of diseases to be those
involving the respiratory, gastrointestinal and involving the respiratory, gastrointestinal and involving the respiratory, gastrointestinal and involving the respiratory, gastrointestinal and
dermatological systems. Respiratory problems dermatological systems. Respiratory problems dermatological systems. Respiratory problems dermatological systems. Respiratory problems
manifested included upper respiratory tract manifested included upper respiratory tract manifested included upper respiratory tract manifested included upper respiratory tract
infections (URTIs), chronic bronchitis and infections (URTIs), chronic bronchitis and infections (URTIs), chronic bronchitis and infections (URTIs), chronic bronchitis and
asthma. asthma. asthma. asthma.
In the absence of supportive bacteriological
examination, organisms that could be involved in
causing the suspected URTIs cannot be determined.
Dermatological (skin) disorders included fungal
infections which could be attributed to lowered
immunity or malnutrition; allergic and unspecified
dermatitis/pruritis (inflammation and itchiness of
the skin) which could also be related to exposure to
environmental toxins. Likewise, exposure to various
pollutants could also have attributed to the
unspecified gastrointestinal problems. Major causes
of/or exacerbation of severity of the abnormalities
has been attributed to the environment around the
dumping site by the residence of the surrounding
residential estates.
Heavy metals concentrations of the soil samples Heavy metals concentrations of the soil samples Heavy metals concentrations of the soil samples Heavy metals concentrations of the soil samples
analysed indicatesanalysed indicatesanalysed indicatesanalysed indicates significant public exposure to significant public exposure to significant public exposure to significant public exposure to
unacceptable levels of environmental lead and to unacceptable levels of environmental lead and to unacceptable levels of environmental lead and to unacceptable levels of environmental lead and to
a lesser extents other metals. This is further a lesser extents other metals. This is further a lesser extents other metals. This is further a lesser extents other metals. This is further
evidenced by the concentration of lead in the evidenced by the concentration of lead in the evidenced by the concentration of lead in the evidenced by the concentration of lead in the
blood of children which indicated that half of blood of children which indicated that half of blood of children which indicated that half of blood of children which indicated that half of
the children had blood lead levels the children had blood lead levels the children had blood lead levels the children had blood lead levels exceeding the exceeding the exceeding the exceeding the
internationally accepted toxic levels. Likewise, internationally accepted toxic levels. Likewise, internationally accepted toxic levels. Likewise, internationally accepted toxic levels. Likewise,
other clinical effects such as headaches, chest other clinical effects such as headaches, chest other clinical effects such as headaches, chest other clinical effects such as headaches, chest
pains, gastrointestinal problems and muscular pains, gastrointestinal problems and muscular pains, gastrointestinal problems and muscular pains, gastrointestinal problems and muscular
weakness had been linked to high levels of heavy weakness had been linked to high levels of heavy weakness had been linked to high levels of heavy weakness had been linked to high levels of heavy
metals. metals. metals. metals.
The liver is the major organ of metabolism of
various substances and detoxification in the body.
Biochemistry results obtained for some of the
children and adolescents indicates significant high
levels of the enzymes Aspartate Transaminases
(AST), Alanine Transaminases (ALT), Alkaline
Phosphatases (ALP) and Lactate Dehydrogenase
(LDH). These enzymes collectively and with other

DISCUSSIONS AND CONCLUSION ●
28
parameters or individually are analysed to evaluate
cellular damage or the presence of a disease process
affecting the liver. The results obtained points to a
degree of liver dysfunction in some children and
calls for further followup and evaluation.
Although the majority of the children did not have
results indicating destruction of the renal system,
the high levels of creatinine in some of the study
subjects indicates the need for closer followup to
determine onset of renal dysfunction as the levels of
creatinine depends with the muscle mass which is
less in children than adults. The routinely analysed
markers of renal dysfunction become deranged
when over 70 % of the kidneys mass is not
functional and at a state when signs and symptoms
of renal failure are evident. The use of more
sensitive markers such as micro proteins and
enzymes specific to the renal system will be more
appropriate in determination of subclinical
nephrotoxicity.
A major issue of concern is the results obtained for
haematological investigations.
The results indicate 50The results indicate 50The results indicate 50The results indicate 50% of the children as % of the children as % of the children as % of the children as
having lower haemoglobin levels than the having lower haemoglobin levels than the having lower haemoglobin levels than the having lower haemoglobin levels than the
reference ranges. reference ranges. reference ranges. reference ranges.
Apart from the haemoglobin levels, the peripheral
blood films indicate size and staining abnormalities
of the red blood cells that are features of iron
deficiency anaemia (IDA) in over 30% of the
children. Exposure to high levels of lead is a known
cause of suppression of the haemoglobin synthesis
which is manifested by low haemoglobin levels and
features that resemble those of IDA.
Results obtained on the blood lead levels of the Results obtained on the blood lead levels of the Results obtained on the blood lead levels of the Results obtained on the blood lead levels of the
children indicates that 50% of the children had children indicates that 50% of the children had children indicates that 50% of the children had children indicates that 50% of the children had
blood lead levels equal to or above 10 blood lead levels equal to or above 10 blood lead levels equal to or above 10 blood lead levels equal to or above 10
micrograms per deciliter of blood. micrograms per deciliter of blood. micrograms per deciliter of blood. micrograms per deciliter of blood.
34% had levels above 15 micrograms per deciliter of
blood, 13% had levels above 20 micrograms per
deciliter of blood and 5% had levels above 25
micrograms per deciliter of blood. The blood lead
level at which haemoglobin synthesis is suppressed is
25 micrograms per deciliter of blood. However, the
percentage of children who had haemoglobin levels
below normal levels equals those who had levels
above the action levels. 35% of the children had
microcytosis (small sized red blood cells) which is a
feature of anaemia due to iron deficiency or heavy
metal intoxication and this percentage almost equals
those who had blood lead levels (BLLs) above 20
micrograms per deciliter of blood. This indicates a
possibility of haemoglobin synthesis being
suppressed at blood lead concentrations below 25
micrograms per deciliter of blood. The high lead
contents of the soil samples and the blood lead levels
in children are an indication of an environment
highly polluted by lead.
In comparison to the less polluted environment of
Waithaka, the mean concentration of lead in the
soil samples from Dandora/Korogocho was seven
times more than the concentration of lead in
Waithaka soil samples.
Likewise, in a previous study, it was established that
the percentage of children with high blood lethe percentage of children with high blood lethe percentage of children with high blood lethe percentage of children with high blood lead ad ad ad
levels at Waithaka was 5.8% which is almost ten levels at Waithaka was 5.8% which is almost ten levels at Waithaka was 5.8% which is almost ten levels at Waithaka was 5.8% which is almost ten
times less than in times less than in times less than in times less than in Dandora/Korogocho which is Dandora/Korogocho which is Dandora/Korogocho which is Dandora/Korogocho which is
50%.50%.50%.50%.
The blood lead levels for children in
Dandora/Korogocho are higher than areas far away
from the dumping site such as Kariobangi North
and Babadogo which has been established to be at
10% and 15.2% respectively.20
The Kariobangi north and Babadogo are slums
bordering Korogocho and Dandora with no clear
boundary between them but further away from the
dumping site. This indicates that the population
living within the vicinity or near the Dandora waste
dumping site is in an environment highly polluted
by lead compared to areas further away.
An increase in the number of white blood cells
referred to as Eosinophils (eosinophilia) is mostly
associated with allergic reactions. Peripheral blood
film studies of the children from
Dandora/Korogocho indicated that 52.5% had
marked eosinophilia.
On clinical evaluation, most of the children On clinical evaluation, most of the children On clinical evaluation, most of the children On clinical evaluation, most of the children
presented with manifestation of respiratory tract presented with manifestation of respiratory tract presented with manifestation of respiratory tract presented with manifestation of respiratory tract
problems that can be due to resproblems that can be due to resproblems that can be due to resproblems that can be due to respiratory allergy piratory allergy piratory allergy piratory allergy
that leads to chronic rhinitis (irritation of the that leads to chronic rhinitis (irritation of the that leads to chronic rhinitis (irritation of the that leads to chronic rhinitis (irritation of the
nasal cavity) and a high occurrence of asthma; nasal cavity) and a high occurrence of asthma; nasal cavity) and a high occurrence of asthma; nasal cavity) and a high occurrence of asthma;
DISCUSSIONS AND CONCLUSION ●
29
The results call for immediate action to prevent continued public overexposure to environmental pollution
There is need for measures to be instituted for proper waste management to minimize the risk of environmental pollution that pose a risk to human health.
allergic conjunctivitis and dermatitis which is an allergic conjunctivitis and dermatitis which is an allergic conjunctivitis and dermatitis which is an allergic conjunctivitis and dermatitis which is an
indication of high exposure to environmental indication of high exposure to environmental indication of high exposure to environmental indication of high exposure to environmental
irritants. irritants. irritants. irritants.
Although no polychlorinated biphenyls (PCBs) were
detected in the environmental samples obtained,
their presence in the environment cannot be ruled
out due to the number of samples analysed and
manifestation of some clinical abnormalities such as
irritation of the nose and lungs, gastrointestinal
discomfort, depression, fatigue and skin conditions
attributed to exposure to PCBs were reported in the
children. Comprehensive analysis of more samples
should be carried out to determine the status of
PCBs congeners and their by products such as
dioxins and furans in the Dandora waste dumping
site environment. Likewise, more samples should be
analysed to determine presence of pesticides.
3.2 Conclusion and recommendations 3.2 Conclusion and recommendations 3.2 Conclusion and recommendations 3.2 Conclusion and recommendations
The results obtained in this study are evidence The results obtained in this study are evidence The results obtained in this study are evidence The results obtained in this study are evidence
that waste dumping at the Dthat waste dumping at the Dthat waste dumping at the Dthat waste dumping at the Dandora waste andora waste andora waste andora waste
dumping site is a potential source of dumping site is a potential source of dumping site is a potential source of dumping site is a potential source of
environmental pollution and a great risk to the environmental pollution and a great risk to the environmental pollution and a great risk to the environmental pollution and a great risk to the
health of people living within and surrounding health of people living within and surrounding health of people living within and surrounding health of people living within and surrounding
the dumping site. the dumping site. the dumping site. the dumping site.
Although indicating the need to carry out a
comprehensive study, the results call for immediate
action to prevent continued public overexposure to
environmental pollution. Close monitoring of
children should be done to monitor their heath and
provide appropriate medical attention meant to
check effects of the pollution. A general checkup on
the children and adolescent should be conducted
with a focus on establishing the extent of
overexposure to environmental toxicants.
The results need to be correlated to observation
from other areas that are at specified distances away
from the dumping site and other non polluted
environments. More environmental samples
including air samples should be analysed to evaluate
the environment. More sensitive markers of toxicity
should be used to ascertain long-term effects of
exposure.
Experience gained in the process of conducting this
study indicates a great need to link environmental
pollution and human health. Thus, systems are
required to be put in place for providing more
knowledge that will be useful in recognition,
diagnosis and management of environmentally
related illness. Health facilities should be equipped
with appropriate analytical systems that will enable
use of biological samples for the purpose of
diagnosis and monitoring of suspected
environmental related cases. Sensitive equipments
for carrying out environment and health related
research are needed to provide a better and quicker
approach in data generation. This indicates the need
to establish an institution that will appropriately
address environmental vs. health issues. Such a
facility will be handy for long-term monitoring,
provision of guidance and be a reference point in
future studies.
There is need for measures to be instituted for
proper waste management to minimize the risk of
environmental pollution that pose a risk to human
health. LLLLikewise, generation of waste should be ikewise, generation of waste should be ikewise, generation of waste should be ikewise, generation of waste should be
reduced by using less waste generating means in reduced by using less waste generating means in reduced by using less waste generating means in reduced by using less waste generating means in
various human activities.various human activities.various human activities.various human activities. This less waste
generating means may include use of more oral
medication than injectables, using recyclable or
reusable products wrappers or containers and
discourage the use of non biodegradable materials.

REFERENCES ●
30
4. References
1. United Nations Environmental Programme. Rio Declaration on Environment and Development, Report of the UN Conference on Environment and Development (Rio de Janeiro, Brazil 1992).
http://www.unep.org/unep/rio.htm
2. World Health Organisation, Fact sheet on Air Pollution, 2000. http:www.who.int/int- fs/en/fact187.html
3. World Health Organisation. Preventing Disease through Healthy Environments; Towards an Estimate of the Environmental Burden of Disease 2006.
4. World Health Organisation. Children’s Health and the Environment: A global Perspective: a resource manual for the health sector. Pronczuk de Garbino J, Editor 2005.
5. American Academy of Pediatrics Committee on Environmental Health. Etzel RA, editor. Pediatric Environmental Health, 2nd edition 2003.
6. World health Organisation. Healthy Environments for Children. WHO, Geneva 2002. 7. United Nations World Summit on Sustainable Development. Plan of implementation. 2002.
http://www.un.org/esa/sustdev/
8. Proceedings of the Workshop on Children’s Health and the Environment. UN offices in Nairobi, October 2005.
9. Ostrosky-Wegman P, Gonsebatt ME. Environmental toxicants in developing countries. Environmental health perspective 104 supplement 3 1996.
10. Mahoney DB, Moy GC. Food borne hazards of particular concern to children. In: Pronczuk de Garbino J. Editor. Children’s health and the environment, a global perspective: a resource manual for the health
sector. Chapter 11, 2005.
11. Agency for Toxic Products and Disease Registry (ATSDR). Toxicological profile for lead. US Department of Health and Human Services; Public Health Services.
12. Young R. Toxicity summary for Mercury. 1992 13. Young RA. Toxicity summary for Cadmium. 1991 14. Opresko DM. Toxicity summary for Arsenic. 1992. 15. Karim AH. Environmental protection, public health and human rights: an integrated assessment. A
report for science and human rights program; American Association for the advancement of Science.
2003.
16. Agency for Toxic Products and Disease Registry (ATSDR). Toxicological Profile for Polychlorinated Biphenyls (PCBs). US Department of Health and Human Services; Public Health Services.1998.
17. Agency for Toxic Products and Disease Registry (ATSDR). Toxicological Profile for Chlorinated Dibenzo-p-Dioxins. US Department of Health and Human Services; Public Health Services.
18. Operational guide on sampling, storage and sample preparation for XRF analysis of Environmental materials. International Atomic agency-Technical Document (draft) 1996.
19. LeadCare® blood lead testing system users guide, Environment Science Associates (ESA). 20. Njoroge GK, UNEP. Blood lead levels in Kenya: A case study for children and adolescents in selected
areas of Nairobi and Olkalou, Nyandarua District. 2005.

ANNEXURES ●
31
4. Annexures
Annexure 1Annexure 1Annexure 1Annexure 1.... Sampling sites for soil and water samples at the Dandora waste dumping site Sampling sites for soil and water samples at the Dandora waste dumping site Sampling sites for soil and water samples at the Dandora waste dumping site Sampling sites for soil and water samples at the Dandora waste dumping site
St. John Catholic Church informal School approximately 100 meters from dumping site
- Quarry full of water adjacent to the school
E11- 1st sampling site for soil; across the school’s fence and next to the schools outlet
overlooking the dumping site
E12- 2nd sampling site for soil in a cultivated area next to the school
E13- 3rd sampling site for soil at the banks of Nairobi River
E14- 4th sampling site for soil in a shamba between the Nairobi River and water logged quarry
E16- 6th sampling site for soil; bordering the dumping site on the Dandora side
E15- 5th Sampling site for compost sample; a site within the dumping site
E21- 1st sampling site for water at a slow moving part of the Nairobi river adjacent to the
dumping site
E22- 2nd sampling site for water at the quarry

ANNEXURES ●
32
Annexure 2Annexure 2Annexure 2Annexure 2.... Environmental samples; sampling and results Environmental samples; sampling and results Environmental samples; sampling and results Environmental samples; sampling and results
Annexure 2a Summary of soil and water sampling process at the DAnnexure 2a Summary of soil and water sampling process at the DAnnexure 2a Summary of soil and water sampling process at the DAnnexure 2a Summary of soil and water sampling process at the Dandora/Korogocho waste andora/Korogocho waste andora/Korogocho waste andora/Korogocho waste
dumping site dumping site dumping site dumping site
E=Environmental, 1st digit = type of sample (1 = soil, 2 = water), 2nd digit = sampling site, 3rd digit (if
included) = sample profile in Cms (1= 0-20, 2= 20-40, 3 = 40-60).
Sampling Sampling Sampling Sampling
site No.site No.site No.site No.
Sample Sample Sample Sample
CodeCodeCodeCode
Sampling sSampling sSampling sSampling site (GPS readings)ite (GPS readings)ite (GPS readings)ite (GPS readings) Profile Profile Profile Profile
(Cms)(Cms)(Cms)(Cms)
Weight/ volume of Weight/ volume of Weight/ volume of Weight/ volume of
samplesamplesamplesample
Soil Soil Soil Soil
samplessamplessamplessamples
Altitude Altitude Altitude Altitude S1S1S1S1oooo
E036E036E036E036oooo
1 1 1 1 E111 1613 14.944 53.548 0-20 2229.35
E121 1598 14.892 53.559 0-20 3190.47
E122 1598 14.892 53.559 20-40 3121.27
2 2 2 2
E123 1598 14.892 53.559 40-60 3216.93
E131 1590 14.921 53.624 0-20 1647.75 3 3 3 3
E132 1590 14.921 53.624 20-40 1979.25
E141 1592 14.938 53.604 0-20 1711.20
E142 1592 14.938 53.604 20-40 1950.10
4 4 4 4
E143 1592 14.938 53.604 40-60 2743.55
E161 1611 14.748 54.098 0-20 3882.66
E162 1611 14.748 54.098 20-40 3624.89
6 6 6 6
E163 1611 14.748 54.098 40-60 2021.25
CompostCompostCompostCompost
5 5 5 5
E151 1613 14.771 53.921 0-20 1032.28
Water Water Water Water
samples samples samples samples
7 7 7 7 E21 1590 14.921 53.624 2000mls
8 8 8 8 E22 1597 14.938 53.604 2000mls

ANNEXURES ●
33
Annexure 2b Annexure 2b Annexure 2b Annexure 2b Elemental Concentrations in individual soil sample profiles from the Dandora /Korogocho Elemental Concentrations in individual soil sample profiles from the Dandora /Korogocho Elemental Concentrations in individual soil sample profiles from the Dandora /Korogocho Elemental Concentrations in individual soil sample profiles from the Dandora /Korogocho
/waste dumping site by EDXRF* /waste dumping site by EDXRF* /waste dumping site by EDXRF* /waste dumping site by EDXRF*
Ele
me
nts
Elemental concentrations (ppms) in individual soil samples.
E111E111E111E111 E121E121E121E121 E122 E122 E122 E122 E123 E123 E123 E123 E131 E131 E131 E131 E132 E132 E132 E132 E141 E141 E141 E141 E142 E142 E142 E142 E143 E143 E143 E143 E161 E161 E161 E161 E162 E162 E162 E162 E163 E163 E163 E163
K K K K 19000 25000 14700 27500 25500 25000 24400 15400 25000 21700 14700 11200
Ca Ca Ca Ca 51300 7800 4800 7100 15900 15000 9500 10900 6100 20500 19700 6100
Ti Ti Ti Ti 6000 5000 3700 6400 6100 6800 5600 4100 7200 5800 4800 3700
Cr Cr Cr Cr BDL 103 BDL BDL 178 BDL 185 147 272 122 BDL 97.8
MnMnMnMn 5900 3700 3000 3600 4200 3600 4200 3600 4900 5400 6600 3700
Fe Fe Fe Fe 46900 39500 35000 47900 57500 59200 49400 42900 57900 43700 39100 30600
Cu Cu Cu Cu 118 BDL BDL BDL 70.1 90.4 BDL 49.1 BDL BDL 198 BDL
Zn Zn Zn Zn 1150 323 279 239 781 759 408 404 267 426 334 175
As As As As BDL BDL BDL BDL BDL BDL BDL BDL BDL BDL BDL BDL
Hg Hg Hg Hg BDL BDL BDL BDL BDL 18.6 BDL BDL BDL BDL BDL BDL
Pb Pb Pb Pb 185 76.09 60.9 60.7 417 488 590 544 547 87.6 66.6 50.2
CdCdCdCd
* * * *
Surface 52.9 ppm Subsurface 26.5 ppm
♠
BDL: Below detection limit- Copper (Cu) - 15 ppms, Chromium (Cr)-70 ppms, Mercury (Hg)-15 ppms
* Cadmium (Cd) was analysed using atomic absorption spectrometry (AAS) on two soil samples (surface and
subsurface) that has been obtained on pooling soil samples from the different levels of sampling.

ANNEXURES ●
34
Annexure 3Annexure 3Annexure 3Annexure 3.... Pesticides screen and polychl Pesticides screen and polychl Pesticides screen and polychl Pesticides screen and polychlorinated biphenyls determination orinated biphenyls determination orinated biphenyls determination orinated biphenyls determination

ANNEXURES ●
35
Annexure 4Annexure 4Annexure 4Annexure 4.... The Lead Care blood lead The Lead Care blood lead The Lead Care blood lead The Lead Care blood lead analyzer analyzer analyzer analyzer
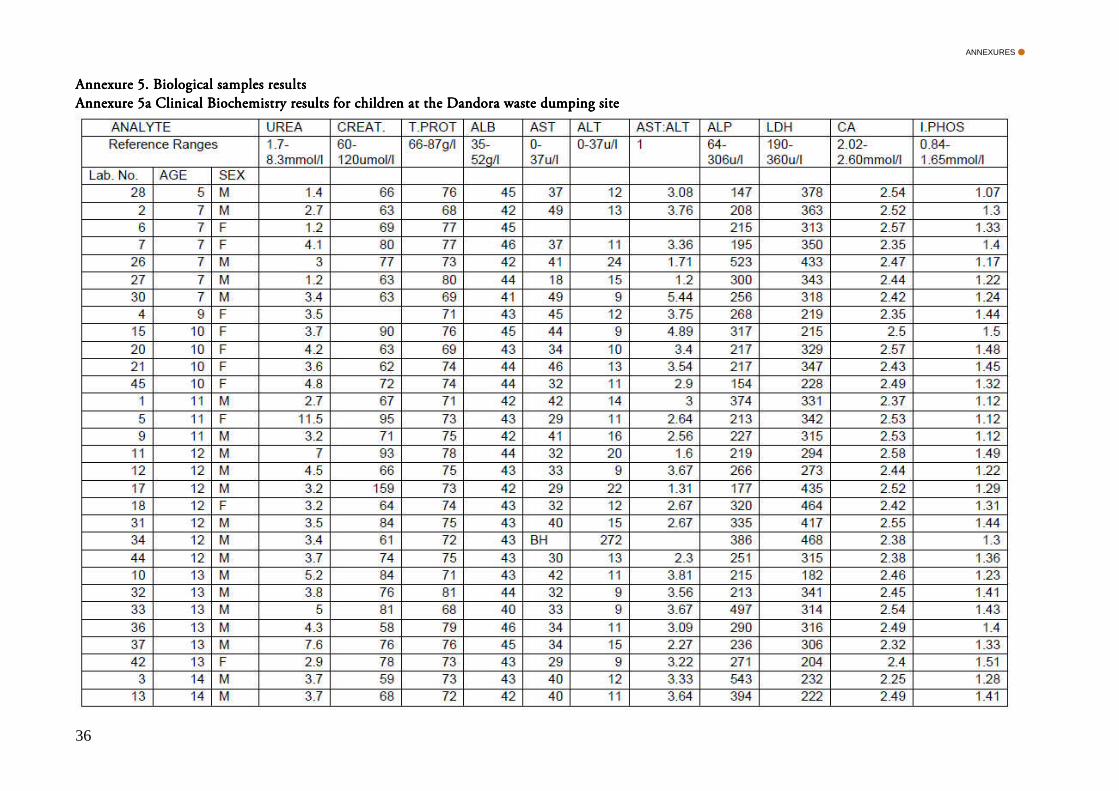
ANNEXURES ●
36
Annexure 5Annexure 5Annexure 5Annexure 5.... Biological samples results Biological samples results Biological samples results Biological samples results
Annexure 5a Annexure 5a Annexure 5a Annexure 5a ClClClClinical Biochemistry results for children at the Dandora waste dumping site inical Biochemistry results for children at the Dandora waste dumping site inical Biochemistry results for children at the Dandora waste dumping site inical Biochemistry results for children at the Dandora waste dumping site

ANNEXURES ●
37
Annexure 5a contAnnexure 5a contAnnexure 5a contAnnexure 5a cont. . . .

ANNEXURES ●
38
Annexure 5b Annexure 5b Annexure 5b Annexure 5b Haematological Indices Haematological Indices Haematological Indices Haematological Indices
INDICES INDICES INDICES INDICES HBHBHBHB WBCs Differential countsWBCs Differential countsWBCs Differential countsWBCs Differential counts RBCs Morphology RBCs Morphology RBCs Morphology RBCs Morphology
REF. RANGE REF. RANGE REF. RANGE REF. RANGE
LabLabLabLab
No.No.No.No.
AGAGAGAG
EEEE
SESESESE
XXXX
Male 11.2Male 11.2Male 11.2Male 11.2----
16.3 16.3 16.3 16.3
Female Female Female Female
11.311.311.311.3----15.0 15.0 15.0 15.0
NeutroNeutroNeutroNeutro
phils phils phils phils
LymphLymphLymphLymph
ocytesocytesocytesocytes
MonocMonocMonocMonoc
ytesytesytesytes
EosinoEosinoEosinoEosino
philsphilsphilsphils
28 5 M 12.9 37 54 7 2 Few microcytes with slight hypochromasia noted
8 6 F 13.1 47 46 3 3 Few microcytes with slight hypochromasia noted
2 7 M 11.1 30 52 7 11 Slight microcytosis/hypochromasia
6 7 F 12.4 36 57 6 1 Normocytic normochromic
7 7 F 13 37 48 11 2 Target cells present/slight hypochromasia
basophilia noted
26 7 M 12.1 36 54 7 2 Target cells/slight hypochromasia noted
27 7 M 14.1 46 36 10 8 Normocytic normochromic
30 7 M 13.2 51 37 5 7 Normocytic normochromic
4 9 F 11.9 34 50 8 8 Few microcytes observed
15 10 F 12 29 62 7 2 Normocytic normochromic
16 10 F 12.3 45 47 4 2 Normocytic normochromic
20 10 F 14 46 52 1 1 Normocytic normochromic
21 10 F 13.3 61 35 3 1 Normocytic normochromic
45 10 F 12.9 44 47 3 6 Normocytic normochromic
1 11 M 11.5 36 51 11 2 Normocytic normochromic
5 11 F 10.5 18 63 7 12 Microcytosis/hypochromasia
9 11 M 12.4 39 56 5 Normocytic normochromic
11 12 M 11.5 24 53 7 16 Microcytosis/marked eosinophilia
12 12 M 13.9 40 40 5 15 Normocytic normochromic/marked eosinophilia
17 12 M 12.1 32 57 8 3 Target cells observed/normocytic normochromic
18 12 F 14.6 54 38 4 4 Microcytosis noted
31 12 M 13.3 39 42 7 12 Microcytosis with slight hypochromasia/Marked
eosinophilia
34 12 M 12.2 48 40 5 7 normocytic normochromic
44 12 M 12.6 53 43 6 Microcytosis observed
10 13 M 12.7 33 62 5 Normocytic normochromic
32 13 M 12.8 22 50 7 21 Microcytosis/marked eosinophilia
33 13 M 13.4 48 43 2 7 Few microcytes noted
36 13 M 15.1 37 50 7 6 Normocytic normochromic
37 13 M 11.6 37 50 4 9 Target cells microcytic hypochromic
42 13 F 11.9 44 48 3 5 Microcytic hypochromic
3 14 M 12.9 32 44 14 10 Normocytic normochromic
13 14 M 12.2 54 34 9 3 Normocytic normochromic
38 14 M 13.4 43 35 8 14 Marked eosinophilia
43 14 F 13.2 31 56 7 6 Normocytic normochromic
39 15 M 13.4 25 57 9 6 Normocytic normochromic
40 15 M 13 55 36 2 7 Normocytic normochromic
41 15 M 13 53 36 7 4 Normocytic normochromic
14 16 M 13.6 35 52 4 9 Normocytic normochromic
35 17 M 13.5 57 35 4 4 Normocytic normochromic
19 18 M 13.2 30 53 6 11 Normocytic normochromic

ANNEXURES ●
39
Annexure 6Annexure 6Annexure 6Annexure 6.... Blood lead levels for children at the St John Korogocho Blood lead levels for children at the St John Korogocho Blood lead levels for children at the St John Korogocho Blood lead levels for children at the St John Korogocho
SAM. NO. SAM. NO. SAM. NO. SAM. NO. AGE AGE AGE AGE SEX SEX SEX SEX BLL BLL BLL BLL
µg/dl 28 5 M 6.6
8 6 F 10
2 7 M 10.5
6 7 F 6.2
7 7 F 16.7
26 7 M 7.3
27 7 M 17.5
30 7 M 9.4
4 9 F 22.8
15 10 F 10
16 10 F 6.1
20 10 F 11.3
21 10 F 7.4
45 10 F 3.9
1 11 M 6.6
9 11 M 4.2
11 12 M 29.4
12 12 M 32.1
17 12 M 8.7
18 12 F 8.4
31 12 M 12.6
34 12 M 11
44 12 M 16.8
10 13 M 8.9
32 13 M 18.7
33 13 M 13
36 13 M 8.4
37 13 M 19.3
42 13 F 6
13 14 M 8.3
38 14 M 8.5
43 14 F 22.9
39 15 M 6.8
40 15 M 8.3
41 15 M 4.9
14 16 M 19.5
35 17 M 16.7
19 18 M 20.6

ANNEXURES ●
40
Annexure 7 Annexure 7 Annexure 7 Annexure 7 Topographical map of the Dandora waste dumping and its environs; circled area Topographical map of the Dandora waste dumping and its environs; circled area Topographical map of the Dandora waste dumping and its environs; circled area Topographical map of the Dandora waste dumping and its environs; circled area
indicates area where study was conducted indicates area where study was conducted indicates area where study was conducted indicates area where study was conducted