environmental quality in connecticut 2011
TRANSCRIPT

7312019 Environmental Quality in Connecticut 2011
httpslidepdfcomreaderfullenvironmental-quality-in-connecticut-2011 148
7312019 Environmental Quality in Connecticut 2011
httpslidepdfcomreaderfullenvironmental-quality-in-connecticut-2011 248
STATE OF CONNECTICUT
COUNCIL ON ENVIRONMENTAL QUALITY
Barbara C Wagner
Chair
M Howard Beach
Janet P Brooks
Liz Clark
Bruce R Fernandez
Karyl Lee Hall
Richard Sherman
Karl J Wagener
Executive Director
June 6 2012
The Honorable Dannel P MalloyGovernor of ConnecticutState Capitol
Hartford CT 06106
Dear Governor Malloy
I am pleased to submit the official report on the condition of Connecticutrsquos envi-
ronment for 2011
As you know the core of the report is a standardized set of environmental indica-
tors by which we measure Connecticuts progress At first glance the statistics for2011 look typical of recent years In the reports introduction the Council takes a
closer look at some of the more revealing indicators
The destructive storms of 2011 had the effect of bringing to light some previouslyobscure environmental data We learned that in nearly three-quarters of Connecti-cut homes mingle extensively with wild natural lands -- a greater portion than any
other state We also learned that residents take full advantage of their proximity tonature by watching wildlife around the home and conserving habitat much morethan the average American and spend an unusually large sum of money doing so
So were suggesting that Connecticut might want to claim the title of the 1 Nature
State
The states pattern of land development present and future will dictate the envi-
ronmental policies essential to long-term improvement in the quality of Connecti-cuts air water and life These conclusions are discussed in Connecticut The Stateof Nature
Activities of the Council summarizes last years investigations and notes that June2011 marked the 40th anniversary of the law that established the CEQ
Later in the year the Council will submit Part II which will include recommenda-tions for improving the statersquos environment based on the data in front of you
As always the Council looks forward to providing you with any additional informa-
tion or assistance that you might request
Respectfully
Barbara C WagnerChair
79 Elm Street Hartford CT 06106
Phone (860) 424-4000 Fax (860) 424-4070
httpwwwctgovceq
7312019 Environmental Quality in Connecticut 2011
httpslidepdfcomreaderfullenvironmental-quality-in-connecticut-2011 348
Bottom Line
A very brief summary of 2011
Improved or Held Steady at a Positive Level in 2011
Drinking Water Quality Bald Eagles amp Piping PloversInland Wetlands Good Air Days Farmland Conservation
What these improvements have in common They are the results of effective regulatory programsand modest public capital investments
Declined or Held Steady at a Level Insufficient to Meet Goals
Beach ClosingsOxygen Levels in Long Island Sound
Pollution in Long Island Sound
Lobsters and Clean Shellfish Beds
Average Level of Air Pollution Conservation of Forest Land (based on incomplete data)
What these deficiencies have in common Most will require substantial public capital investment
or in some cases improved strategies before goals can be met
Trends in Personal Impact Indicators
Connecticut residents used electricity more efficiently at work
Recycling rates remain below targets
Residents took the bus more often and drove lessCompliance rates were down
Data for several environmental indica-
tors were unavailable for 2011 for rea-sons that varied from staff shortages atDEEP to the absence of data collection
systems Nobody knows for examplehow much land in Connecticut was pre-
served last year nor does anyone
know how much has been permanently
protected to date because there is nosystem to collect such data
1
7312019 Environmental Quality in Connecticut 2011
httpslidepdfcomreaderfullenvironmental-quality-in-connecticut-2011 448
Introduction
Connecticuts environmental statistics for 2011 look typical of recent years they portraya static state with slow or no progress on some of the biggest challenges peppered withsmall improvements and minor retreats
Thats at first glance A closer look reveals many more facts some of which were illumi-nated dramatically by Tropical Storm Irene and the October 29 snowstorm
Here are the first glances and the closer looks
AIR
First Glance Slightly fewer bad days but more pollution on the average day
Closer Look Air quality in some towns after the October storm was atrocious appar-
ently because of emissions from generators wood stoves and fireplaces Northern Con-necticut probably saw particle levels over twice the standard that protects human health-- a sample of what Connecticut residents would breathe all the time if it were not for
the successful air pollution controls that have been put in place on most sectors of theeconomy
CLEAN RIVERS AND STREAMS
First Glance No change in six years
Closer Look Steady investment in upgrading cities sewerage continues but it mightnever result in rivers that are truly free of raw sewage after rainstorms We might needa new indicator to measure subtle progress Meanwhile runoff from developed areasremains the largest impediment to clean waterways Control of polluted runoff fromstreets parking lots and lawns is the next challenge if the goal of clean water is to beachieved
2
7312019 Environmental Quality in Connecticut 2011
httpslidepdfcomreaderfullenvironmental-quality-in-connecticut-2011 548
LIFE IN THE SOUND
First Glance Lobsters shellfish beds beaches pollution and oxygen all worse in 2011
Closer look This satellite view of the Connecticut River emptying uncountable tons of sediment into Long Island Sound nearly a week after Tropical Storm Irene receivedwidespread publication It is a powerful reminder that beaches oyster beds and the openwater are affected greatly by the pollution that washes off the surface of Connecticut af-ter every rain
FARM FOREST WETLAND
First Glance A good year for farmland conservation not for other lands
Closer Look Connecticut still does not know how close it is to its goal of conserving 21percent of the states land area (Public Act 12-152 could eventually lead to an accurateinventory of preserved lands)
PERSONAL IMPACT INDICATORS
Driving Our Cars
First Glance People are driving less
Closer Look Connecticut might be in the early stages of an unprecedented shift towardless driving if state and national data continue along current trends Until 2007 the av-erage resident drove more miles every year than in the previous year Some reduction indriving is attributed to economic factors but recent research has found that demograph-ic factors are playing a role
3
7312019 Environmental Quality in Connecticut 2011
httpslidepdfcomreaderfullenvironmental-quality-in-connecticut-2011 648
Compliance
First Glance Down
Closer Look About 1000 violations of Connecticutrsquos environmental laws are de-tected each year Who are the culprits The Council classified all 944 Notices of Violation(NOV) issued by the Department of Energy and Environmental Protection (DEEP) in the2011 fiscal year and found that the majority of NOVs issued to businesses were relatedto the storage distribution and use of petroleum especially gasoline Gas stations andconvenience stores received the largest number of NOVs Some classes of NOV recipientsmight surprise the readers medical offices and landscaping companies receivedmany Only 7 percent of NOVs went to manufacturers with more than 20 employeeswhich is smaller than the number issued to homeowners and other individuals
The indicators in this report provide many additional insights into the progress that Con-necticut residents have made and the challenges they confront Additional and previouslyobscure data about Connecticuts environment were brought to the fore by the storms of
2011 In fact Connecticut might well be able to claim the title The Nature State Readmore
______________________
Notes for This Edition
Regular readers of this report know that its core elements are the 31 indicators that describeConnecticuts environment objectively and reliably One indicator will probably be discontinuedafter this year retail sales data for ENERGY STAR appliances are no longer available state-by-state The most recent data are from 2009
The Council makes improvements to this report every year and many of them havebeen suggested by readers The Council greatly appreciates their advice Additional changes pro-posed by readers are in the works
4
7312019 Environmental Quality in Connecticut 2011
httpslidepdfcomreaderfullenvironmental-quality-in-connecticut-2011 748
Arrowheads Explained
Above each environmental indicator on the pages that follow readers will find an arrowhead that
illustrates improvement (arrowhead up) or decline (arrowhead down) in environmental conditions
There are four variations of the arrow symbols
The data show a positive change from theprevious year The one-year change is not
always consistent with the long-term trendwhich is displayed on the chart
The data show a negative change from the
previous year The one-year change is notalways consistent with the long-term trend
which is displayed on the chart
No arrow means the data for the latest
year available show a very small changepositive or negative from the previous
year If the color is green the indicator is
unchanged at a satisfactory level if red
unsatisfactory If the color is orangethe lack of change is neither good nor bad
Connecticut is not on track to meet its
long-term goal This symbol is used for
those indicators that except in the most
unusual circumstances always will show
some progress (ldquoPreserved Landrdquo is one
example) It would be misleading to label
the one-year change as ldquoimprovedrdquo if the
progress is not sufficient to get the state to
its goal by the established target date
5
7312019 Environmental Quality in Connecticut 2011
httpslidepdfcomreaderfullenvironmental-quality-in-connecticut-2011 848
Connecticut The State of Nature
The storms of 2011 brought to light some previously obscure data that say a lot aboutConnecticut
Example Connecticut is number one in WUI or Wildland-Urban Interface a measure of the proximity of peoples homes to forests wetlands and grasslands Seventy-two per-cent of Connecticuts land area can be classified as WUI a percentage matched by noother state The WUI scale has traditionally been used to measure communities suscep-tibility to forest fires but it also helps to explain such things as the vastness of poweroutages caused by storms
Whether Connecticuts extraordinary WUI classification is due more to effective conser-vation of green spaces in many communities or to past futility in minimizing sprawl is notthe critical point More important are the permanent quality of the developments now in
place the benefits and costs of residents proximity to nature the demographic and eco-nomic trends that will determine future development patterns and pursuing policies thatwill prepare Connecticut against potential degradation
Outside the central cities Connecticut residents live among trees and appear to embracesuch a lifestyle On the average plot of ground in Connecticut more people -- residentsand non-residents together -- are watching wildlife than in nearly any other state Thismakes sense as there is much to watch only in two other states might a birdwatcherfind more species of birds per square mile
Looking at the data even more closely Connecticut residents appear to be almost uniquein their affinity with nearby wild things A greater percentage participate in wildlife-associated recreation than the national average and among those participants residentsof no other state can challenge Connecticut residents preference for watching their wild-life around the home Connecticut is one of only five states where people spend more to
watch wildlife (primarily on equipment purchases) than they spend to hunt and fish (in-cluding license fees) and by a ratio that is unmatched (In the federal data watchingwildlife includes maintaining wildlife habitat)
Residents high rate of participation in outdoor activities and conservation activities is agreat positive on its own but it should be noted that it also yields a significant econom-ic profit to the state A University of Connecticut study released in December of 2011 es-timated that 9000 jobs $1 billion of economic activity and $30 million of net state reve-nue can be attributed to outdoor activities just in state parks and forests Any study thatalso accounted for the economic activity generated by birdwatching hiking and horse-back-riding statewide would show much larger numbers Six years ago the amountspent on hunting fishing and watching wildlife in the state was estimated to be near-
ly $1 billion
6
7312019 Environmental Quality in Connecticut 2011
httpslidepdfcomreaderfullenvironmental-quality-in-connecticut-2011 948
Life among the trees also carries economic costs and environmental risks Residents payto have power restored and the transmission system improved after each storm Somecosts associated with environmental risks are paid only indirectly Research shows forexample that invasive exotic species follow low-density housing development through-out New England Invasive species pose the single biggest threat to Connecticuts naturalecosystems but residents have never paid significant sums for statewide prevention andcontrol efforts (They do pay costs indirectly for some species unabated spread as anexample dense infestations of invasive vines contribute to utility line destruction duringstorms) Conservation organizations agencies and individuals have worked hard and ef-fectively to reduce the threat of some highly destructive species but the state has yet tomobilize against the threat of invasive species in a comprehensive way
The Future State
The pace and pattern of land development will determine the future of Connecticuts airwater and life A sudden spurt in sprawl would yield more water pollution more air pollu-tion more invasive species and a host of other negative outcomes
A 2009 report of the US Forest Service predicts large-scale conversion of Connecticuts
privately-owned forest land to housing and other types of development but that has yetto be shown It is true that any development in Connecticut that is not redevelopment islikely to convert privately-owned forest land However very recent census data showmore population growth in developed areas than in rural or exurban towns What trendwill dominate Connecticuts future
Connecticut generally appears to be in a steady state though one with an aging popula-tion and rising temperatures What a Connecticut resident sees here today is likely to bewhat he or she sees here 15 years from now barring an unforeseen boom in sprawl Asthe Council has noted in previous reports most Connecticut residents today see an envi-ronment little changed from the time they arrived a fact especially true for people 25-
years-old or younger The exceptions are sudden and tend to be negative to the behold-er such as when a familiar forest or farm suddenly disappears a telecommunicationstower appears on a nearby hill or a black bear destroys the backyard bird feeder
It is difficult to foresee strong forces that will alter Connecticuts development patternsor the indicators in this report Even a best-case scenario of vigorous economicgrowth built upon previously-developed properties is unlikely to move the indicators sub-stantially Growth that is based largely on consumption of undeveloped lands on theother hand would have many negative consequences but that outcome can be avoidedthrough good policy With the states environmental indicators showing only minor upsand downs and with a fairly stable though vulnerable economy and landscape delibe-rate actions will need to be taken before residents see improvements These include the
following
7
7312019 Environmental Quality in Connecticut 2011
httpslidepdfcomreaderfullenvironmental-quality-in-connecticut-2011 1048
Reduce water pollution from developed areas This means low-impact devel-opment techniques for new development and a long campaign of retrofittingtowns and cities with green infrastructure The new permeable sidewalks encir-cling the State Capitol should be considered normal not exceptional
Plan for homes and jobs near mass transit As documented in many placesgood transportation and economic development policies can guide and stimulate
development where people can live outside the automobile
Train municipal regulators Volunteer municipal commission members makethousands of regulatory decisions annually Training of these members is a low-cost highly effective component of the environmental protection arsenal buttraining needs are chronically underserved
Invest The cost of regulating pollution is generally covered by the regulated par-ties but who aside from sportsmen and park patrons are paying for the man-agement of the states natural resources For the most part nobody Yet the up-side potential is great residents see $38 of economic activity for each dollar thestate spends on parks
Embrace the Nature State (and Keep Conservation Alive) If residents enjoyliving among trees observing wildlife and working locally to conserve land as
they evidently do state policies should honor that choice However recent reports from the Connecticut Audubon Society and others express doubt that Connecti-cuts high level of volunteer conservation commitment will endure as many child-ren lack extended exposure to wild nature Connecticut must never let a lack of knowledge and enthusiasm erode its status as the Nature State
Connecticutrsquos environmental indicators begin on the next page
8
7312019 Environmental Quality in Connecticut 2011
httpslidepdfcomreaderfullenvironmental-quality-in-connecticut-2011 1148
Air
Good Air Days
Every Connecticut resident breathed good air on 342 days in 2011 eight morethan in 2010
A Good Air Day is a day when every monitoring station in the state records satisfactory air quali-
ty ldquoSatisfactory air qualityrdquo is defined here as air that meets the specific health-based ambient
air quality standards for all of the following 6 pollutants sulfur dioxide lead carbon monoxideparticles nitrogen dioxide and ground-level ozone
Connecticutrsquos goal is to have air that meets health-based standards for all pollutants Violationsof health-based air quality standards have been eliminated for all pollutants except ground-level
ozone and fine particles On 13 summer days concentrations of ground-level ozone violated theozone standard that protects human health The standard for fine particles was violated on 10
days in the fall and winter an unusually high number One steamy July day saw the standardsviolated for both ozone and fine particles Not every town experienced bad air on the same days
Danbury was the location with the most bad air days (11 days total five bad ozone days five bad
particle days and one day that was bad for both ozone and particles)
Ozone is created when nitrogen oxides and organic compounds in the air react in the presence of
sunlight Weather is a big factor in year-to-year fluctuations Motor vehicles remain a major
source of ozone-forming emissions despite improvements in tailpipe standards Much ground-level
ozone originates in states to the west of Connecticut
In typical years cities and towns in the western and coastal regions of the state see the most bad
air days In 2007 and in 2009 however inland towns had more The historical pattern returned in2010 and 2011 with coastal towns having the most bad ozone days Groton and Westport had thehighest frequency in 2011 (nine days each)
9
7312019 Environmental Quality in Connecticut 2011
httpslidepdfcomreaderfullenvironmental-quality-in-connecticut-2011 1248
Fine particles such as those found in smoke and haze are 25 micrometers in diameter andsmaller These particles can form when gases emitted from power plants industries and automo-
biles react in the air Violations of the health standard occur mostly in summer and winter rarely
in spring and fall The fall of 2011 was a notable exception as generators wood stoves and fire-places put into use after the October 29 snowstorm yielded very high levels of fine particles insome cities and towns The monitoring stations in the northern half of the state were themselves
knocked out but the extraordinarily high levels recorded in Springfield Massachusetts -- more
than twice the limit that protects human health -- undoubtedly extended into Connecticut Most of Connecticut meets the health standard for fine particles as that standard allows the air to exceedthe numerical limit for a few days each year
Technical Note The federal government modified the standards for fine particles in December2006 and for ground-level ozone in early 2008 The chart above was redrawn each time to illu-strate the states historical pattern of good air days by applying the new stricter standards to all
previous years The federal government is again reviewing the standards for particles and
ground-level ozone
10
7312019 Environmental Quality in Connecticut 2011
httpslidepdfcomreaderfullenvironmental-quality-in-connecticut-2011 1348
Air
Clearing the Air
Average Levels of Air Pollution
Connecticutrsquos air was slightly more polluted in 2011 than in 2010 breaking afive-year winning streak
The chart shows the average amount of pollution in Connecticuts air for each year Six air pollu-tants -- sulfur dioxide lead carbon monoxide particles nitrogen dioxide and ground-level ozone-- are measured across the state by DEEP At the end of every year the Council expresses the av-erage level of each pollutant on a numerical scale where zero equals no pollution and 100
represents the ldquounhealthfulrdquo level of the specified pollutant The Council then takes this annualnumber for each of the six pollutants and averages them to yield the single index value on thisgraph
In 2011 all of the pollutants (excluding lead) increased slightly for the first time since 2005 Le-
vels of lead in the air have dropped so low that they barely register in this indicator In 2010carbon monoxide was the only pollutant to increase from the previous year
The increase in pollution in 2011 is partially ascribable to the large number of generators woodstoves and fireplaces that were put into use following the October snowstorm Yearly weathervariations also cause fluctuations in air quality
Technical Note A new monitoring station was added in Litchfield in 2010 To maintain an accu-
rate comparison among years data from this station will not be added until there are enoughyears to provide a trend At that time all the earlier years will be re-calculated
11
7312019 Environmental Quality in Connecticut 2011
httpslidepdfcomreaderfullenvironmental-quality-in-connecticut-2011 1448
Farm Forest Wetland
Preserved Land
Connecticuts goal is to preserve 21 of the states land area by 2023 but no-body knows how much land has actually been preserved
State law (CGS 23-8(b)) sets a goal of conserving 21 percent of Connecticutrsquos land area TheGreen Plan Connecticutrsquos official land conservation plan establishes 2023 as the target dateThat goal includes conservation land owned by towns and cities land trusts and other nonprofitorganizations water utilities and the state
The same law sets a goal (10 percent of Connecticuts land area) for state ownership of land forparks forests and wildlife areas Records of state-owned lands are accurate and are reported
here
In 2011 DEEP preserved about 575 acres State grants helped municipalities and land trusts ac-
quire an additional 1600 acres This pace is not nearly sufficient to reach the states goals
Many additional acres probably thousands in some years are preserved by municipalities and
land trusts without state grants but this information is not reported to the state The Council de-termined that previous state estimates of the acreage owned by municipalities and nonprofit land
trusts were inaccurate Those estimates which were reported in previous editions of Environmen-tal Quality in Connecticut are no longer included in this report
The absence of an accurate inventory of protected land in Connecticut is a serious deficiencyDEEP has been collecting data from municipal records in a sequential fashion for 12 years if that
effort is ever completed the earliest-collected data will be well out of date To make land preser-vation more strategic and cost-effective Connecticut needs a reliable and up-to-date registry of the states protected lands Public Act 12-152 could eventually lead to an accurate inventory
12
7312019 Environmental Quality in Connecticut 2011
httpslidepdfcomreaderfullenvironmental-quality-in-connecticut-2011 1548
Farm Forest Wetland
Forest
After a century of growth and relative stability Connecticutrsquos forests -- especiallythe most valuable core forests -- have been shrinking for two decades
Most of Connecticutrsquos forests were cleared for agriculture and industry in the 19th century andthen allowed to regenerate From 1960 to 1980 the overall acreage of forest did not change
much even with the rapid spread of roads housing and commercial development According tothe US Forest Service the spread of forests on abandoned farms equaled the conversion of fo-
rested land to other uses The late 20th century brought a change forest is now declining
This indicator shows the total acreage of forests in Connecticut The forests are divided into core
forests and other forests Core forests are at least 300 feet from non-forest development such as
roads buildings and farms Forests that are fragmented or divided by roads and buildings servesome forest purposes but are not fully-functioning forest ecosystems Fragmented forests areknown to provide substandard habitat for many species of wildlife and in many cases less oppor-
tunity for hunting and other types of recreation
Even as the total acreage of forests might fluctuate over years or decades the extent of core fo-rests will always show a decline except in rare instances where roads or developments might be
abandoned and reclaimed by forests
Technical Note The definition and measurement of core forests is done by the Center for LandUse Education and Research (CLEAR) at the University of Connecticut as part of the Connecticutrsquos
Changing Landscape Project (CCL) The Council finds these data derived from CLEARs analysis of satellite imagery to be the most accurate data available Satellite data is examined by CLEARevery few years this indicator includes the most recent data available (2006)
13
7312019 Environmental Quality in Connecticut 2011
httpslidepdfcomreaderfullenvironmental-quality-in-connecticut-2011 1648
Farm Forest Wetland
Farmland
In 2011 Connecticut preserved 1975 acres of farmland -- the best year for pre-servation since 1993 and close to the 2000-acre annual rate needed to reach
the states goal
The top chart shows the acreage of land being farmed in Connecticut The bottom chart shows thecumulative acreage preserved by the Connecticut Department of Agriculture
14
7312019 Environmental Quality in Connecticut 2011
httpslidepdfcomreaderfullenvironmental-quality-in-connecticut-2011 1748
To preserve land for future agricultural use the Connecticut Department of Agriculture purchasesthe development rights to farmland from volunteer sellers This keeps the land in private owner-
ship with severe restrictions on future nonagricultural development Over 1300 acres were pre-
served each year from 2008 through 2010 In 2011 16 farms participated preserving 1975acres Funds are mostly from state bonding and the Community Investment Act
Connecticuts farmland preservation goal is based on the amount of land needed for food produc-tion Mathematical projections of the current preservation rate show the goal being reached in the22nd century but in reality there will not be that acreage of agricultural land remaining in the
state by the end of the current century if the recent rate of loss continues Preservation of at least
2000 acres annually should result in success
This indicator does not show agricultural land acquired for preservation by municipalities and
nonprofit organizations Several towns purchased farms in recent years with no state assistanceand those acres are not reported or recorded at the state level Along with a central registry of preserved open space Connecticut needs a registry of preserved farmland to help state agencies
and other organizations preserve land strategically
Technical Note Until 2008 the uppermost chart showed the total acreage of land in Connecticutfarms as counted using survey data by the US Department of Agriculture (USDA) The Council
has found a superior data source in the University of Connecticuts Center for Land Use Educa-
tion and Research (CLEAR) CLEAR staff analyzes satellite imagery to measure the actual area of fields pastures orchards and vineyards In contrast the USDA data counted all land in farmseven that which was not used for agriculture CLEAR analyzes new satellite imagery every few
years the most recent imagery is from 2006
15
7312019 Environmental Quality in Connecticut 2011
httpslidepdfcomreaderfullenvironmental-quality-in-connecticut-2011 1848
Farm Forest Wetland
Inland Wetlands
Towns and cities permitted disturbance of about 70 acres of wetlands the fewestin four years
Local commissions reduced the wetlands disturbance caused by the averagepermit
16
7312019 Environmental Quality in Connecticut 2011
httpslidepdfcomreaderfullenvironmental-quality-in-connecticut-2011 1948
The top graph shows the acreage of wetlands disturbed by development ldquoDisturbedrdquo wetlands
are those affected directly by human activity which can range from total destruction (when the
wetlands are filled and built upon) to conversion from one type to another (when for example ashallow swamp is dredged to create a pond) There is no specific goal for wetlands conservation
The top graph also shows the acres of wetlands created or otherwise enhanced by humans No
attempt is made here to evaluate the success of the created wetlands or their value relative to
the natural wetlands that might have been altered In fact the created category includes somany diverse activities that the number has no real meaning The Council intends to drop theacres created category in next years report (Readers are invited to comment on this proposal)
The lower graph shows the area of inland wetlands affected by the average permit issued by mu-
nicipalities Use of the average permit shows trends irrespective of the changes in the number of applications that are caused by economic trends
In 2010 and 2011 more than 25 percent of municipalities failed to report their data to DEEP asrequired by state law
Inland wetlands are estimated to cover about 450000 acres or 15 percent of Connecticuts sur-
face More than 95 percent of the development activity in and around wetlands is regulated bymunicipalities with minimal oversight or supervision by the DEEP In October 2008 the Councilpublished Swamped a special report that analyzed performance of the states inland wetlands
program including training State law requires every municipal wetlands agency to have at leastone member or staff person complete DEEPs comprehensive wetlands training program but
many municipalities do not comply with this requirement A thorough statistical analysis foundthat cities and towns that possessed at least one trained member or staff person allowed less
wetlands disturbance than cities and towns that were not in compliance with the training require-ment
Technical Notes The results for 2010 and 2011 should be considered preliminary due to the high
percentage of non-reporting towns The Council adjusts the reported data to account for the non-
reporting towns but inaccuracies are inevitable (The Council is confident that the statistical ad- justment is reasonable because Swamped also examined differences in performance betweentowns that report to the DEEP and towns that do not report and confirmed that non-reporting
towns are similar to reporting towns in the average amount of wetlands destruction they per-
mit) Also for 2011 two 100-acre projects were not included in the totals one involved invasivespecies removal from a Manchester wetland and the other was a drawdown of a pond in Bethle-hem Both were of a scale that distorted typical wetlands activity data
17
7312019 Environmental Quality in Connecticut 2011
httpslidepdfcomreaderfullenvironmental-quality-in-connecticut-2011 2048
Sound + Shore
No Swimming at the Beach
Heavy rain caused the average coastal city and town to close its beaches manymore days than usual
The Council adds up the number of days that each coastal city and town closed one or more of its
public beaches and calculates an average for all the cities and towns with beaches The cities andtowns in the western half of the state usually have a higher frequency of closings
Yearly variations generally are products of rainfall patterns and unusual incidents such as sewer-line ruptures The storms of 2011 (most notably Tropical Storm Irene) resulted in many closings
as many beaches were awash in contaminated runoff raw sewage and debris
In typical years about half of beach closings are due to tests showing elevated levels of bacteriaPolluted surface runoff or sewage overflows after rainstorms are the most common sources of the
bacteria Most other closings are precautionary as health officials must assume that heavy rains
will wash polluted runoff andor overflow from combined sanitarystorm sewers
Connecticutrsquos goal is to eliminate beach closings caused by discharges of untreated or poorlytreated sewage a common cause of elevated bacteria levels
18
7312019 Environmental Quality in Connecticut 2011
httpslidepdfcomreaderfullenvironmental-quality-in-connecticut-2011 2148
Sound and Shore
Piping Plovers on the Beach
A record year as more than 100 of these threatened shorebirds nestedon coastal beaches from Westport to Stonington
Piping Plovers are small shorebirds that nest on sandy sparsely-vegetated beaches Human intru-sion storm tides and predators frequently destroy nests Fifty-two pairs nested in 2011 nine
more than in 2010 Storms and tides destroyed quite a few of their nests
Although the number of plovers on Connecticuts beaches now exceeds the goal that was set in
the 1980s it continues in threatened status at the state and national level Nesting adults arecounted and in most cases protected every spring by the US Fish and Wildlife Service DEEP andvolunteers working with the Connecticut Audubon Society The Nature Conservancy Audubon
Connecticut and local organizations such as the Friends of Milford Point and Stratford Great Mea-
dows National Wildlife Refuge The protections afforded these plovers also benefit other nesting
species including American Oystercatchers and Least Terns which are also a threatened speciesin Connecticut Since protection and monitoring efforts began in 1984 nesting success has im-proved resulting in more returning adults in subsequent years Yearly variations can occur when
adult birds move from one state to another
19
7312019 Environmental Quality in Connecticut 2011
httpslidepdfcomreaderfullenvironmental-quality-in-connecticut-2011 2248
Sound + Shore
Life in Long Island Sound
About half of the fish species in Long Island Sound are increasing
The lobster population of Long Island Sound has failed to recover
DEEP surveys marine fish squid and lobster populations every spring and fall by towing nets froma research vessel Data for 2010 are absent because repairs to the research vessel John Dempsey precluded the fall Long Island Sound trawl survey
20
7312019 Environmental Quality in Connecticut 2011
httpslidepdfcomreaderfullenvironmental-quality-in-connecticut-2011 2348
The top graph shows general trends in the collective populations of lobster squid and 38 speciesof fish The number displayed for any year is the percentage of these 40 species that were above
their long-term average populations In 2005 through 2009 fewer than half of these species were
as common as they were in the 1980s and 1990s The surveys of 2011 showed modest improve-ment Half of the species were as common as in prior years The species selected for this analy-sis reflect a bias in favor of managed species that have high commercial and recreational value
A separate analysis (not shown) of the geometric mean of the weight of all the fish taken per tow
(regardless of species) was the lowest since 2003 This measure may better reflect the overallhealth of the Sound as a habitat The Council is considering adding this measure in future years
Scientists are unsure of the reasons behind the declines and fluctuations of recent years Onepossible explanation for the decline of some prey species is the population growth of striped bass
and other predators Over recent years some colder-water species such as windowpane flounder
and little skate have declined as warmer-water species such as scup and summer flounder haveincreased along with the average yearly temperature of the Sound The illustration at the bottom
of this page lists some-warm water species that are on the increase with some cold-water speciesthat are decreasing
The fall 2011 trawl results for lobster were the lowest ever recorded It is the nadir in a well-documented decade-long decline in the lobster population that also is evident in a dramatic dropin commercial lobster landings during the same period (not shown) Researchers are focusing on
a combination of four possible causes for the dramatic downturn in lobster populations since
1999 disease changes in water quality changes in climatic conditions and human impacts to theSound Research to date suggests that a trend toward warmer water temperatures is an impor-tant factor in the decline of lobsters
Declined through 2011 Increased through 2011
Windowpane Flounder
(shown)
Little Skate
Scup
Atlantic Moonfish (shown)
Summer Flounder
21
7312019 Environmental Quality in Connecticut 2011
httpslidepdfcomreaderfullenvironmental-quality-in-connecticut-2011 2448
Sound + Shore
Pollution in Long Island Sound
The amount of nitrogen dumped into Long Island Sound and its tributaries in-creased slightly in 2011
The area of the Sound with adequate levels of oxygen declined slightly from2010
22
7312019 Environmental Quality in Connecticut 2011
httpslidepdfcomreaderfullenvironmental-quality-in-connecticut-2011 2548
The area of shellfish beds unconditionally approved for harvesting declined in2011
Hypoxia is a condition in the water when oxygen levels are too low to fully support desirableforms of life including fish and lobsters Hypoxia occurs when the nitrogen in pollution stimulatesexcessive growth of aquatic plants which die and get consumed by oxygen-using bacteria Con-
necticuts goal is to ldquoeliminate the adverse impacts of hypoxia resulting from human activi-
tiesrdquo Hypoxia occurs predominantly in the western portions of the Sound Weather greatly influ-ences hypoxia making year-to-year changes less important than long-term trends
To reduce the nitrogen inputs that cause hypoxia Connecticut and New York adopted a compre-hensive management plan in 1994 and built upon that plan with an expanded agreement in2002
The top graph tracks the amount of nitrogen discharged to the Sound and to major rivers by 79
sewage treatment plants two large coastal industrial facilities and a small group of industrialsources in the Naugatuck River watershed Connecticutrsquos investments in nitrogen-removal tech-nology from many of those plants have been successful
Large uncontrolled quantities of nitrogen enter Long Island Sound when rainfall carries fertilizer
from residents lawns along with the pollutants that have accumulated on pavement Overall
Connecticutrsquos share of the total nitrogen pollution in Long Island Sound is about one-third and
New Yorkrsquos is two-thirds In 2001 the federal Environmental Protection Agency approved the New
York and Connecticut joint plan for implementing a Total Maximum Daily Load (TMDL) The TMDLis the maximum amount of pollutants that can be discharged while still allowing water quality
standards to be attained
The Connecticut Department of Agricultures Bureau of Aquaculture and Laboratory Servic-
es monitors shellfish beds and classifies them according to their potential for the harvesting of healthful uncontaminated shellfish The third graph above shows the acreage of shellfish bedsthat are approved for harvesting because they are generally unaffected by pollution (Even areasthat are approved may be closed as a precaution following exceptional rainfalls of three or more
inches) Aquaculture experts have suggested that the annually increasing volume of runoff from
lawns and pavement is flowing further into the Sound resulting in the shrinkage of the shellfishbeds that are fully approved
23
7312019 Environmental Quality in Connecticut 2011
httpslidepdfcomreaderfullenvironmental-quality-in-connecticut-2011 2648
The decline in approved shellfish beds is not attributed to the storms of 2011 it preceded themwith the reclassification of areas in accord with the bacterial standards model of the National
Shellfish Sanitation Program The model allows designation without sampling based on dilution
calculations in areas where there is recreational or commercial activity
Technical Notes The middle chart above shows the area of Long Island Sound that had adequateoxygen levels throughout the year The sampling area (2700 square kilometers) does not includethe whole Sound (3400 square kilometers) The areas not sampled are shallow waters (less than
two meters deep) near shore which generally do not experience hypoxia embayments the east-
ern end of the Sound which is not expected to experience hypoxia and an area in the far west-ern end which probably becomes hypoxic in most years
Hypoxia was redefined by DEEP in 2011 Areas of the Sound are now considered hypoxic where aliter of water contains less than 30 mg of dissolved oxygen This is the criterion that was used
prior to 2004 From 2004 through 2010 DEEP used 35 mgl as the determining level
The threshold was returned to the 30 level in 2011 to be consistent with the definitions used byNew York and the Long Island Sound Study For this years report data for all previous years
were recalculated to show the area of the Sound having adequate oxygen under the current defi-nition (that is at least 30 mgl)
24
7312019 Environmental Quality in Connecticut 2011
httpslidepdfcomreaderfullenvironmental-quality-in-connecticut-2011 2748
Rivers and Reservoirs
No Swimming in the River
About 80 miles of rivers receive overflows of raw sewage during storms
Throughout the state only 11 of rivers and streams are classified as beingclean enough for swimming and other water contact sports
25
7312019 Environmental Quality in Connecticut 2011
httpslidepdfcomreaderfullenvironmental-quality-in-connecticut-2011 2848
Top Chart In fourteen Connecticut cities and towns sanitary sewers were built in combinationwith storm sewers During storms these systems carry more water than their treatment facilities
can handle and a combination of storm water and untreated sewage overflows directly into the
rivers and Long Island Sound Several of these combined sewer systems have been completely orpartly separated since 1990 reducing the impact of untreated sewage on rivers The improve-ment in 2001 can be attributed to the completion of projects in the towns of Waterbury and Nau-
gatuck In 2005 the Jewett City project was completed eliminating overflows of raw sewage into
the Quinebaug River
Connecticuts goal is to eliminate the effects of raw sewage discharges from combined sewer sys-tems Progress is slow because of the extraordinary expense of separating the sewers
The pie chart illustrates the percentage of the states rivers that fully support recreation This isan estimate based on sampling and statistical analysis by the Department of Energy
and Environmental Protection (DEEP) Most streams are not monitored directly The current figure
of 11 percent is from the Integrated Water Quality Report submitted by the DEEP to the federalgovernment on May 31 2011 The 2008 edition of that report estimated the percentage to be 15
Theres Water in the River
(Better 40 Years Late Than Never)
June 23 1970 ldquoThe Water Resources Commission with
the advice of the Board of Fisheries and Game should be
authorized to establish and regulate minimum stream
flowshellipFlows must be tailored to fit the hydrological and
ecological character of each stream as established by the
minimum demands of aquatic life Authority should include
the power to augment flow from storagehelliprdquo Governorrsquos Committee on Environmental Policy Recommendation 48
December 12 2011 The Department of Energy and Envi-
ronmental Protection obtains final approval for proposed
Stream Flow Standards and Regulations specific to the hy-
drological and ecological character of each stream and re-
quiring release from storage under certain conditions to
augment flow
26
7312019 Environmental Quality in Connecticut 2011
httpslidepdfcomreaderfullenvironmental-quality-in-connecticut-2011 2948
Rivers + Reservoirs
Bald Eagles
Bald eagles have come back to Connecticut even to cities The chemical pollu-tants that interfered with their reproduction have since been controlled and large
trees along fish-rich rivers offer good nesting sites
Bald eagles stopped breeding in Con-necticut in the 1950s The species de-
clined throughout the lower 48 states
and was declared endangered in 1967
A variety of environmental conditionsharmed the eagle including the wide-
spread use of certain chemicals
(chlorinated hydrocarbons) that accu-mulated in its prey (mostly fish) Whenthose chemicals were banned and pol-
luted waterways were improved thebald eagle was able to reproduce againYoung eagles were reintroduced into
nearby states in the 1980s and a pair
found their way to Connecticut in 1991and successfully raised a family in
1992 Many more pairs have since
found acceptable nesting habitat onland protected by government and pri-vate landowners including utility com-
panies DEEP monitors the eagles withthe assistance of the Bald Eagle StudyGroup and other volunteers
The federal government removed the bald eagle from its list of threatened and endangered spe-cies in 2007 In 2010 Connecticut changed the eagles in-state status from endangered tothreatened The Northern States Bald Eagle Recovery Plan established a goal for Connecticut of
20 breeding birds (10 nests) which was reached for the first time in 2005 The population of baldeagles is included as an indicator because the eagle is representative of species especially preda-tors that share similar habitat requirements large areas of relatively undisturbed land near riv-
ers or lakes where the birds can find adequate supplies of fish and other prey that are ndash very im-portantly ndash only minimally contaminated
27
7312019 Environmental Quality in Connecticut 2011
httpslidepdfcomreaderfullenvironmental-quality-in-connecticut-2011 3048
Rivers + Reservoirs
Drinking Water
Most water companies delivered water that met health standards in 2011
Every public water utility submits monthly quality reports to the Department of Public Health This
indicator shows the percentage of monthly reports that demonstrate full compliance after weight-
ing the reports to account for the number of people served by each utility Though long-termproblems occur they are rare in large systems with the exception of the downturn in 2005 and
2006 caused by a few short-term problems in larger systems This indicator would show greaterfluctuations if the larger systems failed to deliver good water The most commonly encountered
contaminants include bacteria and byproducts of disinfection with an assortment of other chemi-cals and radioactive substances
28
7312019 Environmental Quality in Connecticut 2011
httpslidepdfcomreaderfullenvironmental-quality-in-connecticut-2011 3148
Human Health
Breast Cancer in Connecticut
Connecticut has the highest incidence of breast cancer among the 50 states buthas seen improvement since a peak in the late 1990s
Of every 100000 women in the stateaged 50 to 54 a fair number will dis-
cover each year that they have breast
cancer That number is depicted in
this graph (The Council presents dataon this one age group rather than on
the entire female population to con-trol factors such as changes in the av-erage age of the larger population
age 50 to 54 was selected as a repre-
sentative age group and is used ineach yearrsquos report) To minimize year-
to-year fluctuations groups of years
are averaged together (In otherwords each data point on the graphshows the number of new cases in a
single year but that year is actually the average of five years) While some breast cancers arelinked to genetic factors most are associated with non-genetic factors including diet reproductivehistory lifestyle and external agents
Breast Cancer as an Environmental Indicator
There are numerous studies connecting certain chemicals and other environmental factors tobreast cancer These factors if significant do not appear to be as important statistically as a
womans own reproductive history but it is important to note that breast cancer rates vary great-
ly in different parts of the country Among the 50 states Connecticut has the highest incidence of breast cancer this assessment is based on average incidence rates from 2004 through 2008 thelatest years for which 50-state data are available (Source North American Association of Central
Cancer Registries as reported by the American Cancer Society)
The rate of new cases showed improvement in 2000 through 2004 (using the average of the five
years) and has held steady for the period of 2005 through 2009 (the most recent years for whichConnecticut data are available)
29
7312019 Environmental Quality in Connecticut 2011
httpslidepdfcomreaderfullenvironmental-quality-in-connecticut-2011 3248
Human Health
Non-Hodgkins Lymphoma
The reasons for the steep increase in this cancer during the 20th century are notwell understood but exposures to specific pollutants and chemicals are potential
factors Since 1999 the picture has improved
Non-Hodgkins lymphoma is a cancer of the lymphatic system It begins in the lymphoid tissue
which contains lymphocytes white blood cells that help the body fight infections Lymphocytestravel throughout the body and can carry abnormal lymphocytes spreading the cancer The data
for this indicator are from the Department of Public Healthrsquos Tumor Registry which records all
known cancer cases in the state (Please see the note on the previous page under Breast Cancerin Connecticut about the use of the 50 to 54 age group) Non-Hodgkinrsquos lymphoma has increasedmarkedly since recordkeeping began The reasons are not well understood though the rise of Ac-quired Immune Deficiency Syndrome (AIDS) since the 1980s accounts for some cases Several
studies also cite environmental factors including exposure to diesel exhaust and cer-tain fertilizers pesticides and chemicals In 2000 through 2004 and again in 2005 through 2009
(the most recent years for which data are available) the annual rate of new cases showed im-provement
30
7312019 Environmental Quality in Connecticut 2011
httpslidepdfcomreaderfullenvironmental-quality-in-connecticut-2011 3348
Personal Impact
Driving Our Cars
Nearly every year for 25 years the average Connecticut resident drove moremiles than he or she did in the previous year That trend shifted into reverse in
2008
Driving a car truck or sport utility vehicle is one of the most environmentally harmful activities a
Connecticut resident will engage in personally Impacts are direct (air pollution oil leakage etc)
and indirect (causing demand for new roads) The Department of Transportation estimates thetotal miles driven each year in Connecticut Every year from 2000 through 2007 the averageConnecticut resident drove more miles than in previous years The reasons for the decades of in-
creasing auto use are complex and include the fact that most new development was accessibleonly by private vehicle A decline in miles driven began in 2008 and has continued to 2010 (thelatest year for which data are available) The Connecticut trend lags slightly the national trend
of auto use which showed a dramatic drop in 2007 The national trend towards less driving is be-ing led by the 16 to 34 year-old segment of the population
Personal Impact indicators illustrate trends in behavior or practices that can be expected to influence the condition of tomorrowrsquosair water land and wildlife
31
7312019 Environmental Quality in Connecticut 2011
httpslidepdfcomreaderfullenvironmental-quality-in-connecticut-2011 3448
Personal Impact
Taking the Bus
The average Connecticut resident took the bus slightly more often in 2011
The number of local and commuter bus trips taken by the average resident has changed very li t-
tle over the last 20 years Riding a bus is just one way to avoid the negative environmental con-sequences of driving a car Ridership data are collected by the Department of Transportation Ri-
dership rose about 6 percent in 2006 perhaps in response to high gasoline prices Since thenthere have been slight fluctuations In 2011 per capita ridership was the highest since 2001
Personal impact indicators illustrate trends in behavior or practices that can be expected to influence the condition of tomorrowrsquos air water land and wildlife
32
7312019 Environmental Quality in Connecticut 2011
httpslidepdfcomreaderfullenvironmental-quality-in-connecticut-2011 3548
Personal Impact
Compliance
Compliance with environmental regulations declined for the third year in a row
33
7312019 Environmental Quality in Connecticut 2011
httpslidepdfcomreaderfullenvironmental-quality-in-connecticut-2011 3648
Who is breaking Connecticuts environmental laws To find out the Council classified all 944 No-tices of Violation (NOVs) issued by DEEP during fiscal year 2011 The conclusions are summa-
rized in a staff memo and the types of violators are characterized in a series of charts The Coun-
cil does not have data on the publicrsquos perceptions of who the violators are but it senses from eve-ryday conversations that people suppose them to be factories utilities waste disposal facilitiesand perhaps pesticide applicators -- a perception that does not match the data The vast majority
of businesses where violations were found were small companies and most violations were re-
lated to the storage transport or distribution of petroleum The largest group by far were gasstations and convenience stores Only seven percent of NOVs were issued to manufacturers withmore than 20 employees -- fewer than the number that went to individual citizens
This indicator shows the approximate percentage of inspections performed by DEEP that foundthe inspected facilities in full compliance with pertinent environmental laws and regulations
(Monitoring data self-reported by permit holders are not included here) In 2010 and 2011 DEEPstepped up enforcement activity in its underground (petroleum) storage tank program and issuedmany more Notices of Violation (NOVs) than in previous years
The overall compliance rate rarely has been better than 90 percent Generally compliance withair quality regulations is higher than with waste and water regulations The average compliance
rate for all programs declined from 90 percent in 2008 to 89 percent in 2009 86 percent in 2010
and 83 percent in 2011 (The sharp downturn of 2002 was due to a surge in NOVs in a single airprogram Stage II Vapor Recovery at gas stations)
The number of inspections (not shown) declined between 1997 and 2007 increased in 2008 anddeclined again in 2009 through 2011 to its lowest number in 15 years Any relationship betweenthe number of inspections and rate of compliance is uncertain The relative stability of the com-
pliance rate in the face of ever-diminishing staff resources might be regarded as a success for the
DEEP However the failure of the state-- government businesses and residents together -- toadvance affirmatively toward the goal of full compliance is apparent
Personal Impact indicators illustrate trends in behavior or practices that can be expected to influence the condition of tomorrowrsquosair water land and wildlife
Notices of Violation (NOVs) are informal enforcement tools generally issued whenever DEEP detects one or more violations at a
facility They carry no financial penalty The recipient has 30 days to respond They can be issued for relatively minor or majorviolations in cases of the latter type the recipient might also receive an order which might carry a financial penalty NOVs typi-cally outnumber orders by a factor of five or more in any year NOVs are good indicators of trends in violations because almost allviolations found through inspections result in NOVs
Some inspections of compliance with air quality regulations are conducted by the Department of Consumer Protection pursuantto an agreement with DEEP these inspections also are used in calculating compliance rates
34
7312019 Environmental Quality in Connecticut 2011
httpslidepdfcomreaderfullenvironmental-quality-in-connecticut-2011 3748
Personal Impact
Recycling
Some municipalities and regional waste authorities have reported greater partici-pation in recycling programs since adopting single-stream recycling However
notable progress towards the statewide goal remains elusive
The General Assembly es-
tablished a goal of reduc-ing and recycling 40 per-cent of Connecticuts mu-
nicipal solid waste streamby the year 2000 (Sec22a-220(f)) That
goal was never met and
the consequences havebeen enormous Hundredsof thousands of tons of
waste were shipped out
of Connecticut in manyyears putting thousands of diesel trucks on the high-
ways for trips of many
hundred miles One conse-quence of this needless
truck traffic is the yearly
addition of 300000 ormore pounds of diesel pol-lutants into the air Anoth-
er consequence is finan-cial one ton that is re-cycled instead of burned or
landfilled can save a municipality hauler or resident from $40 to $93 according to a 2010 report of the Legislative Program Review and Investigations Committee
As total tonnage of waste has grown the percent that is recycled has not In 2006 DEEP amendedthe State Solid Waste Management Plan to include a goal of diverting 58 percent of Connecticutrsquosmunicipal solid waste stream from disposal by 2024 This would be accomplished through recy-
cling composting and waste reduction (such as use of lighter packaging material) If this goal ismet Connecticut will be able to manage all of its garbage without exporting it
DEEP reports suggest that the official figures slightly underestimate actual recycling volume Thegap in the graph reflects a lack of available data is for the years between 2004 and 2008
35
7312019 Environmental Quality in Connecticut 2011
httpslidepdfcomreaderfullenvironmental-quality-in-connecticut-2011 3848
Personal Impact
Climate Changers
The average resident is causing less carbon dioxide to be put onto the atmos-phere a result of lower petroleum consumption
Certain gases in the air func-
tion like the glass of a green-
house they allow the sunsenergy to pass through the
atmosphere to the ground
then trap the heat that ra-diates from the ground Thesegases are often called green-
house gases Worldwide a
build-up of greenhouse gases is contributing to the ongoing
rise in temperature Carbon
dioxide is not the only green-house gas nor even the mostpowerful but carbon dioxide
emissions are far greater in
quantity than the othersThe chart shows the total
emissions of carbon dioxide
emitted from burning of petroleum natural gas and coal in Connecticut divided by the population
A 2008 state law set two goals for reducing greenhouse gas emissions reduce statewide emis-sions to 10 percent below 1990 levels by 2020 and 80 percent below 2001 levels by 2050The chart above shows emissions per Connecticut resident not total emissions and there-
fore displays the goals after adjusting them to account for the larger population that is pro-
jected for 2020 and 2050 There are expected to be hundreds of thousands more people living inConnecticut in 2020 and 2050 so the average resident will have to work that much harder to re-duce carbon dioxide emissions if the statewide goal is to be met
Most human-generated carbon dioxide results from the combustion of fuels in houses businesses
power plants and vehicles and the last of these is the largest source Connecticut is more ener-
gy-efficient than the nation as a whole and the average Connecticut residents contribution toglobal climate change is less than the average Americans
Technical Note The Council has changed the data source for this indicator In previous years da-ta was available for all greenhouse gases not just carbon dioxide However to bring the chartmore up to date the Council switched to a source that includes carbon dioxide only Because the
other gases are emitted in small quantities the carbon dioxide data by themselves give an accu-rate picture of trends in greenhouse gas emissions The most recent data available even for car-bon dioxide alone are from 2009
36
7312019 Environmental Quality in Connecticut 2011
httpslidepdfcomreaderfullenvironmental-quality-in-connecticut-2011 3948
Personal Impact
Electricity at Home and Work
At Home
The average Connecticut resident used slightly less electricity at home in 2011
Thousands of households have been signing up annually to buy electricity gener-ated by renewable energy sources through the CTCleanEnergyOptions program
37
7312019 Environmental Quality in Connecticut 2011
httpslidepdfcomreaderfullenvironmental-quality-in-connecticut-2011 4048
Through 2009 the majority of Connecticut households did not purchase the mostefficient refrigerators or air conditioners This trend probably has not changedbut more recent data are not available and this indicator will be discontinued
At Work
For three years in a row Connecticut businesses have used electricity more effi-ciently to produce goods and services
38
7312019 Environmental Quality in Connecticut 2011
httpslidepdfcomreaderfullenvironmental-quality-in-connecticut-2011 4148
Efficiency at Home The average Connecticut household has been consuming less electricity since the peak
usage year of 2007 despite a brief reversal in 2010 According to the Connecticut Siting Council peak de-mand occurs during hot humid summer days due to air conditioner demand The increase in summertimeconsumption has had significant environmental consequences On the hottest days Connecticutrsquos base-loadpower plants are unable to meet the additional demand and older petroleum-fueled plants are brought online Because they are used sporadically many of these older plants are permitted to operate with no pollu-tion control equipment As a result state residents generate the most air pollution on the hottest summerdays when air quality is already bad
The vast majority of Connecticutrsquos electricity is generated from nuclear energy and the combustion of naturalgas oil and coal Hydropower solar and other renewable resources are small but growing sources of elec-tricity Each source renewable or not has its own negative environmental consequences Reducing thoseconsequences will require Connecticut households to use electricity much more efficiently Such efficiencycan be attained in part with ENERGY STAR appliances
Efficiency in the Kitchen In a typical home the refrigerator consumes more electricity than any otherappliance (Central air conditioning uses more but is not in everyonersquos home) To be labeled ENERGY STAR efficient a full-size refrigerator must operate using at least 20 percent less energy than the federal stan-dards for household appliances
ENERGY STAR appliance sales figures had been collected from voluntary reports by retailers to the ENERGY
STAR program Data on sales by state are no longer available For Connecticut 2009 data are the most re-cent available In 2009 38 percent of refrigerators bought by Connecticut consumers were ENERGY STARefficient a decrease from its peak (44 percent) in 2005 Sales trends for ENERGY STAR air conditioners al-so dropped in 2009 to 42 percent from 44 percent in 2008 Public surveys have shown conclusively thatmost people are aware of the ENERGY STAR label and what it means so reasons other than awareness mustbe addressed to boost ENERGY STAR labeled product sales and stem the ongoing waste of electricity inhomes
The ENERGY STAR program was created in 1992 as a joint effort of the US Environmental Protection Agen-cy and the US Department of Energy to identify and label energy efficient products By consuming lesselectricity ENERGY STAR products help to reduce air pollution and greenhouse gas emissions
The Connecticut Energy Efficiency Fund has partnered with Top Ten USA to help consumers find the mostenergy efficient appliances
Buying Cleaner Energy The CTCleanEnergyOptions program enables customers to sign up to pur-
chase electricity from renewable sources that include wind and low-impact hydroelectric (water power) Par-ticipation has grown steadily though the rate of increased participation is slowing There were 7 per-cent more participants in the program in 2011 than in 2010 The electricity that actually enters these housesis not necessarily from renewable sources The consumer who elects this option is paying for the generationof renewable electricity on the regional electric grid This reduces the amount of electricity that otherwisewould be generated by nuclear coal oil and natural gas-fired generating plants all of which create pollutionCTCleanEnergyOptions is a collaborative program administered by the Clean Energy Finance and InvestmentAuthority
Efficiency at work The bottom graph shows trends in the efficiency with which Connecticutrsquos economyuses electricity to produce goods and services Connecticuts businesses generally have been producing more
goods and services with less electricity State Gross Domestic Product (GDP) represents the total value of goods and services produced within the state in a single year Payment to employees constitutes about 60percent of the GDP In 2010 (the most recent data available) the Bureau of Economic Analysis put Connect-icuts GDP at $237 billion (current dollars) From 2009 to 2010 the GDP grew twice as fast as electricity con-sumption by Connecticuts industrial and commercial sectors Preliminary data for 2011 suggest that therewas no change in efficiency The long-term positive trend demonstrates that with advances in energy effi-cient technology it is possible for Connecticutrsquos economy to continue growing while using electricity moreefficiently
39
7312019 Environmental Quality in Connecticut 2011
httpslidepdfcomreaderfullenvironmental-quality-in-connecticut-2011 4248
Activities of the CEQ in 2011
June saw the 40th anniversary of the legislation that created the Council on Environmen-
tal Quality (CEQ) The Councils first meeting was held in the fall of 1971 Previous re-
ports looked back at some of those early events In the more recent past the Coun-
cils 41st year was one of its busiest and most productive
Research and Reports
The Council published Environmental Quality in Connecticut in April 2011 identifying
Routes to Progress that would move some of Connecticuts environmental indicators in
a positive direction
The Council is required to recommend legislation for identifying the deficiencies of exist-
ing programs and activities The Council published those in January 2012
From time to time the Council asks staff to prepare updates to previous reports Exam-
ples from 2011 include a staff memo on environmental regulation and the growth of
small businesses and a memo on the benefits to Connecticut of a new federal initiative to
reduce mercury pollution
Review of State Projects and Programs
In December 2010 the Council received complaints and inquiries about a state grant fora boat launch facility that was awarded without the environmental review and public no-
tice required by the Connecticut Environmental Policy Act (CEPA) After review the
Council advised the Commissioner of Energy and Environmental Protection of the appli-
cability of CEPA Ultimately the Department of Energy and Environmental Protection
(DEEP) declined to conduct an evaluation The Councils conclusion is summarized in a
2011 letter to one of the citizens who contacted the Council
Council research in 2010 found that one of the most polluting power plants in the state is
located in Hartford and is generally only used on the hottest days of the year when air
quality is already at its worst In December 2011 DEEP published notice of its intent torenew the air pollution permit for the plant Seeing several problems in the draft permit
as well as opportunities to improve and perhaps phase out use of the plant the Council
submitted detailed comments As of press time the permit renewal is still pending
40
7312019 Environmental Quality in Connecticut 2011
httpslidepdfcomreaderfullenvironmental-quality-in-connecticut-2011 4348
The Council continued to improve the Environmental Monitor to accommodate changes in
CEPA most recently to add public notices in cases where agencies decide not to com-
plete an environmental impact evaluation after it has conducted a public scoping
process
Citizen Complaints
As noted in reports of the past two years citizens of Haddam have spoken repeatedly to
the Council about contamination of land and groundwater that has existed in their com-
munity for more than 25 years Among many issues the apparent lack of remedial ac-
tion by one company was of particular note as the company had been required by the
DEEP to investigate the contamination and prepare a clean-up plan The Council decided
to follow this case in detail in order to learn more about the adequacy of existing laws
and programs In April 2010 the Council wrote to DEEP recommending enforcement ac-
tion against the company in question DEEP began legal action against the company in
late 2010 As of May 2012 there has been some study by the landowner as well as addi-
tional legal and bureaucratic action but to date no remediation
Along with many other parties the Council participated throughout 2011 in DEEPs ongo-
ing effort to transform remediation laws and programs The Councils close attention to
the Haddam case has yielded several insights into problems that need to be fixed
Aside from remediation the following are a sample of the many other complaints inves-
tigated in 2011
Dumping on a state university campus
Lack of notice of pesticide spraying on a railroad right-of-way as railroads are ex-
empt from the law governing notification of abutting homeowners
Pesticides and other contaminants in the wells of many homes in one neighbor-
hood
Apparent misinformation in an application for a proposed large drinking water
well with no effective consequences for providing wrong or misleading informa-
tion
Several matters relating to the siting of telecommunications towers including the
need to consider their effect on bird migration corridors preserved natural
areas and coastal areas
Pollution from outdoor wood furnaces both legal and illegal
The Council researched all of the complaints it received and offered recommendations to
the relevant state agencies where warranted Some problems such as illegal tree re-
moval on private property will require legislative action to correct
41
7312019 Environmental Quality in Connecticut 2011
httpslidepdfcomreaderfullenvironmental-quality-in-connecticut-2011 4448
The Word from Mansfield
The Council periodically holds public forums in different parts of the state to learn what
environmental topics are most on residentsrsquo minds The information presented at these
forums has been extremely useful to the Council
In July 2011 the Council heard from many citizens and municipal officials in Mans-
field They spoke about numerous environmental problems many involving the ac-
tions and responsibilities of state agencies Others suggested interesting directions for
the future of the state and its environment The Council investigated all of them and re-
sponded to each speaker Many investigations led to actions by state agencies andor
recommendations for legislation Read a complete summary of the speakers and the is-
sues they raised
Advice From the Public
In November of 2011 the Council released its required recommendations for corrective
legislation in draft form and invited the public to weigh in Citizens and organizations
spoke to the Council at a public forum held in the Legislative Office Building in Hartford
and many others submitted written comments Read a complete summary Their in-
sights technical advice and opinions proved a big help to the Council in preparing its fi-
nal recommendations which were submitted to Governor Dannel P Malloy and the Gen-
eral Assembly in January 2012
___________
In addition to the dozens who spoke at the public forums the Council heard from organi-zations at regular monthly meetings These included DEEP the University of ConnecticutNorth Stamford Concerned Citizens for the Environment Citizens for Clean GroundwaterRivers Alliance of Connecticut Sierra Club and others
Many people across the state expressed their concerns during 2011 The Council workedto address them all and truly appreciates the efforts people made to bring environmen-tal problems to light The Council looks forward to helping citizens and agenciessolve the challenges of 2012 and beyond
42
7312019 Environmental Quality in Connecticut 2011
httpslidepdfcomreaderfullenvironmental-quality-in-connecticut-2011 4548
The release of this edition of Environmental Quality in Connecticut marks 41 years of CEQ service
Council Duties
The duties of the Council on Environmental Quality are described in Sections 22a-11through 22a-13 of the Connecticut General Statutes
The Council is a nine-member board that works independently of the Department of Energy and Environmental Protection (except for administrative functions) The Chair-man and four other members are appointed by the Governor two members by the Pres-ident Pro Tempore of the Senate and two by the Speaker of the House The Councilrsquosprimary responsibilities include
1 Submittal to the Governor of an annual report on the status of Connecticutrsquos env i-ronment including progress toward goals of the statewide environmental planwith recommendations for remedying deficiencies of state programs
2 Review of state agenciesrsquo construction projects3 Investigation of citizensrsquo complaints and allegations of violations of environmental
laws
In addition under the Connecticut Environmental Policy Act (CEPA) and its attendantregulations the Council on Environmental Quality reviews Environmental Impact Evalua-tions that state agencies develop for major projects The Council publishes the Environ-mental Monitor the official publication for scoping notices and environmental impactevaluations for state projects under CEPA The Environmental Monitor also is the officialpublication for notice of intent by state agencies to sell or transfer state lands
43
7312019 Environmental Quality in Connecticut 2011
httpslidepdfcomreaderfullenvironmental-quality-in-connecticut-2011 4648
CEQ Members
Barbara C Wagner (Chair)Resident of Glastonbury Attorney with law office in Glastonbury specializing in commer-cial and residential real estate Executive Director Wind Hill Community Farm Glaston-bury Member Glastonbury Town Council 2000-2010 Co-Founder and Board Member of
Town Center Initiative addressing walkability issues in Glastonburyrsquos center Board of Trustees Diamond Lake Land Trust Former member State Open Space and WatershedLand Acquisition Board
M Howard BeachResident of Simsbury Conservation amp Zoning Compliance Officer Planning AnalystTown of Simsbury Member Simsbury Conservation Inland Wetlands Commission from1980 to 2004 Chairman from 1994 to 2004 Member Board of Directors The Farming-ton River Watershed Association 2004 to 2006 Life Member and past Board MemberSimsbury Land Conservation Trust Founding Member Farmington Valley BiodiversityProject Member Town of Simsbury Open Space Committee 1999 to 2004 Member CTDevelopers Council Member Government Affairs Committee Simsbury Chamber of
Commerce In 2004 completed a Masters Degree in Environmental Law at Vermont LawSchool
Janet P BrooksResident of Middletown Attorney with law office in East Berlin with a practice in envi-ronmental administrative and land use law Member of the Connecticut Bar AssociationPlanning amp Zoning Section and Environment Section Co-author of Connecticut Environ-mental Protection Act Volume 15 of the Connecticut Practice Series published by Thom-son West Formerly Assistant Attorney General in the Environment Department of theConnecticut Attorney Generalrsquos (AGs) Office for 18 years enforcing the statersquos environ-mental laws running the gamut from noise odor water pollution air pollution pesticides
to habitat protection and preservation of land While at the AGrsquos Office coordinated thewetlands appeal practice and developed the legal training for wetlands commissioners forDEEPrsquos annual training Recipient of 1984 German Marshall Fund grant to study the ef-fect of citizen participation on hazardous waste clean-ups in four European countriesBased on those experiences authored a chapter published in Americarsquos Future in Toxic Waste Management Lessons from Europe Staff Attorney for five years at the Connecti-cut Fund for the Environment Inc representing citizens groups in administrative andcourt proceedings Began practice of law assisting the Middletown City Attorney in thecityrsquos opposition to the utility companyrsquos burning of PCB waste oil with in the city bounda-ries
Liz ClarkResident of West Hartford
44
7312019 Environmental Quality in Connecticut 2011
httpslidepdfcomreaderfullenvironmental-quality-in-connecticut-2011 4748
Bruce R FernandezResident of Farmington Retired after 18 years owning and managing a software busi-ness serving insurance companies and independent agencies Prior to that was a con-sulting engineer specializing in energy efficient power plants and paper mills Vice-President of Operations of a small utility serving Bronxville NY and a jet engine de-signtest engineer Masters degrees in Engineering and Management Served in UnitedStates Army Corps of Engineers as small unit commander served in Vietnam and tenyears in Army Reserves Member Board of Directors Farmington Land Trust
Karyl Lee Hall Resident of Branford Attorney with the Connecticut Legal Rights Project Formerly withMurtha Cullina the Connecticut Fund for the Environment and Connecticut Legal Servic-es Co-Chair Branford Conservation Commission Co-chair Scenic Roads AdvisoryCommittee for Routes 146 and 77 Member Advisory Board Branford Land Trust Vice
President Citizens for Branfordrsquos Environment 2002-2009 Connecticut Bar AssociationPro Bono Service Award 2003 Former Co-chair State Implementation Plan [for AirManagement] Revision Advisory Committee
Richard Sherman Resident of Chaplin Architectural designer and construction manager of earth shelteredpassive solar and energy efficient residences Former CEQ Representative to the Route 6Advisory Committee (during previous term on CEQ) Charter Member Transit Alliance of Eastern CT and Citizens for a Sensible Six Former Organizer the Progress and EquityPartnership Member of CEPA Working Group League of Conservation Voters of CTFormer President Northeast Chapter of ACLU-CT Board of Directors Member of PeoplesAction for Clean Energy (PACE) and Northeast Sustainable Energy Association (NESEA)Former Chair Mansfield Transportation Advisory Committee Former President Mans-field Commonground Member Mansfield Planning and Zoning Design Review PanelFormer Chair Mansfield Democratic Town Committee Host and producer of the radio
show A Distant Shore on WHUS (917 FM Storrs) Former Public Affairs Director of WHUS Stopover host American Tour dSol solar electric car race
Norman VanCor(member through April 2012)Resident of Harwinton Owner of Buy Safe Home Inspection LLC and Mizzentop Antiqui-ties Served in United States Marine Corp in Vietnam Awarded the Navy Cross Vietnam-ese Cross of Gallantry and other decorations One of first ten inductees to CT VeteransHall of Fame Former Director Yankee Energy in sales marketing government relationscommunications Founding member and President Emeritus Quinnipiac River WatershedAssociation Former member Rivers Advisory Committee Former Chairman SouthingtonConservation Commission Former host of radio program on environmental topics For-
mer President Southington Water Works Former member Board of Directors of Opera-tion Fuel Active Pheresis donor at American Red Cross with over 37 gallons of wholeblood and platelet donations Former Volunteer Hunter Safety Instructor for the DEEPConservation Education Program Certified Master Gardener
45
7312019 Environmental Quality in Connecticut 2011
httpslidepdfcomreaderfullenvironmental-quality-in-connecticut-2011 4848
Acknowledgments
The Council appreciates the assistance of the many people in the Departments of Agri-culture Energy and Environmental Protection Transportation and Public Health and theConnecticut Siting Council who provided data Researchers at the Center for LanduseEducation and Research (CLEAR) at the University of Connecticut provided very valuable
data
The Council especially thanks the many citizens businesses and organizations who of-fered information and viewpoints to the Council throughout the year
The Council also appreciates the work of its Executive Director Karl Wagener and Envi-ronmental Analyst Peter Hearn in drafting this report for review by the Council and pre-paring the final version for publication
The Council notes the valuable contributions of Eric Walsh an intern from the Universityof Connecticut Law School and Avery Yoshimine an intern from the University of Con-necticut their research contributed greatly to this report
Contact the CEQ
We would like to hear from you Does this report give you the information on Connecticuts environment that you need Is
there something missing
79 Elm Street
Hartford CT 06106
Phone
860-424-4000
(messages can be left 24 hours a day)
Fax
860-424-4070
karlwagenerctgov

7312019 Environmental Quality in Connecticut 2011
httpslidepdfcomreaderfullenvironmental-quality-in-connecticut-2011 248
STATE OF CONNECTICUT
COUNCIL ON ENVIRONMENTAL QUALITY
Barbara C Wagner
Chair
M Howard Beach
Janet P Brooks
Liz Clark
Bruce R Fernandez
Karyl Lee Hall
Richard Sherman
Karl J Wagener
Executive Director
June 6 2012
The Honorable Dannel P MalloyGovernor of ConnecticutState Capitol
Hartford CT 06106
Dear Governor Malloy
I am pleased to submit the official report on the condition of Connecticutrsquos envi-
ronment for 2011
As you know the core of the report is a standardized set of environmental indica-
tors by which we measure Connecticuts progress At first glance the statistics for2011 look typical of recent years In the reports introduction the Council takes a
closer look at some of the more revealing indicators
The destructive storms of 2011 had the effect of bringing to light some previouslyobscure environmental data We learned that in nearly three-quarters of Connecti-cut homes mingle extensively with wild natural lands -- a greater portion than any
other state We also learned that residents take full advantage of their proximity tonature by watching wildlife around the home and conserving habitat much morethan the average American and spend an unusually large sum of money doing so
So were suggesting that Connecticut might want to claim the title of the 1 Nature
State
The states pattern of land development present and future will dictate the envi-
ronmental policies essential to long-term improvement in the quality of Connecti-cuts air water and life These conclusions are discussed in Connecticut The Stateof Nature
Activities of the Council summarizes last years investigations and notes that June2011 marked the 40th anniversary of the law that established the CEQ
Later in the year the Council will submit Part II which will include recommenda-tions for improving the statersquos environment based on the data in front of you
As always the Council looks forward to providing you with any additional informa-
tion or assistance that you might request
Respectfully
Barbara C WagnerChair
79 Elm Street Hartford CT 06106
Phone (860) 424-4000 Fax (860) 424-4070
httpwwwctgovceq
7312019 Environmental Quality in Connecticut 2011
httpslidepdfcomreaderfullenvironmental-quality-in-connecticut-2011 348
Bottom Line
A very brief summary of 2011
Improved or Held Steady at a Positive Level in 2011
Drinking Water Quality Bald Eagles amp Piping PloversInland Wetlands Good Air Days Farmland Conservation
What these improvements have in common They are the results of effective regulatory programsand modest public capital investments
Declined or Held Steady at a Level Insufficient to Meet Goals
Beach ClosingsOxygen Levels in Long Island Sound
Pollution in Long Island Sound
Lobsters and Clean Shellfish Beds
Average Level of Air Pollution Conservation of Forest Land (based on incomplete data)
What these deficiencies have in common Most will require substantial public capital investment
or in some cases improved strategies before goals can be met
Trends in Personal Impact Indicators
Connecticut residents used electricity more efficiently at work
Recycling rates remain below targets
Residents took the bus more often and drove lessCompliance rates were down
Data for several environmental indica-
tors were unavailable for 2011 for rea-sons that varied from staff shortages atDEEP to the absence of data collection
systems Nobody knows for examplehow much land in Connecticut was pre-
served last year nor does anyone
know how much has been permanently
protected to date because there is nosystem to collect such data
1
7312019 Environmental Quality in Connecticut 2011
httpslidepdfcomreaderfullenvironmental-quality-in-connecticut-2011 448
Introduction
Connecticuts environmental statistics for 2011 look typical of recent years they portraya static state with slow or no progress on some of the biggest challenges peppered withsmall improvements and minor retreats
Thats at first glance A closer look reveals many more facts some of which were illumi-nated dramatically by Tropical Storm Irene and the October 29 snowstorm
Here are the first glances and the closer looks
AIR
First Glance Slightly fewer bad days but more pollution on the average day
Closer Look Air quality in some towns after the October storm was atrocious appar-
ently because of emissions from generators wood stoves and fireplaces Northern Con-necticut probably saw particle levels over twice the standard that protects human health-- a sample of what Connecticut residents would breathe all the time if it were not for
the successful air pollution controls that have been put in place on most sectors of theeconomy
CLEAN RIVERS AND STREAMS
First Glance No change in six years
Closer Look Steady investment in upgrading cities sewerage continues but it mightnever result in rivers that are truly free of raw sewage after rainstorms We might needa new indicator to measure subtle progress Meanwhile runoff from developed areasremains the largest impediment to clean waterways Control of polluted runoff fromstreets parking lots and lawns is the next challenge if the goal of clean water is to beachieved
2
7312019 Environmental Quality in Connecticut 2011
httpslidepdfcomreaderfullenvironmental-quality-in-connecticut-2011 548
LIFE IN THE SOUND
First Glance Lobsters shellfish beds beaches pollution and oxygen all worse in 2011
Closer look This satellite view of the Connecticut River emptying uncountable tons of sediment into Long Island Sound nearly a week after Tropical Storm Irene receivedwidespread publication It is a powerful reminder that beaches oyster beds and the openwater are affected greatly by the pollution that washes off the surface of Connecticut af-ter every rain
FARM FOREST WETLAND
First Glance A good year for farmland conservation not for other lands
Closer Look Connecticut still does not know how close it is to its goal of conserving 21percent of the states land area (Public Act 12-152 could eventually lead to an accurateinventory of preserved lands)
PERSONAL IMPACT INDICATORS
Driving Our Cars
First Glance People are driving less
Closer Look Connecticut might be in the early stages of an unprecedented shift towardless driving if state and national data continue along current trends Until 2007 the av-erage resident drove more miles every year than in the previous year Some reduction indriving is attributed to economic factors but recent research has found that demograph-ic factors are playing a role
3
7312019 Environmental Quality in Connecticut 2011
httpslidepdfcomreaderfullenvironmental-quality-in-connecticut-2011 648
Compliance
First Glance Down
Closer Look About 1000 violations of Connecticutrsquos environmental laws are de-tected each year Who are the culprits The Council classified all 944 Notices of Violation(NOV) issued by the Department of Energy and Environmental Protection (DEEP) in the2011 fiscal year and found that the majority of NOVs issued to businesses were relatedto the storage distribution and use of petroleum especially gasoline Gas stations andconvenience stores received the largest number of NOVs Some classes of NOV recipientsmight surprise the readers medical offices and landscaping companies receivedmany Only 7 percent of NOVs went to manufacturers with more than 20 employeeswhich is smaller than the number issued to homeowners and other individuals
The indicators in this report provide many additional insights into the progress that Con-necticut residents have made and the challenges they confront Additional and previouslyobscure data about Connecticuts environment were brought to the fore by the storms of
2011 In fact Connecticut might well be able to claim the title The Nature State Readmore
______________________
Notes for This Edition
Regular readers of this report know that its core elements are the 31 indicators that describeConnecticuts environment objectively and reliably One indicator will probably be discontinuedafter this year retail sales data for ENERGY STAR appliances are no longer available state-by-state The most recent data are from 2009
The Council makes improvements to this report every year and many of them havebeen suggested by readers The Council greatly appreciates their advice Additional changes pro-posed by readers are in the works
4
7312019 Environmental Quality in Connecticut 2011
httpslidepdfcomreaderfullenvironmental-quality-in-connecticut-2011 748
Arrowheads Explained
Above each environmental indicator on the pages that follow readers will find an arrowhead that
illustrates improvement (arrowhead up) or decline (arrowhead down) in environmental conditions
There are four variations of the arrow symbols
The data show a positive change from theprevious year The one-year change is not
always consistent with the long-term trendwhich is displayed on the chart
The data show a negative change from the
previous year The one-year change is notalways consistent with the long-term trend
which is displayed on the chart
No arrow means the data for the latest
year available show a very small changepositive or negative from the previous
year If the color is green the indicator is
unchanged at a satisfactory level if red
unsatisfactory If the color is orangethe lack of change is neither good nor bad
Connecticut is not on track to meet its
long-term goal This symbol is used for
those indicators that except in the most
unusual circumstances always will show
some progress (ldquoPreserved Landrdquo is one
example) It would be misleading to label
the one-year change as ldquoimprovedrdquo if the
progress is not sufficient to get the state to
its goal by the established target date
5
7312019 Environmental Quality in Connecticut 2011
httpslidepdfcomreaderfullenvironmental-quality-in-connecticut-2011 848
Connecticut The State of Nature
The storms of 2011 brought to light some previously obscure data that say a lot aboutConnecticut
Example Connecticut is number one in WUI or Wildland-Urban Interface a measure of the proximity of peoples homes to forests wetlands and grasslands Seventy-two per-cent of Connecticuts land area can be classified as WUI a percentage matched by noother state The WUI scale has traditionally been used to measure communities suscep-tibility to forest fires but it also helps to explain such things as the vastness of poweroutages caused by storms
Whether Connecticuts extraordinary WUI classification is due more to effective conser-vation of green spaces in many communities or to past futility in minimizing sprawl is notthe critical point More important are the permanent quality of the developments now in
place the benefits and costs of residents proximity to nature the demographic and eco-nomic trends that will determine future development patterns and pursuing policies thatwill prepare Connecticut against potential degradation
Outside the central cities Connecticut residents live among trees and appear to embracesuch a lifestyle On the average plot of ground in Connecticut more people -- residentsand non-residents together -- are watching wildlife than in nearly any other state Thismakes sense as there is much to watch only in two other states might a birdwatcherfind more species of birds per square mile
Looking at the data even more closely Connecticut residents appear to be almost uniquein their affinity with nearby wild things A greater percentage participate in wildlife-associated recreation than the national average and among those participants residentsof no other state can challenge Connecticut residents preference for watching their wild-life around the home Connecticut is one of only five states where people spend more to
watch wildlife (primarily on equipment purchases) than they spend to hunt and fish (in-cluding license fees) and by a ratio that is unmatched (In the federal data watchingwildlife includes maintaining wildlife habitat)
Residents high rate of participation in outdoor activities and conservation activities is agreat positive on its own but it should be noted that it also yields a significant econom-ic profit to the state A University of Connecticut study released in December of 2011 es-timated that 9000 jobs $1 billion of economic activity and $30 million of net state reve-nue can be attributed to outdoor activities just in state parks and forests Any study thatalso accounted for the economic activity generated by birdwatching hiking and horse-back-riding statewide would show much larger numbers Six years ago the amountspent on hunting fishing and watching wildlife in the state was estimated to be near-
ly $1 billion
6
7312019 Environmental Quality in Connecticut 2011
httpslidepdfcomreaderfullenvironmental-quality-in-connecticut-2011 948
Life among the trees also carries economic costs and environmental risks Residents payto have power restored and the transmission system improved after each storm Somecosts associated with environmental risks are paid only indirectly Research shows forexample that invasive exotic species follow low-density housing development through-out New England Invasive species pose the single biggest threat to Connecticuts naturalecosystems but residents have never paid significant sums for statewide prevention andcontrol efforts (They do pay costs indirectly for some species unabated spread as anexample dense infestations of invasive vines contribute to utility line destruction duringstorms) Conservation organizations agencies and individuals have worked hard and ef-fectively to reduce the threat of some highly destructive species but the state has yet tomobilize against the threat of invasive species in a comprehensive way
The Future State
The pace and pattern of land development will determine the future of Connecticuts airwater and life A sudden spurt in sprawl would yield more water pollution more air pollu-tion more invasive species and a host of other negative outcomes
A 2009 report of the US Forest Service predicts large-scale conversion of Connecticuts
privately-owned forest land to housing and other types of development but that has yetto be shown It is true that any development in Connecticut that is not redevelopment islikely to convert privately-owned forest land However very recent census data showmore population growth in developed areas than in rural or exurban towns What trendwill dominate Connecticuts future
Connecticut generally appears to be in a steady state though one with an aging popula-tion and rising temperatures What a Connecticut resident sees here today is likely to bewhat he or she sees here 15 years from now barring an unforeseen boom in sprawl Asthe Council has noted in previous reports most Connecticut residents today see an envi-ronment little changed from the time they arrived a fact especially true for people 25-
years-old or younger The exceptions are sudden and tend to be negative to the behold-er such as when a familiar forest or farm suddenly disappears a telecommunicationstower appears on a nearby hill or a black bear destroys the backyard bird feeder
It is difficult to foresee strong forces that will alter Connecticuts development patternsor the indicators in this report Even a best-case scenario of vigorous economicgrowth built upon previously-developed properties is unlikely to move the indicators sub-stantially Growth that is based largely on consumption of undeveloped lands on theother hand would have many negative consequences but that outcome can be avoidedthrough good policy With the states environmental indicators showing only minor upsand downs and with a fairly stable though vulnerable economy and landscape delibe-rate actions will need to be taken before residents see improvements These include the
following
7
7312019 Environmental Quality in Connecticut 2011
httpslidepdfcomreaderfullenvironmental-quality-in-connecticut-2011 1048
Reduce water pollution from developed areas This means low-impact devel-opment techniques for new development and a long campaign of retrofittingtowns and cities with green infrastructure The new permeable sidewalks encir-cling the State Capitol should be considered normal not exceptional
Plan for homes and jobs near mass transit As documented in many placesgood transportation and economic development policies can guide and stimulate
development where people can live outside the automobile
Train municipal regulators Volunteer municipal commission members makethousands of regulatory decisions annually Training of these members is a low-cost highly effective component of the environmental protection arsenal buttraining needs are chronically underserved
Invest The cost of regulating pollution is generally covered by the regulated par-ties but who aside from sportsmen and park patrons are paying for the man-agement of the states natural resources For the most part nobody Yet the up-side potential is great residents see $38 of economic activity for each dollar thestate spends on parks
Embrace the Nature State (and Keep Conservation Alive) If residents enjoyliving among trees observing wildlife and working locally to conserve land as
they evidently do state policies should honor that choice However recent reports from the Connecticut Audubon Society and others express doubt that Connecti-cuts high level of volunteer conservation commitment will endure as many child-ren lack extended exposure to wild nature Connecticut must never let a lack of knowledge and enthusiasm erode its status as the Nature State
Connecticutrsquos environmental indicators begin on the next page
8
7312019 Environmental Quality in Connecticut 2011
httpslidepdfcomreaderfullenvironmental-quality-in-connecticut-2011 1148
Air
Good Air Days
Every Connecticut resident breathed good air on 342 days in 2011 eight morethan in 2010
A Good Air Day is a day when every monitoring station in the state records satisfactory air quali-
ty ldquoSatisfactory air qualityrdquo is defined here as air that meets the specific health-based ambient
air quality standards for all of the following 6 pollutants sulfur dioxide lead carbon monoxideparticles nitrogen dioxide and ground-level ozone
Connecticutrsquos goal is to have air that meets health-based standards for all pollutants Violationsof health-based air quality standards have been eliminated for all pollutants except ground-level
ozone and fine particles On 13 summer days concentrations of ground-level ozone violated theozone standard that protects human health The standard for fine particles was violated on 10
days in the fall and winter an unusually high number One steamy July day saw the standardsviolated for both ozone and fine particles Not every town experienced bad air on the same days
Danbury was the location with the most bad air days (11 days total five bad ozone days five bad
particle days and one day that was bad for both ozone and particles)
Ozone is created when nitrogen oxides and organic compounds in the air react in the presence of
sunlight Weather is a big factor in year-to-year fluctuations Motor vehicles remain a major
source of ozone-forming emissions despite improvements in tailpipe standards Much ground-level
ozone originates in states to the west of Connecticut
In typical years cities and towns in the western and coastal regions of the state see the most bad
air days In 2007 and in 2009 however inland towns had more The historical pattern returned in2010 and 2011 with coastal towns having the most bad ozone days Groton and Westport had thehighest frequency in 2011 (nine days each)
9
7312019 Environmental Quality in Connecticut 2011
httpslidepdfcomreaderfullenvironmental-quality-in-connecticut-2011 1248
Fine particles such as those found in smoke and haze are 25 micrometers in diameter andsmaller These particles can form when gases emitted from power plants industries and automo-
biles react in the air Violations of the health standard occur mostly in summer and winter rarely
in spring and fall The fall of 2011 was a notable exception as generators wood stoves and fire-places put into use after the October 29 snowstorm yielded very high levels of fine particles insome cities and towns The monitoring stations in the northern half of the state were themselves
knocked out but the extraordinarily high levels recorded in Springfield Massachusetts -- more
than twice the limit that protects human health -- undoubtedly extended into Connecticut Most of Connecticut meets the health standard for fine particles as that standard allows the air to exceedthe numerical limit for a few days each year
Technical Note The federal government modified the standards for fine particles in December2006 and for ground-level ozone in early 2008 The chart above was redrawn each time to illu-strate the states historical pattern of good air days by applying the new stricter standards to all
previous years The federal government is again reviewing the standards for particles and
ground-level ozone
10
7312019 Environmental Quality in Connecticut 2011
httpslidepdfcomreaderfullenvironmental-quality-in-connecticut-2011 1348
Air
Clearing the Air
Average Levels of Air Pollution
Connecticutrsquos air was slightly more polluted in 2011 than in 2010 breaking afive-year winning streak
The chart shows the average amount of pollution in Connecticuts air for each year Six air pollu-tants -- sulfur dioxide lead carbon monoxide particles nitrogen dioxide and ground-level ozone-- are measured across the state by DEEP At the end of every year the Council expresses the av-erage level of each pollutant on a numerical scale where zero equals no pollution and 100
represents the ldquounhealthfulrdquo level of the specified pollutant The Council then takes this annualnumber for each of the six pollutants and averages them to yield the single index value on thisgraph
In 2011 all of the pollutants (excluding lead) increased slightly for the first time since 2005 Le-
vels of lead in the air have dropped so low that they barely register in this indicator In 2010carbon monoxide was the only pollutant to increase from the previous year
The increase in pollution in 2011 is partially ascribable to the large number of generators woodstoves and fireplaces that were put into use following the October snowstorm Yearly weathervariations also cause fluctuations in air quality
Technical Note A new monitoring station was added in Litchfield in 2010 To maintain an accu-
rate comparison among years data from this station will not be added until there are enoughyears to provide a trend At that time all the earlier years will be re-calculated
11
7312019 Environmental Quality in Connecticut 2011
httpslidepdfcomreaderfullenvironmental-quality-in-connecticut-2011 1448
Farm Forest Wetland
Preserved Land
Connecticuts goal is to preserve 21 of the states land area by 2023 but no-body knows how much land has actually been preserved
State law (CGS 23-8(b)) sets a goal of conserving 21 percent of Connecticutrsquos land area TheGreen Plan Connecticutrsquos official land conservation plan establishes 2023 as the target dateThat goal includes conservation land owned by towns and cities land trusts and other nonprofitorganizations water utilities and the state
The same law sets a goal (10 percent of Connecticuts land area) for state ownership of land forparks forests and wildlife areas Records of state-owned lands are accurate and are reported
here
In 2011 DEEP preserved about 575 acres State grants helped municipalities and land trusts ac-
quire an additional 1600 acres This pace is not nearly sufficient to reach the states goals
Many additional acres probably thousands in some years are preserved by municipalities and
land trusts without state grants but this information is not reported to the state The Council de-termined that previous state estimates of the acreage owned by municipalities and nonprofit land
trusts were inaccurate Those estimates which were reported in previous editions of Environmen-tal Quality in Connecticut are no longer included in this report
The absence of an accurate inventory of protected land in Connecticut is a serious deficiencyDEEP has been collecting data from municipal records in a sequential fashion for 12 years if that
effort is ever completed the earliest-collected data will be well out of date To make land preser-vation more strategic and cost-effective Connecticut needs a reliable and up-to-date registry of the states protected lands Public Act 12-152 could eventually lead to an accurate inventory
12
7312019 Environmental Quality in Connecticut 2011
httpslidepdfcomreaderfullenvironmental-quality-in-connecticut-2011 1548
Farm Forest Wetland
Forest
After a century of growth and relative stability Connecticutrsquos forests -- especiallythe most valuable core forests -- have been shrinking for two decades
Most of Connecticutrsquos forests were cleared for agriculture and industry in the 19th century andthen allowed to regenerate From 1960 to 1980 the overall acreage of forest did not change
much even with the rapid spread of roads housing and commercial development According tothe US Forest Service the spread of forests on abandoned farms equaled the conversion of fo-
rested land to other uses The late 20th century brought a change forest is now declining
This indicator shows the total acreage of forests in Connecticut The forests are divided into core
forests and other forests Core forests are at least 300 feet from non-forest development such as
roads buildings and farms Forests that are fragmented or divided by roads and buildings servesome forest purposes but are not fully-functioning forest ecosystems Fragmented forests areknown to provide substandard habitat for many species of wildlife and in many cases less oppor-
tunity for hunting and other types of recreation
Even as the total acreage of forests might fluctuate over years or decades the extent of core fo-rests will always show a decline except in rare instances where roads or developments might be
abandoned and reclaimed by forests
Technical Note The definition and measurement of core forests is done by the Center for LandUse Education and Research (CLEAR) at the University of Connecticut as part of the Connecticutrsquos
Changing Landscape Project (CCL) The Council finds these data derived from CLEARs analysis of satellite imagery to be the most accurate data available Satellite data is examined by CLEARevery few years this indicator includes the most recent data available (2006)
13
7312019 Environmental Quality in Connecticut 2011
httpslidepdfcomreaderfullenvironmental-quality-in-connecticut-2011 1648
Farm Forest Wetland
Farmland
In 2011 Connecticut preserved 1975 acres of farmland -- the best year for pre-servation since 1993 and close to the 2000-acre annual rate needed to reach
the states goal
The top chart shows the acreage of land being farmed in Connecticut The bottom chart shows thecumulative acreage preserved by the Connecticut Department of Agriculture
14
7312019 Environmental Quality in Connecticut 2011
httpslidepdfcomreaderfullenvironmental-quality-in-connecticut-2011 1748
To preserve land for future agricultural use the Connecticut Department of Agriculture purchasesthe development rights to farmland from volunteer sellers This keeps the land in private owner-
ship with severe restrictions on future nonagricultural development Over 1300 acres were pre-
served each year from 2008 through 2010 In 2011 16 farms participated preserving 1975acres Funds are mostly from state bonding and the Community Investment Act
Connecticuts farmland preservation goal is based on the amount of land needed for food produc-tion Mathematical projections of the current preservation rate show the goal being reached in the22nd century but in reality there will not be that acreage of agricultural land remaining in the
state by the end of the current century if the recent rate of loss continues Preservation of at least
2000 acres annually should result in success
This indicator does not show agricultural land acquired for preservation by municipalities and
nonprofit organizations Several towns purchased farms in recent years with no state assistanceand those acres are not reported or recorded at the state level Along with a central registry of preserved open space Connecticut needs a registry of preserved farmland to help state agencies
and other organizations preserve land strategically
Technical Note Until 2008 the uppermost chart showed the total acreage of land in Connecticutfarms as counted using survey data by the US Department of Agriculture (USDA) The Council
has found a superior data source in the University of Connecticuts Center for Land Use Educa-
tion and Research (CLEAR) CLEAR staff analyzes satellite imagery to measure the actual area of fields pastures orchards and vineyards In contrast the USDA data counted all land in farmseven that which was not used for agriculture CLEAR analyzes new satellite imagery every few
years the most recent imagery is from 2006
15
7312019 Environmental Quality in Connecticut 2011
httpslidepdfcomreaderfullenvironmental-quality-in-connecticut-2011 1848
Farm Forest Wetland
Inland Wetlands
Towns and cities permitted disturbance of about 70 acres of wetlands the fewestin four years
Local commissions reduced the wetlands disturbance caused by the averagepermit
16
7312019 Environmental Quality in Connecticut 2011
httpslidepdfcomreaderfullenvironmental-quality-in-connecticut-2011 1948
The top graph shows the acreage of wetlands disturbed by development ldquoDisturbedrdquo wetlands
are those affected directly by human activity which can range from total destruction (when the
wetlands are filled and built upon) to conversion from one type to another (when for example ashallow swamp is dredged to create a pond) There is no specific goal for wetlands conservation
The top graph also shows the acres of wetlands created or otherwise enhanced by humans No
attempt is made here to evaluate the success of the created wetlands or their value relative to
the natural wetlands that might have been altered In fact the created category includes somany diverse activities that the number has no real meaning The Council intends to drop theacres created category in next years report (Readers are invited to comment on this proposal)
The lower graph shows the area of inland wetlands affected by the average permit issued by mu-
nicipalities Use of the average permit shows trends irrespective of the changes in the number of applications that are caused by economic trends
In 2010 and 2011 more than 25 percent of municipalities failed to report their data to DEEP asrequired by state law
Inland wetlands are estimated to cover about 450000 acres or 15 percent of Connecticuts sur-
face More than 95 percent of the development activity in and around wetlands is regulated bymunicipalities with minimal oversight or supervision by the DEEP In October 2008 the Councilpublished Swamped a special report that analyzed performance of the states inland wetlands
program including training State law requires every municipal wetlands agency to have at leastone member or staff person complete DEEPs comprehensive wetlands training program but
many municipalities do not comply with this requirement A thorough statistical analysis foundthat cities and towns that possessed at least one trained member or staff person allowed less
wetlands disturbance than cities and towns that were not in compliance with the training require-ment
Technical Notes The results for 2010 and 2011 should be considered preliminary due to the high
percentage of non-reporting towns The Council adjusts the reported data to account for the non-
reporting towns but inaccuracies are inevitable (The Council is confident that the statistical ad- justment is reasonable because Swamped also examined differences in performance betweentowns that report to the DEEP and towns that do not report and confirmed that non-reporting
towns are similar to reporting towns in the average amount of wetlands destruction they per-
mit) Also for 2011 two 100-acre projects were not included in the totals one involved invasivespecies removal from a Manchester wetland and the other was a drawdown of a pond in Bethle-hem Both were of a scale that distorted typical wetlands activity data
17
7312019 Environmental Quality in Connecticut 2011
httpslidepdfcomreaderfullenvironmental-quality-in-connecticut-2011 2048
Sound + Shore
No Swimming at the Beach
Heavy rain caused the average coastal city and town to close its beaches manymore days than usual
The Council adds up the number of days that each coastal city and town closed one or more of its
public beaches and calculates an average for all the cities and towns with beaches The cities andtowns in the western half of the state usually have a higher frequency of closings
Yearly variations generally are products of rainfall patterns and unusual incidents such as sewer-line ruptures The storms of 2011 (most notably Tropical Storm Irene) resulted in many closings
as many beaches were awash in contaminated runoff raw sewage and debris
In typical years about half of beach closings are due to tests showing elevated levels of bacteriaPolluted surface runoff or sewage overflows after rainstorms are the most common sources of the
bacteria Most other closings are precautionary as health officials must assume that heavy rains
will wash polluted runoff andor overflow from combined sanitarystorm sewers
Connecticutrsquos goal is to eliminate beach closings caused by discharges of untreated or poorlytreated sewage a common cause of elevated bacteria levels
18
7312019 Environmental Quality in Connecticut 2011
httpslidepdfcomreaderfullenvironmental-quality-in-connecticut-2011 2148
Sound and Shore
Piping Plovers on the Beach
A record year as more than 100 of these threatened shorebirds nestedon coastal beaches from Westport to Stonington
Piping Plovers are small shorebirds that nest on sandy sparsely-vegetated beaches Human intru-sion storm tides and predators frequently destroy nests Fifty-two pairs nested in 2011 nine
more than in 2010 Storms and tides destroyed quite a few of their nests
Although the number of plovers on Connecticuts beaches now exceeds the goal that was set in
the 1980s it continues in threatened status at the state and national level Nesting adults arecounted and in most cases protected every spring by the US Fish and Wildlife Service DEEP andvolunteers working with the Connecticut Audubon Society The Nature Conservancy Audubon
Connecticut and local organizations such as the Friends of Milford Point and Stratford Great Mea-
dows National Wildlife Refuge The protections afforded these plovers also benefit other nesting
species including American Oystercatchers and Least Terns which are also a threatened speciesin Connecticut Since protection and monitoring efforts began in 1984 nesting success has im-proved resulting in more returning adults in subsequent years Yearly variations can occur when
adult birds move from one state to another
19
7312019 Environmental Quality in Connecticut 2011
httpslidepdfcomreaderfullenvironmental-quality-in-connecticut-2011 2248
Sound + Shore
Life in Long Island Sound
About half of the fish species in Long Island Sound are increasing
The lobster population of Long Island Sound has failed to recover
DEEP surveys marine fish squid and lobster populations every spring and fall by towing nets froma research vessel Data for 2010 are absent because repairs to the research vessel John Dempsey precluded the fall Long Island Sound trawl survey
20
7312019 Environmental Quality in Connecticut 2011
httpslidepdfcomreaderfullenvironmental-quality-in-connecticut-2011 2348
The top graph shows general trends in the collective populations of lobster squid and 38 speciesof fish The number displayed for any year is the percentage of these 40 species that were above
their long-term average populations In 2005 through 2009 fewer than half of these species were
as common as they were in the 1980s and 1990s The surveys of 2011 showed modest improve-ment Half of the species were as common as in prior years The species selected for this analy-sis reflect a bias in favor of managed species that have high commercial and recreational value
A separate analysis (not shown) of the geometric mean of the weight of all the fish taken per tow
(regardless of species) was the lowest since 2003 This measure may better reflect the overallhealth of the Sound as a habitat The Council is considering adding this measure in future years
Scientists are unsure of the reasons behind the declines and fluctuations of recent years Onepossible explanation for the decline of some prey species is the population growth of striped bass
and other predators Over recent years some colder-water species such as windowpane flounder
and little skate have declined as warmer-water species such as scup and summer flounder haveincreased along with the average yearly temperature of the Sound The illustration at the bottom
of this page lists some-warm water species that are on the increase with some cold-water speciesthat are decreasing
The fall 2011 trawl results for lobster were the lowest ever recorded It is the nadir in a well-documented decade-long decline in the lobster population that also is evident in a dramatic dropin commercial lobster landings during the same period (not shown) Researchers are focusing on
a combination of four possible causes for the dramatic downturn in lobster populations since
1999 disease changes in water quality changes in climatic conditions and human impacts to theSound Research to date suggests that a trend toward warmer water temperatures is an impor-tant factor in the decline of lobsters
Declined through 2011 Increased through 2011
Windowpane Flounder
(shown)
Little Skate
Scup
Atlantic Moonfish (shown)
Summer Flounder
21
7312019 Environmental Quality in Connecticut 2011
httpslidepdfcomreaderfullenvironmental-quality-in-connecticut-2011 2448
Sound + Shore
Pollution in Long Island Sound
The amount of nitrogen dumped into Long Island Sound and its tributaries in-creased slightly in 2011
The area of the Sound with adequate levels of oxygen declined slightly from2010
22
7312019 Environmental Quality in Connecticut 2011
httpslidepdfcomreaderfullenvironmental-quality-in-connecticut-2011 2548
The area of shellfish beds unconditionally approved for harvesting declined in2011
Hypoxia is a condition in the water when oxygen levels are too low to fully support desirableforms of life including fish and lobsters Hypoxia occurs when the nitrogen in pollution stimulatesexcessive growth of aquatic plants which die and get consumed by oxygen-using bacteria Con-
necticuts goal is to ldquoeliminate the adverse impacts of hypoxia resulting from human activi-
tiesrdquo Hypoxia occurs predominantly in the western portions of the Sound Weather greatly influ-ences hypoxia making year-to-year changes less important than long-term trends
To reduce the nitrogen inputs that cause hypoxia Connecticut and New York adopted a compre-hensive management plan in 1994 and built upon that plan with an expanded agreement in2002
The top graph tracks the amount of nitrogen discharged to the Sound and to major rivers by 79
sewage treatment plants two large coastal industrial facilities and a small group of industrialsources in the Naugatuck River watershed Connecticutrsquos investments in nitrogen-removal tech-nology from many of those plants have been successful
Large uncontrolled quantities of nitrogen enter Long Island Sound when rainfall carries fertilizer
from residents lawns along with the pollutants that have accumulated on pavement Overall
Connecticutrsquos share of the total nitrogen pollution in Long Island Sound is about one-third and
New Yorkrsquos is two-thirds In 2001 the federal Environmental Protection Agency approved the New
York and Connecticut joint plan for implementing a Total Maximum Daily Load (TMDL) The TMDLis the maximum amount of pollutants that can be discharged while still allowing water quality
standards to be attained
The Connecticut Department of Agricultures Bureau of Aquaculture and Laboratory Servic-
es monitors shellfish beds and classifies them according to their potential for the harvesting of healthful uncontaminated shellfish The third graph above shows the acreage of shellfish bedsthat are approved for harvesting because they are generally unaffected by pollution (Even areasthat are approved may be closed as a precaution following exceptional rainfalls of three or more
inches) Aquaculture experts have suggested that the annually increasing volume of runoff from
lawns and pavement is flowing further into the Sound resulting in the shrinkage of the shellfishbeds that are fully approved
23
7312019 Environmental Quality in Connecticut 2011
httpslidepdfcomreaderfullenvironmental-quality-in-connecticut-2011 2648
The decline in approved shellfish beds is not attributed to the storms of 2011 it preceded themwith the reclassification of areas in accord with the bacterial standards model of the National
Shellfish Sanitation Program The model allows designation without sampling based on dilution
calculations in areas where there is recreational or commercial activity
Technical Notes The middle chart above shows the area of Long Island Sound that had adequateoxygen levels throughout the year The sampling area (2700 square kilometers) does not includethe whole Sound (3400 square kilometers) The areas not sampled are shallow waters (less than
two meters deep) near shore which generally do not experience hypoxia embayments the east-
ern end of the Sound which is not expected to experience hypoxia and an area in the far west-ern end which probably becomes hypoxic in most years
Hypoxia was redefined by DEEP in 2011 Areas of the Sound are now considered hypoxic where aliter of water contains less than 30 mg of dissolved oxygen This is the criterion that was used
prior to 2004 From 2004 through 2010 DEEP used 35 mgl as the determining level
The threshold was returned to the 30 level in 2011 to be consistent with the definitions used byNew York and the Long Island Sound Study For this years report data for all previous years
were recalculated to show the area of the Sound having adequate oxygen under the current defi-nition (that is at least 30 mgl)
24
7312019 Environmental Quality in Connecticut 2011
httpslidepdfcomreaderfullenvironmental-quality-in-connecticut-2011 2748
Rivers and Reservoirs
No Swimming in the River
About 80 miles of rivers receive overflows of raw sewage during storms
Throughout the state only 11 of rivers and streams are classified as beingclean enough for swimming and other water contact sports
25
7312019 Environmental Quality in Connecticut 2011
httpslidepdfcomreaderfullenvironmental-quality-in-connecticut-2011 2848
Top Chart In fourteen Connecticut cities and towns sanitary sewers were built in combinationwith storm sewers During storms these systems carry more water than their treatment facilities
can handle and a combination of storm water and untreated sewage overflows directly into the
rivers and Long Island Sound Several of these combined sewer systems have been completely orpartly separated since 1990 reducing the impact of untreated sewage on rivers The improve-ment in 2001 can be attributed to the completion of projects in the towns of Waterbury and Nau-
gatuck In 2005 the Jewett City project was completed eliminating overflows of raw sewage into
the Quinebaug River
Connecticuts goal is to eliminate the effects of raw sewage discharges from combined sewer sys-tems Progress is slow because of the extraordinary expense of separating the sewers
The pie chart illustrates the percentage of the states rivers that fully support recreation This isan estimate based on sampling and statistical analysis by the Department of Energy
and Environmental Protection (DEEP) Most streams are not monitored directly The current figure
of 11 percent is from the Integrated Water Quality Report submitted by the DEEP to the federalgovernment on May 31 2011 The 2008 edition of that report estimated the percentage to be 15
Theres Water in the River
(Better 40 Years Late Than Never)
June 23 1970 ldquoThe Water Resources Commission with
the advice of the Board of Fisheries and Game should be
authorized to establish and regulate minimum stream
flowshellipFlows must be tailored to fit the hydrological and
ecological character of each stream as established by the
minimum demands of aquatic life Authority should include
the power to augment flow from storagehelliprdquo Governorrsquos Committee on Environmental Policy Recommendation 48
December 12 2011 The Department of Energy and Envi-
ronmental Protection obtains final approval for proposed
Stream Flow Standards and Regulations specific to the hy-
drological and ecological character of each stream and re-
quiring release from storage under certain conditions to
augment flow
26
7312019 Environmental Quality in Connecticut 2011
httpslidepdfcomreaderfullenvironmental-quality-in-connecticut-2011 2948
Rivers + Reservoirs
Bald Eagles
Bald eagles have come back to Connecticut even to cities The chemical pollu-tants that interfered with their reproduction have since been controlled and large
trees along fish-rich rivers offer good nesting sites
Bald eagles stopped breeding in Con-necticut in the 1950s The species de-
clined throughout the lower 48 states
and was declared endangered in 1967
A variety of environmental conditionsharmed the eagle including the wide-
spread use of certain chemicals
(chlorinated hydrocarbons) that accu-mulated in its prey (mostly fish) Whenthose chemicals were banned and pol-
luted waterways were improved thebald eagle was able to reproduce againYoung eagles were reintroduced into
nearby states in the 1980s and a pair
found their way to Connecticut in 1991and successfully raised a family in
1992 Many more pairs have since
found acceptable nesting habitat onland protected by government and pri-vate landowners including utility com-
panies DEEP monitors the eagles withthe assistance of the Bald Eagle StudyGroup and other volunteers
The federal government removed the bald eagle from its list of threatened and endangered spe-cies in 2007 In 2010 Connecticut changed the eagles in-state status from endangered tothreatened The Northern States Bald Eagle Recovery Plan established a goal for Connecticut of
20 breeding birds (10 nests) which was reached for the first time in 2005 The population of baldeagles is included as an indicator because the eagle is representative of species especially preda-tors that share similar habitat requirements large areas of relatively undisturbed land near riv-
ers or lakes where the birds can find adequate supplies of fish and other prey that are ndash very im-portantly ndash only minimally contaminated
27
7312019 Environmental Quality in Connecticut 2011
httpslidepdfcomreaderfullenvironmental-quality-in-connecticut-2011 3048
Rivers + Reservoirs
Drinking Water
Most water companies delivered water that met health standards in 2011
Every public water utility submits monthly quality reports to the Department of Public Health This
indicator shows the percentage of monthly reports that demonstrate full compliance after weight-
ing the reports to account for the number of people served by each utility Though long-termproblems occur they are rare in large systems with the exception of the downturn in 2005 and
2006 caused by a few short-term problems in larger systems This indicator would show greaterfluctuations if the larger systems failed to deliver good water The most commonly encountered
contaminants include bacteria and byproducts of disinfection with an assortment of other chemi-cals and radioactive substances
28
7312019 Environmental Quality in Connecticut 2011
httpslidepdfcomreaderfullenvironmental-quality-in-connecticut-2011 3148
Human Health
Breast Cancer in Connecticut
Connecticut has the highest incidence of breast cancer among the 50 states buthas seen improvement since a peak in the late 1990s
Of every 100000 women in the stateaged 50 to 54 a fair number will dis-
cover each year that they have breast
cancer That number is depicted in
this graph (The Council presents dataon this one age group rather than on
the entire female population to con-trol factors such as changes in the av-erage age of the larger population
age 50 to 54 was selected as a repre-
sentative age group and is used ineach yearrsquos report) To minimize year-
to-year fluctuations groups of years
are averaged together (In otherwords each data point on the graphshows the number of new cases in a
single year but that year is actually the average of five years) While some breast cancers arelinked to genetic factors most are associated with non-genetic factors including diet reproductivehistory lifestyle and external agents
Breast Cancer as an Environmental Indicator
There are numerous studies connecting certain chemicals and other environmental factors tobreast cancer These factors if significant do not appear to be as important statistically as a
womans own reproductive history but it is important to note that breast cancer rates vary great-
ly in different parts of the country Among the 50 states Connecticut has the highest incidence of breast cancer this assessment is based on average incidence rates from 2004 through 2008 thelatest years for which 50-state data are available (Source North American Association of Central
Cancer Registries as reported by the American Cancer Society)
The rate of new cases showed improvement in 2000 through 2004 (using the average of the five
years) and has held steady for the period of 2005 through 2009 (the most recent years for whichConnecticut data are available)
29
7312019 Environmental Quality in Connecticut 2011
httpslidepdfcomreaderfullenvironmental-quality-in-connecticut-2011 3248
Human Health
Non-Hodgkins Lymphoma
The reasons for the steep increase in this cancer during the 20th century are notwell understood but exposures to specific pollutants and chemicals are potential
factors Since 1999 the picture has improved
Non-Hodgkins lymphoma is a cancer of the lymphatic system It begins in the lymphoid tissue
which contains lymphocytes white blood cells that help the body fight infections Lymphocytestravel throughout the body and can carry abnormal lymphocytes spreading the cancer The data
for this indicator are from the Department of Public Healthrsquos Tumor Registry which records all
known cancer cases in the state (Please see the note on the previous page under Breast Cancerin Connecticut about the use of the 50 to 54 age group) Non-Hodgkinrsquos lymphoma has increasedmarkedly since recordkeeping began The reasons are not well understood though the rise of Ac-quired Immune Deficiency Syndrome (AIDS) since the 1980s accounts for some cases Several
studies also cite environmental factors including exposure to diesel exhaust and cer-tain fertilizers pesticides and chemicals In 2000 through 2004 and again in 2005 through 2009
(the most recent years for which data are available) the annual rate of new cases showed im-provement
30
7312019 Environmental Quality in Connecticut 2011
httpslidepdfcomreaderfullenvironmental-quality-in-connecticut-2011 3348
Personal Impact
Driving Our Cars
Nearly every year for 25 years the average Connecticut resident drove moremiles than he or she did in the previous year That trend shifted into reverse in
2008
Driving a car truck or sport utility vehicle is one of the most environmentally harmful activities a
Connecticut resident will engage in personally Impacts are direct (air pollution oil leakage etc)
and indirect (causing demand for new roads) The Department of Transportation estimates thetotal miles driven each year in Connecticut Every year from 2000 through 2007 the averageConnecticut resident drove more miles than in previous years The reasons for the decades of in-
creasing auto use are complex and include the fact that most new development was accessibleonly by private vehicle A decline in miles driven began in 2008 and has continued to 2010 (thelatest year for which data are available) The Connecticut trend lags slightly the national trend
of auto use which showed a dramatic drop in 2007 The national trend towards less driving is be-ing led by the 16 to 34 year-old segment of the population
Personal Impact indicators illustrate trends in behavior or practices that can be expected to influence the condition of tomorrowrsquosair water land and wildlife
31
7312019 Environmental Quality in Connecticut 2011
httpslidepdfcomreaderfullenvironmental-quality-in-connecticut-2011 3448
Personal Impact
Taking the Bus
The average Connecticut resident took the bus slightly more often in 2011
The number of local and commuter bus trips taken by the average resident has changed very li t-
tle over the last 20 years Riding a bus is just one way to avoid the negative environmental con-sequences of driving a car Ridership data are collected by the Department of Transportation Ri-
dership rose about 6 percent in 2006 perhaps in response to high gasoline prices Since thenthere have been slight fluctuations In 2011 per capita ridership was the highest since 2001
Personal impact indicators illustrate trends in behavior or practices that can be expected to influence the condition of tomorrowrsquos air water land and wildlife
32
7312019 Environmental Quality in Connecticut 2011
httpslidepdfcomreaderfullenvironmental-quality-in-connecticut-2011 3548
Personal Impact
Compliance
Compliance with environmental regulations declined for the third year in a row
33
7312019 Environmental Quality in Connecticut 2011
httpslidepdfcomreaderfullenvironmental-quality-in-connecticut-2011 3648
Who is breaking Connecticuts environmental laws To find out the Council classified all 944 No-tices of Violation (NOVs) issued by DEEP during fiscal year 2011 The conclusions are summa-
rized in a staff memo and the types of violators are characterized in a series of charts The Coun-
cil does not have data on the publicrsquos perceptions of who the violators are but it senses from eve-ryday conversations that people suppose them to be factories utilities waste disposal facilitiesand perhaps pesticide applicators -- a perception that does not match the data The vast majority
of businesses where violations were found were small companies and most violations were re-
lated to the storage transport or distribution of petroleum The largest group by far were gasstations and convenience stores Only seven percent of NOVs were issued to manufacturers withmore than 20 employees -- fewer than the number that went to individual citizens
This indicator shows the approximate percentage of inspections performed by DEEP that foundthe inspected facilities in full compliance with pertinent environmental laws and regulations
(Monitoring data self-reported by permit holders are not included here) In 2010 and 2011 DEEPstepped up enforcement activity in its underground (petroleum) storage tank program and issuedmany more Notices of Violation (NOVs) than in previous years
The overall compliance rate rarely has been better than 90 percent Generally compliance withair quality regulations is higher than with waste and water regulations The average compliance
rate for all programs declined from 90 percent in 2008 to 89 percent in 2009 86 percent in 2010
and 83 percent in 2011 (The sharp downturn of 2002 was due to a surge in NOVs in a single airprogram Stage II Vapor Recovery at gas stations)
The number of inspections (not shown) declined between 1997 and 2007 increased in 2008 anddeclined again in 2009 through 2011 to its lowest number in 15 years Any relationship betweenthe number of inspections and rate of compliance is uncertain The relative stability of the com-
pliance rate in the face of ever-diminishing staff resources might be regarded as a success for the
DEEP However the failure of the state-- government businesses and residents together -- toadvance affirmatively toward the goal of full compliance is apparent
Personal Impact indicators illustrate trends in behavior or practices that can be expected to influence the condition of tomorrowrsquosair water land and wildlife
Notices of Violation (NOVs) are informal enforcement tools generally issued whenever DEEP detects one or more violations at a
facility They carry no financial penalty The recipient has 30 days to respond They can be issued for relatively minor or majorviolations in cases of the latter type the recipient might also receive an order which might carry a financial penalty NOVs typi-cally outnumber orders by a factor of five or more in any year NOVs are good indicators of trends in violations because almost allviolations found through inspections result in NOVs
Some inspections of compliance with air quality regulations are conducted by the Department of Consumer Protection pursuantto an agreement with DEEP these inspections also are used in calculating compliance rates
34
7312019 Environmental Quality in Connecticut 2011
httpslidepdfcomreaderfullenvironmental-quality-in-connecticut-2011 3748
Personal Impact
Recycling
Some municipalities and regional waste authorities have reported greater partici-pation in recycling programs since adopting single-stream recycling However
notable progress towards the statewide goal remains elusive
The General Assembly es-
tablished a goal of reduc-ing and recycling 40 per-cent of Connecticuts mu-
nicipal solid waste streamby the year 2000 (Sec22a-220(f)) That
goal was never met and
the consequences havebeen enormous Hundredsof thousands of tons of
waste were shipped out
of Connecticut in manyyears putting thousands of diesel trucks on the high-
ways for trips of many
hundred miles One conse-quence of this needless
truck traffic is the yearly
addition of 300000 ormore pounds of diesel pol-lutants into the air Anoth-
er consequence is finan-cial one ton that is re-cycled instead of burned or
landfilled can save a municipality hauler or resident from $40 to $93 according to a 2010 report of the Legislative Program Review and Investigations Committee
As total tonnage of waste has grown the percent that is recycled has not In 2006 DEEP amendedthe State Solid Waste Management Plan to include a goal of diverting 58 percent of Connecticutrsquosmunicipal solid waste stream from disposal by 2024 This would be accomplished through recy-
cling composting and waste reduction (such as use of lighter packaging material) If this goal ismet Connecticut will be able to manage all of its garbage without exporting it
DEEP reports suggest that the official figures slightly underestimate actual recycling volume Thegap in the graph reflects a lack of available data is for the years between 2004 and 2008
35
7312019 Environmental Quality in Connecticut 2011
httpslidepdfcomreaderfullenvironmental-quality-in-connecticut-2011 3848
Personal Impact
Climate Changers
The average resident is causing less carbon dioxide to be put onto the atmos-phere a result of lower petroleum consumption
Certain gases in the air func-
tion like the glass of a green-
house they allow the sunsenergy to pass through the
atmosphere to the ground
then trap the heat that ra-diates from the ground Thesegases are often called green-
house gases Worldwide a
build-up of greenhouse gases is contributing to the ongoing
rise in temperature Carbon
dioxide is not the only green-house gas nor even the mostpowerful but carbon dioxide
emissions are far greater in
quantity than the othersThe chart shows the total
emissions of carbon dioxide
emitted from burning of petroleum natural gas and coal in Connecticut divided by the population
A 2008 state law set two goals for reducing greenhouse gas emissions reduce statewide emis-sions to 10 percent below 1990 levels by 2020 and 80 percent below 2001 levels by 2050The chart above shows emissions per Connecticut resident not total emissions and there-
fore displays the goals after adjusting them to account for the larger population that is pro-
jected for 2020 and 2050 There are expected to be hundreds of thousands more people living inConnecticut in 2020 and 2050 so the average resident will have to work that much harder to re-duce carbon dioxide emissions if the statewide goal is to be met
Most human-generated carbon dioxide results from the combustion of fuels in houses businesses
power plants and vehicles and the last of these is the largest source Connecticut is more ener-
gy-efficient than the nation as a whole and the average Connecticut residents contribution toglobal climate change is less than the average Americans
Technical Note The Council has changed the data source for this indicator In previous years da-ta was available for all greenhouse gases not just carbon dioxide However to bring the chartmore up to date the Council switched to a source that includes carbon dioxide only Because the
other gases are emitted in small quantities the carbon dioxide data by themselves give an accu-rate picture of trends in greenhouse gas emissions The most recent data available even for car-bon dioxide alone are from 2009
36
7312019 Environmental Quality in Connecticut 2011
httpslidepdfcomreaderfullenvironmental-quality-in-connecticut-2011 3948
Personal Impact
Electricity at Home and Work
At Home
The average Connecticut resident used slightly less electricity at home in 2011
Thousands of households have been signing up annually to buy electricity gener-ated by renewable energy sources through the CTCleanEnergyOptions program
37
7312019 Environmental Quality in Connecticut 2011
httpslidepdfcomreaderfullenvironmental-quality-in-connecticut-2011 4048
Through 2009 the majority of Connecticut households did not purchase the mostefficient refrigerators or air conditioners This trend probably has not changedbut more recent data are not available and this indicator will be discontinued
At Work
For three years in a row Connecticut businesses have used electricity more effi-ciently to produce goods and services
38
7312019 Environmental Quality in Connecticut 2011
httpslidepdfcomreaderfullenvironmental-quality-in-connecticut-2011 4148
Efficiency at Home The average Connecticut household has been consuming less electricity since the peak
usage year of 2007 despite a brief reversal in 2010 According to the Connecticut Siting Council peak de-mand occurs during hot humid summer days due to air conditioner demand The increase in summertimeconsumption has had significant environmental consequences On the hottest days Connecticutrsquos base-loadpower plants are unable to meet the additional demand and older petroleum-fueled plants are brought online Because they are used sporadically many of these older plants are permitted to operate with no pollu-tion control equipment As a result state residents generate the most air pollution on the hottest summerdays when air quality is already bad
The vast majority of Connecticutrsquos electricity is generated from nuclear energy and the combustion of naturalgas oil and coal Hydropower solar and other renewable resources are small but growing sources of elec-tricity Each source renewable or not has its own negative environmental consequences Reducing thoseconsequences will require Connecticut households to use electricity much more efficiently Such efficiencycan be attained in part with ENERGY STAR appliances
Efficiency in the Kitchen In a typical home the refrigerator consumes more electricity than any otherappliance (Central air conditioning uses more but is not in everyonersquos home) To be labeled ENERGY STAR efficient a full-size refrigerator must operate using at least 20 percent less energy than the federal stan-dards for household appliances
ENERGY STAR appliance sales figures had been collected from voluntary reports by retailers to the ENERGY
STAR program Data on sales by state are no longer available For Connecticut 2009 data are the most re-cent available In 2009 38 percent of refrigerators bought by Connecticut consumers were ENERGY STARefficient a decrease from its peak (44 percent) in 2005 Sales trends for ENERGY STAR air conditioners al-so dropped in 2009 to 42 percent from 44 percent in 2008 Public surveys have shown conclusively thatmost people are aware of the ENERGY STAR label and what it means so reasons other than awareness mustbe addressed to boost ENERGY STAR labeled product sales and stem the ongoing waste of electricity inhomes
The ENERGY STAR program was created in 1992 as a joint effort of the US Environmental Protection Agen-cy and the US Department of Energy to identify and label energy efficient products By consuming lesselectricity ENERGY STAR products help to reduce air pollution and greenhouse gas emissions
The Connecticut Energy Efficiency Fund has partnered with Top Ten USA to help consumers find the mostenergy efficient appliances
Buying Cleaner Energy The CTCleanEnergyOptions program enables customers to sign up to pur-
chase electricity from renewable sources that include wind and low-impact hydroelectric (water power) Par-ticipation has grown steadily though the rate of increased participation is slowing There were 7 per-cent more participants in the program in 2011 than in 2010 The electricity that actually enters these housesis not necessarily from renewable sources The consumer who elects this option is paying for the generationof renewable electricity on the regional electric grid This reduces the amount of electricity that otherwisewould be generated by nuclear coal oil and natural gas-fired generating plants all of which create pollutionCTCleanEnergyOptions is a collaborative program administered by the Clean Energy Finance and InvestmentAuthority
Efficiency at work The bottom graph shows trends in the efficiency with which Connecticutrsquos economyuses electricity to produce goods and services Connecticuts businesses generally have been producing more
goods and services with less electricity State Gross Domestic Product (GDP) represents the total value of goods and services produced within the state in a single year Payment to employees constitutes about 60percent of the GDP In 2010 (the most recent data available) the Bureau of Economic Analysis put Connect-icuts GDP at $237 billion (current dollars) From 2009 to 2010 the GDP grew twice as fast as electricity con-sumption by Connecticuts industrial and commercial sectors Preliminary data for 2011 suggest that therewas no change in efficiency The long-term positive trend demonstrates that with advances in energy effi-cient technology it is possible for Connecticutrsquos economy to continue growing while using electricity moreefficiently
39
7312019 Environmental Quality in Connecticut 2011
httpslidepdfcomreaderfullenvironmental-quality-in-connecticut-2011 4248
Activities of the CEQ in 2011
June saw the 40th anniversary of the legislation that created the Council on Environmen-
tal Quality (CEQ) The Councils first meeting was held in the fall of 1971 Previous re-
ports looked back at some of those early events In the more recent past the Coun-
cils 41st year was one of its busiest and most productive
Research and Reports
The Council published Environmental Quality in Connecticut in April 2011 identifying
Routes to Progress that would move some of Connecticuts environmental indicators in
a positive direction
The Council is required to recommend legislation for identifying the deficiencies of exist-
ing programs and activities The Council published those in January 2012
From time to time the Council asks staff to prepare updates to previous reports Exam-
ples from 2011 include a staff memo on environmental regulation and the growth of
small businesses and a memo on the benefits to Connecticut of a new federal initiative to
reduce mercury pollution
Review of State Projects and Programs
In December 2010 the Council received complaints and inquiries about a state grant fora boat launch facility that was awarded without the environmental review and public no-
tice required by the Connecticut Environmental Policy Act (CEPA) After review the
Council advised the Commissioner of Energy and Environmental Protection of the appli-
cability of CEPA Ultimately the Department of Energy and Environmental Protection
(DEEP) declined to conduct an evaluation The Councils conclusion is summarized in a
2011 letter to one of the citizens who contacted the Council
Council research in 2010 found that one of the most polluting power plants in the state is
located in Hartford and is generally only used on the hottest days of the year when air
quality is already at its worst In December 2011 DEEP published notice of its intent torenew the air pollution permit for the plant Seeing several problems in the draft permit
as well as opportunities to improve and perhaps phase out use of the plant the Council
submitted detailed comments As of press time the permit renewal is still pending
40
7312019 Environmental Quality in Connecticut 2011
httpslidepdfcomreaderfullenvironmental-quality-in-connecticut-2011 4348
The Council continued to improve the Environmental Monitor to accommodate changes in
CEPA most recently to add public notices in cases where agencies decide not to com-
plete an environmental impact evaluation after it has conducted a public scoping
process
Citizen Complaints
As noted in reports of the past two years citizens of Haddam have spoken repeatedly to
the Council about contamination of land and groundwater that has existed in their com-
munity for more than 25 years Among many issues the apparent lack of remedial ac-
tion by one company was of particular note as the company had been required by the
DEEP to investigate the contamination and prepare a clean-up plan The Council decided
to follow this case in detail in order to learn more about the adequacy of existing laws
and programs In April 2010 the Council wrote to DEEP recommending enforcement ac-
tion against the company in question DEEP began legal action against the company in
late 2010 As of May 2012 there has been some study by the landowner as well as addi-
tional legal and bureaucratic action but to date no remediation
Along with many other parties the Council participated throughout 2011 in DEEPs ongo-
ing effort to transform remediation laws and programs The Councils close attention to
the Haddam case has yielded several insights into problems that need to be fixed
Aside from remediation the following are a sample of the many other complaints inves-
tigated in 2011
Dumping on a state university campus
Lack of notice of pesticide spraying on a railroad right-of-way as railroads are ex-
empt from the law governing notification of abutting homeowners
Pesticides and other contaminants in the wells of many homes in one neighbor-
hood
Apparent misinformation in an application for a proposed large drinking water
well with no effective consequences for providing wrong or misleading informa-
tion
Several matters relating to the siting of telecommunications towers including the
need to consider their effect on bird migration corridors preserved natural
areas and coastal areas
Pollution from outdoor wood furnaces both legal and illegal
The Council researched all of the complaints it received and offered recommendations to
the relevant state agencies where warranted Some problems such as illegal tree re-
moval on private property will require legislative action to correct
41
7312019 Environmental Quality in Connecticut 2011
httpslidepdfcomreaderfullenvironmental-quality-in-connecticut-2011 4448
The Word from Mansfield
The Council periodically holds public forums in different parts of the state to learn what
environmental topics are most on residentsrsquo minds The information presented at these
forums has been extremely useful to the Council
In July 2011 the Council heard from many citizens and municipal officials in Mans-
field They spoke about numerous environmental problems many involving the ac-
tions and responsibilities of state agencies Others suggested interesting directions for
the future of the state and its environment The Council investigated all of them and re-
sponded to each speaker Many investigations led to actions by state agencies andor
recommendations for legislation Read a complete summary of the speakers and the is-
sues they raised
Advice From the Public
In November of 2011 the Council released its required recommendations for corrective
legislation in draft form and invited the public to weigh in Citizens and organizations
spoke to the Council at a public forum held in the Legislative Office Building in Hartford
and many others submitted written comments Read a complete summary Their in-
sights technical advice and opinions proved a big help to the Council in preparing its fi-
nal recommendations which were submitted to Governor Dannel P Malloy and the Gen-
eral Assembly in January 2012
___________
In addition to the dozens who spoke at the public forums the Council heard from organi-zations at regular monthly meetings These included DEEP the University of ConnecticutNorth Stamford Concerned Citizens for the Environment Citizens for Clean GroundwaterRivers Alliance of Connecticut Sierra Club and others
Many people across the state expressed their concerns during 2011 The Council workedto address them all and truly appreciates the efforts people made to bring environmen-tal problems to light The Council looks forward to helping citizens and agenciessolve the challenges of 2012 and beyond
42
7312019 Environmental Quality in Connecticut 2011
httpslidepdfcomreaderfullenvironmental-quality-in-connecticut-2011 4548
The release of this edition of Environmental Quality in Connecticut marks 41 years of CEQ service
Council Duties
The duties of the Council on Environmental Quality are described in Sections 22a-11through 22a-13 of the Connecticut General Statutes
The Council is a nine-member board that works independently of the Department of Energy and Environmental Protection (except for administrative functions) The Chair-man and four other members are appointed by the Governor two members by the Pres-ident Pro Tempore of the Senate and two by the Speaker of the House The Councilrsquosprimary responsibilities include
1 Submittal to the Governor of an annual report on the status of Connecticutrsquos env i-ronment including progress toward goals of the statewide environmental planwith recommendations for remedying deficiencies of state programs
2 Review of state agenciesrsquo construction projects3 Investigation of citizensrsquo complaints and allegations of violations of environmental
laws
In addition under the Connecticut Environmental Policy Act (CEPA) and its attendantregulations the Council on Environmental Quality reviews Environmental Impact Evalua-tions that state agencies develop for major projects The Council publishes the Environ-mental Monitor the official publication for scoping notices and environmental impactevaluations for state projects under CEPA The Environmental Monitor also is the officialpublication for notice of intent by state agencies to sell or transfer state lands
43
7312019 Environmental Quality in Connecticut 2011
httpslidepdfcomreaderfullenvironmental-quality-in-connecticut-2011 4648
CEQ Members
Barbara C Wagner (Chair)Resident of Glastonbury Attorney with law office in Glastonbury specializing in commer-cial and residential real estate Executive Director Wind Hill Community Farm Glaston-bury Member Glastonbury Town Council 2000-2010 Co-Founder and Board Member of
Town Center Initiative addressing walkability issues in Glastonburyrsquos center Board of Trustees Diamond Lake Land Trust Former member State Open Space and WatershedLand Acquisition Board
M Howard BeachResident of Simsbury Conservation amp Zoning Compliance Officer Planning AnalystTown of Simsbury Member Simsbury Conservation Inland Wetlands Commission from1980 to 2004 Chairman from 1994 to 2004 Member Board of Directors The Farming-ton River Watershed Association 2004 to 2006 Life Member and past Board MemberSimsbury Land Conservation Trust Founding Member Farmington Valley BiodiversityProject Member Town of Simsbury Open Space Committee 1999 to 2004 Member CTDevelopers Council Member Government Affairs Committee Simsbury Chamber of
Commerce In 2004 completed a Masters Degree in Environmental Law at Vermont LawSchool
Janet P BrooksResident of Middletown Attorney with law office in East Berlin with a practice in envi-ronmental administrative and land use law Member of the Connecticut Bar AssociationPlanning amp Zoning Section and Environment Section Co-author of Connecticut Environ-mental Protection Act Volume 15 of the Connecticut Practice Series published by Thom-son West Formerly Assistant Attorney General in the Environment Department of theConnecticut Attorney Generalrsquos (AGs) Office for 18 years enforcing the statersquos environ-mental laws running the gamut from noise odor water pollution air pollution pesticides
to habitat protection and preservation of land While at the AGrsquos Office coordinated thewetlands appeal practice and developed the legal training for wetlands commissioners forDEEPrsquos annual training Recipient of 1984 German Marshall Fund grant to study the ef-fect of citizen participation on hazardous waste clean-ups in four European countriesBased on those experiences authored a chapter published in Americarsquos Future in Toxic Waste Management Lessons from Europe Staff Attorney for five years at the Connecti-cut Fund for the Environment Inc representing citizens groups in administrative andcourt proceedings Began practice of law assisting the Middletown City Attorney in thecityrsquos opposition to the utility companyrsquos burning of PCB waste oil with in the city bounda-ries
Liz ClarkResident of West Hartford
44
7312019 Environmental Quality in Connecticut 2011
httpslidepdfcomreaderfullenvironmental-quality-in-connecticut-2011 4748
Bruce R FernandezResident of Farmington Retired after 18 years owning and managing a software busi-ness serving insurance companies and independent agencies Prior to that was a con-sulting engineer specializing in energy efficient power plants and paper mills Vice-President of Operations of a small utility serving Bronxville NY and a jet engine de-signtest engineer Masters degrees in Engineering and Management Served in UnitedStates Army Corps of Engineers as small unit commander served in Vietnam and tenyears in Army Reserves Member Board of Directors Farmington Land Trust
Karyl Lee Hall Resident of Branford Attorney with the Connecticut Legal Rights Project Formerly withMurtha Cullina the Connecticut Fund for the Environment and Connecticut Legal Servic-es Co-Chair Branford Conservation Commission Co-chair Scenic Roads AdvisoryCommittee for Routes 146 and 77 Member Advisory Board Branford Land Trust Vice
President Citizens for Branfordrsquos Environment 2002-2009 Connecticut Bar AssociationPro Bono Service Award 2003 Former Co-chair State Implementation Plan [for AirManagement] Revision Advisory Committee
Richard Sherman Resident of Chaplin Architectural designer and construction manager of earth shelteredpassive solar and energy efficient residences Former CEQ Representative to the Route 6Advisory Committee (during previous term on CEQ) Charter Member Transit Alliance of Eastern CT and Citizens for a Sensible Six Former Organizer the Progress and EquityPartnership Member of CEPA Working Group League of Conservation Voters of CTFormer President Northeast Chapter of ACLU-CT Board of Directors Member of PeoplesAction for Clean Energy (PACE) and Northeast Sustainable Energy Association (NESEA)Former Chair Mansfield Transportation Advisory Committee Former President Mans-field Commonground Member Mansfield Planning and Zoning Design Review PanelFormer Chair Mansfield Democratic Town Committee Host and producer of the radio
show A Distant Shore on WHUS (917 FM Storrs) Former Public Affairs Director of WHUS Stopover host American Tour dSol solar electric car race
Norman VanCor(member through April 2012)Resident of Harwinton Owner of Buy Safe Home Inspection LLC and Mizzentop Antiqui-ties Served in United States Marine Corp in Vietnam Awarded the Navy Cross Vietnam-ese Cross of Gallantry and other decorations One of first ten inductees to CT VeteransHall of Fame Former Director Yankee Energy in sales marketing government relationscommunications Founding member and President Emeritus Quinnipiac River WatershedAssociation Former member Rivers Advisory Committee Former Chairman SouthingtonConservation Commission Former host of radio program on environmental topics For-
mer President Southington Water Works Former member Board of Directors of Opera-tion Fuel Active Pheresis donor at American Red Cross with over 37 gallons of wholeblood and platelet donations Former Volunteer Hunter Safety Instructor for the DEEPConservation Education Program Certified Master Gardener
45
7312019 Environmental Quality in Connecticut 2011
httpslidepdfcomreaderfullenvironmental-quality-in-connecticut-2011 4848
Acknowledgments
The Council appreciates the assistance of the many people in the Departments of Agri-culture Energy and Environmental Protection Transportation and Public Health and theConnecticut Siting Council who provided data Researchers at the Center for LanduseEducation and Research (CLEAR) at the University of Connecticut provided very valuable
data
The Council especially thanks the many citizens businesses and organizations who of-fered information and viewpoints to the Council throughout the year
The Council also appreciates the work of its Executive Director Karl Wagener and Envi-ronmental Analyst Peter Hearn in drafting this report for review by the Council and pre-paring the final version for publication
The Council notes the valuable contributions of Eric Walsh an intern from the Universityof Connecticut Law School and Avery Yoshimine an intern from the University of Con-necticut their research contributed greatly to this report
Contact the CEQ
We would like to hear from you Does this report give you the information on Connecticuts environment that you need Is
there something missing
79 Elm Street
Hartford CT 06106
Phone
860-424-4000
(messages can be left 24 hours a day)
Fax
860-424-4070
karlwagenerctgov
7312019 Environmental Quality in Connecticut 2011
httpslidepdfcomreaderfullenvironmental-quality-in-connecticut-2011 348
Bottom Line
A very brief summary of 2011
Improved or Held Steady at a Positive Level in 2011
Drinking Water Quality Bald Eagles amp Piping PloversInland Wetlands Good Air Days Farmland Conservation
What these improvements have in common They are the results of effective regulatory programsand modest public capital investments
Declined or Held Steady at a Level Insufficient to Meet Goals
Beach ClosingsOxygen Levels in Long Island Sound
Pollution in Long Island Sound
Lobsters and Clean Shellfish Beds
Average Level of Air Pollution Conservation of Forest Land (based on incomplete data)
What these deficiencies have in common Most will require substantial public capital investment
or in some cases improved strategies before goals can be met
Trends in Personal Impact Indicators
Connecticut residents used electricity more efficiently at work
Recycling rates remain below targets
Residents took the bus more often and drove lessCompliance rates were down
Data for several environmental indica-
tors were unavailable for 2011 for rea-sons that varied from staff shortages atDEEP to the absence of data collection
systems Nobody knows for examplehow much land in Connecticut was pre-
served last year nor does anyone
know how much has been permanently
protected to date because there is nosystem to collect such data
1
7312019 Environmental Quality in Connecticut 2011
httpslidepdfcomreaderfullenvironmental-quality-in-connecticut-2011 448
Introduction
Connecticuts environmental statistics for 2011 look typical of recent years they portraya static state with slow or no progress on some of the biggest challenges peppered withsmall improvements and minor retreats
Thats at first glance A closer look reveals many more facts some of which were illumi-nated dramatically by Tropical Storm Irene and the October 29 snowstorm
Here are the first glances and the closer looks
AIR
First Glance Slightly fewer bad days but more pollution on the average day
Closer Look Air quality in some towns after the October storm was atrocious appar-
ently because of emissions from generators wood stoves and fireplaces Northern Con-necticut probably saw particle levels over twice the standard that protects human health-- a sample of what Connecticut residents would breathe all the time if it were not for
the successful air pollution controls that have been put in place on most sectors of theeconomy
CLEAN RIVERS AND STREAMS
First Glance No change in six years
Closer Look Steady investment in upgrading cities sewerage continues but it mightnever result in rivers that are truly free of raw sewage after rainstorms We might needa new indicator to measure subtle progress Meanwhile runoff from developed areasremains the largest impediment to clean waterways Control of polluted runoff fromstreets parking lots and lawns is the next challenge if the goal of clean water is to beachieved
2
7312019 Environmental Quality in Connecticut 2011
httpslidepdfcomreaderfullenvironmental-quality-in-connecticut-2011 548
LIFE IN THE SOUND
First Glance Lobsters shellfish beds beaches pollution and oxygen all worse in 2011
Closer look This satellite view of the Connecticut River emptying uncountable tons of sediment into Long Island Sound nearly a week after Tropical Storm Irene receivedwidespread publication It is a powerful reminder that beaches oyster beds and the openwater are affected greatly by the pollution that washes off the surface of Connecticut af-ter every rain
FARM FOREST WETLAND
First Glance A good year for farmland conservation not for other lands
Closer Look Connecticut still does not know how close it is to its goal of conserving 21percent of the states land area (Public Act 12-152 could eventually lead to an accurateinventory of preserved lands)
PERSONAL IMPACT INDICATORS
Driving Our Cars
First Glance People are driving less
Closer Look Connecticut might be in the early stages of an unprecedented shift towardless driving if state and national data continue along current trends Until 2007 the av-erage resident drove more miles every year than in the previous year Some reduction indriving is attributed to economic factors but recent research has found that demograph-ic factors are playing a role
3
7312019 Environmental Quality in Connecticut 2011
httpslidepdfcomreaderfullenvironmental-quality-in-connecticut-2011 648
Compliance
First Glance Down
Closer Look About 1000 violations of Connecticutrsquos environmental laws are de-tected each year Who are the culprits The Council classified all 944 Notices of Violation(NOV) issued by the Department of Energy and Environmental Protection (DEEP) in the2011 fiscal year and found that the majority of NOVs issued to businesses were relatedto the storage distribution and use of petroleum especially gasoline Gas stations andconvenience stores received the largest number of NOVs Some classes of NOV recipientsmight surprise the readers medical offices and landscaping companies receivedmany Only 7 percent of NOVs went to manufacturers with more than 20 employeeswhich is smaller than the number issued to homeowners and other individuals
The indicators in this report provide many additional insights into the progress that Con-necticut residents have made and the challenges they confront Additional and previouslyobscure data about Connecticuts environment were brought to the fore by the storms of
2011 In fact Connecticut might well be able to claim the title The Nature State Readmore
______________________
Notes for This Edition
Regular readers of this report know that its core elements are the 31 indicators that describeConnecticuts environment objectively and reliably One indicator will probably be discontinuedafter this year retail sales data for ENERGY STAR appliances are no longer available state-by-state The most recent data are from 2009
The Council makes improvements to this report every year and many of them havebeen suggested by readers The Council greatly appreciates their advice Additional changes pro-posed by readers are in the works
4
7312019 Environmental Quality in Connecticut 2011
httpslidepdfcomreaderfullenvironmental-quality-in-connecticut-2011 748
Arrowheads Explained
Above each environmental indicator on the pages that follow readers will find an arrowhead that
illustrates improvement (arrowhead up) or decline (arrowhead down) in environmental conditions
There are four variations of the arrow symbols
The data show a positive change from theprevious year The one-year change is not
always consistent with the long-term trendwhich is displayed on the chart
The data show a negative change from the
previous year The one-year change is notalways consistent with the long-term trend
which is displayed on the chart
No arrow means the data for the latest
year available show a very small changepositive or negative from the previous
year If the color is green the indicator is
unchanged at a satisfactory level if red
unsatisfactory If the color is orangethe lack of change is neither good nor bad
Connecticut is not on track to meet its
long-term goal This symbol is used for
those indicators that except in the most
unusual circumstances always will show
some progress (ldquoPreserved Landrdquo is one
example) It would be misleading to label
the one-year change as ldquoimprovedrdquo if the
progress is not sufficient to get the state to
its goal by the established target date
5
7312019 Environmental Quality in Connecticut 2011
httpslidepdfcomreaderfullenvironmental-quality-in-connecticut-2011 848
Connecticut The State of Nature
The storms of 2011 brought to light some previously obscure data that say a lot aboutConnecticut
Example Connecticut is number one in WUI or Wildland-Urban Interface a measure of the proximity of peoples homes to forests wetlands and grasslands Seventy-two per-cent of Connecticuts land area can be classified as WUI a percentage matched by noother state The WUI scale has traditionally been used to measure communities suscep-tibility to forest fires but it also helps to explain such things as the vastness of poweroutages caused by storms
Whether Connecticuts extraordinary WUI classification is due more to effective conser-vation of green spaces in many communities or to past futility in minimizing sprawl is notthe critical point More important are the permanent quality of the developments now in
place the benefits and costs of residents proximity to nature the demographic and eco-nomic trends that will determine future development patterns and pursuing policies thatwill prepare Connecticut against potential degradation
Outside the central cities Connecticut residents live among trees and appear to embracesuch a lifestyle On the average plot of ground in Connecticut more people -- residentsand non-residents together -- are watching wildlife than in nearly any other state Thismakes sense as there is much to watch only in two other states might a birdwatcherfind more species of birds per square mile
Looking at the data even more closely Connecticut residents appear to be almost uniquein their affinity with nearby wild things A greater percentage participate in wildlife-associated recreation than the national average and among those participants residentsof no other state can challenge Connecticut residents preference for watching their wild-life around the home Connecticut is one of only five states where people spend more to
watch wildlife (primarily on equipment purchases) than they spend to hunt and fish (in-cluding license fees) and by a ratio that is unmatched (In the federal data watchingwildlife includes maintaining wildlife habitat)
Residents high rate of participation in outdoor activities and conservation activities is agreat positive on its own but it should be noted that it also yields a significant econom-ic profit to the state A University of Connecticut study released in December of 2011 es-timated that 9000 jobs $1 billion of economic activity and $30 million of net state reve-nue can be attributed to outdoor activities just in state parks and forests Any study thatalso accounted for the economic activity generated by birdwatching hiking and horse-back-riding statewide would show much larger numbers Six years ago the amountspent on hunting fishing and watching wildlife in the state was estimated to be near-
ly $1 billion
6
7312019 Environmental Quality in Connecticut 2011
httpslidepdfcomreaderfullenvironmental-quality-in-connecticut-2011 948
Life among the trees also carries economic costs and environmental risks Residents payto have power restored and the transmission system improved after each storm Somecosts associated with environmental risks are paid only indirectly Research shows forexample that invasive exotic species follow low-density housing development through-out New England Invasive species pose the single biggest threat to Connecticuts naturalecosystems but residents have never paid significant sums for statewide prevention andcontrol efforts (They do pay costs indirectly for some species unabated spread as anexample dense infestations of invasive vines contribute to utility line destruction duringstorms) Conservation organizations agencies and individuals have worked hard and ef-fectively to reduce the threat of some highly destructive species but the state has yet tomobilize against the threat of invasive species in a comprehensive way
The Future State
The pace and pattern of land development will determine the future of Connecticuts airwater and life A sudden spurt in sprawl would yield more water pollution more air pollu-tion more invasive species and a host of other negative outcomes
A 2009 report of the US Forest Service predicts large-scale conversion of Connecticuts
privately-owned forest land to housing and other types of development but that has yetto be shown It is true that any development in Connecticut that is not redevelopment islikely to convert privately-owned forest land However very recent census data showmore population growth in developed areas than in rural or exurban towns What trendwill dominate Connecticuts future
Connecticut generally appears to be in a steady state though one with an aging popula-tion and rising temperatures What a Connecticut resident sees here today is likely to bewhat he or she sees here 15 years from now barring an unforeseen boom in sprawl Asthe Council has noted in previous reports most Connecticut residents today see an envi-ronment little changed from the time they arrived a fact especially true for people 25-
years-old or younger The exceptions are sudden and tend to be negative to the behold-er such as when a familiar forest or farm suddenly disappears a telecommunicationstower appears on a nearby hill or a black bear destroys the backyard bird feeder
It is difficult to foresee strong forces that will alter Connecticuts development patternsor the indicators in this report Even a best-case scenario of vigorous economicgrowth built upon previously-developed properties is unlikely to move the indicators sub-stantially Growth that is based largely on consumption of undeveloped lands on theother hand would have many negative consequences but that outcome can be avoidedthrough good policy With the states environmental indicators showing only minor upsand downs and with a fairly stable though vulnerable economy and landscape delibe-rate actions will need to be taken before residents see improvements These include the
following
7
7312019 Environmental Quality in Connecticut 2011
httpslidepdfcomreaderfullenvironmental-quality-in-connecticut-2011 1048
Reduce water pollution from developed areas This means low-impact devel-opment techniques for new development and a long campaign of retrofittingtowns and cities with green infrastructure The new permeable sidewalks encir-cling the State Capitol should be considered normal not exceptional
Plan for homes and jobs near mass transit As documented in many placesgood transportation and economic development policies can guide and stimulate
development where people can live outside the automobile
Train municipal regulators Volunteer municipal commission members makethousands of regulatory decisions annually Training of these members is a low-cost highly effective component of the environmental protection arsenal buttraining needs are chronically underserved
Invest The cost of regulating pollution is generally covered by the regulated par-ties but who aside from sportsmen and park patrons are paying for the man-agement of the states natural resources For the most part nobody Yet the up-side potential is great residents see $38 of economic activity for each dollar thestate spends on parks
Embrace the Nature State (and Keep Conservation Alive) If residents enjoyliving among trees observing wildlife and working locally to conserve land as
they evidently do state policies should honor that choice However recent reports from the Connecticut Audubon Society and others express doubt that Connecti-cuts high level of volunteer conservation commitment will endure as many child-ren lack extended exposure to wild nature Connecticut must never let a lack of knowledge and enthusiasm erode its status as the Nature State
Connecticutrsquos environmental indicators begin on the next page
8
7312019 Environmental Quality in Connecticut 2011
httpslidepdfcomreaderfullenvironmental-quality-in-connecticut-2011 1148
Air
Good Air Days
Every Connecticut resident breathed good air on 342 days in 2011 eight morethan in 2010
A Good Air Day is a day when every monitoring station in the state records satisfactory air quali-
ty ldquoSatisfactory air qualityrdquo is defined here as air that meets the specific health-based ambient
air quality standards for all of the following 6 pollutants sulfur dioxide lead carbon monoxideparticles nitrogen dioxide and ground-level ozone
Connecticutrsquos goal is to have air that meets health-based standards for all pollutants Violationsof health-based air quality standards have been eliminated for all pollutants except ground-level
ozone and fine particles On 13 summer days concentrations of ground-level ozone violated theozone standard that protects human health The standard for fine particles was violated on 10
days in the fall and winter an unusually high number One steamy July day saw the standardsviolated for both ozone and fine particles Not every town experienced bad air on the same days
Danbury was the location with the most bad air days (11 days total five bad ozone days five bad
particle days and one day that was bad for both ozone and particles)
Ozone is created when nitrogen oxides and organic compounds in the air react in the presence of
sunlight Weather is a big factor in year-to-year fluctuations Motor vehicles remain a major
source of ozone-forming emissions despite improvements in tailpipe standards Much ground-level
ozone originates in states to the west of Connecticut
In typical years cities and towns in the western and coastal regions of the state see the most bad
air days In 2007 and in 2009 however inland towns had more The historical pattern returned in2010 and 2011 with coastal towns having the most bad ozone days Groton and Westport had thehighest frequency in 2011 (nine days each)
9
7312019 Environmental Quality in Connecticut 2011
httpslidepdfcomreaderfullenvironmental-quality-in-connecticut-2011 1248
Fine particles such as those found in smoke and haze are 25 micrometers in diameter andsmaller These particles can form when gases emitted from power plants industries and automo-
biles react in the air Violations of the health standard occur mostly in summer and winter rarely
in spring and fall The fall of 2011 was a notable exception as generators wood stoves and fire-places put into use after the October 29 snowstorm yielded very high levels of fine particles insome cities and towns The monitoring stations in the northern half of the state were themselves
knocked out but the extraordinarily high levels recorded in Springfield Massachusetts -- more
than twice the limit that protects human health -- undoubtedly extended into Connecticut Most of Connecticut meets the health standard for fine particles as that standard allows the air to exceedthe numerical limit for a few days each year
Technical Note The federal government modified the standards for fine particles in December2006 and for ground-level ozone in early 2008 The chart above was redrawn each time to illu-strate the states historical pattern of good air days by applying the new stricter standards to all
previous years The federal government is again reviewing the standards for particles and
ground-level ozone
10
7312019 Environmental Quality in Connecticut 2011
httpslidepdfcomreaderfullenvironmental-quality-in-connecticut-2011 1348
Air
Clearing the Air
Average Levels of Air Pollution
Connecticutrsquos air was slightly more polluted in 2011 than in 2010 breaking afive-year winning streak
The chart shows the average amount of pollution in Connecticuts air for each year Six air pollu-tants -- sulfur dioxide lead carbon monoxide particles nitrogen dioxide and ground-level ozone-- are measured across the state by DEEP At the end of every year the Council expresses the av-erage level of each pollutant on a numerical scale where zero equals no pollution and 100
represents the ldquounhealthfulrdquo level of the specified pollutant The Council then takes this annualnumber for each of the six pollutants and averages them to yield the single index value on thisgraph
In 2011 all of the pollutants (excluding lead) increased slightly for the first time since 2005 Le-
vels of lead in the air have dropped so low that they barely register in this indicator In 2010carbon monoxide was the only pollutant to increase from the previous year
The increase in pollution in 2011 is partially ascribable to the large number of generators woodstoves and fireplaces that were put into use following the October snowstorm Yearly weathervariations also cause fluctuations in air quality
Technical Note A new monitoring station was added in Litchfield in 2010 To maintain an accu-
rate comparison among years data from this station will not be added until there are enoughyears to provide a trend At that time all the earlier years will be re-calculated
11
7312019 Environmental Quality in Connecticut 2011
httpslidepdfcomreaderfullenvironmental-quality-in-connecticut-2011 1448
Farm Forest Wetland
Preserved Land
Connecticuts goal is to preserve 21 of the states land area by 2023 but no-body knows how much land has actually been preserved
State law (CGS 23-8(b)) sets a goal of conserving 21 percent of Connecticutrsquos land area TheGreen Plan Connecticutrsquos official land conservation plan establishes 2023 as the target dateThat goal includes conservation land owned by towns and cities land trusts and other nonprofitorganizations water utilities and the state
The same law sets a goal (10 percent of Connecticuts land area) for state ownership of land forparks forests and wildlife areas Records of state-owned lands are accurate and are reported
here
In 2011 DEEP preserved about 575 acres State grants helped municipalities and land trusts ac-
quire an additional 1600 acres This pace is not nearly sufficient to reach the states goals
Many additional acres probably thousands in some years are preserved by municipalities and
land trusts without state grants but this information is not reported to the state The Council de-termined that previous state estimates of the acreage owned by municipalities and nonprofit land
trusts were inaccurate Those estimates which were reported in previous editions of Environmen-tal Quality in Connecticut are no longer included in this report
The absence of an accurate inventory of protected land in Connecticut is a serious deficiencyDEEP has been collecting data from municipal records in a sequential fashion for 12 years if that
effort is ever completed the earliest-collected data will be well out of date To make land preser-vation more strategic and cost-effective Connecticut needs a reliable and up-to-date registry of the states protected lands Public Act 12-152 could eventually lead to an accurate inventory
12
7312019 Environmental Quality in Connecticut 2011
httpslidepdfcomreaderfullenvironmental-quality-in-connecticut-2011 1548
Farm Forest Wetland
Forest
After a century of growth and relative stability Connecticutrsquos forests -- especiallythe most valuable core forests -- have been shrinking for two decades
Most of Connecticutrsquos forests were cleared for agriculture and industry in the 19th century andthen allowed to regenerate From 1960 to 1980 the overall acreage of forest did not change
much even with the rapid spread of roads housing and commercial development According tothe US Forest Service the spread of forests on abandoned farms equaled the conversion of fo-
rested land to other uses The late 20th century brought a change forest is now declining
This indicator shows the total acreage of forests in Connecticut The forests are divided into core
forests and other forests Core forests are at least 300 feet from non-forest development such as
roads buildings and farms Forests that are fragmented or divided by roads and buildings servesome forest purposes but are not fully-functioning forest ecosystems Fragmented forests areknown to provide substandard habitat for many species of wildlife and in many cases less oppor-
tunity for hunting and other types of recreation
Even as the total acreage of forests might fluctuate over years or decades the extent of core fo-rests will always show a decline except in rare instances where roads or developments might be
abandoned and reclaimed by forests
Technical Note The definition and measurement of core forests is done by the Center for LandUse Education and Research (CLEAR) at the University of Connecticut as part of the Connecticutrsquos
Changing Landscape Project (CCL) The Council finds these data derived from CLEARs analysis of satellite imagery to be the most accurate data available Satellite data is examined by CLEARevery few years this indicator includes the most recent data available (2006)
13
7312019 Environmental Quality in Connecticut 2011
httpslidepdfcomreaderfullenvironmental-quality-in-connecticut-2011 1648
Farm Forest Wetland
Farmland
In 2011 Connecticut preserved 1975 acres of farmland -- the best year for pre-servation since 1993 and close to the 2000-acre annual rate needed to reach
the states goal
The top chart shows the acreage of land being farmed in Connecticut The bottom chart shows thecumulative acreage preserved by the Connecticut Department of Agriculture
14
7312019 Environmental Quality in Connecticut 2011
httpslidepdfcomreaderfullenvironmental-quality-in-connecticut-2011 1748
To preserve land for future agricultural use the Connecticut Department of Agriculture purchasesthe development rights to farmland from volunteer sellers This keeps the land in private owner-
ship with severe restrictions on future nonagricultural development Over 1300 acres were pre-
served each year from 2008 through 2010 In 2011 16 farms participated preserving 1975acres Funds are mostly from state bonding and the Community Investment Act
Connecticuts farmland preservation goal is based on the amount of land needed for food produc-tion Mathematical projections of the current preservation rate show the goal being reached in the22nd century but in reality there will not be that acreage of agricultural land remaining in the
state by the end of the current century if the recent rate of loss continues Preservation of at least
2000 acres annually should result in success
This indicator does not show agricultural land acquired for preservation by municipalities and
nonprofit organizations Several towns purchased farms in recent years with no state assistanceand those acres are not reported or recorded at the state level Along with a central registry of preserved open space Connecticut needs a registry of preserved farmland to help state agencies
and other organizations preserve land strategically
Technical Note Until 2008 the uppermost chart showed the total acreage of land in Connecticutfarms as counted using survey data by the US Department of Agriculture (USDA) The Council
has found a superior data source in the University of Connecticuts Center for Land Use Educa-
tion and Research (CLEAR) CLEAR staff analyzes satellite imagery to measure the actual area of fields pastures orchards and vineyards In contrast the USDA data counted all land in farmseven that which was not used for agriculture CLEAR analyzes new satellite imagery every few
years the most recent imagery is from 2006
15
7312019 Environmental Quality in Connecticut 2011
httpslidepdfcomreaderfullenvironmental-quality-in-connecticut-2011 1848
Farm Forest Wetland
Inland Wetlands
Towns and cities permitted disturbance of about 70 acres of wetlands the fewestin four years
Local commissions reduced the wetlands disturbance caused by the averagepermit
16
7312019 Environmental Quality in Connecticut 2011
httpslidepdfcomreaderfullenvironmental-quality-in-connecticut-2011 1948
The top graph shows the acreage of wetlands disturbed by development ldquoDisturbedrdquo wetlands
are those affected directly by human activity which can range from total destruction (when the
wetlands are filled and built upon) to conversion from one type to another (when for example ashallow swamp is dredged to create a pond) There is no specific goal for wetlands conservation
The top graph also shows the acres of wetlands created or otherwise enhanced by humans No
attempt is made here to evaluate the success of the created wetlands or their value relative to
the natural wetlands that might have been altered In fact the created category includes somany diverse activities that the number has no real meaning The Council intends to drop theacres created category in next years report (Readers are invited to comment on this proposal)
The lower graph shows the area of inland wetlands affected by the average permit issued by mu-
nicipalities Use of the average permit shows trends irrespective of the changes in the number of applications that are caused by economic trends
In 2010 and 2011 more than 25 percent of municipalities failed to report their data to DEEP asrequired by state law
Inland wetlands are estimated to cover about 450000 acres or 15 percent of Connecticuts sur-
face More than 95 percent of the development activity in and around wetlands is regulated bymunicipalities with minimal oversight or supervision by the DEEP In October 2008 the Councilpublished Swamped a special report that analyzed performance of the states inland wetlands
program including training State law requires every municipal wetlands agency to have at leastone member or staff person complete DEEPs comprehensive wetlands training program but
many municipalities do not comply with this requirement A thorough statistical analysis foundthat cities and towns that possessed at least one trained member or staff person allowed less
wetlands disturbance than cities and towns that were not in compliance with the training require-ment
Technical Notes The results for 2010 and 2011 should be considered preliminary due to the high
percentage of non-reporting towns The Council adjusts the reported data to account for the non-
reporting towns but inaccuracies are inevitable (The Council is confident that the statistical ad- justment is reasonable because Swamped also examined differences in performance betweentowns that report to the DEEP and towns that do not report and confirmed that non-reporting
towns are similar to reporting towns in the average amount of wetlands destruction they per-
mit) Also for 2011 two 100-acre projects were not included in the totals one involved invasivespecies removal from a Manchester wetland and the other was a drawdown of a pond in Bethle-hem Both were of a scale that distorted typical wetlands activity data
17
7312019 Environmental Quality in Connecticut 2011
httpslidepdfcomreaderfullenvironmental-quality-in-connecticut-2011 2048
Sound + Shore
No Swimming at the Beach
Heavy rain caused the average coastal city and town to close its beaches manymore days than usual
The Council adds up the number of days that each coastal city and town closed one or more of its
public beaches and calculates an average for all the cities and towns with beaches The cities andtowns in the western half of the state usually have a higher frequency of closings
Yearly variations generally are products of rainfall patterns and unusual incidents such as sewer-line ruptures The storms of 2011 (most notably Tropical Storm Irene) resulted in many closings
as many beaches were awash in contaminated runoff raw sewage and debris
In typical years about half of beach closings are due to tests showing elevated levels of bacteriaPolluted surface runoff or sewage overflows after rainstorms are the most common sources of the
bacteria Most other closings are precautionary as health officials must assume that heavy rains
will wash polluted runoff andor overflow from combined sanitarystorm sewers
Connecticutrsquos goal is to eliminate beach closings caused by discharges of untreated or poorlytreated sewage a common cause of elevated bacteria levels
18
7312019 Environmental Quality in Connecticut 2011
httpslidepdfcomreaderfullenvironmental-quality-in-connecticut-2011 2148
Sound and Shore
Piping Plovers on the Beach
A record year as more than 100 of these threatened shorebirds nestedon coastal beaches from Westport to Stonington
Piping Plovers are small shorebirds that nest on sandy sparsely-vegetated beaches Human intru-sion storm tides and predators frequently destroy nests Fifty-two pairs nested in 2011 nine
more than in 2010 Storms and tides destroyed quite a few of their nests
Although the number of plovers on Connecticuts beaches now exceeds the goal that was set in
the 1980s it continues in threatened status at the state and national level Nesting adults arecounted and in most cases protected every spring by the US Fish and Wildlife Service DEEP andvolunteers working with the Connecticut Audubon Society The Nature Conservancy Audubon
Connecticut and local organizations such as the Friends of Milford Point and Stratford Great Mea-
dows National Wildlife Refuge The protections afforded these plovers also benefit other nesting
species including American Oystercatchers and Least Terns which are also a threatened speciesin Connecticut Since protection and monitoring efforts began in 1984 nesting success has im-proved resulting in more returning adults in subsequent years Yearly variations can occur when
adult birds move from one state to another
19
7312019 Environmental Quality in Connecticut 2011
httpslidepdfcomreaderfullenvironmental-quality-in-connecticut-2011 2248
Sound + Shore
Life in Long Island Sound
About half of the fish species in Long Island Sound are increasing
The lobster population of Long Island Sound has failed to recover
DEEP surveys marine fish squid and lobster populations every spring and fall by towing nets froma research vessel Data for 2010 are absent because repairs to the research vessel John Dempsey precluded the fall Long Island Sound trawl survey
20
7312019 Environmental Quality in Connecticut 2011
httpslidepdfcomreaderfullenvironmental-quality-in-connecticut-2011 2348
The top graph shows general trends in the collective populations of lobster squid and 38 speciesof fish The number displayed for any year is the percentage of these 40 species that were above
their long-term average populations In 2005 through 2009 fewer than half of these species were
as common as they were in the 1980s and 1990s The surveys of 2011 showed modest improve-ment Half of the species were as common as in prior years The species selected for this analy-sis reflect a bias in favor of managed species that have high commercial and recreational value
A separate analysis (not shown) of the geometric mean of the weight of all the fish taken per tow
(regardless of species) was the lowest since 2003 This measure may better reflect the overallhealth of the Sound as a habitat The Council is considering adding this measure in future years
Scientists are unsure of the reasons behind the declines and fluctuations of recent years Onepossible explanation for the decline of some prey species is the population growth of striped bass
and other predators Over recent years some colder-water species such as windowpane flounder
and little skate have declined as warmer-water species such as scup and summer flounder haveincreased along with the average yearly temperature of the Sound The illustration at the bottom
of this page lists some-warm water species that are on the increase with some cold-water speciesthat are decreasing
The fall 2011 trawl results for lobster were the lowest ever recorded It is the nadir in a well-documented decade-long decline in the lobster population that also is evident in a dramatic dropin commercial lobster landings during the same period (not shown) Researchers are focusing on
a combination of four possible causes for the dramatic downturn in lobster populations since
1999 disease changes in water quality changes in climatic conditions and human impacts to theSound Research to date suggests that a trend toward warmer water temperatures is an impor-tant factor in the decline of lobsters
Declined through 2011 Increased through 2011
Windowpane Flounder
(shown)
Little Skate
Scup
Atlantic Moonfish (shown)
Summer Flounder
21
7312019 Environmental Quality in Connecticut 2011
httpslidepdfcomreaderfullenvironmental-quality-in-connecticut-2011 2448
Sound + Shore
Pollution in Long Island Sound
The amount of nitrogen dumped into Long Island Sound and its tributaries in-creased slightly in 2011
The area of the Sound with adequate levels of oxygen declined slightly from2010
22
7312019 Environmental Quality in Connecticut 2011
httpslidepdfcomreaderfullenvironmental-quality-in-connecticut-2011 2548
The area of shellfish beds unconditionally approved for harvesting declined in2011
Hypoxia is a condition in the water when oxygen levels are too low to fully support desirableforms of life including fish and lobsters Hypoxia occurs when the nitrogen in pollution stimulatesexcessive growth of aquatic plants which die and get consumed by oxygen-using bacteria Con-
necticuts goal is to ldquoeliminate the adverse impacts of hypoxia resulting from human activi-
tiesrdquo Hypoxia occurs predominantly in the western portions of the Sound Weather greatly influ-ences hypoxia making year-to-year changes less important than long-term trends
To reduce the nitrogen inputs that cause hypoxia Connecticut and New York adopted a compre-hensive management plan in 1994 and built upon that plan with an expanded agreement in2002
The top graph tracks the amount of nitrogen discharged to the Sound and to major rivers by 79
sewage treatment plants two large coastal industrial facilities and a small group of industrialsources in the Naugatuck River watershed Connecticutrsquos investments in nitrogen-removal tech-nology from many of those plants have been successful
Large uncontrolled quantities of nitrogen enter Long Island Sound when rainfall carries fertilizer
from residents lawns along with the pollutants that have accumulated on pavement Overall
Connecticutrsquos share of the total nitrogen pollution in Long Island Sound is about one-third and
New Yorkrsquos is two-thirds In 2001 the federal Environmental Protection Agency approved the New
York and Connecticut joint plan for implementing a Total Maximum Daily Load (TMDL) The TMDLis the maximum amount of pollutants that can be discharged while still allowing water quality
standards to be attained
The Connecticut Department of Agricultures Bureau of Aquaculture and Laboratory Servic-
es monitors shellfish beds and classifies them according to their potential for the harvesting of healthful uncontaminated shellfish The third graph above shows the acreage of shellfish bedsthat are approved for harvesting because they are generally unaffected by pollution (Even areasthat are approved may be closed as a precaution following exceptional rainfalls of three or more
inches) Aquaculture experts have suggested that the annually increasing volume of runoff from
lawns and pavement is flowing further into the Sound resulting in the shrinkage of the shellfishbeds that are fully approved
23
7312019 Environmental Quality in Connecticut 2011
httpslidepdfcomreaderfullenvironmental-quality-in-connecticut-2011 2648
The decline in approved shellfish beds is not attributed to the storms of 2011 it preceded themwith the reclassification of areas in accord with the bacterial standards model of the National
Shellfish Sanitation Program The model allows designation without sampling based on dilution
calculations in areas where there is recreational or commercial activity
Technical Notes The middle chart above shows the area of Long Island Sound that had adequateoxygen levels throughout the year The sampling area (2700 square kilometers) does not includethe whole Sound (3400 square kilometers) The areas not sampled are shallow waters (less than
two meters deep) near shore which generally do not experience hypoxia embayments the east-
ern end of the Sound which is not expected to experience hypoxia and an area in the far west-ern end which probably becomes hypoxic in most years
Hypoxia was redefined by DEEP in 2011 Areas of the Sound are now considered hypoxic where aliter of water contains less than 30 mg of dissolved oxygen This is the criterion that was used
prior to 2004 From 2004 through 2010 DEEP used 35 mgl as the determining level
The threshold was returned to the 30 level in 2011 to be consistent with the definitions used byNew York and the Long Island Sound Study For this years report data for all previous years
were recalculated to show the area of the Sound having adequate oxygen under the current defi-nition (that is at least 30 mgl)
24
7312019 Environmental Quality in Connecticut 2011
httpslidepdfcomreaderfullenvironmental-quality-in-connecticut-2011 2748
Rivers and Reservoirs
No Swimming in the River
About 80 miles of rivers receive overflows of raw sewage during storms
Throughout the state only 11 of rivers and streams are classified as beingclean enough for swimming and other water contact sports
25
7312019 Environmental Quality in Connecticut 2011
httpslidepdfcomreaderfullenvironmental-quality-in-connecticut-2011 2848
Top Chart In fourteen Connecticut cities and towns sanitary sewers were built in combinationwith storm sewers During storms these systems carry more water than their treatment facilities
can handle and a combination of storm water and untreated sewage overflows directly into the
rivers and Long Island Sound Several of these combined sewer systems have been completely orpartly separated since 1990 reducing the impact of untreated sewage on rivers The improve-ment in 2001 can be attributed to the completion of projects in the towns of Waterbury and Nau-
gatuck In 2005 the Jewett City project was completed eliminating overflows of raw sewage into
the Quinebaug River
Connecticuts goal is to eliminate the effects of raw sewage discharges from combined sewer sys-tems Progress is slow because of the extraordinary expense of separating the sewers
The pie chart illustrates the percentage of the states rivers that fully support recreation This isan estimate based on sampling and statistical analysis by the Department of Energy
and Environmental Protection (DEEP) Most streams are not monitored directly The current figure
of 11 percent is from the Integrated Water Quality Report submitted by the DEEP to the federalgovernment on May 31 2011 The 2008 edition of that report estimated the percentage to be 15
Theres Water in the River
(Better 40 Years Late Than Never)
June 23 1970 ldquoThe Water Resources Commission with
the advice of the Board of Fisheries and Game should be
authorized to establish and regulate minimum stream
flowshellipFlows must be tailored to fit the hydrological and
ecological character of each stream as established by the
minimum demands of aquatic life Authority should include
the power to augment flow from storagehelliprdquo Governorrsquos Committee on Environmental Policy Recommendation 48
December 12 2011 The Department of Energy and Envi-
ronmental Protection obtains final approval for proposed
Stream Flow Standards and Regulations specific to the hy-
drological and ecological character of each stream and re-
quiring release from storage under certain conditions to
augment flow
26
7312019 Environmental Quality in Connecticut 2011
httpslidepdfcomreaderfullenvironmental-quality-in-connecticut-2011 2948
Rivers + Reservoirs
Bald Eagles
Bald eagles have come back to Connecticut even to cities The chemical pollu-tants that interfered with their reproduction have since been controlled and large
trees along fish-rich rivers offer good nesting sites
Bald eagles stopped breeding in Con-necticut in the 1950s The species de-
clined throughout the lower 48 states
and was declared endangered in 1967
A variety of environmental conditionsharmed the eagle including the wide-
spread use of certain chemicals
(chlorinated hydrocarbons) that accu-mulated in its prey (mostly fish) Whenthose chemicals were banned and pol-
luted waterways were improved thebald eagle was able to reproduce againYoung eagles were reintroduced into
nearby states in the 1980s and a pair
found their way to Connecticut in 1991and successfully raised a family in
1992 Many more pairs have since
found acceptable nesting habitat onland protected by government and pri-vate landowners including utility com-
panies DEEP monitors the eagles withthe assistance of the Bald Eagle StudyGroup and other volunteers
The federal government removed the bald eagle from its list of threatened and endangered spe-cies in 2007 In 2010 Connecticut changed the eagles in-state status from endangered tothreatened The Northern States Bald Eagle Recovery Plan established a goal for Connecticut of
20 breeding birds (10 nests) which was reached for the first time in 2005 The population of baldeagles is included as an indicator because the eagle is representative of species especially preda-tors that share similar habitat requirements large areas of relatively undisturbed land near riv-
ers or lakes where the birds can find adequate supplies of fish and other prey that are ndash very im-portantly ndash only minimally contaminated
27
7312019 Environmental Quality in Connecticut 2011
httpslidepdfcomreaderfullenvironmental-quality-in-connecticut-2011 3048
Rivers + Reservoirs
Drinking Water
Most water companies delivered water that met health standards in 2011
Every public water utility submits monthly quality reports to the Department of Public Health This
indicator shows the percentage of monthly reports that demonstrate full compliance after weight-
ing the reports to account for the number of people served by each utility Though long-termproblems occur they are rare in large systems with the exception of the downturn in 2005 and
2006 caused by a few short-term problems in larger systems This indicator would show greaterfluctuations if the larger systems failed to deliver good water The most commonly encountered
contaminants include bacteria and byproducts of disinfection with an assortment of other chemi-cals and radioactive substances
28
7312019 Environmental Quality in Connecticut 2011
httpslidepdfcomreaderfullenvironmental-quality-in-connecticut-2011 3148
Human Health
Breast Cancer in Connecticut
Connecticut has the highest incidence of breast cancer among the 50 states buthas seen improvement since a peak in the late 1990s
Of every 100000 women in the stateaged 50 to 54 a fair number will dis-
cover each year that they have breast
cancer That number is depicted in
this graph (The Council presents dataon this one age group rather than on
the entire female population to con-trol factors such as changes in the av-erage age of the larger population
age 50 to 54 was selected as a repre-
sentative age group and is used ineach yearrsquos report) To minimize year-
to-year fluctuations groups of years
are averaged together (In otherwords each data point on the graphshows the number of new cases in a
single year but that year is actually the average of five years) While some breast cancers arelinked to genetic factors most are associated with non-genetic factors including diet reproductivehistory lifestyle and external agents
Breast Cancer as an Environmental Indicator
There are numerous studies connecting certain chemicals and other environmental factors tobreast cancer These factors if significant do not appear to be as important statistically as a
womans own reproductive history but it is important to note that breast cancer rates vary great-
ly in different parts of the country Among the 50 states Connecticut has the highest incidence of breast cancer this assessment is based on average incidence rates from 2004 through 2008 thelatest years for which 50-state data are available (Source North American Association of Central
Cancer Registries as reported by the American Cancer Society)
The rate of new cases showed improvement in 2000 through 2004 (using the average of the five
years) and has held steady for the period of 2005 through 2009 (the most recent years for whichConnecticut data are available)
29
7312019 Environmental Quality in Connecticut 2011
httpslidepdfcomreaderfullenvironmental-quality-in-connecticut-2011 3248
Human Health
Non-Hodgkins Lymphoma
The reasons for the steep increase in this cancer during the 20th century are notwell understood but exposures to specific pollutants and chemicals are potential
factors Since 1999 the picture has improved
Non-Hodgkins lymphoma is a cancer of the lymphatic system It begins in the lymphoid tissue
which contains lymphocytes white blood cells that help the body fight infections Lymphocytestravel throughout the body and can carry abnormal lymphocytes spreading the cancer The data
for this indicator are from the Department of Public Healthrsquos Tumor Registry which records all
known cancer cases in the state (Please see the note on the previous page under Breast Cancerin Connecticut about the use of the 50 to 54 age group) Non-Hodgkinrsquos lymphoma has increasedmarkedly since recordkeeping began The reasons are not well understood though the rise of Ac-quired Immune Deficiency Syndrome (AIDS) since the 1980s accounts for some cases Several
studies also cite environmental factors including exposure to diesel exhaust and cer-tain fertilizers pesticides and chemicals In 2000 through 2004 and again in 2005 through 2009
(the most recent years for which data are available) the annual rate of new cases showed im-provement
30
7312019 Environmental Quality in Connecticut 2011
httpslidepdfcomreaderfullenvironmental-quality-in-connecticut-2011 3348
Personal Impact
Driving Our Cars
Nearly every year for 25 years the average Connecticut resident drove moremiles than he or she did in the previous year That trend shifted into reverse in
2008
Driving a car truck or sport utility vehicle is one of the most environmentally harmful activities a
Connecticut resident will engage in personally Impacts are direct (air pollution oil leakage etc)
and indirect (causing demand for new roads) The Department of Transportation estimates thetotal miles driven each year in Connecticut Every year from 2000 through 2007 the averageConnecticut resident drove more miles than in previous years The reasons for the decades of in-
creasing auto use are complex and include the fact that most new development was accessibleonly by private vehicle A decline in miles driven began in 2008 and has continued to 2010 (thelatest year for which data are available) The Connecticut trend lags slightly the national trend
of auto use which showed a dramatic drop in 2007 The national trend towards less driving is be-ing led by the 16 to 34 year-old segment of the population
Personal Impact indicators illustrate trends in behavior or practices that can be expected to influence the condition of tomorrowrsquosair water land and wildlife
31
7312019 Environmental Quality in Connecticut 2011
httpslidepdfcomreaderfullenvironmental-quality-in-connecticut-2011 3448
Personal Impact
Taking the Bus
The average Connecticut resident took the bus slightly more often in 2011
The number of local and commuter bus trips taken by the average resident has changed very li t-
tle over the last 20 years Riding a bus is just one way to avoid the negative environmental con-sequences of driving a car Ridership data are collected by the Department of Transportation Ri-
dership rose about 6 percent in 2006 perhaps in response to high gasoline prices Since thenthere have been slight fluctuations In 2011 per capita ridership was the highest since 2001
Personal impact indicators illustrate trends in behavior or practices that can be expected to influence the condition of tomorrowrsquos air water land and wildlife
32
7312019 Environmental Quality in Connecticut 2011
httpslidepdfcomreaderfullenvironmental-quality-in-connecticut-2011 3548
Personal Impact
Compliance
Compliance with environmental regulations declined for the third year in a row
33
7312019 Environmental Quality in Connecticut 2011
httpslidepdfcomreaderfullenvironmental-quality-in-connecticut-2011 3648
Who is breaking Connecticuts environmental laws To find out the Council classified all 944 No-tices of Violation (NOVs) issued by DEEP during fiscal year 2011 The conclusions are summa-
rized in a staff memo and the types of violators are characterized in a series of charts The Coun-
cil does not have data on the publicrsquos perceptions of who the violators are but it senses from eve-ryday conversations that people suppose them to be factories utilities waste disposal facilitiesand perhaps pesticide applicators -- a perception that does not match the data The vast majority
of businesses where violations were found were small companies and most violations were re-
lated to the storage transport or distribution of petroleum The largest group by far were gasstations and convenience stores Only seven percent of NOVs were issued to manufacturers withmore than 20 employees -- fewer than the number that went to individual citizens
This indicator shows the approximate percentage of inspections performed by DEEP that foundthe inspected facilities in full compliance with pertinent environmental laws and regulations
(Monitoring data self-reported by permit holders are not included here) In 2010 and 2011 DEEPstepped up enforcement activity in its underground (petroleum) storage tank program and issuedmany more Notices of Violation (NOVs) than in previous years
The overall compliance rate rarely has been better than 90 percent Generally compliance withair quality regulations is higher than with waste and water regulations The average compliance
rate for all programs declined from 90 percent in 2008 to 89 percent in 2009 86 percent in 2010
and 83 percent in 2011 (The sharp downturn of 2002 was due to a surge in NOVs in a single airprogram Stage II Vapor Recovery at gas stations)
The number of inspections (not shown) declined between 1997 and 2007 increased in 2008 anddeclined again in 2009 through 2011 to its lowest number in 15 years Any relationship betweenthe number of inspections and rate of compliance is uncertain The relative stability of the com-
pliance rate in the face of ever-diminishing staff resources might be regarded as a success for the
DEEP However the failure of the state-- government businesses and residents together -- toadvance affirmatively toward the goal of full compliance is apparent
Personal Impact indicators illustrate trends in behavior or practices that can be expected to influence the condition of tomorrowrsquosair water land and wildlife
Notices of Violation (NOVs) are informal enforcement tools generally issued whenever DEEP detects one or more violations at a
facility They carry no financial penalty The recipient has 30 days to respond They can be issued for relatively minor or majorviolations in cases of the latter type the recipient might also receive an order which might carry a financial penalty NOVs typi-cally outnumber orders by a factor of five or more in any year NOVs are good indicators of trends in violations because almost allviolations found through inspections result in NOVs
Some inspections of compliance with air quality regulations are conducted by the Department of Consumer Protection pursuantto an agreement with DEEP these inspections also are used in calculating compliance rates
34
7312019 Environmental Quality in Connecticut 2011
httpslidepdfcomreaderfullenvironmental-quality-in-connecticut-2011 3748
Personal Impact
Recycling
Some municipalities and regional waste authorities have reported greater partici-pation in recycling programs since adopting single-stream recycling However
notable progress towards the statewide goal remains elusive
The General Assembly es-
tablished a goal of reduc-ing and recycling 40 per-cent of Connecticuts mu-
nicipal solid waste streamby the year 2000 (Sec22a-220(f)) That
goal was never met and
the consequences havebeen enormous Hundredsof thousands of tons of
waste were shipped out
of Connecticut in manyyears putting thousands of diesel trucks on the high-
ways for trips of many
hundred miles One conse-quence of this needless
truck traffic is the yearly
addition of 300000 ormore pounds of diesel pol-lutants into the air Anoth-
er consequence is finan-cial one ton that is re-cycled instead of burned or
landfilled can save a municipality hauler or resident from $40 to $93 according to a 2010 report of the Legislative Program Review and Investigations Committee
As total tonnage of waste has grown the percent that is recycled has not In 2006 DEEP amendedthe State Solid Waste Management Plan to include a goal of diverting 58 percent of Connecticutrsquosmunicipal solid waste stream from disposal by 2024 This would be accomplished through recy-
cling composting and waste reduction (such as use of lighter packaging material) If this goal ismet Connecticut will be able to manage all of its garbage without exporting it
DEEP reports suggest that the official figures slightly underestimate actual recycling volume Thegap in the graph reflects a lack of available data is for the years between 2004 and 2008
35
7312019 Environmental Quality in Connecticut 2011
httpslidepdfcomreaderfullenvironmental-quality-in-connecticut-2011 3848
Personal Impact
Climate Changers
The average resident is causing less carbon dioxide to be put onto the atmos-phere a result of lower petroleum consumption
Certain gases in the air func-
tion like the glass of a green-
house they allow the sunsenergy to pass through the
atmosphere to the ground
then trap the heat that ra-diates from the ground Thesegases are often called green-
house gases Worldwide a
build-up of greenhouse gases is contributing to the ongoing
rise in temperature Carbon
dioxide is not the only green-house gas nor even the mostpowerful but carbon dioxide
emissions are far greater in
quantity than the othersThe chart shows the total
emissions of carbon dioxide
emitted from burning of petroleum natural gas and coal in Connecticut divided by the population
A 2008 state law set two goals for reducing greenhouse gas emissions reduce statewide emis-sions to 10 percent below 1990 levels by 2020 and 80 percent below 2001 levels by 2050The chart above shows emissions per Connecticut resident not total emissions and there-
fore displays the goals after adjusting them to account for the larger population that is pro-
jected for 2020 and 2050 There are expected to be hundreds of thousands more people living inConnecticut in 2020 and 2050 so the average resident will have to work that much harder to re-duce carbon dioxide emissions if the statewide goal is to be met
Most human-generated carbon dioxide results from the combustion of fuels in houses businesses
power plants and vehicles and the last of these is the largest source Connecticut is more ener-
gy-efficient than the nation as a whole and the average Connecticut residents contribution toglobal climate change is less than the average Americans
Technical Note The Council has changed the data source for this indicator In previous years da-ta was available for all greenhouse gases not just carbon dioxide However to bring the chartmore up to date the Council switched to a source that includes carbon dioxide only Because the
other gases are emitted in small quantities the carbon dioxide data by themselves give an accu-rate picture of trends in greenhouse gas emissions The most recent data available even for car-bon dioxide alone are from 2009
36
7312019 Environmental Quality in Connecticut 2011
httpslidepdfcomreaderfullenvironmental-quality-in-connecticut-2011 3948
Personal Impact
Electricity at Home and Work
At Home
The average Connecticut resident used slightly less electricity at home in 2011
Thousands of households have been signing up annually to buy electricity gener-ated by renewable energy sources through the CTCleanEnergyOptions program
37
7312019 Environmental Quality in Connecticut 2011
httpslidepdfcomreaderfullenvironmental-quality-in-connecticut-2011 4048
Through 2009 the majority of Connecticut households did not purchase the mostefficient refrigerators or air conditioners This trend probably has not changedbut more recent data are not available and this indicator will be discontinued
At Work
For three years in a row Connecticut businesses have used electricity more effi-ciently to produce goods and services
38
7312019 Environmental Quality in Connecticut 2011
httpslidepdfcomreaderfullenvironmental-quality-in-connecticut-2011 4148
Efficiency at Home The average Connecticut household has been consuming less electricity since the peak
usage year of 2007 despite a brief reversal in 2010 According to the Connecticut Siting Council peak de-mand occurs during hot humid summer days due to air conditioner demand The increase in summertimeconsumption has had significant environmental consequences On the hottest days Connecticutrsquos base-loadpower plants are unable to meet the additional demand and older petroleum-fueled plants are brought online Because they are used sporadically many of these older plants are permitted to operate with no pollu-tion control equipment As a result state residents generate the most air pollution on the hottest summerdays when air quality is already bad
The vast majority of Connecticutrsquos electricity is generated from nuclear energy and the combustion of naturalgas oil and coal Hydropower solar and other renewable resources are small but growing sources of elec-tricity Each source renewable or not has its own negative environmental consequences Reducing thoseconsequences will require Connecticut households to use electricity much more efficiently Such efficiencycan be attained in part with ENERGY STAR appliances
Efficiency in the Kitchen In a typical home the refrigerator consumes more electricity than any otherappliance (Central air conditioning uses more but is not in everyonersquos home) To be labeled ENERGY STAR efficient a full-size refrigerator must operate using at least 20 percent less energy than the federal stan-dards for household appliances
ENERGY STAR appliance sales figures had been collected from voluntary reports by retailers to the ENERGY
STAR program Data on sales by state are no longer available For Connecticut 2009 data are the most re-cent available In 2009 38 percent of refrigerators bought by Connecticut consumers were ENERGY STARefficient a decrease from its peak (44 percent) in 2005 Sales trends for ENERGY STAR air conditioners al-so dropped in 2009 to 42 percent from 44 percent in 2008 Public surveys have shown conclusively thatmost people are aware of the ENERGY STAR label and what it means so reasons other than awareness mustbe addressed to boost ENERGY STAR labeled product sales and stem the ongoing waste of electricity inhomes
The ENERGY STAR program was created in 1992 as a joint effort of the US Environmental Protection Agen-cy and the US Department of Energy to identify and label energy efficient products By consuming lesselectricity ENERGY STAR products help to reduce air pollution and greenhouse gas emissions
The Connecticut Energy Efficiency Fund has partnered with Top Ten USA to help consumers find the mostenergy efficient appliances
Buying Cleaner Energy The CTCleanEnergyOptions program enables customers to sign up to pur-
chase electricity from renewable sources that include wind and low-impact hydroelectric (water power) Par-ticipation has grown steadily though the rate of increased participation is slowing There were 7 per-cent more participants in the program in 2011 than in 2010 The electricity that actually enters these housesis not necessarily from renewable sources The consumer who elects this option is paying for the generationof renewable electricity on the regional electric grid This reduces the amount of electricity that otherwisewould be generated by nuclear coal oil and natural gas-fired generating plants all of which create pollutionCTCleanEnergyOptions is a collaborative program administered by the Clean Energy Finance and InvestmentAuthority
Efficiency at work The bottom graph shows trends in the efficiency with which Connecticutrsquos economyuses electricity to produce goods and services Connecticuts businesses generally have been producing more
goods and services with less electricity State Gross Domestic Product (GDP) represents the total value of goods and services produced within the state in a single year Payment to employees constitutes about 60percent of the GDP In 2010 (the most recent data available) the Bureau of Economic Analysis put Connect-icuts GDP at $237 billion (current dollars) From 2009 to 2010 the GDP grew twice as fast as electricity con-sumption by Connecticuts industrial and commercial sectors Preliminary data for 2011 suggest that therewas no change in efficiency The long-term positive trend demonstrates that with advances in energy effi-cient technology it is possible for Connecticutrsquos economy to continue growing while using electricity moreefficiently
39
7312019 Environmental Quality in Connecticut 2011
httpslidepdfcomreaderfullenvironmental-quality-in-connecticut-2011 4248
Activities of the CEQ in 2011
June saw the 40th anniversary of the legislation that created the Council on Environmen-
tal Quality (CEQ) The Councils first meeting was held in the fall of 1971 Previous re-
ports looked back at some of those early events In the more recent past the Coun-
cils 41st year was one of its busiest and most productive
Research and Reports
The Council published Environmental Quality in Connecticut in April 2011 identifying
Routes to Progress that would move some of Connecticuts environmental indicators in
a positive direction
The Council is required to recommend legislation for identifying the deficiencies of exist-
ing programs and activities The Council published those in January 2012
From time to time the Council asks staff to prepare updates to previous reports Exam-
ples from 2011 include a staff memo on environmental regulation and the growth of
small businesses and a memo on the benefits to Connecticut of a new federal initiative to
reduce mercury pollution
Review of State Projects and Programs
In December 2010 the Council received complaints and inquiries about a state grant fora boat launch facility that was awarded without the environmental review and public no-
tice required by the Connecticut Environmental Policy Act (CEPA) After review the
Council advised the Commissioner of Energy and Environmental Protection of the appli-
cability of CEPA Ultimately the Department of Energy and Environmental Protection
(DEEP) declined to conduct an evaluation The Councils conclusion is summarized in a
2011 letter to one of the citizens who contacted the Council
Council research in 2010 found that one of the most polluting power plants in the state is
located in Hartford and is generally only used on the hottest days of the year when air
quality is already at its worst In December 2011 DEEP published notice of its intent torenew the air pollution permit for the plant Seeing several problems in the draft permit
as well as opportunities to improve and perhaps phase out use of the plant the Council
submitted detailed comments As of press time the permit renewal is still pending
40
7312019 Environmental Quality in Connecticut 2011
httpslidepdfcomreaderfullenvironmental-quality-in-connecticut-2011 4348
The Council continued to improve the Environmental Monitor to accommodate changes in
CEPA most recently to add public notices in cases where agencies decide not to com-
plete an environmental impact evaluation after it has conducted a public scoping
process
Citizen Complaints
As noted in reports of the past two years citizens of Haddam have spoken repeatedly to
the Council about contamination of land and groundwater that has existed in their com-
munity for more than 25 years Among many issues the apparent lack of remedial ac-
tion by one company was of particular note as the company had been required by the
DEEP to investigate the contamination and prepare a clean-up plan The Council decided
to follow this case in detail in order to learn more about the adequacy of existing laws
and programs In April 2010 the Council wrote to DEEP recommending enforcement ac-
tion against the company in question DEEP began legal action against the company in
late 2010 As of May 2012 there has been some study by the landowner as well as addi-
tional legal and bureaucratic action but to date no remediation
Along with many other parties the Council participated throughout 2011 in DEEPs ongo-
ing effort to transform remediation laws and programs The Councils close attention to
the Haddam case has yielded several insights into problems that need to be fixed
Aside from remediation the following are a sample of the many other complaints inves-
tigated in 2011
Dumping on a state university campus
Lack of notice of pesticide spraying on a railroad right-of-way as railroads are ex-
empt from the law governing notification of abutting homeowners
Pesticides and other contaminants in the wells of many homes in one neighbor-
hood
Apparent misinformation in an application for a proposed large drinking water
well with no effective consequences for providing wrong or misleading informa-
tion
Several matters relating to the siting of telecommunications towers including the
need to consider their effect on bird migration corridors preserved natural
areas and coastal areas
Pollution from outdoor wood furnaces both legal and illegal
The Council researched all of the complaints it received and offered recommendations to
the relevant state agencies where warranted Some problems such as illegal tree re-
moval on private property will require legislative action to correct
41
7312019 Environmental Quality in Connecticut 2011
httpslidepdfcomreaderfullenvironmental-quality-in-connecticut-2011 4448
The Word from Mansfield
The Council periodically holds public forums in different parts of the state to learn what
environmental topics are most on residentsrsquo minds The information presented at these
forums has been extremely useful to the Council
In July 2011 the Council heard from many citizens and municipal officials in Mans-
field They spoke about numerous environmental problems many involving the ac-
tions and responsibilities of state agencies Others suggested interesting directions for
the future of the state and its environment The Council investigated all of them and re-
sponded to each speaker Many investigations led to actions by state agencies andor
recommendations for legislation Read a complete summary of the speakers and the is-
sues they raised
Advice From the Public
In November of 2011 the Council released its required recommendations for corrective
legislation in draft form and invited the public to weigh in Citizens and organizations
spoke to the Council at a public forum held in the Legislative Office Building in Hartford
and many others submitted written comments Read a complete summary Their in-
sights technical advice and opinions proved a big help to the Council in preparing its fi-
nal recommendations which were submitted to Governor Dannel P Malloy and the Gen-
eral Assembly in January 2012
___________
In addition to the dozens who spoke at the public forums the Council heard from organi-zations at regular monthly meetings These included DEEP the University of ConnecticutNorth Stamford Concerned Citizens for the Environment Citizens for Clean GroundwaterRivers Alliance of Connecticut Sierra Club and others
Many people across the state expressed their concerns during 2011 The Council workedto address them all and truly appreciates the efforts people made to bring environmen-tal problems to light The Council looks forward to helping citizens and agenciessolve the challenges of 2012 and beyond
42
7312019 Environmental Quality in Connecticut 2011
httpslidepdfcomreaderfullenvironmental-quality-in-connecticut-2011 4548
The release of this edition of Environmental Quality in Connecticut marks 41 years of CEQ service
Council Duties
The duties of the Council on Environmental Quality are described in Sections 22a-11through 22a-13 of the Connecticut General Statutes
The Council is a nine-member board that works independently of the Department of Energy and Environmental Protection (except for administrative functions) The Chair-man and four other members are appointed by the Governor two members by the Pres-ident Pro Tempore of the Senate and two by the Speaker of the House The Councilrsquosprimary responsibilities include
1 Submittal to the Governor of an annual report on the status of Connecticutrsquos env i-ronment including progress toward goals of the statewide environmental planwith recommendations for remedying deficiencies of state programs
2 Review of state agenciesrsquo construction projects3 Investigation of citizensrsquo complaints and allegations of violations of environmental
laws
In addition under the Connecticut Environmental Policy Act (CEPA) and its attendantregulations the Council on Environmental Quality reviews Environmental Impact Evalua-tions that state agencies develop for major projects The Council publishes the Environ-mental Monitor the official publication for scoping notices and environmental impactevaluations for state projects under CEPA The Environmental Monitor also is the officialpublication for notice of intent by state agencies to sell or transfer state lands
43
7312019 Environmental Quality in Connecticut 2011
httpslidepdfcomreaderfullenvironmental-quality-in-connecticut-2011 4648
CEQ Members
Barbara C Wagner (Chair)Resident of Glastonbury Attorney with law office in Glastonbury specializing in commer-cial and residential real estate Executive Director Wind Hill Community Farm Glaston-bury Member Glastonbury Town Council 2000-2010 Co-Founder and Board Member of
Town Center Initiative addressing walkability issues in Glastonburyrsquos center Board of Trustees Diamond Lake Land Trust Former member State Open Space and WatershedLand Acquisition Board
M Howard BeachResident of Simsbury Conservation amp Zoning Compliance Officer Planning AnalystTown of Simsbury Member Simsbury Conservation Inland Wetlands Commission from1980 to 2004 Chairman from 1994 to 2004 Member Board of Directors The Farming-ton River Watershed Association 2004 to 2006 Life Member and past Board MemberSimsbury Land Conservation Trust Founding Member Farmington Valley BiodiversityProject Member Town of Simsbury Open Space Committee 1999 to 2004 Member CTDevelopers Council Member Government Affairs Committee Simsbury Chamber of
Commerce In 2004 completed a Masters Degree in Environmental Law at Vermont LawSchool
Janet P BrooksResident of Middletown Attorney with law office in East Berlin with a practice in envi-ronmental administrative and land use law Member of the Connecticut Bar AssociationPlanning amp Zoning Section and Environment Section Co-author of Connecticut Environ-mental Protection Act Volume 15 of the Connecticut Practice Series published by Thom-son West Formerly Assistant Attorney General in the Environment Department of theConnecticut Attorney Generalrsquos (AGs) Office for 18 years enforcing the statersquos environ-mental laws running the gamut from noise odor water pollution air pollution pesticides
to habitat protection and preservation of land While at the AGrsquos Office coordinated thewetlands appeal practice and developed the legal training for wetlands commissioners forDEEPrsquos annual training Recipient of 1984 German Marshall Fund grant to study the ef-fect of citizen participation on hazardous waste clean-ups in four European countriesBased on those experiences authored a chapter published in Americarsquos Future in Toxic Waste Management Lessons from Europe Staff Attorney for five years at the Connecti-cut Fund for the Environment Inc representing citizens groups in administrative andcourt proceedings Began practice of law assisting the Middletown City Attorney in thecityrsquos opposition to the utility companyrsquos burning of PCB waste oil with in the city bounda-ries
Liz ClarkResident of West Hartford
44
7312019 Environmental Quality in Connecticut 2011
httpslidepdfcomreaderfullenvironmental-quality-in-connecticut-2011 4748
Bruce R FernandezResident of Farmington Retired after 18 years owning and managing a software busi-ness serving insurance companies and independent agencies Prior to that was a con-sulting engineer specializing in energy efficient power plants and paper mills Vice-President of Operations of a small utility serving Bronxville NY and a jet engine de-signtest engineer Masters degrees in Engineering and Management Served in UnitedStates Army Corps of Engineers as small unit commander served in Vietnam and tenyears in Army Reserves Member Board of Directors Farmington Land Trust
Karyl Lee Hall Resident of Branford Attorney with the Connecticut Legal Rights Project Formerly withMurtha Cullina the Connecticut Fund for the Environment and Connecticut Legal Servic-es Co-Chair Branford Conservation Commission Co-chair Scenic Roads AdvisoryCommittee for Routes 146 and 77 Member Advisory Board Branford Land Trust Vice
President Citizens for Branfordrsquos Environment 2002-2009 Connecticut Bar AssociationPro Bono Service Award 2003 Former Co-chair State Implementation Plan [for AirManagement] Revision Advisory Committee
Richard Sherman Resident of Chaplin Architectural designer and construction manager of earth shelteredpassive solar and energy efficient residences Former CEQ Representative to the Route 6Advisory Committee (during previous term on CEQ) Charter Member Transit Alliance of Eastern CT and Citizens for a Sensible Six Former Organizer the Progress and EquityPartnership Member of CEPA Working Group League of Conservation Voters of CTFormer President Northeast Chapter of ACLU-CT Board of Directors Member of PeoplesAction for Clean Energy (PACE) and Northeast Sustainable Energy Association (NESEA)Former Chair Mansfield Transportation Advisory Committee Former President Mans-field Commonground Member Mansfield Planning and Zoning Design Review PanelFormer Chair Mansfield Democratic Town Committee Host and producer of the radio
show A Distant Shore on WHUS (917 FM Storrs) Former Public Affairs Director of WHUS Stopover host American Tour dSol solar electric car race
Norman VanCor(member through April 2012)Resident of Harwinton Owner of Buy Safe Home Inspection LLC and Mizzentop Antiqui-ties Served in United States Marine Corp in Vietnam Awarded the Navy Cross Vietnam-ese Cross of Gallantry and other decorations One of first ten inductees to CT VeteransHall of Fame Former Director Yankee Energy in sales marketing government relationscommunications Founding member and President Emeritus Quinnipiac River WatershedAssociation Former member Rivers Advisory Committee Former Chairman SouthingtonConservation Commission Former host of radio program on environmental topics For-
mer President Southington Water Works Former member Board of Directors of Opera-tion Fuel Active Pheresis donor at American Red Cross with over 37 gallons of wholeblood and platelet donations Former Volunteer Hunter Safety Instructor for the DEEPConservation Education Program Certified Master Gardener
45
7312019 Environmental Quality in Connecticut 2011
httpslidepdfcomreaderfullenvironmental-quality-in-connecticut-2011 4848
Acknowledgments
The Council appreciates the assistance of the many people in the Departments of Agri-culture Energy and Environmental Protection Transportation and Public Health and theConnecticut Siting Council who provided data Researchers at the Center for LanduseEducation and Research (CLEAR) at the University of Connecticut provided very valuable
data
The Council especially thanks the many citizens businesses and organizations who of-fered information and viewpoints to the Council throughout the year
The Council also appreciates the work of its Executive Director Karl Wagener and Envi-ronmental Analyst Peter Hearn in drafting this report for review by the Council and pre-paring the final version for publication
The Council notes the valuable contributions of Eric Walsh an intern from the Universityof Connecticut Law School and Avery Yoshimine an intern from the University of Con-necticut their research contributed greatly to this report
Contact the CEQ
We would like to hear from you Does this report give you the information on Connecticuts environment that you need Is
there something missing
79 Elm Street
Hartford CT 06106
Phone
860-424-4000
(messages can be left 24 hours a day)
Fax
860-424-4070
karlwagenerctgov

7312019 Environmental Quality in Connecticut 2011
httpslidepdfcomreaderfullenvironmental-quality-in-connecticut-2011 948
Life among the trees also carries economic costs and environmental risks Residents payto have power restored and the transmission system improved after each storm Somecosts associated with environmental risks are paid only indirectly Research shows forexample that invasive exotic species follow low-density housing development through-out New England Invasive species pose the single biggest threat to Connecticuts naturalecosystems but residents have never paid significant sums for statewide prevention andcontrol efforts (They do pay costs indirectly for some species unabated spread as anexample dense infestations of invasive vines contribute to utility line destruction duringstorms) Conservation organizations agencies and individuals have worked hard and ef-fectively to reduce the threat of some highly destructive species but the state has yet tomobilize against the threat of invasive species in a comprehensive way
The Future State
The pace and pattern of land development will determine the future of Connecticuts airwater and life A sudden spurt in sprawl would yield more water pollution more air pollu-tion more invasive species and a host of other negative outcomes
A 2009 report of the US Forest Service predicts large-scale conversion of Connecticuts
privately-owned forest land to housing and other types of development but that has yetto be shown It is true that any development in Connecticut that is not redevelopment islikely to convert privately-owned forest land However very recent census data showmore population growth in developed areas than in rural or exurban towns What trendwill dominate Connecticuts future
Connecticut generally appears to be in a steady state though one with an aging popula-tion and rising temperatures What a Connecticut resident sees here today is likely to bewhat he or she sees here 15 years from now barring an unforeseen boom in sprawl Asthe Council has noted in previous reports most Connecticut residents today see an envi-ronment little changed from the time they arrived a fact especially true for people 25-
years-old or younger The exceptions are sudden and tend to be negative to the behold-er such as when a familiar forest or farm suddenly disappears a telecommunicationstower appears on a nearby hill or a black bear destroys the backyard bird feeder
It is difficult to foresee strong forces that will alter Connecticuts development patternsor the indicators in this report Even a best-case scenario of vigorous economicgrowth built upon previously-developed properties is unlikely to move the indicators sub-stantially Growth that is based largely on consumption of undeveloped lands on theother hand would have many negative consequences but that outcome can be avoidedthrough good policy With the states environmental indicators showing only minor upsand downs and with a fairly stable though vulnerable economy and landscape delibe-rate actions will need to be taken before residents see improvements These include the
following
7
7312019 Environmental Quality in Connecticut 2011
httpslidepdfcomreaderfullenvironmental-quality-in-connecticut-2011 1048
Reduce water pollution from developed areas This means low-impact devel-opment techniques for new development and a long campaign of retrofittingtowns and cities with green infrastructure The new permeable sidewalks encir-cling the State Capitol should be considered normal not exceptional
Plan for homes and jobs near mass transit As documented in many placesgood transportation and economic development policies can guide and stimulate
development where people can live outside the automobile
Train municipal regulators Volunteer municipal commission members makethousands of regulatory decisions annually Training of these members is a low-cost highly effective component of the environmental protection arsenal buttraining needs are chronically underserved
Invest The cost of regulating pollution is generally covered by the regulated par-ties but who aside from sportsmen and park patrons are paying for the man-agement of the states natural resources For the most part nobody Yet the up-side potential is great residents see $38 of economic activity for each dollar thestate spends on parks
Embrace the Nature State (and Keep Conservation Alive) If residents enjoyliving among trees observing wildlife and working locally to conserve land as
they evidently do state policies should honor that choice However recent reports from the Connecticut Audubon Society and others express doubt that Connecti-cuts high level of volunteer conservation commitment will endure as many child-ren lack extended exposure to wild nature Connecticut must never let a lack of knowledge and enthusiasm erode its status as the Nature State
Connecticutrsquos environmental indicators begin on the next page
8
7312019 Environmental Quality in Connecticut 2011
httpslidepdfcomreaderfullenvironmental-quality-in-connecticut-2011 1148
Air
Good Air Days
Every Connecticut resident breathed good air on 342 days in 2011 eight morethan in 2010
A Good Air Day is a day when every monitoring station in the state records satisfactory air quali-
ty ldquoSatisfactory air qualityrdquo is defined here as air that meets the specific health-based ambient
air quality standards for all of the following 6 pollutants sulfur dioxide lead carbon monoxideparticles nitrogen dioxide and ground-level ozone
Connecticutrsquos goal is to have air that meets health-based standards for all pollutants Violationsof health-based air quality standards have been eliminated for all pollutants except ground-level
ozone and fine particles On 13 summer days concentrations of ground-level ozone violated theozone standard that protects human health The standard for fine particles was violated on 10
days in the fall and winter an unusually high number One steamy July day saw the standardsviolated for both ozone and fine particles Not every town experienced bad air on the same days
Danbury was the location with the most bad air days (11 days total five bad ozone days five bad
particle days and one day that was bad for both ozone and particles)
Ozone is created when nitrogen oxides and organic compounds in the air react in the presence of
sunlight Weather is a big factor in year-to-year fluctuations Motor vehicles remain a major
source of ozone-forming emissions despite improvements in tailpipe standards Much ground-level
ozone originates in states to the west of Connecticut
In typical years cities and towns in the western and coastal regions of the state see the most bad
air days In 2007 and in 2009 however inland towns had more The historical pattern returned in2010 and 2011 with coastal towns having the most bad ozone days Groton and Westport had thehighest frequency in 2011 (nine days each)
9
7312019 Environmental Quality in Connecticut 2011
httpslidepdfcomreaderfullenvironmental-quality-in-connecticut-2011 1248
Fine particles such as those found in smoke and haze are 25 micrometers in diameter andsmaller These particles can form when gases emitted from power plants industries and automo-
biles react in the air Violations of the health standard occur mostly in summer and winter rarely
in spring and fall The fall of 2011 was a notable exception as generators wood stoves and fire-places put into use after the October 29 snowstorm yielded very high levels of fine particles insome cities and towns The monitoring stations in the northern half of the state were themselves
knocked out but the extraordinarily high levels recorded in Springfield Massachusetts -- more
than twice the limit that protects human health -- undoubtedly extended into Connecticut Most of Connecticut meets the health standard for fine particles as that standard allows the air to exceedthe numerical limit for a few days each year
Technical Note The federal government modified the standards for fine particles in December2006 and for ground-level ozone in early 2008 The chart above was redrawn each time to illu-strate the states historical pattern of good air days by applying the new stricter standards to all
previous years The federal government is again reviewing the standards for particles and
ground-level ozone
10
7312019 Environmental Quality in Connecticut 2011
httpslidepdfcomreaderfullenvironmental-quality-in-connecticut-2011 1348
Air
Clearing the Air
Average Levels of Air Pollution
Connecticutrsquos air was slightly more polluted in 2011 than in 2010 breaking afive-year winning streak
The chart shows the average amount of pollution in Connecticuts air for each year Six air pollu-tants -- sulfur dioxide lead carbon monoxide particles nitrogen dioxide and ground-level ozone-- are measured across the state by DEEP At the end of every year the Council expresses the av-erage level of each pollutant on a numerical scale where zero equals no pollution and 100
represents the ldquounhealthfulrdquo level of the specified pollutant The Council then takes this annualnumber for each of the six pollutants and averages them to yield the single index value on thisgraph
In 2011 all of the pollutants (excluding lead) increased slightly for the first time since 2005 Le-
vels of lead in the air have dropped so low that they barely register in this indicator In 2010carbon monoxide was the only pollutant to increase from the previous year
The increase in pollution in 2011 is partially ascribable to the large number of generators woodstoves and fireplaces that were put into use following the October snowstorm Yearly weathervariations also cause fluctuations in air quality
Technical Note A new monitoring station was added in Litchfield in 2010 To maintain an accu-
rate comparison among years data from this station will not be added until there are enoughyears to provide a trend At that time all the earlier years will be re-calculated
11
7312019 Environmental Quality in Connecticut 2011
httpslidepdfcomreaderfullenvironmental-quality-in-connecticut-2011 1448
Farm Forest Wetland
Preserved Land
Connecticuts goal is to preserve 21 of the states land area by 2023 but no-body knows how much land has actually been preserved
State law (CGS 23-8(b)) sets a goal of conserving 21 percent of Connecticutrsquos land area TheGreen Plan Connecticutrsquos official land conservation plan establishes 2023 as the target dateThat goal includes conservation land owned by towns and cities land trusts and other nonprofitorganizations water utilities and the state
The same law sets a goal (10 percent of Connecticuts land area) for state ownership of land forparks forests and wildlife areas Records of state-owned lands are accurate and are reported
here
In 2011 DEEP preserved about 575 acres State grants helped municipalities and land trusts ac-
quire an additional 1600 acres This pace is not nearly sufficient to reach the states goals
Many additional acres probably thousands in some years are preserved by municipalities and
land trusts without state grants but this information is not reported to the state The Council de-termined that previous state estimates of the acreage owned by municipalities and nonprofit land
trusts were inaccurate Those estimates which were reported in previous editions of Environmen-tal Quality in Connecticut are no longer included in this report
The absence of an accurate inventory of protected land in Connecticut is a serious deficiencyDEEP has been collecting data from municipal records in a sequential fashion for 12 years if that
effort is ever completed the earliest-collected data will be well out of date To make land preser-vation more strategic and cost-effective Connecticut needs a reliable and up-to-date registry of the states protected lands Public Act 12-152 could eventually lead to an accurate inventory
12
7312019 Environmental Quality in Connecticut 2011
httpslidepdfcomreaderfullenvironmental-quality-in-connecticut-2011 1548
Farm Forest Wetland
Forest
After a century of growth and relative stability Connecticutrsquos forests -- especiallythe most valuable core forests -- have been shrinking for two decades
Most of Connecticutrsquos forests were cleared for agriculture and industry in the 19th century andthen allowed to regenerate From 1960 to 1980 the overall acreage of forest did not change
much even with the rapid spread of roads housing and commercial development According tothe US Forest Service the spread of forests on abandoned farms equaled the conversion of fo-
rested land to other uses The late 20th century brought a change forest is now declining
This indicator shows the total acreage of forests in Connecticut The forests are divided into core
forests and other forests Core forests are at least 300 feet from non-forest development such as
roads buildings and farms Forests that are fragmented or divided by roads and buildings servesome forest purposes but are not fully-functioning forest ecosystems Fragmented forests areknown to provide substandard habitat for many species of wildlife and in many cases less oppor-
tunity for hunting and other types of recreation
Even as the total acreage of forests might fluctuate over years or decades the extent of core fo-rests will always show a decline except in rare instances where roads or developments might be
abandoned and reclaimed by forests
Technical Note The definition and measurement of core forests is done by the Center for LandUse Education and Research (CLEAR) at the University of Connecticut as part of the Connecticutrsquos
Changing Landscape Project (CCL) The Council finds these data derived from CLEARs analysis of satellite imagery to be the most accurate data available Satellite data is examined by CLEARevery few years this indicator includes the most recent data available (2006)
13
7312019 Environmental Quality in Connecticut 2011
httpslidepdfcomreaderfullenvironmental-quality-in-connecticut-2011 1648
Farm Forest Wetland
Farmland
In 2011 Connecticut preserved 1975 acres of farmland -- the best year for pre-servation since 1993 and close to the 2000-acre annual rate needed to reach
the states goal
The top chart shows the acreage of land being farmed in Connecticut The bottom chart shows thecumulative acreage preserved by the Connecticut Department of Agriculture
14
7312019 Environmental Quality in Connecticut 2011
httpslidepdfcomreaderfullenvironmental-quality-in-connecticut-2011 1748
To preserve land for future agricultural use the Connecticut Department of Agriculture purchasesthe development rights to farmland from volunteer sellers This keeps the land in private owner-
ship with severe restrictions on future nonagricultural development Over 1300 acres were pre-
served each year from 2008 through 2010 In 2011 16 farms participated preserving 1975acres Funds are mostly from state bonding and the Community Investment Act
Connecticuts farmland preservation goal is based on the amount of land needed for food produc-tion Mathematical projections of the current preservation rate show the goal being reached in the22nd century but in reality there will not be that acreage of agricultural land remaining in the
state by the end of the current century if the recent rate of loss continues Preservation of at least
2000 acres annually should result in success
This indicator does not show agricultural land acquired for preservation by municipalities and
nonprofit organizations Several towns purchased farms in recent years with no state assistanceand those acres are not reported or recorded at the state level Along with a central registry of preserved open space Connecticut needs a registry of preserved farmland to help state agencies
and other organizations preserve land strategically
Technical Note Until 2008 the uppermost chart showed the total acreage of land in Connecticutfarms as counted using survey data by the US Department of Agriculture (USDA) The Council
has found a superior data source in the University of Connecticuts Center for Land Use Educa-
tion and Research (CLEAR) CLEAR staff analyzes satellite imagery to measure the actual area of fields pastures orchards and vineyards In contrast the USDA data counted all land in farmseven that which was not used for agriculture CLEAR analyzes new satellite imagery every few
years the most recent imagery is from 2006
15
7312019 Environmental Quality in Connecticut 2011
httpslidepdfcomreaderfullenvironmental-quality-in-connecticut-2011 1848
Farm Forest Wetland
Inland Wetlands
Towns and cities permitted disturbance of about 70 acres of wetlands the fewestin four years
Local commissions reduced the wetlands disturbance caused by the averagepermit
16
7312019 Environmental Quality in Connecticut 2011
httpslidepdfcomreaderfullenvironmental-quality-in-connecticut-2011 1948
The top graph shows the acreage of wetlands disturbed by development ldquoDisturbedrdquo wetlands
are those affected directly by human activity which can range from total destruction (when the
wetlands are filled and built upon) to conversion from one type to another (when for example ashallow swamp is dredged to create a pond) There is no specific goal for wetlands conservation
The top graph also shows the acres of wetlands created or otherwise enhanced by humans No
attempt is made here to evaluate the success of the created wetlands or their value relative to
the natural wetlands that might have been altered In fact the created category includes somany diverse activities that the number has no real meaning The Council intends to drop theacres created category in next years report (Readers are invited to comment on this proposal)
The lower graph shows the area of inland wetlands affected by the average permit issued by mu-
nicipalities Use of the average permit shows trends irrespective of the changes in the number of applications that are caused by economic trends
In 2010 and 2011 more than 25 percent of municipalities failed to report their data to DEEP asrequired by state law
Inland wetlands are estimated to cover about 450000 acres or 15 percent of Connecticuts sur-
face More than 95 percent of the development activity in and around wetlands is regulated bymunicipalities with minimal oversight or supervision by the DEEP In October 2008 the Councilpublished Swamped a special report that analyzed performance of the states inland wetlands
program including training State law requires every municipal wetlands agency to have at leastone member or staff person complete DEEPs comprehensive wetlands training program but
many municipalities do not comply with this requirement A thorough statistical analysis foundthat cities and towns that possessed at least one trained member or staff person allowed less
wetlands disturbance than cities and towns that were not in compliance with the training require-ment
Technical Notes The results for 2010 and 2011 should be considered preliminary due to the high
percentage of non-reporting towns The Council adjusts the reported data to account for the non-
reporting towns but inaccuracies are inevitable (The Council is confident that the statistical ad- justment is reasonable because Swamped also examined differences in performance betweentowns that report to the DEEP and towns that do not report and confirmed that non-reporting
towns are similar to reporting towns in the average amount of wetlands destruction they per-
mit) Also for 2011 two 100-acre projects were not included in the totals one involved invasivespecies removal from a Manchester wetland and the other was a drawdown of a pond in Bethle-hem Both were of a scale that distorted typical wetlands activity data
17
7312019 Environmental Quality in Connecticut 2011
httpslidepdfcomreaderfullenvironmental-quality-in-connecticut-2011 2048
Sound + Shore
No Swimming at the Beach
Heavy rain caused the average coastal city and town to close its beaches manymore days than usual
The Council adds up the number of days that each coastal city and town closed one or more of its
public beaches and calculates an average for all the cities and towns with beaches The cities andtowns in the western half of the state usually have a higher frequency of closings
Yearly variations generally are products of rainfall patterns and unusual incidents such as sewer-line ruptures The storms of 2011 (most notably Tropical Storm Irene) resulted in many closings
as many beaches were awash in contaminated runoff raw sewage and debris
In typical years about half of beach closings are due to tests showing elevated levels of bacteriaPolluted surface runoff or sewage overflows after rainstorms are the most common sources of the
bacteria Most other closings are precautionary as health officials must assume that heavy rains
will wash polluted runoff andor overflow from combined sanitarystorm sewers
Connecticutrsquos goal is to eliminate beach closings caused by discharges of untreated or poorlytreated sewage a common cause of elevated bacteria levels
18
7312019 Environmental Quality in Connecticut 2011
httpslidepdfcomreaderfullenvironmental-quality-in-connecticut-2011 2148
Sound and Shore
Piping Plovers on the Beach
A record year as more than 100 of these threatened shorebirds nestedon coastal beaches from Westport to Stonington
Piping Plovers are small shorebirds that nest on sandy sparsely-vegetated beaches Human intru-sion storm tides and predators frequently destroy nests Fifty-two pairs nested in 2011 nine
more than in 2010 Storms and tides destroyed quite a few of their nests
Although the number of plovers on Connecticuts beaches now exceeds the goal that was set in
the 1980s it continues in threatened status at the state and national level Nesting adults arecounted and in most cases protected every spring by the US Fish and Wildlife Service DEEP andvolunteers working with the Connecticut Audubon Society The Nature Conservancy Audubon
Connecticut and local organizations such as the Friends of Milford Point and Stratford Great Mea-
dows National Wildlife Refuge The protections afforded these plovers also benefit other nesting
species including American Oystercatchers and Least Terns which are also a threatened speciesin Connecticut Since protection and monitoring efforts began in 1984 nesting success has im-proved resulting in more returning adults in subsequent years Yearly variations can occur when
adult birds move from one state to another
19
7312019 Environmental Quality in Connecticut 2011
httpslidepdfcomreaderfullenvironmental-quality-in-connecticut-2011 2248
Sound + Shore
Life in Long Island Sound
About half of the fish species in Long Island Sound are increasing
The lobster population of Long Island Sound has failed to recover
DEEP surveys marine fish squid and lobster populations every spring and fall by towing nets froma research vessel Data for 2010 are absent because repairs to the research vessel John Dempsey precluded the fall Long Island Sound trawl survey
20
7312019 Environmental Quality in Connecticut 2011
httpslidepdfcomreaderfullenvironmental-quality-in-connecticut-2011 2348
The top graph shows general trends in the collective populations of lobster squid and 38 speciesof fish The number displayed for any year is the percentage of these 40 species that were above
their long-term average populations In 2005 through 2009 fewer than half of these species were
as common as they were in the 1980s and 1990s The surveys of 2011 showed modest improve-ment Half of the species were as common as in prior years The species selected for this analy-sis reflect a bias in favor of managed species that have high commercial and recreational value
A separate analysis (not shown) of the geometric mean of the weight of all the fish taken per tow
(regardless of species) was the lowest since 2003 This measure may better reflect the overallhealth of the Sound as a habitat The Council is considering adding this measure in future years
Scientists are unsure of the reasons behind the declines and fluctuations of recent years Onepossible explanation for the decline of some prey species is the population growth of striped bass
and other predators Over recent years some colder-water species such as windowpane flounder
and little skate have declined as warmer-water species such as scup and summer flounder haveincreased along with the average yearly temperature of the Sound The illustration at the bottom
of this page lists some-warm water species that are on the increase with some cold-water speciesthat are decreasing
The fall 2011 trawl results for lobster were the lowest ever recorded It is the nadir in a well-documented decade-long decline in the lobster population that also is evident in a dramatic dropin commercial lobster landings during the same period (not shown) Researchers are focusing on
a combination of four possible causes for the dramatic downturn in lobster populations since
1999 disease changes in water quality changes in climatic conditions and human impacts to theSound Research to date suggests that a trend toward warmer water temperatures is an impor-tant factor in the decline of lobsters
Declined through 2011 Increased through 2011
Windowpane Flounder
(shown)
Little Skate
Scup
Atlantic Moonfish (shown)
Summer Flounder
21
7312019 Environmental Quality in Connecticut 2011
httpslidepdfcomreaderfullenvironmental-quality-in-connecticut-2011 2448
Sound + Shore
Pollution in Long Island Sound
The amount of nitrogen dumped into Long Island Sound and its tributaries in-creased slightly in 2011
The area of the Sound with adequate levels of oxygen declined slightly from2010
22
7312019 Environmental Quality in Connecticut 2011
httpslidepdfcomreaderfullenvironmental-quality-in-connecticut-2011 2548
The area of shellfish beds unconditionally approved for harvesting declined in2011
Hypoxia is a condition in the water when oxygen levels are too low to fully support desirableforms of life including fish and lobsters Hypoxia occurs when the nitrogen in pollution stimulatesexcessive growth of aquatic plants which die and get consumed by oxygen-using bacteria Con-
necticuts goal is to ldquoeliminate the adverse impacts of hypoxia resulting from human activi-
tiesrdquo Hypoxia occurs predominantly in the western portions of the Sound Weather greatly influ-ences hypoxia making year-to-year changes less important than long-term trends
To reduce the nitrogen inputs that cause hypoxia Connecticut and New York adopted a compre-hensive management plan in 1994 and built upon that plan with an expanded agreement in2002
The top graph tracks the amount of nitrogen discharged to the Sound and to major rivers by 79
sewage treatment plants two large coastal industrial facilities and a small group of industrialsources in the Naugatuck River watershed Connecticutrsquos investments in nitrogen-removal tech-nology from many of those plants have been successful
Large uncontrolled quantities of nitrogen enter Long Island Sound when rainfall carries fertilizer
from residents lawns along with the pollutants that have accumulated on pavement Overall
Connecticutrsquos share of the total nitrogen pollution in Long Island Sound is about one-third and
New Yorkrsquos is two-thirds In 2001 the federal Environmental Protection Agency approved the New
York and Connecticut joint plan for implementing a Total Maximum Daily Load (TMDL) The TMDLis the maximum amount of pollutants that can be discharged while still allowing water quality
standards to be attained
The Connecticut Department of Agricultures Bureau of Aquaculture and Laboratory Servic-
es monitors shellfish beds and classifies them according to their potential for the harvesting of healthful uncontaminated shellfish The third graph above shows the acreage of shellfish bedsthat are approved for harvesting because they are generally unaffected by pollution (Even areasthat are approved may be closed as a precaution following exceptional rainfalls of three or more
inches) Aquaculture experts have suggested that the annually increasing volume of runoff from
lawns and pavement is flowing further into the Sound resulting in the shrinkage of the shellfishbeds that are fully approved
23
7312019 Environmental Quality in Connecticut 2011
httpslidepdfcomreaderfullenvironmental-quality-in-connecticut-2011 2648
The decline in approved shellfish beds is not attributed to the storms of 2011 it preceded themwith the reclassification of areas in accord with the bacterial standards model of the National
Shellfish Sanitation Program The model allows designation without sampling based on dilution
calculations in areas where there is recreational or commercial activity
Technical Notes The middle chart above shows the area of Long Island Sound that had adequateoxygen levels throughout the year The sampling area (2700 square kilometers) does not includethe whole Sound (3400 square kilometers) The areas not sampled are shallow waters (less than
two meters deep) near shore which generally do not experience hypoxia embayments the east-
ern end of the Sound which is not expected to experience hypoxia and an area in the far west-ern end which probably becomes hypoxic in most years
Hypoxia was redefined by DEEP in 2011 Areas of the Sound are now considered hypoxic where aliter of water contains less than 30 mg of dissolved oxygen This is the criterion that was used
prior to 2004 From 2004 through 2010 DEEP used 35 mgl as the determining level
The threshold was returned to the 30 level in 2011 to be consistent with the definitions used byNew York and the Long Island Sound Study For this years report data for all previous years
were recalculated to show the area of the Sound having adequate oxygen under the current defi-nition (that is at least 30 mgl)
24
7312019 Environmental Quality in Connecticut 2011
httpslidepdfcomreaderfullenvironmental-quality-in-connecticut-2011 2748
Rivers and Reservoirs
No Swimming in the River
About 80 miles of rivers receive overflows of raw sewage during storms
Throughout the state only 11 of rivers and streams are classified as beingclean enough for swimming and other water contact sports
25
7312019 Environmental Quality in Connecticut 2011
httpslidepdfcomreaderfullenvironmental-quality-in-connecticut-2011 2848
Top Chart In fourteen Connecticut cities and towns sanitary sewers were built in combinationwith storm sewers During storms these systems carry more water than their treatment facilities
can handle and a combination of storm water and untreated sewage overflows directly into the
rivers and Long Island Sound Several of these combined sewer systems have been completely orpartly separated since 1990 reducing the impact of untreated sewage on rivers The improve-ment in 2001 can be attributed to the completion of projects in the towns of Waterbury and Nau-
gatuck In 2005 the Jewett City project was completed eliminating overflows of raw sewage into
the Quinebaug River
Connecticuts goal is to eliminate the effects of raw sewage discharges from combined sewer sys-tems Progress is slow because of the extraordinary expense of separating the sewers
The pie chart illustrates the percentage of the states rivers that fully support recreation This isan estimate based on sampling and statistical analysis by the Department of Energy
and Environmental Protection (DEEP) Most streams are not monitored directly The current figure
of 11 percent is from the Integrated Water Quality Report submitted by the DEEP to the federalgovernment on May 31 2011 The 2008 edition of that report estimated the percentage to be 15
Theres Water in the River
(Better 40 Years Late Than Never)
June 23 1970 ldquoThe Water Resources Commission with
the advice of the Board of Fisheries and Game should be
authorized to establish and regulate minimum stream
flowshellipFlows must be tailored to fit the hydrological and
ecological character of each stream as established by the
minimum demands of aquatic life Authority should include
the power to augment flow from storagehelliprdquo Governorrsquos Committee on Environmental Policy Recommendation 48
December 12 2011 The Department of Energy and Envi-
ronmental Protection obtains final approval for proposed
Stream Flow Standards and Regulations specific to the hy-
drological and ecological character of each stream and re-
quiring release from storage under certain conditions to
augment flow
26
7312019 Environmental Quality in Connecticut 2011
httpslidepdfcomreaderfullenvironmental-quality-in-connecticut-2011 2948
Rivers + Reservoirs
Bald Eagles
Bald eagles have come back to Connecticut even to cities The chemical pollu-tants that interfered with their reproduction have since been controlled and large
trees along fish-rich rivers offer good nesting sites
Bald eagles stopped breeding in Con-necticut in the 1950s The species de-
clined throughout the lower 48 states
and was declared endangered in 1967
A variety of environmental conditionsharmed the eagle including the wide-
spread use of certain chemicals
(chlorinated hydrocarbons) that accu-mulated in its prey (mostly fish) Whenthose chemicals were banned and pol-
luted waterways were improved thebald eagle was able to reproduce againYoung eagles were reintroduced into
nearby states in the 1980s and a pair
found their way to Connecticut in 1991and successfully raised a family in
1992 Many more pairs have since
found acceptable nesting habitat onland protected by government and pri-vate landowners including utility com-
panies DEEP monitors the eagles withthe assistance of the Bald Eagle StudyGroup and other volunteers
The federal government removed the bald eagle from its list of threatened and endangered spe-cies in 2007 In 2010 Connecticut changed the eagles in-state status from endangered tothreatened The Northern States Bald Eagle Recovery Plan established a goal for Connecticut of
20 breeding birds (10 nests) which was reached for the first time in 2005 The population of baldeagles is included as an indicator because the eagle is representative of species especially preda-tors that share similar habitat requirements large areas of relatively undisturbed land near riv-
ers or lakes where the birds can find adequate supplies of fish and other prey that are ndash very im-portantly ndash only minimally contaminated
27
7312019 Environmental Quality in Connecticut 2011
httpslidepdfcomreaderfullenvironmental-quality-in-connecticut-2011 3048
Rivers + Reservoirs
Drinking Water
Most water companies delivered water that met health standards in 2011
Every public water utility submits monthly quality reports to the Department of Public Health This
indicator shows the percentage of monthly reports that demonstrate full compliance after weight-
ing the reports to account for the number of people served by each utility Though long-termproblems occur they are rare in large systems with the exception of the downturn in 2005 and
2006 caused by a few short-term problems in larger systems This indicator would show greaterfluctuations if the larger systems failed to deliver good water The most commonly encountered
contaminants include bacteria and byproducts of disinfection with an assortment of other chemi-cals and radioactive substances
28
7312019 Environmental Quality in Connecticut 2011
httpslidepdfcomreaderfullenvironmental-quality-in-connecticut-2011 3148
Human Health
Breast Cancer in Connecticut
Connecticut has the highest incidence of breast cancer among the 50 states buthas seen improvement since a peak in the late 1990s
Of every 100000 women in the stateaged 50 to 54 a fair number will dis-
cover each year that they have breast
cancer That number is depicted in
this graph (The Council presents dataon this one age group rather than on
the entire female population to con-trol factors such as changes in the av-erage age of the larger population
age 50 to 54 was selected as a repre-
sentative age group and is used ineach yearrsquos report) To minimize year-
to-year fluctuations groups of years
are averaged together (In otherwords each data point on the graphshows the number of new cases in a
single year but that year is actually the average of five years) While some breast cancers arelinked to genetic factors most are associated with non-genetic factors including diet reproductivehistory lifestyle and external agents
Breast Cancer as an Environmental Indicator
There are numerous studies connecting certain chemicals and other environmental factors tobreast cancer These factors if significant do not appear to be as important statistically as a
womans own reproductive history but it is important to note that breast cancer rates vary great-
ly in different parts of the country Among the 50 states Connecticut has the highest incidence of breast cancer this assessment is based on average incidence rates from 2004 through 2008 thelatest years for which 50-state data are available (Source North American Association of Central
Cancer Registries as reported by the American Cancer Society)
The rate of new cases showed improvement in 2000 through 2004 (using the average of the five
years) and has held steady for the period of 2005 through 2009 (the most recent years for whichConnecticut data are available)
29
7312019 Environmental Quality in Connecticut 2011
httpslidepdfcomreaderfullenvironmental-quality-in-connecticut-2011 3248
Human Health
Non-Hodgkins Lymphoma
The reasons for the steep increase in this cancer during the 20th century are notwell understood but exposures to specific pollutants and chemicals are potential
factors Since 1999 the picture has improved
Non-Hodgkins lymphoma is a cancer of the lymphatic system It begins in the lymphoid tissue
which contains lymphocytes white blood cells that help the body fight infections Lymphocytestravel throughout the body and can carry abnormal lymphocytes spreading the cancer The data
for this indicator are from the Department of Public Healthrsquos Tumor Registry which records all
known cancer cases in the state (Please see the note on the previous page under Breast Cancerin Connecticut about the use of the 50 to 54 age group) Non-Hodgkinrsquos lymphoma has increasedmarkedly since recordkeeping began The reasons are not well understood though the rise of Ac-quired Immune Deficiency Syndrome (AIDS) since the 1980s accounts for some cases Several
studies also cite environmental factors including exposure to diesel exhaust and cer-tain fertilizers pesticides and chemicals In 2000 through 2004 and again in 2005 through 2009
(the most recent years for which data are available) the annual rate of new cases showed im-provement
30
7312019 Environmental Quality in Connecticut 2011
httpslidepdfcomreaderfullenvironmental-quality-in-connecticut-2011 3348
Personal Impact
Driving Our Cars
Nearly every year for 25 years the average Connecticut resident drove moremiles than he or she did in the previous year That trend shifted into reverse in
2008
Driving a car truck or sport utility vehicle is one of the most environmentally harmful activities a
Connecticut resident will engage in personally Impacts are direct (air pollution oil leakage etc)
and indirect (causing demand for new roads) The Department of Transportation estimates thetotal miles driven each year in Connecticut Every year from 2000 through 2007 the averageConnecticut resident drove more miles than in previous years The reasons for the decades of in-
creasing auto use are complex and include the fact that most new development was accessibleonly by private vehicle A decline in miles driven began in 2008 and has continued to 2010 (thelatest year for which data are available) The Connecticut trend lags slightly the national trend
of auto use which showed a dramatic drop in 2007 The national trend towards less driving is be-ing led by the 16 to 34 year-old segment of the population
Personal Impact indicators illustrate trends in behavior or practices that can be expected to influence the condition of tomorrowrsquosair water land and wildlife
31
7312019 Environmental Quality in Connecticut 2011
httpslidepdfcomreaderfullenvironmental-quality-in-connecticut-2011 3448
Personal Impact
Taking the Bus
The average Connecticut resident took the bus slightly more often in 2011
The number of local and commuter bus trips taken by the average resident has changed very li t-
tle over the last 20 years Riding a bus is just one way to avoid the negative environmental con-sequences of driving a car Ridership data are collected by the Department of Transportation Ri-
dership rose about 6 percent in 2006 perhaps in response to high gasoline prices Since thenthere have been slight fluctuations In 2011 per capita ridership was the highest since 2001
Personal impact indicators illustrate trends in behavior or practices that can be expected to influence the condition of tomorrowrsquos air water land and wildlife
32
7312019 Environmental Quality in Connecticut 2011
httpslidepdfcomreaderfullenvironmental-quality-in-connecticut-2011 3548
Personal Impact
Compliance
Compliance with environmental regulations declined for the third year in a row
33
7312019 Environmental Quality in Connecticut 2011
httpslidepdfcomreaderfullenvironmental-quality-in-connecticut-2011 3648
Who is breaking Connecticuts environmental laws To find out the Council classified all 944 No-tices of Violation (NOVs) issued by DEEP during fiscal year 2011 The conclusions are summa-
rized in a staff memo and the types of violators are characterized in a series of charts The Coun-
cil does not have data on the publicrsquos perceptions of who the violators are but it senses from eve-ryday conversations that people suppose them to be factories utilities waste disposal facilitiesand perhaps pesticide applicators -- a perception that does not match the data The vast majority
of businesses where violations were found were small companies and most violations were re-
lated to the storage transport or distribution of petroleum The largest group by far were gasstations and convenience stores Only seven percent of NOVs were issued to manufacturers withmore than 20 employees -- fewer than the number that went to individual citizens
This indicator shows the approximate percentage of inspections performed by DEEP that foundthe inspected facilities in full compliance with pertinent environmental laws and regulations
(Monitoring data self-reported by permit holders are not included here) In 2010 and 2011 DEEPstepped up enforcement activity in its underground (petroleum) storage tank program and issuedmany more Notices of Violation (NOVs) than in previous years
The overall compliance rate rarely has been better than 90 percent Generally compliance withair quality regulations is higher than with waste and water regulations The average compliance
rate for all programs declined from 90 percent in 2008 to 89 percent in 2009 86 percent in 2010
and 83 percent in 2011 (The sharp downturn of 2002 was due to a surge in NOVs in a single airprogram Stage II Vapor Recovery at gas stations)
The number of inspections (not shown) declined between 1997 and 2007 increased in 2008 anddeclined again in 2009 through 2011 to its lowest number in 15 years Any relationship betweenthe number of inspections and rate of compliance is uncertain The relative stability of the com-
pliance rate in the face of ever-diminishing staff resources might be regarded as a success for the
DEEP However the failure of the state-- government businesses and residents together -- toadvance affirmatively toward the goal of full compliance is apparent
Personal Impact indicators illustrate trends in behavior or practices that can be expected to influence the condition of tomorrowrsquosair water land and wildlife
Notices of Violation (NOVs) are informal enforcement tools generally issued whenever DEEP detects one or more violations at a
facility They carry no financial penalty The recipient has 30 days to respond They can be issued for relatively minor or majorviolations in cases of the latter type the recipient might also receive an order which might carry a financial penalty NOVs typi-cally outnumber orders by a factor of five or more in any year NOVs are good indicators of trends in violations because almost allviolations found through inspections result in NOVs
Some inspections of compliance with air quality regulations are conducted by the Department of Consumer Protection pursuantto an agreement with DEEP these inspections also are used in calculating compliance rates
34
7312019 Environmental Quality in Connecticut 2011
httpslidepdfcomreaderfullenvironmental-quality-in-connecticut-2011 3748
Personal Impact
Recycling
Some municipalities and regional waste authorities have reported greater partici-pation in recycling programs since adopting single-stream recycling However
notable progress towards the statewide goal remains elusive
The General Assembly es-
tablished a goal of reduc-ing and recycling 40 per-cent of Connecticuts mu-
nicipal solid waste streamby the year 2000 (Sec22a-220(f)) That
goal was never met and
the consequences havebeen enormous Hundredsof thousands of tons of
waste were shipped out
of Connecticut in manyyears putting thousands of diesel trucks on the high-
ways for trips of many
hundred miles One conse-quence of this needless
truck traffic is the yearly
addition of 300000 ormore pounds of diesel pol-lutants into the air Anoth-
er consequence is finan-cial one ton that is re-cycled instead of burned or
landfilled can save a municipality hauler or resident from $40 to $93 according to a 2010 report of the Legislative Program Review and Investigations Committee
As total tonnage of waste has grown the percent that is recycled has not In 2006 DEEP amendedthe State Solid Waste Management Plan to include a goal of diverting 58 percent of Connecticutrsquosmunicipal solid waste stream from disposal by 2024 This would be accomplished through recy-
cling composting and waste reduction (such as use of lighter packaging material) If this goal ismet Connecticut will be able to manage all of its garbage without exporting it
DEEP reports suggest that the official figures slightly underestimate actual recycling volume Thegap in the graph reflects a lack of available data is for the years between 2004 and 2008
35
7312019 Environmental Quality in Connecticut 2011
httpslidepdfcomreaderfullenvironmental-quality-in-connecticut-2011 3848
Personal Impact
Climate Changers
The average resident is causing less carbon dioxide to be put onto the atmos-phere a result of lower petroleum consumption
Certain gases in the air func-
tion like the glass of a green-
house they allow the sunsenergy to pass through the
atmosphere to the ground
then trap the heat that ra-diates from the ground Thesegases are often called green-
house gases Worldwide a
build-up of greenhouse gases is contributing to the ongoing
rise in temperature Carbon
dioxide is not the only green-house gas nor even the mostpowerful but carbon dioxide
emissions are far greater in
quantity than the othersThe chart shows the total
emissions of carbon dioxide
emitted from burning of petroleum natural gas and coal in Connecticut divided by the population
A 2008 state law set two goals for reducing greenhouse gas emissions reduce statewide emis-sions to 10 percent below 1990 levels by 2020 and 80 percent below 2001 levels by 2050The chart above shows emissions per Connecticut resident not total emissions and there-
fore displays the goals after adjusting them to account for the larger population that is pro-
jected for 2020 and 2050 There are expected to be hundreds of thousands more people living inConnecticut in 2020 and 2050 so the average resident will have to work that much harder to re-duce carbon dioxide emissions if the statewide goal is to be met
Most human-generated carbon dioxide results from the combustion of fuels in houses businesses
power plants and vehicles and the last of these is the largest source Connecticut is more ener-
gy-efficient than the nation as a whole and the average Connecticut residents contribution toglobal climate change is less than the average Americans
Technical Note The Council has changed the data source for this indicator In previous years da-ta was available for all greenhouse gases not just carbon dioxide However to bring the chartmore up to date the Council switched to a source that includes carbon dioxide only Because the
other gases are emitted in small quantities the carbon dioxide data by themselves give an accu-rate picture of trends in greenhouse gas emissions The most recent data available even for car-bon dioxide alone are from 2009
36
7312019 Environmental Quality in Connecticut 2011
httpslidepdfcomreaderfullenvironmental-quality-in-connecticut-2011 3948
Personal Impact
Electricity at Home and Work
At Home
The average Connecticut resident used slightly less electricity at home in 2011
Thousands of households have been signing up annually to buy electricity gener-ated by renewable energy sources through the CTCleanEnergyOptions program
37
7312019 Environmental Quality in Connecticut 2011
httpslidepdfcomreaderfullenvironmental-quality-in-connecticut-2011 4048
Through 2009 the majority of Connecticut households did not purchase the mostefficient refrigerators or air conditioners This trend probably has not changedbut more recent data are not available and this indicator will be discontinued
At Work
For three years in a row Connecticut businesses have used electricity more effi-ciently to produce goods and services
38
7312019 Environmental Quality in Connecticut 2011
httpslidepdfcomreaderfullenvironmental-quality-in-connecticut-2011 4148
Efficiency at Home The average Connecticut household has been consuming less electricity since the peak
usage year of 2007 despite a brief reversal in 2010 According to the Connecticut Siting Council peak de-mand occurs during hot humid summer days due to air conditioner demand The increase in summertimeconsumption has had significant environmental consequences On the hottest days Connecticutrsquos base-loadpower plants are unable to meet the additional demand and older petroleum-fueled plants are brought online Because they are used sporadically many of these older plants are permitted to operate with no pollu-tion control equipment As a result state residents generate the most air pollution on the hottest summerdays when air quality is already bad
The vast majority of Connecticutrsquos electricity is generated from nuclear energy and the combustion of naturalgas oil and coal Hydropower solar and other renewable resources are small but growing sources of elec-tricity Each source renewable or not has its own negative environmental consequences Reducing thoseconsequences will require Connecticut households to use electricity much more efficiently Such efficiencycan be attained in part with ENERGY STAR appliances
Efficiency in the Kitchen In a typical home the refrigerator consumes more electricity than any otherappliance (Central air conditioning uses more but is not in everyonersquos home) To be labeled ENERGY STAR efficient a full-size refrigerator must operate using at least 20 percent less energy than the federal stan-dards for household appliances
ENERGY STAR appliance sales figures had been collected from voluntary reports by retailers to the ENERGY
STAR program Data on sales by state are no longer available For Connecticut 2009 data are the most re-cent available In 2009 38 percent of refrigerators bought by Connecticut consumers were ENERGY STARefficient a decrease from its peak (44 percent) in 2005 Sales trends for ENERGY STAR air conditioners al-so dropped in 2009 to 42 percent from 44 percent in 2008 Public surveys have shown conclusively thatmost people are aware of the ENERGY STAR label and what it means so reasons other than awareness mustbe addressed to boost ENERGY STAR labeled product sales and stem the ongoing waste of electricity inhomes
The ENERGY STAR program was created in 1992 as a joint effort of the US Environmental Protection Agen-cy and the US Department of Energy to identify and label energy efficient products By consuming lesselectricity ENERGY STAR products help to reduce air pollution and greenhouse gas emissions
The Connecticut Energy Efficiency Fund has partnered with Top Ten USA to help consumers find the mostenergy efficient appliances
Buying Cleaner Energy The CTCleanEnergyOptions program enables customers to sign up to pur-
chase electricity from renewable sources that include wind and low-impact hydroelectric (water power) Par-ticipation has grown steadily though the rate of increased participation is slowing There were 7 per-cent more participants in the program in 2011 than in 2010 The electricity that actually enters these housesis not necessarily from renewable sources The consumer who elects this option is paying for the generationof renewable electricity on the regional electric grid This reduces the amount of electricity that otherwisewould be generated by nuclear coal oil and natural gas-fired generating plants all of which create pollutionCTCleanEnergyOptions is a collaborative program administered by the Clean Energy Finance and InvestmentAuthority
Efficiency at work The bottom graph shows trends in the efficiency with which Connecticutrsquos economyuses electricity to produce goods and services Connecticuts businesses generally have been producing more
goods and services with less electricity State Gross Domestic Product (GDP) represents the total value of goods and services produced within the state in a single year Payment to employees constitutes about 60percent of the GDP In 2010 (the most recent data available) the Bureau of Economic Analysis put Connect-icuts GDP at $237 billion (current dollars) From 2009 to 2010 the GDP grew twice as fast as electricity con-sumption by Connecticuts industrial and commercial sectors Preliminary data for 2011 suggest that therewas no change in efficiency The long-term positive trend demonstrates that with advances in energy effi-cient technology it is possible for Connecticutrsquos economy to continue growing while using electricity moreefficiently
39
7312019 Environmental Quality in Connecticut 2011
httpslidepdfcomreaderfullenvironmental-quality-in-connecticut-2011 4248
Activities of the CEQ in 2011
June saw the 40th anniversary of the legislation that created the Council on Environmen-
tal Quality (CEQ) The Councils first meeting was held in the fall of 1971 Previous re-
ports looked back at some of those early events In the more recent past the Coun-
cils 41st year was one of its busiest and most productive
Research and Reports
The Council published Environmental Quality in Connecticut in April 2011 identifying
Routes to Progress that would move some of Connecticuts environmental indicators in
a positive direction
The Council is required to recommend legislation for identifying the deficiencies of exist-
ing programs and activities The Council published those in January 2012
From time to time the Council asks staff to prepare updates to previous reports Exam-
ples from 2011 include a staff memo on environmental regulation and the growth of
small businesses and a memo on the benefits to Connecticut of a new federal initiative to
reduce mercury pollution
Review of State Projects and Programs
In December 2010 the Council received complaints and inquiries about a state grant fora boat launch facility that was awarded without the environmental review and public no-
tice required by the Connecticut Environmental Policy Act (CEPA) After review the
Council advised the Commissioner of Energy and Environmental Protection of the appli-
cability of CEPA Ultimately the Department of Energy and Environmental Protection
(DEEP) declined to conduct an evaluation The Councils conclusion is summarized in a
2011 letter to one of the citizens who contacted the Council
Council research in 2010 found that one of the most polluting power plants in the state is
located in Hartford and is generally only used on the hottest days of the year when air
quality is already at its worst In December 2011 DEEP published notice of its intent torenew the air pollution permit for the plant Seeing several problems in the draft permit
as well as opportunities to improve and perhaps phase out use of the plant the Council
submitted detailed comments As of press time the permit renewal is still pending
40
7312019 Environmental Quality in Connecticut 2011
httpslidepdfcomreaderfullenvironmental-quality-in-connecticut-2011 4348
The Council continued to improve the Environmental Monitor to accommodate changes in
CEPA most recently to add public notices in cases where agencies decide not to com-
plete an environmental impact evaluation after it has conducted a public scoping
process
Citizen Complaints
As noted in reports of the past two years citizens of Haddam have spoken repeatedly to
the Council about contamination of land and groundwater that has existed in their com-
munity for more than 25 years Among many issues the apparent lack of remedial ac-
tion by one company was of particular note as the company had been required by the
DEEP to investigate the contamination and prepare a clean-up plan The Council decided
to follow this case in detail in order to learn more about the adequacy of existing laws
and programs In April 2010 the Council wrote to DEEP recommending enforcement ac-
tion against the company in question DEEP began legal action against the company in
late 2010 As of May 2012 there has been some study by the landowner as well as addi-
tional legal and bureaucratic action but to date no remediation
Along with many other parties the Council participated throughout 2011 in DEEPs ongo-
ing effort to transform remediation laws and programs The Councils close attention to
the Haddam case has yielded several insights into problems that need to be fixed
Aside from remediation the following are a sample of the many other complaints inves-
tigated in 2011
Dumping on a state university campus
Lack of notice of pesticide spraying on a railroad right-of-way as railroads are ex-
empt from the law governing notification of abutting homeowners
Pesticides and other contaminants in the wells of many homes in one neighbor-
hood
Apparent misinformation in an application for a proposed large drinking water
well with no effective consequences for providing wrong or misleading informa-
tion
Several matters relating to the siting of telecommunications towers including the
need to consider their effect on bird migration corridors preserved natural
areas and coastal areas
Pollution from outdoor wood furnaces both legal and illegal
The Council researched all of the complaints it received and offered recommendations to
the relevant state agencies where warranted Some problems such as illegal tree re-
moval on private property will require legislative action to correct
41
7312019 Environmental Quality in Connecticut 2011
httpslidepdfcomreaderfullenvironmental-quality-in-connecticut-2011 4448
The Word from Mansfield
The Council periodically holds public forums in different parts of the state to learn what
environmental topics are most on residentsrsquo minds The information presented at these
forums has been extremely useful to the Council
In July 2011 the Council heard from many citizens and municipal officials in Mans-
field They spoke about numerous environmental problems many involving the ac-
tions and responsibilities of state agencies Others suggested interesting directions for
the future of the state and its environment The Council investigated all of them and re-
sponded to each speaker Many investigations led to actions by state agencies andor
recommendations for legislation Read a complete summary of the speakers and the is-
sues they raised
Advice From the Public
In November of 2011 the Council released its required recommendations for corrective
legislation in draft form and invited the public to weigh in Citizens and organizations
spoke to the Council at a public forum held in the Legislative Office Building in Hartford
and many others submitted written comments Read a complete summary Their in-
sights technical advice and opinions proved a big help to the Council in preparing its fi-
nal recommendations which were submitted to Governor Dannel P Malloy and the Gen-
eral Assembly in January 2012
___________
In addition to the dozens who spoke at the public forums the Council heard from organi-zations at regular monthly meetings These included DEEP the University of ConnecticutNorth Stamford Concerned Citizens for the Environment Citizens for Clean GroundwaterRivers Alliance of Connecticut Sierra Club and others
Many people across the state expressed their concerns during 2011 The Council workedto address them all and truly appreciates the efforts people made to bring environmen-tal problems to light The Council looks forward to helping citizens and agenciessolve the challenges of 2012 and beyond
42
7312019 Environmental Quality in Connecticut 2011
httpslidepdfcomreaderfullenvironmental-quality-in-connecticut-2011 4548
The release of this edition of Environmental Quality in Connecticut marks 41 years of CEQ service
Council Duties
The duties of the Council on Environmental Quality are described in Sections 22a-11through 22a-13 of the Connecticut General Statutes
The Council is a nine-member board that works independently of the Department of Energy and Environmental Protection (except for administrative functions) The Chair-man and four other members are appointed by the Governor two members by the Pres-ident Pro Tempore of the Senate and two by the Speaker of the House The Councilrsquosprimary responsibilities include
1 Submittal to the Governor of an annual report on the status of Connecticutrsquos env i-ronment including progress toward goals of the statewide environmental planwith recommendations for remedying deficiencies of state programs
2 Review of state agenciesrsquo construction projects3 Investigation of citizensrsquo complaints and allegations of violations of environmental
laws
In addition under the Connecticut Environmental Policy Act (CEPA) and its attendantregulations the Council on Environmental Quality reviews Environmental Impact Evalua-tions that state agencies develop for major projects The Council publishes the Environ-mental Monitor the official publication for scoping notices and environmental impactevaluations for state projects under CEPA The Environmental Monitor also is the officialpublication for notice of intent by state agencies to sell or transfer state lands
43
7312019 Environmental Quality in Connecticut 2011
httpslidepdfcomreaderfullenvironmental-quality-in-connecticut-2011 4648
CEQ Members
Barbara C Wagner (Chair)Resident of Glastonbury Attorney with law office in Glastonbury specializing in commer-cial and residential real estate Executive Director Wind Hill Community Farm Glaston-bury Member Glastonbury Town Council 2000-2010 Co-Founder and Board Member of
Town Center Initiative addressing walkability issues in Glastonburyrsquos center Board of Trustees Diamond Lake Land Trust Former member State Open Space and WatershedLand Acquisition Board
M Howard BeachResident of Simsbury Conservation amp Zoning Compliance Officer Planning AnalystTown of Simsbury Member Simsbury Conservation Inland Wetlands Commission from1980 to 2004 Chairman from 1994 to 2004 Member Board of Directors The Farming-ton River Watershed Association 2004 to 2006 Life Member and past Board MemberSimsbury Land Conservation Trust Founding Member Farmington Valley BiodiversityProject Member Town of Simsbury Open Space Committee 1999 to 2004 Member CTDevelopers Council Member Government Affairs Committee Simsbury Chamber of
Commerce In 2004 completed a Masters Degree in Environmental Law at Vermont LawSchool
Janet P BrooksResident of Middletown Attorney with law office in East Berlin with a practice in envi-ronmental administrative and land use law Member of the Connecticut Bar AssociationPlanning amp Zoning Section and Environment Section Co-author of Connecticut Environ-mental Protection Act Volume 15 of the Connecticut Practice Series published by Thom-son West Formerly Assistant Attorney General in the Environment Department of theConnecticut Attorney Generalrsquos (AGs) Office for 18 years enforcing the statersquos environ-mental laws running the gamut from noise odor water pollution air pollution pesticides
to habitat protection and preservation of land While at the AGrsquos Office coordinated thewetlands appeal practice and developed the legal training for wetlands commissioners forDEEPrsquos annual training Recipient of 1984 German Marshall Fund grant to study the ef-fect of citizen participation on hazardous waste clean-ups in four European countriesBased on those experiences authored a chapter published in Americarsquos Future in Toxic Waste Management Lessons from Europe Staff Attorney for five years at the Connecti-cut Fund for the Environment Inc representing citizens groups in administrative andcourt proceedings Began practice of law assisting the Middletown City Attorney in thecityrsquos opposition to the utility companyrsquos burning of PCB waste oil with in the city bounda-ries
Liz ClarkResident of West Hartford
44
7312019 Environmental Quality in Connecticut 2011
httpslidepdfcomreaderfullenvironmental-quality-in-connecticut-2011 4748
Bruce R FernandezResident of Farmington Retired after 18 years owning and managing a software busi-ness serving insurance companies and independent agencies Prior to that was a con-sulting engineer specializing in energy efficient power plants and paper mills Vice-President of Operations of a small utility serving Bronxville NY and a jet engine de-signtest engineer Masters degrees in Engineering and Management Served in UnitedStates Army Corps of Engineers as small unit commander served in Vietnam and tenyears in Army Reserves Member Board of Directors Farmington Land Trust
Karyl Lee Hall Resident of Branford Attorney with the Connecticut Legal Rights Project Formerly withMurtha Cullina the Connecticut Fund for the Environment and Connecticut Legal Servic-es Co-Chair Branford Conservation Commission Co-chair Scenic Roads AdvisoryCommittee for Routes 146 and 77 Member Advisory Board Branford Land Trust Vice
President Citizens for Branfordrsquos Environment 2002-2009 Connecticut Bar AssociationPro Bono Service Award 2003 Former Co-chair State Implementation Plan [for AirManagement] Revision Advisory Committee
Richard Sherman Resident of Chaplin Architectural designer and construction manager of earth shelteredpassive solar and energy efficient residences Former CEQ Representative to the Route 6Advisory Committee (during previous term on CEQ) Charter Member Transit Alliance of Eastern CT and Citizens for a Sensible Six Former Organizer the Progress and EquityPartnership Member of CEPA Working Group League of Conservation Voters of CTFormer President Northeast Chapter of ACLU-CT Board of Directors Member of PeoplesAction for Clean Energy (PACE) and Northeast Sustainable Energy Association (NESEA)Former Chair Mansfield Transportation Advisory Committee Former President Mans-field Commonground Member Mansfield Planning and Zoning Design Review PanelFormer Chair Mansfield Democratic Town Committee Host and producer of the radio
show A Distant Shore on WHUS (917 FM Storrs) Former Public Affairs Director of WHUS Stopover host American Tour dSol solar electric car race
Norman VanCor(member through April 2012)Resident of Harwinton Owner of Buy Safe Home Inspection LLC and Mizzentop Antiqui-ties Served in United States Marine Corp in Vietnam Awarded the Navy Cross Vietnam-ese Cross of Gallantry and other decorations One of first ten inductees to CT VeteransHall of Fame Former Director Yankee Energy in sales marketing government relationscommunications Founding member and President Emeritus Quinnipiac River WatershedAssociation Former member Rivers Advisory Committee Former Chairman SouthingtonConservation Commission Former host of radio program on environmental topics For-
mer President Southington Water Works Former member Board of Directors of Opera-tion Fuel Active Pheresis donor at American Red Cross with over 37 gallons of wholeblood and platelet donations Former Volunteer Hunter Safety Instructor for the DEEPConservation Education Program Certified Master Gardener
45
7312019 Environmental Quality in Connecticut 2011
httpslidepdfcomreaderfullenvironmental-quality-in-connecticut-2011 4848
Acknowledgments
The Council appreciates the assistance of the many people in the Departments of Agri-culture Energy and Environmental Protection Transportation and Public Health and theConnecticut Siting Council who provided data Researchers at the Center for LanduseEducation and Research (CLEAR) at the University of Connecticut provided very valuable
data
The Council especially thanks the many citizens businesses and organizations who of-fered information and viewpoints to the Council throughout the year
The Council also appreciates the work of its Executive Director Karl Wagener and Envi-ronmental Analyst Peter Hearn in drafting this report for review by the Council and pre-paring the final version for publication
The Council notes the valuable contributions of Eric Walsh an intern from the Universityof Connecticut Law School and Avery Yoshimine an intern from the University of Con-necticut their research contributed greatly to this report
Contact the CEQ
We would like to hear from you Does this report give you the information on Connecticuts environment that you need Is
there something missing
79 Elm Street
Hartford CT 06106
Phone
860-424-4000
(messages can be left 24 hours a day)
Fax
860-424-4070
karlwagenerctgov
7312019 Environmental Quality in Connecticut 2011
httpslidepdfcomreaderfullenvironmental-quality-in-connecticut-2011 1048
Reduce water pollution from developed areas This means low-impact devel-opment techniques for new development and a long campaign of retrofittingtowns and cities with green infrastructure The new permeable sidewalks encir-cling the State Capitol should be considered normal not exceptional
Plan for homes and jobs near mass transit As documented in many placesgood transportation and economic development policies can guide and stimulate
development where people can live outside the automobile
Train municipal regulators Volunteer municipal commission members makethousands of regulatory decisions annually Training of these members is a low-cost highly effective component of the environmental protection arsenal buttraining needs are chronically underserved
Invest The cost of regulating pollution is generally covered by the regulated par-ties but who aside from sportsmen and park patrons are paying for the man-agement of the states natural resources For the most part nobody Yet the up-side potential is great residents see $38 of economic activity for each dollar thestate spends on parks
Embrace the Nature State (and Keep Conservation Alive) If residents enjoyliving among trees observing wildlife and working locally to conserve land as
they evidently do state policies should honor that choice However recent reports from the Connecticut Audubon Society and others express doubt that Connecti-cuts high level of volunteer conservation commitment will endure as many child-ren lack extended exposure to wild nature Connecticut must never let a lack of knowledge and enthusiasm erode its status as the Nature State
Connecticutrsquos environmental indicators begin on the next page
8
7312019 Environmental Quality in Connecticut 2011
httpslidepdfcomreaderfullenvironmental-quality-in-connecticut-2011 1148
Air
Good Air Days
Every Connecticut resident breathed good air on 342 days in 2011 eight morethan in 2010
A Good Air Day is a day when every monitoring station in the state records satisfactory air quali-
ty ldquoSatisfactory air qualityrdquo is defined here as air that meets the specific health-based ambient
air quality standards for all of the following 6 pollutants sulfur dioxide lead carbon monoxideparticles nitrogen dioxide and ground-level ozone
Connecticutrsquos goal is to have air that meets health-based standards for all pollutants Violationsof health-based air quality standards have been eliminated for all pollutants except ground-level
ozone and fine particles On 13 summer days concentrations of ground-level ozone violated theozone standard that protects human health The standard for fine particles was violated on 10
days in the fall and winter an unusually high number One steamy July day saw the standardsviolated for both ozone and fine particles Not every town experienced bad air on the same days
Danbury was the location with the most bad air days (11 days total five bad ozone days five bad
particle days and one day that was bad for both ozone and particles)
Ozone is created when nitrogen oxides and organic compounds in the air react in the presence of
sunlight Weather is a big factor in year-to-year fluctuations Motor vehicles remain a major
source of ozone-forming emissions despite improvements in tailpipe standards Much ground-level
ozone originates in states to the west of Connecticut
In typical years cities and towns in the western and coastal regions of the state see the most bad
air days In 2007 and in 2009 however inland towns had more The historical pattern returned in2010 and 2011 with coastal towns having the most bad ozone days Groton and Westport had thehighest frequency in 2011 (nine days each)
9
7312019 Environmental Quality in Connecticut 2011
httpslidepdfcomreaderfullenvironmental-quality-in-connecticut-2011 1248
Fine particles such as those found in smoke and haze are 25 micrometers in diameter andsmaller These particles can form when gases emitted from power plants industries and automo-
biles react in the air Violations of the health standard occur mostly in summer and winter rarely
in spring and fall The fall of 2011 was a notable exception as generators wood stoves and fire-places put into use after the October 29 snowstorm yielded very high levels of fine particles insome cities and towns The monitoring stations in the northern half of the state were themselves
knocked out but the extraordinarily high levels recorded in Springfield Massachusetts -- more
than twice the limit that protects human health -- undoubtedly extended into Connecticut Most of Connecticut meets the health standard for fine particles as that standard allows the air to exceedthe numerical limit for a few days each year
Technical Note The federal government modified the standards for fine particles in December2006 and for ground-level ozone in early 2008 The chart above was redrawn each time to illu-strate the states historical pattern of good air days by applying the new stricter standards to all
previous years The federal government is again reviewing the standards for particles and
ground-level ozone
10
7312019 Environmental Quality in Connecticut 2011
httpslidepdfcomreaderfullenvironmental-quality-in-connecticut-2011 1348
Air
Clearing the Air
Average Levels of Air Pollution
Connecticutrsquos air was slightly more polluted in 2011 than in 2010 breaking afive-year winning streak
The chart shows the average amount of pollution in Connecticuts air for each year Six air pollu-tants -- sulfur dioxide lead carbon monoxide particles nitrogen dioxide and ground-level ozone-- are measured across the state by DEEP At the end of every year the Council expresses the av-erage level of each pollutant on a numerical scale where zero equals no pollution and 100
represents the ldquounhealthfulrdquo level of the specified pollutant The Council then takes this annualnumber for each of the six pollutants and averages them to yield the single index value on thisgraph
In 2011 all of the pollutants (excluding lead) increased slightly for the first time since 2005 Le-
vels of lead in the air have dropped so low that they barely register in this indicator In 2010carbon monoxide was the only pollutant to increase from the previous year
The increase in pollution in 2011 is partially ascribable to the large number of generators woodstoves and fireplaces that were put into use following the October snowstorm Yearly weathervariations also cause fluctuations in air quality
Technical Note A new monitoring station was added in Litchfield in 2010 To maintain an accu-
rate comparison among years data from this station will not be added until there are enoughyears to provide a trend At that time all the earlier years will be re-calculated
11
7312019 Environmental Quality in Connecticut 2011
httpslidepdfcomreaderfullenvironmental-quality-in-connecticut-2011 1448
Farm Forest Wetland
Preserved Land
Connecticuts goal is to preserve 21 of the states land area by 2023 but no-body knows how much land has actually been preserved
State law (CGS 23-8(b)) sets a goal of conserving 21 percent of Connecticutrsquos land area TheGreen Plan Connecticutrsquos official land conservation plan establishes 2023 as the target dateThat goal includes conservation land owned by towns and cities land trusts and other nonprofitorganizations water utilities and the state
The same law sets a goal (10 percent of Connecticuts land area) for state ownership of land forparks forests and wildlife areas Records of state-owned lands are accurate and are reported
here
In 2011 DEEP preserved about 575 acres State grants helped municipalities and land trusts ac-
quire an additional 1600 acres This pace is not nearly sufficient to reach the states goals
Many additional acres probably thousands in some years are preserved by municipalities and
land trusts without state grants but this information is not reported to the state The Council de-termined that previous state estimates of the acreage owned by municipalities and nonprofit land
trusts were inaccurate Those estimates which were reported in previous editions of Environmen-tal Quality in Connecticut are no longer included in this report
The absence of an accurate inventory of protected land in Connecticut is a serious deficiencyDEEP has been collecting data from municipal records in a sequential fashion for 12 years if that
effort is ever completed the earliest-collected data will be well out of date To make land preser-vation more strategic and cost-effective Connecticut needs a reliable and up-to-date registry of the states protected lands Public Act 12-152 could eventually lead to an accurate inventory
12
7312019 Environmental Quality in Connecticut 2011
httpslidepdfcomreaderfullenvironmental-quality-in-connecticut-2011 1548
Farm Forest Wetland
Forest
After a century of growth and relative stability Connecticutrsquos forests -- especiallythe most valuable core forests -- have been shrinking for two decades
Most of Connecticutrsquos forests were cleared for agriculture and industry in the 19th century andthen allowed to regenerate From 1960 to 1980 the overall acreage of forest did not change
much even with the rapid spread of roads housing and commercial development According tothe US Forest Service the spread of forests on abandoned farms equaled the conversion of fo-
rested land to other uses The late 20th century brought a change forest is now declining
This indicator shows the total acreage of forests in Connecticut The forests are divided into core
forests and other forests Core forests are at least 300 feet from non-forest development such as
roads buildings and farms Forests that are fragmented or divided by roads and buildings servesome forest purposes but are not fully-functioning forest ecosystems Fragmented forests areknown to provide substandard habitat for many species of wildlife and in many cases less oppor-
tunity for hunting and other types of recreation
Even as the total acreage of forests might fluctuate over years or decades the extent of core fo-rests will always show a decline except in rare instances where roads or developments might be
abandoned and reclaimed by forests
Technical Note The definition and measurement of core forests is done by the Center for LandUse Education and Research (CLEAR) at the University of Connecticut as part of the Connecticutrsquos
Changing Landscape Project (CCL) The Council finds these data derived from CLEARs analysis of satellite imagery to be the most accurate data available Satellite data is examined by CLEARevery few years this indicator includes the most recent data available (2006)
13
7312019 Environmental Quality in Connecticut 2011
httpslidepdfcomreaderfullenvironmental-quality-in-connecticut-2011 1648
Farm Forest Wetland
Farmland
In 2011 Connecticut preserved 1975 acres of farmland -- the best year for pre-servation since 1993 and close to the 2000-acre annual rate needed to reach
the states goal
The top chart shows the acreage of land being farmed in Connecticut The bottom chart shows thecumulative acreage preserved by the Connecticut Department of Agriculture
14
7312019 Environmental Quality in Connecticut 2011
httpslidepdfcomreaderfullenvironmental-quality-in-connecticut-2011 1748
To preserve land for future agricultural use the Connecticut Department of Agriculture purchasesthe development rights to farmland from volunteer sellers This keeps the land in private owner-
ship with severe restrictions on future nonagricultural development Over 1300 acres were pre-
served each year from 2008 through 2010 In 2011 16 farms participated preserving 1975acres Funds are mostly from state bonding and the Community Investment Act
Connecticuts farmland preservation goal is based on the amount of land needed for food produc-tion Mathematical projections of the current preservation rate show the goal being reached in the22nd century but in reality there will not be that acreage of agricultural land remaining in the
state by the end of the current century if the recent rate of loss continues Preservation of at least
2000 acres annually should result in success
This indicator does not show agricultural land acquired for preservation by municipalities and
nonprofit organizations Several towns purchased farms in recent years with no state assistanceand those acres are not reported or recorded at the state level Along with a central registry of preserved open space Connecticut needs a registry of preserved farmland to help state agencies
and other organizations preserve land strategically
Technical Note Until 2008 the uppermost chart showed the total acreage of land in Connecticutfarms as counted using survey data by the US Department of Agriculture (USDA) The Council
has found a superior data source in the University of Connecticuts Center for Land Use Educa-
tion and Research (CLEAR) CLEAR staff analyzes satellite imagery to measure the actual area of fields pastures orchards and vineyards In contrast the USDA data counted all land in farmseven that which was not used for agriculture CLEAR analyzes new satellite imagery every few
years the most recent imagery is from 2006
15
7312019 Environmental Quality in Connecticut 2011
httpslidepdfcomreaderfullenvironmental-quality-in-connecticut-2011 1848
Farm Forest Wetland
Inland Wetlands
Towns and cities permitted disturbance of about 70 acres of wetlands the fewestin four years
Local commissions reduced the wetlands disturbance caused by the averagepermit
16
7312019 Environmental Quality in Connecticut 2011
httpslidepdfcomreaderfullenvironmental-quality-in-connecticut-2011 1948
The top graph shows the acreage of wetlands disturbed by development ldquoDisturbedrdquo wetlands
are those affected directly by human activity which can range from total destruction (when the
wetlands are filled and built upon) to conversion from one type to another (when for example ashallow swamp is dredged to create a pond) There is no specific goal for wetlands conservation
The top graph also shows the acres of wetlands created or otherwise enhanced by humans No
attempt is made here to evaluate the success of the created wetlands or their value relative to
the natural wetlands that might have been altered In fact the created category includes somany diverse activities that the number has no real meaning The Council intends to drop theacres created category in next years report (Readers are invited to comment on this proposal)
The lower graph shows the area of inland wetlands affected by the average permit issued by mu-
nicipalities Use of the average permit shows trends irrespective of the changes in the number of applications that are caused by economic trends
In 2010 and 2011 more than 25 percent of municipalities failed to report their data to DEEP asrequired by state law
Inland wetlands are estimated to cover about 450000 acres or 15 percent of Connecticuts sur-
face More than 95 percent of the development activity in and around wetlands is regulated bymunicipalities with minimal oversight or supervision by the DEEP In October 2008 the Councilpublished Swamped a special report that analyzed performance of the states inland wetlands
program including training State law requires every municipal wetlands agency to have at leastone member or staff person complete DEEPs comprehensive wetlands training program but
many municipalities do not comply with this requirement A thorough statistical analysis foundthat cities and towns that possessed at least one trained member or staff person allowed less
wetlands disturbance than cities and towns that were not in compliance with the training require-ment
Technical Notes The results for 2010 and 2011 should be considered preliminary due to the high
percentage of non-reporting towns The Council adjusts the reported data to account for the non-
reporting towns but inaccuracies are inevitable (The Council is confident that the statistical ad- justment is reasonable because Swamped also examined differences in performance betweentowns that report to the DEEP and towns that do not report and confirmed that non-reporting
towns are similar to reporting towns in the average amount of wetlands destruction they per-
mit) Also for 2011 two 100-acre projects were not included in the totals one involved invasivespecies removal from a Manchester wetland and the other was a drawdown of a pond in Bethle-hem Both were of a scale that distorted typical wetlands activity data
17
7312019 Environmental Quality in Connecticut 2011
httpslidepdfcomreaderfullenvironmental-quality-in-connecticut-2011 2048
Sound + Shore
No Swimming at the Beach
Heavy rain caused the average coastal city and town to close its beaches manymore days than usual
The Council adds up the number of days that each coastal city and town closed one or more of its
public beaches and calculates an average for all the cities and towns with beaches The cities andtowns in the western half of the state usually have a higher frequency of closings
Yearly variations generally are products of rainfall patterns and unusual incidents such as sewer-line ruptures The storms of 2011 (most notably Tropical Storm Irene) resulted in many closings
as many beaches were awash in contaminated runoff raw sewage and debris
In typical years about half of beach closings are due to tests showing elevated levels of bacteriaPolluted surface runoff or sewage overflows after rainstorms are the most common sources of the
bacteria Most other closings are precautionary as health officials must assume that heavy rains
will wash polluted runoff andor overflow from combined sanitarystorm sewers
Connecticutrsquos goal is to eliminate beach closings caused by discharges of untreated or poorlytreated sewage a common cause of elevated bacteria levels
18
7312019 Environmental Quality in Connecticut 2011
httpslidepdfcomreaderfullenvironmental-quality-in-connecticut-2011 2148
Sound and Shore
Piping Plovers on the Beach
A record year as more than 100 of these threatened shorebirds nestedon coastal beaches from Westport to Stonington
Piping Plovers are small shorebirds that nest on sandy sparsely-vegetated beaches Human intru-sion storm tides and predators frequently destroy nests Fifty-two pairs nested in 2011 nine
more than in 2010 Storms and tides destroyed quite a few of their nests
Although the number of plovers on Connecticuts beaches now exceeds the goal that was set in
the 1980s it continues in threatened status at the state and national level Nesting adults arecounted and in most cases protected every spring by the US Fish and Wildlife Service DEEP andvolunteers working with the Connecticut Audubon Society The Nature Conservancy Audubon
Connecticut and local organizations such as the Friends of Milford Point and Stratford Great Mea-
dows National Wildlife Refuge The protections afforded these plovers also benefit other nesting
species including American Oystercatchers and Least Terns which are also a threatened speciesin Connecticut Since protection and monitoring efforts began in 1984 nesting success has im-proved resulting in more returning adults in subsequent years Yearly variations can occur when
adult birds move from one state to another
19
7312019 Environmental Quality in Connecticut 2011
httpslidepdfcomreaderfullenvironmental-quality-in-connecticut-2011 2248
Sound + Shore
Life in Long Island Sound
About half of the fish species in Long Island Sound are increasing
The lobster population of Long Island Sound has failed to recover
DEEP surveys marine fish squid and lobster populations every spring and fall by towing nets froma research vessel Data for 2010 are absent because repairs to the research vessel John Dempsey precluded the fall Long Island Sound trawl survey
20
7312019 Environmental Quality in Connecticut 2011
httpslidepdfcomreaderfullenvironmental-quality-in-connecticut-2011 2348
The top graph shows general trends in the collective populations of lobster squid and 38 speciesof fish The number displayed for any year is the percentage of these 40 species that were above
their long-term average populations In 2005 through 2009 fewer than half of these species were
as common as they were in the 1980s and 1990s The surveys of 2011 showed modest improve-ment Half of the species were as common as in prior years The species selected for this analy-sis reflect a bias in favor of managed species that have high commercial and recreational value
A separate analysis (not shown) of the geometric mean of the weight of all the fish taken per tow
(regardless of species) was the lowest since 2003 This measure may better reflect the overallhealth of the Sound as a habitat The Council is considering adding this measure in future years
Scientists are unsure of the reasons behind the declines and fluctuations of recent years Onepossible explanation for the decline of some prey species is the population growth of striped bass
and other predators Over recent years some colder-water species such as windowpane flounder
and little skate have declined as warmer-water species such as scup and summer flounder haveincreased along with the average yearly temperature of the Sound The illustration at the bottom
of this page lists some-warm water species that are on the increase with some cold-water speciesthat are decreasing
The fall 2011 trawl results for lobster were the lowest ever recorded It is the nadir in a well-documented decade-long decline in the lobster population that also is evident in a dramatic dropin commercial lobster landings during the same period (not shown) Researchers are focusing on
a combination of four possible causes for the dramatic downturn in lobster populations since
1999 disease changes in water quality changes in climatic conditions and human impacts to theSound Research to date suggests that a trend toward warmer water temperatures is an impor-tant factor in the decline of lobsters
Declined through 2011 Increased through 2011
Windowpane Flounder
(shown)
Little Skate
Scup
Atlantic Moonfish (shown)
Summer Flounder
21
7312019 Environmental Quality in Connecticut 2011
httpslidepdfcomreaderfullenvironmental-quality-in-connecticut-2011 2448
Sound + Shore
Pollution in Long Island Sound
The amount of nitrogen dumped into Long Island Sound and its tributaries in-creased slightly in 2011
The area of the Sound with adequate levels of oxygen declined slightly from2010
22
7312019 Environmental Quality in Connecticut 2011
httpslidepdfcomreaderfullenvironmental-quality-in-connecticut-2011 2548
The area of shellfish beds unconditionally approved for harvesting declined in2011
Hypoxia is a condition in the water when oxygen levels are too low to fully support desirableforms of life including fish and lobsters Hypoxia occurs when the nitrogen in pollution stimulatesexcessive growth of aquatic plants which die and get consumed by oxygen-using bacteria Con-
necticuts goal is to ldquoeliminate the adverse impacts of hypoxia resulting from human activi-
tiesrdquo Hypoxia occurs predominantly in the western portions of the Sound Weather greatly influ-ences hypoxia making year-to-year changes less important than long-term trends
To reduce the nitrogen inputs that cause hypoxia Connecticut and New York adopted a compre-hensive management plan in 1994 and built upon that plan with an expanded agreement in2002
The top graph tracks the amount of nitrogen discharged to the Sound and to major rivers by 79
sewage treatment plants two large coastal industrial facilities and a small group of industrialsources in the Naugatuck River watershed Connecticutrsquos investments in nitrogen-removal tech-nology from many of those plants have been successful
Large uncontrolled quantities of nitrogen enter Long Island Sound when rainfall carries fertilizer
from residents lawns along with the pollutants that have accumulated on pavement Overall
Connecticutrsquos share of the total nitrogen pollution in Long Island Sound is about one-third and
New Yorkrsquos is two-thirds In 2001 the federal Environmental Protection Agency approved the New
York and Connecticut joint plan for implementing a Total Maximum Daily Load (TMDL) The TMDLis the maximum amount of pollutants that can be discharged while still allowing water quality
standards to be attained
The Connecticut Department of Agricultures Bureau of Aquaculture and Laboratory Servic-
es monitors shellfish beds and classifies them according to their potential for the harvesting of healthful uncontaminated shellfish The third graph above shows the acreage of shellfish bedsthat are approved for harvesting because they are generally unaffected by pollution (Even areasthat are approved may be closed as a precaution following exceptional rainfalls of three or more
inches) Aquaculture experts have suggested that the annually increasing volume of runoff from
lawns and pavement is flowing further into the Sound resulting in the shrinkage of the shellfishbeds that are fully approved
23
7312019 Environmental Quality in Connecticut 2011
httpslidepdfcomreaderfullenvironmental-quality-in-connecticut-2011 2648
The decline in approved shellfish beds is not attributed to the storms of 2011 it preceded themwith the reclassification of areas in accord with the bacterial standards model of the National
Shellfish Sanitation Program The model allows designation without sampling based on dilution
calculations in areas where there is recreational or commercial activity
Technical Notes The middle chart above shows the area of Long Island Sound that had adequateoxygen levels throughout the year The sampling area (2700 square kilometers) does not includethe whole Sound (3400 square kilometers) The areas not sampled are shallow waters (less than
two meters deep) near shore which generally do not experience hypoxia embayments the east-
ern end of the Sound which is not expected to experience hypoxia and an area in the far west-ern end which probably becomes hypoxic in most years
Hypoxia was redefined by DEEP in 2011 Areas of the Sound are now considered hypoxic where aliter of water contains less than 30 mg of dissolved oxygen This is the criterion that was used
prior to 2004 From 2004 through 2010 DEEP used 35 mgl as the determining level
The threshold was returned to the 30 level in 2011 to be consistent with the definitions used byNew York and the Long Island Sound Study For this years report data for all previous years
were recalculated to show the area of the Sound having adequate oxygen under the current defi-nition (that is at least 30 mgl)
24
7312019 Environmental Quality in Connecticut 2011
httpslidepdfcomreaderfullenvironmental-quality-in-connecticut-2011 2748
Rivers and Reservoirs
No Swimming in the River
About 80 miles of rivers receive overflows of raw sewage during storms
Throughout the state only 11 of rivers and streams are classified as beingclean enough for swimming and other water contact sports
25
7312019 Environmental Quality in Connecticut 2011
httpslidepdfcomreaderfullenvironmental-quality-in-connecticut-2011 2848
Top Chart In fourteen Connecticut cities and towns sanitary sewers were built in combinationwith storm sewers During storms these systems carry more water than their treatment facilities
can handle and a combination of storm water and untreated sewage overflows directly into the
rivers and Long Island Sound Several of these combined sewer systems have been completely orpartly separated since 1990 reducing the impact of untreated sewage on rivers The improve-ment in 2001 can be attributed to the completion of projects in the towns of Waterbury and Nau-
gatuck In 2005 the Jewett City project was completed eliminating overflows of raw sewage into
the Quinebaug River
Connecticuts goal is to eliminate the effects of raw sewage discharges from combined sewer sys-tems Progress is slow because of the extraordinary expense of separating the sewers
The pie chart illustrates the percentage of the states rivers that fully support recreation This isan estimate based on sampling and statistical analysis by the Department of Energy
and Environmental Protection (DEEP) Most streams are not monitored directly The current figure
of 11 percent is from the Integrated Water Quality Report submitted by the DEEP to the federalgovernment on May 31 2011 The 2008 edition of that report estimated the percentage to be 15
Theres Water in the River
(Better 40 Years Late Than Never)
June 23 1970 ldquoThe Water Resources Commission with
the advice of the Board of Fisheries and Game should be
authorized to establish and regulate minimum stream
flowshellipFlows must be tailored to fit the hydrological and
ecological character of each stream as established by the
minimum demands of aquatic life Authority should include
the power to augment flow from storagehelliprdquo Governorrsquos Committee on Environmental Policy Recommendation 48
December 12 2011 The Department of Energy and Envi-
ronmental Protection obtains final approval for proposed
Stream Flow Standards and Regulations specific to the hy-
drological and ecological character of each stream and re-
quiring release from storage under certain conditions to
augment flow
26
7312019 Environmental Quality in Connecticut 2011
httpslidepdfcomreaderfullenvironmental-quality-in-connecticut-2011 2948
Rivers + Reservoirs
Bald Eagles
Bald eagles have come back to Connecticut even to cities The chemical pollu-tants that interfered with their reproduction have since been controlled and large
trees along fish-rich rivers offer good nesting sites
Bald eagles stopped breeding in Con-necticut in the 1950s The species de-
clined throughout the lower 48 states
and was declared endangered in 1967
A variety of environmental conditionsharmed the eagle including the wide-
spread use of certain chemicals
(chlorinated hydrocarbons) that accu-mulated in its prey (mostly fish) Whenthose chemicals were banned and pol-
luted waterways were improved thebald eagle was able to reproduce againYoung eagles were reintroduced into
nearby states in the 1980s and a pair
found their way to Connecticut in 1991and successfully raised a family in
1992 Many more pairs have since
found acceptable nesting habitat onland protected by government and pri-vate landowners including utility com-
panies DEEP monitors the eagles withthe assistance of the Bald Eagle StudyGroup and other volunteers
The federal government removed the bald eagle from its list of threatened and endangered spe-cies in 2007 In 2010 Connecticut changed the eagles in-state status from endangered tothreatened The Northern States Bald Eagle Recovery Plan established a goal for Connecticut of
20 breeding birds (10 nests) which was reached for the first time in 2005 The population of baldeagles is included as an indicator because the eagle is representative of species especially preda-tors that share similar habitat requirements large areas of relatively undisturbed land near riv-
ers or lakes where the birds can find adequate supplies of fish and other prey that are ndash very im-portantly ndash only minimally contaminated
27
7312019 Environmental Quality in Connecticut 2011
httpslidepdfcomreaderfullenvironmental-quality-in-connecticut-2011 3048
Rivers + Reservoirs
Drinking Water
Most water companies delivered water that met health standards in 2011
Every public water utility submits monthly quality reports to the Department of Public Health This
indicator shows the percentage of monthly reports that demonstrate full compliance after weight-
ing the reports to account for the number of people served by each utility Though long-termproblems occur they are rare in large systems with the exception of the downturn in 2005 and
2006 caused by a few short-term problems in larger systems This indicator would show greaterfluctuations if the larger systems failed to deliver good water The most commonly encountered
contaminants include bacteria and byproducts of disinfection with an assortment of other chemi-cals and radioactive substances
28
7312019 Environmental Quality in Connecticut 2011
httpslidepdfcomreaderfullenvironmental-quality-in-connecticut-2011 3148
Human Health
Breast Cancer in Connecticut
Connecticut has the highest incidence of breast cancer among the 50 states buthas seen improvement since a peak in the late 1990s
Of every 100000 women in the stateaged 50 to 54 a fair number will dis-
cover each year that they have breast
cancer That number is depicted in
this graph (The Council presents dataon this one age group rather than on
the entire female population to con-trol factors such as changes in the av-erage age of the larger population
age 50 to 54 was selected as a repre-
sentative age group and is used ineach yearrsquos report) To minimize year-
to-year fluctuations groups of years
are averaged together (In otherwords each data point on the graphshows the number of new cases in a
single year but that year is actually the average of five years) While some breast cancers arelinked to genetic factors most are associated with non-genetic factors including diet reproductivehistory lifestyle and external agents
Breast Cancer as an Environmental Indicator
There are numerous studies connecting certain chemicals and other environmental factors tobreast cancer These factors if significant do not appear to be as important statistically as a
womans own reproductive history but it is important to note that breast cancer rates vary great-
ly in different parts of the country Among the 50 states Connecticut has the highest incidence of breast cancer this assessment is based on average incidence rates from 2004 through 2008 thelatest years for which 50-state data are available (Source North American Association of Central
Cancer Registries as reported by the American Cancer Society)
The rate of new cases showed improvement in 2000 through 2004 (using the average of the five
years) and has held steady for the period of 2005 through 2009 (the most recent years for whichConnecticut data are available)
29
7312019 Environmental Quality in Connecticut 2011
httpslidepdfcomreaderfullenvironmental-quality-in-connecticut-2011 3248
Human Health
Non-Hodgkins Lymphoma
The reasons for the steep increase in this cancer during the 20th century are notwell understood but exposures to specific pollutants and chemicals are potential
factors Since 1999 the picture has improved
Non-Hodgkins lymphoma is a cancer of the lymphatic system It begins in the lymphoid tissue
which contains lymphocytes white blood cells that help the body fight infections Lymphocytestravel throughout the body and can carry abnormal lymphocytes spreading the cancer The data
for this indicator are from the Department of Public Healthrsquos Tumor Registry which records all
known cancer cases in the state (Please see the note on the previous page under Breast Cancerin Connecticut about the use of the 50 to 54 age group) Non-Hodgkinrsquos lymphoma has increasedmarkedly since recordkeeping began The reasons are not well understood though the rise of Ac-quired Immune Deficiency Syndrome (AIDS) since the 1980s accounts for some cases Several
studies also cite environmental factors including exposure to diesel exhaust and cer-tain fertilizers pesticides and chemicals In 2000 through 2004 and again in 2005 through 2009
(the most recent years for which data are available) the annual rate of new cases showed im-provement
30
7312019 Environmental Quality in Connecticut 2011
httpslidepdfcomreaderfullenvironmental-quality-in-connecticut-2011 3348
Personal Impact
Driving Our Cars
Nearly every year for 25 years the average Connecticut resident drove moremiles than he or she did in the previous year That trend shifted into reverse in
2008
Driving a car truck or sport utility vehicle is one of the most environmentally harmful activities a
Connecticut resident will engage in personally Impacts are direct (air pollution oil leakage etc)
and indirect (causing demand for new roads) The Department of Transportation estimates thetotal miles driven each year in Connecticut Every year from 2000 through 2007 the averageConnecticut resident drove more miles than in previous years The reasons for the decades of in-
creasing auto use are complex and include the fact that most new development was accessibleonly by private vehicle A decline in miles driven began in 2008 and has continued to 2010 (thelatest year for which data are available) The Connecticut trend lags slightly the national trend
of auto use which showed a dramatic drop in 2007 The national trend towards less driving is be-ing led by the 16 to 34 year-old segment of the population
Personal Impact indicators illustrate trends in behavior or practices that can be expected to influence the condition of tomorrowrsquosair water land and wildlife
31
7312019 Environmental Quality in Connecticut 2011
httpslidepdfcomreaderfullenvironmental-quality-in-connecticut-2011 3448
Personal Impact
Taking the Bus
The average Connecticut resident took the bus slightly more often in 2011
The number of local and commuter bus trips taken by the average resident has changed very li t-
tle over the last 20 years Riding a bus is just one way to avoid the negative environmental con-sequences of driving a car Ridership data are collected by the Department of Transportation Ri-
dership rose about 6 percent in 2006 perhaps in response to high gasoline prices Since thenthere have been slight fluctuations In 2011 per capita ridership was the highest since 2001
Personal impact indicators illustrate trends in behavior or practices that can be expected to influence the condition of tomorrowrsquos air water land and wildlife
32
7312019 Environmental Quality in Connecticut 2011
httpslidepdfcomreaderfullenvironmental-quality-in-connecticut-2011 3548
Personal Impact
Compliance
Compliance with environmental regulations declined for the third year in a row
33
7312019 Environmental Quality in Connecticut 2011
httpslidepdfcomreaderfullenvironmental-quality-in-connecticut-2011 3648
Who is breaking Connecticuts environmental laws To find out the Council classified all 944 No-tices of Violation (NOVs) issued by DEEP during fiscal year 2011 The conclusions are summa-
rized in a staff memo and the types of violators are characterized in a series of charts The Coun-
cil does not have data on the publicrsquos perceptions of who the violators are but it senses from eve-ryday conversations that people suppose them to be factories utilities waste disposal facilitiesand perhaps pesticide applicators -- a perception that does not match the data The vast majority
of businesses where violations were found were small companies and most violations were re-
lated to the storage transport or distribution of petroleum The largest group by far were gasstations and convenience stores Only seven percent of NOVs were issued to manufacturers withmore than 20 employees -- fewer than the number that went to individual citizens
This indicator shows the approximate percentage of inspections performed by DEEP that foundthe inspected facilities in full compliance with pertinent environmental laws and regulations
(Monitoring data self-reported by permit holders are not included here) In 2010 and 2011 DEEPstepped up enforcement activity in its underground (petroleum) storage tank program and issuedmany more Notices of Violation (NOVs) than in previous years
The overall compliance rate rarely has been better than 90 percent Generally compliance withair quality regulations is higher than with waste and water regulations The average compliance
rate for all programs declined from 90 percent in 2008 to 89 percent in 2009 86 percent in 2010
and 83 percent in 2011 (The sharp downturn of 2002 was due to a surge in NOVs in a single airprogram Stage II Vapor Recovery at gas stations)
The number of inspections (not shown) declined between 1997 and 2007 increased in 2008 anddeclined again in 2009 through 2011 to its lowest number in 15 years Any relationship betweenthe number of inspections and rate of compliance is uncertain The relative stability of the com-
pliance rate in the face of ever-diminishing staff resources might be regarded as a success for the
DEEP However the failure of the state-- government businesses and residents together -- toadvance affirmatively toward the goal of full compliance is apparent
Personal Impact indicators illustrate trends in behavior or practices that can be expected to influence the condition of tomorrowrsquosair water land and wildlife
Notices of Violation (NOVs) are informal enforcement tools generally issued whenever DEEP detects one or more violations at a
facility They carry no financial penalty The recipient has 30 days to respond They can be issued for relatively minor or majorviolations in cases of the latter type the recipient might also receive an order which might carry a financial penalty NOVs typi-cally outnumber orders by a factor of five or more in any year NOVs are good indicators of trends in violations because almost allviolations found through inspections result in NOVs
Some inspections of compliance with air quality regulations are conducted by the Department of Consumer Protection pursuantto an agreement with DEEP these inspections also are used in calculating compliance rates
34
7312019 Environmental Quality in Connecticut 2011
httpslidepdfcomreaderfullenvironmental-quality-in-connecticut-2011 3748
Personal Impact
Recycling
Some municipalities and regional waste authorities have reported greater partici-pation in recycling programs since adopting single-stream recycling However
notable progress towards the statewide goal remains elusive
The General Assembly es-
tablished a goal of reduc-ing and recycling 40 per-cent of Connecticuts mu-
nicipal solid waste streamby the year 2000 (Sec22a-220(f)) That
goal was never met and
the consequences havebeen enormous Hundredsof thousands of tons of
waste were shipped out
of Connecticut in manyyears putting thousands of diesel trucks on the high-
ways for trips of many
hundred miles One conse-quence of this needless
truck traffic is the yearly
addition of 300000 ormore pounds of diesel pol-lutants into the air Anoth-
er consequence is finan-cial one ton that is re-cycled instead of burned or
landfilled can save a municipality hauler or resident from $40 to $93 according to a 2010 report of the Legislative Program Review and Investigations Committee
As total tonnage of waste has grown the percent that is recycled has not In 2006 DEEP amendedthe State Solid Waste Management Plan to include a goal of diverting 58 percent of Connecticutrsquosmunicipal solid waste stream from disposal by 2024 This would be accomplished through recy-
cling composting and waste reduction (such as use of lighter packaging material) If this goal ismet Connecticut will be able to manage all of its garbage without exporting it
DEEP reports suggest that the official figures slightly underestimate actual recycling volume Thegap in the graph reflects a lack of available data is for the years between 2004 and 2008
35
7312019 Environmental Quality in Connecticut 2011
httpslidepdfcomreaderfullenvironmental-quality-in-connecticut-2011 3848
Personal Impact
Climate Changers
The average resident is causing less carbon dioxide to be put onto the atmos-phere a result of lower petroleum consumption
Certain gases in the air func-
tion like the glass of a green-
house they allow the sunsenergy to pass through the
atmosphere to the ground
then trap the heat that ra-diates from the ground Thesegases are often called green-
house gases Worldwide a
build-up of greenhouse gases is contributing to the ongoing
rise in temperature Carbon
dioxide is not the only green-house gas nor even the mostpowerful but carbon dioxide
emissions are far greater in
quantity than the othersThe chart shows the total
emissions of carbon dioxide
emitted from burning of petroleum natural gas and coal in Connecticut divided by the population
A 2008 state law set two goals for reducing greenhouse gas emissions reduce statewide emis-sions to 10 percent below 1990 levels by 2020 and 80 percent below 2001 levels by 2050The chart above shows emissions per Connecticut resident not total emissions and there-
fore displays the goals after adjusting them to account for the larger population that is pro-
jected for 2020 and 2050 There are expected to be hundreds of thousands more people living inConnecticut in 2020 and 2050 so the average resident will have to work that much harder to re-duce carbon dioxide emissions if the statewide goal is to be met
Most human-generated carbon dioxide results from the combustion of fuels in houses businesses
power plants and vehicles and the last of these is the largest source Connecticut is more ener-
gy-efficient than the nation as a whole and the average Connecticut residents contribution toglobal climate change is less than the average Americans
Technical Note The Council has changed the data source for this indicator In previous years da-ta was available for all greenhouse gases not just carbon dioxide However to bring the chartmore up to date the Council switched to a source that includes carbon dioxide only Because the
other gases are emitted in small quantities the carbon dioxide data by themselves give an accu-rate picture of trends in greenhouse gas emissions The most recent data available even for car-bon dioxide alone are from 2009
36
7312019 Environmental Quality in Connecticut 2011
httpslidepdfcomreaderfullenvironmental-quality-in-connecticut-2011 3948
Personal Impact
Electricity at Home and Work
At Home
The average Connecticut resident used slightly less electricity at home in 2011
Thousands of households have been signing up annually to buy electricity gener-ated by renewable energy sources through the CTCleanEnergyOptions program
37
7312019 Environmental Quality in Connecticut 2011
httpslidepdfcomreaderfullenvironmental-quality-in-connecticut-2011 4048
Through 2009 the majority of Connecticut households did not purchase the mostefficient refrigerators or air conditioners This trend probably has not changedbut more recent data are not available and this indicator will be discontinued
At Work
For three years in a row Connecticut businesses have used electricity more effi-ciently to produce goods and services
38
7312019 Environmental Quality in Connecticut 2011
httpslidepdfcomreaderfullenvironmental-quality-in-connecticut-2011 4148
Efficiency at Home The average Connecticut household has been consuming less electricity since the peak
usage year of 2007 despite a brief reversal in 2010 According to the Connecticut Siting Council peak de-mand occurs during hot humid summer days due to air conditioner demand The increase in summertimeconsumption has had significant environmental consequences On the hottest days Connecticutrsquos base-loadpower plants are unable to meet the additional demand and older petroleum-fueled plants are brought online Because they are used sporadically many of these older plants are permitted to operate with no pollu-tion control equipment As a result state residents generate the most air pollution on the hottest summerdays when air quality is already bad
The vast majority of Connecticutrsquos electricity is generated from nuclear energy and the combustion of naturalgas oil and coal Hydropower solar and other renewable resources are small but growing sources of elec-tricity Each source renewable or not has its own negative environmental consequences Reducing thoseconsequences will require Connecticut households to use electricity much more efficiently Such efficiencycan be attained in part with ENERGY STAR appliances
Efficiency in the Kitchen In a typical home the refrigerator consumes more electricity than any otherappliance (Central air conditioning uses more but is not in everyonersquos home) To be labeled ENERGY STAR efficient a full-size refrigerator must operate using at least 20 percent less energy than the federal stan-dards for household appliances
ENERGY STAR appliance sales figures had been collected from voluntary reports by retailers to the ENERGY
STAR program Data on sales by state are no longer available For Connecticut 2009 data are the most re-cent available In 2009 38 percent of refrigerators bought by Connecticut consumers were ENERGY STARefficient a decrease from its peak (44 percent) in 2005 Sales trends for ENERGY STAR air conditioners al-so dropped in 2009 to 42 percent from 44 percent in 2008 Public surveys have shown conclusively thatmost people are aware of the ENERGY STAR label and what it means so reasons other than awareness mustbe addressed to boost ENERGY STAR labeled product sales and stem the ongoing waste of electricity inhomes
The ENERGY STAR program was created in 1992 as a joint effort of the US Environmental Protection Agen-cy and the US Department of Energy to identify and label energy efficient products By consuming lesselectricity ENERGY STAR products help to reduce air pollution and greenhouse gas emissions
The Connecticut Energy Efficiency Fund has partnered with Top Ten USA to help consumers find the mostenergy efficient appliances
Buying Cleaner Energy The CTCleanEnergyOptions program enables customers to sign up to pur-
chase electricity from renewable sources that include wind and low-impact hydroelectric (water power) Par-ticipation has grown steadily though the rate of increased participation is slowing There were 7 per-cent more participants in the program in 2011 than in 2010 The electricity that actually enters these housesis not necessarily from renewable sources The consumer who elects this option is paying for the generationof renewable electricity on the regional electric grid This reduces the amount of electricity that otherwisewould be generated by nuclear coal oil and natural gas-fired generating plants all of which create pollutionCTCleanEnergyOptions is a collaborative program administered by the Clean Energy Finance and InvestmentAuthority
Efficiency at work The bottom graph shows trends in the efficiency with which Connecticutrsquos economyuses electricity to produce goods and services Connecticuts businesses generally have been producing more
goods and services with less electricity State Gross Domestic Product (GDP) represents the total value of goods and services produced within the state in a single year Payment to employees constitutes about 60percent of the GDP In 2010 (the most recent data available) the Bureau of Economic Analysis put Connect-icuts GDP at $237 billion (current dollars) From 2009 to 2010 the GDP grew twice as fast as electricity con-sumption by Connecticuts industrial and commercial sectors Preliminary data for 2011 suggest that therewas no change in efficiency The long-term positive trend demonstrates that with advances in energy effi-cient technology it is possible for Connecticutrsquos economy to continue growing while using electricity moreefficiently
39
7312019 Environmental Quality in Connecticut 2011
httpslidepdfcomreaderfullenvironmental-quality-in-connecticut-2011 4248
Activities of the CEQ in 2011
June saw the 40th anniversary of the legislation that created the Council on Environmen-
tal Quality (CEQ) The Councils first meeting was held in the fall of 1971 Previous re-
ports looked back at some of those early events In the more recent past the Coun-
cils 41st year was one of its busiest and most productive
Research and Reports
The Council published Environmental Quality in Connecticut in April 2011 identifying
Routes to Progress that would move some of Connecticuts environmental indicators in
a positive direction
The Council is required to recommend legislation for identifying the deficiencies of exist-
ing programs and activities The Council published those in January 2012
From time to time the Council asks staff to prepare updates to previous reports Exam-
ples from 2011 include a staff memo on environmental regulation and the growth of
small businesses and a memo on the benefits to Connecticut of a new federal initiative to
reduce mercury pollution
Review of State Projects and Programs
In December 2010 the Council received complaints and inquiries about a state grant fora boat launch facility that was awarded without the environmental review and public no-
tice required by the Connecticut Environmental Policy Act (CEPA) After review the
Council advised the Commissioner of Energy and Environmental Protection of the appli-
cability of CEPA Ultimately the Department of Energy and Environmental Protection
(DEEP) declined to conduct an evaluation The Councils conclusion is summarized in a
2011 letter to one of the citizens who contacted the Council
Council research in 2010 found that one of the most polluting power plants in the state is
located in Hartford and is generally only used on the hottest days of the year when air
quality is already at its worst In December 2011 DEEP published notice of its intent torenew the air pollution permit for the plant Seeing several problems in the draft permit
as well as opportunities to improve and perhaps phase out use of the plant the Council
submitted detailed comments As of press time the permit renewal is still pending
40
7312019 Environmental Quality in Connecticut 2011
httpslidepdfcomreaderfullenvironmental-quality-in-connecticut-2011 4348
The Council continued to improve the Environmental Monitor to accommodate changes in
CEPA most recently to add public notices in cases where agencies decide not to com-
plete an environmental impact evaluation after it has conducted a public scoping
process
Citizen Complaints
As noted in reports of the past two years citizens of Haddam have spoken repeatedly to
the Council about contamination of land and groundwater that has existed in their com-
munity for more than 25 years Among many issues the apparent lack of remedial ac-
tion by one company was of particular note as the company had been required by the
DEEP to investigate the contamination and prepare a clean-up plan The Council decided
to follow this case in detail in order to learn more about the adequacy of existing laws
and programs In April 2010 the Council wrote to DEEP recommending enforcement ac-
tion against the company in question DEEP began legal action against the company in
late 2010 As of May 2012 there has been some study by the landowner as well as addi-
tional legal and bureaucratic action but to date no remediation
Along with many other parties the Council participated throughout 2011 in DEEPs ongo-
ing effort to transform remediation laws and programs The Councils close attention to
the Haddam case has yielded several insights into problems that need to be fixed
Aside from remediation the following are a sample of the many other complaints inves-
tigated in 2011
Dumping on a state university campus
Lack of notice of pesticide spraying on a railroad right-of-way as railroads are ex-
empt from the law governing notification of abutting homeowners
Pesticides and other contaminants in the wells of many homes in one neighbor-
hood
Apparent misinformation in an application for a proposed large drinking water
well with no effective consequences for providing wrong or misleading informa-
tion
Several matters relating to the siting of telecommunications towers including the
need to consider their effect on bird migration corridors preserved natural
areas and coastal areas
Pollution from outdoor wood furnaces both legal and illegal
The Council researched all of the complaints it received and offered recommendations to
the relevant state agencies where warranted Some problems such as illegal tree re-
moval on private property will require legislative action to correct
41
7312019 Environmental Quality in Connecticut 2011
httpslidepdfcomreaderfullenvironmental-quality-in-connecticut-2011 4448
The Word from Mansfield
The Council periodically holds public forums in different parts of the state to learn what
environmental topics are most on residentsrsquo minds The information presented at these
forums has been extremely useful to the Council
In July 2011 the Council heard from many citizens and municipal officials in Mans-
field They spoke about numerous environmental problems many involving the ac-
tions and responsibilities of state agencies Others suggested interesting directions for
the future of the state and its environment The Council investigated all of them and re-
sponded to each speaker Many investigations led to actions by state agencies andor
recommendations for legislation Read a complete summary of the speakers and the is-
sues they raised
Advice From the Public
In November of 2011 the Council released its required recommendations for corrective
legislation in draft form and invited the public to weigh in Citizens and organizations
spoke to the Council at a public forum held in the Legislative Office Building in Hartford
and many others submitted written comments Read a complete summary Their in-
sights technical advice and opinions proved a big help to the Council in preparing its fi-
nal recommendations which were submitted to Governor Dannel P Malloy and the Gen-
eral Assembly in January 2012
___________
In addition to the dozens who spoke at the public forums the Council heard from organi-zations at regular monthly meetings These included DEEP the University of ConnecticutNorth Stamford Concerned Citizens for the Environment Citizens for Clean GroundwaterRivers Alliance of Connecticut Sierra Club and others
Many people across the state expressed their concerns during 2011 The Council workedto address them all and truly appreciates the efforts people made to bring environmen-tal problems to light The Council looks forward to helping citizens and agenciessolve the challenges of 2012 and beyond
42
7312019 Environmental Quality in Connecticut 2011
httpslidepdfcomreaderfullenvironmental-quality-in-connecticut-2011 4548
The release of this edition of Environmental Quality in Connecticut marks 41 years of CEQ service
Council Duties
The duties of the Council on Environmental Quality are described in Sections 22a-11through 22a-13 of the Connecticut General Statutes
The Council is a nine-member board that works independently of the Department of Energy and Environmental Protection (except for administrative functions) The Chair-man and four other members are appointed by the Governor two members by the Pres-ident Pro Tempore of the Senate and two by the Speaker of the House The Councilrsquosprimary responsibilities include
1 Submittal to the Governor of an annual report on the status of Connecticutrsquos env i-ronment including progress toward goals of the statewide environmental planwith recommendations for remedying deficiencies of state programs
2 Review of state agenciesrsquo construction projects3 Investigation of citizensrsquo complaints and allegations of violations of environmental
laws
In addition under the Connecticut Environmental Policy Act (CEPA) and its attendantregulations the Council on Environmental Quality reviews Environmental Impact Evalua-tions that state agencies develop for major projects The Council publishes the Environ-mental Monitor the official publication for scoping notices and environmental impactevaluations for state projects under CEPA The Environmental Monitor also is the officialpublication for notice of intent by state agencies to sell or transfer state lands
43
7312019 Environmental Quality in Connecticut 2011
httpslidepdfcomreaderfullenvironmental-quality-in-connecticut-2011 4648
CEQ Members
Barbara C Wagner (Chair)Resident of Glastonbury Attorney with law office in Glastonbury specializing in commer-cial and residential real estate Executive Director Wind Hill Community Farm Glaston-bury Member Glastonbury Town Council 2000-2010 Co-Founder and Board Member of
Town Center Initiative addressing walkability issues in Glastonburyrsquos center Board of Trustees Diamond Lake Land Trust Former member State Open Space and WatershedLand Acquisition Board
M Howard BeachResident of Simsbury Conservation amp Zoning Compliance Officer Planning AnalystTown of Simsbury Member Simsbury Conservation Inland Wetlands Commission from1980 to 2004 Chairman from 1994 to 2004 Member Board of Directors The Farming-ton River Watershed Association 2004 to 2006 Life Member and past Board MemberSimsbury Land Conservation Trust Founding Member Farmington Valley BiodiversityProject Member Town of Simsbury Open Space Committee 1999 to 2004 Member CTDevelopers Council Member Government Affairs Committee Simsbury Chamber of
Commerce In 2004 completed a Masters Degree in Environmental Law at Vermont LawSchool
Janet P BrooksResident of Middletown Attorney with law office in East Berlin with a practice in envi-ronmental administrative and land use law Member of the Connecticut Bar AssociationPlanning amp Zoning Section and Environment Section Co-author of Connecticut Environ-mental Protection Act Volume 15 of the Connecticut Practice Series published by Thom-son West Formerly Assistant Attorney General in the Environment Department of theConnecticut Attorney Generalrsquos (AGs) Office for 18 years enforcing the statersquos environ-mental laws running the gamut from noise odor water pollution air pollution pesticides
to habitat protection and preservation of land While at the AGrsquos Office coordinated thewetlands appeal practice and developed the legal training for wetlands commissioners forDEEPrsquos annual training Recipient of 1984 German Marshall Fund grant to study the ef-fect of citizen participation on hazardous waste clean-ups in four European countriesBased on those experiences authored a chapter published in Americarsquos Future in Toxic Waste Management Lessons from Europe Staff Attorney for five years at the Connecti-cut Fund for the Environment Inc representing citizens groups in administrative andcourt proceedings Began practice of law assisting the Middletown City Attorney in thecityrsquos opposition to the utility companyrsquos burning of PCB waste oil with in the city bounda-ries
Liz ClarkResident of West Hartford
44
7312019 Environmental Quality in Connecticut 2011
httpslidepdfcomreaderfullenvironmental-quality-in-connecticut-2011 4748
Bruce R FernandezResident of Farmington Retired after 18 years owning and managing a software busi-ness serving insurance companies and independent agencies Prior to that was a con-sulting engineer specializing in energy efficient power plants and paper mills Vice-President of Operations of a small utility serving Bronxville NY and a jet engine de-signtest engineer Masters degrees in Engineering and Management Served in UnitedStates Army Corps of Engineers as small unit commander served in Vietnam and tenyears in Army Reserves Member Board of Directors Farmington Land Trust
Karyl Lee Hall Resident of Branford Attorney with the Connecticut Legal Rights Project Formerly withMurtha Cullina the Connecticut Fund for the Environment and Connecticut Legal Servic-es Co-Chair Branford Conservation Commission Co-chair Scenic Roads AdvisoryCommittee for Routes 146 and 77 Member Advisory Board Branford Land Trust Vice
President Citizens for Branfordrsquos Environment 2002-2009 Connecticut Bar AssociationPro Bono Service Award 2003 Former Co-chair State Implementation Plan [for AirManagement] Revision Advisory Committee
Richard Sherman Resident of Chaplin Architectural designer and construction manager of earth shelteredpassive solar and energy efficient residences Former CEQ Representative to the Route 6Advisory Committee (during previous term on CEQ) Charter Member Transit Alliance of Eastern CT and Citizens for a Sensible Six Former Organizer the Progress and EquityPartnership Member of CEPA Working Group League of Conservation Voters of CTFormer President Northeast Chapter of ACLU-CT Board of Directors Member of PeoplesAction for Clean Energy (PACE) and Northeast Sustainable Energy Association (NESEA)Former Chair Mansfield Transportation Advisory Committee Former President Mans-field Commonground Member Mansfield Planning and Zoning Design Review PanelFormer Chair Mansfield Democratic Town Committee Host and producer of the radio
show A Distant Shore on WHUS (917 FM Storrs) Former Public Affairs Director of WHUS Stopover host American Tour dSol solar electric car race
Norman VanCor(member through April 2012)Resident of Harwinton Owner of Buy Safe Home Inspection LLC and Mizzentop Antiqui-ties Served in United States Marine Corp in Vietnam Awarded the Navy Cross Vietnam-ese Cross of Gallantry and other decorations One of first ten inductees to CT VeteransHall of Fame Former Director Yankee Energy in sales marketing government relationscommunications Founding member and President Emeritus Quinnipiac River WatershedAssociation Former member Rivers Advisory Committee Former Chairman SouthingtonConservation Commission Former host of radio program on environmental topics For-
mer President Southington Water Works Former member Board of Directors of Opera-tion Fuel Active Pheresis donor at American Red Cross with over 37 gallons of wholeblood and platelet donations Former Volunteer Hunter Safety Instructor for the DEEPConservation Education Program Certified Master Gardener
45
7312019 Environmental Quality in Connecticut 2011
httpslidepdfcomreaderfullenvironmental-quality-in-connecticut-2011 4848
Acknowledgments
The Council appreciates the assistance of the many people in the Departments of Agri-culture Energy and Environmental Protection Transportation and Public Health and theConnecticut Siting Council who provided data Researchers at the Center for LanduseEducation and Research (CLEAR) at the University of Connecticut provided very valuable
data
The Council especially thanks the many citizens businesses and organizations who of-fered information and viewpoints to the Council throughout the year
The Council also appreciates the work of its Executive Director Karl Wagener and Envi-ronmental Analyst Peter Hearn in drafting this report for review by the Council and pre-paring the final version for publication
The Council notes the valuable contributions of Eric Walsh an intern from the Universityof Connecticut Law School and Avery Yoshimine an intern from the University of Con-necticut their research contributed greatly to this report
Contact the CEQ
We would like to hear from you Does this report give you the information on Connecticuts environment that you need Is
there something missing
79 Elm Street
Hartford CT 06106
Phone
860-424-4000
(messages can be left 24 hours a day)
Fax
860-424-4070
karlwagenerctgov

7312019 Environmental Quality in Connecticut 2011
httpslidepdfcomreaderfullenvironmental-quality-in-connecticut-2011 2048
Sound + Shore
No Swimming at the Beach
Heavy rain caused the average coastal city and town to close its beaches manymore days than usual
The Council adds up the number of days that each coastal city and town closed one or more of its
public beaches and calculates an average for all the cities and towns with beaches The cities andtowns in the western half of the state usually have a higher frequency of closings
Yearly variations generally are products of rainfall patterns and unusual incidents such as sewer-line ruptures The storms of 2011 (most notably Tropical Storm Irene) resulted in many closings
as many beaches were awash in contaminated runoff raw sewage and debris
In typical years about half of beach closings are due to tests showing elevated levels of bacteriaPolluted surface runoff or sewage overflows after rainstorms are the most common sources of the
bacteria Most other closings are precautionary as health officials must assume that heavy rains
will wash polluted runoff andor overflow from combined sanitarystorm sewers
Connecticutrsquos goal is to eliminate beach closings caused by discharges of untreated or poorlytreated sewage a common cause of elevated bacteria levels
18
7312019 Environmental Quality in Connecticut 2011
httpslidepdfcomreaderfullenvironmental-quality-in-connecticut-2011 2148
Sound and Shore
Piping Plovers on the Beach
A record year as more than 100 of these threatened shorebirds nestedon coastal beaches from Westport to Stonington
Piping Plovers are small shorebirds that nest on sandy sparsely-vegetated beaches Human intru-sion storm tides and predators frequently destroy nests Fifty-two pairs nested in 2011 nine
more than in 2010 Storms and tides destroyed quite a few of their nests
Although the number of plovers on Connecticuts beaches now exceeds the goal that was set in
the 1980s it continues in threatened status at the state and national level Nesting adults arecounted and in most cases protected every spring by the US Fish and Wildlife Service DEEP andvolunteers working with the Connecticut Audubon Society The Nature Conservancy Audubon
Connecticut and local organizations such as the Friends of Milford Point and Stratford Great Mea-
dows National Wildlife Refuge The protections afforded these plovers also benefit other nesting
species including American Oystercatchers and Least Terns which are also a threatened speciesin Connecticut Since protection and monitoring efforts began in 1984 nesting success has im-proved resulting in more returning adults in subsequent years Yearly variations can occur when
adult birds move from one state to another
19
7312019 Environmental Quality in Connecticut 2011
httpslidepdfcomreaderfullenvironmental-quality-in-connecticut-2011 2248
Sound + Shore
Life in Long Island Sound
About half of the fish species in Long Island Sound are increasing
The lobster population of Long Island Sound has failed to recover
DEEP surveys marine fish squid and lobster populations every spring and fall by towing nets froma research vessel Data for 2010 are absent because repairs to the research vessel John Dempsey precluded the fall Long Island Sound trawl survey
20
7312019 Environmental Quality in Connecticut 2011
httpslidepdfcomreaderfullenvironmental-quality-in-connecticut-2011 2348
The top graph shows general trends in the collective populations of lobster squid and 38 speciesof fish The number displayed for any year is the percentage of these 40 species that were above
their long-term average populations In 2005 through 2009 fewer than half of these species were
as common as they were in the 1980s and 1990s The surveys of 2011 showed modest improve-ment Half of the species were as common as in prior years The species selected for this analy-sis reflect a bias in favor of managed species that have high commercial and recreational value
A separate analysis (not shown) of the geometric mean of the weight of all the fish taken per tow
(regardless of species) was the lowest since 2003 This measure may better reflect the overallhealth of the Sound as a habitat The Council is considering adding this measure in future years
Scientists are unsure of the reasons behind the declines and fluctuations of recent years Onepossible explanation for the decline of some prey species is the population growth of striped bass
and other predators Over recent years some colder-water species such as windowpane flounder
and little skate have declined as warmer-water species such as scup and summer flounder haveincreased along with the average yearly temperature of the Sound The illustration at the bottom
of this page lists some-warm water species that are on the increase with some cold-water speciesthat are decreasing
The fall 2011 trawl results for lobster were the lowest ever recorded It is the nadir in a well-documented decade-long decline in the lobster population that also is evident in a dramatic dropin commercial lobster landings during the same period (not shown) Researchers are focusing on
a combination of four possible causes for the dramatic downturn in lobster populations since
1999 disease changes in water quality changes in climatic conditions and human impacts to theSound Research to date suggests that a trend toward warmer water temperatures is an impor-tant factor in the decline of lobsters
Declined through 2011 Increased through 2011
Windowpane Flounder
(shown)
Little Skate
Scup
Atlantic Moonfish (shown)
Summer Flounder
21
7312019 Environmental Quality in Connecticut 2011
httpslidepdfcomreaderfullenvironmental-quality-in-connecticut-2011 2448
Sound + Shore
Pollution in Long Island Sound
The amount of nitrogen dumped into Long Island Sound and its tributaries in-creased slightly in 2011
The area of the Sound with adequate levels of oxygen declined slightly from2010
22
7312019 Environmental Quality in Connecticut 2011
httpslidepdfcomreaderfullenvironmental-quality-in-connecticut-2011 2548
The area of shellfish beds unconditionally approved for harvesting declined in2011
Hypoxia is a condition in the water when oxygen levels are too low to fully support desirableforms of life including fish and lobsters Hypoxia occurs when the nitrogen in pollution stimulatesexcessive growth of aquatic plants which die and get consumed by oxygen-using bacteria Con-
necticuts goal is to ldquoeliminate the adverse impacts of hypoxia resulting from human activi-
tiesrdquo Hypoxia occurs predominantly in the western portions of the Sound Weather greatly influ-ences hypoxia making year-to-year changes less important than long-term trends
To reduce the nitrogen inputs that cause hypoxia Connecticut and New York adopted a compre-hensive management plan in 1994 and built upon that plan with an expanded agreement in2002
The top graph tracks the amount of nitrogen discharged to the Sound and to major rivers by 79
sewage treatment plants two large coastal industrial facilities and a small group of industrialsources in the Naugatuck River watershed Connecticutrsquos investments in nitrogen-removal tech-nology from many of those plants have been successful
Large uncontrolled quantities of nitrogen enter Long Island Sound when rainfall carries fertilizer
from residents lawns along with the pollutants that have accumulated on pavement Overall
Connecticutrsquos share of the total nitrogen pollution in Long Island Sound is about one-third and
New Yorkrsquos is two-thirds In 2001 the federal Environmental Protection Agency approved the New
York and Connecticut joint plan for implementing a Total Maximum Daily Load (TMDL) The TMDLis the maximum amount of pollutants that can be discharged while still allowing water quality
standards to be attained
The Connecticut Department of Agricultures Bureau of Aquaculture and Laboratory Servic-
es monitors shellfish beds and classifies them according to their potential for the harvesting of healthful uncontaminated shellfish The third graph above shows the acreage of shellfish bedsthat are approved for harvesting because they are generally unaffected by pollution (Even areasthat are approved may be closed as a precaution following exceptional rainfalls of three or more
inches) Aquaculture experts have suggested that the annually increasing volume of runoff from
lawns and pavement is flowing further into the Sound resulting in the shrinkage of the shellfishbeds that are fully approved
23
7312019 Environmental Quality in Connecticut 2011
httpslidepdfcomreaderfullenvironmental-quality-in-connecticut-2011 2648
The decline in approved shellfish beds is not attributed to the storms of 2011 it preceded themwith the reclassification of areas in accord with the bacterial standards model of the National
Shellfish Sanitation Program The model allows designation without sampling based on dilution
calculations in areas where there is recreational or commercial activity
Technical Notes The middle chart above shows the area of Long Island Sound that had adequateoxygen levels throughout the year The sampling area (2700 square kilometers) does not includethe whole Sound (3400 square kilometers) The areas not sampled are shallow waters (less than
two meters deep) near shore which generally do not experience hypoxia embayments the east-
ern end of the Sound which is not expected to experience hypoxia and an area in the far west-ern end which probably becomes hypoxic in most years
Hypoxia was redefined by DEEP in 2011 Areas of the Sound are now considered hypoxic where aliter of water contains less than 30 mg of dissolved oxygen This is the criterion that was used
prior to 2004 From 2004 through 2010 DEEP used 35 mgl as the determining level
The threshold was returned to the 30 level in 2011 to be consistent with the definitions used byNew York and the Long Island Sound Study For this years report data for all previous years
were recalculated to show the area of the Sound having adequate oxygen under the current defi-nition (that is at least 30 mgl)
24
7312019 Environmental Quality in Connecticut 2011
httpslidepdfcomreaderfullenvironmental-quality-in-connecticut-2011 2748
Rivers and Reservoirs
No Swimming in the River
About 80 miles of rivers receive overflows of raw sewage during storms
Throughout the state only 11 of rivers and streams are classified as beingclean enough for swimming and other water contact sports
25
7312019 Environmental Quality in Connecticut 2011
httpslidepdfcomreaderfullenvironmental-quality-in-connecticut-2011 2848
Top Chart In fourteen Connecticut cities and towns sanitary sewers were built in combinationwith storm sewers During storms these systems carry more water than their treatment facilities
can handle and a combination of storm water and untreated sewage overflows directly into the
rivers and Long Island Sound Several of these combined sewer systems have been completely orpartly separated since 1990 reducing the impact of untreated sewage on rivers The improve-ment in 2001 can be attributed to the completion of projects in the towns of Waterbury and Nau-
gatuck In 2005 the Jewett City project was completed eliminating overflows of raw sewage into
the Quinebaug River
Connecticuts goal is to eliminate the effects of raw sewage discharges from combined sewer sys-tems Progress is slow because of the extraordinary expense of separating the sewers
The pie chart illustrates the percentage of the states rivers that fully support recreation This isan estimate based on sampling and statistical analysis by the Department of Energy
and Environmental Protection (DEEP) Most streams are not monitored directly The current figure
of 11 percent is from the Integrated Water Quality Report submitted by the DEEP to the federalgovernment on May 31 2011 The 2008 edition of that report estimated the percentage to be 15
Theres Water in the River
(Better 40 Years Late Than Never)
June 23 1970 ldquoThe Water Resources Commission with
the advice of the Board of Fisheries and Game should be
authorized to establish and regulate minimum stream
flowshellipFlows must be tailored to fit the hydrological and
ecological character of each stream as established by the
minimum demands of aquatic life Authority should include
the power to augment flow from storagehelliprdquo Governorrsquos Committee on Environmental Policy Recommendation 48
December 12 2011 The Department of Energy and Envi-
ronmental Protection obtains final approval for proposed
Stream Flow Standards and Regulations specific to the hy-
drological and ecological character of each stream and re-
quiring release from storage under certain conditions to
augment flow
26
7312019 Environmental Quality in Connecticut 2011
httpslidepdfcomreaderfullenvironmental-quality-in-connecticut-2011 2948
Rivers + Reservoirs
Bald Eagles
Bald eagles have come back to Connecticut even to cities The chemical pollu-tants that interfered with their reproduction have since been controlled and large
trees along fish-rich rivers offer good nesting sites
Bald eagles stopped breeding in Con-necticut in the 1950s The species de-
clined throughout the lower 48 states
and was declared endangered in 1967
A variety of environmental conditionsharmed the eagle including the wide-
spread use of certain chemicals
(chlorinated hydrocarbons) that accu-mulated in its prey (mostly fish) Whenthose chemicals were banned and pol-
luted waterways were improved thebald eagle was able to reproduce againYoung eagles were reintroduced into
nearby states in the 1980s and a pair
found their way to Connecticut in 1991and successfully raised a family in
1992 Many more pairs have since
found acceptable nesting habitat onland protected by government and pri-vate landowners including utility com-
panies DEEP monitors the eagles withthe assistance of the Bald Eagle StudyGroup and other volunteers
The federal government removed the bald eagle from its list of threatened and endangered spe-cies in 2007 In 2010 Connecticut changed the eagles in-state status from endangered tothreatened The Northern States Bald Eagle Recovery Plan established a goal for Connecticut of
20 breeding birds (10 nests) which was reached for the first time in 2005 The population of baldeagles is included as an indicator because the eagle is representative of species especially preda-tors that share similar habitat requirements large areas of relatively undisturbed land near riv-
ers or lakes where the birds can find adequate supplies of fish and other prey that are ndash very im-portantly ndash only minimally contaminated
27
7312019 Environmental Quality in Connecticut 2011
httpslidepdfcomreaderfullenvironmental-quality-in-connecticut-2011 3048
Rivers + Reservoirs
Drinking Water
Most water companies delivered water that met health standards in 2011
Every public water utility submits monthly quality reports to the Department of Public Health This
indicator shows the percentage of monthly reports that demonstrate full compliance after weight-
ing the reports to account for the number of people served by each utility Though long-termproblems occur they are rare in large systems with the exception of the downturn in 2005 and
2006 caused by a few short-term problems in larger systems This indicator would show greaterfluctuations if the larger systems failed to deliver good water The most commonly encountered
contaminants include bacteria and byproducts of disinfection with an assortment of other chemi-cals and radioactive substances
28
7312019 Environmental Quality in Connecticut 2011
httpslidepdfcomreaderfullenvironmental-quality-in-connecticut-2011 3148
Human Health
Breast Cancer in Connecticut
Connecticut has the highest incidence of breast cancer among the 50 states buthas seen improvement since a peak in the late 1990s
Of every 100000 women in the stateaged 50 to 54 a fair number will dis-
cover each year that they have breast
cancer That number is depicted in
this graph (The Council presents dataon this one age group rather than on
the entire female population to con-trol factors such as changes in the av-erage age of the larger population
age 50 to 54 was selected as a repre-
sentative age group and is used ineach yearrsquos report) To minimize year-
to-year fluctuations groups of years
are averaged together (In otherwords each data point on the graphshows the number of new cases in a
single year but that year is actually the average of five years) While some breast cancers arelinked to genetic factors most are associated with non-genetic factors including diet reproductivehistory lifestyle and external agents
Breast Cancer as an Environmental Indicator
There are numerous studies connecting certain chemicals and other environmental factors tobreast cancer These factors if significant do not appear to be as important statistically as a
womans own reproductive history but it is important to note that breast cancer rates vary great-
ly in different parts of the country Among the 50 states Connecticut has the highest incidence of breast cancer this assessment is based on average incidence rates from 2004 through 2008 thelatest years for which 50-state data are available (Source North American Association of Central
Cancer Registries as reported by the American Cancer Society)
The rate of new cases showed improvement in 2000 through 2004 (using the average of the five
years) and has held steady for the period of 2005 through 2009 (the most recent years for whichConnecticut data are available)
29
7312019 Environmental Quality in Connecticut 2011
httpslidepdfcomreaderfullenvironmental-quality-in-connecticut-2011 3248
Human Health
Non-Hodgkins Lymphoma
The reasons for the steep increase in this cancer during the 20th century are notwell understood but exposures to specific pollutants and chemicals are potential
factors Since 1999 the picture has improved
Non-Hodgkins lymphoma is a cancer of the lymphatic system It begins in the lymphoid tissue
which contains lymphocytes white blood cells that help the body fight infections Lymphocytestravel throughout the body and can carry abnormal lymphocytes spreading the cancer The data
for this indicator are from the Department of Public Healthrsquos Tumor Registry which records all
known cancer cases in the state (Please see the note on the previous page under Breast Cancerin Connecticut about the use of the 50 to 54 age group) Non-Hodgkinrsquos lymphoma has increasedmarkedly since recordkeeping began The reasons are not well understood though the rise of Ac-quired Immune Deficiency Syndrome (AIDS) since the 1980s accounts for some cases Several
studies also cite environmental factors including exposure to diesel exhaust and cer-tain fertilizers pesticides and chemicals In 2000 through 2004 and again in 2005 through 2009
(the most recent years for which data are available) the annual rate of new cases showed im-provement
30
7312019 Environmental Quality in Connecticut 2011
httpslidepdfcomreaderfullenvironmental-quality-in-connecticut-2011 3348
Personal Impact
Driving Our Cars
Nearly every year for 25 years the average Connecticut resident drove moremiles than he or she did in the previous year That trend shifted into reverse in
2008
Driving a car truck or sport utility vehicle is one of the most environmentally harmful activities a
Connecticut resident will engage in personally Impacts are direct (air pollution oil leakage etc)
and indirect (causing demand for new roads) The Department of Transportation estimates thetotal miles driven each year in Connecticut Every year from 2000 through 2007 the averageConnecticut resident drove more miles than in previous years The reasons for the decades of in-
creasing auto use are complex and include the fact that most new development was accessibleonly by private vehicle A decline in miles driven began in 2008 and has continued to 2010 (thelatest year for which data are available) The Connecticut trend lags slightly the national trend
of auto use which showed a dramatic drop in 2007 The national trend towards less driving is be-ing led by the 16 to 34 year-old segment of the population
Personal Impact indicators illustrate trends in behavior or practices that can be expected to influence the condition of tomorrowrsquosair water land and wildlife
31
7312019 Environmental Quality in Connecticut 2011
httpslidepdfcomreaderfullenvironmental-quality-in-connecticut-2011 3448
Personal Impact
Taking the Bus
The average Connecticut resident took the bus slightly more often in 2011
The number of local and commuter bus trips taken by the average resident has changed very li t-
tle over the last 20 years Riding a bus is just one way to avoid the negative environmental con-sequences of driving a car Ridership data are collected by the Department of Transportation Ri-
dership rose about 6 percent in 2006 perhaps in response to high gasoline prices Since thenthere have been slight fluctuations In 2011 per capita ridership was the highest since 2001
Personal impact indicators illustrate trends in behavior or practices that can be expected to influence the condition of tomorrowrsquos air water land and wildlife
32
7312019 Environmental Quality in Connecticut 2011
httpslidepdfcomreaderfullenvironmental-quality-in-connecticut-2011 3548
Personal Impact
Compliance
Compliance with environmental regulations declined for the third year in a row
33
7312019 Environmental Quality in Connecticut 2011
httpslidepdfcomreaderfullenvironmental-quality-in-connecticut-2011 3648
Who is breaking Connecticuts environmental laws To find out the Council classified all 944 No-tices of Violation (NOVs) issued by DEEP during fiscal year 2011 The conclusions are summa-
rized in a staff memo and the types of violators are characterized in a series of charts The Coun-
cil does not have data on the publicrsquos perceptions of who the violators are but it senses from eve-ryday conversations that people suppose them to be factories utilities waste disposal facilitiesand perhaps pesticide applicators -- a perception that does not match the data The vast majority
of businesses where violations were found were small companies and most violations were re-
lated to the storage transport or distribution of petroleum The largest group by far were gasstations and convenience stores Only seven percent of NOVs were issued to manufacturers withmore than 20 employees -- fewer than the number that went to individual citizens
This indicator shows the approximate percentage of inspections performed by DEEP that foundthe inspected facilities in full compliance with pertinent environmental laws and regulations
(Monitoring data self-reported by permit holders are not included here) In 2010 and 2011 DEEPstepped up enforcement activity in its underground (petroleum) storage tank program and issuedmany more Notices of Violation (NOVs) than in previous years
The overall compliance rate rarely has been better than 90 percent Generally compliance withair quality regulations is higher than with waste and water regulations The average compliance
rate for all programs declined from 90 percent in 2008 to 89 percent in 2009 86 percent in 2010
and 83 percent in 2011 (The sharp downturn of 2002 was due to a surge in NOVs in a single airprogram Stage II Vapor Recovery at gas stations)
The number of inspections (not shown) declined between 1997 and 2007 increased in 2008 anddeclined again in 2009 through 2011 to its lowest number in 15 years Any relationship betweenthe number of inspections and rate of compliance is uncertain The relative stability of the com-
pliance rate in the face of ever-diminishing staff resources might be regarded as a success for the
DEEP However the failure of the state-- government businesses and residents together -- toadvance affirmatively toward the goal of full compliance is apparent
Personal Impact indicators illustrate trends in behavior or practices that can be expected to influence the condition of tomorrowrsquosair water land and wildlife
Notices of Violation (NOVs) are informal enforcement tools generally issued whenever DEEP detects one or more violations at a
facility They carry no financial penalty The recipient has 30 days to respond They can be issued for relatively minor or majorviolations in cases of the latter type the recipient might also receive an order which might carry a financial penalty NOVs typi-cally outnumber orders by a factor of five or more in any year NOVs are good indicators of trends in violations because almost allviolations found through inspections result in NOVs
Some inspections of compliance with air quality regulations are conducted by the Department of Consumer Protection pursuantto an agreement with DEEP these inspections also are used in calculating compliance rates
34
7312019 Environmental Quality in Connecticut 2011
httpslidepdfcomreaderfullenvironmental-quality-in-connecticut-2011 3748
Personal Impact
Recycling
Some municipalities and regional waste authorities have reported greater partici-pation in recycling programs since adopting single-stream recycling However
notable progress towards the statewide goal remains elusive
The General Assembly es-
tablished a goal of reduc-ing and recycling 40 per-cent of Connecticuts mu-
nicipal solid waste streamby the year 2000 (Sec22a-220(f)) That
goal was never met and
the consequences havebeen enormous Hundredsof thousands of tons of
waste were shipped out
of Connecticut in manyyears putting thousands of diesel trucks on the high-
ways for trips of many
hundred miles One conse-quence of this needless
truck traffic is the yearly
addition of 300000 ormore pounds of diesel pol-lutants into the air Anoth-
er consequence is finan-cial one ton that is re-cycled instead of burned or
landfilled can save a municipality hauler or resident from $40 to $93 according to a 2010 report of the Legislative Program Review and Investigations Committee
As total tonnage of waste has grown the percent that is recycled has not In 2006 DEEP amendedthe State Solid Waste Management Plan to include a goal of diverting 58 percent of Connecticutrsquosmunicipal solid waste stream from disposal by 2024 This would be accomplished through recy-
cling composting and waste reduction (such as use of lighter packaging material) If this goal ismet Connecticut will be able to manage all of its garbage without exporting it
DEEP reports suggest that the official figures slightly underestimate actual recycling volume Thegap in the graph reflects a lack of available data is for the years between 2004 and 2008
35
7312019 Environmental Quality in Connecticut 2011
httpslidepdfcomreaderfullenvironmental-quality-in-connecticut-2011 3848
Personal Impact
Climate Changers
The average resident is causing less carbon dioxide to be put onto the atmos-phere a result of lower petroleum consumption
Certain gases in the air func-
tion like the glass of a green-
house they allow the sunsenergy to pass through the
atmosphere to the ground
then trap the heat that ra-diates from the ground Thesegases are often called green-
house gases Worldwide a
build-up of greenhouse gases is contributing to the ongoing
rise in temperature Carbon
dioxide is not the only green-house gas nor even the mostpowerful but carbon dioxide
emissions are far greater in
quantity than the othersThe chart shows the total
emissions of carbon dioxide
emitted from burning of petroleum natural gas and coal in Connecticut divided by the population
A 2008 state law set two goals for reducing greenhouse gas emissions reduce statewide emis-sions to 10 percent below 1990 levels by 2020 and 80 percent below 2001 levels by 2050The chart above shows emissions per Connecticut resident not total emissions and there-
fore displays the goals after adjusting them to account for the larger population that is pro-
jected for 2020 and 2050 There are expected to be hundreds of thousands more people living inConnecticut in 2020 and 2050 so the average resident will have to work that much harder to re-duce carbon dioxide emissions if the statewide goal is to be met
Most human-generated carbon dioxide results from the combustion of fuels in houses businesses
power plants and vehicles and the last of these is the largest source Connecticut is more ener-
gy-efficient than the nation as a whole and the average Connecticut residents contribution toglobal climate change is less than the average Americans
Technical Note The Council has changed the data source for this indicator In previous years da-ta was available for all greenhouse gases not just carbon dioxide However to bring the chartmore up to date the Council switched to a source that includes carbon dioxide only Because the
other gases are emitted in small quantities the carbon dioxide data by themselves give an accu-rate picture of trends in greenhouse gas emissions The most recent data available even for car-bon dioxide alone are from 2009
36
7312019 Environmental Quality in Connecticut 2011
httpslidepdfcomreaderfullenvironmental-quality-in-connecticut-2011 3948
Personal Impact
Electricity at Home and Work
At Home
The average Connecticut resident used slightly less electricity at home in 2011
Thousands of households have been signing up annually to buy electricity gener-ated by renewable energy sources through the CTCleanEnergyOptions program
37
7312019 Environmental Quality in Connecticut 2011
httpslidepdfcomreaderfullenvironmental-quality-in-connecticut-2011 4048
Through 2009 the majority of Connecticut households did not purchase the mostefficient refrigerators or air conditioners This trend probably has not changedbut more recent data are not available and this indicator will be discontinued
At Work
For three years in a row Connecticut businesses have used electricity more effi-ciently to produce goods and services
38
7312019 Environmental Quality in Connecticut 2011
httpslidepdfcomreaderfullenvironmental-quality-in-connecticut-2011 4148
Efficiency at Home The average Connecticut household has been consuming less electricity since the peak
usage year of 2007 despite a brief reversal in 2010 According to the Connecticut Siting Council peak de-mand occurs during hot humid summer days due to air conditioner demand The increase in summertimeconsumption has had significant environmental consequences On the hottest days Connecticutrsquos base-loadpower plants are unable to meet the additional demand and older petroleum-fueled plants are brought online Because they are used sporadically many of these older plants are permitted to operate with no pollu-tion control equipment As a result state residents generate the most air pollution on the hottest summerdays when air quality is already bad
The vast majority of Connecticutrsquos electricity is generated from nuclear energy and the combustion of naturalgas oil and coal Hydropower solar and other renewable resources are small but growing sources of elec-tricity Each source renewable or not has its own negative environmental consequences Reducing thoseconsequences will require Connecticut households to use electricity much more efficiently Such efficiencycan be attained in part with ENERGY STAR appliances
Efficiency in the Kitchen In a typical home the refrigerator consumes more electricity than any otherappliance (Central air conditioning uses more but is not in everyonersquos home) To be labeled ENERGY STAR efficient a full-size refrigerator must operate using at least 20 percent less energy than the federal stan-dards for household appliances
ENERGY STAR appliance sales figures had been collected from voluntary reports by retailers to the ENERGY
STAR program Data on sales by state are no longer available For Connecticut 2009 data are the most re-cent available In 2009 38 percent of refrigerators bought by Connecticut consumers were ENERGY STARefficient a decrease from its peak (44 percent) in 2005 Sales trends for ENERGY STAR air conditioners al-so dropped in 2009 to 42 percent from 44 percent in 2008 Public surveys have shown conclusively thatmost people are aware of the ENERGY STAR label and what it means so reasons other than awareness mustbe addressed to boost ENERGY STAR labeled product sales and stem the ongoing waste of electricity inhomes
The ENERGY STAR program was created in 1992 as a joint effort of the US Environmental Protection Agen-cy and the US Department of Energy to identify and label energy efficient products By consuming lesselectricity ENERGY STAR products help to reduce air pollution and greenhouse gas emissions
The Connecticut Energy Efficiency Fund has partnered with Top Ten USA to help consumers find the mostenergy efficient appliances
Buying Cleaner Energy The CTCleanEnergyOptions program enables customers to sign up to pur-
chase electricity from renewable sources that include wind and low-impact hydroelectric (water power) Par-ticipation has grown steadily though the rate of increased participation is slowing There were 7 per-cent more participants in the program in 2011 than in 2010 The electricity that actually enters these housesis not necessarily from renewable sources The consumer who elects this option is paying for the generationof renewable electricity on the regional electric grid This reduces the amount of electricity that otherwisewould be generated by nuclear coal oil and natural gas-fired generating plants all of which create pollutionCTCleanEnergyOptions is a collaborative program administered by the Clean Energy Finance and InvestmentAuthority
Efficiency at work The bottom graph shows trends in the efficiency with which Connecticutrsquos economyuses electricity to produce goods and services Connecticuts businesses generally have been producing more
goods and services with less electricity State Gross Domestic Product (GDP) represents the total value of goods and services produced within the state in a single year Payment to employees constitutes about 60percent of the GDP In 2010 (the most recent data available) the Bureau of Economic Analysis put Connect-icuts GDP at $237 billion (current dollars) From 2009 to 2010 the GDP grew twice as fast as electricity con-sumption by Connecticuts industrial and commercial sectors Preliminary data for 2011 suggest that therewas no change in efficiency The long-term positive trend demonstrates that with advances in energy effi-cient technology it is possible for Connecticutrsquos economy to continue growing while using electricity moreefficiently
39
7312019 Environmental Quality in Connecticut 2011
httpslidepdfcomreaderfullenvironmental-quality-in-connecticut-2011 4248
Activities of the CEQ in 2011
June saw the 40th anniversary of the legislation that created the Council on Environmen-
tal Quality (CEQ) The Councils first meeting was held in the fall of 1971 Previous re-
ports looked back at some of those early events In the more recent past the Coun-
cils 41st year was one of its busiest and most productive
Research and Reports
The Council published Environmental Quality in Connecticut in April 2011 identifying
Routes to Progress that would move some of Connecticuts environmental indicators in
a positive direction
The Council is required to recommend legislation for identifying the deficiencies of exist-
ing programs and activities The Council published those in January 2012
From time to time the Council asks staff to prepare updates to previous reports Exam-
ples from 2011 include a staff memo on environmental regulation and the growth of
small businesses and a memo on the benefits to Connecticut of a new federal initiative to
reduce mercury pollution
Review of State Projects and Programs
In December 2010 the Council received complaints and inquiries about a state grant fora boat launch facility that was awarded without the environmental review and public no-
tice required by the Connecticut Environmental Policy Act (CEPA) After review the
Council advised the Commissioner of Energy and Environmental Protection of the appli-
cability of CEPA Ultimately the Department of Energy and Environmental Protection
(DEEP) declined to conduct an evaluation The Councils conclusion is summarized in a
2011 letter to one of the citizens who contacted the Council
Council research in 2010 found that one of the most polluting power plants in the state is
located in Hartford and is generally only used on the hottest days of the year when air
quality is already at its worst In December 2011 DEEP published notice of its intent torenew the air pollution permit for the plant Seeing several problems in the draft permit
as well as opportunities to improve and perhaps phase out use of the plant the Council
submitted detailed comments As of press time the permit renewal is still pending
40
7312019 Environmental Quality in Connecticut 2011
httpslidepdfcomreaderfullenvironmental-quality-in-connecticut-2011 4348
The Council continued to improve the Environmental Monitor to accommodate changes in
CEPA most recently to add public notices in cases where agencies decide not to com-
plete an environmental impact evaluation after it has conducted a public scoping
process
Citizen Complaints
As noted in reports of the past two years citizens of Haddam have spoken repeatedly to
the Council about contamination of land and groundwater that has existed in their com-
munity for more than 25 years Among many issues the apparent lack of remedial ac-
tion by one company was of particular note as the company had been required by the
DEEP to investigate the contamination and prepare a clean-up plan The Council decided
to follow this case in detail in order to learn more about the adequacy of existing laws
and programs In April 2010 the Council wrote to DEEP recommending enforcement ac-
tion against the company in question DEEP began legal action against the company in
late 2010 As of May 2012 there has been some study by the landowner as well as addi-
tional legal and bureaucratic action but to date no remediation
Along with many other parties the Council participated throughout 2011 in DEEPs ongo-
ing effort to transform remediation laws and programs The Councils close attention to
the Haddam case has yielded several insights into problems that need to be fixed
Aside from remediation the following are a sample of the many other complaints inves-
tigated in 2011
Dumping on a state university campus
Lack of notice of pesticide spraying on a railroad right-of-way as railroads are ex-
empt from the law governing notification of abutting homeowners
Pesticides and other contaminants in the wells of many homes in one neighbor-
hood
Apparent misinformation in an application for a proposed large drinking water
well with no effective consequences for providing wrong or misleading informa-
tion
Several matters relating to the siting of telecommunications towers including the
need to consider their effect on bird migration corridors preserved natural
areas and coastal areas
Pollution from outdoor wood furnaces both legal and illegal
The Council researched all of the complaints it received and offered recommendations to
the relevant state agencies where warranted Some problems such as illegal tree re-
moval on private property will require legislative action to correct
41
7312019 Environmental Quality in Connecticut 2011
httpslidepdfcomreaderfullenvironmental-quality-in-connecticut-2011 4448
The Word from Mansfield
The Council periodically holds public forums in different parts of the state to learn what
environmental topics are most on residentsrsquo minds The information presented at these
forums has been extremely useful to the Council
In July 2011 the Council heard from many citizens and municipal officials in Mans-
field They spoke about numerous environmental problems many involving the ac-
tions and responsibilities of state agencies Others suggested interesting directions for
the future of the state and its environment The Council investigated all of them and re-
sponded to each speaker Many investigations led to actions by state agencies andor
recommendations for legislation Read a complete summary of the speakers and the is-
sues they raised
Advice From the Public
In November of 2011 the Council released its required recommendations for corrective
legislation in draft form and invited the public to weigh in Citizens and organizations
spoke to the Council at a public forum held in the Legislative Office Building in Hartford
and many others submitted written comments Read a complete summary Their in-
sights technical advice and opinions proved a big help to the Council in preparing its fi-
nal recommendations which were submitted to Governor Dannel P Malloy and the Gen-
eral Assembly in January 2012
___________
In addition to the dozens who spoke at the public forums the Council heard from organi-zations at regular monthly meetings These included DEEP the University of ConnecticutNorth Stamford Concerned Citizens for the Environment Citizens for Clean GroundwaterRivers Alliance of Connecticut Sierra Club and others
Many people across the state expressed their concerns during 2011 The Council workedto address them all and truly appreciates the efforts people made to bring environmen-tal problems to light The Council looks forward to helping citizens and agenciessolve the challenges of 2012 and beyond
42
7312019 Environmental Quality in Connecticut 2011
httpslidepdfcomreaderfullenvironmental-quality-in-connecticut-2011 4548
The release of this edition of Environmental Quality in Connecticut marks 41 years of CEQ service
Council Duties
The duties of the Council on Environmental Quality are described in Sections 22a-11through 22a-13 of the Connecticut General Statutes
The Council is a nine-member board that works independently of the Department of Energy and Environmental Protection (except for administrative functions) The Chair-man and four other members are appointed by the Governor two members by the Pres-ident Pro Tempore of the Senate and two by the Speaker of the House The Councilrsquosprimary responsibilities include
1 Submittal to the Governor of an annual report on the status of Connecticutrsquos env i-ronment including progress toward goals of the statewide environmental planwith recommendations for remedying deficiencies of state programs
2 Review of state agenciesrsquo construction projects3 Investigation of citizensrsquo complaints and allegations of violations of environmental
laws
In addition under the Connecticut Environmental Policy Act (CEPA) and its attendantregulations the Council on Environmental Quality reviews Environmental Impact Evalua-tions that state agencies develop for major projects The Council publishes the Environ-mental Monitor the official publication for scoping notices and environmental impactevaluations for state projects under CEPA The Environmental Monitor also is the officialpublication for notice of intent by state agencies to sell or transfer state lands
43
7312019 Environmental Quality in Connecticut 2011
httpslidepdfcomreaderfullenvironmental-quality-in-connecticut-2011 4648
CEQ Members
Barbara C Wagner (Chair)Resident of Glastonbury Attorney with law office in Glastonbury specializing in commer-cial and residential real estate Executive Director Wind Hill Community Farm Glaston-bury Member Glastonbury Town Council 2000-2010 Co-Founder and Board Member of
Town Center Initiative addressing walkability issues in Glastonburyrsquos center Board of Trustees Diamond Lake Land Trust Former member State Open Space and WatershedLand Acquisition Board
M Howard BeachResident of Simsbury Conservation amp Zoning Compliance Officer Planning AnalystTown of Simsbury Member Simsbury Conservation Inland Wetlands Commission from1980 to 2004 Chairman from 1994 to 2004 Member Board of Directors The Farming-ton River Watershed Association 2004 to 2006 Life Member and past Board MemberSimsbury Land Conservation Trust Founding Member Farmington Valley BiodiversityProject Member Town of Simsbury Open Space Committee 1999 to 2004 Member CTDevelopers Council Member Government Affairs Committee Simsbury Chamber of
Commerce In 2004 completed a Masters Degree in Environmental Law at Vermont LawSchool
Janet P BrooksResident of Middletown Attorney with law office in East Berlin with a practice in envi-ronmental administrative and land use law Member of the Connecticut Bar AssociationPlanning amp Zoning Section and Environment Section Co-author of Connecticut Environ-mental Protection Act Volume 15 of the Connecticut Practice Series published by Thom-son West Formerly Assistant Attorney General in the Environment Department of theConnecticut Attorney Generalrsquos (AGs) Office for 18 years enforcing the statersquos environ-mental laws running the gamut from noise odor water pollution air pollution pesticides
to habitat protection and preservation of land While at the AGrsquos Office coordinated thewetlands appeal practice and developed the legal training for wetlands commissioners forDEEPrsquos annual training Recipient of 1984 German Marshall Fund grant to study the ef-fect of citizen participation on hazardous waste clean-ups in four European countriesBased on those experiences authored a chapter published in Americarsquos Future in Toxic Waste Management Lessons from Europe Staff Attorney for five years at the Connecti-cut Fund for the Environment Inc representing citizens groups in administrative andcourt proceedings Began practice of law assisting the Middletown City Attorney in thecityrsquos opposition to the utility companyrsquos burning of PCB waste oil with in the city bounda-ries
Liz ClarkResident of West Hartford
44
7312019 Environmental Quality in Connecticut 2011
httpslidepdfcomreaderfullenvironmental-quality-in-connecticut-2011 4748
Bruce R FernandezResident of Farmington Retired after 18 years owning and managing a software busi-ness serving insurance companies and independent agencies Prior to that was a con-sulting engineer specializing in energy efficient power plants and paper mills Vice-President of Operations of a small utility serving Bronxville NY and a jet engine de-signtest engineer Masters degrees in Engineering and Management Served in UnitedStates Army Corps of Engineers as small unit commander served in Vietnam and tenyears in Army Reserves Member Board of Directors Farmington Land Trust
Karyl Lee Hall Resident of Branford Attorney with the Connecticut Legal Rights Project Formerly withMurtha Cullina the Connecticut Fund for the Environment and Connecticut Legal Servic-es Co-Chair Branford Conservation Commission Co-chair Scenic Roads AdvisoryCommittee for Routes 146 and 77 Member Advisory Board Branford Land Trust Vice
President Citizens for Branfordrsquos Environment 2002-2009 Connecticut Bar AssociationPro Bono Service Award 2003 Former Co-chair State Implementation Plan [for AirManagement] Revision Advisory Committee
Richard Sherman Resident of Chaplin Architectural designer and construction manager of earth shelteredpassive solar and energy efficient residences Former CEQ Representative to the Route 6Advisory Committee (during previous term on CEQ) Charter Member Transit Alliance of Eastern CT and Citizens for a Sensible Six Former Organizer the Progress and EquityPartnership Member of CEPA Working Group League of Conservation Voters of CTFormer President Northeast Chapter of ACLU-CT Board of Directors Member of PeoplesAction for Clean Energy (PACE) and Northeast Sustainable Energy Association (NESEA)Former Chair Mansfield Transportation Advisory Committee Former President Mans-field Commonground Member Mansfield Planning and Zoning Design Review PanelFormer Chair Mansfield Democratic Town Committee Host and producer of the radio
show A Distant Shore on WHUS (917 FM Storrs) Former Public Affairs Director of WHUS Stopover host American Tour dSol solar electric car race
Norman VanCor(member through April 2012)Resident of Harwinton Owner of Buy Safe Home Inspection LLC and Mizzentop Antiqui-ties Served in United States Marine Corp in Vietnam Awarded the Navy Cross Vietnam-ese Cross of Gallantry and other decorations One of first ten inductees to CT VeteransHall of Fame Former Director Yankee Energy in sales marketing government relationscommunications Founding member and President Emeritus Quinnipiac River WatershedAssociation Former member Rivers Advisory Committee Former Chairman SouthingtonConservation Commission Former host of radio program on environmental topics For-
mer President Southington Water Works Former member Board of Directors of Opera-tion Fuel Active Pheresis donor at American Red Cross with over 37 gallons of wholeblood and platelet donations Former Volunteer Hunter Safety Instructor for the DEEPConservation Education Program Certified Master Gardener
45
7312019 Environmental Quality in Connecticut 2011
httpslidepdfcomreaderfullenvironmental-quality-in-connecticut-2011 4848
Acknowledgments
The Council appreciates the assistance of the many people in the Departments of Agri-culture Energy and Environmental Protection Transportation and Public Health and theConnecticut Siting Council who provided data Researchers at the Center for LanduseEducation and Research (CLEAR) at the University of Connecticut provided very valuable
data
The Council especially thanks the many citizens businesses and organizations who of-fered information and viewpoints to the Council throughout the year
The Council also appreciates the work of its Executive Director Karl Wagener and Envi-ronmental Analyst Peter Hearn in drafting this report for review by the Council and pre-paring the final version for publication
The Council notes the valuable contributions of Eric Walsh an intern from the Universityof Connecticut Law School and Avery Yoshimine an intern from the University of Con-necticut their research contributed greatly to this report
Contact the CEQ
We would like to hear from you Does this report give you the information on Connecticuts environment that you need Is
there something missing
79 Elm Street
Hartford CT 06106
Phone
860-424-4000
(messages can be left 24 hours a day)
Fax
860-424-4070
karlwagenerctgov
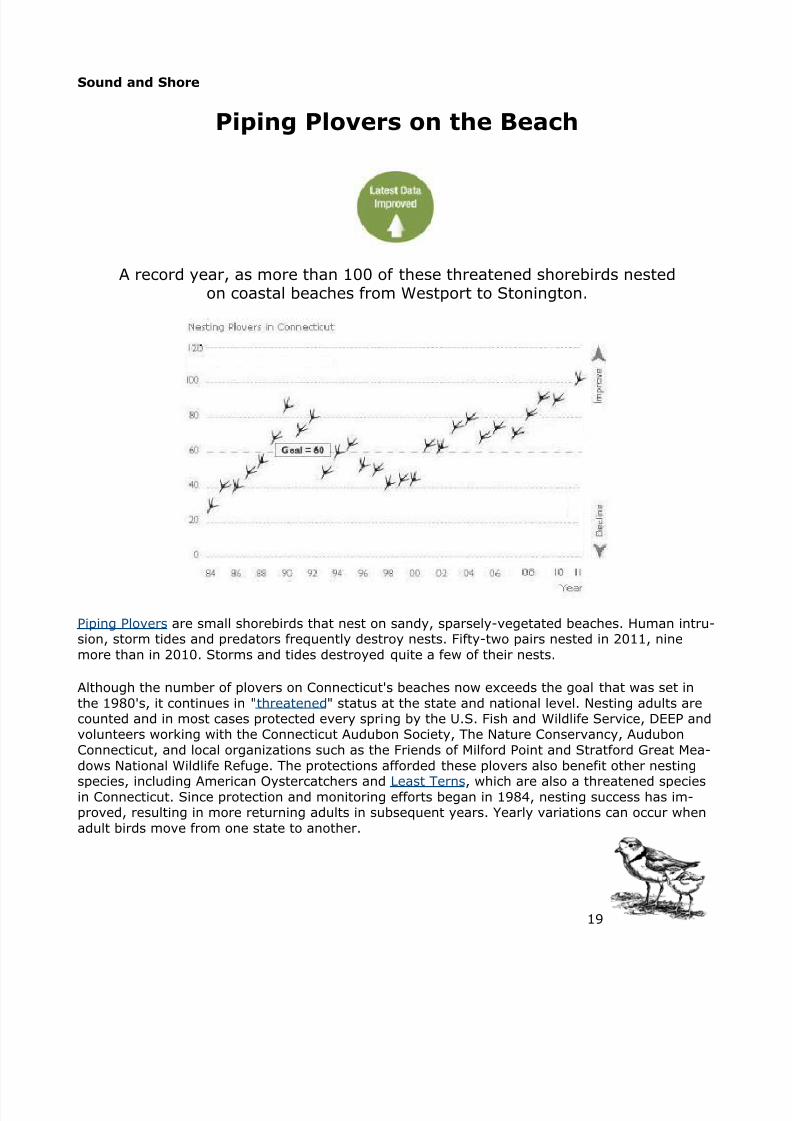
7312019 Environmental Quality in Connecticut 2011
httpslidepdfcomreaderfullenvironmental-quality-in-connecticut-2011 3548
Personal Impact
Compliance
Compliance with environmental regulations declined for the third year in a row
33
7312019 Environmental Quality in Connecticut 2011
httpslidepdfcomreaderfullenvironmental-quality-in-connecticut-2011 3648
Who is breaking Connecticuts environmental laws To find out the Council classified all 944 No-tices of Violation (NOVs) issued by DEEP during fiscal year 2011 The conclusions are summa-
rized in a staff memo and the types of violators are characterized in a series of charts The Coun-
cil does not have data on the publicrsquos perceptions of who the violators are but it senses from eve-ryday conversations that people suppose them to be factories utilities waste disposal facilitiesand perhaps pesticide applicators -- a perception that does not match the data The vast majority
of businesses where violations were found were small companies and most violations were re-
lated to the storage transport or distribution of petroleum The largest group by far were gasstations and convenience stores Only seven percent of NOVs were issued to manufacturers withmore than 20 employees -- fewer than the number that went to individual citizens
This indicator shows the approximate percentage of inspections performed by DEEP that foundthe inspected facilities in full compliance with pertinent environmental laws and regulations
(Monitoring data self-reported by permit holders are not included here) In 2010 and 2011 DEEPstepped up enforcement activity in its underground (petroleum) storage tank program and issuedmany more Notices of Violation (NOVs) than in previous years
The overall compliance rate rarely has been better than 90 percent Generally compliance withair quality regulations is higher than with waste and water regulations The average compliance
rate for all programs declined from 90 percent in 2008 to 89 percent in 2009 86 percent in 2010
and 83 percent in 2011 (The sharp downturn of 2002 was due to a surge in NOVs in a single airprogram Stage II Vapor Recovery at gas stations)
The number of inspections (not shown) declined between 1997 and 2007 increased in 2008 anddeclined again in 2009 through 2011 to its lowest number in 15 years Any relationship betweenthe number of inspections and rate of compliance is uncertain The relative stability of the com-
pliance rate in the face of ever-diminishing staff resources might be regarded as a success for the
DEEP However the failure of the state-- government businesses and residents together -- toadvance affirmatively toward the goal of full compliance is apparent
Personal Impact indicators illustrate trends in behavior or practices that can be expected to influence the condition of tomorrowrsquosair water land and wildlife
Notices of Violation (NOVs) are informal enforcement tools generally issued whenever DEEP detects one or more violations at a
facility They carry no financial penalty The recipient has 30 days to respond They can be issued for relatively minor or majorviolations in cases of the latter type the recipient might also receive an order which might carry a financial penalty NOVs typi-cally outnumber orders by a factor of five or more in any year NOVs are good indicators of trends in violations because almost allviolations found through inspections result in NOVs
Some inspections of compliance with air quality regulations are conducted by the Department of Consumer Protection pursuantto an agreement with DEEP these inspections also are used in calculating compliance rates
34
7312019 Environmental Quality in Connecticut 2011
httpslidepdfcomreaderfullenvironmental-quality-in-connecticut-2011 3748
Personal Impact
Recycling
Some municipalities and regional waste authorities have reported greater partici-pation in recycling programs since adopting single-stream recycling However
notable progress towards the statewide goal remains elusive
The General Assembly es-
tablished a goal of reduc-ing and recycling 40 per-cent of Connecticuts mu-
nicipal solid waste streamby the year 2000 (Sec22a-220(f)) That
goal was never met and
the consequences havebeen enormous Hundredsof thousands of tons of
waste were shipped out
of Connecticut in manyyears putting thousands of diesel trucks on the high-
ways for trips of many
hundred miles One conse-quence of this needless
truck traffic is the yearly
addition of 300000 ormore pounds of diesel pol-lutants into the air Anoth-
er consequence is finan-cial one ton that is re-cycled instead of burned or
landfilled can save a municipality hauler or resident from $40 to $93 according to a 2010 report of the Legislative Program Review and Investigations Committee
As total tonnage of waste has grown the percent that is recycled has not In 2006 DEEP amendedthe State Solid Waste Management Plan to include a goal of diverting 58 percent of Connecticutrsquosmunicipal solid waste stream from disposal by 2024 This would be accomplished through recy-
cling composting and waste reduction (such as use of lighter packaging material) If this goal ismet Connecticut will be able to manage all of its garbage without exporting it
DEEP reports suggest that the official figures slightly underestimate actual recycling volume Thegap in the graph reflects a lack of available data is for the years between 2004 and 2008
35
7312019 Environmental Quality in Connecticut 2011
httpslidepdfcomreaderfullenvironmental-quality-in-connecticut-2011 3848
Personal Impact
Climate Changers
The average resident is causing less carbon dioxide to be put onto the atmos-phere a result of lower petroleum consumption
Certain gases in the air func-
tion like the glass of a green-
house they allow the sunsenergy to pass through the
atmosphere to the ground
then trap the heat that ra-diates from the ground Thesegases are often called green-
house gases Worldwide a
build-up of greenhouse gases is contributing to the ongoing
rise in temperature Carbon
dioxide is not the only green-house gas nor even the mostpowerful but carbon dioxide
emissions are far greater in
quantity than the othersThe chart shows the total
emissions of carbon dioxide
emitted from burning of petroleum natural gas and coal in Connecticut divided by the population
A 2008 state law set two goals for reducing greenhouse gas emissions reduce statewide emis-sions to 10 percent below 1990 levels by 2020 and 80 percent below 2001 levels by 2050The chart above shows emissions per Connecticut resident not total emissions and there-
fore displays the goals after adjusting them to account for the larger population that is pro-
jected for 2020 and 2050 There are expected to be hundreds of thousands more people living inConnecticut in 2020 and 2050 so the average resident will have to work that much harder to re-duce carbon dioxide emissions if the statewide goal is to be met
Most human-generated carbon dioxide results from the combustion of fuels in houses businesses
power plants and vehicles and the last of these is the largest source Connecticut is more ener-
gy-efficient than the nation as a whole and the average Connecticut residents contribution toglobal climate change is less than the average Americans
Technical Note The Council has changed the data source for this indicator In previous years da-ta was available for all greenhouse gases not just carbon dioxide However to bring the chartmore up to date the Council switched to a source that includes carbon dioxide only Because the
other gases are emitted in small quantities the carbon dioxide data by themselves give an accu-rate picture of trends in greenhouse gas emissions The most recent data available even for car-bon dioxide alone are from 2009
36
7312019 Environmental Quality in Connecticut 2011
httpslidepdfcomreaderfullenvironmental-quality-in-connecticut-2011 3948
Personal Impact
Electricity at Home and Work
At Home
The average Connecticut resident used slightly less electricity at home in 2011
Thousands of households have been signing up annually to buy electricity gener-ated by renewable energy sources through the CTCleanEnergyOptions program
37
7312019 Environmental Quality in Connecticut 2011
httpslidepdfcomreaderfullenvironmental-quality-in-connecticut-2011 4048
Through 2009 the majority of Connecticut households did not purchase the mostefficient refrigerators or air conditioners This trend probably has not changedbut more recent data are not available and this indicator will be discontinued
At Work
For three years in a row Connecticut businesses have used electricity more effi-ciently to produce goods and services
38
7312019 Environmental Quality in Connecticut 2011
httpslidepdfcomreaderfullenvironmental-quality-in-connecticut-2011 4148
Efficiency at Home The average Connecticut household has been consuming less electricity since the peak
usage year of 2007 despite a brief reversal in 2010 According to the Connecticut Siting Council peak de-mand occurs during hot humid summer days due to air conditioner demand The increase in summertimeconsumption has had significant environmental consequences On the hottest days Connecticutrsquos base-loadpower plants are unable to meet the additional demand and older petroleum-fueled plants are brought online Because they are used sporadically many of these older plants are permitted to operate with no pollu-tion control equipment As a result state residents generate the most air pollution on the hottest summerdays when air quality is already bad
The vast majority of Connecticutrsquos electricity is generated from nuclear energy and the combustion of naturalgas oil and coal Hydropower solar and other renewable resources are small but growing sources of elec-tricity Each source renewable or not has its own negative environmental consequences Reducing thoseconsequences will require Connecticut households to use electricity much more efficiently Such efficiencycan be attained in part with ENERGY STAR appliances
Efficiency in the Kitchen In a typical home the refrigerator consumes more electricity than any otherappliance (Central air conditioning uses more but is not in everyonersquos home) To be labeled ENERGY STAR efficient a full-size refrigerator must operate using at least 20 percent less energy than the federal stan-dards for household appliances
ENERGY STAR appliance sales figures had been collected from voluntary reports by retailers to the ENERGY
STAR program Data on sales by state are no longer available For Connecticut 2009 data are the most re-cent available In 2009 38 percent of refrigerators bought by Connecticut consumers were ENERGY STARefficient a decrease from its peak (44 percent) in 2005 Sales trends for ENERGY STAR air conditioners al-so dropped in 2009 to 42 percent from 44 percent in 2008 Public surveys have shown conclusively thatmost people are aware of the ENERGY STAR label and what it means so reasons other than awareness mustbe addressed to boost ENERGY STAR labeled product sales and stem the ongoing waste of electricity inhomes
The ENERGY STAR program was created in 1992 as a joint effort of the US Environmental Protection Agen-cy and the US Department of Energy to identify and label energy efficient products By consuming lesselectricity ENERGY STAR products help to reduce air pollution and greenhouse gas emissions
The Connecticut Energy Efficiency Fund has partnered with Top Ten USA to help consumers find the mostenergy efficient appliances
Buying Cleaner Energy The CTCleanEnergyOptions program enables customers to sign up to pur-
chase electricity from renewable sources that include wind and low-impact hydroelectric (water power) Par-ticipation has grown steadily though the rate of increased participation is slowing There were 7 per-cent more participants in the program in 2011 than in 2010 The electricity that actually enters these housesis not necessarily from renewable sources The consumer who elects this option is paying for the generationof renewable electricity on the regional electric grid This reduces the amount of electricity that otherwisewould be generated by nuclear coal oil and natural gas-fired generating plants all of which create pollutionCTCleanEnergyOptions is a collaborative program administered by the Clean Energy Finance and InvestmentAuthority
Efficiency at work The bottom graph shows trends in the efficiency with which Connecticutrsquos economyuses electricity to produce goods and services Connecticuts businesses generally have been producing more
goods and services with less electricity State Gross Domestic Product (GDP) represents the total value of goods and services produced within the state in a single year Payment to employees constitutes about 60percent of the GDP In 2010 (the most recent data available) the Bureau of Economic Analysis put Connect-icuts GDP at $237 billion (current dollars) From 2009 to 2010 the GDP grew twice as fast as electricity con-sumption by Connecticuts industrial and commercial sectors Preliminary data for 2011 suggest that therewas no change in efficiency The long-term positive trend demonstrates that with advances in energy effi-cient technology it is possible for Connecticutrsquos economy to continue growing while using electricity moreefficiently
39
7312019 Environmental Quality in Connecticut 2011
httpslidepdfcomreaderfullenvironmental-quality-in-connecticut-2011 4248
Activities of the CEQ in 2011
June saw the 40th anniversary of the legislation that created the Council on Environmen-
tal Quality (CEQ) The Councils first meeting was held in the fall of 1971 Previous re-
ports looked back at some of those early events In the more recent past the Coun-
cils 41st year was one of its busiest and most productive
Research and Reports
The Council published Environmental Quality in Connecticut in April 2011 identifying
Routes to Progress that would move some of Connecticuts environmental indicators in
a positive direction
The Council is required to recommend legislation for identifying the deficiencies of exist-
ing programs and activities The Council published those in January 2012
From time to time the Council asks staff to prepare updates to previous reports Exam-
ples from 2011 include a staff memo on environmental regulation and the growth of
small businesses and a memo on the benefits to Connecticut of a new federal initiative to
reduce mercury pollution
Review of State Projects and Programs
In December 2010 the Council received complaints and inquiries about a state grant fora boat launch facility that was awarded without the environmental review and public no-
tice required by the Connecticut Environmental Policy Act (CEPA) After review the
Council advised the Commissioner of Energy and Environmental Protection of the appli-
cability of CEPA Ultimately the Department of Energy and Environmental Protection
(DEEP) declined to conduct an evaluation The Councils conclusion is summarized in a
2011 letter to one of the citizens who contacted the Council
Council research in 2010 found that one of the most polluting power plants in the state is
located in Hartford and is generally only used on the hottest days of the year when air
quality is already at its worst In December 2011 DEEP published notice of its intent torenew the air pollution permit for the plant Seeing several problems in the draft permit
as well as opportunities to improve and perhaps phase out use of the plant the Council
submitted detailed comments As of press time the permit renewal is still pending
40
7312019 Environmental Quality in Connecticut 2011
httpslidepdfcomreaderfullenvironmental-quality-in-connecticut-2011 4348
The Council continued to improve the Environmental Monitor to accommodate changes in
CEPA most recently to add public notices in cases where agencies decide not to com-
plete an environmental impact evaluation after it has conducted a public scoping
process
Citizen Complaints
As noted in reports of the past two years citizens of Haddam have spoken repeatedly to
the Council about contamination of land and groundwater that has existed in their com-
munity for more than 25 years Among many issues the apparent lack of remedial ac-
tion by one company was of particular note as the company had been required by the
DEEP to investigate the contamination and prepare a clean-up plan The Council decided
to follow this case in detail in order to learn more about the adequacy of existing laws
and programs In April 2010 the Council wrote to DEEP recommending enforcement ac-
tion against the company in question DEEP began legal action against the company in
late 2010 As of May 2012 there has been some study by the landowner as well as addi-
tional legal and bureaucratic action but to date no remediation
Along with many other parties the Council participated throughout 2011 in DEEPs ongo-
ing effort to transform remediation laws and programs The Councils close attention to
the Haddam case has yielded several insights into problems that need to be fixed
Aside from remediation the following are a sample of the many other complaints inves-
tigated in 2011
Dumping on a state university campus
Lack of notice of pesticide spraying on a railroad right-of-way as railroads are ex-
empt from the law governing notification of abutting homeowners
Pesticides and other contaminants in the wells of many homes in one neighbor-
hood
Apparent misinformation in an application for a proposed large drinking water
well with no effective consequences for providing wrong or misleading informa-
tion
Several matters relating to the siting of telecommunications towers including the
need to consider their effect on bird migration corridors preserved natural
areas and coastal areas
Pollution from outdoor wood furnaces both legal and illegal
The Council researched all of the complaints it received and offered recommendations to
the relevant state agencies where warranted Some problems such as illegal tree re-
moval on private property will require legislative action to correct
41
7312019 Environmental Quality in Connecticut 2011
httpslidepdfcomreaderfullenvironmental-quality-in-connecticut-2011 4448
The Word from Mansfield
The Council periodically holds public forums in different parts of the state to learn what
environmental topics are most on residentsrsquo minds The information presented at these
forums has been extremely useful to the Council
In July 2011 the Council heard from many citizens and municipal officials in Mans-
field They spoke about numerous environmental problems many involving the ac-
tions and responsibilities of state agencies Others suggested interesting directions for
the future of the state and its environment The Council investigated all of them and re-
sponded to each speaker Many investigations led to actions by state agencies andor
recommendations for legislation Read a complete summary of the speakers and the is-
sues they raised
Advice From the Public
In November of 2011 the Council released its required recommendations for corrective
legislation in draft form and invited the public to weigh in Citizens and organizations
spoke to the Council at a public forum held in the Legislative Office Building in Hartford
and many others submitted written comments Read a complete summary Their in-
sights technical advice and opinions proved a big help to the Council in preparing its fi-
nal recommendations which were submitted to Governor Dannel P Malloy and the Gen-
eral Assembly in January 2012
___________
In addition to the dozens who spoke at the public forums the Council heard from organi-zations at regular monthly meetings These included DEEP the University of ConnecticutNorth Stamford Concerned Citizens for the Environment Citizens for Clean GroundwaterRivers Alliance of Connecticut Sierra Club and others
Many people across the state expressed their concerns during 2011 The Council workedto address them all and truly appreciates the efforts people made to bring environmen-tal problems to light The Council looks forward to helping citizens and agenciessolve the challenges of 2012 and beyond
42
7312019 Environmental Quality in Connecticut 2011
httpslidepdfcomreaderfullenvironmental-quality-in-connecticut-2011 4548
The release of this edition of Environmental Quality in Connecticut marks 41 years of CEQ service
Council Duties
The duties of the Council on Environmental Quality are described in Sections 22a-11through 22a-13 of the Connecticut General Statutes
The Council is a nine-member board that works independently of the Department of Energy and Environmental Protection (except for administrative functions) The Chair-man and four other members are appointed by the Governor two members by the Pres-ident Pro Tempore of the Senate and two by the Speaker of the House The Councilrsquosprimary responsibilities include
1 Submittal to the Governor of an annual report on the status of Connecticutrsquos env i-ronment including progress toward goals of the statewide environmental planwith recommendations for remedying deficiencies of state programs
2 Review of state agenciesrsquo construction projects3 Investigation of citizensrsquo complaints and allegations of violations of environmental
laws
In addition under the Connecticut Environmental Policy Act (CEPA) and its attendantregulations the Council on Environmental Quality reviews Environmental Impact Evalua-tions that state agencies develop for major projects The Council publishes the Environ-mental Monitor the official publication for scoping notices and environmental impactevaluations for state projects under CEPA The Environmental Monitor also is the officialpublication for notice of intent by state agencies to sell or transfer state lands
43
7312019 Environmental Quality in Connecticut 2011
httpslidepdfcomreaderfullenvironmental-quality-in-connecticut-2011 4648
CEQ Members
Barbara C Wagner (Chair)Resident of Glastonbury Attorney with law office in Glastonbury specializing in commer-cial and residential real estate Executive Director Wind Hill Community Farm Glaston-bury Member Glastonbury Town Council 2000-2010 Co-Founder and Board Member of
Town Center Initiative addressing walkability issues in Glastonburyrsquos center Board of Trustees Diamond Lake Land Trust Former member State Open Space and WatershedLand Acquisition Board
M Howard BeachResident of Simsbury Conservation amp Zoning Compliance Officer Planning AnalystTown of Simsbury Member Simsbury Conservation Inland Wetlands Commission from1980 to 2004 Chairman from 1994 to 2004 Member Board of Directors The Farming-ton River Watershed Association 2004 to 2006 Life Member and past Board MemberSimsbury Land Conservation Trust Founding Member Farmington Valley BiodiversityProject Member Town of Simsbury Open Space Committee 1999 to 2004 Member CTDevelopers Council Member Government Affairs Committee Simsbury Chamber of
Commerce In 2004 completed a Masters Degree in Environmental Law at Vermont LawSchool
Janet P BrooksResident of Middletown Attorney with law office in East Berlin with a practice in envi-ronmental administrative and land use law Member of the Connecticut Bar AssociationPlanning amp Zoning Section and Environment Section Co-author of Connecticut Environ-mental Protection Act Volume 15 of the Connecticut Practice Series published by Thom-son West Formerly Assistant Attorney General in the Environment Department of theConnecticut Attorney Generalrsquos (AGs) Office for 18 years enforcing the statersquos environ-mental laws running the gamut from noise odor water pollution air pollution pesticides
to habitat protection and preservation of land While at the AGrsquos Office coordinated thewetlands appeal practice and developed the legal training for wetlands commissioners forDEEPrsquos annual training Recipient of 1984 German Marshall Fund grant to study the ef-fect of citizen participation on hazardous waste clean-ups in four European countriesBased on those experiences authored a chapter published in Americarsquos Future in Toxic Waste Management Lessons from Europe Staff Attorney for five years at the Connecti-cut Fund for the Environment Inc representing citizens groups in administrative andcourt proceedings Began practice of law assisting the Middletown City Attorney in thecityrsquos opposition to the utility companyrsquos burning of PCB waste oil with in the city bounda-ries
Liz ClarkResident of West Hartford
44
7312019 Environmental Quality in Connecticut 2011
httpslidepdfcomreaderfullenvironmental-quality-in-connecticut-2011 4748
Bruce R FernandezResident of Farmington Retired after 18 years owning and managing a software busi-ness serving insurance companies and independent agencies Prior to that was a con-sulting engineer specializing in energy efficient power plants and paper mills Vice-President of Operations of a small utility serving Bronxville NY and a jet engine de-signtest engineer Masters degrees in Engineering and Management Served in UnitedStates Army Corps of Engineers as small unit commander served in Vietnam and tenyears in Army Reserves Member Board of Directors Farmington Land Trust
Karyl Lee Hall Resident of Branford Attorney with the Connecticut Legal Rights Project Formerly withMurtha Cullina the Connecticut Fund for the Environment and Connecticut Legal Servic-es Co-Chair Branford Conservation Commission Co-chair Scenic Roads AdvisoryCommittee for Routes 146 and 77 Member Advisory Board Branford Land Trust Vice
President Citizens for Branfordrsquos Environment 2002-2009 Connecticut Bar AssociationPro Bono Service Award 2003 Former Co-chair State Implementation Plan [for AirManagement] Revision Advisory Committee
Richard Sherman Resident of Chaplin Architectural designer and construction manager of earth shelteredpassive solar and energy efficient residences Former CEQ Representative to the Route 6Advisory Committee (during previous term on CEQ) Charter Member Transit Alliance of Eastern CT and Citizens for a Sensible Six Former Organizer the Progress and EquityPartnership Member of CEPA Working Group League of Conservation Voters of CTFormer President Northeast Chapter of ACLU-CT Board of Directors Member of PeoplesAction for Clean Energy (PACE) and Northeast Sustainable Energy Association (NESEA)Former Chair Mansfield Transportation Advisory Committee Former President Mans-field Commonground Member Mansfield Planning and Zoning Design Review PanelFormer Chair Mansfield Democratic Town Committee Host and producer of the radio
show A Distant Shore on WHUS (917 FM Storrs) Former Public Affairs Director of WHUS Stopover host American Tour dSol solar electric car race
Norman VanCor(member through April 2012)Resident of Harwinton Owner of Buy Safe Home Inspection LLC and Mizzentop Antiqui-ties Served in United States Marine Corp in Vietnam Awarded the Navy Cross Vietnam-ese Cross of Gallantry and other decorations One of first ten inductees to CT VeteransHall of Fame Former Director Yankee Energy in sales marketing government relationscommunications Founding member and President Emeritus Quinnipiac River WatershedAssociation Former member Rivers Advisory Committee Former Chairman SouthingtonConservation Commission Former host of radio program on environmental topics For-
mer President Southington Water Works Former member Board of Directors of Opera-tion Fuel Active Pheresis donor at American Red Cross with over 37 gallons of wholeblood and platelet donations Former Volunteer Hunter Safety Instructor for the DEEPConservation Education Program Certified Master Gardener
45
7312019 Environmental Quality in Connecticut 2011
httpslidepdfcomreaderfullenvironmental-quality-in-connecticut-2011 4848
Acknowledgments
The Council appreciates the assistance of the many people in the Departments of Agri-culture Energy and Environmental Protection Transportation and Public Health and theConnecticut Siting Council who provided data Researchers at the Center for LanduseEducation and Research (CLEAR) at the University of Connecticut provided very valuable
data
The Council especially thanks the many citizens businesses and organizations who of-fered information and viewpoints to the Council throughout the year
The Council also appreciates the work of its Executive Director Karl Wagener and Envi-ronmental Analyst Peter Hearn in drafting this report for review by the Council and pre-paring the final version for publication
The Council notes the valuable contributions of Eric Walsh an intern from the Universityof Connecticut Law School and Avery Yoshimine an intern from the University of Con-necticut their research contributed greatly to this report
Contact the CEQ
We would like to hear from you Does this report give you the information on Connecticuts environment that you need Is
there something missing
79 Elm Street
Hartford CT 06106
Phone
860-424-4000
(messages can be left 24 hours a day)
Fax
860-424-4070
karlwagenerctgov
7312019 Environmental Quality in Connecticut 2011
httpslidepdfcomreaderfullenvironmental-quality-in-connecticut-2011 3648
Who is breaking Connecticuts environmental laws To find out the Council classified all 944 No-tices of Violation (NOVs) issued by DEEP during fiscal year 2011 The conclusions are summa-
rized in a staff memo and the types of violators are characterized in a series of charts The Coun-
cil does not have data on the publicrsquos perceptions of who the violators are but it senses from eve-ryday conversations that people suppose them to be factories utilities waste disposal facilitiesand perhaps pesticide applicators -- a perception that does not match the data The vast majority
of businesses where violations were found were small companies and most violations were re-
lated to the storage transport or distribution of petroleum The largest group by far were gasstations and convenience stores Only seven percent of NOVs were issued to manufacturers withmore than 20 employees -- fewer than the number that went to individual citizens
This indicator shows the approximate percentage of inspections performed by DEEP that foundthe inspected facilities in full compliance with pertinent environmental laws and regulations
(Monitoring data self-reported by permit holders are not included here) In 2010 and 2011 DEEPstepped up enforcement activity in its underground (petroleum) storage tank program and issuedmany more Notices of Violation (NOVs) than in previous years
The overall compliance rate rarely has been better than 90 percent Generally compliance withair quality regulations is higher than with waste and water regulations The average compliance
rate for all programs declined from 90 percent in 2008 to 89 percent in 2009 86 percent in 2010
and 83 percent in 2011 (The sharp downturn of 2002 was due to a surge in NOVs in a single airprogram Stage II Vapor Recovery at gas stations)
The number of inspections (not shown) declined between 1997 and 2007 increased in 2008 anddeclined again in 2009 through 2011 to its lowest number in 15 years Any relationship betweenthe number of inspections and rate of compliance is uncertain The relative stability of the com-
pliance rate in the face of ever-diminishing staff resources might be regarded as a success for the
DEEP However the failure of the state-- government businesses and residents together -- toadvance affirmatively toward the goal of full compliance is apparent
Personal Impact indicators illustrate trends in behavior or practices that can be expected to influence the condition of tomorrowrsquosair water land and wildlife
Notices of Violation (NOVs) are informal enforcement tools generally issued whenever DEEP detects one or more violations at a
facility They carry no financial penalty The recipient has 30 days to respond They can be issued for relatively minor or majorviolations in cases of the latter type the recipient might also receive an order which might carry a financial penalty NOVs typi-cally outnumber orders by a factor of five or more in any year NOVs are good indicators of trends in violations because almost allviolations found through inspections result in NOVs
Some inspections of compliance with air quality regulations are conducted by the Department of Consumer Protection pursuantto an agreement with DEEP these inspections also are used in calculating compliance rates
34
7312019 Environmental Quality in Connecticut 2011
httpslidepdfcomreaderfullenvironmental-quality-in-connecticut-2011 3748
Personal Impact
Recycling
Some municipalities and regional waste authorities have reported greater partici-pation in recycling programs since adopting single-stream recycling However
notable progress towards the statewide goal remains elusive
The General Assembly es-
tablished a goal of reduc-ing and recycling 40 per-cent of Connecticuts mu-
nicipal solid waste streamby the year 2000 (Sec22a-220(f)) That
goal was never met and
the consequences havebeen enormous Hundredsof thousands of tons of
waste were shipped out
of Connecticut in manyyears putting thousands of diesel trucks on the high-
ways for trips of many
hundred miles One conse-quence of this needless
truck traffic is the yearly
addition of 300000 ormore pounds of diesel pol-lutants into the air Anoth-
er consequence is finan-cial one ton that is re-cycled instead of burned or
landfilled can save a municipality hauler or resident from $40 to $93 according to a 2010 report of the Legislative Program Review and Investigations Committee
As total tonnage of waste has grown the percent that is recycled has not In 2006 DEEP amendedthe State Solid Waste Management Plan to include a goal of diverting 58 percent of Connecticutrsquosmunicipal solid waste stream from disposal by 2024 This would be accomplished through recy-
cling composting and waste reduction (such as use of lighter packaging material) If this goal ismet Connecticut will be able to manage all of its garbage without exporting it
DEEP reports suggest that the official figures slightly underestimate actual recycling volume Thegap in the graph reflects a lack of available data is for the years between 2004 and 2008
35
7312019 Environmental Quality in Connecticut 2011
httpslidepdfcomreaderfullenvironmental-quality-in-connecticut-2011 3848
Personal Impact
Climate Changers
The average resident is causing less carbon dioxide to be put onto the atmos-phere a result of lower petroleum consumption
Certain gases in the air func-
tion like the glass of a green-
house they allow the sunsenergy to pass through the
atmosphere to the ground
then trap the heat that ra-diates from the ground Thesegases are often called green-
house gases Worldwide a
build-up of greenhouse gases is contributing to the ongoing
rise in temperature Carbon
dioxide is not the only green-house gas nor even the mostpowerful but carbon dioxide
emissions are far greater in
quantity than the othersThe chart shows the total
emissions of carbon dioxide
emitted from burning of petroleum natural gas and coal in Connecticut divided by the population
A 2008 state law set two goals for reducing greenhouse gas emissions reduce statewide emis-sions to 10 percent below 1990 levels by 2020 and 80 percent below 2001 levels by 2050The chart above shows emissions per Connecticut resident not total emissions and there-
fore displays the goals after adjusting them to account for the larger population that is pro-
jected for 2020 and 2050 There are expected to be hundreds of thousands more people living inConnecticut in 2020 and 2050 so the average resident will have to work that much harder to re-duce carbon dioxide emissions if the statewide goal is to be met
Most human-generated carbon dioxide results from the combustion of fuels in houses businesses
power plants and vehicles and the last of these is the largest source Connecticut is more ener-
gy-efficient than the nation as a whole and the average Connecticut residents contribution toglobal climate change is less than the average Americans
Technical Note The Council has changed the data source for this indicator In previous years da-ta was available for all greenhouse gases not just carbon dioxide However to bring the chartmore up to date the Council switched to a source that includes carbon dioxide only Because the
other gases are emitted in small quantities the carbon dioxide data by themselves give an accu-rate picture of trends in greenhouse gas emissions The most recent data available even for car-bon dioxide alone are from 2009
36
7312019 Environmental Quality in Connecticut 2011
httpslidepdfcomreaderfullenvironmental-quality-in-connecticut-2011 3948
Personal Impact
Electricity at Home and Work
At Home
The average Connecticut resident used slightly less electricity at home in 2011
Thousands of households have been signing up annually to buy electricity gener-ated by renewable energy sources through the CTCleanEnergyOptions program
37
7312019 Environmental Quality in Connecticut 2011
httpslidepdfcomreaderfullenvironmental-quality-in-connecticut-2011 4048
Through 2009 the majority of Connecticut households did not purchase the mostefficient refrigerators or air conditioners This trend probably has not changedbut more recent data are not available and this indicator will be discontinued
At Work
For three years in a row Connecticut businesses have used electricity more effi-ciently to produce goods and services
38
7312019 Environmental Quality in Connecticut 2011
httpslidepdfcomreaderfullenvironmental-quality-in-connecticut-2011 4148
Efficiency at Home The average Connecticut household has been consuming less electricity since the peak
usage year of 2007 despite a brief reversal in 2010 According to the Connecticut Siting Council peak de-mand occurs during hot humid summer days due to air conditioner demand The increase in summertimeconsumption has had significant environmental consequences On the hottest days Connecticutrsquos base-loadpower plants are unable to meet the additional demand and older petroleum-fueled plants are brought online Because they are used sporadically many of these older plants are permitted to operate with no pollu-tion control equipment As a result state residents generate the most air pollution on the hottest summerdays when air quality is already bad
The vast majority of Connecticutrsquos electricity is generated from nuclear energy and the combustion of naturalgas oil and coal Hydropower solar and other renewable resources are small but growing sources of elec-tricity Each source renewable or not has its own negative environmental consequences Reducing thoseconsequences will require Connecticut households to use electricity much more efficiently Such efficiencycan be attained in part with ENERGY STAR appliances
Efficiency in the Kitchen In a typical home the refrigerator consumes more electricity than any otherappliance (Central air conditioning uses more but is not in everyonersquos home) To be labeled ENERGY STAR efficient a full-size refrigerator must operate using at least 20 percent less energy than the federal stan-dards for household appliances
ENERGY STAR appliance sales figures had been collected from voluntary reports by retailers to the ENERGY
STAR program Data on sales by state are no longer available For Connecticut 2009 data are the most re-cent available In 2009 38 percent of refrigerators bought by Connecticut consumers were ENERGY STARefficient a decrease from its peak (44 percent) in 2005 Sales trends for ENERGY STAR air conditioners al-so dropped in 2009 to 42 percent from 44 percent in 2008 Public surveys have shown conclusively thatmost people are aware of the ENERGY STAR label and what it means so reasons other than awareness mustbe addressed to boost ENERGY STAR labeled product sales and stem the ongoing waste of electricity inhomes
The ENERGY STAR program was created in 1992 as a joint effort of the US Environmental Protection Agen-cy and the US Department of Energy to identify and label energy efficient products By consuming lesselectricity ENERGY STAR products help to reduce air pollution and greenhouse gas emissions
The Connecticut Energy Efficiency Fund has partnered with Top Ten USA to help consumers find the mostenergy efficient appliances
Buying Cleaner Energy The CTCleanEnergyOptions program enables customers to sign up to pur-
chase electricity from renewable sources that include wind and low-impact hydroelectric (water power) Par-ticipation has grown steadily though the rate of increased participation is slowing There were 7 per-cent more participants in the program in 2011 than in 2010 The electricity that actually enters these housesis not necessarily from renewable sources The consumer who elects this option is paying for the generationof renewable electricity on the regional electric grid This reduces the amount of electricity that otherwisewould be generated by nuclear coal oil and natural gas-fired generating plants all of which create pollutionCTCleanEnergyOptions is a collaborative program administered by the Clean Energy Finance and InvestmentAuthority
Efficiency at work The bottom graph shows trends in the efficiency with which Connecticutrsquos economyuses electricity to produce goods and services Connecticuts businesses generally have been producing more
goods and services with less electricity State Gross Domestic Product (GDP) represents the total value of goods and services produced within the state in a single year Payment to employees constitutes about 60percent of the GDP In 2010 (the most recent data available) the Bureau of Economic Analysis put Connect-icuts GDP at $237 billion (current dollars) From 2009 to 2010 the GDP grew twice as fast as electricity con-sumption by Connecticuts industrial and commercial sectors Preliminary data for 2011 suggest that therewas no change in efficiency The long-term positive trend demonstrates that with advances in energy effi-cient technology it is possible for Connecticutrsquos economy to continue growing while using electricity moreefficiently
39
7312019 Environmental Quality in Connecticut 2011
httpslidepdfcomreaderfullenvironmental-quality-in-connecticut-2011 4248
Activities of the CEQ in 2011
June saw the 40th anniversary of the legislation that created the Council on Environmen-
tal Quality (CEQ) The Councils first meeting was held in the fall of 1971 Previous re-
ports looked back at some of those early events In the more recent past the Coun-
cils 41st year was one of its busiest and most productive
Research and Reports
The Council published Environmental Quality in Connecticut in April 2011 identifying
Routes to Progress that would move some of Connecticuts environmental indicators in
a positive direction
The Council is required to recommend legislation for identifying the deficiencies of exist-
ing programs and activities The Council published those in January 2012
From time to time the Council asks staff to prepare updates to previous reports Exam-
ples from 2011 include a staff memo on environmental regulation and the growth of
small businesses and a memo on the benefits to Connecticut of a new federal initiative to
reduce mercury pollution
Review of State Projects and Programs
In December 2010 the Council received complaints and inquiries about a state grant fora boat launch facility that was awarded without the environmental review and public no-
tice required by the Connecticut Environmental Policy Act (CEPA) After review the
Council advised the Commissioner of Energy and Environmental Protection of the appli-
cability of CEPA Ultimately the Department of Energy and Environmental Protection
(DEEP) declined to conduct an evaluation The Councils conclusion is summarized in a
2011 letter to one of the citizens who contacted the Council
Council research in 2010 found that one of the most polluting power plants in the state is
located in Hartford and is generally only used on the hottest days of the year when air
quality is already at its worst In December 2011 DEEP published notice of its intent torenew the air pollution permit for the plant Seeing several problems in the draft permit
as well as opportunities to improve and perhaps phase out use of the plant the Council
submitted detailed comments As of press time the permit renewal is still pending
40
7312019 Environmental Quality in Connecticut 2011
httpslidepdfcomreaderfullenvironmental-quality-in-connecticut-2011 4348
The Council continued to improve the Environmental Monitor to accommodate changes in
CEPA most recently to add public notices in cases where agencies decide not to com-
plete an environmental impact evaluation after it has conducted a public scoping
process
Citizen Complaints
As noted in reports of the past two years citizens of Haddam have spoken repeatedly to
the Council about contamination of land and groundwater that has existed in their com-
munity for more than 25 years Among many issues the apparent lack of remedial ac-
tion by one company was of particular note as the company had been required by the
DEEP to investigate the contamination and prepare a clean-up plan The Council decided
to follow this case in detail in order to learn more about the adequacy of existing laws
and programs In April 2010 the Council wrote to DEEP recommending enforcement ac-
tion against the company in question DEEP began legal action against the company in
late 2010 As of May 2012 there has been some study by the landowner as well as addi-
tional legal and bureaucratic action but to date no remediation
Along with many other parties the Council participated throughout 2011 in DEEPs ongo-
ing effort to transform remediation laws and programs The Councils close attention to
the Haddam case has yielded several insights into problems that need to be fixed
Aside from remediation the following are a sample of the many other complaints inves-
tigated in 2011
Dumping on a state university campus
Lack of notice of pesticide spraying on a railroad right-of-way as railroads are ex-
empt from the law governing notification of abutting homeowners
Pesticides and other contaminants in the wells of many homes in one neighbor-
hood
Apparent misinformation in an application for a proposed large drinking water
well with no effective consequences for providing wrong or misleading informa-
tion
Several matters relating to the siting of telecommunications towers including the
need to consider their effect on bird migration corridors preserved natural
areas and coastal areas
Pollution from outdoor wood furnaces both legal and illegal
The Council researched all of the complaints it received and offered recommendations to
the relevant state agencies where warranted Some problems such as illegal tree re-
moval on private property will require legislative action to correct
41
7312019 Environmental Quality in Connecticut 2011
httpslidepdfcomreaderfullenvironmental-quality-in-connecticut-2011 4448
The Word from Mansfield
The Council periodically holds public forums in different parts of the state to learn what
environmental topics are most on residentsrsquo minds The information presented at these
forums has been extremely useful to the Council
In July 2011 the Council heard from many citizens and municipal officials in Mans-
field They spoke about numerous environmental problems many involving the ac-
tions and responsibilities of state agencies Others suggested interesting directions for
the future of the state and its environment The Council investigated all of them and re-
sponded to each speaker Many investigations led to actions by state agencies andor
recommendations for legislation Read a complete summary of the speakers and the is-
sues they raised
Advice From the Public
In November of 2011 the Council released its required recommendations for corrective
legislation in draft form and invited the public to weigh in Citizens and organizations
spoke to the Council at a public forum held in the Legislative Office Building in Hartford
and many others submitted written comments Read a complete summary Their in-
sights technical advice and opinions proved a big help to the Council in preparing its fi-
nal recommendations which were submitted to Governor Dannel P Malloy and the Gen-
eral Assembly in January 2012
___________
In addition to the dozens who spoke at the public forums the Council heard from organi-zations at regular monthly meetings These included DEEP the University of ConnecticutNorth Stamford Concerned Citizens for the Environment Citizens for Clean GroundwaterRivers Alliance of Connecticut Sierra Club and others
Many people across the state expressed their concerns during 2011 The Council workedto address them all and truly appreciates the efforts people made to bring environmen-tal problems to light The Council looks forward to helping citizens and agenciessolve the challenges of 2012 and beyond
42
7312019 Environmental Quality in Connecticut 2011
httpslidepdfcomreaderfullenvironmental-quality-in-connecticut-2011 4548
The release of this edition of Environmental Quality in Connecticut marks 41 years of CEQ service
Council Duties
The duties of the Council on Environmental Quality are described in Sections 22a-11through 22a-13 of the Connecticut General Statutes
The Council is a nine-member board that works independently of the Department of Energy and Environmental Protection (except for administrative functions) The Chair-man and four other members are appointed by the Governor two members by the Pres-ident Pro Tempore of the Senate and two by the Speaker of the House The Councilrsquosprimary responsibilities include
1 Submittal to the Governor of an annual report on the status of Connecticutrsquos env i-ronment including progress toward goals of the statewide environmental planwith recommendations for remedying deficiencies of state programs
2 Review of state agenciesrsquo construction projects3 Investigation of citizensrsquo complaints and allegations of violations of environmental
laws
In addition under the Connecticut Environmental Policy Act (CEPA) and its attendantregulations the Council on Environmental Quality reviews Environmental Impact Evalua-tions that state agencies develop for major projects The Council publishes the Environ-mental Monitor the official publication for scoping notices and environmental impactevaluations for state projects under CEPA The Environmental Monitor also is the officialpublication for notice of intent by state agencies to sell or transfer state lands
43
7312019 Environmental Quality in Connecticut 2011
httpslidepdfcomreaderfullenvironmental-quality-in-connecticut-2011 4648
CEQ Members
Barbara C Wagner (Chair)Resident of Glastonbury Attorney with law office in Glastonbury specializing in commer-cial and residential real estate Executive Director Wind Hill Community Farm Glaston-bury Member Glastonbury Town Council 2000-2010 Co-Founder and Board Member of
Town Center Initiative addressing walkability issues in Glastonburyrsquos center Board of Trustees Diamond Lake Land Trust Former member State Open Space and WatershedLand Acquisition Board
M Howard BeachResident of Simsbury Conservation amp Zoning Compliance Officer Planning AnalystTown of Simsbury Member Simsbury Conservation Inland Wetlands Commission from1980 to 2004 Chairman from 1994 to 2004 Member Board of Directors The Farming-ton River Watershed Association 2004 to 2006 Life Member and past Board MemberSimsbury Land Conservation Trust Founding Member Farmington Valley BiodiversityProject Member Town of Simsbury Open Space Committee 1999 to 2004 Member CTDevelopers Council Member Government Affairs Committee Simsbury Chamber of
Commerce In 2004 completed a Masters Degree in Environmental Law at Vermont LawSchool
Janet P BrooksResident of Middletown Attorney with law office in East Berlin with a practice in envi-ronmental administrative and land use law Member of the Connecticut Bar AssociationPlanning amp Zoning Section and Environment Section Co-author of Connecticut Environ-mental Protection Act Volume 15 of the Connecticut Practice Series published by Thom-son West Formerly Assistant Attorney General in the Environment Department of theConnecticut Attorney Generalrsquos (AGs) Office for 18 years enforcing the statersquos environ-mental laws running the gamut from noise odor water pollution air pollution pesticides
to habitat protection and preservation of land While at the AGrsquos Office coordinated thewetlands appeal practice and developed the legal training for wetlands commissioners forDEEPrsquos annual training Recipient of 1984 German Marshall Fund grant to study the ef-fect of citizen participation on hazardous waste clean-ups in four European countriesBased on those experiences authored a chapter published in Americarsquos Future in Toxic Waste Management Lessons from Europe Staff Attorney for five years at the Connecti-cut Fund for the Environment Inc representing citizens groups in administrative andcourt proceedings Began practice of law assisting the Middletown City Attorney in thecityrsquos opposition to the utility companyrsquos burning of PCB waste oil with in the city bounda-ries
Liz ClarkResident of West Hartford
44
7312019 Environmental Quality in Connecticut 2011
httpslidepdfcomreaderfullenvironmental-quality-in-connecticut-2011 4748
Bruce R FernandezResident of Farmington Retired after 18 years owning and managing a software busi-ness serving insurance companies and independent agencies Prior to that was a con-sulting engineer specializing in energy efficient power plants and paper mills Vice-President of Operations of a small utility serving Bronxville NY and a jet engine de-signtest engineer Masters degrees in Engineering and Management Served in UnitedStates Army Corps of Engineers as small unit commander served in Vietnam and tenyears in Army Reserves Member Board of Directors Farmington Land Trust
Karyl Lee Hall Resident of Branford Attorney with the Connecticut Legal Rights Project Formerly withMurtha Cullina the Connecticut Fund for the Environment and Connecticut Legal Servic-es Co-Chair Branford Conservation Commission Co-chair Scenic Roads AdvisoryCommittee for Routes 146 and 77 Member Advisory Board Branford Land Trust Vice
President Citizens for Branfordrsquos Environment 2002-2009 Connecticut Bar AssociationPro Bono Service Award 2003 Former Co-chair State Implementation Plan [for AirManagement] Revision Advisory Committee
Richard Sherman Resident of Chaplin Architectural designer and construction manager of earth shelteredpassive solar and energy efficient residences Former CEQ Representative to the Route 6Advisory Committee (during previous term on CEQ) Charter Member Transit Alliance of Eastern CT and Citizens for a Sensible Six Former Organizer the Progress and EquityPartnership Member of CEPA Working Group League of Conservation Voters of CTFormer President Northeast Chapter of ACLU-CT Board of Directors Member of PeoplesAction for Clean Energy (PACE) and Northeast Sustainable Energy Association (NESEA)Former Chair Mansfield Transportation Advisory Committee Former President Mans-field Commonground Member Mansfield Planning and Zoning Design Review PanelFormer Chair Mansfield Democratic Town Committee Host and producer of the radio
show A Distant Shore on WHUS (917 FM Storrs) Former Public Affairs Director of WHUS Stopover host American Tour dSol solar electric car race
Norman VanCor(member through April 2012)Resident of Harwinton Owner of Buy Safe Home Inspection LLC and Mizzentop Antiqui-ties Served in United States Marine Corp in Vietnam Awarded the Navy Cross Vietnam-ese Cross of Gallantry and other decorations One of first ten inductees to CT VeteransHall of Fame Former Director Yankee Energy in sales marketing government relationscommunications Founding member and President Emeritus Quinnipiac River WatershedAssociation Former member Rivers Advisory Committee Former Chairman SouthingtonConservation Commission Former host of radio program on environmental topics For-
mer President Southington Water Works Former member Board of Directors of Opera-tion Fuel Active Pheresis donor at American Red Cross with over 37 gallons of wholeblood and platelet donations Former Volunteer Hunter Safety Instructor for the DEEPConservation Education Program Certified Master Gardener
45
7312019 Environmental Quality in Connecticut 2011
httpslidepdfcomreaderfullenvironmental-quality-in-connecticut-2011 4848
Acknowledgments
The Council appreciates the assistance of the many people in the Departments of Agri-culture Energy and Environmental Protection Transportation and Public Health and theConnecticut Siting Council who provided data Researchers at the Center for LanduseEducation and Research (CLEAR) at the University of Connecticut provided very valuable
data
The Council especially thanks the many citizens businesses and organizations who of-fered information and viewpoints to the Council throughout the year
The Council also appreciates the work of its Executive Director Karl Wagener and Envi-ronmental Analyst Peter Hearn in drafting this report for review by the Council and pre-paring the final version for publication
The Council notes the valuable contributions of Eric Walsh an intern from the Universityof Connecticut Law School and Avery Yoshimine an intern from the University of Con-necticut their research contributed greatly to this report
Contact the CEQ
We would like to hear from you Does this report give you the information on Connecticuts environment that you need Is
there something missing
79 Elm Street
Hartford CT 06106
Phone
860-424-4000
(messages can be left 24 hours a day)
Fax
860-424-4070
karlwagenerctgov

7312019 Environmental Quality in Connecticut 2011
httpslidepdfcomreaderfullenvironmental-quality-in-connecticut-2011 4648
CEQ Members
Barbara C Wagner (Chair)Resident of Glastonbury Attorney with law office in Glastonbury specializing in commer-cial and residential real estate Executive Director Wind Hill Community Farm Glaston-bury Member Glastonbury Town Council 2000-2010 Co-Founder and Board Member of
Town Center Initiative addressing walkability issues in Glastonburyrsquos center Board of Trustees Diamond Lake Land Trust Former member State Open Space and WatershedLand Acquisition Board
M Howard BeachResident of Simsbury Conservation amp Zoning Compliance Officer Planning AnalystTown of Simsbury Member Simsbury Conservation Inland Wetlands Commission from1980 to 2004 Chairman from 1994 to 2004 Member Board of Directors The Farming-ton River Watershed Association 2004 to 2006 Life Member and past Board MemberSimsbury Land Conservation Trust Founding Member Farmington Valley BiodiversityProject Member Town of Simsbury Open Space Committee 1999 to 2004 Member CTDevelopers Council Member Government Affairs Committee Simsbury Chamber of
Commerce In 2004 completed a Masters Degree in Environmental Law at Vermont LawSchool
Janet P BrooksResident of Middletown Attorney with law office in East Berlin with a practice in envi-ronmental administrative and land use law Member of the Connecticut Bar AssociationPlanning amp Zoning Section and Environment Section Co-author of Connecticut Environ-mental Protection Act Volume 15 of the Connecticut Practice Series published by Thom-son West Formerly Assistant Attorney General in the Environment Department of theConnecticut Attorney Generalrsquos (AGs) Office for 18 years enforcing the statersquos environ-mental laws running the gamut from noise odor water pollution air pollution pesticides
to habitat protection and preservation of land While at the AGrsquos Office coordinated thewetlands appeal practice and developed the legal training for wetlands commissioners forDEEPrsquos annual training Recipient of 1984 German Marshall Fund grant to study the ef-fect of citizen participation on hazardous waste clean-ups in four European countriesBased on those experiences authored a chapter published in Americarsquos Future in Toxic Waste Management Lessons from Europe Staff Attorney for five years at the Connecti-cut Fund for the Environment Inc representing citizens groups in administrative andcourt proceedings Began practice of law assisting the Middletown City Attorney in thecityrsquos opposition to the utility companyrsquos burning of PCB waste oil with in the city bounda-ries
Liz ClarkResident of West Hartford
44
7312019 Environmental Quality in Connecticut 2011
httpslidepdfcomreaderfullenvironmental-quality-in-connecticut-2011 4748
Bruce R FernandezResident of Farmington Retired after 18 years owning and managing a software busi-ness serving insurance companies and independent agencies Prior to that was a con-sulting engineer specializing in energy efficient power plants and paper mills Vice-President of Operations of a small utility serving Bronxville NY and a jet engine de-signtest engineer Masters degrees in Engineering and Management Served in UnitedStates Army Corps of Engineers as small unit commander served in Vietnam and tenyears in Army Reserves Member Board of Directors Farmington Land Trust
Karyl Lee Hall Resident of Branford Attorney with the Connecticut Legal Rights Project Formerly withMurtha Cullina the Connecticut Fund for the Environment and Connecticut Legal Servic-es Co-Chair Branford Conservation Commission Co-chair Scenic Roads AdvisoryCommittee for Routes 146 and 77 Member Advisory Board Branford Land Trust Vice
President Citizens for Branfordrsquos Environment 2002-2009 Connecticut Bar AssociationPro Bono Service Award 2003 Former Co-chair State Implementation Plan [for AirManagement] Revision Advisory Committee
Richard Sherman Resident of Chaplin Architectural designer and construction manager of earth shelteredpassive solar and energy efficient residences Former CEQ Representative to the Route 6Advisory Committee (during previous term on CEQ) Charter Member Transit Alliance of Eastern CT and Citizens for a Sensible Six Former Organizer the Progress and EquityPartnership Member of CEPA Working Group League of Conservation Voters of CTFormer President Northeast Chapter of ACLU-CT Board of Directors Member of PeoplesAction for Clean Energy (PACE) and Northeast Sustainable Energy Association (NESEA)Former Chair Mansfield Transportation Advisory Committee Former President Mans-field Commonground Member Mansfield Planning and Zoning Design Review PanelFormer Chair Mansfield Democratic Town Committee Host and producer of the radio
show A Distant Shore on WHUS (917 FM Storrs) Former Public Affairs Director of WHUS Stopover host American Tour dSol solar electric car race
Norman VanCor(member through April 2012)Resident of Harwinton Owner of Buy Safe Home Inspection LLC and Mizzentop Antiqui-ties Served in United States Marine Corp in Vietnam Awarded the Navy Cross Vietnam-ese Cross of Gallantry and other decorations One of first ten inductees to CT VeteransHall of Fame Former Director Yankee Energy in sales marketing government relationscommunications Founding member and President Emeritus Quinnipiac River WatershedAssociation Former member Rivers Advisory Committee Former Chairman SouthingtonConservation Commission Former host of radio program on environmental topics For-
mer President Southington Water Works Former member Board of Directors of Opera-tion Fuel Active Pheresis donor at American Red Cross with over 37 gallons of wholeblood and platelet donations Former Volunteer Hunter Safety Instructor for the DEEPConservation Education Program Certified Master Gardener
45
7312019 Environmental Quality in Connecticut 2011
httpslidepdfcomreaderfullenvironmental-quality-in-connecticut-2011 4848
Acknowledgments
The Council appreciates the assistance of the many people in the Departments of Agri-culture Energy and Environmental Protection Transportation and Public Health and theConnecticut Siting Council who provided data Researchers at the Center for LanduseEducation and Research (CLEAR) at the University of Connecticut provided very valuable
data
The Council especially thanks the many citizens businesses and organizations who of-fered information and viewpoints to the Council throughout the year
The Council also appreciates the work of its Executive Director Karl Wagener and Envi-ronmental Analyst Peter Hearn in drafting this report for review by the Council and pre-paring the final version for publication
The Council notes the valuable contributions of Eric Walsh an intern from the Universityof Connecticut Law School and Avery Yoshimine an intern from the University of Con-necticut their research contributed greatly to this report
Contact the CEQ
We would like to hear from you Does this report give you the information on Connecticuts environment that you need Is
there something missing
79 Elm Street
Hartford CT 06106
Phone
860-424-4000
(messages can be left 24 hours a day)
Fax
860-424-4070
karlwagenerctgov
7312019 Environmental Quality in Connecticut 2011
httpslidepdfcomreaderfullenvironmental-quality-in-connecticut-2011 4748
Bruce R FernandezResident of Farmington Retired after 18 years owning and managing a software busi-ness serving insurance companies and independent agencies Prior to that was a con-sulting engineer specializing in energy efficient power plants and paper mills Vice-President of Operations of a small utility serving Bronxville NY and a jet engine de-signtest engineer Masters degrees in Engineering and Management Served in UnitedStates Army Corps of Engineers as small unit commander served in Vietnam and tenyears in Army Reserves Member Board of Directors Farmington Land Trust
Karyl Lee Hall Resident of Branford Attorney with the Connecticut Legal Rights Project Formerly withMurtha Cullina the Connecticut Fund for the Environment and Connecticut Legal Servic-es Co-Chair Branford Conservation Commission Co-chair Scenic Roads AdvisoryCommittee for Routes 146 and 77 Member Advisory Board Branford Land Trust Vice
President Citizens for Branfordrsquos Environment 2002-2009 Connecticut Bar AssociationPro Bono Service Award 2003 Former Co-chair State Implementation Plan [for AirManagement] Revision Advisory Committee
Richard Sherman Resident of Chaplin Architectural designer and construction manager of earth shelteredpassive solar and energy efficient residences Former CEQ Representative to the Route 6Advisory Committee (during previous term on CEQ) Charter Member Transit Alliance of Eastern CT and Citizens for a Sensible Six Former Organizer the Progress and EquityPartnership Member of CEPA Working Group League of Conservation Voters of CTFormer President Northeast Chapter of ACLU-CT Board of Directors Member of PeoplesAction for Clean Energy (PACE) and Northeast Sustainable Energy Association (NESEA)Former Chair Mansfield Transportation Advisory Committee Former President Mans-field Commonground Member Mansfield Planning and Zoning Design Review PanelFormer Chair Mansfield Democratic Town Committee Host and producer of the radio
show A Distant Shore on WHUS (917 FM Storrs) Former Public Affairs Director of WHUS Stopover host American Tour dSol solar electric car race
Norman VanCor(member through April 2012)Resident of Harwinton Owner of Buy Safe Home Inspection LLC and Mizzentop Antiqui-ties Served in United States Marine Corp in Vietnam Awarded the Navy Cross Vietnam-ese Cross of Gallantry and other decorations One of first ten inductees to CT VeteransHall of Fame Former Director Yankee Energy in sales marketing government relationscommunications Founding member and President Emeritus Quinnipiac River WatershedAssociation Former member Rivers Advisory Committee Former Chairman SouthingtonConservation Commission Former host of radio program on environmental topics For-
mer President Southington Water Works Former member Board of Directors of Opera-tion Fuel Active Pheresis donor at American Red Cross with over 37 gallons of wholeblood and platelet donations Former Volunteer Hunter Safety Instructor for the DEEPConservation Education Program Certified Master Gardener
45
7312019 Environmental Quality in Connecticut 2011
httpslidepdfcomreaderfullenvironmental-quality-in-connecticut-2011 4848
Acknowledgments
The Council appreciates the assistance of the many people in the Departments of Agri-culture Energy and Environmental Protection Transportation and Public Health and theConnecticut Siting Council who provided data Researchers at the Center for LanduseEducation and Research (CLEAR) at the University of Connecticut provided very valuable
data
The Council especially thanks the many citizens businesses and organizations who of-fered information and viewpoints to the Council throughout the year
The Council also appreciates the work of its Executive Director Karl Wagener and Envi-ronmental Analyst Peter Hearn in drafting this report for review by the Council and pre-paring the final version for publication
The Council notes the valuable contributions of Eric Walsh an intern from the Universityof Connecticut Law School and Avery Yoshimine an intern from the University of Con-necticut their research contributed greatly to this report
Contact the CEQ
We would like to hear from you Does this report give you the information on Connecticuts environment that you need Is
there something missing
79 Elm Street
Hartford CT 06106
Phone
860-424-4000
(messages can be left 24 hours a day)
Fax
860-424-4070
karlwagenerctgov