environmental report 2016 - 株式会社ジャパンディ … report 2016 07 smartphone, tablet...
TRANSCRIPT

Japan Display Inc. Group
EnvironmentalReport
2016

02 Environmental Report 2016
To contribute to the realization of a prosperous society by delivering beauty and excitement to the world's people through leading-edge technology.JDI aims to contribute to the enrichment of peoples' lifestyles and cultures by developing and delivering to the world beautiful displays which generate surprise and excitement using state of the art technology.
Under the management philosophy, recognizing that global environment conservation is one of the most important challenges for humanity, we at Japan Display Inc. group respect people and environment, and aim to contribute to a sustainable society.
Basic policy - We will continually improve our environmental management system to work to reduce environmental burden,
considering lifecycle of our display products.
- We will comply with domestic and foreign legal requirements and other voluntarily accepted requirements.
- We will set environmental objectives or others on the following priority themes and promote activities for their achievement to work for prevention of pollution and protection of environment.
Priority themes1) We will reduce environmental burden of business activities. We will: 1-1) Promote measures against global warming, energy conservation and effective use of water; 1-2) Thoroughly manage chemical substances and promote their reduction and substitution; 1-3) Promote 3R (Reduce, Reuse, Recycle) activities of wastes.2) We will reduce environmental burden of products. We will: 2-1) Promote the development of environmentally considered products; 2-2) Thoroughly manage chemical substances contained in products; 2-3) Promote green procurement.3) We will work on activities for conservation of biodiversity and environmental activities at local communities.
To ensure our environmental conservation activities, all employees are communicated on this policy and provided with environmental education thoroughly. Our business partners are also expected for cooperation.
Management Philosophy
Environmental Policy
Management Philosophy/Environmental Policy
Mitsuru Homma
April 1, 2016Chairman and CEOJapan Display Inc.

03Environmental Report 2016
We wish to express our deepest gratitude and appreciation for your support of Japan Display Inc.
Established on April 1, 2012, JDI was listed in the � rst section of the Tokyo Stock Exchange in March 2014. The reformation of our management structure in June 2015 marked the company's transition to the next phase. JDI develops, manufactures and delivers "displays" to the global market that are essential in creating an interface capable of transmitting large amounts of information instantaneously and linking people to the world at large.
While displays for mobile products currently represent more than 80% of JDI's sales volume structure, we are currently also strengthening our automotive in-vehicle display business as our second core business, a � eld that is showing remarkable market growth. Furthermore, with the aim of establishing our third core business, April 2016 saw the inauguration of our Display Solutions Business Unit, which is opening up new business frontiers, such as: high-de� nition, low power consumption displays for devices such as 2-in-1 notebook PCs and tablets, re� ective displays, displays for high-de� nition medical devices, and displays for the virtual reality (VR) market. We will increase JDI's business ratio in these non-mobile � elds to 50%.
Moreover, in addition to high added-value liquid crystal displays (i.e., high-de� nition, slim, and narrow frame displays with high-sensitivity in-cell touch sensors) in mobile � elds, we are now in the process of establishing � exible OLED mass production technologies with the aim of realizing mass production in 2018. It is anticipated that bendable displays will lead to major changes in the design of many devices, such as smartphones.
Conversely, the production of our products involves enormous inputs of energy and resources and outputs of waste. The Hakusan Plant (Ishikawa Prefecture), which will be a state-of-the-art production line, is scheduled to begin operating in 2016 to increase our production capacity for the mobile category, which continues to grow. Seeing as how our company is one that involves a particularly large environmental burden, we consider it our responsibility to continuously strive to reduce this environmental burden at the production stage. As such, we have set forth an Environmental Policy and promote activities for this sake.
To meet the needs of markets that are constantly changing with dizzying speed, JDI will leverage its advanced technological capabilities, cost-competitiveness, production capacity and product quality and contribute to the realization of a prosperous society by delivering beauty and excitement to the world's people through our leading-edge technology.
We will contribute to the creation of a new society by delivering on our corporate slogan of “Exciting Live Interface.” At the same time, we will build consideration for the environment into our product development process, and will strive to create innovative products that strike a balance between value and the environment.
Thank you for your continued encouragement and support.
Mitsuru HommaChairman and CEO
Message from the Management

04 Environmental Report 2016
On June 21, 2016, I was appointed to the post of Environmental Management Of� cer.
In 2013, the second year after JDI was founded, we acquired integrated ISO 14001 certi� cation for our plants and of� ces in Japan, and since then we have promoted our environmental activities under an integrated management system. In FY2015, ended March 2016, JDI underwent its � rst renewal audit, and on having all of its domestic bases rigorously examined by a third party, the company was found to have committed no nonconformities. We were recognized as conforming to the ISO’s requirements, and the continuance of our ISO certi� cation was certi� ed. This report provides an overview of our environmental activities in FY2015, including the contents of the results of audit.
Our environmental activities can be broken down into two aspects: product-related and production-related. Firstly, product-related environmental activities consist of knowing and responding to the regulations of various countries and demands from customers related to the chemical substances contained such as REACH and RoHS in our products. Our thorough management includes confirmation of the chemical substances in products from the development and design stages onward, prevention of contamination in our production lines, and so on.
We have established criteria for environmental consciousness, and we de� ne the products satisfying these criteria as “environmentally conscious products.” One of our environmental targets is to raise the proportion of environmentally conscious products in our lineup. We have made this a key performance indicator, and we will work towards achieving it.
Next, in production-related environmental activities, we are committed to observing all laws and ordinances related to the environment in our production activities. We have determined that the rising share of high-value-added products in our output has been accompanied by an increase in industrial processes, hence an increase in the environmental burden per sheet of glass. With a new plant scheduled to start operating this � scal year, we believe our environmental burden will continue to grow. So with a view towards reducing our environmental burden, we have set new medium-term environmental targets that call for continual reductions in use of energy such as electricity and gas, as well as water, waste, and chemical substances. As we achieve these targets, we plan to collect and disclose indirect data (Scope 3) on our entire supply chain, a new initiative. To improve the reliability of our environmental data, we are considering data veri� cation by a third-party organization.
In relation to global warming, JDI does not act alone, but rather participates in an industry-wide initiative to bring about a low-carbon society. We are contributing to the achievement of industry-wide goals on this front.
We look forward to your continued encouragement and support.
Nobuyuki TamiyaHR & General Affairs Manager
Environmental Management Of� cer

05Environmental Report 2016
Contents
02
03-04
05
06
07-08
09
10
11-12
13
14
15
16-18
19-20
21-23
24-25
26
27-28
29-32
33-34
Management Philosophy/Environmental Policy …………
Message from the Management ………………………………………
Contents/Editorial Policy ……………………………………………………
Company Outline ……………………………………………………………………
Product Overview …………………………………………………………………
Environmental Management Organization ……………………
Environmental Activity Plans and Actual Performance …
Environmental Targets …………………………………………………………
Environmental Aspects (Environmental Burden) …………
Environmental Audits ……………………………………………………………
Environmental Accounting …………………………………………………
Initiatives on Global Warming Prevention and Energy Conservation ……………………………………………………………
Waste Reduction Activities and Waste Management ……
Initiatives for Minimizing Environmental Risks ………………
Environmentally Considered Products ……………………………
Displaying at Exhibitions ………………………………………………………
Ecosystem Conservation Activities …………………………………
Communication ………………………………………………………………………
Legal Compliance …………………………………………………………………
This is the fourth environmental report issued by Japan Display Inc. continuing on from last year.We think it important to appropriately disclose information to and communicate with all of our stakeholders. This report was compiled with the goal of conveying our activities for the realization of a sustainable society in an easy to understand manner.
In editing the report, we added the data and details of activities taken by overseas manufacturing subsidiaries. We also expressed ideas by incorporating as many � gures and photographs as possible, and we introduce each of our activities through their own page layout. We plan to issue this regularly once each year while working to make the report even easier to read in the future.
Japanese version is also available from our website (http://www.j-display.com/Environment/report.html), and we would be pleased if people were to make use of this as well.If there are any comments, advice, and so forth, please contact us via our website below so that we can use them as references for the future.
Please use these forms to contact us.
Enquiries about products, etc.https://www.webcoms.jp/jdi/eng/form.phpEnquiries from shareholders and investorshttps://www.webcoms.jp/jdi/ir/eng/form.php
Editorial Policy
Target PeriodApril 2015 – March 2016Some activities outside of the above period are also included.
Month IssuedAugust 2016
Assumed ReadersThis report is aimed at a diverse range of stakeholders that includes our customers, shareholders, investors, suppliers, everyone in our local communities, and more.
PublisherHR & General Affairs Division, CSR & Environmental Management Department, Japan Display Inc.

06 Environmental Report 2016
Company name Japan Display Inc.
Head of� ce address 3-7-1 Nishi-shinbashi, Minato-ku, Tokyo
Start of business April 1, 2012
Capital 96.8 billion yen
Business content Development, design, production, and sale of small- and medium-sized display devices and related products
No. of employees Approximately 15,722 (consolidated, March 31, 2016)
Major production lines by plant
A Mobara Plant
B
G3.5 LTPS
G4 a-Si
C
Ishikawa Plant
Higashiura Plant
D Tottori Plant
G6 LTPS & G4.5 a-Si/LTPS
Ishikawa Plant G4.5 LTPS
G5.5 LTPS
G6 LTPS (Scheduled)
Nomi Plant
Hakusan Plant
a-Si: amorphous silicon TFT technology-adopted plantLTPS: low temperature poly-silicon technology-adopted plant
Sales subsidiaries
Manufacturing subsidiaries
C
A
B
D
Suzhou JDI Devices Inc.Suzhou JDI Electronics Inc.
Nanox Philippines Inc.
Shenzhen JDI Inc.
Kaohsiung Opto-Electronics Inc.
A
B
C
D
E
F
JDI Display America,Inc.
JDI Europe GmbH
JDI China Inc.
JDI Hong Kong Limited
JDI Taiwan Inc.Taiwan Display Inc.
JDI Korea Inc.
■ Head O�ce ●Sales sites ● Production sites ▲ Development and design sites
Western Japan O�ce
Head O�ce
Ebina O�ce
Mobara Plant
Higashiura Plant
Ishikawa Site
Tottori Plant
C
D
A
B
Hakusan Plant(planned site)
■ Head Office ●Sales sites ● Production sites
A
B
C
D E
F
AB
C
D
Company Outline
Domestic sites
Overseas sites
07Environmental Report 2016
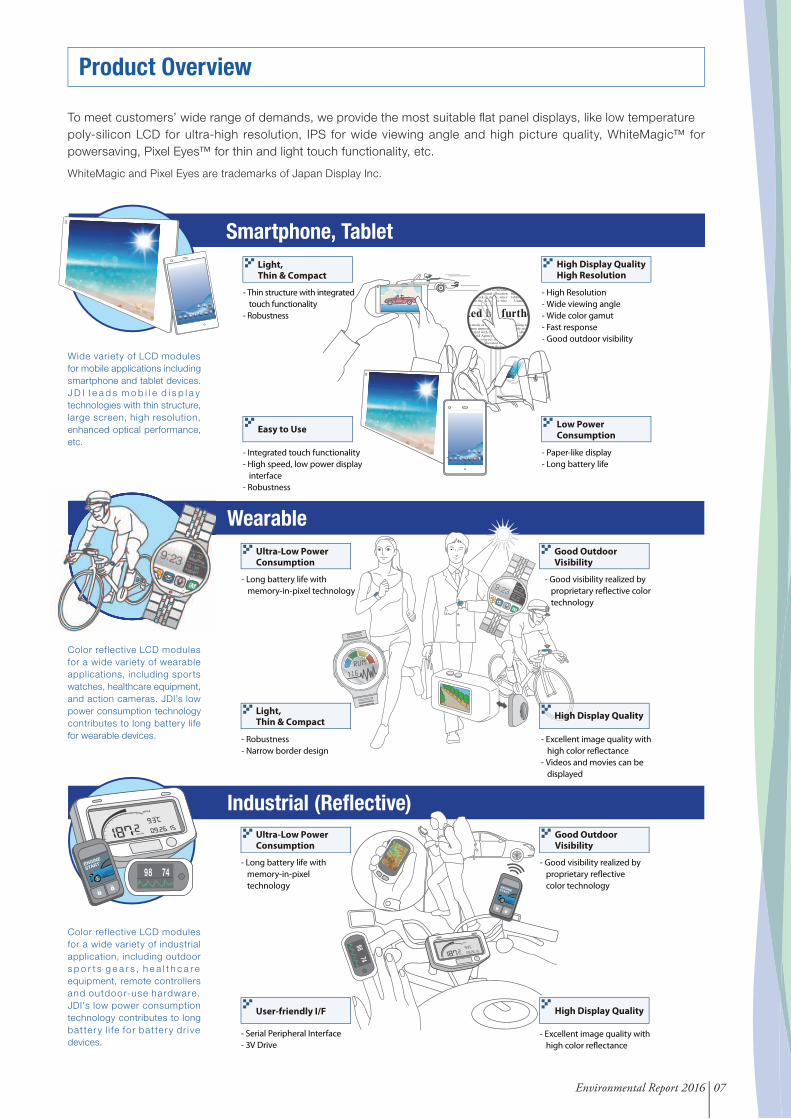
Smartphone, Tablet
Wide variety of LCD modules for mobile applications including smartphone and tablet devices. J D I l e a d s m o b i l e d i s p l a y technologies with thin structure, large screen, high resolution, enhanced optical performance, etc.
Color reflective LCD modules for a wide variety of wearable applications, including sports watches, healthcare equipment, and action cameras. JDI’s low power consumption technology contributes to long battery life for wearable devices.
Color reflective LCD modules for a wide variety of industrial application, including outdoor s p o r t s g e a r s , h e a l t h c a r e equipment, remote controllers and outdoor-use hardware. JDI's low power consumption technology contributes to long bat te r y l i fe for bat te r y dr ive devices.
Industrial (Re� ective)
Wearable
Ultra-Low Power Consumption
- Long battery life with memory-in-pixel technology
User-friendly I/F
- Serial Peripheral Interface- 3V Drive
Good Outdoor Visibility
- Good visibility realized by proprietary re�ective color technology
High Display Quality
- Excellent image quality with high color re�ectance
Light, Thin & Compact
- Thin structure with integrated touch functionality
- Robustness
- Integrated touch functionality- High speed, low power display
interface- Robustness
High Display Quality High Resolution
- High Resolution- Wide viewing angle- Wide color gamut- Fast response- Good outdoor visibility
Low Power Consumption
- Paper-like display- Long battery life
Easy to Use
Ultra-Low Power Consumption
- Long battery life with memory-in-pixel technology
- Good visibility realized by proprietary re�ective color technology
- Robustness- Narrow border design
- Excellent image quality with high color re�ectance
- Videos and movies can be displayed
Light, Thin & Compact
Good Outdoor Visibility
High Display Quality
Product Overview
To meet customers’ wide range of demands, we provide the most suitable � at panel displays, like low temperaturepoly-silicon LCD for ultra-high resolution, IPS for wide viewing angle and high picture quality, WhiteMagic™ for powersaving, Pixel Eyes™ for thin and light touch functionality, etc.
WhiteMagic and Pixel Eyes are trademarks of Japan Display Inc.

08 Environmental Report 2016
LCD modules for d isp lay ing images and diagnosis, such as PACS (P ic tu re A rch i v ing and Communication System, a medical imaging management s y s t e m ) , u l t r a s o n o g r a p h , mammography, etc. IPS for wide viewing-angle and high contrast provides for accurate screen images. An LED back l ight is suited for environmental needs and low power consumption.
LCD modules for automotive a p p l i c a t i o n s , s u c h a s c a r navigation, instrument panel, a nd re a r se a t mon i to r. T he p r o d u c t s a r e d e s i g n e d t o b e r e l i a b l e a n d d u r a b l e i n temperature, v ibrat ion, and other conditions required by automotive environments.
Landscape IPS LCD modules for single-lens reflex and high-end compact digital cameras r e q u i r i n g d i s p l a y s w i t h h igh br ightness, low power consumpt ion, w ide v iewing angle and sRGB. Pixel Eyes with integrated touch functionality, a n d W h i t e M a g i c f o r g o o d ou tdoo r v i s ib i l i t y w i th h i gh luminance, are also available.
Automotive
Digital Camera
MedicalAccurate Screen ImageHigh Resolution, High Picture Quality
- Wide viewing angle- High contrast- True black- High brightness- High resolution- Low re�ectance- Wide color gamut
Reliable Quality
- Brightness life- Brightness uniformity
UsabilityEasy to Use, Small Footprint
- Thin- Light weight- Compact (narrow frame)
EnvironmentLow Power Consumption
- LED backlight- High transmissivity- Highly e�cient backlight
High Resolution, Easier to Use
- High resolution, large screen- ScreenFit ▶ Good visibility by
optical adhesion of cover glass
- Equipped with touch functionality
- Narrow border
Comfortable Space for Driving
- High resolution, large screen- Wide color gamut- Display uniformity- Wide viewing angle- Thin, light weight
For Safety and Reassurance
- High brightness- High contrast- Large screen ▶ Large amount of information- Fast response- True black appearance ▶ Interior design styling
Special PhotographyShooting Studio, Night time
- Truck-black- Black uniformity- Smooth gradation
Special PhotographyShooting Outdoor
- High brightness- Low power consumption- Waterproof- Color accuracy- Low re�ectivity- High contrast
Operating
- Usability- Waterproof- Abrasion resistant
- Touch functionality- Low power
consumption
Everyday PhotographyShooting
- Large screen- Bright- Narrow border- Light weight- Thin structure
Viewing
- Large screen- High resolution- High brightness- High contrast- Wide color gamut- Uniformity- Low re�ectivity

09Environmental Report 2016
Head O�ce/Western Japan O�ce/
Ebina O�ce
Tottori Area
Higashiura Area
Ishikawa/Nomi Area
Mobara Area
ActionGroups
Environmental Promotion Secretariat
(Environmental Management Dept.)
Internal Environmental Audit Team
Chief Executive for the Environment
Environmental Management O�cer
Environmental Promotion O�cer
Eco Products Subcommittee
Environmental Promotion Committee
General Environmental Committee
Schematic Diagram of Our Environmental Management Organization in Japan
Environmental Management Organization
JDI acquired integrated ISO 14001 certification in FY2013, through which we promote ongoing activities. Our environmental management organization consists of a structure with the Chief Executive Of� cer (CEO) as the Chief Executive for the Environment, and which is also comprised of an Environmental Management Officer (CAO); Environmental Promotion Of� cer; and the head of� ce, of� ces, and manufacturing sites below them.
Our overseas manufacturing subsidiaries have individually acquired ISO certi� cation and have set up environmental management organization, which promotes environmental activities. In the aim of integrating them with the environmental activities in Japan starting from last � scal year in particular, we are making efforts such as onsite visits to each overseas manufacturing subsidiary for mutual understanding of the activities and offering instructions for improvements, while also meeting periodically with each subsidiary to strengthen governance each other.
Under the Chief Executive for the Environment, the Environmental Management Of� cer, to whom responsibility and authority for environmental activities has been transferred, manages environmental activities. The Environmental Promotion Of� cer coordinates overall environmental activities for the head of� ce, of� ces, and each area.
Our management-level executives gather together to perform Management Review at the General Environmental Committee, which is chaired by the Chief Executive for the Environment once a year.
In addition, the Environmental Promotion Committee, which is chaired by the Environmental Management Of� cer, is our highest deliberative body for environmental activities whose members consist of Area Chief Executives for the Environment, promotion leaders for Head of� ce and of� ces, and others.
The Eco Products Subcommittee, which is chaired by the Environmental Promotion Of� cer and held twice a year, convenes members from each business headquarters. Here they primarily engage in deliberations over issues such as noti� cation of laws and regulations related to product-related environmental activities, the management of the chemical substances contained in products, registering and expanding environmentally conscious products.
As for the effectiveness of our environmental activities, our Internal Environmental Audit Team, which consists of certi� ed auditors from within the company, objectively examined environmental activities. Moreover, we ask third-party organizations to periodically con� rm that our system of environmental activities is compliant with ISO 14001-2004 Requirements.

10 Environmental Report 2016
Environmental Activity Plans and Actual Performance
Our domestic environmental activity plans and actual performance for FY2015 are shown in the table below. When it comes to our environmental activities for the current � scal year, as a result of our legal compliance and periodic progress management for our environmental targets that was carried out in each quarter, we were able to achieve every item. Moreover, various committee meetings were held as planned, activities were con� rmed by internal and external audits, and improvements were made. We also instituted environmental aspect surveys geared towards our activities in the next fiscal year at each site. We offered general environmental education and product-related environmental education via e-learning, carried out a document review on two occasions, and achieved all other items according to plan.
Items Frequency Category 2015/4~/6 2015/7~/9 2015/10~/12 2016/1~/3
EnvironmentalPromotionCommittee
(ManagementReviews)
Once every year
Planned - - - ○ March
Conducted - - - ● 3/30
Environmental Promotion Committee
Once every term
Planned - - ○ October ○ March
Conducted - - ● 10/9 ● 3/11
Eco Products Subcommittee
Once every term
Planned - ○ September - ○ February
Conducted - ● 9/18 - ● 2/19
Revise manualsOnce every
year
Planned ○ - -
Conducted - ● 6/8 - -
Internal/external audits
Once every year
Planned - ○ Internal audits ○ External audits -
Conducted - ● ● 11/5~13 -
Environmental aspect surveys
Once every year
Planned - - - ○
Conducted - - - ● 2/26
Con� rm legal compliance/
target progress
Once every quarter
Planned ○ July ○ October ○ January ○ April
Conducted ● July ● October ● January ● April
Environmental education
Once everyyear
Planned○ General environmental activity
-○ General environmental activity
-
Conducted ● May-June - ● October- November
-
Other As needed
Planned
○ Liaison Committee for Overseas Manufacturing Subsidiaries
○ Liaison Committee for Overseas Manufacturing Subsidiaries
○ Liaison Committee for Overseas Manufacturing Subsidiaries
○ Liaison Committee for Overseas Manufacturing Subsidiaries
Conducted ● 4/23,28,5/8~9 ● 9/10,16,25 ● 10/9,27,29 ● 2/23,24,29, 3/17~19

11Environmental Report 2016
In accordance with JDI’s environmental policy, we have set targets for reducing CO2 emissions from energy sources, reducing water intake, reducing emissions of chemical substances, reducing waste output, and expanding our lineup of environmentally conscious products. We continue to work for improvement in all areas.
Our record on FY2015 domestic environmental targets is shown in the chart below. We achieved our targets in all areas. The energy-ef� cient new line at the Mobara Plant was included in calculations for the � rst time in FY2015, and thus contributed to items ①–④. Reductions were relatively large per basic unit. Each plant is also steadily and incrementally reducing inputs and outputs on their own. Examples are shown on pages 16-18. Regarding the product-related item ⑤, please see page 24 for an explanation of products with built-in environmental consciousness.
In the same way, overseas manufacturing subsidiaries also set environmental targets and pursue activities based on their own environmental policies.
Applicable range: ①–④ apply to the � ve plants of Tottori, Higashiura, Ishikawa, Nomi, and Mobara (including the new production line), which are manufacturing sites in Japan.
The baseline year covers the � ve plants at Tottori, Higashiura, Ishikawa, Fukaya, and Mobara (not including the new line).
*1: The CO2 emissions coefficient from electricity is 0.476 t-CO2/MWh (receiving-end CO2 emissions basic unit for FY2011 announced by the Federation of Electric Power Companies of Japan). The other conversion factors are from the Act on the Rational Use of Energy and the Act on Promotion of Global Warming Countermeasures.
*2: The priority controlled chemical substances refer to 36 substances selected as being subject to priority control efforts. They include volatile organic compounds (VOC) and PRTR targeted substances, and constitute the bulk of the substances that we use and emit.
*3: Waste, etc. = General waste + Industrial waste + Valuables*4: The denominator for the basic unit is the glass substrate area (converted value)*5: Proportion of environmentally conscious products = Number of environmentally conscious products for the fiscal year in
question / Number of products developed in the � scal year in question
Item Indicator Target value Actual value Evaluation
① Reduce emissions of energy-derived CO2
Reduction rate for basic unit (Baseline: FY2012)
40% 41.4% ○
② Reduce the amount of water received 34% 43.3% ○
③ Reduce emissions of priority controlled chemical substances
53% 59.4% ○
④ Reduce emissions of waste, etc. 15% 19.8% ○
⑤ Expand environmentally conscious products
Proportion of environmentally conscious
products90% 96% ○
Environmental Targets for FY2015
Environmental Targets

12 Environmental Report 2016
Our FY2016 domestic environmental targets are shown in the chart below. Regarding the four production-related targets ① through ④, our enterprise scale has changed so much from FY2012 that we decided to change the baseline to FY2013. Also, in accordance with a revision to our environmental policy, we have added a biodiversity-related target and simultaneously increased the number of targeted items so our activities will cover a broad range of product-related issues.
Applicable range: ①–④ apply to the six plants of Tottori, Higashiura, Ishikawa, Nomi, Fukaya, and Mobara (not including the new production line), which are manufacturing sites in Japan.Fukaya Plant to be included in baseline calculations.*6: After a review in FY2016, the number of priority controlled chemical substances was set at 38.
Results and FY2016 target values(Four production-related items)Baseline is changed to FY2013 in this graph to correspond with activities in FY2016 and beyond.
(Note) Due to changes in the baseline and coverage, we are unable to show targets over multiple years, so only FY2016 values are shown this time.
(%)100
80
60
40
20
0
(%)100
80
60
40
20
02013 2014 2015 2016
(%)100
80
60
40
20
02013 2014 2015 2016
(%)100
80
60
40
20
02013 2014 2015 2016
Target values (basic unit)Actual values (basic unit)
Amount of water receivedEmissions of priority controlled chemical substances Emissions of waste, etc.
2013 2014 2015 2016
Emissions of energy-derived CO2
Item Indicator Target value
① Reduce emissions of energy-derived CO2
Reduction rate for basic unit(Baseline: FY2013)
18.5%
② Reduce the amount of water received 2.4%
③ Reduce emissions of priority controlled chemical substances
27.8%
④ Reduce emissions of waste, etc. 7.5%
⑤ Continue biodiversity conservation activities and environmental activities in local communities
Carried out as planned
⑥ Supply environmentally conscious products that take product life cycles into account
Percentage of products meeting our“environmentally conscious product” standards
*excluding customer causes
100%
⑦ Con� rm chemical substance levels in products within the development process
Appropriate management of chemical content judgments
⑧ Promote environmentally conscious procurement activities
Revision of Green Procurement Guidelines to take legal and other requirements into account will be considered
Environmental Targets for FY2016

13Environmental Report 2016
INPUT
Electricity(purchased power)
Heavy fuel oil
LNG
Diesel oil
Japan Overseas
1,116,575 130,226
121 0
16.236 0.310
6,127 81
2,033 0
907 0
0 1,588
Amount of water received 13.363 1.681
16,520 327
Energy
OUTPUT
Electricity(solar power)
City gas
MWh
MWh
kL
t
t
t
kL
million m3
million m3
LPG
Energy-derived CO2*2
Amount of priority controlled chemical substances*1emitted
Industrial waste
Valuables
586,000 101,000
54,000 0
12.642 1.393
214 84*4
28,272 6,665
18,874 2,630
General waste
9,065 2,219
333 1,816
CO2
Greenhouse gases*3
Wastewater
Total waste, etc.
t-CO2
t-CO2
million m3
t
t
t
t
t
Production activities
Amount of priority controlled chemical substances*1 used
Japan Overseas
*1: The priority controlled chemical substances refer to 36 substances selected as being subject to priority control efforts.*2: The CO2 emissions coefficient from electricity in Japan is 0.476 t- CO2/MWh (receiving-end CO2 emissions basic unit for
FY2011 announced by the Federation of Electric Power Companies of Japan). The other conversion factors are from the Act on the Rational Use of Energy and the Act on Promotion of Global Warming Countermeasures. Local emissions coef� cients for China, Taiwan, and the Philippines were used for the CO2 emissions coef� cients from electricity in other countries.
*3: Among substances covered in the Act on Promotion of Global Warming Countermeasures, we use the term “greenhouse gases” to refer to these seven substances: PFC (CF4, c-C4F8), HFC (CHF3, C2HF5), SF6, NF3, N2O. We use AR4 for the emission coef� cient.
*4: Within Japan, this refers only to emissions of the 36 priority controlled chemical substances designated by JDI, and overseas it refers only to emissions of VOC.
2012 2013 2014 2015
800,000
600,000
400,000
200,000
0
Total emissions of waste, etc. (including valuables) Emissions of priority controlled chemical substances
Japan
Overseas(t-CO2)
2012 2013 2014 2015
40,000
30,000
20,000
10,000
0
(t)
2012 2013 2014 2015
20
15
10
5
0
(million m3)
2012 2013 2014 2015
500
300
200
100
0
(t)
Emissions of energy-derived CO2 Amount of water received
Addition ofNomi Plant
Addition of thenew production line
at Mobara Plant
VOC reductions due toprocess modi�cations
400
Addition ofNomi Plant
Addition of thenew production line
at Mobara Plant
Addition ofNomi Plant
Addition of thenew production line
at Mobara PlantAddition ofNomi Plant
Environmental Aspects (Environmental Burden)
When it comes to our business activities, these involve inputs such as energy and resources and the creation of products, which is accompanied by outputs such as CO2, waste, and so on. These inputs and outputs are regarded as environmental aspects within ISO 14001.
An overview of this is shown in the � gure below (covers all domestic plants + overseas manufacturing subsidiaries). The basis of our environmental improvement activities lies in reducing the amount of inputs and outputs, and we work to address such activities by determining each of these items for every area in a detailed manner.
14 Environmental Report 2016
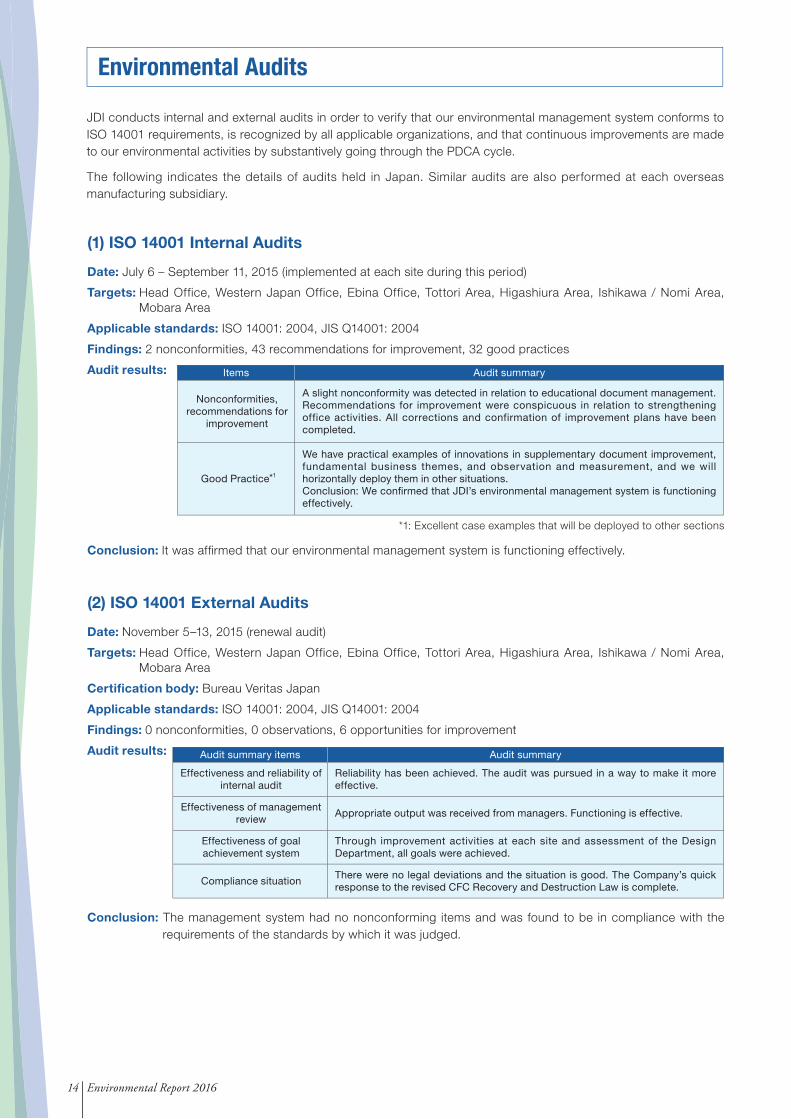
(2) ISO 14001 External Audits
Date: November 5–13, 2015 (renewal audit)
Targets: Head Office, Western Japan Office, Ebina Office, Tottori Area, Higashiura Area, Ishikawa / Nomi Area, Mobara Area
Certi� cation body: Bureau Veritas Japan
Applicable standards: ISO 14001: 2004, JIS Q14001: 2004
Findings: 0 nonconformities, 0 observations, 6 opportunities for improvement
Audit results:
Conclusion: It was af� rmed that our environmental management system is functioning effectively.
Conclusion: The management system had no nonconforming items and was found to be in compliance with the requirements of the standards by which it was judged.
(1) ISO 14001 Internal Audits
Date: July 6 – September 11, 2015 (implemented at each site during this period)
Targets: Head Office, Western Japan Office, Ebina Office, Tottori Area, Higashiura Area, Ishikawa / Nomi Area, Mobara Area
Applicable standards: ISO 14001: 2004, JIS Q14001: 2004
Findings: 2 nonconformities, 43 recommendations for improvement, 32 good practices
Audit results: Items Audit summary
Nonconformities, recommendations for
improvement
A slight nonconformity was detected in relation to educational document management. Recommendations for improvement were conspicuous in relation to strengthening office activities. All corrections and confirmation of improvement plans have been completed.
Good Practice*1
We have practical examples of innovations in supplementary document improvement, fundamental business themes, and observation and measurement, and we will horizontally deploy them in other situations.Conclusion: We con� rmed that JDI’s environmental management system is functioning effectively.
Audit summary items Audit summary
Effectiveness and reliability of internal audit
Reliability has been achieved. The audit was pursued in a way to make it more effective.
Effectiveness of management review
Appropriate output was received from managers. Functioning is effective.
Effectiveness of goal achievement system
Through improvement activities at each site and assessment of the Design Department, all goals were achieved.
Compliance situationThere were no legal deviations and the situation is good. The Company’s quick response to the revised CFC Recovery and Destruction Law is complete.
*1: Excellent case examples that will be deployed to other sections
Environmental Audits
JDI conducts internal and external audits in order to verify that our environmental management system conforms to ISO 14001 requirements, is recognized by all applicable organizations, and that continuous improvements are made to our environmental activities by substantively going through the PDCA cycle.
The following indicates the details of audits held in Japan. Similar audits are also performed at each overseas manufacturing subsidiary.

15Environmental Report 2016
Audit summary items Audit summary
Effectiveness and reliability of internal audit
Reliability has been achieved. The audit was pursued in a way to make it more effective.
Effectiveness of management review
Appropriate output was received from managers. Functioning is effective.
Effectiveness of goal achievement system
Through improvement activities at each site and assessment of the Design Department, all goals were achieved.
Compliance situationThere were no legal deviations and the situation is good. The Company’s quick response to the revised CFC Recovery and Destruction Law is complete.
Major category Item Details Investment Expenses
Environmental conservation
costs (costs within business areas*1 )
Pollution prevention costs
Costs for preventing air pollution, water pollution, soil pollution, noise, foul odors, and more.
38 2,318
Global environmental
conservation costs
Costs for preventing global warming, conserving energy, preventing the depletion of the ozone layer, and more.
19 41
Resource recycling costs
Costs for the ef� cient utilization of resources, as well as the recycling, treatment, and disposal of industrial waste and general waste.
2 738
Total 59 3,097
Major category Category Item Bene� t Unit
Environmental conservation bene� ts (physical unit)
Environmental conservation bene� ts related to environmental burdens and waste*2
Emissions of energy-derived CO2
36 1,000 t-CO2
Emissions of waste, etc. -428 t
Economic bene� ts associated with environmental conservation
activities
Operating revenue related to environmental burdens and waste
Revenue from the sale of valuables
89 1 million yen
*2: In order to consider the changes in the production output, values were derived using the following formula, which was established by referring to the Environmental Accounting Guidelines.
Bene� t = Emissions from the previous � scal year × (glass substrate area from the � scal year in question / glass substrate area from the previous � scal year) – Emissions from the � scal year in question.
Unit: 1 million yenSummary of Environmental Conservation Costs in Japan
Summary of Environmental Conservation Bene� ts in Japan
Applicable range:Environmental accounting is applied to the six plants of Tottori, Higashiura, Ishikawa, Nomi, Fukaya, and Mobara (including the new production line)
Environmental Accounting
We determine investments and expenses related to environmental conservation in order to tabulate and perform analysis in working towards environmental accounting that reflects factors like cost-effectiveness in managerial decision-making. We have established accounting items by referring to the Ministry of the Environment’s Environmental Accounting Guidelines, while also taking matters such as their degree of importance into consideration.
FY2015 environmental conservation costs and the effect of those conservation measures are shown in the table below.
Within costs, “investment” for pollution reduction refers to the laying of pipes for liquid waste, and “investment” for global environmental conservation refers to the use of waste heat from an external cooling unit that chills water for the production process (page 16). Expenses include those for environmental analysis and measurement, waste disposal, outsourcing, repair and maintenance, and other uses. With the closure of the Fukaya Plant, CO2 emissions declined about 5% year on year from the previous fiscal year, and waste output increased about 1.5%. We expanded the range of valuables, and we recovered more than in FY2014.
*1: Analysis and measurement costs related to the environment are also included in the costs within business areas.

16 Environmental Report 2016
Coolantwater tankCirculating pump
Newly installed
Inverter pump
External A/C unit
External A/C unit
Cooledwater pipe
On-sitecontrol
panel
Circulating pump
Electricity
Coolingcoil
Heatingcoil
Heatingcoil
Filter
Temperature sensor
Heat exchanger
To clean room
Outside air
Fan
25.5℃7500L/min
23℃7500L/min
Returntemperature18℃
Boiler
Productiondevice
❷
❶ ❷Refrigerator
Refrigerator Filter
City gas
Steam Steam
Coldwater
Cold water
Electricity
Effect: CO2 emission reduction 1,954 (t-CO2/year)
Higashiura Plant: Energy Conservation by Using Waste Heat in External A/C Unit
Initiatives on Global Warming Prevention and Energy Conservation
In our Environmental Policy, we declared that we will take countermeasures against global warming and conserve energy. We have taken action based on FY2015 environmental targets, which take FY2012 as the baseline for our medium-term environmental targets. We also participate in the “Commitment to a Low Carbon Society” plan being addressed by the electrical and electronics industry as a whole, and are working on energy improvements with a view towards FY2020.
When it comes to reducing emissions from our plants, we have been working to make improvements by optimizing equipment use at our Ishikawa, Higashiura, Nomi, and Tottori Plants, with the highest priority being placed on reducing the energy used at and greenhouse gases emitted from our plants. Case examples will be introduced below.
The external unit of our clean room air-conditioning system uses steam from a boiler for heating.Elsewhere in the plant, coolant water that has been warmed in production devices is then cooled in a refrigeration system.We tied these two processes together, sending the warmed coolant water to the external unit of the air conditioner, where the waste heat is used. This reduces natural gas usage by the boiler and cuts down on use of the refrigerator to cool our coolant water, which results in lower electricity consumption.
Improvements(1) The installation of a pump to send warmed coolant water to the external unit instead of using steam from a boiler
reduces natural gas consumption.(2) Use of the cooling coil in the external unit of our air-conditioning system reduces the burden on our coolant
water refrigerator.

17Environmental Report 2016
Blades (large) high-volume �ow
With valve adjustment
Blades (small) low-volume �ow
No valve restriction
Conventional pump operatingconditionsFlow volume is excessive when the pump is running normally, so the pump was used with the valve partially closed, which impaired the e�cient use of electricity.
Before the improvementsHigh electric power consumption
After the improvementsLow electric power consumption
Pump operating conditions after improvementWith blades trimmed (left diagram), the cooled water �ow is appropri-ate, the pump has less work to do, and its electrical e�ciency loss is lower.
Ishikawa Plant & Higashiura Plant: Improvement in Cooled-Water Pump Optimization
*We veri� ed the pressure loss with the pump manufacturer, and then decided how much to trim the blades to give the appropriate pump head (pressure).*These measures were applied to four pumps at the Ishikawa Plant and two at the Higashiura Plant (with plans for one more in FY2016).
The primary cooled-water pumps at the Ishikawa Plant and Higashiura Plant had large pump head, so water was sent to refrigerators and to cooled water pumps with valves partially closed, which impaired the ef� cient use of electricity. Operating at a set � ow allowed blades in � ow pumps to be trimmed, and adjustments were made so that an appropriate water � ow could be maintained without closing valves, resulting in a reduction of pump shaft power. In this way, we were able to reduce overall electricity use by the refrigeration system.
ImprovementsBlades in cooled-water pumps were trimmed and pump shaft power was reduced, which reduced electricity consumption in the refrigeration system by 15%.
Effect (total of Ishikawa and Higashiura plants): CO2 emission reduction 212 (t-CO2/year), to be continued in FY2016

18 Environmental Report 2016
The popularization and spread of renewable energies throughout society is important from the perspectives of combatting global warming, diversifying energy sources, and creating new industries and jobs.Our plants are striving to put in place solar power system as initiative to promote renewable energies.
Effectively Using Renewable Energy from Solar PowerAs part of its efforts to prevent global warming, our Tottori Plant introduced a solar power system on the plant’s rooftop in 2001.
It started operation of the system as part of a joint study with the New Energy and Industrial Technology Development Organization (NEDO) to expand the adoption of solar power. The system has a maximum output of 150 kW (with a total of 900 solar power generating panels) and generated 121 MWh of electricity in FY2015, thereby contributing to reductions of approximately 58 t-CO2. Solar power generating panels at our Tottori Plant
Before the improvements After the improvements
Organic wastewater tank
Industrial water tank
Mixing tank, neutralization tank, observation tank
Pure waterproduction
Discharge into sewage system
Pure water
A UF membrane (ultra�ltration membrane) catches ultra�ne particles, which are discharged from the system.
UF unit RO unit BAC (biological activated carbon)An RO membrane (reverse
osmosis membrane) catches electrolytes, total organic carbon (TOC), and particles in water, which are discharged from the system.
Activated carbon that adheres to organic matter and allows a �lm of microorganisms to form on its surface, fostering biodegradability
Organic wastewater recycle
Productionprocess
Existing wastewater recycle unit
New wastewater recycle unit
Tottori Plant: Renewable Energy Initiatives
Tottori Plant: Reduction of Water Use through Reuse of Waste Water
In an effort to improve water circulation volume and trim its utility expense, the Tottori Plant worked on ways to reuse organic waste water from production processes.
Pure water is used to wash panels in their production process, and previously the water, once used, was treated and discharged into the sewage system.
To ful� ll our goal of reusing organic wastewater from the production process, we expanded facilities at the plant.As shown in the diagram below, a new wastewater recycle unit has been added to enable reuse of the concentrated wastewater used in washing. For the puri� ed water to be reused like new water, stabilization of water quality is also necessary. This problem was solved by returning the water to an industrial water tank, which made reuse possible.
As a result, the Tottori Plant used 28% less industrial water than it budgeted for, and the plant has been able to hold down its use of water resources even as its capacity utilization rate has risen.
Effect (water use reduction): 380,972m3/year (Recycle of over 1,000m3/day of organic wastewater led directly to the reduction in water use)

19Environmental Report 2016
�����������������������
Permit for a waste treatment company
Inside the premises of a waste treatment company
Example of an inspection formInside the premises of a waste treatment company
Inside the premises of a waste treatment company
Inside the premises of a waste treatment company
Con� rmation examples for waste intermediate treatment companies
Image of JDI’s standards check sheet
Initiatives to Reduce Indirect Risks from Waste (All Plants)
JDI has set forth the goal of reaching zero emissions by promoting the 3Rs (Reduce, Reuse, Recycle) for waste in its Environmental Policy, and is working towards this goal.
Furthermore, pursuant to law we separate out specially-controlled industrial waste, industrial waste, and general waste, and perform risk management for each of these. Below we will introduce case examples of responses to indirect risks (illegal dumping, accidents, etc.), as well as case examples of reducing the quantities of materials used and recycling activities in which the waste emitted is restored to its original state and reused to the extent possible.
To protect against problems such as the illegal dumping of waste, which has recently come to pose a social problem, JDI manages its waste pursuant to law as a waste emitter. We have also voluntarily set standards for the environment and visit the disposal companies to which we consign our waste disposal and transport, and call upon them for their cooperation to ensure that accidents and problems do not occur.
During the periodic visits we use a checklist to con� rm the permitted scope and licenses of the disposal companies.We also confirm matters dealing with their waste disposal business, storage conditions, and management conditions via the four-page checklist, and grade them as either passing or failing for each item before � nally rating them with an overall score.
The waste collection and transportation companies and intermediate treatment companies we visited in FY2015 all received suf� ciently favorable overall ratings for us to continue using them.
Waste Reduction Activities and Waste Management
20 Environmental Report 2016
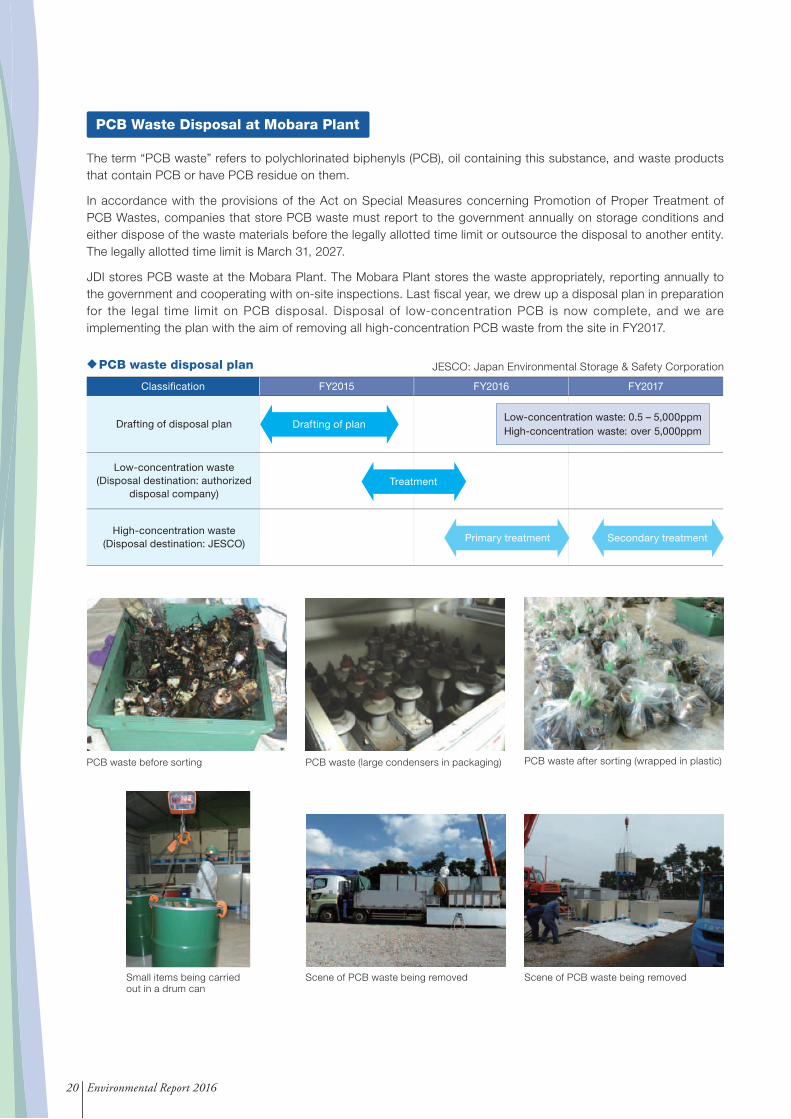
PCB waste disposal plan
PCB Waste Disposal at Mobara Plant
Classi� cation FY2015 FY2016 FY2017
Drafting of disposal plan
Low-concentration waste(Disposal destination: authorized
disposal company)
High-concentration waste(Disposal destination: JESCO)
Low-concentration waste: 0.5 – 5,000ppmHigh-concentration waste: over 5,000ppm
JESCO: Japan Environmental Storage & Safety Corporation
PCB waste after sorting (wrapped in plastic)
Scene of PCB waste being removed
PCB waste before sorting
Small items being carried out in a drum can
PCB waste (large condensers in packaging)
Scene of PCB waste being removed
Drafting of plan
Treatment
Primary treatment
The term “PCB waste” refers to polychlorinated biphenyls (PCB), oil containing this substance, and waste products that contain PCB or have PCB residue on them.
In accordance with the provisions of the Act on Special Measures concerning Promotion of Proper Treatment of PCB Wastes, companies that store PCB waste must report to the government annually on storage conditions and either dispose of the waste materials before the legally allotted time limit or outsource the disposal to another entity. The legally allotted time limit is March 31, 2027.
JDI stores PCB waste at the Mobara Plant. The Mobara Plant stores the waste appropriately, reporting annually to the government and cooperating with on-site inspections. Last � scal year, we drew up a disposal plan in preparation for the legal time limit on PCB disposal. Disposal of low-concentration PCB is now complete, and we are implementing the plan with the aim of removing all high-concentration PCB waste from the site in FY2017.
Secondary treatment
21Environmental Report 2016
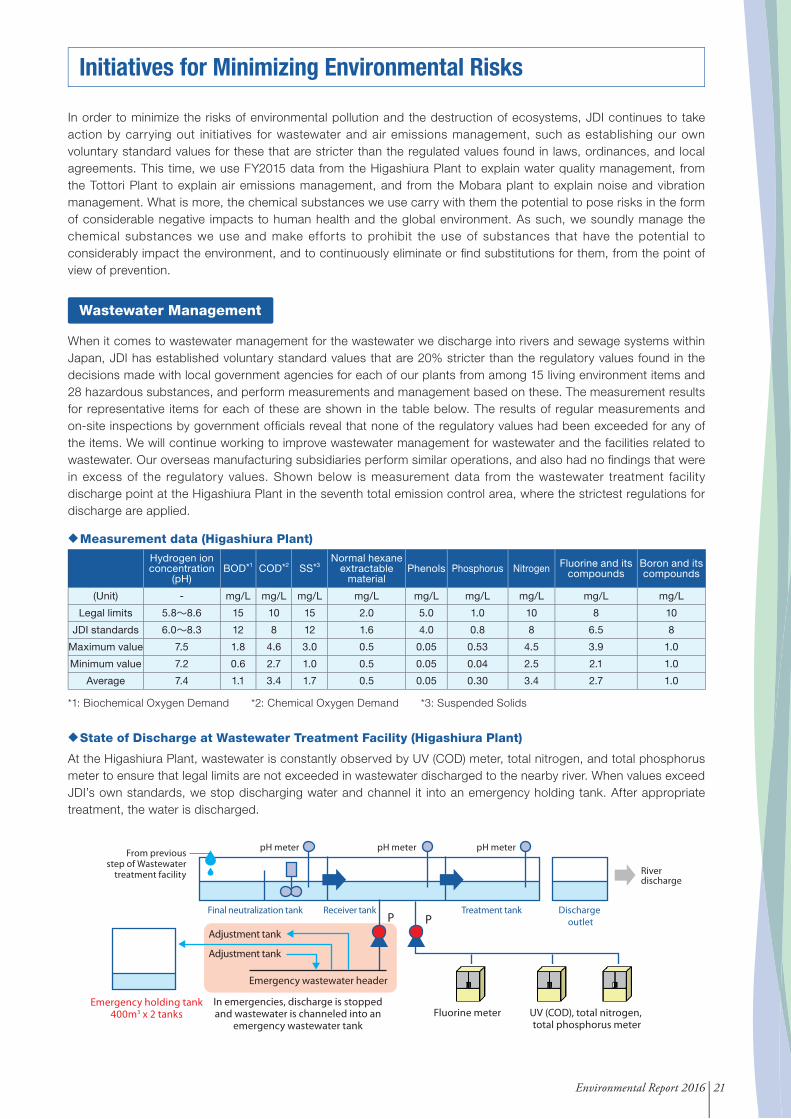
Measurement data (Higashiura Plant)
State of Discharge at Wastewater Treatment Facility (Higashiura Plant)
Wastewater Management
Hydrogen ion concentration
(pH)BOD*1 COD*2 SS*3
Normal hexane extractable
materialPhenols Phosphorus Nitrogen Fluorine and its
compoundsBoron and its compounds
(Unit) - mg/L mg/L mg/L mg/L mg/L mg/L mg/L mg/L mg/L
Legal limits 5.8~8.6 15 10 15 2.0 5.0 1.0 10 8 10
JDI standards 6.0~8.3 12 8 12 1.6 4.0 0.8 8 6.5 8
Maximum value 7.5 1.8 4.6 3.0 0.5 0.05 0.53 4.5 3.9 1.0
Minimum value 7.2 0.6 2.7 1.0 0.5 0.05 0.04 2.5 2.1 1.0
Average 7.4 1.1 3.4 1.7 0.5 0.05 0.30 3.4 2.7 1.0
*1: Biochemical Oxygen Demand *2: Chemical Oxygen Demand *3: Suspended Solids
Emergency holding tank400m3 x 2 tanks
Emergency wastewater header
Adjustment tank
Adjustment tank
Final neutralization tank
From previousstep of Wastewater
treatment facility
Treatment tank Discharge outlet
River discharge
Receiver tank
pH meter
P P
Fluorine meter UV (COD), total nitrogen, total phosphorus meter
pH meter pH meter
In emergencies, discharge is stopped and wastewater is channeled into an
emergency wastewater tank
Initiatives for Minimizing Environmental Risks
In order to minimize the risks of environmental pollution and the destruction of ecosystems, JDI continues to take action by carrying out initiatives for wastewater and air emissions management, such as establishing our own voluntary standard values for these that are stricter than the regulated values found in laws, ordinances, and local agreements. This time, we use FY2015 data from the Higashiura Plant to explain water quality management, from the Tottori Plant to explain air emissions management, and from the Mobara plant to explain noise and vibration management. What is more, the chemical substances we use carry with them the potential to pose risks in the form of considerable negative impacts to human health and the global environment. As such, we soundly manage the chemical substances we use and make efforts to prohibit the use of substances that have the potential to considerably impact the environment, and to continuously eliminate or � nd substitutions for them, from the point of view of prevention.
When it comes to wastewater management for the wastewater we discharge into rivers and sewage systems within Japan, JDI has established voluntary standard values that are 20% stricter than the regulatory values found in the decisions made with local government agencies for each of our plants from among 15 living environment items and 28 hazardous substances, and perform measurements and management based on these. The measurement results for representative items for each of these are shown in the table below. The results of regular measurements and on-site inspections by government of� cials reveal that none of the regulatory values had been exceeded for any of the items. We will continue working to improve wastewater management for wastewater and the facilities related to wastewater. Our overseas manufacturing subsidiaries perform similar operations, and also had no � ndings that were in excess of the regulatory values. Shown below is measurement data from the wastewater treatment facility discharge point at the Higashiura Plant in the seventh total emission control area, where the strictest regulations for discharge are applied.
At the Higashiura Plant, wastewater is constantly observed by UV (COD) meter, total nitrogen, and total phosphorus meter to ensure that legal limits are not exceeded in wastewater discharged to the nearby river. When values exceed JDI’s own standards, we stop discharging water and channel it into an emergency holding tank. After appropriate treatment, the water is discharged.
22 Environmental Report 2016
Management of Chemical Substances
Measured Data (Tottori Plant)
Measured Data (Mobara Plant)
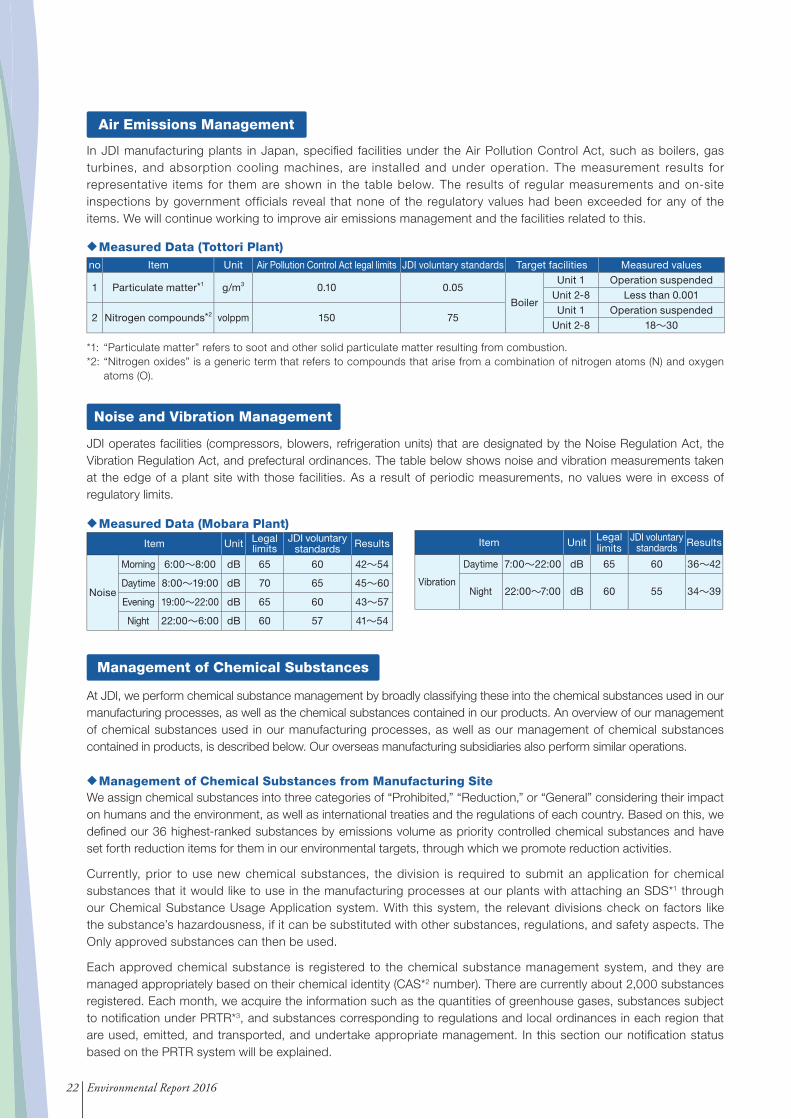
Air Emissions Management
Noise and Vibration Management
Item Unit Legal limits
JDI voluntary standards Results
Noise
Morning 6:00~8:00 dB 65 60 42~54
Daytime 8:00~19:00 dB 70 65 45~60
Evening 19:00~22:00 dB 65 60 43~57
Night 22:00~6:00 dB 60 57 41~54
Item Unit Legal limits
JDI voluntary standards Results
Vibration
Daytime 7:00~22:00 dB 65 60 36~42
Night 22:00~7:00 dB 60 55 34~39
no Item Unit Air Pollution Control Act legal limits JDI voluntary standards Target facilities Measured values
1 Particulate matter*1 g/m3 0.10 0.05 Boiler
Unit 1 Operation suspendedUnit 2-8 Less than 0.001
2 Nitrogen compounds*2 volppm 150 75Unit 1 Operation suspended
Unit 2-8 18~30
In JDI manufacturing plants in Japan, speci� ed facilities under the Air Pollution Control Act, such as boilers, gas turbines, and absorption cooling machines, are installed and under operation. The measurement results for representative items for them are shown in the table below. The results of regular measurements and on-site inspections by government officials reveal that none of the regulatory values had been exceeded for any of the items. We will continue working to improve air emissions management and the facilities related to this.
At JDI, we perform chemical substance management by broadly classifying these into the chemical substances used in our manufacturing processes, as well as the chemical substances contained in our products. An overview of our management of chemical substances used in our manufacturing processes, as well as our management of chemical substances contained in products, is described below. Our overseas manufacturing subsidiaries also perform similar operations.
Management of Chemical Substances from Manufacturing SiteWe assign chemical substances into three categories of “Prohibited,” “Reduction,” or “General” considering their impact on humans and the environment, as well as international treaties and the regulations of each country. Based on this, we de� ned our 36 highest-ranked substances by emissions volume as priority controlled chemical substances and have set forth reduction items for them in our environmental targets, through which we promote reduction activities.
Currently, prior to use new chemical substances, the division is required to submit an application for chemical substances that it would like to use in the manufacturing processes at our plants with attaching an SDS*1 through our Chemical Substance Usage Application system. With this system, the relevant divisions check on factors like the substance’s hazardousness, if it can be substituted with other substances, regulations, and safety aspects. The Only approved substances can then be used.
Each approved chemical substance is registered to the chemical substance management system, and they are managed appropriately based on their chemical identity (CAS*2 number). There are currently about 2,000 substances registered. Each month, we acquire the information such as the quantities of greenhouse gases, substances subject to noti� cation under PRTR*3, and substances corresponding to regulations and local ordinances in each region that are used, emitted, and transported, and undertake appropriate management. In this section our noti� cation status based on the PRTR system will be explained.
JDI operates facilities (compressors, blowers, refrigeration units) that are designated by the Noise Regulation Act, the Vibration Regulation Act, and prefectural ordinances. The table below shows noise and vibration measurements taken at the edge of a plant site with those facilities. As a result of periodic measurements, no values were in excess of regulatory limits.
*1: “Particulate matter” refers to soot and other solid particulate matter resulting from combustion.*2: “Nitrogen oxides” is a generic term that refers to compounds that arise from a combination of nitrogen atoms (N) and oxygen
atoms (O).

23Environmental Report 2016
Quantity discharged Quantity transferred
To air To public water bodies Transferred to sewage system Off -site
FY2014 FY2015 FY2014 FY2015 FY2014 FY2015 FY2014 FY2015
acetic acid 2-methoxyethy 2,370(1,700) 4,730 0 0 0 0 23 0
2-Aminoethanol 190 1,620 1,478.1 1,301 0 0 2,004.7 2.2
Hydrogen � uoride and its water-soluble salts 3.2 1,320 0 0 0 0 10,000 61
Boron and its compounds 3.0 0 200(2,380) 190 0 0 400(12,320) 330
Indium and its compounds 0 0 14 33 1.5 0 734 140
Molybdenum and its compounds 0 0 690 460 2.5 0 2,690 2,500
Conceptual diagram of our management system for the chemical substances contained in products
Component survey sheet
Requestsurvey
Requestcon�rmation
Requestsurvey
Registerresponse
Notifythe results
Issue survey request
(1) Request survey
jDesc
Laws and regulations
Customers’ environmental standards
Green Procurement Guidelines
Con�rm the compliance of the response and
register/save this in jDesc
Divisions at JDI
Register/save survey reply in jDesc
Analysis report
Safety data sheet
Certi�cation of non-use
Suppliers
(2) Request con�rmation of the compliance of the response
(3) Register con�rmation results
Notify con�rmation results
Register the con�rmation
results
Issue survey request based on the ordering information
Issue compliance con�rmation request
Laws and regulations
Since the actual quantities discharged into soil and disposed in land� ll for the sites in question were “0,” these were not recorded.FY2014 � gures (in parentheses) predate the change noti� cation.
*1: Safety Data Sheet*2: Chemical Abstracts Service (a worldwide ID system in which a unique number is assigned to each chemical substance)*3: The Pollutant Release and Transfer Register is a system in which the quantities of chemical substances designated as
hazardous that are discharged into the environment (air, water, soil) or transferred out of business sites contained in waste must be determined by the business itself, which must also notify this to the national government
Table of Substances Subject to PRTR Noti� cation
*4: JD Environmental information System for Chemical substance
Unit: kg
Management System for Chemical Substances Contained in ProductsSince April 1, 2013, we have been operating a system (jDesc*4) that links us with suppliers and helps us to manage the chemical content of products. Under this system, suppliers register a variety of data stipulated in our Green Procurement Guidelines. By the end of FY2015, data on about 10,000 procured items was registered in the system. Based on the final parts tables of JDI’s products, this data allows us to confirm the absence of chemical substances in our products, or to tally up the amount of chemical substances contained in products. We will continue using this system effectively to make our management of product chemical content more thoroughgoing, as set forth in our environmental policy.
PRTR Reporting SituationBased on the Act on Con� rmation, etc. of Release Amounts of Speci� c Chemical Substances in the Environment and Promotion of Improvements to the Management Thereof, we currently report on seven substances.
With the goal of improving report accuracy in the FY2015 report, we measured and analyzed each substance, con� rmed with the government, and reviewed our calculation method based on PRTR guidelines. As a result, we revised some reported values in the FY2014 report and reported on the change. In April 2016, we completed the switch to a facility that is highly ef� cient at removing acetic acid 2-methoxyethyl, and in FY2016 and beyond, we plan to reduce levels of this substance to about 1/3 of FY2015 levels.

24 Environmental Report 2016
Reducing weight
Long-term usability
Recycling
Ease of disassembly/ treatment
Environmental conservation
Energy conservation
Provision of information
Packagingmaterials
Products developed in �scal 2015Conventional product
Products developed in �scal 2014
0.0
1.0
2.0
3.0
4.0
5.0
Evaluation Criteria and Primary Evaluation Items Example for determination of environmentally conscious products
Initiatives Related to Environmentally Conscious Products
Evaluation criteria Primary evaluation items
① Reducing weight Reducing product size/weight
② Long-term usability Durability/reliability
③ Recycling Reuse/recycling of parts
④Ease of
disassembly/treatment
Ease of dismantling/disassembly and disassembly time, etc.
⑤ Environmental conservation
Chemical substances in parts and in manufacturing processes
⑥ Energy conservation Energy conservation in the product design
⑦ Provision of information
Framework for providing environmental information
⑧ Packaging materials Reducing the weight of packaging materials and the chemical substances they contain, etc.
Environmentally Considered Products
As the environmental aspect of the LCD devices dominate the final products, we work towards minimizing the environmental burden for the products and manufacturing. We will introduce the activities of environmentally considered products in FY2015.
Regarding the environmental performance of our products, we avoid biased assessments by considering the entire lifecycle of products, from raw material procurement to the disposal stage, and we numerically score each product on eight scales. These assessments are incorporated into the product development process so that all developed products are assessed. Products that score especially high on environmental performance are ranked as environmentally conscious products. By raising the ratio of environmentally conscious products within our lineup, we aim to comprehensively reduce the burden our products put on the environment. In FY2015, we raised this ratio to 96%. We will continue to develop environmentally conscious products in accordance with our environmental policy, and thus contribute to reducing the impact of our products on the environment.

25Environmental Report 2016
Management of Chemical Substances Contained in Products
When it comes to our products, the JDI Group as a whole is carrying out the following measures to accommodate laws related to chemical substances in products, such as the RoHS Directive and REACH Regulations, as well as our customers’ demands.
Enactment of the Green Procurement GuidelinesOur Green Procurement Guidelines were enacted based on trends in the laws of various countries pertaining to products obtained from the relevant groups. We ask that our suppliers comply with these as a reflection of the demands concerning chemical substances in products by our customers. These Green Procurement Guidelines are revised annually to ensure they appropriately re� ect the legal trends related to chemical substances in products, and are disclosed on our website.
Management of Chemical Substances in Product Development ProcessesWhen it comes to chemicals contained in the products we procure from external sources, we adhere to our Green Procurement Guidelines, and we ask our suppliers to register data on those chemicals to our Product Chemical Content Management System.We then confirm that the data they register with us conforms to our Green Procurement Guidelines and our customers’ demands via multiple internal divisions, starting from the product development process onward.
Managing Suppliers’ Management Systems for the Chemical Substances in ProductsWe request that our suppliers’ management systems for the chemical substances in products meet the standards set by JDI, and that they use the Guidelines for the Management of Chemical Substances in Products that are widely used by the electrical and electronics industry and other industries. In FY2015, we � nished con� rming the chemical substance management status of our suppliers and their ISO 14001 and ISO 9001 acquisition status using a system that we developed in-house.
Management of Chemical Substances in Parts Prior to Their Use in Mass Production LinesPrior to mass production stage, we periodically inspect and analyze product parts via a � uorescent X-ray analyzer to investigate the containing chemical substances, and check if prohibited toxic substances, such as the RoHS Directive (lead, mercury, cadmium, hexavalent chromium, and brominated flame retardants), are included in the parts.Moving forward, we will continue to manage chemical substances in our products together with our suppliers and related internal divisions conforming to our customers’ requirements.

26 Environmental Report 2016
WhiteMagic and Pixel Eyes are trademarks of Japan Display Inc.
The Japan Display Technology Exhibition
SID Display Week 2016
Japan Display technology exhibit
Keynote speech at the symposium Receiving the Display of the Year Award Scene in the exhibition area
Explanation of market trends, our business developments, and basic strategy
Displaying at Exhibitions
With the goal of disclosing information to and achieving mutual understanding with our stakeholders, we display products that incorporate the latest in JDI’s technology at various exhibitions, such as SID (The Society for Information Display). These exhibitions open up two-way lines of communication. We would like to report on two recent exhibitions: the Japan Display Technology Exhibition and SID Display Week 2016.
On January 22, 2016, JDI opened its Japan Display Technology Exhibition at the Shinbashi Kokukaikan.
At the explanatory meeting, the head of our Research and Development Center spoke about market trends, JDI’s business developments, and its technological strategy.He explained LTPS technology—the basis of displays—and product development with this technology at its core, and announced that JDI had the world’s top LTPS production capacity. High-resolution technology, low power-consumption technology, in-cell touch technology, OLED technology, curved panel technology for automobiles, high-speed system technology for electronic mirrors, and ultra-low power consumption re� ective-type LCD modules were introduced.
In the exhibition area, the numerous visitors had a chance to see many of the latest displays that embody our four technology themes: Mobile, Automotive, C&I, and Re� ective.
This event, the world’s largest for displays, was held in San Francisco, California, from May 22 to 27, 2016 (local time). JDI gave presentations at the symposium and exhibited its technology at a booth.
Under the concept of “LTPS World – What JDI’s LTPS offers,” we showed the added value provided by our low-temperature polysilicon (LTPS) technology. Exhibited items included 8K4K high-resolution LCD modules, as well as low power-consumption WhiteMagic™ and re� ective LCD modules, and Pixel Eyes™ with in-cell touch technology. In addition, JDI gave six presentations at the symposium, which attracts display-related researchers and technologists from the entire world. On top of all that, we were greatly honored that JDI’s 17.3-inch (43.9cm) 8K4K LCD display won the Display of the Year Award, one of the well-known Display Industrial Awards presented at SID Display Week 2016.

27Environmental Report 2016
Ecosystem Conservation Activities
JDI works for the conservation of ecosystems through greening activities at our business sites and nature recovery activities for nearby area of each site. We will introduce the initiatives of our Mobara Plant and Nomi Plant.
In the Mobara Plant, we have the Hotaru-gawa Creek and the Koi Pond, a man-made creek and a pond with koi, carps in Japanese, living in it. The � re� ies dwell in the creek, and we clean the area around the creek and maintain the water quality so the environment remains amenable to � re� ies.
In July 2015, volunteers trimmed grass along the banks, picked up trash from the creek, and cleaned the Koi Pond.
Every year in June, � re� ies can be seen � ying near the creek. We will continue this conservation activity to maintain an environment where � re� ies can be seen � itting through the air.
Activities at Mobara Plant
the Hotaru-gawa Creek
The Koi Pond
Cleaning activity at the Koi Pond

28 Environmental Report 2016
In addition to creating a biotope environment, the Nomi Plant has conducted repeated surveys of the plants and animals living there. In FY2015, newly planted trees were given a regular trimming. The biological survey con� rmed the presence of loaches in the biotope, and the 80 medaka originally released there had multiplied to approximately 1,000.The presence of many kinds of dragon� y larvae (nymphs) and adults was con� rmed, showing that the Nomi Plant has become a dragon� y sanctuary.
We aim to maintain this ecosystem and its food chain as part of the natural surroundings, and we will preserve the bio-friendly environment and natural scenery.
Activities at Nomi Plant
Loach and dragon� y nymph
Scarlet skimmerPlant: Fringed water-lily (Type II Endangered in Ishikawa Prefecture, Near Threatened according to Environmental Agency)
Lesser emperor depositing eggsPlant: Water snow� ake (Type I Endangered in Ishikawa Prefecture, Near Threatened according to Environmental Agency)
Redtails mating (the heart shape they form is characteristic)Plant: Simplestem bur-reed (Type II Endangered in Ishikawa Prefecture, Near Threatened according to Environmental Agency)
Four-spotted chaserPlant: Wild Japanese iris (Near Threatened in Ishikawa Prefecture)
Medaka
Found in the Nomi Plant Biotope
Dragonfly nymphs Adults
Damsel� ies 8 Species
Redtail
- Yellow damsel� y
- Dusky lilysquatter
- Ezo bluet
Tropical bluetail -
- Emerald damsel� y
- Greater emerald damsel� y
- Monosashi damsel� y
2 Species 7 Species
Hawkers 3 Species
Lesser emperor
Black-striped lesser emperor
- Yabu hawker
2 Species 3 Species
Dragon� ies 13 Species
Neki dragon� y
White-tailed skimmer
Blue-tailed forest hawk
Wide-bellied skimmer
Scarlet skimmer
Konoshime skimmer
- Pied skimmer
- Four-spotted chaser
- Globe skimmer
- Mayudate skimmer
- Autumn darter
- Butter� y dragon� y
Banded darter -
7 Species 12 Species
Total 24 Species Total 11 Species Total 22 Species
Biotope panorama
29Environmental Report 2016
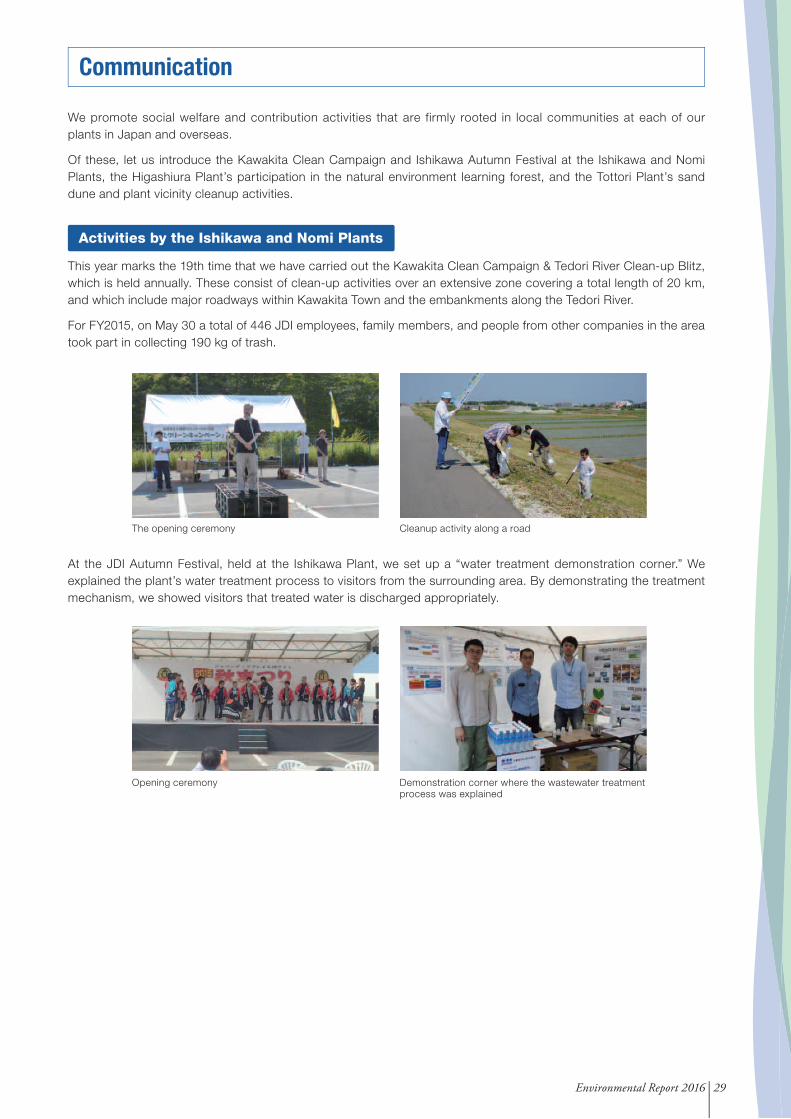
The opening ceremony
Opening ceremony
Cleanup activity along a road
Demonstration corner where the wastewater treatment process was explained
Activities by the Ishikawa and Nomi Plants
Communication
We promote social welfare and contribution activities that are firmly rooted in local communities at each of our plants in Japan and overseas.
Of these, let us introduce the Kawakita Clean Campaign and Ishikawa Autumn Festival at the Ishikawa and Nomi Plants, the Higashiura Plant’s participation in the natural environment learning forest, and the Tottori Plant’s sand dune and plant vicinity cleanup activities.
This year marks the 19th time that we have carried out the Kawakita Clean Campaign & Tedori River Clean-up Blitz, which is held annually. These consist of clean-up activities over an extensive zone covering a total length of 20 km, and which include major roadways within Kawakita Town and the embankments along the Tedori River.
For FY2015, on May 30 a total of 446 JDI employees, family members, and people from other companies in the area took part in collecting 190 kg of trash.
At the JDI Autumn Festival, held at the Ishikawa Plant, we set up a “water treatment demonstration corner.” We explained the plant’s water treatment process to visitors from the surrounding area. By demonstrating the treatment mechanism, we showed visitors that treated water is discharged appropriately.

30 Environmental Report 2016
Group photo taken at the Tottori Sand Dunes cleanup
A scene during Operation Cleanup
Planting the rice paddy
Activities at the Higashiura Plant
Activities at the Tottori Plant
A “natural environment learning forest” is located on the west side of the Higashiura Plant. This is a place where local residents can come into contact with a natural farm-and-forest landscape and learn about the relationship between people and nature. Various events are held here, and every year we participate in planting and harvesting a rice paddy. In FY2015, the rice paddy was expanded and yielded a good crop. The 30 kg of rice we received for our participation was distributed to employees at no cost through the company cafeteria. We will continue to participate in local events and contribute to the community.
The Tottori Plant contributes to eastern Tottori Prefecture by participating twice a year, spring and fall, in the Tottori Sand Dunes cleanup. Participants totaled 175 and included both JDI employees and their family members. This was the tenth year that JDI participated.
We also hold a semiannual Operation Cleanup around the Tottori Plant. In FY2015, a total of 28 people participated in the two events. We intend to keep making social contributions that are rooted in the community.

31Environmental Report 2016
Company name Suzhou JDI Electronics Inc. (SE)
Time established February 1996
Capital US$126 million
CEO Kotaru Ueno
No. of employees 2,613 (as of May 2016)
Location No.168 Jin Feng Road, Suzhou New District, Suzhou, 215011, PRC
Business line Manufacture of small and medium-sized LCDSuzhou JDI Electronics Inc. (SE)
Environmental Activities at Suzhou JDI Electronics Inc.
Initiatives UnitTargeted reduction
Actual reduction*1
Achievement rate
Assessment FY2016 targets
① Reduction of electricity usage
kWh 749,907 2,663,281 355% ○ 4,310,788
② Reduction of water usage
m3 51,423 141,216 275% ○ 20,616
③ Reduction of waste t 55 140 254% ○ 108
④ Reduction of VOC emission
kg 1,195 988 83% △*2 5,084*3
1. Environmental Plans and Results
Communication with Overseas
We have five overseas manufacturing subsidiaries. They mainly assemble liquid crystal panels and manufacture liquid crystal parts. Each company has acquired ISO 14001 certif ication, and they promote to continue improvements for environmental aspects.
Their primary environmental burdens come from the electricity and water used in production, as well as their waste.All of the companies promote reductions of their environmental burdens, and work on preventing global warming (reducing CO2) and effectively using resources (reusing water resources and reducing the amount of waste generated) as priority issues. We work to communicate with the companies by holding regular meetings to con� rm and to ascertain the progress of each company.
The following articles show the activities by Suzhou JDI Electronics Inc. (SE).
*1: Actual reduction = cumulative effect of environmental policies we implemented*2: Target not reached because of production cutback*3: Will change to VOC usage reduction in FY2016

32 Environmental Report 2016
2. Example of ActivitiesWe would like to introduce some examples of environmental activities in FY2015.(1) Electricity usage reduction - We matched and optimized FFU, circulation equipment, and air conditioning operation values to requested workplace
air cleanliness, temperature, and humidity values. 227 FFU stopped Four circulators stopped 11 air-conditioning systems stopped Reduction effect: 26,047kWh/month (CO2 emission cut of 196 (t/ CO2))
(2) Waste reduction - Matching the washing machine’s operations to production volume resulted in a reduction of organic wastewater
emission. - Reduction effect: 59.4 T/year of organic wastewater
(3) VOC emission reduction - Ethanol usage was reduced through improvements to containers and other measures. - Reduction effect: 988 kg/year of VOC emission
(4) Summer/winter autonomous energy savings activity - Autonomous energy saving activities were instituted to reduce unnecessary use of lighting, PCs, and other office
equipment, and to rationalize air conditioner temperature settings
(5) Contributions to the community - No car day (monthly) - KIDS environmental education activity (annually) - Environmental conservation volunteer activity (annually)
KIDS environmental education Environmental conservation volunteer activity
In winter, air conditioner is set to 22°C or lower
Each person declares an energy-saving target
Environmental conservation volunteer activity

33Environmental Report 2016
(1) Laws related to preventing pollution
(2) Laws related to a sound material-cycle society and waste
(4) Laws related to chemical substances
(6) Others
(3) Laws for energy conservation and global environmental problems, etc.
(5) Regional ordinances
-Act on the Improvement of Pollution Prevention Systems
-Air Pollution Control Act-Water Pollution Prevention Act-Puri�cation Tank Act
-Noise Regulation Act-O�ensive Odor Control Act-Soil Contamination Countermeasures Act
etc.
-Basic Act on Establishing a Sound Material-Cycle Society-Waste Management and Public Cleansing Act -Respective Acts on Recycling (Home Appliances, Containers and Packaging, etc.)
-Act on Promoting Green Purchasing etc.
-Law concerning Pollutant Release and Transfer Register
-PRTR Act-Act on the Evaluation of Chemical Substances and Regulation of Their Manufacture, etc.
-Poisonous and Deleterious Substances Control Act etc.
-Act on the Rational Use, etc. of Energy -Act on Promotion of Global Warming Countermeasures-Act on the Protection of the Ozone Layer-Fluorocarbons Recovery and Destruction Act etc.
-Tottori Prefectural Ordinance on Global Warming Countermeasures-Aichi Prefectural Ordinance on the Preservation of the Living Environment for Residents
-Ordinance on the Protection and Nurture of the Environment of Home Ishikawa
-Saitama Prefectural Ordinance on Preserving the Living Environment-Chiba Prefectural Ordinance on VOC
etc.-Basic Act on Biodiversity-Factory Location Act -Industrial Safety and Health Act-Fire Service Act-High Pressure Gas Safety Act
etc.
From Opening to Closure of a Plant
Exterior of Hakusan Plant Fukaya Plant turned into vacant lot
Legal Compliance
Compliance is one of the most fundamental challenges when it comes to companies fulf il l ing their social responsibility. We pre-emptively prevent the discharge of environmental pollutants and other contaminants into the soil, groundwater, and atmosphere, while also creating systems for compliance to environmental laws and undertaking environmental conservation activities. This � scal year, there were no violations of environmental laws, neither in Japan nor overseas. Major laws related to the environment in Japan are indicated below. Of these, this report will explain reporting on the opening and closing of plants and initiatives related to the Act for Rationalized Use and Proper Management of Fluorocarbons.
Two big plant-related moves are planned for FY2016: the Hakusan Plant will start operations and the Fukaya Plant will be shut down.
The opening and closure of a plant are attended by many legal obligations, such as reporting on the establishment of new facilities and their decommissioning. We cooperated with government bodies to ensure that our response was complete. We will maintain our appropriate response in the future.

34 Environmental Report 2016
External unit of an air conditioner using � uorocarbons
Inspection scene
Response to Act for Rationalized Use and Proper Management of Fluorocarbons
In FY2015, the Act for Rationalized Use and Proper Management of Fluorocarbons went into effect and so did our response. Based on the act, the relevant equipment has been listed and simple, regular inspections have been carried out. We rely on government-authorized specialists to do the regular inspections and repair the equipment in case of malfunctions. Also, we track the amounts of � uorocarbons added and recovered each year.

Japan Display Inc.3-7-1, Nishi-shinbashi, Minato-ku, Tokyo, 105-0003, Japan
EnvironmentalReport
2016