environmental risks from agriculture in europebiogov.uclouvain.be/communication/papers/h1...
TRANSCRIPT

Environmental risks fromagriculture in Europe
Locating environmental risk zones in Europe using agri-environmental indicators

Citation: Delbaere, B. & A. Nieto Serradilla (Eds) (2004)
Environmental risks from agriculture in Europe: Locating
environmental risk zones in Europe using agri-environmental
indicators – Tilburg, ECNC-European Centre for Nature
Conservation
ECNC-European Centre for Nature Conservation
Headquarters Tilburg
PO Box 90154
5000 LG Tilburg
the Netherlands
www.ecnc.org
ECNC Regional Office Budapest
c.o. National Authority for Nature Conservation
Költo Utca 21
1121 Budapest
Hungary
2004 © ECNC: No part of this publication may be reproduced,
stored in a retrieval system, or transmitted in any form or by
any means, electronic, mechanical, photocopying, recording
or otherwise, without the prior written permission of ECNC.
The EnRisk team is solely responsible for the content of this
document. It does not represent the opinion of the European
Community, nor is the EC responsible for any use that might
be made of data appearing herein.
EnRisk is financed by the European Commission as a
Concerted Action under theme ‘Quality of Life and
Management of Living Resources’ of the Fifth Framework
Programme for Research, Technological Development and
Demonstration Activities.
Contract no.: QLK5-CT-2001-01911

Edited by:
Ben Delbaere and Ana Nieto Serradilla,
ECNC-European Centre for Nature Conservation
With contributions by:
• Prof. Dr Winfried E.H. Blum, Dr Max Kuderna & Gabriele
Wolkerstorfer – Institute for Soil Research, University of
Agricultural Sciences, Vienna, Austria
• Dr Floor Brouwer & Frans E. Godeschalk - Agricultural
Economics Research Institute, Wageningen University and
Research Centre, the Netherlands
• Prof. Dr Francisco Díaz Pineda, Paloma Fernández Sañudo
& Teresa Gil Gil - Centro de Investigaciones Ambientales de
la Comunidad de Madrid ‘Fernando González Bernáldez’,
Spain
• Dr Ir Anne Gobin - Laboratory for Experimental
Geomorphology, Catholic University of Leuven, Belgium
• Paul Goriup – The NatureBureau, United Kingdom
• Prof. Dr Volkmar Gutsche – Federal Biological Research
Centre for Agriculture and Forestry, Germany
• Dr Alan Pickaver – EUCC – the Coastal Union, the
Netherlands
• Dirk Wascher & Michiel van Eupen – Alterra, Green World
Research, the Netherlands
• Dr Paul Williams – The Natural History Museum, United
Kingdom
• Dr Christoph Zöckler, Mary Edwards & Matt Doughty –
UNEP-World Conservation Monitoring Centre, United
Kingdom
Environmental risks fromagriculture in Europe
Locating environmental risk zones in Europe using agri-environmental indicators

4 Environmental risk assessment and agriculture / Agriculture and the environment

List of contents Preface 8 Executive summary 9 Introduction 12
1 Environmental risk assessment and agriculture 15
1.1 Agriculture and the environment 151.2 Agri-environmental policies in Europe 171.2.1 Policy focused on nutrient enrichment 17 1.2.2 Soil erosion policy 181.2.3 Policies on pesticide use 181.2.4 Policies on agriculture and biodiversity 191.2.5 European landscape policies 201.3 Agri-environmental indicators 211.3.1 The ELISA project 211.3.2 European Union and the IRENA project 211.3.3 Organisation for Economic Co-operation and Development 241.4 Environmental risk assessment 241.5 Method applied in the EnRisk project 261.5.1 EnRisk objectives 261.5.2 Scientific added value 261.5.3 Geographical scope 261.5.4 Common framework 26
2 Risk assessment at the European scale 31
2.1 Soil erosion 312.1.1 Assessment of the European soil loss 312.1.2 Methodology 332.1.3 Mapping soil erosion risk zones 362.1.4 Interpretation of results 412.2 Nutrient enrichment 442.2.1 Overview and interpretation of data sources 442.2.2 Methodology 502.2.3 European eutrophication risk zones 502.2.4 Interpretation of results 512.3 Pesticide use 522.3.1 Overview and interpretation of data sources 522.3.2 Methodology 532.3.3 Mapping pesticide risk zones 552.3.4 Interpretation of results 56

2.4 Biodiversity 622.4.1 Assessing risks to biodiversity 622.4.2 Overview of data sources 632.4.3 Methodology 652.4.4 European biodiversity risk zones 682.4.5 Interpretation of results 682.5 Landscape 752.5.1 Conceptual framework 752.5.2 Overview and interpretation of data sources 752.5.3 Methodological approach for landscape state and vulnerability assessment 792.5.4 Calculation towards landscape vulnerability for diversity 822.5.5 Interpretation of results 882.5.6 Landscape risk assessment: example of livestock density 892.6 Matching environmental risk zones with farm types 912.6.1 Soil erosion 912.6.2 Eutrophication 912.6.3 Pesticide 912.6.4 Relating biodiversity risk zones to farm practices 922.6.5 Landscapes 922.7 Integrative assessment soil erosion and pesticide use 95
3 Risk assessment at local to regional scales 97
3.1 Introduction 973.2 General description of the Region of Murcia, Spain 993.2.1 Introduction 993.3 Soil erosion in the Region of Murcia, Spain 1043.3.1 The case study area 1043.3.2 Data and model used in the case study area 1043.3.3 Validation and comparison of the European approach 1043.3.4 Tolerable soil loss 1063.4 Pesticide use in the Region of Murcia, Spain 1083.4.1 Database 1083.4.2 Method 1083.4.3 Results and discussion 1093.5 Eutrophication in Murcia 1143.5.1 Database 1143.5.2 Method 1143.5.3 Results and discussion 1143.6 Risks to biodiversity in Murcia 1163.6.1 Introduction 1163.6.2 Method and results 1163.6.3 Interpretation of results 1193.7 Landscape risks in Murcia 1213.7.1 The backgrounds of changes in landscape diversity in the southeast of Spain 121

3.7.2 Landscape types in Murcia 1213.7.3 Landscape diversity and vulnerability 1223.8 Soil erosion risks in the Ybbs river basin, Austria and the Zala river basin, Hungary 1263.8.1 The case study areas 1263.8.2 Data and models used in the case study areas 1263.8.3 Validation and comparison of the European approach 1283.8.4 Validation by others 1313.9 Parcel-level pesticide risks in Lamspringe – county Hildesheim, Germany 1323.9.1 Background 1323.9.2 Characterization of investigation site 1323.9.3 Data and method 1323.9.4 Results and discussion 1323.9.5 Summarizing conclusions 1363.10 Eutrophication risks and biodiversity in the Baltic Sea 1373.10.1 The characteristics of the Baltic Sea and eutrophication 1373.10.2 Loading of nitrogen and phosphorus as a result of agricultural practices 1373.10.3 Impacts on biodiversity caused by eutrophication 1413.10.4 Current environmental risk assessment 1453.10.5 Conclusions 1473.11 Landscape risks in the Green Heart, the Netherlands 1493.11.1 The Green Heart as part of the Randstad 1493.11.2 Agriculture 1503.11.3 National validation of landscape Shannon diversity 1513.11.4 National validation of landscape vulnerability taking into account intrinsic diversity 1543.11.5 Landscape diversity changes over time 1543.11.6 Interpretation of the results 154
4 Review of methodology, data and results 157
4.1 Soil erosion 1574.2 Pesticides 1604.3 Eutrophication 1614.4 Biodiversity 1614.5 Landscape 163
5 Conclusions 165
6 Recommendations 169
Bibliography 172 Project participants 178 Acronyms 180 Annexes 182 Thank you 183 Colophon 184
PrefaceEurope’s agricultural policy and its relation to our natural
environment has been the subject of a lot of debate over
recent years. It has long been my conviction that
environmental concerns should be integrated more seriously
into agricultural policies. I was therefore encouraged by the
mid-term reform of the European Union’s Common
Agricultural Policy (CAP) in 2003, although arguably more
could have been achieved. Already before that reform I
stressed in my speech to Europe’s environment ministers
gathering in Kyiv for the fifth ‘Environment for Europe’
conference in May 2003 that in my view the CAP should be
developed into an European Union’s Rural Policy as soon as
possible, in which the ‘production’ of nature, biodiversity and
landscape values should be regarded as important elements
for rural development, including the economic viability of
regions.
It is in this perspective that I am delighted with the
publication of this report on ‘Environmental risks from
agriculture in Europe’. It is a key output of three years of
investigations by an experienced and interdisciplinary team
of 11 European scientists under coordination by ECNC–
European Centre for Nature Conservation in the project
abbreviated EnRisk – Environmental Risk Assessment for
European Agriculture.
This team has made an attempt to use agri-environmental
indicators and data sets in Europe for the identification of
areas that are at particularly high risk for negative impacts
from selected agricultural practices on water, soil,
biodiversity and landscapes. As the report concludes, this
has not been an easy task for various reasons of a technical
nature. However, the report clearly outlines a methodology
that can, if more accurate and up-to-date data become
available, support policymakers in identifying priority areas
for taking environmental measures.
Amongst others, the study recommends that more effort be
put into collecting and processing environmental data in
harmonized ways. This is particularly applicable to the topics
of biodiversity and landscapes. The report also recommends
that, together with the Organisation for Economic Co-
operation and Development, the European Commission and
others, the risk indicators that have been developed by the
team should be further refined.
This report is a tool to convey the message that emerges
from the research to a broad audience. I encourage both the
science and policy community to study the recommendations
of the team and to integrate them into their developments.
The recommendations may well be incorporated in future
research studies on relations between agriculture and
environment as well as in rural policy development at both
regional and international levels. You can count on ECNC to
help to make the recommendations a reality.
I should like to take this opportunity to thank the EnRisk
team at ECNC and its project partners for the work and
creativity they have put into achieving this output. I should
also like to thank the EnRisk steering group and others who
have contributed valuable and constructive criticism during
the course of this project. And finally, a word of thanks goes
to the European Commission (Directorate-General Research)
for providing the financial opportunity to undertake this
research. I hope you will find the result interesting and
constructive reading.
Sir Brian UnwinPresident ECNC
8
9
Executive summaryEurope’s environment, biological diversity and landscape
have to a large extent been shaped by agricultural land use.
Today agricultural practices have both positive and negative
impacts on the environment and its components. Because of
the diversity in environmental, biological and geomorphological
factors in Europe the impacts from agriculture vary by
region. European policies, most notably the European Union’s
Common Agricultural Policy (CAP), have been developed and
implemented to ensure that agricultural harm to the
environment is reduced or compensated. In order for the
policies and measures to be most effective it is important to
customize and prioritize their implementation to the
characteristics of individual regions of Europe. For this
reason it is important to know which areas of Europe are
more sensitive to environmental impacts from agriculture
than others. In other words, where are the areas of highest
risk for environmental damage from agriculture?
The current report contains the final product of a project that
has aimed to answer this question: EnRisk, or ‘Environmental
Risk Assessment for European Agriculture’. During a period
of three years a team of 11 research institutes from six
European countries, financed by the European Commission,
has worked towards the following objectives:
• to investigate the role of risk assessment as a decision
support tool;
• to test existing data and indicators;
• to identify and map environmental risk zones at European
and local level; and
• to formulate policy and methodology recommendations.
Building on the previous ELISA project (Environmental
Indicators for Sustainable Agriculture) the project team has
concentrated on five environmental themes: soil erosion,
pesticide use, nutrient enrichment, biodiversity loss, and
landscape change. It has done so in an integrated way, by
looking at the interactions between these themes as well as
by relating the findings to farm practices. The research was
carried out from two geographical perspectives: the pan-
European scale and local or regional case studies.
The EnRisk project has been innovative in its approach
because:
• agri-environmental indicators were tested for the concrete
purpose of environmental risk assessment;
• integrated environmental risk assessment was carried out,
linking five themes and their interrelations and the cause-
effect relations with agricultural land use;
• the focus of 'conventional' risk assessment is on
ecotoxicology and human health, whereas EnRisk looked at
ecological risk assessment by assessing risk to ecosystems
and their components;
• risks from agriculture to biodiversity and landscapes were
quantified and risk indicators developed.
For both the European assessment and the case studies the
best available data have been used. No data have been
specifically collected for the purpose of the study. Although
this forms a limitation to what could be possible, it gives the
opportunity to really test in how far these databases, such as
the Corine Land Cover database (CLC), can be used for the
purpose of environmental risk assessment. The challenge by
using this approach has been to find a way to combine data
that vary in quality, scale, resolution, geographical coverage,
structure, or actuality into a common output.
Also the agri-environmental indicators that have initially been
selected for the assessments were developed elsewhere.
Specifically the indicators that were proposed by the ELISA
project, as well as those listed by the European Union (EU)
(and implemented in the IRENA project (Indicator Reporting
on the Integration of Environmental Concerns into Agriculture
Policy)) and the Organisation for Economic Co-operation and
Development (OECD) formed a starting point for the
environmental themes covered by EnRisk. Additional risk
indicators were developed for some of the individual themes.
For integrating the EnRisk themes the following rationale
has been guiding the research. First, indicators were
selected to quantify and map out the state of the receptor
themes (e.g. soil type, nitrogen load in rivers, breeding bird
richness or landscape diversity). Second, indicators to
quantify pressures from agriculture were identified (e.g.
livestock density, pesticide usage, agricultural land cover
type). In a third step threshold levels have been assigned to
relate the potential pressures to actual risks to the receptor
themes (e.g. tolerable soil loss, pesticide impact scores for
arable breeding birds). The combination of the threshold
levels and the pressure values was then used in a fourth step
to map out environmental risk zones.
Once the risk zones for components of the five environmental
themes were located on a map farm level statistics were
used to explain the causal relation between farm practices
and the risks identified. The findings at the European level
were refined, validated and tested by case studies for each of
the themes. One case study, in the Spanish Region of Murcia,

looked at all environmental themes, whereas other case
studies concentrated on specific environmental risks (e.g.
the impact from nutrient enrichment in the Baltic Sea area
on marine biodiversity through eutrophication).
The environmental risk assessments carried out in the
EnRisk project led to the following conclusions:• a methodology using data of different resolution and
accuracy was developed to assess risks posed by certain
agricultural activities on environmental components;
• with the current data quality at European level,
environmental risk assessment on a European scale allows
location of risk zones at a very coarse resolution and with a
high level of uncertainty. The approach developed in this
project will allow for proper continent-wide risk assessment
in the future, when more accurate and up-to-date
environmental data become available. This is especially true
for the topics of eutrophication, biodiversity and landscape;
• interpretation of risk maps requires forecasting of
scenarios in agricultural land use changes. To date, such
forecast information is unavailable to make proper
judgements;
• the agri-environmental indicators that have been
developed in the ELISA project, at the level of EU or by OECD,
have proven to be a good starting point for risk assessment;
• the Corine land cover classes have been identified on the
basis of satellite remote sensing and are therefore non-
exclusive and not always accurate. The recent results of the
CLC 2000 project may increase the quality of these data;
• the species distribution data from the European biological
atlases using a 50x50 km grid are too coarse for a European-
wide analysis. Although general assessments can be made,
the data resolution and reliability do not allow for
interpretation of risk regions with the precision required. For
this purpose, it would be a high priority to survey European
biodiversity at finer resolution.
The above conclusions lead to the following
recommendations:
With regard to agri-environmental measures:
• the indicative maps of environmental risk areas in Europe
should be interpreted as a confirmation of the severity of
agricultural impacts on the environment across large parts
of Europe;
• areas with high sensitivity and currently under low to
medium pressures (mostly in new EU Member States) should
be treated with high priority for conservation and for
implementation of agri-environmental measures;
• areas with high pressures are highlighted on a European
scale to alert to prime activities for mitigation:
• for soil erosion: southern and central Spain, parts of
Italy and Greece;
• for nutrient enrichment: the Netherlands, northwest
Germany and northern France;
• for pesticides: the Netherlands, Flanders (Belgium),
northwest Germany and south Germany;
• for biodiversity and landscapes: most new EU Member
States and Eastern European countries, northern
Germany, Greece and southern Spain;
• therefore, the increased concern for environmental
matters in agricultural policy (CAP reform, Biodiversity
Action Plan for agriculture, reinforced EU Rural Development
policy) should be reflected through an undelayed
implementation of the proposed actions;
• the implementation of agri-environmental measures
should take into account the regional differentiation and the
differences between environmental themes, as demonstrated
in this report, as a basis for achieving improvements;
• an integrated approach in treating risks from agricultural
practices on the environment is adopted. Such an approach
could limit the risks of knock-on effects from different
environmental themes;
• sustainability impact assessments should be undertaken
as a standard practice for planned changes in agricultural
land use at larger scales;
• livestock density is considered to be an indicator for the
broader process of intensification of agriculture, rather than
only for nutrient pollution.
With regard to data:
• increased effort should be put in improving and updating
European agricultural and environmental data sets with
regards to their accuracy, scientific rigorousness,
geographical coverage, accessibility, format and
comparability;
• the indicators that have been developed by EnRisk should
be used in related projects on agri-environmental
relationships, such as the IRENA project and in the
implementation of agri-environmental indicators by OECD
countries;
• an increased sampling effort to acquire representative
biological data at sufficiently detailed taxonomic and spatial
resolution – including for highly indicative taxa currently not
10

11
well represented in regular data collection, such as
butterflies and plants – should be supported and advocated
by the responsible authorities;
• international organizations responsible for European data
collection and processing should continue and increase their
cooperation in order to fully integrate biodiversity and
environmental data at relevant scales;
• the EnRisk methodology should be further refined with
new data sets, most notably land cover change data deriving
from the CLC 2000, in order to develop environmental risk
indicators that can be applied at European as well as
regional level;
• research efforts towards assessing risks to biodiversity
should be increased. In this respect it is recommended that
the Integrated Project ALARM (Assessing LArge-scale
environmental Risks with tested Methods, funded by the EU’s
Sixth Framework Programme) (UFZ, 2004) builds on the
findings from EnRisk.
With regard to farming practices and their relation to
environmental risks:
• for biodiversity conservation, priority should be given to
areas that are identified as highly sensitive because of the
relatively low agricultural inputs and high value for
biodiversity;
• soil protection measures to prevent soil loss by water
erosion are in the first place required for areas with
perennial crops. Examples for such measures are terracing,
mulching or green cover between the rows (where sufficient
water is available);
• semi-natural grasslands are treated with high priority
because of the multiple pressures from agriculture
(including practices such as conversion into crop, reseeding,
drainage, abandonment, high fertilization, and high stocking
densities) and their high value for biodiversity and landscape
protection.

Introduction
Assessing the risks from agriculture to the environment is a
relatively new field of research. Traditionally environmental
risk assessment focuses on the effects of a deteriorated or
polluted environment on human health. With the increasing
awareness of the environmental impacts of agricultural
practices and the need to take policy measures to counteract
them, the need for risk assessments has grown. The project
that led to this publication is a contribution to risk
assessment that focuses on the risks for the environment,
looked at from a European perspective.
The current report presents the outcome of the project
‘Environmental Risk Assessment for European Agriculture’
or ‘EnRisk’. The European Union’s Fifth Framework
Programme for Research, Technological Development and
Demonstration Activities funds the EnRisk project as a
follow-up to the ELISA project (Environmental Indicators for
Sustainable Agriculture, Fourth Framework Programme,
FAIR-CT97-3448; Wascher, 2000a), both of which have been
coordinated by ECNC-European Centre for Nature
Conservation.
The aim of the EnRisk project is to provide scientifically
sound support to national and international agri-
environmental policy by:
• investigating the role of risk assessment for five
environmental themes (soil erosion, nutrient enrichment,
pesticide use, biodiversity, landscape) as a tool for policy
implementation;
• reviewing and interpreting existing environmental and
socio-economic information and its effectiveness for policy
objectives;
• identifying environmentally sensitive areas and risk zones
in Europe;
• testing the reliability of European information for
assessing sustainable agricultural land use by comparing it
with regional case studies;
• providing recommendations for future assessments and
policy implementation.
Throughout the project duration it has become clear, as is
demonstrated in this report, that the aim to provide policy
recommendations with the intention to influence agricultural
policy to the benefit of the environment was somewhat over
ambitious. The reason for this is that the scientific state of
affairs for environmental risk assessment at a large scale
requires much scientific and technical development. Instead
the focus was on technical and methodological issues and
the feasibility of environmental risk assessment at the
European scale.
Therefore, the questions that the EnRisk project aims to
answer are of a more methodological nature, such as:
• Can environmental risk assessment (ERA) be used as a
decision support tool for agricultural policy at the European
scale?
• Are the current sets of agri-environmental indicators
(AEIs) and agricultural and environmental data suitable for
the purpose of European ERA and to identify environmental
risk zones?
• What needs to be done to fill gaps in indicators, data,
knowledge or expertise, if needed?
• What policy decision can be taken on the basis of European
ERA for agriculture?
It should be clear from the outset that this project does not
geographically delimit specific areas in Europe that are of
higher risk to certain agricultural pressures. Rather, it gives
an indication of broad regions with potentially higher risks.
12

13
More importantly, the project has devised a methodology that
can be used for more specific risk assessments if data
availability and quality is improved.
Chapter 1 of this publication provides a general presentation
of the background to the project: the relationship between
agriculture and the environment, agri-environmental
policies, agri-environmental indicators and the method used
in the EnRisk project. Chapter 2 contains the results of the
European phase of the project, in which environmental risks
have been assessed at a continental scale. For each of the
five environmental themes a description is given of the used
data sets, the method, results and interpretation. The
chapter ends with a section that integrates the separate
environmental themes while relating the identified risks to
farm practices. Chapter 3 summarizes the results from case
studies that were undertaken to test the methodology, to
refine findings or to illustrate other issues. The findings of
the European and case study research are reviewed in
Chapter 4, which leads to the study’s conclusions in Chapter
5 and recommendations in Chapter 6.
14 Environmental risk assessment and agriculture / Agriculture and the environment

15
Environmental risk assessment and agriculture
1.1 Agriculture and the environmentSince its origin in the Near East some 10,000 years ago
agriculture has had impacts on the environment. These
impacts resulted from the conversion of what was before
‘wild’ land that was the result of purely natural ecological
processes into areas for cropping and raising livestock. This
conversion has always involved a number of human inputs,
ranging from cutting or burning of forest, the mechanical
ploughing of the land, the sowing of desired crops, input of
nutrients and – more recently – chemical products such as
artificial fertilizers and pesticides.
Until the Middle Ages the intensity and extent with which
agriculture was practised was at a relatively low level, due to
low human population size and therefore low demand and to
the state of development of agricultural practices. Since that
time, and especially since the 19th century, both agricultural
intensity and extent have rapidly increased worldwide.
Detailed overviews of the development of agriculture
throughout human history have been described elsewhere
(e.g. Nowicki, 1997).
It has been recognized that two opposite processes are
influencing the environmental impact of agriculture:
intensification and marginalization/abandonment (Baldock et
al., 1996). Agriculture can have both negative and positive
impacts on the environment (OECD, 1997; Delbaere, 2002).
1

On the positive side examples are mainly with the effect of
small-scale and low intensity farming practices on the
increased variation in habitat types and their associated
species diversity. This has led to local increase of biodiversity
value in many places in Europe. On the negative side, for
example, the high levels of pesticide input on large parcels
has led to surface and groundwater pollution, with
successive negative impacts on economy (e.g. high
purification costs), biodiversity and human health.
Whether or not an impact of a trend in agriculture
(intensification or extensification) has negative effects
depends on the baseline situation of a given (agro)-
ecosystem. For example, starting from a high nature value
farmland area that has developed through century-long low
intensity farming practices an increase in intensity of
fertilizer use or an increase of scale will most likely have
negative effects on biodiversity.
On the other hand, as indicated above, an area that has never
been farmed and that by nature has poor environmental
conditions (low nutrient levels, low water levels) may benefit
from some form of agricultural use which might lead to
reduced risk for soil erosion, desertification or to higher local
biodiversity levels.
Figure 1 illustrates this baseline-dependent effect for the
impact of agricultural intensification on biodiversity.
With over half of Europe’s land area being used for
agriculture, this is clearly the most dominant and impacting
land use type. The European Environment Agency (EEA, 2000)
states that ‘Agriculture remains a major source of pressure
on the environment … becoming even more intensive and
specialized.’ Areas of general concern include:
• emissions of pollutants, particularly greenhouse gases,
and fertilizer run-off into water systems;
• lower population levels of both rare and once-common
wildlife species, particularly birds as indicator species;
• loss of traditional landscapes due either to simplification
(e.g. removal of field boundaries, more monoculture) or to
abandonment (desertification) or degradation (unused
terracing, farm buildings, etc.).
Policies have been developed at national and international
levels (see next section) to regulate agriculture, including for
environmental benefits. However, with the diversity of
environmental conditions in Europe the environmental
impacts from agriculture are regionally different and require
a regional approach. The EnRisk project aims to provide a
tool for identifying those regions in Europe that are more
sensitive to agricultural pressures and that are at risk of
further environmental deterioration. This identification of
regional differences will help policymakers at the European
level set priorities for implementing agri-environmental
measures, focusing on those regions that are at highest
environmental risk.
Figure 1 General relationship between agricultural intensity and biodiversity value
Source: adapted from EEA, 2004a
Intensity of agriculture
Bio
dive
rsity
16 Environmental risk assessment and agriculture / Agriculture and the environment / Agri-environmental policies in Europe

1716 Environmental risk assessment and agriculture / Agriculture and the environment / Agri-environmental policies in Europe
1.2 Agri-environmental policies in EuropeSince 1992, with the MacSharry reform of the European Union
Common Agricultural Policy (CAP), environmental
considerations have increasingly been integrated into
agricultural policy throughout the European Union (EU). This
reform for the first time included environmental conditions
related to agricultural policies, clustered in the ‘accompanying
measures’. Especially the accompanying measures in Council
Regulation (EEC) 2078/92 on agri-environmental measures
were a turning point in EU agricultural policy. It had affected
20% of the EU’s agricultural area in 1999 (CEC, 1999a). The
1992 reform of the CAP reduced market and price support
measures, and a system of direct payments was introduced to
compensate farmers for the loss of income. Such a system
included payments on a per hectare basis for the production of
cereals, oilseed and protein crops, as well as for beef, sheep
and goats (on a per headage basis).
A second major reform round of the CAP was linked to the
EU’s Agenda 2000 discussions, which were agreed in March
1999 in Berlin. One of the main concerns driving the reform of
the CAP in this round was the forthcoming enlargement of the
EU with the then potentially 13 new Member States as well as
the forthcoming negotiations to liberalize agricultural trade.
Continuing the CAP in its form of 2001 with 28 Member States
would be extremely expensive (Lowe & Brouwer, 2000).
However, during these reform discussions stronger
integration of environmental concerns into agricultural policy
was also envisaged. This resulted amongst others in the shift
of aid for crop output to direct area payments and the
increases in headage support payments that benefited organic
producers. Cross-compliance environmental measures –
attaching environmental conditions to the receipt of
agricultural support payments – in Article 3 of the Common
Rules Regulation 1259/1999, as well as in the Rural
Development Regulation 1257/1999, are other major
environmental achievements of this reform. The latter is
called the ‘second pillar’ of agricultural policy, the first one
relating to market support measures. The types of measures
that may be taken under Article 3 of the Common Rules
Regulation are threefold:
• support in return for agri-environmental commitments;
• general mandatory requirements;
• specific environmental requirements constituting a
condition for direct payments (i.e. cross-compliance).
The mid-term review of the CAP (COM(2002) 394, CEC, 2002a),
as presented by Agriculture Commissioner Fischler in July
2002, contained the basis for a stronger environmental
component for agricultural policy. Multifunctionality of
agriculture (production of environmental, socio-cultural and
economic services other than food and fibre production) is
becoming a key issue in the reforms. External reasons for
such a reform included negotiations on a new agricultural
agreement within the World Trade Organization (WTO),
enlargement of the EU, agreements of Agenda 21 for a
sustainable development and the need to respond to the
Convention on Biological Diversity (CBD). Also, domestic
arguments became evident to reform agricultural policy,
including consumer pressure reducing confidence in the
safety of meat products, negative impacts of agricultural
policy on environment and animal welfare, and the
consideration of ecological and social benefits of agriculture.
Following the reforms from June 2003, Member States shall
define, either at national or regional level, minimum
requirements for good agricultural and environmental
practices. A framework for good agricultural and
environmental conditions needs to be implemented,
considering standards on soil erosion, soil organic matter, soil
structure and to ensure a minimum level of maintenance and
avoid the deterioration of habitats (e.g. protection of
permanent pasture, retention of landscape features and
avoiding the encroachment of unwanted vegetation on
agricultural land). The CAP reform is implemented by way of
three Commission Regulations: (EC) 796/2004 on cross-
compliance, controls and modulation; (EC) 795/2004 on Single
Farm Payment; and (EC) 2237/2003 on direct support
schemes.
In the following sections more specific policies on the topics
that are dealt with within EnRisk are described. Before doing
so, it is worth mentioning here that the EU also has a Directive
that specifically deals with environmental risk assessments
(93/67/EEC). However, this Risk Assessment Directive deals
with risks from specific substances to man and the
environment (as notified in Council Directive 67/548/EEC) and
has therefore a different focus than the EnRisk project.
1.2.1 Policy focused on nutrient enrichmentNutrient enrichment by nitrates and phosphorus is a high
priority in Europe. Contamination of both surface and
groundwater and soils is a serious problem in parts of
Europe. Standards for the collection, treatment and
discharge of urban wastewater and wastewater from some
industrial sectors are defined in the Urban Waste Water
Directive (91/271/EEC). Main sources of eutrophication are
farming, industry, sewage systems and urban wastewater
treatment plants. Limit values are specified in the Directive
with discharges to sensitive areas where nitrogen and/or phos-
phorus removal is prescribed. Major reductions need to be
achieved in case total phosphorus discharge from urban
wastewater treatment plants to sensitive areas exceeds 2 mg P
per litre (for agglomerations between 10,000 and 100,000 pop-
ulation equivalents (p.e.)) and 1 mg P per litre (at least 100,000
p.e.). Requirements are also formulated for discharge of nitro-
gen exceeding 10 mg N per litre (at least 100,000 p.e.) and 15
mg N per litre (10,000–100,000 p.e.). In Poland, Belgium (main-
ly in Flanders) and the United Kingdom, phosphorus levels
exceed 0.5 mg P per litre in more than half of the rivers. Also,
the highest nitrogen levels are found in rivers in the United
Kingdom, Denmark, Germany, the Netherlands, Belgium
(Flanders), Luxembourg, Poland, the Czech Republic and
Bulgaria (Kristensen & Hansen, 1994). Here, the concentration
exceeds 2.5 mg N per litre in more than half of the rivers.
In addition to the Waste Water Directive, the Nitrates
Directive (91/676/EEC) also adopts measures to reduce and
further prevent pollution of water for drinking water pur-
poses from agricultural sources. The Nitrates Directive re-
quires the application of Good Agricultural Practice to be
applied with mandatory measures to be adopted in regions
that are designated as nitrate vulnerable zones. More re-
cently, the Water Framework Directive (2000/60/EC) requires
the achievement of good chemical and ecological status in all
surface waters and good chemical status including trend
reversal in all groundwater. Agriculture is an important
source of pollution, which needs to be controlled to achieve
the objectives of the Nitrates Directive and the Water
Framework Directive.
1.2.2 Soil erosion policySoil protection has become a major concern for EU politics in
the last few years. In 2001 the European Commission
adopted a proposal ‘Environment 2010: Our Future, Our
Choice’ which, amongst other areas, emphasized the
importance of soil. In 2002 the Commission launched a soil
protection strategy placing soil on the same level with water
and air (CEC, 2002b). Erosion was seen as one of the major
problems across the EU in that context.
As a first step in the development of an encompassing EU
policy to protect soils against erosion and pollution, the
Commission has published a Communication (COM(2002)
179, CEC, 2002c) ‘Towards a Thematic Strategy for Soil
Protection’, which is the first occasion on which the
Commission has addressed soil protection for its own sake.
In that Communication soil erosion is identified as one of the
most severe soil degradation processes in Europe. In
response to the Communication the European Parliament
(2003) released a resolution on the Thematic Strategy for Soil
Protection, in which the Commission is called ‘to reverse the
alarming trend towards erosion’ and to ‘provide a methodical
assessment and mapping of European soil’, based on
principles that ‘should be designed to prevent soil erosion’.
The Commission is urged to draw up a scientific soil
catalogue, which should include erosion processes.
Recently a Technical Working Group on Erosion as one
component of a European thematic strategy for soil
protection was established and seven work packages were
created with the following objectives (Düwel, 2004):
• pressures and drivers causing erosion in Europe;
• nature and extent of soil erosion in Europe;
• impacts of soil erosion;
• measures and policy instruments to address soil erosion
(prevention and remediation);
• link with organic matter and contamination;
• desertification;
• monitoring soil erosion in Europe.
1.2.3 Policies on pesticide useTwo Directives affect directly the use of pesticides in Europe.
The placing on the market is regulated at the Community
level by the Council Directive 91/414/EEC, while the Council
Directive 79/117/EEC prohibits the placing on the market of
pesticides containing certain active substances. The
Directives on Maximum Residue Levels (MRLs) on food and
feed stuffs, the European Directive on Drinking Water
(80/778/EEC, amended by Directive 98/83/EC) and the Water
Framework Directive (2000/60/EC) also aim at risk preven-
tion and risk reduction, but are placed more at the end-of-life
stage of pesticides.
In 2002 the Commission started a communication process to
the Council, the European Parliament and the Economic and
Social Committee: ‘Towards a Thematic Strategy on the
Sustainable Use of Pesticides’ (COM (2002) 349, CEC, 2002d).
The main objectives of the Thematic Strategy as defined by
the Sixth Community Environment Action Programme are:
• to minimize the hazards and risks to health and environ-
ment from the use of pesticides;
• to improve controls on the use and distribution of pesticides;
18 Environmental risk assessment and agriculture / Agri-environmental policies in Europe

1918 Environmental risk assessment and agriculture / Agri-environmental policies in Europe
• to reduce the levels of harmful active substances including
through substituting the most dangerous with safer,
including non-chemical, alternatives;
• to encourage the use of low input or pesticide free cultiva-
tion among others through raising users’ awareness, promot-
ing the use of codes of good practices, and promoting consid-
eration of the possible application of financial instruments;
• to establish a transparent system for reporting and
monitoring progress made in fulfilling the objectives of the
strategy including the development of suitable indicators.
1.2.4 Policies on agriculture and biodiversityWithin the CAP it is primarily the second pillar that allows
Member States to implement measures to reduce the
impacts of agriculture on biodiversity. Of these measures
two are of specific importance to high nature value (HNV)
farmland (EEA, 2004a):
• agri-environment schemes as part of the revised rural
development regulation (1783/2003, replacing 1257/1999)
allow for support to farmers for environmentally favourable
measures;
• less favoured area payments to compensate farmers for
social or environmental constraints of the area they work in.
When applied properly they may provide an effective way to
prevent abandonment of (HNV) farmland.
A policy plan that has been designed specifically for the
integration of biodiversity concerns within agriculture is the
Biodiversity Action Plan (BAP) for Agriculture (CEC, 2001a) as
part of the European Community Biodiversity Strategy (ECBS;
CEC, 1998). This Action Plan defines specific activities to
achieve the objectives for agriculture as defined in the ECBS.
The Strategy is the EU’s response to the global CBD.
The basic principles for the BAP for agriculture have been
formulated in the Commission’s document ‘Directions to-
wards sustainable agriculture’ (CEC, 1999b). While giving a
clear indication of what is at stake in the relation between
agriculture and biodiversity, this document formulated mea-
sures that may benefit biodiversity. The most important ones
are included in the rural development measures (e.g. pre-
serving the natural heritage to increase tourist potential of
rural areas), which include the agri-environment measures
(e.g. set-aside) and the compensatory allowances in less
favoured areas (mentioned above).
Two EU Directives that are of most importance to biodiversity
conservation are the Birds (79/409/EEC) and Habitats (92/43/
EEC) Directives. Together they include the obligation for
countries to designate areas as part of the Natura 2000 net-
work of protected areas. The Habitats Directive lists 198 hab-
itat types of Community interest in its Annex 1, of which 28
depend on extensive agricultural management (EEA, 2004a).
At the pan-European level the Pan-European Biological and
Landscape Diversity Strategy (PEBLDS; Council of Europe et
al., 1996) provides the most important policy framework, in-
cluding for the relation between agriculture and biodiversity.
Within the remit of PEBLDS the Kyiv Resolution on
Biodiversity, adopted at the fifth ministerial conference
‘Environment for Europe’ in May 2003 (ECE/CEP/108), in-
cludes a target on agriculture and biodiversity which says:
‘By 2006, the identification, using agreed common
criteria, of all high nature value areas in agricultural
ecosystems in the pan-European region will be
complete. By 2008, a substantial proportion of these
areas will be under biodiversity-sensitive management
by using appropriate mechanisms such as rural
development instruments, agri-environmental
programmes and organic agriculture, to inter alia
support their economic and ecological viability.
‘By 2008, financial subsidy and incentive schemes for
agriculture in the pan-European region will take the
conservation and sustainable use of biodiversity in
consideration.’
This target derives from recommendations that were formu-
lated at the ‘High-level pan-European conference on agricul-
ture and biodiversity’ that was organized by the Council of
Europe with the United Nations Environment Programme
(UNEP) and the French Government in Paris in June 2002.
Amongst others the participants to this conference recom-
mended the further identification of HNV areas in agricul-
tural ecosystems in order to apply appropriate management
practices for the conservation of agro-biodiversity.
A draft action plan (STRA-CO (2004) 3b) to achieve the target
mentioned above was approved by the Bureau of the PEBLDS
Council in May 2004.
Finally, at the global level a policy focusing on agriculture
and biodiversity is embedded in the activities of the CBD. A
programme of work on agricultural biological diversity is
being implemented. However, the focus of this work pro-
gramme is on genetic resources for food and agriculture,
which have not been covered by the EnRisk project.

1.2.5 European landscape policiesThe main focus of landscape conservation in Europe has
traditionally been oriented towards scenic beauty, natural
and cultural heritage, traditional land management,
historical features and recreational functions. In light of the
growing responsibilities of European institutions in the field
of sustainable development and human welfare, landscapes
receive increasing policy and research attention for offering
integrative concepts as well as operational tools for bridging
the gap between environmental and socio-economic
objectives (Wascher, 2000b). As a consequence, traditional
conservation approaches such as the UNESCO Cultural
Landscapes initiative and the European Landscape
Convention (Council of Europe, 2000) co-exist with integrated
policies such as in agriculture (Agenda 2000) and in spatial
planning (European Spatial Development Perspective
(ESDP)).
In 1992 the Convention Concerning the Protection of the
World Cultural and Natural Heritage (World Heritage
Convention, adopted by the General Conference of the United
Nations Educational, Scientific and Cultural Organization
(UNESCO) in 1972) became the first international legal
instrument to recognize and protect World Heritage Cultural
Landscapes. The inclusion of cultural landscapes has
significant consequences for:
• the recognition of intangible values and for the heritage of
local communities;
• the importance of protecting biological diversity by
maintaining cultural diversity;
• the management ensuring the conservation of cultural
properties or landscapes;
• the interpretation, presentation, and management of the
properties.
The European Landscape Convention is an initiative of the
Congress of Local and Regional Authorities of the Council of
Europe. This Convention (also ‘Florence Convention’) aims at
protection, management and planning of all landscapes, and
to raise awareness for the values of a living landscape. In fact
it stresses the right of the people to identify themselves with
‘their’ landscape, and the right of the landscape to be taken
care of. Although the Convention is a relatively weak policy
document in terms of legal obligations and power, it
represents a real concern with the threatened landscapes of
Europe and a substantial appeal to the Member States to
establish an active landscape policy.
Rural Development Plans within the framework of the EU
Agenda 2000 provide the basis for regional monitoring
schemes that take into account the carrying capacity of the
region – issues of high relevance for landscapes. The second
pillar includes a relatively small proportion of total CAP
funds, but the decoupling process has opened agricultural
policies to overall rural development and could facilitate
turning some of the natural handicaps of mountains and
other Less Favoured Areas (LFA) into advantages: for
instance, cultural heritage, landscape, high-quality products,
diversification (Nordregio, 2004). The dominant objective for
LFA policy is to maintain farm management in less-favoured
areas based on environmental principles and provision of
other functions beyond food production.
Agri-environmental measures remain mandatory and are
simplified. The budget allows only for expansion at the rate
of inflation to 2006. Agri-environmental measures have yet to
cover a large proportion of tradional and cultural landscapes,
especially in countries with a large share of marginal farming
systems. The new ‘Article 16’ of the Rural Development
Regulation, which allows compensation payments in Natura
2000 sites, for example, is of special interest for future
landscape management according to environmental
standards.
The impacts on landscape quality that have been associated
with agricultural intensification include (Stapleton et al., 2000):
• removal of field boundaries (which also includes loss of
habitats for flora and fauna);
• destruction of archaeological monuments; and
• detrimental impacts on the environment such as pollution
of river water, eutrophication of lakes, and significant
contributions to methane gas emissions.
Different priorities and concerns of the first wave of agri-
environment programmes have been identified at national
and sub-national level by the project ‘Implementation and
effectiveness of agri-environmental schemes established
under Regulation 2078/92’ (FAIR1 CT95-274; Schramek et al.,
1999). These comprise:
• a focus on nature and landscape protection and on
mechanisms for changing agricultural land management;
• the economic support of marginal agricultural activities
threatened by the abandonment of farming and
compensation for natural handicaps is an important part of
the programme in places such as southern France, parts of
Spain, Portugal and much of Greece;
• farm-based pollution is a concern in a number of countries
such as Germany and Denmark;
• agricultural modernization and structural reform has been
an important goal in southern European countries in particular.
20 Environmental risk assessment and agriculture / Agri-environmental policies in Europe / Agri-environmental indicators
2120 Environmental risk assessment and agriculture / Agri-environmental policies in Europe / Agri-environmental indicators
1.3 Agri-environmental indicators
There is increased awareness of the environmental impacts
from agriculture. Agri-environmental measures are being
introduced and the Cardiff process advocates the integration
of environmental concerns into sectoral policies. These
processes lead to a growing need for indicators that help
simplify and communicate the often complex relationships
between agricultural pressures and environmental impacts.
Indicators that are designed or used for this particular
relationship are called agri-environmental indicators,
abbreviated AEIs.
The development of AEIs in many cases is structured
according to the DPSIR framework (Driving Force – Pressure
– State – Impact – Response) as used by the EEA. This
framework is also adopted within the EnRisk project, as it
provides a useful way of relating causes to effects and
responses in a policy-relevant way.
Many initiatives are developing AEIs for specific purposes
(see e.g. Brouwer & Crabtree, 1999 and EEA, 2004b for an
overview), of which some of most relevance to EnRisk are
described below. The full indicator lists from these initiatives
are included in Table 1 to 4.
1.3.1 The ELISA projectThe research project ELISA (Environmental Indicators for
Sustainable Agriculture), funded by the EU’s Fourth
Framework Programme (FAIR-CT97-3448) and coordinated
by ECNC, proposed a list of state and pressure indicators
(Table 3 and in Section 1.5.4) for selected environmental
components: soil, water, biodiversity and landscape
(Wascher, 2000a). These indicators had been proposed on the
basis of an analysis of their relevance, reliability and
feasibility for specific topics. The ELISA project led to a
specific recommendation to develop and test agricultural risk
indicators to define zones of high risk for negative
environmental impacts. This recommendation led to the
development of the EnRisk project, which is a follow-up to
ELISA.
1.3.2 European Union and the IRENA projectWith the change in agricultural policy in the European Union
as described in Section 1.2 the EU also started developing a
set of AEIs. Of particular importance in this respect are the
two Commission communications that list a set of indicators
as well as the data needs to underpin them: ‘Indicators for
the Integration of Environmental Concerns into the Common
Agricultural Policy’ (COM(2000) 20 final; CEC, 2000) and
‘Statistical information needed for Indicators to monitor the
Integration of Environmental concerns into the Common
Agricultural Policy’ (COM(2001) 144 final; CEC, 2001a).
These indicators (Table 1) have been proposed for the
Commission to report on the integration of environmental
concerns into Community sectoral policies. A joint project
with EC services (Directorates-General Agriculture,
Environment, Eurostat (European Statistical Office), Joint
Research Centre (JRC) and EEA) has been set up to develop
and compile the indicators as defined in the Commission
communications, to provide related agri-environmental data
sets and to produce a first indicator report and assessment
(EEA, 2004c). This IRENA project (Indicator Reporting on the
integration of Environmental Concerns into Agricultural
Policy) is ended in December 2004.
An additional EC project in support of providing the statistical
information for the above-mentioned indicators is LUCAS
(Land Use/Cover Area Frame Statistical Survey). In a stepped
approach, this project focuses more on territorial
components and the use of spatial data sets, such as Corine
Land Cover (CLC) (EEA, 2001a; Galego, 2002).

Table 1 Agri-environmental indicators as identified by the European Commission COM(2001) 144 final for assessing
the integration of environmental concerns into the agricultural sector
DPSIR reference No Indicator
Responses Public policy 1 Area under agri-environment support
2 Good farming practice
3 Environmental targets
4 Nature protection
Market signals 5.1 Organic producer prices
5.2 Agricultural income of organic farmers
Technology and skills 6 Holders’ training levels
Attitudes 7 Organic farming
Driving forces Input use 8 Fertilizer consumption
9 Pesticide consumption
10 Water use
11 Energy use
Land use 12 Topological change
13 Cropping/livestock patterns
Management 14 Management practices
Trends 15 Intensification/extensification
16 Diversification
17 Marginalization
Pressures Pollution 18 Surface nutrient balance
19 CH4 emissions
20 Pesticide soil contamination
21 Water contamination
Resource depletion 22 Ground water abstraction/water stress
23 Soil erosion
24 Land cover change
25 Genetic diversity
Benefits 26 High nature value areas
27 Renewable energy sources
State Biodiversity 28 Species richness
Natural resources 29 Soil quality
30 Nitrates/pesticides in water
31 Ground water levels
Landscape 32 Land use matrix
Impact Habitats and biodiversity 33 Habitat and biodiversity
Natural resources 34.1 GHG emissions
34.2 Nitrate contamination
34.3 Water use
Landscape diversity 35 Agricultural and global diversity
Source: adapted from CEC, 2001b
22 Environmental risk assessment and agriculture / Agri-environmental indicators

23
Table 2 Complete list of OECD agri-environmental indicators
I. Agriculture in the broader economic, social and environmental context
1. Contextual information and indicators 2. Farm financial resources
Agricultural GDP
Agricultural output
Farm employment
Farmer age/gender distribution
Farmer education
Number of farms
Agricultural support
Land use
- Stock of agricultural land
- Change in agricultural land
- Agricultural land use
Farm income
Agri-environmental expenditure
- Public and private agri-environmental
expenditure
- Expenditure on agri-environmental
research
II. Farm management and the environment
1. Farm management
Whole farm management
- Environmental whole farm
management plans
- Organic farming
Nutrient management
- Nutrient management plans
- Soil tests
Pest management
- Use of non-chemical pest control
methods
- Use of integrated pest management
Soil and land management
- Soil cover
- Land management practices
Irrigation and water management
- Irrigation technology
III. Use of farm inputs and natural resources
1. Nutrient use 2. Pesticide use and risks 3. Water use
Nitrogen balance
Nitrogen efficiency
Pesticide use
Pesticide risk
Water use intensity
Water use efficiency
- Water use technical efficiency
- Water use economic efficiency
Water stress
IV. Environmental impacts of agriculture
1. Soil quality 3. Land conservation 4. Greenhouse gases
Risk of soil erosion by water
Risk of soil erosion by wind
2. Water quality
Water quality risk indicator
Water quality state indicator
5. Biodiversity 6. Wildlife habitats 7. Landscape
Genetic diversity
Species diversity
- Wild species
- Non-native species
Ecosystem diversity
Intensively farmed agricultural habitats
Semi-natural agricultural habitats
Uncultivated natural habitats
Habitat matrix
Structure of landscapes
- Environmental features and
land use patterns
- Man-made objects (cultural features)
Landscape management
Landscape costs and benefits
Source: adapted from OECD, 2001

1.3.3 Organisation for Economic Co-operation and DevelopmentThe Organisation for Economic Co-operation and
Development (OECD) has developed AEIs for its member
countries to measure the environmental performance of
agriculture. While focusing on policy analysis, the OECD
indicators are developed using the DSR framework (Driving
force – State – Response). Agri-environmental indicators for
environmental impacts of agriculture are developed and
produced for soil quality, water quality, land conservation,
greenhouse gases, biodiversity, wildlife habitats and
landscape (Table 2; OECD, 2001).
Within the process of developing AEIs the OECD has
conducted specific studies and consultations on indicators
for selected components, such as for biodiversity (OECD,
2003) and landscape (NIJOS, 2003).
1.4 Environmental risk assessmentERA is part of a wider process of environmental risk analysis.
Risk analysis is an approach including tools for identifying
and comparing environmental costs and benefits of decision
options (Cornell University, 2004). It includes two major
components: risk assessment and risk management with
stakeholder involvement being embedded in between and
throughout these stages.
Environmental risk assessment on the one hand is a
scientific process. It is a key tool to help judging where the
balance should be between environmental protection and
economic and technological development.
A general framework for ERA includes a number of key
steps, which are illustrated in Figure 2.
Risk management on the other hand is a policy process that
follows on from the results from risk assessment and that
requires judgement of importance and taking of priorities
and choices to prevent or reduce certain risks. The EnRisk
project considers the risk assessment steps, of which the
principles are applied to agricultural policy.
Traditionally ERA has a strong focus on risks related to
ecotoxicology and human health. Also ecological risk
assessment (EcoRA), although focusing on living organisms
in the variety of ecosystems, has concentrated on risks from
chemicals and Genetically Modified Organisms (GMOs)
(Fairman et al., 1998). This means that the type of risk
assessment that is undertaken in the current project is
different and has not been developed very well to date,
especially where it regards risks to biodiversity and
landscapes. An effort to address this gap is made by EnRisk.
For the current project environmental risk assessment is
defined as ‘the examination of risks resulting from
agricultural land use practices that threaten ecosystems,
wildlife and physical components of the landscape’. The
steps carried out as part of the EnRisk environmental risk
assessment are described in more detail in Section 1.5.
The steps that have been taken address a number of
questions that ensure that the outputs from an
environmental risk assessment help in decision-making
(adapted from Defra, 2000):
• What impacts from agriculture to the environment may
occur?
• How harmful are these impacts to the environment?
• How likely is it that these impacts will occur?
• How frequently and where will these impacts occur?
24 Environmental risk assessment and agriculture / Agri-environmental indicators / Environmental risk assessment

2524 Environmental risk assessment and agriculture / Agri-environmental indicators / Environmental risk assessment
• How much confidence can be placed in the results of the
risk assessment?
• What are the critical data gaps and can these gaps be
filled?
• Are further iterations to the risk assessment needed?
Given the geographical scope of EnRisk (Section 1.5.3) only
some of these questions will be answered. Unlike with a
particular development project on a certain site, it would be
over ambitious to aim at identifying how likely it is that
harmful impacts of agriculture as a whole to the environment
as a whole will occur at a certain frequency and location and
how much confidence one could place on these findings.
Instead, this project focuses on certain aspects of the
complex cause-effect relationships between agriculture and
the environment. For example, what are the likely impacts of
high pesticide use on bird species that are associated to
arable land? Or, where are the areas in Europe with the
highest risk for significant soil loss due to water erosion
caused by agriculture?
Figure 2 Framework of environmental risk assessment
Source: Defra, 2000
Tiered risk assessment
Problem formulation
Risk management
Collect data, iterate processes and monitor
Tier 3 Detailed quantitativerisk assessment*
Hazard identification
* Stages within each tier ofrisk assessment
Identification of consequences
Magnitude of consequences
Probability of consequences
Significance of the risk
Tier 1 Risk screening*
Options appraisal
Economics
Social issues
Technology
Management
Risk prioritisation
Tier 2 Generic quantitativerisk assessment*
1.5 Method applied in the EnRisk project1.5.1 EnRisk objectivesThe EnRisk project was designed as a follow-up to the ELISA
project (Section 1.3.1). In general terms it aims at
formulating science-based recommendations to ensure a
viable and sustainable agriculture that is economically
competitive on a global market.
More specifically the EnRisk objectives are to:
• investigate the role of risk assessment for five
environmental themes (soil erosion, nutrient enrichment,
pesticide use, biodiversity loss, landscape change) as a tool
for policy implementation;
• review and interpret existing environmental and socio-
economic information and its effectiveness for policy
objectives;
• identify environmentally sensitive areas and risk zones in
Europe;
• test the reliability of European information for assessing
sustainable agricultural land use by comparing it with
regional case studies;
• provide recommendations for future assessments and
policy implementation.
From the outset, EnRisk focuses on five environmental
themes: soil erosion, nutrient enrichment, pesticide use,
biodiversity and landscapes. This ensures the right focus to
consider cause-effect relationship between these themes,
with agriculture as the main driving force.
1.5.2 Scientific added valueThe EnRisk project adds value and innovation to science in the
following way:
• agri-environmental indicators that have been proposed and
developed to date are tested for the concrete purpose of
environmental risk assessment. This provides insight in their
suitability for this purpose;
• the type of integrated environmental risk assessment,
linking five themes and their interrelations and the cause-
effect relations with agricultural land use practices, that is
done by EnRisk has never been carried out before;
• the focus of 'conventional' risk assessment is on
ecotoxicology and human health, whereas EnRisk looks at
ecological risk assessment by assessing risk to ecosystems
and their components;
• assessing risks from agriculture to biodiversity and
landscapes has never been tried before in Europe and will need
innovative thinking when incorporating aspects of vulnerability,
probability of risk, and acceptable threshold levels.
1.5.3 Geographical scopeThe geographical region covered by the EnRisk project
consists of the 25 European Union (EU) Member States, the
three EU Accession Countries, Norway and Switzerland. For
practical reasons the Balkan countries and the part of Russia
southwest of Lithuania have been included where appropriate.
This brings the total number of countries covered to 34:
Austria, Belgium, Bosnia-Herzegovina, Bulgaria, Croatia,
Cyprus, Czech Republic, Denmark, Estonia, Finland, France,
Germany, Greece, Hungary, Ireland, Italy, Latvia, Lithuania,
Luxembourg, Malta, the Netherlands, Norway, Poland,
Portugal, Romania, Russia (Kaliningrad region), Serbia and
Montenegro, Slovakia, Slovenia, Spain, Sweden, Switzerland,
Turkey, and the United Kingdom. The geographical area
covered does not include overseas territories.
1.5.4 Common frameworkThe EnRisk project was designed in two phases: the first
phase considered environmental risk assessment at the
European scale, the second phase looked at local or regional
case studies.
For both phases of the project, the five environmental
themes covered by EnRisk focused on soil erosion, pesticide
use, nutrient enrichment, biodiversity and landscapes. The
method applied for each of these themes is described in the
following pages.
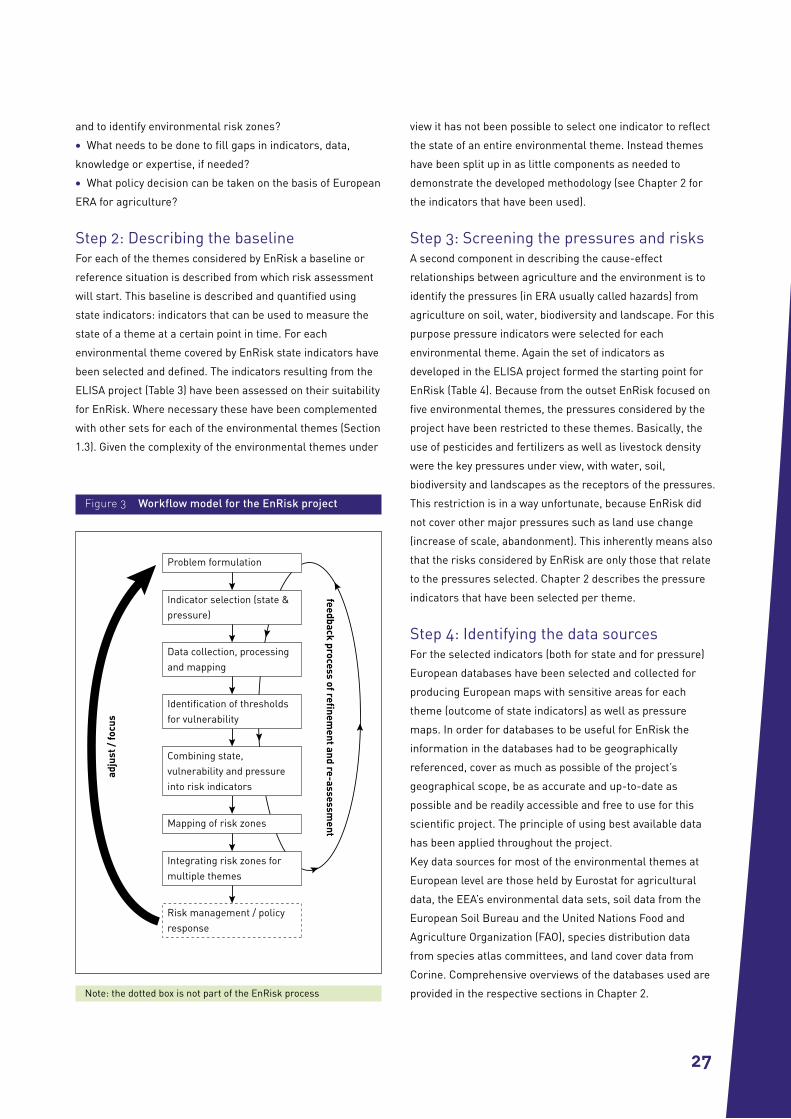
In general terms, the approach followed is visualized in
Figure 3.
Step 1: Formulating the problemThe overall problem under view in the EnRisk project is
formulated as follows: European agriculture affects water,
soil, biodiversity and landscapes, which can reduce its own
sustainability (economically, socially and environmentally).
There is a need for objective and geographically referenced
measures that policymakers can use to achieve more
sustainable agriculture.
Based on the objectives as listed in Section 1.5.1. the
following research questions depict the problem in more
specific terms:
• Can ERA be used as a decision support tool for agricultural
policy at the European scale?
• Are the current sets of AEIs and agricultural and
environmental data suitable for the purpose of European ERA
26 Environmental risk assessment and agriculture / Method applied in the EnRisk project
2726 Environmental risk assessment and agriculture / Method applied in the EnRisk project
and to identify environmental risk zones?
• What needs to be done to fill gaps in indicators, data,
knowledge or expertise, if needed?
• What policy decision can be taken on the basis of European
ERA for agriculture?
Step 2: Describing the baselineFor each of the themes considered by EnRisk a baseline or
reference situation is described from which risk assessment
will start. This baseline is described and quantified using
state indicators: indicators that can be used to measure the
state of a theme at a certain point in time. For each
environmental theme covered by EnRisk state indicators have
been selected and defined. The indicators resulting from the
ELISA project (Table 3) have been assessed on their suitability
for EnRisk. Where necessary these have been complemented
with other sets for each of the environmental themes (Section
1.3). Given the complexity of the environmental themes under
view it has not been possible to select one indicator to reflect
the state of an entire environmental theme. Instead themes
have been split up in as little components as needed to
demonstrate the developed methodology (see Chapter 2 for
the indicators that have been used).
Step 3: Screening the pressures and risksA second component in describing the cause-effect
relationships between agriculture and the environment is to
identify the pressures (in ERA usually called hazards) from
agriculture on soil, water, biodiversity and landscape. For this
purpose pressure indicators were selected for each
environmental theme. Again the set of indicators as
developed in the ELISA project formed the starting point for
EnRisk (Table 4). Because from the outset EnRisk focused on
five environmental themes, the pressures considered by the
project have been restricted to these themes. Basically, the
use of pesticides and fertilizers as well as livestock density
were the key pressures under view, with water, soil,
biodiversity and landscapes as the receptors of the pressures.
This restriction is in a way unfortunate, because EnRisk did
not cover other major pressures such as land use change
(increase of scale, abandonment). This inherently means also
that the risks considered by EnRisk are only those that relate
to the pressures selected. Chapter 2 describes the pressure
indicators that have been selected per theme.
Step 4: Identifying the data sourcesFor the selected indicators (both for state and for pressure)
European databases have been selected and collected for
producing European maps with sensitive areas for each
theme (outcome of state indicators) as well as pressure
maps. In order for databases to be useful for EnRisk the
information in the databases had to be geographically
referenced, cover as much as possible of the project’s
geographical scope, be as accurate and up-to-date as
possible and be readily accessible and free to use for this
scientific project. The principle of using best available data
has been applied throughout the project.
Key data sources for most of the environmental themes at
European level are those held by Eurostat for agricultural
data, the EEA’s environmental data sets, soil data from the
European Soil Bureau and the United Nations Food and
Agriculture Organization (FAO), species distribution data
from species atlas committees, and land cover data from
Corine. Comprehensive overviews of the databases used are
provided in the respective sections in Chapter 2.
Figure 3 Workflow model for the EnRisk project
Note: the dotted box is not part of the EnRisk process
Problem formulation
Indicator selection (state &pressure)
Mapping of risk zones
Integrating risk zones formultiple themes
Risk management / policyresponse
Data collection, processingand mapping
Identification of thresholdsfor vulnerability
Combining state,vulnerability and pressureinto risk indicators
adju
st /
focu
s
feedback process of refinement and re-assessm
ent

Table 3 Agri-environmental state indicators resulting from the ELISA project
Theme Indicator code Indicator
Soil S.1 Water erosion
S.2 Wind erosion
S.3 Soil compaction
S.4 Pesticides in soil
Water W.1 Nitrate in rivers
W.2 Nitrate in groundwater
W.3 Nitrate in drinking water
W.4 Pesticides in groundwater
W.5 Pesticides in rivers/surface waters
W.6 Groundwater level
Biodiversity B.1 Spatial complexity
B.2 Corridors and linkages between habitat types
B.3 Size/% of characteristic habitat types
B.4 Flagship species
B.5 Species richness
B.6 Species population trends
B.7 Genetic diversity in semi-natural agro-ecosystems
B.8 Genetic diversity in farm species
Landscape L.1 Biophysical adequateness of land use
L.2 Openness versus closedness
L.3 Adequateness of key cultural features
L.4 Land recognised for its scenic or scientific value
Source: Wascher, 2000a
For the European-scale assessment a 50x50 km grid
resolution was chosen for the output maps. This resolution
was chosen because of the limitation posed by the European
species distribution data, which are only available at this
resolution for Europe and which are the hardest to convert
into other resolutions. Given the coarse character of the
European assessment and the objective to identify in general
terms which broad regions of Europe can be regarded to be
of relatively higher risk to certain environmental impacts,
this resolution was regarded by the project team as the most
appropriate common denominator.
Step 5: Producing European sensitivity and pressure mapsEuropean-wide maps presenting the baseline for each theme
were produced on the basis of the selected state indicators in
step 2 and from the information held in the databases
selected in step 4. These reference maps form the basis to
refer pressures and risks to.
For each theme the baseline data were combined with
measures that express the sensitivity of the theme under
view to agricultural pressures. This required the
identification of threshold values per theme.
In addition European maps presenting the geographical
28 Environmental risk assessment and agriculture / Method applied in the EnRisk project

29
distribution and level of pressures from agriculture were
produced on the basis of the selected pressure indicators in
step 3 and their respective databases.
This step also considered how to integrate the maps
produced for the themes of soil erosion, pesticide use and
nutrient enrichment with those produced for biodiversity and
landscapes, the other two EnRisk themes. All three types of
maps (state, sensitivity and pressure) provide intermediary
products that are required to identify, by combining the
maps, the environmental risk zones per theme in Europe.
Step 6: Locating European environmental risk zonesBy overlaying the pressure maps on top of the sensitivity
maps for selected themes, a first indication is given of the
potential risk zones for the combination of the pressure and
environmental component under view. For each combination
a further refinement was carried out by adding data layers
such as the actual presence of certain land cover types or
further environmental conditions. This led to the presentation
of more actual risks per theme. Due to the lack of
prospective data on future pressure values and the lack of
historical trend data (e.g. land cover change) it has not been
possible to predict the areas of risks for future developments
in agriculture.
Step 7: Integrating environmental risk zones for multiple themesThe strength of the EnRisk project is in its integrated
approach. Risk maps for individual environmental themes
were combined into integrated risk maps. In this way, it has
been possible to identify those areas in Europe that are of
particularly high policy relevance because of their cumulated
environmental impacts from agriculture or because of the
combination of risks.
Step 8: Interpretation of resultsThe final step in the EnRisk approach is to identify why
certain areas stand out in terms of risk value. The risk maps
were compared with statistics on farm level practices so as
to find a causal relationship between what happens at the
farm and how this may impact on environmental risks. This
information then provides a basis for recommendations in
terms of agricultural practices or policies.
Table 4 Agri-environmental pressure indicators resulting from the ELISA project
Theme Indicator code Indicator
Land use intensity LU.1 Share of irrigated area
LU.2 Yield of cereals
LU.3 Share of farms with > 50% cereals
LU.4 Share of UAA in total area
LU.5 Livestock density
Nutrients N.1 N-discharge
N.2 Nitrate surplus
Pesticides P.1a Direct usage data per pesticide
P.1b Sales data per pesticide
P.1c Pesticides cost per crop
P.1d Estimated usage data per crop
P.2a+b Pesticide risk
Source: Wascher, 2000a