environmental science unit 2 ia
DESCRIPTION
Environmental Science Unit 2 IATRANSCRIPT

Site Visits
Entry Number: 01
Date: 13/10/11
Site (Location): Cipero River, San Fernando, Trinidad
Objectives:
1. To observe activities that may influence the river to conduct water sampling to determine
the presence of pollutants.
2. Collect and test a water sample from the river for various pollutants at the lower, middle
and upper region of the river.
3. Record the different types flora and fauna present along the river bank.
4. Make a direct link between man-made and natural activities that can influence the
quality of the river water which will make the use of the river easily determined.
Introduction/Background:
Water Resources Agency has indicated that the water levels in the Cipero River are
extremely high; therefore there is the strong possibility that this river will overflow its banks.
Evidently, this river has a terrible drainage system and highly leached soils. However there are a
lot of big trees along the river bank providing shade and a habitat for animals and also smaller
plants. Additionally, due to this large amount of shade provided, there is a myriad of various
species of animals. Nevertheless the Cipero River is known as one of the dirtiest river in
Trinidad.
1 BRANDON ATWELL – PRESENTATION COLLEGE SAN FERNANDO
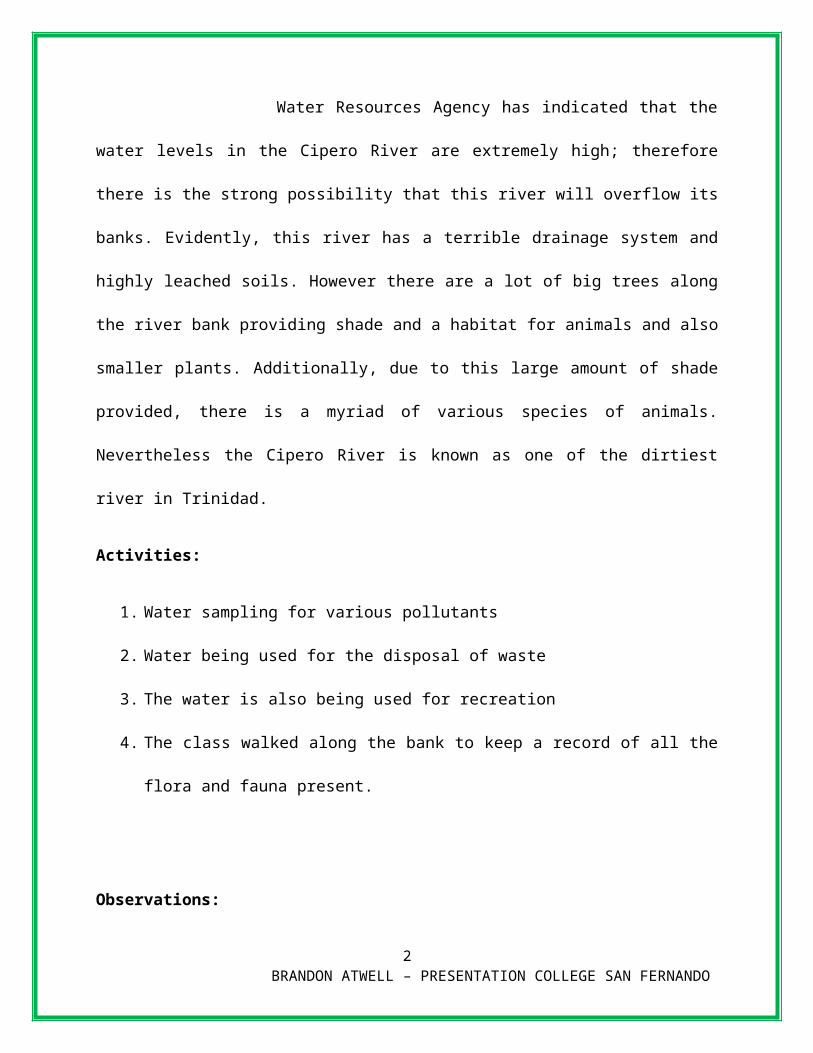
Activities:
1. Water sampling for various pollutants
2. Water being used for the disposal of waste
3. The water is also being used for recreation
4. The class walked along the bank to keep a record of all the flora and fauna present.
Observations:
Weather; It was a fact that during the visit to the Cipero River, San Fernando, Trinidad, there
was a very quick change with regard to the weather. The change in weather was as follows; rainy
to sunny, then back to heavier rainfall.
River/Vegetation; Evidently, the water is brown and relatively stagnant. The grass surrounding
the river was tall and there were also a large number of trees. Additionally, at some intervals the
bank of the river was paved. Subsequently, there were also a few businesses and garages in close
proximity to the river, therefore these were at least two reasons as to why the river is so polluted
because all solid and liquid waste from these locations eventually ends up in the river.
One example is the Gulf view industrial park. There were also pipelines and a few drains.
Surprisingly upon the visit to the Cipero River, the class was graced by the presence of a Possum
(Manicou).
Possible Pollutants;
1. Garbage disposal
2 BRANDON ATWELL – PRESENTATION COLLEGE SAN FERNANDO

2. Pollutants from fertilizers and pesticides that is present in the nearby drains.
Test Lower
Average
Middle
course
Average
Upper course
Average
Total
Average
International
Standard
pH 9 8.9 12.6 10.17 6.5 – 9.0
Conductivity(U.S) 210 241.8 600 350.6 Below 1500 - 1800
Temperature (◦C) 23.4 26.7 23.6 24.6 23 – 30
Salinity (ppm) 608 590 665.02 621 500
TDS (ppt) 1510 1364.8 1390 1421.6 Below 1000 - 1200
Dissolve Oxygen (ppm) 4.05 4.20 6.03 4.76 At 25◦C 8.3
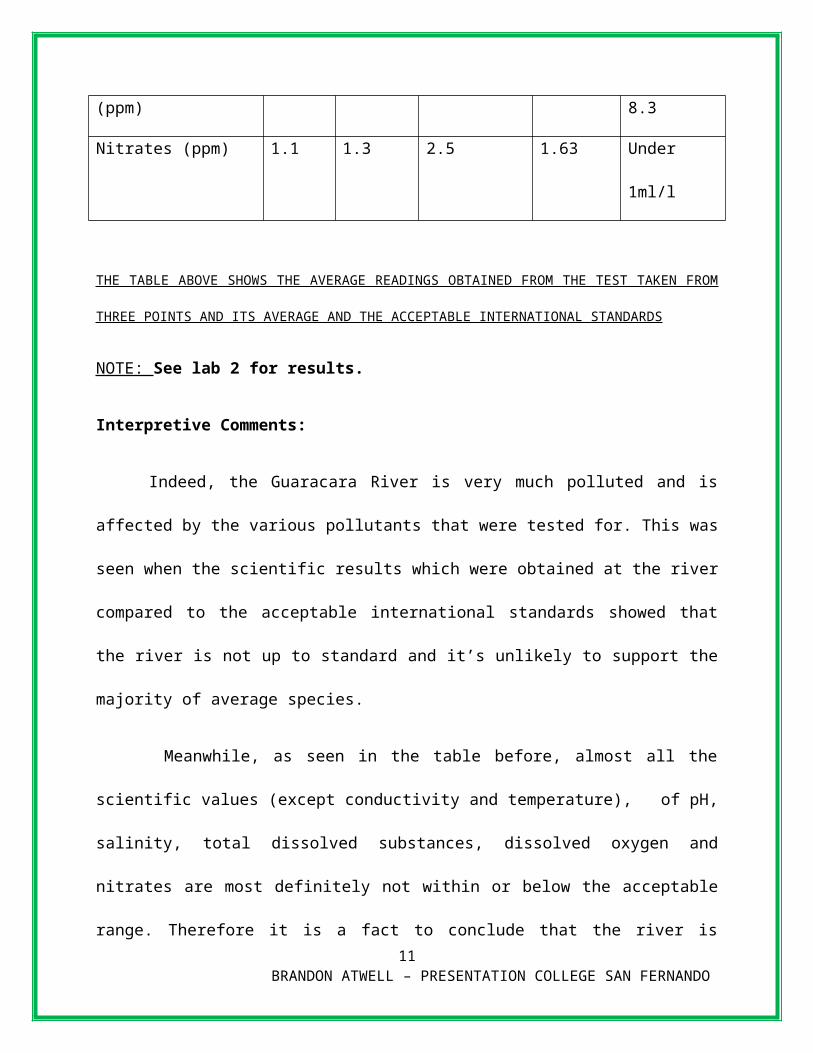
Nitrates (ppm) 3.09 4.90 2.9 3.63 Under 1ml/l
THE TABLE ABOVE SHOWS THE AVERAGE READINGS OBTAINED FROM THE TEST TAKEN FROM
THREE POINTS AND ITS AVERAGE AND THE ACCEPTABLE INTERNATIONAL STANDARDS
NOTE: See lab 1 for results.
Interpretive Comments:
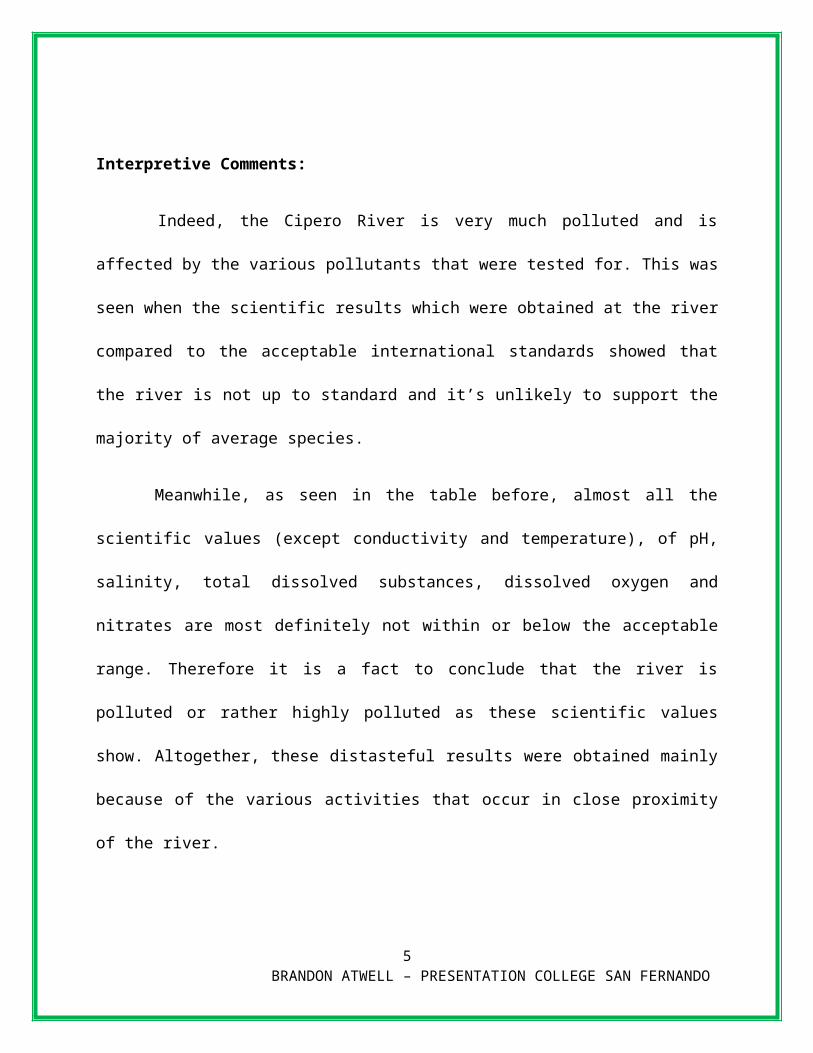
Indeed, the Cipero River is very much polluted and is affected by the various pollutants that
were tested for. This was seen when the scientific results which were obtained at the river
compared to the acceptable international standards showed that the river is not up to standard and
it’s unlikely to support the majority of average species.
3 BRANDON ATWELL – PRESENTATION COLLEGE SAN FERNANDO

Meanwhile, as seen in the table before, almost all the scientific values (except conductivity
and temperature), of pH, salinity, total dissolved substances, dissolved oxygen and nitrates are
most definitely not within or below the acceptable range. Therefore it is a fact to conclude that
the river is polluted or rather highly polluted as these scientific values show. Altogether, these
distasteful results were obtained mainly because of the various activities that occur in close
proximity of the river.
The pipelines that run directly into the river (point source) from the nearby businesses are one
major cause of the river being so polluted. It is a known fact that as the temperature of the water
increases, the dissolved oxygen content is decreased. Therefore when hot water is realized from
these pipelines, the dissolve oxygen content is being decreased. Secondly, there are also nitrates
being released into the river from the various garages that are near the river. The environmental
pathway is as follows; Garages Drains River.
Evidently, the area is developed with regard to Caribbean standards and has an acceptable
infrastructure. Therefore, the activities at the river are on a large scale and are polluting the river
significantly. Nevertheless, this is the main reason why the water from this river isn’t used
domestically.
Follow – up – Activities - Visit to Guaracara River, Pointe – a – Pierre, Trinidad.
4 BRANDON ATWELL – PRESENTATION COLLEGE SAN FERNANDO
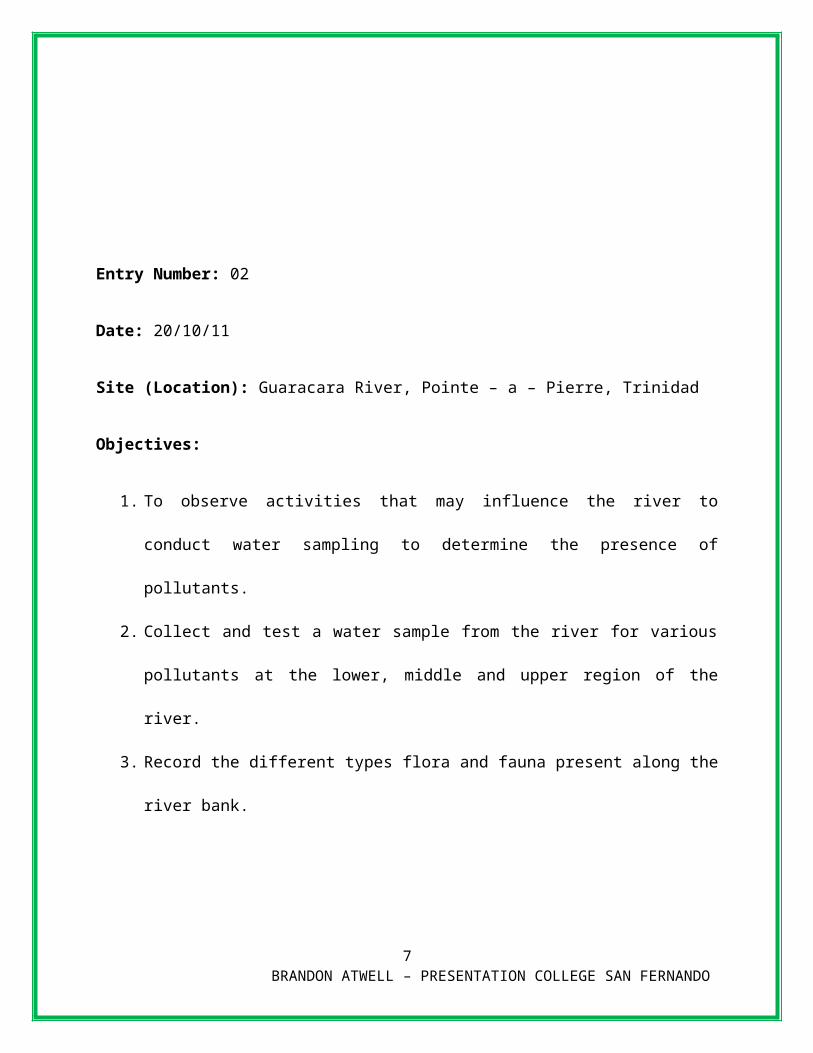
Entry Number: 02
Date: 20/10/11
Site (Location): Guaracara River, Pointe – a – Pierre, Trinidad
Objectives:
1. To observe activities that may influence the river to conduct water sampling to determine
the presence of pollutants.
2. Collect and test a water sample from the river for various pollutants at the lower, middle
and upper region of the river.
3. Record the different types flora and fauna present along the river bank.
4. Make a direct link between man-made and natural activities that can influence the
quality of the river water which will make the use of the river easily determined.
Introduction/Background:
The Guaracara River, located in south Trinidad, runs westward out of the Central Range and
drains into the Gulf of Paria. It forms the boundary between the city of San Fernando (to the
south) and the Couva-Tabaquite-Talparo Regional Corporation. In local terms it separates
Marabella (the northernmost portion of the city) from Pointe-à-Pierre. Its geographical
coordinates are 10° 22' 0" North, 61° 19' 0" West. The river is heavily polluted, both by non-
point agricultural and residential run-off from Marabella and the town of Gasparillo and from
5 BRANDON ATWELL – PRESENTATION COLLEGE SAN FERNANDO

industrial waste (primarily oily run-off) from the oil refinery at Pointe-a-Pierre owned by
Petrotrin (the State-owned oil company).
Activities:
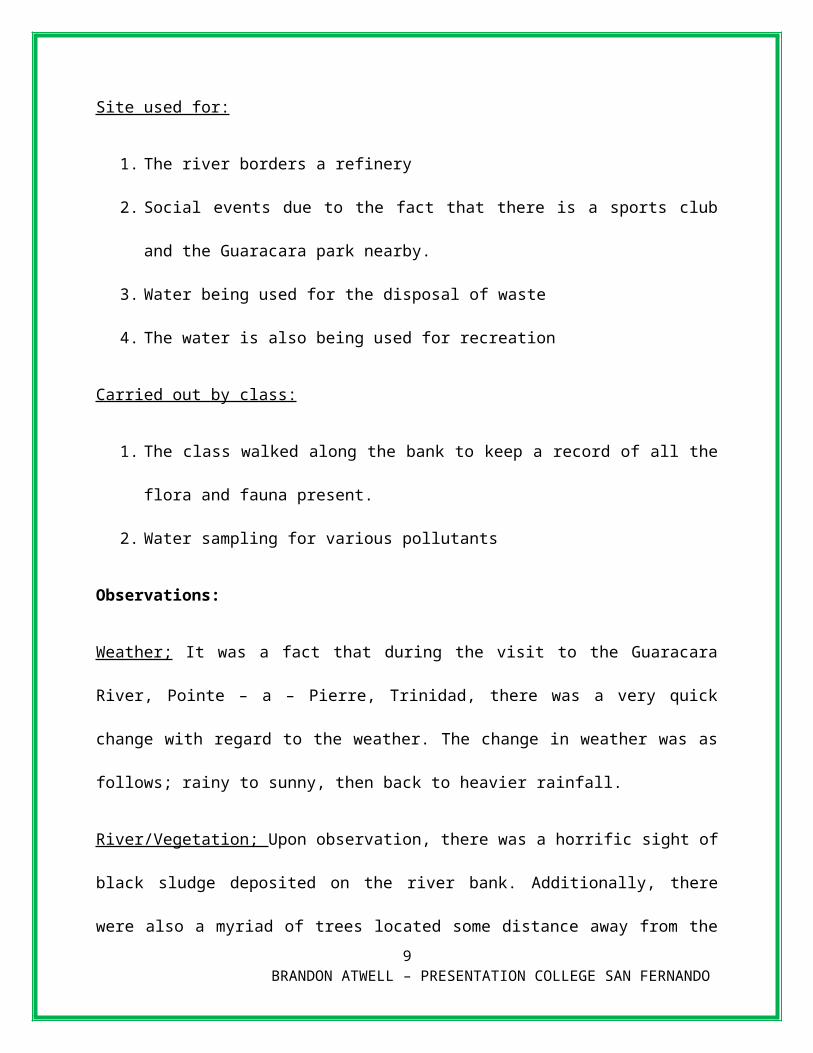
Site used for:
1. The river borders a refinery
2. Social events due to the fact that there is a sports club and the Guaracara park nearby.
3. Water being used for the disposal of waste
4. The water is also being used for recreation
Carried out by class:
1. The class walked along the bank to keep a record of all the flora and fauna present.
2. Water sampling for various pollutants
Observations:
Weather; It was a fact that during the visit to the Guaracara River, Pointe – a – Pierre, Trinidad,
there was a very quick change with regard to the weather. The change in weather was as follows;
rainy to sunny, then back to heavier rainfall.
River/Vegetation; Upon observation, there was a horrific sight of black sludge deposited on the
river bank. Additionally, there were also a myriad of trees located some distance away from the
water and also the blooming of algae. Alas, the class became uncomfortable when the stench of
hydrocarbons begun to emanate into the environment. Meanwhile, whilst conducting the
6 BRANDON ATWELL – PRESENTATION COLLEGE SAN FERNANDO
observation process, an oily film was seen on the water. However there were also a large number
of pipelines.
Possible Pollutants;
1. Sewages from ‘outhouses’
2. Pollutants from fertilizers and pesticides
3. Garbage disposal
Test Lower
Average
Middle
course
Average
Upper course
Average
Total
Average
International
Standard
pH 8 8.3 10.9 9.07 6.5 – 9.0
Conductivity(U.S) 200 221.8 180 200.6 Below 1500 - 1800
Temperature (◦C) 23.9 25 24.6 24.5 23 – 30
Salinity (ppm) 600 540 495.09 545.03 500
TDS (ppt) 1110 1324.8 1300 1244.8 Below 1000 - 1200
Dissolve Oxygen (ppm) 6.05 5.20 7.03 6.09 At 25◦C 8.3
Nitrates (ppm) 1.1 1.3 2.5 1.63 Under 1ml/l
THE TABLE ABOVE SHOWS THE AVERAGE READINGS OBTAINED FROM THE TEST TAKEN FROM
THREE POINTS AND ITS AVERAGE AND THE ACCEPTABLE INTERNATIONAL STANDARDS
NOTE: See lab 2 for results.
Interpretive Comments:
7 BRANDON ATWELL – PRESENTATION COLLEGE SAN FERNANDO

Indeed, the Guaracara River is very much polluted and is affected by the various pollutants
that were tested for. This was seen when the scientific results which were obtained at the river
compared to the acceptable international standards showed that the river is not up to standard and
it’s unlikely to support the majority of average species.
Meanwhile, as seen in the table before, almost all the scientific values (except conductivity
and temperature), of pH, salinity, total dissolved substances, dissolved oxygen and nitrates are
most definitely not within or below the acceptable range. Therefore it is a fact to conclude that
the river is polluted or rather highly polluted as these scientific values show. Altogether, these
distasteful results were obtained mainly because of the various activities that occur in close
proximity of the river.
Moreover, there is non-point pollution by the agricultural sector. The fact that there is a high
level of nitrates present in the river hints to us that a lot of fertilizers are used to cultivate the
crops in this vicinity. A reading of 1.63ml/l was obtained. Therefore this reading explained why
evidence of eutrophication was seen at certain parts of the River. Meanwhile this process is
known to reduce the dissolve oxygen content of water hence an average reading of 6.09(ppm)
was recorded. Additionally, it then dawned on the class that this could be a reason as to why
there isn’t a high level of aquatic life present at the river as expected due to its size.
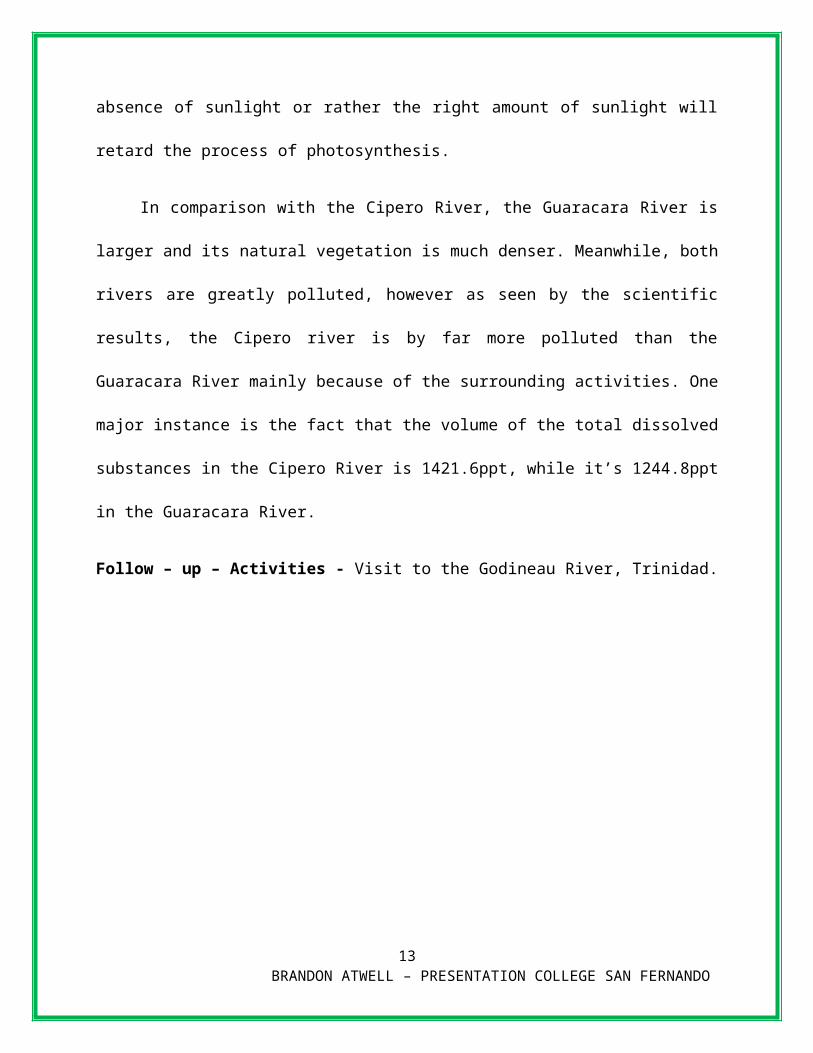
Similarly, the layer of oil on some parts of the river reduces the level of sunlight that enters the
river. Therefore the aquatic plant population is also on a decrease since the absence of sunlight or
rather the right amount of sunlight will retard the process of photosynthesis.
In comparison with the Cipero River, the Guaracara River is larger and its natural vegetation is
much denser. Meanwhile, both rivers are greatly polluted, however as seen by the scientific
8 BRANDON ATWELL – PRESENTATION COLLEGE SAN FERNANDO
results, the Cipero river is by far more polluted than the Guaracara River mainly because of the
surrounding activities. One major instance is the fact that the volume of the total dissolved
substances in the Cipero River is 1421.6ppt, while it’s 1244.8ppt in the Guaracara River.
Follow – up – Activities - Visit to the Godineau River, Trinidad.
9 BRANDON ATWELL – PRESENTATION COLLEGE SAN FERNANDO

Entry Number: 03
Date: 27/10/11
Site (Location): Godineau River, Trinidad
Objectives:
1. To observe activities that may influence the river to conduct water sampling to determine
the presence of pollutants.
2. Collect and test a water sample from the river for various pollutants at the lower, middle
and upper region of the river.
3. Record the different types flora and fauna present along the river bank.
4. Make a direct link between man-made and natural activities that can influence the
quality of the river water which will make the use of the river easily determined.
Introduction/Background:
Ultimately, the Godineau River is well known for its kayaking experiences. Kayaking in the
Godineau area takes one through a variety of habitats, from saltwater mangrove swamp to fresh
water marshland to partially cultivated areas. A variety of birdlife can be seen on these kayak
trips including Scarlet Ibis, Southern Lapwing, Osprey, Savannah Hawk, Wattled Jacana, Cattle
Egret, Yellow-hooded Blackbird, Lesser Yellowlegs, Black-bellied Whistling Duck and a variety
of migrating ducks (during the northern winter).
10 BRANDON ATWELL – PRESENTATION COLLEGE SAN FERNANDO
The Godineau River is one of the rivers in Trinidad that provides a year round kayaking
opportunity as the water level is always sufficient. This kayak trip can be started either from the
Gulf of Paria along the area known as the Mosquito Creek or inland from the Woodland area.
Lastly, the Godineau River is also known as the South Oropouche River.
Activities:
Site used for:
1. Religious activities (cremation etc)
2. Recreation (fishing, kayaking, jet skiing, crab catching)
3. Nature watching
Carried out by class:
1. Walked along the bank
2. Observations were made
3. Testing of the water was done
Observations:
Weather; It was a fact that during the visit to the Godineau River, Trinidad, there was a very
quick change with regard to the weather. The change in weather was as follows; rainy to sunny,
then back to heavier rainfall.
River/Vegetation; Upon visiting the river it was obvious that the area in which the river is
situated is heavily forested. Additionally during the observation process the following things was
11 BRANDON ATWELL – PRESENTATION COLLEGE SAN FERNANDO

seen; Mangroves, Crabs, Birds, People. Also a few people were fishing and there was also a
funeral at the nearby cremation site hence some religious flags were seen at the mouth of the
river. Nevertheless, the colour of the water was indeed brown and the river itself was wide.
Possible Pollutants;
1. Pollutants from fishing boats
2. Sewages from ‘outhouses’
3. Pollutants from fertilizers and pesticides
4. Garbage disposal
5. Pollutants from cremation site
Test Lower
Average
Middle
course
Average
Upper course
Average
Total
Average
International
Standard
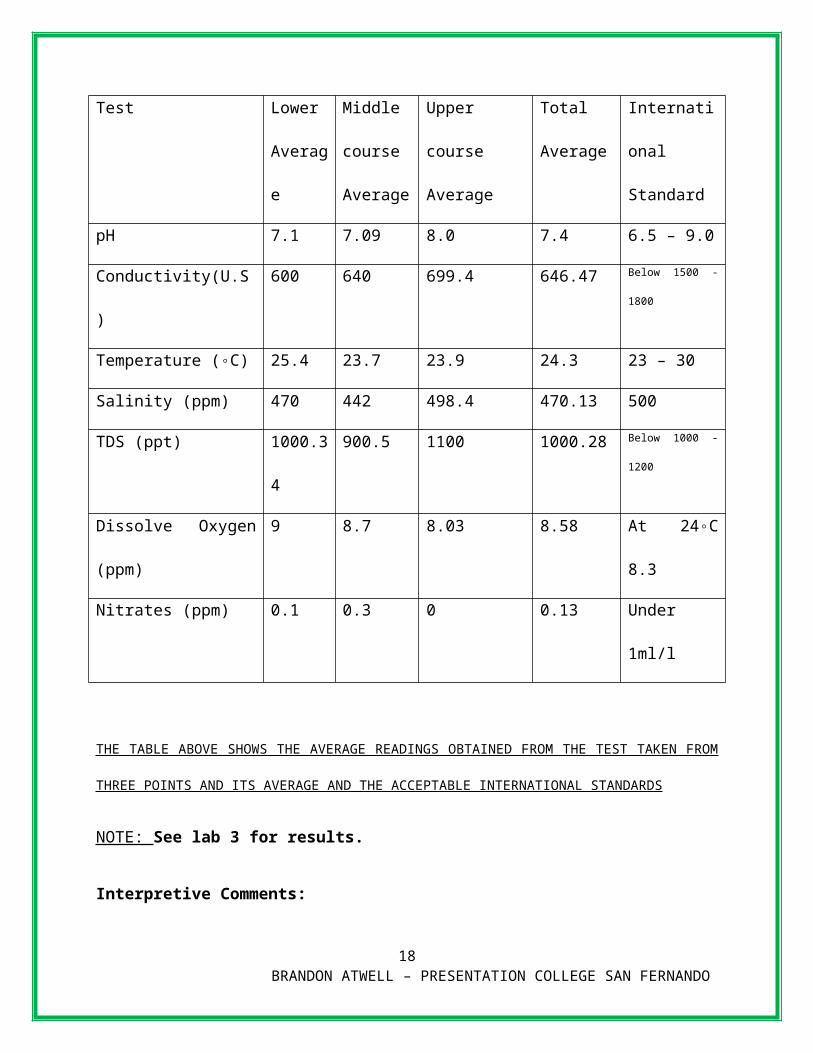
pH 7.1 7.09 8.0 7.4 6.5 – 9.0
Conductivity(U.S) 600 640 699.4 646.47 Below 1500 - 1800
Temperature (◦C) 25.4 23.7 23.9 24.3 23 – 30
Salinity (ppm) 470 442 498.4 470.13 500
TDS (ppt) 1000.34 900.5 1100 1000.28 Below 1000 - 1200
Dissolve Oxygen (ppm) 9 8.7 8.03 8.58 At 24◦C 8.3
Nitrates (ppm) 0.1 0.3 0 0.13 Under 1ml/l
THE TABLE ABOVE SHOWS THE AVERAGE READINGS OBTAINED FROM THE TEST TAKEN FROM
THREE POINTS AND ITS AVERAGE AND THE ACCEPTABLE INTERNATIONAL STANDARDS
12 BRANDON ATWELL – PRESENTATION COLLEGE SAN FERNANDO
NOTE: See lab 3 for results.
Interpretive Comments:
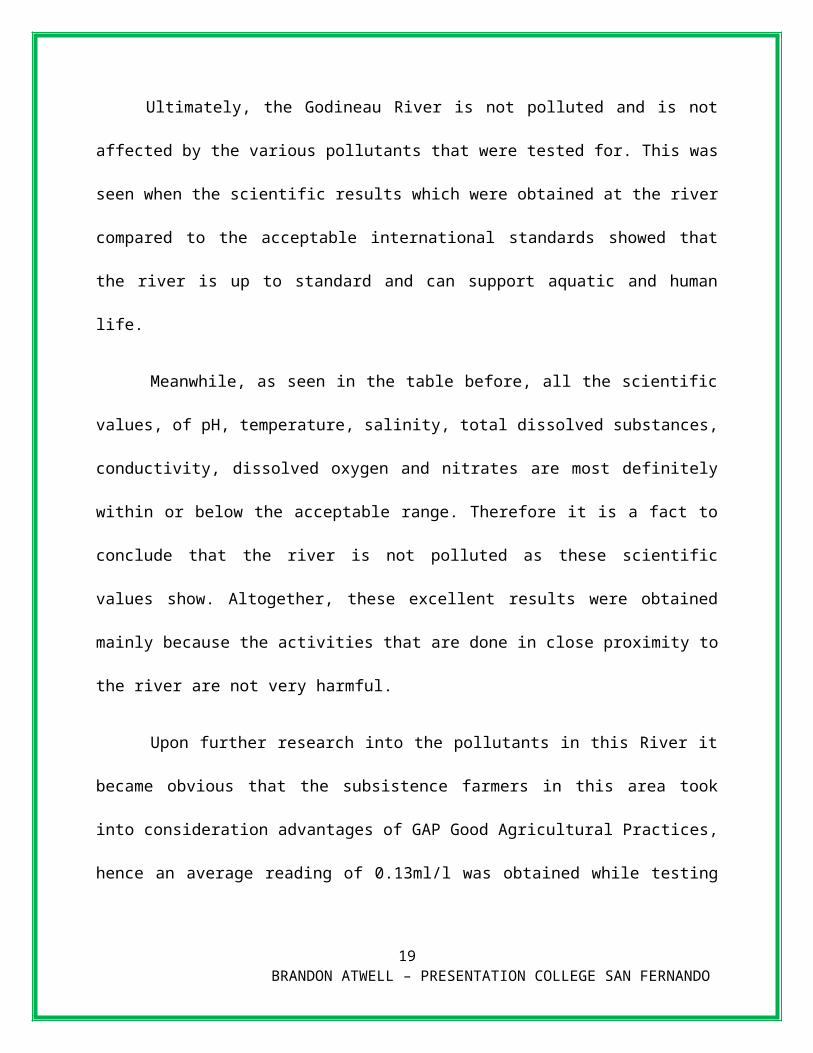
Ultimately, the Godineau River is not polluted and is not affected by the various pollutants
that were tested for. This was seen when the scientific results which were obtained at the river
compared to the acceptable international standards showed that the river is up to standard and
can support aquatic and human life.
Meanwhile, as seen in the table before, all the scientific values, of pH, temperature, salinity,
total dissolved substances, conductivity, dissolved oxygen and nitrates are most definitely within
or below the acceptable range. Therefore it is a fact to conclude that the river is not polluted as
these scientific values show. Altogether, these excellent results were obtained mainly because the
activities that are done in close proximity to the river are not very harmful.
Upon further research into the pollutants in this River it became obvious that the subsistence
farmers in this area took into consideration advantages of GAP Good Agricultural Practices,
hence an average reading of 0.13ml/l was obtained while testing for nitrates. Similarly these
practices also facilitated for a low pH reading in the river.
The Godineau area is somewhat underdeveloped with regard to Caribbean standards and
indeed some homes have ‘outhouses’. Obviously, this sewage runs directly into certain parts of
the river (point source pollutant) and this may then become a major pollutant hence the reason
why an average pH of 7.4 was obtained.
13 BRANDON ATWELL – PRESENTATION COLLEGE SAN FERNANDO
On the other hand, in comparison to the Guaracara and Cipero River, the Godineau River is
far more up to standard and this may be the reason why the Godineau River is well known for its
marvelous kayaking and fishing experiences.
Follow – up – Activities - Visit to the Caroni River, Caroni,Trinidad.
14 BRANDON ATWELL – PRESENTATION COLLEGE SAN FERNANDO

Entry Number: 04
Date: 04/11/11
Site (Location): Caroni River, Caroni, Trinidad. Located in Northern Trinidad.
Objectives:
1. To observe activities that may influence the river to conduct water sampling to determine
the presence of pollutants.
2. Collect and test a water sample from the river for various pollutants at the lower, middle
and upper region of the river.
3. Record the different types flora and fauna present along the river bank.
4. Make a direct link between man-made and natural activities that can influence the
quality of the river water which will make the use of the river easily determined.
Introduction/Background:
The Caroni River is the largest river in Trinidad and Tobago, running for 40 km (25 mi) from
its origins in the Northern Range on the island of Trinidad, through the northern lowlands of the
Caroni Plains and enters the Gulf of Paria at the Caroni Swamp.
The Caroni and its tributaries drain one of the most densely populated part of Trinidad, the
"East-West Corridor", and also provides most of its drinking water through the Caroni-Arena
15 BRANDON ATWELL – PRESENTATION COLLEGE SAN FERNANDO

Dam. Point and non-point pollution is thus a major concern, as is the deforestation of its
watershed on the southern slopes of the Northern Range. The banks of the Caroni River are one
of the two main sites for Hindu cremations.
Activities:
Site used for:
1. Religious activities (cremation etc)
2. Recreation (Site seeing) - Tourism
3. Water for Farms
4. Water Treatment
5. Vegetable farming
6. Rice Farm
Carried out by class:
7. Walked along the bank
8. Observations were made
9. Testing of the water was done
Observations:
Weather; It was a fact that during the visit to the Godineau River, Trinidad, there was a very
quick change with regard to the weather. The change in weather was as follows; rainy to sunny,
then back to heavier rainfall.
16 BRANDON ATWELL – PRESENTATION COLLEGE SAN FERNANDO

River/Vegetation; Upon observation it was clear that rice was grown in close proximity to the
river. The land was indeed flat (plains) and there was also a mangrove. Additionally, near the
water was forested and animals such as Birds and Caimans were seen. With regard to vegetation,
crops such as patchoi, peas, cucumber, bhagi and citrus was present between the upper and
middle course of the river. Moreover, the colour of the water was dark green.
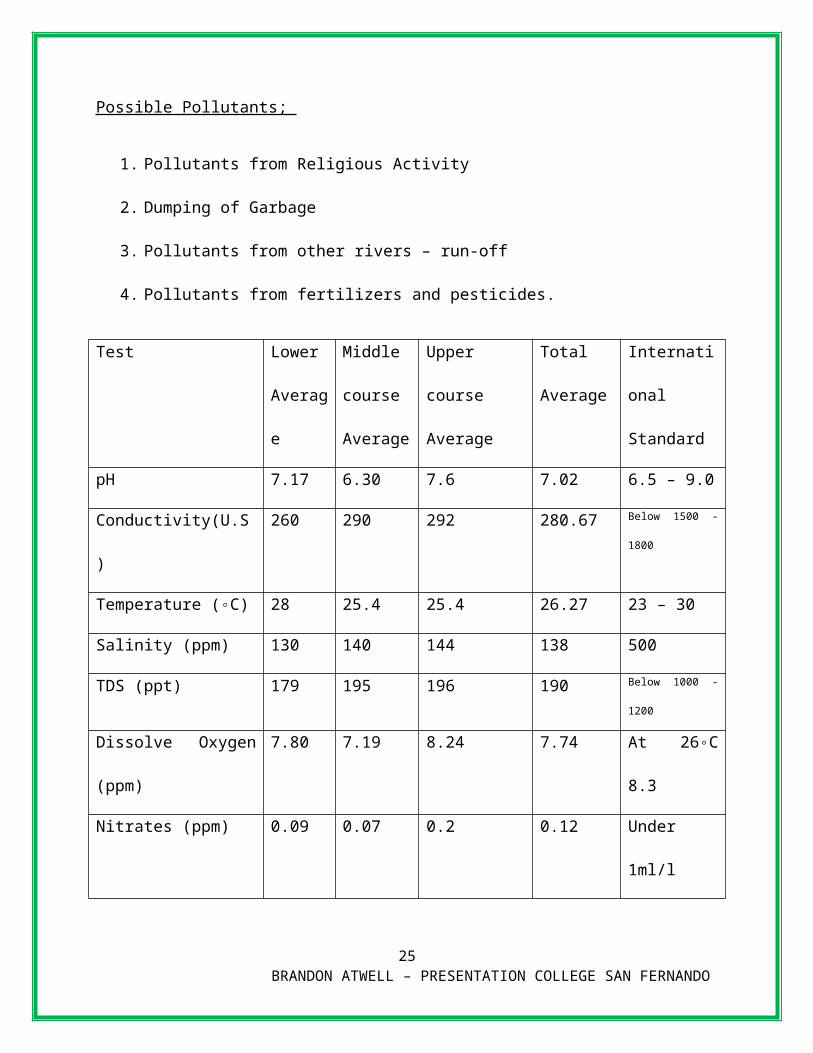
Possible Pollutants;
1. Pollutants from Religious Activity
2. Dumping of Garbage
3. Pollutants from other rivers – run-off
4. Pollutants from fertilizers and pesticides.
Test Lower
Average
Middle
course
Average
Upper course
Average
Total
Average
International
Standard
pH 7.17 6.30 7.6 7.02 6.5 – 9.0
Conductivity(U.S) 260 290 292 280.67 Below 1500 - 1800
Temperature (◦C) 28 25.4 25.4 26.27 23 – 30
Salinity (ppm) 130 140 144 138 500
TDS (ppt) 179 195 196 190 Below 1000 - 1200
Dissolve Oxygen (ppm) 7.80 7.19 8.24 7.74 At 26◦C 8.3
Nitrates (ppm) 0.09 0.07 0.2 0.12 Under 1ml/l
17 BRANDON ATWELL – PRESENTATION COLLEGE SAN FERNANDO
THE TABLE ABOVE SHOWS THE AVERAGE READINGS OBTAINED FROM THE TEST TAKEN FROM
THREE POINTS AND ITS AVERAGE AND THE ACCEPTABLE INTERNATIONAL STANDARDS
NOTE: See lab 4 for results.
Interpretive Comments:
Ultimately, the Caroni River is not polluted and is not affected by the various pollutants that
were tested for. This was seen when the scientific results which were obtained at the river
compared to the acceptable international standards showed that the river is up to standard and
can support aquatic and human life.
Meanwhile, as seen in the table before, all the scientific values, of pH, temperature, salinity,
total dissolved substances, conductivity, dissolved oxygen and nitrates are most definitely within
or below the acceptable range. Therefore it is a fact to conclude that the river is not polluted as
these scientific values show. Altogether, these excellent results were obtained mainly because the
activities that are done in close proximity to the river are not very harmful.
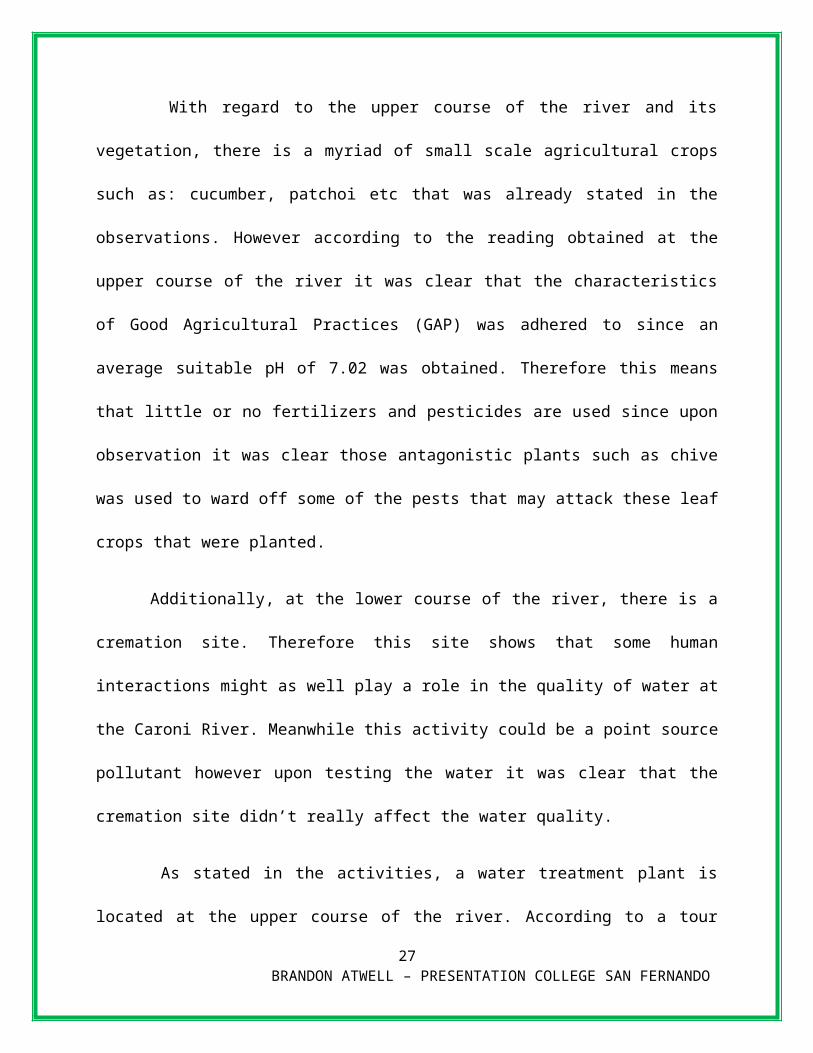
With regard to the upper course of the river and its vegetation, there is a myriad of small scale
agricultural crops such as: cucumber, patchoi etc that was already stated in the observations.
However according to the reading obtained at the upper course of the river it was clear that the
characteristics of Good Agricultural Practices (GAP) was adhered to since an average suitable
pH of 7.02 was obtained. Therefore this means that little or no fertilizers and pesticides are used
since upon observation it was clear those antagonistic plants such as chive was used to ward off
some of the pests that may attack these leaf crops that were planted.
18 BRANDON ATWELL – PRESENTATION COLLEGE SAN FERNANDO
Additionally, at the lower course of the river, there is a cremation site. Therefore this site
shows that some human interactions might as well play a role in the quality of water at the
Caroni River. Meanwhile this activity could be a point source pollutant however upon testing the
water it was clear that the cremation site didn’t really affect the water quality.
As stated in the activities, a water treatment plant is located at the upper course of the river.
According to a tour guide at the River, the water treatment plant operates as follows; firstly, there
is band shield that prevents rubbish from entering then to an area where coagulation occur then
fluctuation then sedimentation, then filtration. Subsequently, the water is passed through
Androxyte Carbon and also sand to remove the solids. Lastly the water is then pumped into tanks
where it is lime injected.
Ultimately, in comparison to the Cipero, Guaracara and Godineau River, the Caroni River is
the largest and the cleanest. For example with regard to the average Salinity of all the Rivers the
Caroni River had the lowest reading that was also very well up to international standards, that is,
138ppm. On the other hand, the Caroni river also had the lowest average nitrate level of 0.12
ml/l.
Follow – up – Activities - Visit to the Ortoire River Mayaro, Trinidad.
19 BRANDON ATWELL – PRESENTATION COLLEGE SAN FERNANDO

Entry Number: 05
Date: 11/11/11
Site (Location): Ortoire River located in the South East of Trinidad, Mayaro.
Objectives:
1. To observe activities that may influence the river to conduct water sampling to determine
the presence of pollutants.
2. Collect and test a water sample from the river for various pollutants at the lower, middle
and upper region of the river.
3. Record the different types flora and fauna present along the river bank.
4. Make a direct link between man-made and natural activities that can influence the
quality of the river water which will make the use of the river easily determined.
Introduction/Background:
The Ortoire River is a large river in Trinidad and Tobago. It forms the boundary between
Nariva County and Mayaro County in east Trinidad. It is brown in color and at one time had an
iron bridge with wooden planks but it has been replaced with an all paved concrete bridge; also it 20
BRANDON ATWELL – PRESENTATION COLLEGE SAN FERNANDO

was made higher to reduce flooding. Its latitude is 10 N 19 60 N, Longitude 61N 0’0 N and is 50
Kilometers long. Additionally, the Ortoire River flows from the Central range into the Atlantic
Ocean.
The Water and Sewage Authority of Trinidad and Tobago (WASA) protect the use of water in
this river since it has a good supply of water to support the South of Trinidad. Meanwhile the
Ortoire River is well known for its Kayaking and Fishing experiences.
Activities:
Site used for:
1. Fishing
2. Recreation (Site seeing and Kayaking) - Tourism
3. Bathing
4. Vegetable farming
Carried out by class:
5. Walked along the bank
6. Observations were made
7. Testing of the water was done
Observations:
21 BRANDON ATWELL – PRESENTATION COLLEGE SAN FERNANDO

Weather; It was a fact that during the visit to the Godineau River, Trinidad, there was a very
quick change with regard to the weather. The change in weather was as follows; rainy to sunny,
then back to heavier rainfall.
River/Vegetation; The vegetation in this area consists of Bamboos and also a mangrove. Also
subsistence agriculture is widely practiced since products such as peppers, coconuts, watermelon,
cassava and mangoes were seen. However there was very little development along the River but
mostly grasses and bamboos. Moreover the colour of the water was brown and erosion and
sedimentation was seen along the banks of the River.
Possible Pollutants;
1. Pollutants from Sedimentation
2. Dumping of Garbage
3. Pollutants from other rivers – run-off
4. Pollutants from fertilizers and pesticides
Test Lower
Average
Middle
course
Average
Upper course
Average
Total
Average
International
Standard
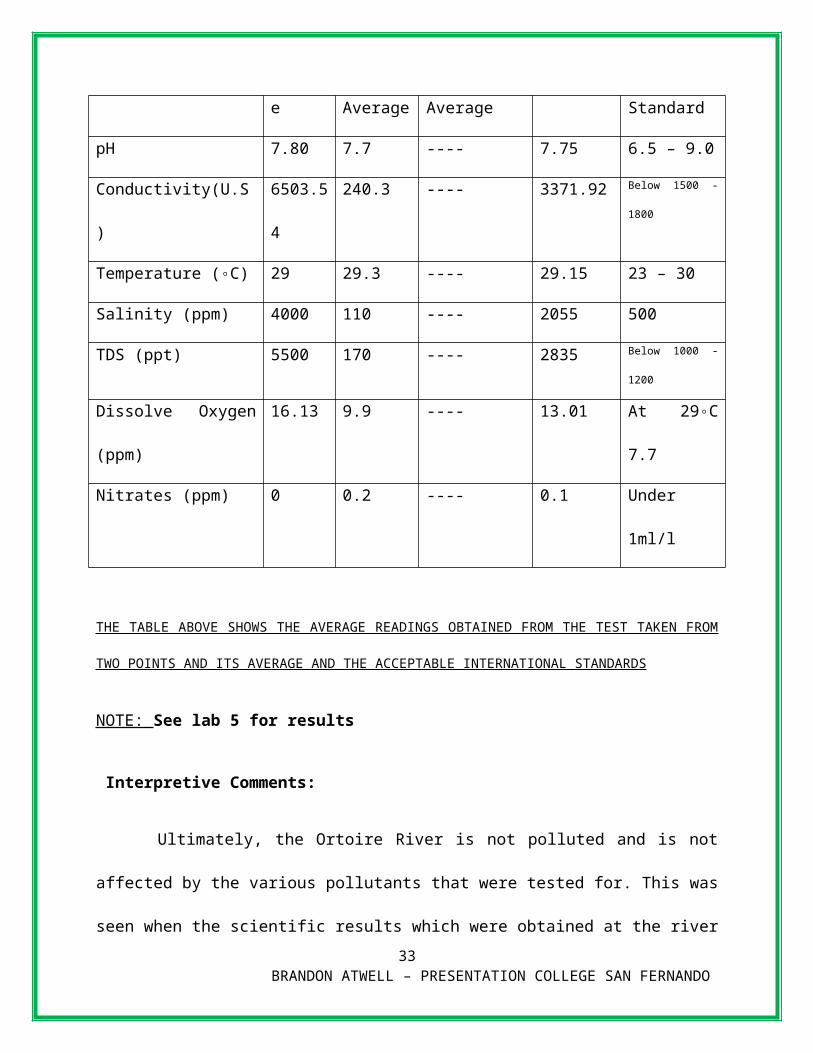
pH 7.80 7.7 ---- 7.75 6.5 – 9.0
Conductivity(U.S) 6503.54 240.3 ---- 3371.92 Below 1500 - 1800
Temperature (◦C) 29 29.3 ---- 29.15 23 – 30
Salinity (ppm) 4000 110 ---- 2055 500
TDS (ppt) 5500 170 ---- 2835 Below 1000 - 1200
Dissolve Oxygen (ppm) 16.13 9.9 ---- 13.01 At 29◦C 7.7
22 BRANDON ATWELL – PRESENTATION COLLEGE SAN FERNANDO

Nitrates (ppm) 0 0.2 ---- 0.1 Under 1ml/l
THE TABLE ABOVE SHOWS THE AVERAGE READINGS OBTAINED FROM THE TEST TAKEN FROM
TWO POINTS AND ITS AVERAGE AND THE ACCEPTABLE INTERNATIONAL STANDARDS
NOTE: See lab 5 for results
Interpretive Comments:
Ultimately, the Ortoire River is not polluted and is not affected by the various pollutants that
were tested for. This was seen when the scientific results which were obtained at the river
compared to the acceptable international standards showed that the river is up to standard and
can support aquatic and human life.
Meanwhile, as seen in the table before, all the scientific values, of pH, temperature, salinity,
total dissolved substances, conductivity, dissolved oxygen and nitrates are most definitely within
or below the acceptable range. This is obviously with the exception of the high levels of
Conductivity, Salinity and Total dissolved substances due to the fact that sea water mixes with
the river water and the testing was done at the mouth of the river. Therefore it is a fact to
conclude that the river is not polluted as these scientific values show. Altogether, these excellent
results were obtained mainly because the activities that are done in close proximity to the river
are not very harmful.
In terms of vegetation, subsistence farming is practiced with the area of the middle and lower
course. As already stated in the observation, crops such as coconuts, mangoes and cassavas are
among some of the crops planted. Indeed these subsistence farmers in close proximity to the
23 BRANDON ATWELL – PRESENTATION COLLEGE SAN FERNANDO

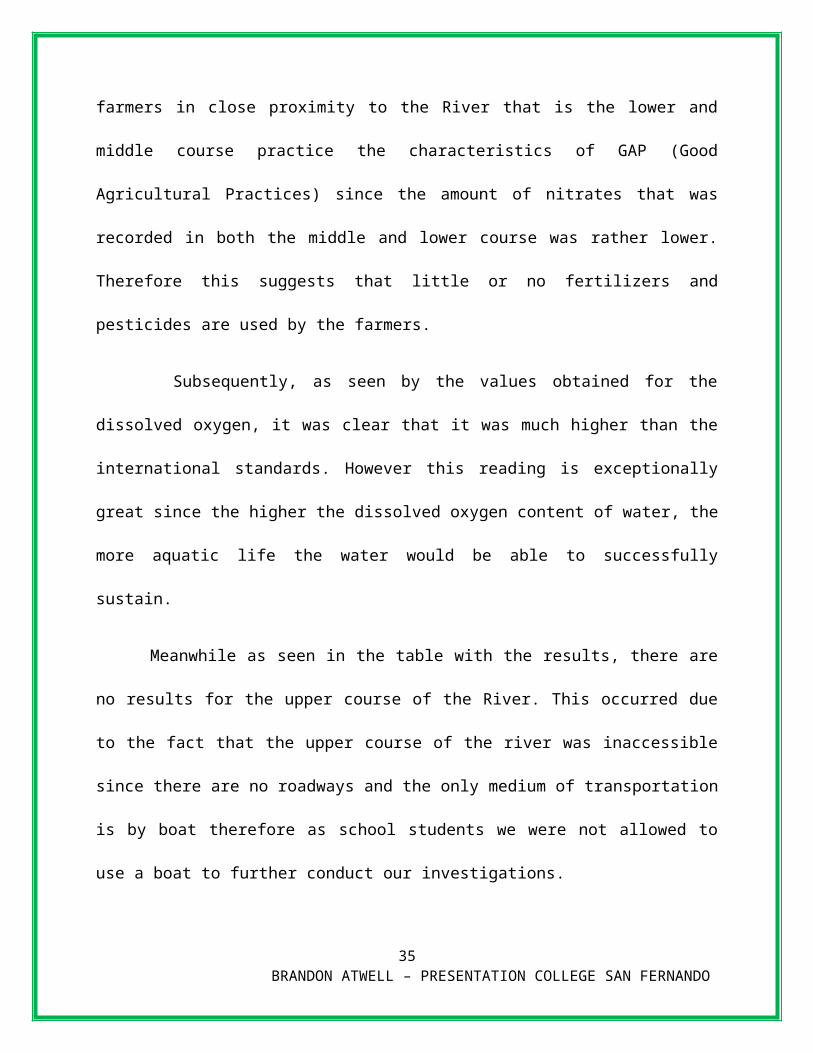
River that is the lower and middle course practice the characteristics of GAP (Good Agricultural
Practices) since the amount of nitrates that was recorded in both the middle and lower course was
rather lower. Therefore this suggests that little or no fertilizers and pesticides are used by the
farmers.
Subsequently, as seen by the values obtained for the dissolved oxygen, it was clear that it was
much higher than the international standards. However this reading is exceptionally great since
the higher the dissolved oxygen content of water, the more aquatic life the water would be able
to successfully sustain.
Meanwhile as seen in the table with the results, there are no results for the upper course of the
River. This occurred due to the fact that the upper course of the river was inaccessible since there
are no roadways and the only medium of transportation is by boat therefore as school students
we were not allowed to use a boat to further conduct our investigations.
In comparison to the Cipero, Guaracara, Godineau and Caroni River, the Ortoire River is the
cleanest of them all. This River had the lowest amount of nitrates, that is, a mere 0.1lm/l in
comparison to the 3.63lm/l that was recorded in the Cipero River which according to the results
is the dirtiest river of the five (5) that were tested. However one thing that both the Caroni and
Ortoire River have in common is that they are somewhat protected by the Water and Sewage
Authority of Trinidad and Tobago (WASA) since both are already being used as a source of
water by WASA.
Follow – up – Activities: The class subsequently visited the five (5) Rivers that was part of the
research and had cleanup activities.
24 BRANDON ATWELL – PRESENTATION COLLEGE SAN FERNANDO
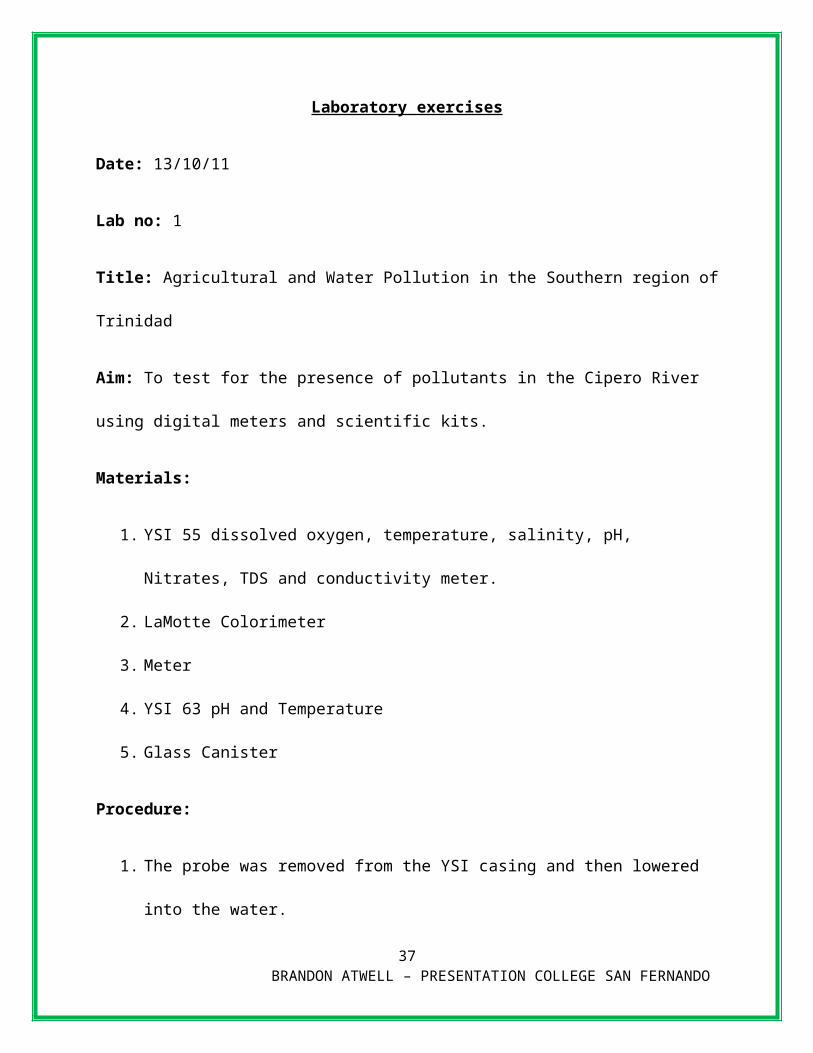
Laboratory exercises
Date: 13/10/11
Lab no: 1
Title: Agricultural and Water Pollution in the Southern region of Trinidad
Aim: To test for the presence of pollutants in the Cipero River using digital meters and scientific
kits.
Materials:
1. YSI 55 dissolved oxygen, temperature, salinity, pH, Nitrates, TDS and conductivity
meter.
2. LaMotte Colorimeter
3. Meter
4. YSI 63 pH and Temperature
5. Glass Canister
Procedure:
1. The probe was removed from the YSI casing and then lowered into the water.
25 BRANDON ATWELL – PRESENTATION COLLEGE SAN FERNANDO
2. Readings of dissolved oxygen concentration and temperature was taken from the three
samples from the lower course.
3. Steps one and two were repeated when testing for the dissolved oxygen concentration and
temperature of the middle and upper course of the river.
4. The probe was then pulled up, washed with distilled water and replaced.
5. The YSI 63 probe was removed from the casing, and then lowered into the water.
6. Readings of pH, Salinity, Conductivity and TDS was taken from the three samples from
the lower course.
7. Steps five and six were repeated when testing for the pH, Salinity, Conductivity and TDS
of the middle and upper course of the river.
8. The probe was then raised, washed with distilled water and replaced.
9. Three samples of water were taken from the lower course of the river and were later
placed in glass canisters where it was tested for nitrates using the colorimeter.
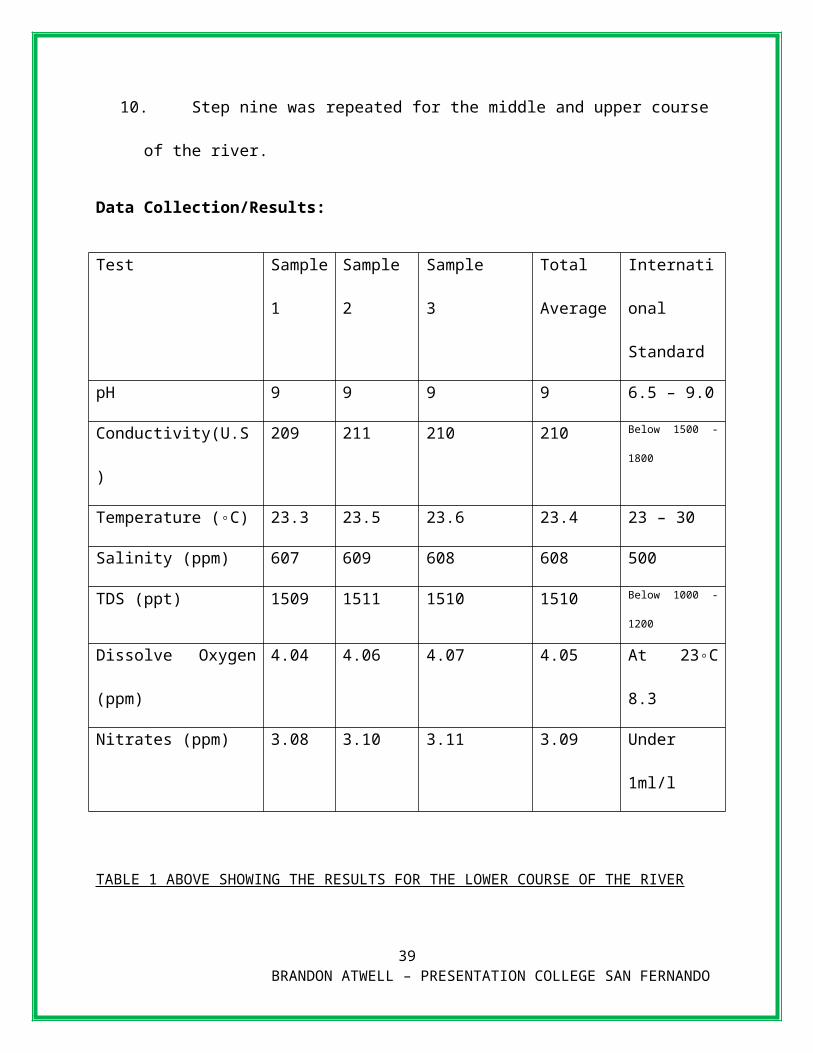
10. Step nine was repeated for the middle and upper course of the river.
Data Collection/Results:
Test Sample
1
Sample
2
Sample
3
Total
Average
International
Standard
pH 9 9 9 9 6.5 – 9.0
Conductivity(U.S) 209 211 210 210 Below 1500 - 1800
Temperature (◦C) 23.3 23.5 23.6 23.4 23 – 30
Salinity (ppm) 607 609 608 608 500
TDS (ppt) 1509 1511 1510 1510 Below 1000 - 1200
Dissolve Oxygen (ppm) 4.04 4.06 4.07 4.05 At 23◦C 8.3
26 BRANDON ATWELL – PRESENTATION COLLEGE SAN FERNANDO
Nitrates (ppm) 3.08 3.10 3.11 3.09 Under 1ml/l
TABLE 1 ABOVE SHOWING THE RESULTS FOR THE LOWER COURSE OF THE RIVER
Test Sample
1
Sample
2
Sample
3
Total
Average
International
Standard
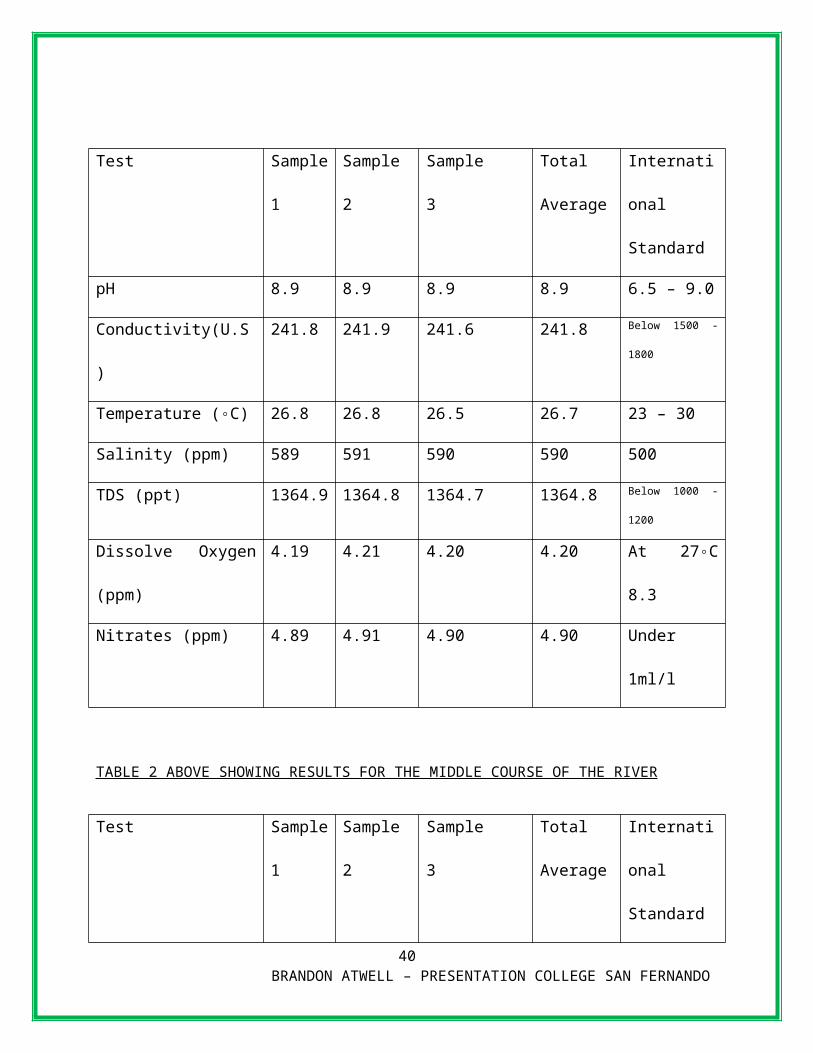
pH 8.9 8.9 8.9 8.9 6.5 – 9.0
Conductivity(U.S) 241.8 241.9 241.6 241.8 Below 1500 - 1800
Temperature (◦C) 26.8 26.8 26.5 26.7 23 – 30
Salinity (ppm) 589 591 590 590 500
TDS (ppt) 1364.9 1364.8 1364.7 1364.8 Below 1000 - 1200
Dissolve Oxygen (ppm) 4.19 4.21 4.20 4.20 At 27◦C 8.3
Nitrates (ppm) 4.89 4.91 4.90 4.90 Under 1ml/l
TABLE 2 ABOVE SHOWING RESULTS FOR THE MIDDLE COURSE OF THE RIVER
Test Sample
1
Sample
2
Sample
3
Total
Average
International
Standard
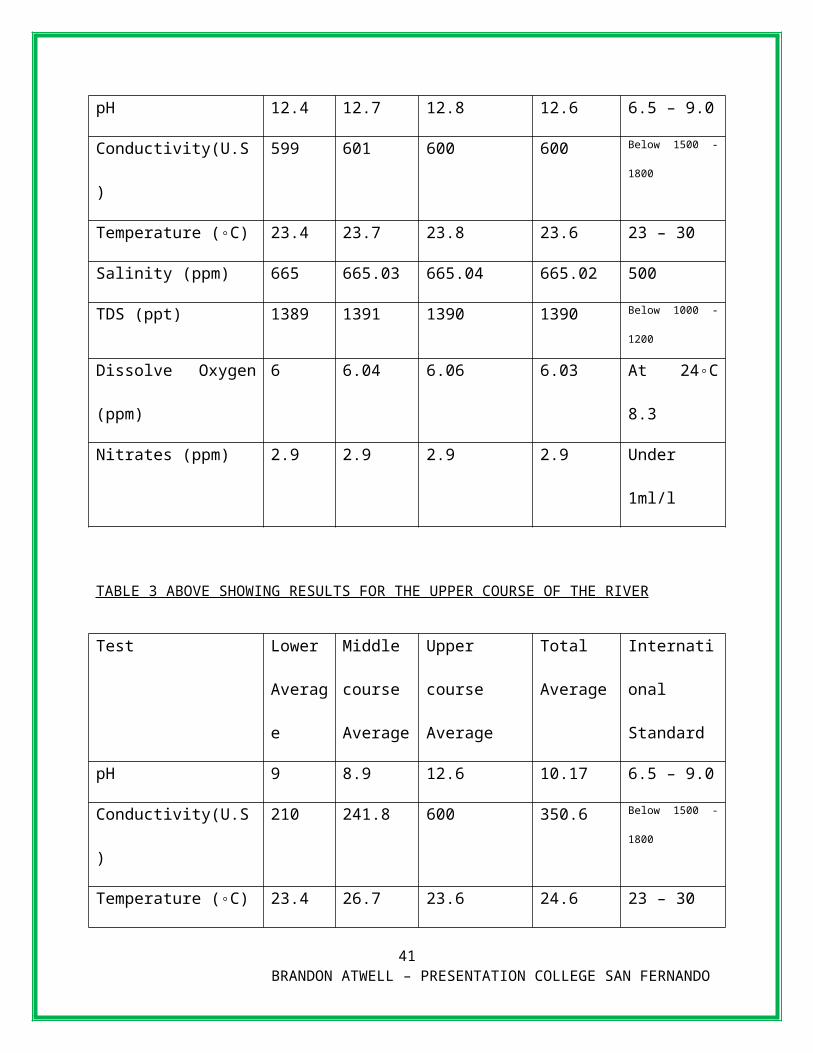
pH 12.4 12.7 12.8 12.6 6.5 – 9.0
Conductivity(U.S) 599 601 600 600 Below 1500 - 1800
Temperature (◦C) 23.4 23.7 23.8 23.6 23 – 30
27 BRANDON ATWELL – PRESENTATION COLLEGE SAN FERNANDO
Salinity (ppm) 665 665.03 665.04 665.02 500
TDS (ppt) 1389 1391 1390 1390 Below 1000 - 1200
Dissolve Oxygen (ppm) 6 6.04 6.06 6.03 At 24◦C 8.3
Nitrates (ppm) 2.9 2.9 2.9 2.9 Under 1ml/l
TABLE 3 ABOVE SHOWING RESULTS FOR THE UPPER COURSE OF THE RIVER
Test Lower
Average
Middle
course
Average
Upper course
Average
Total
Average
International
Standard
pH 9 8.9 12.6 10.17 6.5 – 9.0
Conductivity(U.S) 210 241.8 600 350.6 Below 1500 - 1800
Temperature (◦C) 23.4 26.7 23.6 24.6 23 – 30
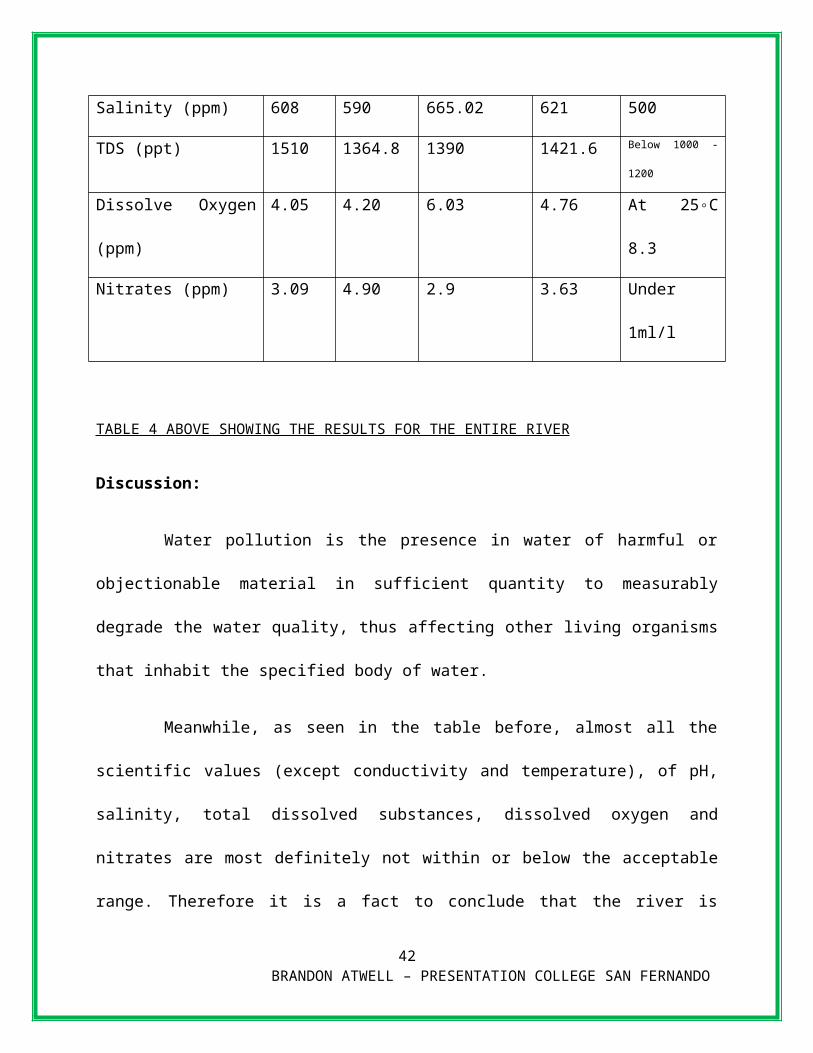
Salinity (ppm) 608 590 665.02 621 500
TDS (ppt) 1510 1364.8 1390 1421.6 Below 1000 - 1200
Dissolve Oxygen (ppm) 4.05 4.20 6.03 4.76 At 25◦C 8.3
Nitrates (ppm) 3.09 4.90 2.9 3.63 Under 1ml/l
TABLE 4 ABOVE SHOWING THE RESULTS FOR THE ENTIRE RIVER
Discussion:
28 BRANDON ATWELL – PRESENTATION COLLEGE SAN FERNANDO

Water pollution is the presence in water of harmful or objectionable material in sufficient
quantity to measurably degrade the water quality, thus affecting other living organisms that
inhabit the specified body of water.
Meanwhile, as seen in the table before, almost all the scientific values (except conductivity
and temperature), of pH, salinity, total dissolved substances, dissolved oxygen and nitrates are
most definitely not within or below the acceptable range. Therefore it is a fact to conclude that
the river is polluted or rather highly polluted as these scientific values show. Altogether, these
distasteful results were obtained mainly because of the various activities that occur in close
proximity of the river.
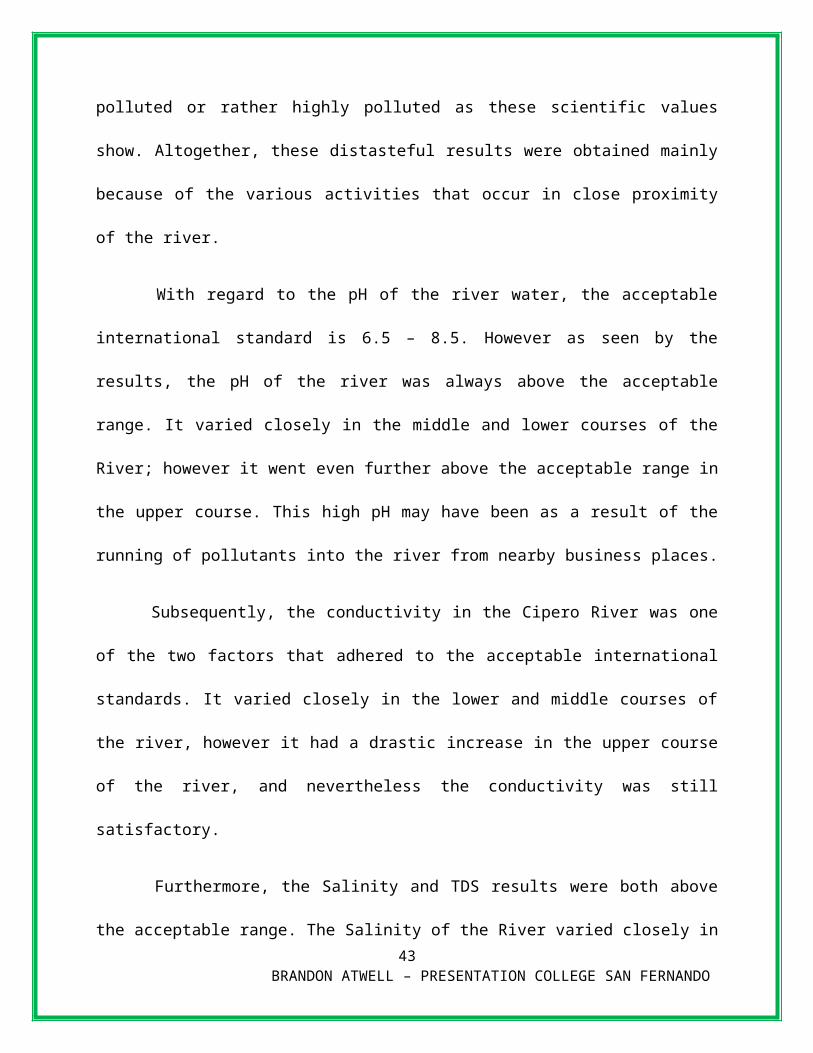
With regard to the pH of the river water, the acceptable international standard is 6.5 – 8.5.
However as seen by the results, the pH of the river was always above the acceptable range. It
varied closely in the middle and lower courses of the River; however it went even further above
the acceptable range in the upper course. This high pH may have been as a result of the running
of pollutants into the river from nearby business places.
Subsequently, the conductivity in the Cipero River was one of the two factors that adhered to
the acceptable international standards. It varied closely in the lower and middle courses of the
river, however it had a drastic increase in the upper course of the river, and nevertheless the
conductivity was still satisfactory.
Furthermore, the Salinity and TDS results were both above the acceptable range. The Salinity
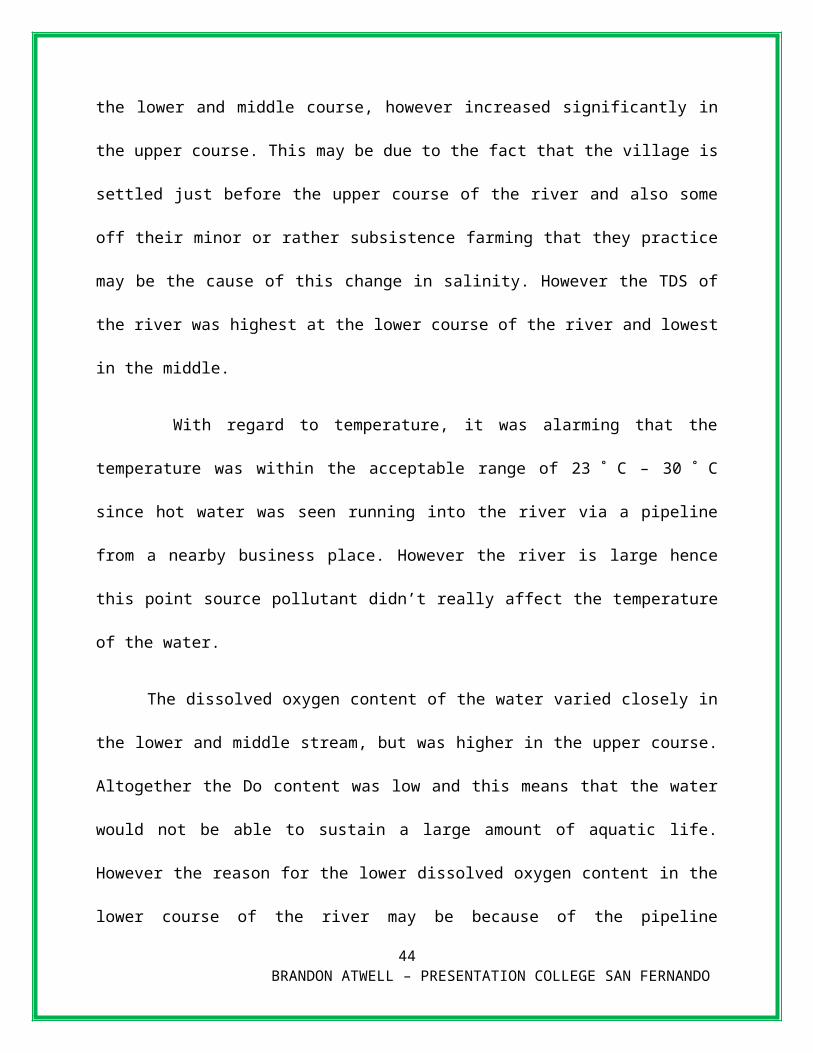
of the River varied closely in the lower and middle course, however increased significantly in the
upper course. This may be due to the fact that the village is settled just before the upper course of
the river and also some off their minor or rather subsistence farming that they practice may be
29 BRANDON ATWELL – PRESENTATION COLLEGE SAN FERNANDO
the cause of this change in salinity. However the TDS of the river was highest at the lower
course of the river and lowest in the middle.
With regard to temperature, it was alarming that the temperature was within the acceptable
range of 23 N C – 30 N C since hot water was seen running into the river via a pipeline from a
nearby business place. However the river is large hence this point source pollutant didn’t really
affect the temperature of the water.
The dissolved oxygen content of the water varied closely in the lower and middle stream, but
was higher in the upper course. Altogether the Do content was low and this means that the water
would not be able to sustain a large amount of aquatic life. However the reason for the lower
dissolved oxygen content in the lower course of the river may be because of the pipeline
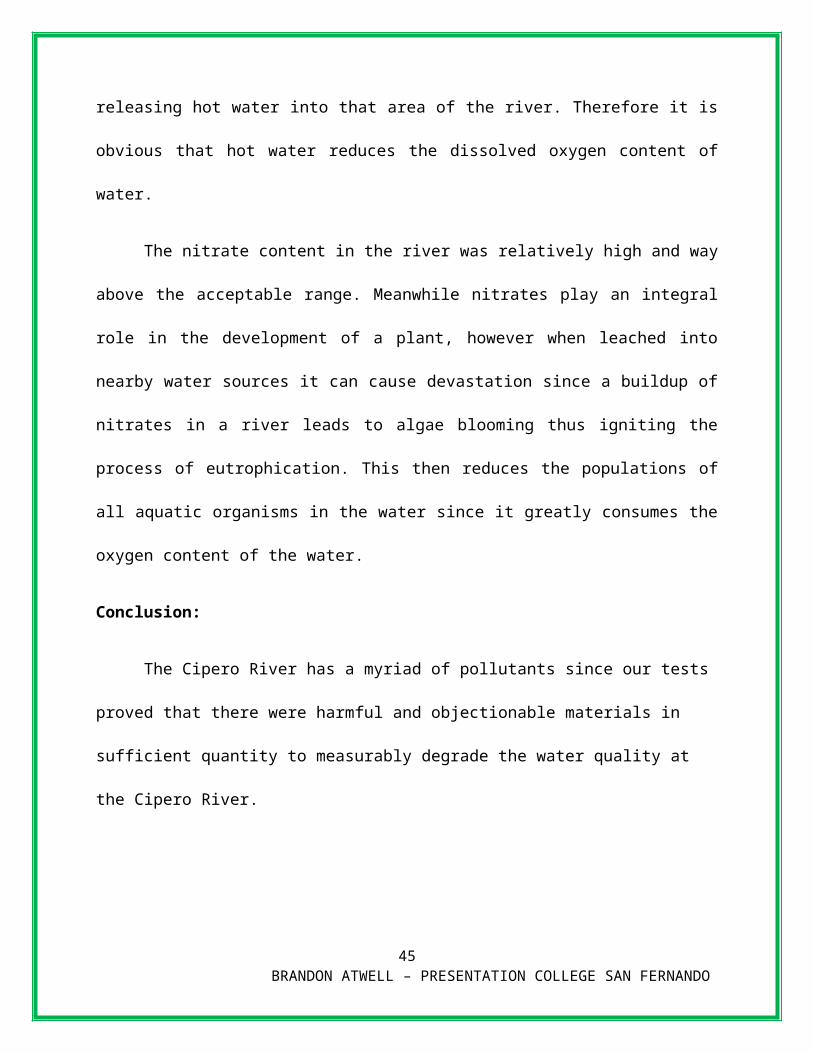
releasing hot water into that area of the river. Therefore it is obvious that hot water reduces the
dissolved oxygen content of water.
The nitrate content in the river was relatively high and way above the acceptable range.
Meanwhile nitrates play an integral role in the development of a plant, however when leached
into nearby water sources it can cause devastation since a buildup of nitrates in a river leads to
algae blooming thus igniting the process of eutrophication. This then reduces the populations of
all aquatic organisms in the water since it greatly consumes the oxygen content of the water.
Conclusion:
The Cipero River has a myriad of pollutants since our tests proved that there were harmful
and objectionable materials in sufficient quantity to measurably degrade the water quality at the
Cipero River.
30 BRANDON ATWELL – PRESENTATION COLLEGE SAN FERNANDO
Date: 20/10/11
Lab no: 2
Title: Agricultural and Water Pollution in the Southern region of Trinidad
Aim: To test for the presence of pollutants in the Guaracara River using digital meters and
scientific kits.
Materials:
1. YSI 55 dissolved oxygen, temperature, salinity, pH, Nitrates, TDS and conductivity
meter.
2. LaMotte Colorimeter
3. Meter
4. YSI 63 pH and Temperature
31 BRANDON ATWELL – PRESENTATION COLLEGE SAN FERNANDO

5. Glass Canister
Procedure:
1. The probe was removed from the YSI casing and then lowered into the water.
2. Readings of dissolved oxygen concentration and temperature was taken from the three
samples from the lower course.
3. Steps one and two were repeated when testing for the dissolved oxygen concentration and
temperature of the middle and upper course of the river.
4. The probe was then pulled up, washed with distilled water and replaced.
5. The YSI 63 probe was removed from the casing, and then lowered into the water.
6. Readings of pH, Salinity, Conductivity and TDS was taken from the three samples from
the lower course.
7. Steps five and six were repeated when testing for the pH, Salinity, Conductivity and TDS
of the middle and upper course of the river.
8. The probe was then raised, washed with distilled water and replaced.
9. Three samples of water were taken from the lower course of the river and were later
placed in glass canisters where it was tested for nitrates using the colorimeter.
10. Step nine was repeated for the middle and upper course of the river.
Data Collection/ Results:
Test Sample
1
Sample
2
Sample
3
Total
Average
International
Standard
Ph 7 9 8 8 6.5 – 9.0
32 BRANDON ATWELL – PRESENTATION COLLEGE SAN FERNANDO
Conductivity(U.S) 199 201 200 200 Below 1500 - 1800
Temperature (◦C) 23.9 23.9 23.9 23.9 23 – 30
Salinity (ppm) 600 599 601 600 500
TDS (ppt) 1109 1110 1111 1110 Below 1000 - 1200
Dissolve Oxygen (ppm) 6.04 6.06 6.05 6.05 At 24◦C 8.3
Nitrates (ppm) 1.2 1.2 0.9 1.1 Under 1ml/l
TABLE 1 ABOVE SHOWING THE RESULTS FOR THE LOWER COURSE OF THE RIVER
Test Sample
1
Sample
2
Sample
3
Total
Average
International
Standard
pH 8.4 8.3 8.2 8.3 6.5 – 9.0
Conductivity(U.S) 221.7 221.9 221.8 221.8 Below 1500 - 1800
Temperature (◦C) 25 24 26 25 23 – 30
Salinity (ppm) 539 541 540 540 500
TDS (ppt) 1324.7 1324.9 1324.8 1324.8 Below 1000 - 1200
Dissolve Oxygen (ppm) 5.21 5.19 5.20 5.20 At 25◦C 8.3
Nitrates (ppm) 1.2 1.4 1.3 1.3 Under 1ml/l
TABLE 2 ABOVE SHOWING THE RESULTS FOR THE MIDDLE COURSE OF THE RIVER
Test Sample
1
Sample
2
Sample
3
Total
Average
International
Standard
33 BRANDON ATWELL – PRESENTATION COLLEGE SAN FERNANDO

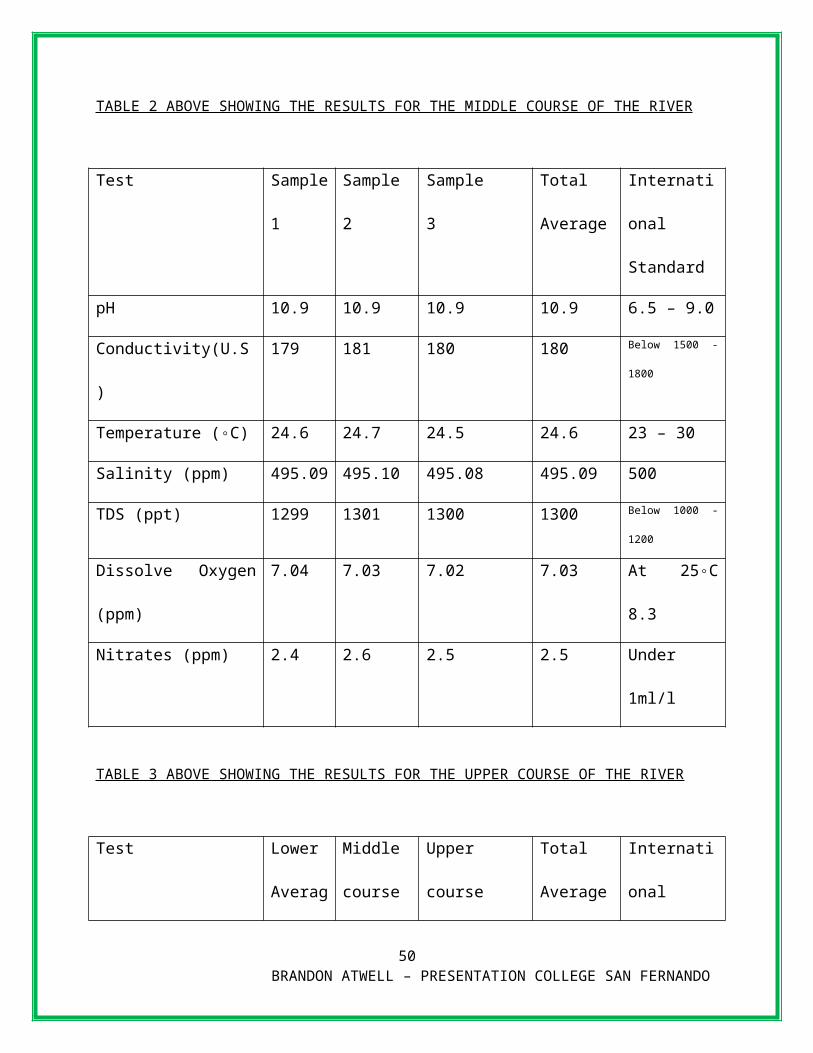
pH 10.9 10.9 10.9 10.9 6.5 – 9.0
Conductivity(U.S) 179 181 180 180 Below 1500 - 1800
Temperature (◦C) 24.6 24.7 24.5 24.6 23 – 30
Salinity (ppm) 495.09 495.10 495.08 495.09 500
TDS (ppt) 1299 1301 1300 1300 Below 1000 - 1200
Dissolve Oxygen (ppm) 7.04 7.03 7.02 7.03 At 25◦C 8.3
Nitrates (ppm) 2.4 2.6 2.5 2.5 Under 1ml/l
TABLE 3 ABOVE SHOWING THE RESULTS FOR THE UPPER COURSE OF THE RIVER
Test Lower
Average
Middle
course
Average
Upper course
Average
Total
Average
International
Standard
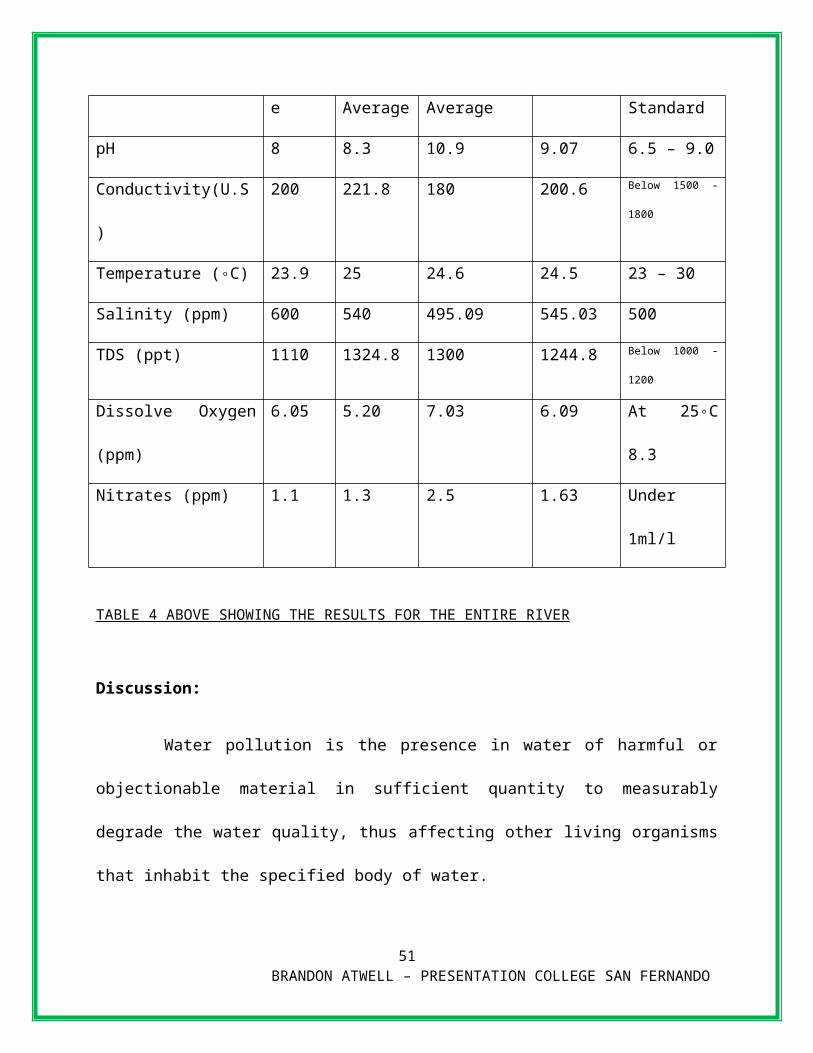
pH 8 8.3 10.9 9.07 6.5 – 9.0
Conductivity(U.S) 200 221.8 180 200.6 Below 1500 - 1800
Temperature (◦C) 23.9 25 24.6 24.5 23 – 30
Salinity (ppm) 600 540 495.09 545.03 500
TDS (ppt) 1110 1324.8 1300 1244.8 Below 1000 - 1200
Dissolve Oxygen (ppm) 6.05 5.20 7.03 6.09 At 25◦C 8.3
Nitrates (ppm) 1.1 1.3 2.5 1.63 Under 1ml/l
TABLE 4 ABOVE SHOWING THE RESULTS FOR THE ENTIRE RIVER
Discussion:
34 BRANDON ATWELL – PRESENTATION COLLEGE SAN FERNANDO
Water pollution is the presence in water of harmful or objectionable material in sufficient
quantity to measurably degrade the water quality, thus affecting other living organisms that
inhabit the specified body of water.
Meanwhile, as seen in the table before, almost all the scientific values (except conductivity
and temperature), of pH, salinity, total dissolved substances, dissolved oxygen and nitrates are
most definitely not within or below the acceptable range. Therefore it is a fact to conclude that
the river is polluted or rather highly polluted as these scientific values show. Altogether, these
distasteful results were obtained mainly because of the various activities that occur in close
proximity of the river.
With regard to the pH of the river water, the acceptable international standard is 6.5 – 8.5.
However as seen by the results, the pH of the river was not always above the acceptable range. It
varied closely in the middle and lower courses of the River and stayed within the acceptable
range; however it drastically increased above the acceptable range in the upper course thus the
average reading of pH in the river was above the acceptable international standards. This high
pH may have been as a result of the running of pollutants into the river from nearby business
places and the fact that there is a refinery bordering the river close to the upper course.
Subsequently, the conductivity in the Guaracara River was one of the two factors that adhered
to the acceptable international standards. Its levels fluctuated throughout the three courses of the
river but nevertheless the conductivity was still satisfactory.
Furthermore, the Salinity and TDS results were both above the acceptable range. The Salinity
of the River decreased up the river since the lower course was the highest followed by the middle
course and then finally the upper course. This may be due to the fact that the village is settled
35 BRANDON ATWELL – PRESENTATION COLLEGE SAN FERNANDO

just before the lower course of the river and also some off their minor or rather subsistence
farming that they practice may be the cause of this change in salinity. However the TDS of the
river was highest at the middle course of the river and lowest in the lower course.
With regard to temperature, it was alarming that the temperature was within the acceptable
range of 23 N C– 30 N C since hot water was seen running into the river via a pipeline from the
nearby refinery. However the river is large hence this point source pollutant didn’t really affect
the temperature of the water.
The dissolved oxygen content of the water fluctuated throughout the three courses of the
river. Altogether the Do content was low and this means that the water would not be able to
sustain a large amount of aquatic life. However although the refinery was releasing hot water
near the upper course of the river, the dissolved oxygen content was still highest there.
The nitrate content in the river was relatively high and above the acceptable range.
Meanwhile nitrates play an integral role in the development of a plant, however when leached
into nearby water sources it can cause devastation since a buildup of nitrates in a river leads to
algae blooming thus igniting the process of eutrophication. This then reduces the populations of
all aquatic organisms in the water since it greatly consumes the oxygen content of the water.
Conclusion:
The Guaracara River has a myriad of pollutants since our tests proved that there were harmful
and objectionable materials in sufficient quantity to measurably degrade the water quality at the
Guaracara River.
36 BRANDON ATWELL – PRESENTATION COLLEGE SAN FERNANDO
Date: 27/10/11
Lab no: 3
Title: Agricultural and Water Pollution in the Southern region of Trinidad
Aim: To test for the presence of pollutants in the Godineau River using digital meters and
scientific kits.
Materials:
1. YSI 55 dissolved oxygen, temperature, salinity, pH, Nitrates, TDS and conductivity
meter.
2. LaMotte Colorimeter
3. Meter
4. YSI 63 pH and Temperature
5. Glass Canister
37 BRANDON ATWELL – PRESENTATION COLLEGE SAN FERNANDO

Procedure:
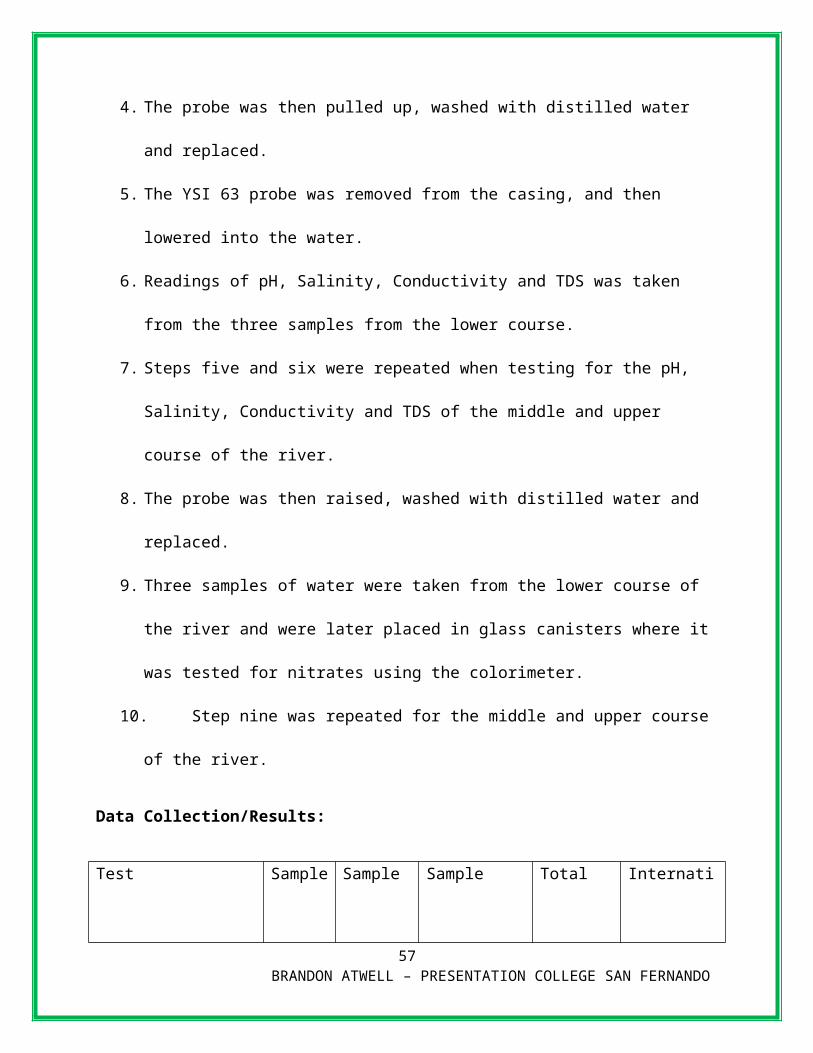
1. The probe was removed from the YSI casing and then lowered into the water.
2. Readings of dissolved oxygen concentration and temperature was taken from the three
samples from the lower course.
3. Steps one and two were repeated when testing for the dissolved oxygen concentration and
temperature of the middle and upper course of the river.
4. The probe was then pulled up, washed with distilled water and replaced.
5. The YSI 63 probe was removed from the casing, and then lowered into the water.
6. Readings of pH, Salinity, Conductivity and TDS was taken from the three samples from
the lower course.
7. Steps five and six were repeated when testing for the pH, Salinity, Conductivity and TDS
of the middle and upper course of the river.
8. The probe was then raised, washed with distilled water and replaced.
9. Three samples of water were taken from the lower course of the river and were later
placed in glass canisters where it was tested for nitrates using the colorimeter.
10. Step nine was repeated for the middle and upper course of the river.
Data Collection/Results:
Test Sample
1
Sample
2
Sample
3
Total
Average
International
Standard
Ph 7.1 7.2 7.0 7.1 6.5 – 9.0
Conductivity(U.S) 601 600 599 600 Below 1500 - 1800
Temperature (◦C) 25.4 25.3 25.5 25.4 23 – 30
38 BRANDON ATWELL – PRESENTATION COLLEGE SAN FERNANDO
Salinity (ppm) 469 470 471 470 500
TDS (ppt) 1000.33 1000.35 1000.34 1000.34 Below 1000 - 1200
Dissolve Oxygen (ppm) 9 9 9 9 At 25◦C 8.3
Nitrates (ppm) 0.1 0.1 0.1 0.1 Under 1ml/l
TABLE 1 ABOVE SHOWING THE RESULTS FOR THE LOWER COURSE OF THE RIVER
Test Sample
1
Sample
2
Sample
3
Total
Average
International
Standard
pH 7.10 7.09 7.08 7.09 6.5 – 9.0
Conductivity(U.S) 640 639 641 640 Below 1500 - 1800
Temperature (◦C) 23.6 23.8 23.7 23.7 23 – 30
Salinity (ppm) 442 443 441 442 500
TDS (ppt) 900.6 900.5 900.4 900.5 Below 1000 - 1200
Dissolve Oxygen (ppm) 8.6 8.8 8.7 8.7 At 24◦C 8.3
Nitrates (ppm) 0.3 0.4 0.2 0.3 Under 1ml/l
TABLE 2 ABOVE SHOWING THE RESULTS FOR THE MIDDLE COURSE OF THE RIVER
Test Sample
1
Sample
2
Sample
3
Total
Average
International
Standard
pH 7.9 8.1 8.0 8.0 6.5 – 9.0
Conductivity(U.S) 699.5 699.3 699.4 699.4 Below 1500 - 1800
39 BRANDON ATWELL – PRESENTATION COLLEGE SAN FERNANDO
Temperature (◦C) 23.9 23.9 23.9 23.9 23 – 30
Salinity (ppm) 498.5 498.3 498.4 498.4 500
TDS (ppt) 1099 1101 1100 1100 Below 1000 - 1200
Dissolve Oxygen (ppm) 8.03 8.02 8.04 8.03 At 24◦C 8.3
Nitrates (ppm) 0 0 0 0 Under 1ml/l
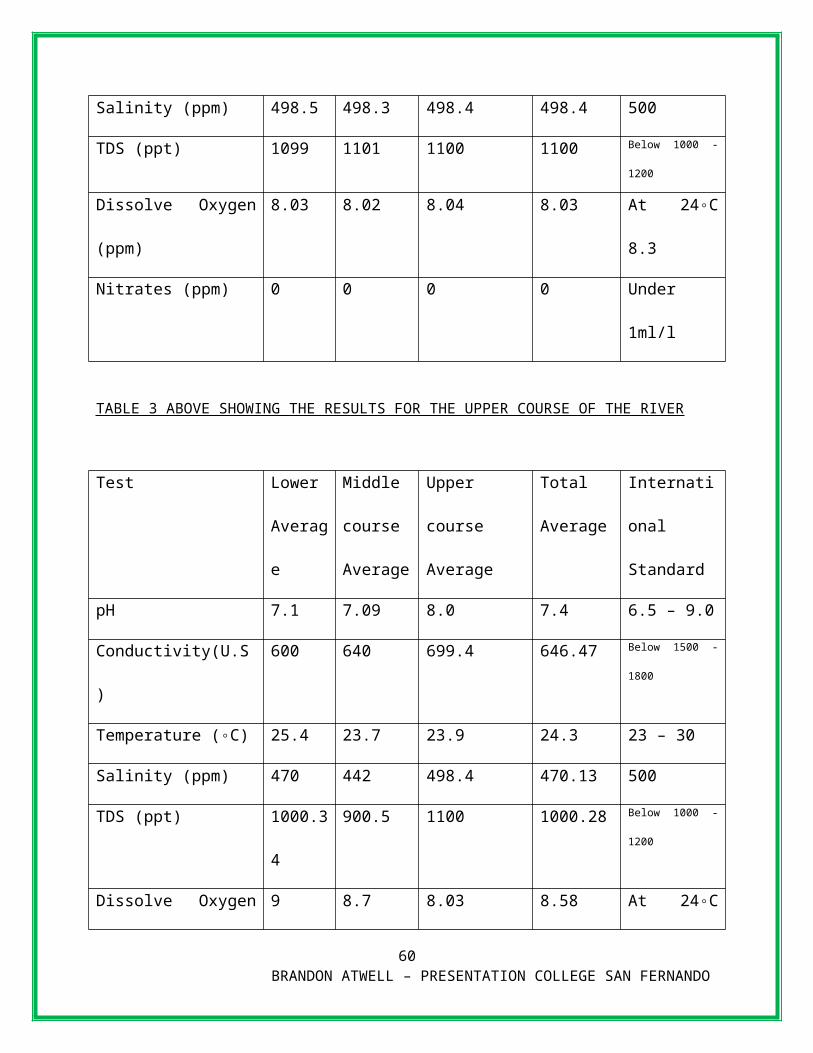
TABLE 3 ABOVE SHOWING THE RESULTS FOR THE UPPER COURSE OF THE RIVER
Test Lower
Average
Middle
course
Average
Upper course
Average
Total
Average
International
Standard
pH 7.1 7.09 8.0 7.4 6.5 – 9.0
Conductivity(U.S) 600 640 699.4 646.47 Below 1500 - 1800
Temperature (◦C) 25.4 23.7 23.9 24.3 23 – 30
Salinity (ppm) 470 442 498.4 470.13 500
TDS (ppt) 1000.34 900.5 1100 1000.28 Below 1000 - 1200
Dissolve Oxygen (ppm) 9 8.7 8.03 8.58 At 24◦C 8.3
Nitrates (ppm) 0.1 0.3 0 0.13 Under 1ml/l
TABLE 4 ABOVE THE SHOWING RESULTS FOR THE ENTIRE RIVER
Discussion:
40 BRANDON ATWELL – PRESENTATION COLLEGE SAN FERNANDO
Water pollution is the presence in water of harmful or objectionable material in sufficient
quantity to measurably degrade the water quality, thus affecting other living organisms that
inhabit the specified body of water.
Meanwhile, as seen in the table before, all the scientific values, of pH, temperature, salinity,
total dissolved substances, conductivity, dissolved oxygen and nitrates are most definitely within
or below the acceptable range. Therefore it is a fact to conclude that the river is not polluted as
these scientific values show. Altogether, these excellent results were obtained mainly because the
activities that are done in close proximity to the river are not very harmful.
In terms of the pH of the Godineau River, the readings were below the acceptable
international standards of 6.5 – 8.5. The pH of the river varied closely but increased up the
course of the river since the upper course of the river had the highest pH. However the pollutants
from the fishing boats may have caused this slight increase in pH since the majority of fishing
activities occurs in the upper course of the Godineau River.
Subsequently, the conductivity of the river was below the acceptable international standards.
However the conductivity increased up the course of the river mainly because the upper course
of the river suffered more impurities than the other courses of the river. For example the
conductivity of the lower course was 600US whilst the upper course had a reading of 699.4US.
Similarly, the temperature, salinity and TDS of the river were all within the international
standards. The temperature of the river varied slightly with the lower course of the river having
the highest recorded temperature. With regard to the salinity of the river an average reading of
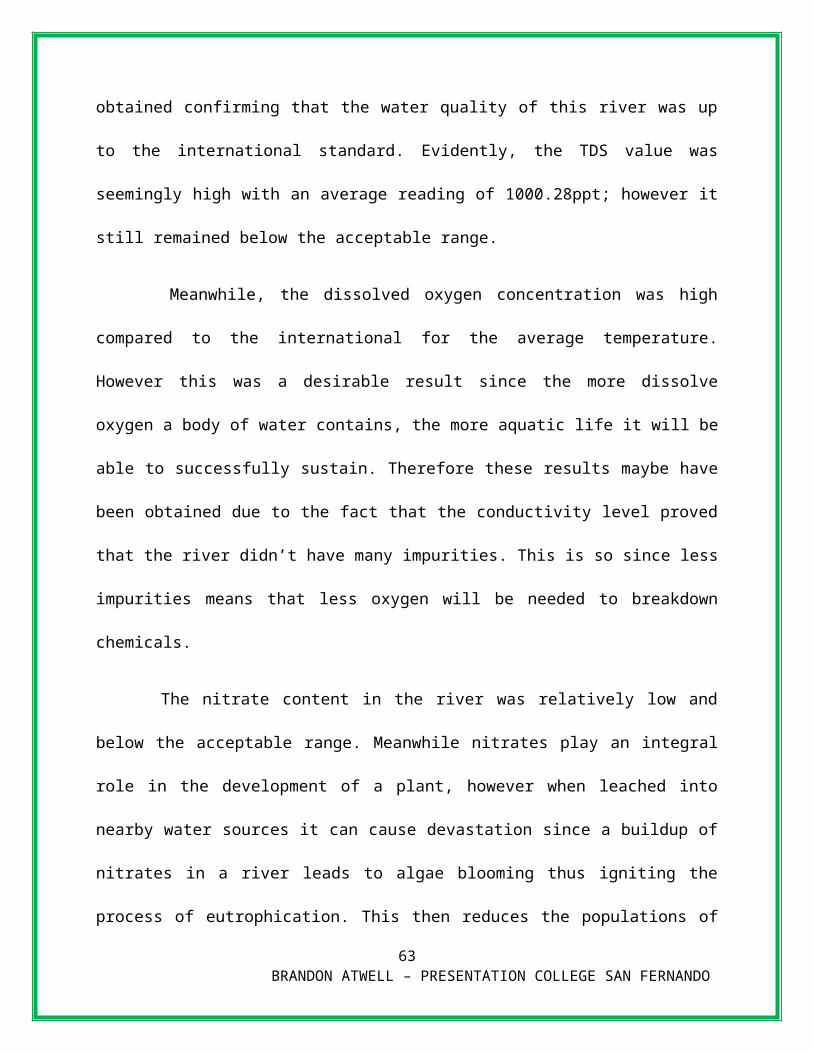
470.13ppt was obtained confirming that the water quality of this river was up to the international
41 BRANDON ATWELL – PRESENTATION COLLEGE SAN FERNANDO
standard. Evidently, the TDS value was seemingly high with an average reading of 1000.28ppt;
however it still remained below the acceptable range.
Meanwhile, the dissolved oxygen concentration was high compared to the international for
the average temperature. However this was a desirable result since the more dissolve oxygen a
body of water contains, the more aquatic life it will be able to successfully sustain. Therefore
these results maybe have been obtained due to the fact that the conductivity level proved that the
river didn’t have many impurities. This is so since less impurities means that less oxygen will be
needed to breakdown chemicals.
The nitrate content in the river was relatively low and below the acceptable range. Meanwhile
nitrates play an integral role in the development of a plant, however when leached into nearby
water sources it can cause devastation since a buildup of nitrates in a river leads to algae
blooming thus igniting the process of eutrophication. This then reduces the populations of all
aquatic organisms in the water since it greatly consumes the oxygen content of the water.
Nevertheless, this was not the case in the Godineau River.
Conclusion:
The Godineau River has little or no pollutants since our tests proved that there were no
harmful and objectionable materials in sufficient quantity to measurably degrade the water
quality at the Godineau River.
42 BRANDON ATWELL – PRESENTATION COLLEGE SAN FERNANDO
Date: 04/11/11
Lab no: 4
Title: Agricultural and Water Pollution in the Northern region of Trinidad
Aim: To test for the presence of pollutants in the Caroni River using digital meters and scientific
kits.
Materials:
1. YSI 55 dissolved oxygen, temperature, salinity, pH, Nitrates, TDS and conductivity
meter.
2. LaMotte Colorimeter
3. Meter
4. YSI 63 pH and Temperature
5. Glass Canister
Procedure:
43 BRANDON ATWELL – PRESENTATION COLLEGE SAN FERNANDO
1. The probe was removed from the YSI casing and then lowered into the water.
2. Readings of dissolved oxygen concentration and temperature was taken from the three
samples from the lower course.
3. Steps one and two were repeated when testing for the dissolved oxygen concentration and
temperature of the middle and upper course of the river.
4. The probe was then pulled up, washed with distilled water and replaced.
5. The YSI 63 probe was removed from the casing, and then lowered into the water.
6. Readings of pH, Salinity, Conductivity and TDS was taken from the three samples from
the lower course.
7. Steps five and six were repeated when testing for the pH, Salinity, Conductivity and TDS
of the middle and upper course of the river.
8. The probe was then raised, washed with distilled water and replaced.
9. Three samples of water were taken from the lower course of the river and were later
placed in glass canisters where it was tested for nitrates using the colorimeter.
10. Step nine was repeated for the middle and upper course of the river.
Data Collection/Results:
Test Sample
1
Sample
2
Sample
3
Total
Average
International
Standard
pH 7.16 7.17 7.18 7.17 6.5 – 9.0
Conductivity(U.S) 260 259 261 260 Below 1500 – 1800
Temperature (◦C) 29 28 27 28 23 – 30
Salinity (ppm) 130 129 131 130 500
TDS (ppt) 178 180 179 179 Below 1000 – 1200
44 BRANDON ATWELL – PRESENTATION COLLEGE SAN FERNANDO
Dissolve Oxygen (ppm) 7.81 7.80 7.79 7.80 At 28◦C 8.0
Nitrates (ppm) 0.10 0.09 0.08 0.09 Under 1ml/l
TABLE 1 ABOVE SHOWING THE RESULTS FOR THE LOWER COURSE OF THE RIVER
Test Sample
1
Sample
2
Sample
3
Total
Average
International
Standard
pH 6.30 6.29 6.31 6.30 6.5 – 9.0
Conductivity(U.S) 289 290 291 290 Below 1500 – 1800
Temperature (◦C) 25.3 25.5 25.4 25.4 23 – 30
Salinity (ppm) 139 141 140 140 500
TDS (ppt) 195 196 194 195 Below 1000 – 1200
Dissolve Oxygen (ppm) 7.18 7.19 7.20 7.19 At 25◦C 8.3
Nitrates (ppm) 0.08 0.07 0.06 0.07 Under 1ml/l
TABLE 2 ABOVE SHOWING THE RESULTS FOR THE MIDDLE COURSE OF THE RIVER
Test Sample
1
Sample
2
Sample
3
Total
Average
International
Standard
pH 7.6 7.5 7.7 7.6 6.5 – 9.0
Conductivity(U.S) 292 291 293 292 Below 1500 – 1800
45 BRANDON ATWELL – PRESENTATION COLLEGE SAN FERNANDO

Temperature (◦C) 25.3 25.5 25.4 25.4 23 – 30
Salinity (ppm) 143 145 144 144 500
TDS (ppt) 196 195 197 196 Below 1000 – 1200
Dissolve Oxygen (ppm) 8.24 8.23 8.25 8.24 At 25◦C 8.3
Nitrates (ppm) 0.3 0.2 0.1 0.2 Under 1ml/l
TABLE 3 ABOVE SHOWING THE RESULTS FOR THE UPPER COURSE OF THE RIVER
Test Lower
Average
Middle
course
Average
Upper course
Average
Total
Average
International
Standard
pH 7.17 6.30 7.6 7.02 6.5 – 9.0
Conductivity(U.S) 260 290 292 280.67 Below 1500 – 1800
Temperature (◦C) 28 25.4 25.4 26.27 23 – 30
Salinity (ppm) 130 140 144 138 500
TDS (ppt) 179 195 196 190 Below 1000 – 1200
Dissolve Oxygen (ppm) 7.80 7.19 8.24 7.74 At 26◦C 8.3
Nitrates (ppm) 0.09 0.07 0.2 0.12 Under 1ml/l
TABLE 4 ABOVE SHOWING THE RESULTS FOR THE ENITRE RIVER
Discussion:
46 BRANDON ATWELL – PRESENTATION COLLEGE SAN FERNANDO

Water pollution is the presence in water of harmful or objectionable material in sufficient
quantity to measurably degrade the water quality, thus affecting other living organisms that
inhabit the specified body of water.
Meanwhile, as seen in the table before, all the scientific values, of pH, temperature, salinity,
total dissolved substances, conductivity, dissolved oxygen and nitrates are most definitely within
or below the acceptable range. Therefore it is a fact to conclude that the river is not polluted as
these scientific values show. Altogether, these excellent results were obtained mainly because the
activities that are done in close proximity to the river are not very harmful.
In terms of the pH of the Caroni River, the readings were below the acceptable international
standards of 6.5 – 8.5. The pH of the river fluctuated since there was a decrease in pH from the
lower to middle stream and then an increase from the middle stream to the upper stream.
However it was noted that the average pH of the Caroni River was 7.02 and the pH of pure water
is 7.0. Therefore the average pH of the river is very close to the pH of pure water meaning that
this river will successfully sustain some aquatic life since it’s a fact that some organisms require
a specific pH for reproduction to take place.
Subsequently, the conductivity of the river was below the acceptable international standards.
However the conductivity increased up the course of the river mainly because the upper course
of the river suffered more impurities than the other courses of the river. For example the
conductivity of the lower course was 260US whilst the upper course had a reading of 292US.
Similarly, the temperature, salinity and TDS of the river were all within the international
standards. The temperature of the river varied slightly with the lower course of the river having
the highest recorded temperature and both the middle and upper course having the same
47 BRANDON ATWELL – PRESENTATION COLLEGE SAN FERNANDO

temperature. With regard to the salinity of the river an average reading of 138ppm was obtained
confirming that the water quality of this river was up to the international standard. Evidently, the
TDS value was relatively low with an average reading of 190ppt.
Meanwhile, the dissolved oxygen concentration was below the acceptable international range
and varied slightly since the upper course was somewhat higher than both the lower and middle
course of the river. However low dissolved oxygen content in this case means that the dissolved
oxygen was used to breakdown the chemicals in the water since this is one function of dissolved
oxygen in water.
The nitrate content in the river was relatively low and below the acceptable range. Meanwhile
nitrates play an integral role in the development of a plant, however when leached into nearby
water sources it can cause devastation since a buildup of nitrates in a river leads to algae
blooming thus igniting the process of eutrophication. This then reduces the populations of all
aquatic organisms in the water since it greatly consumes the oxygen content of the water.
Nevertheless, this was not the case in the Caroni River.
Conclusion:
The Caroni River has little or no pollutants since our tests proved that there were no harmful
and objectionable materials in sufficient quantity to measurably degrade the water quality at the
Caroni River.
48 BRANDON ATWELL – PRESENTATION COLLEGE SAN FERNANDO

Date: 11/11/11
Lab no: 5
Title: Agricultural and Water Pollution in the Southern region of Trinidad
Aim: To test for the presence of pollutants in the Ortoire River using digital meters and scientific
kits.
Materials:
1. YSI 55 dissolved oxygen, temperature, salinity, pH, Nitrates, TDS and conductivity
meter.
2. LaMotte Colorimeter
3. Meter
4. YSI 63 pH and Temperature
5. Glass Canister
Procedure:
49 BRANDON ATWELL – PRESENTATION COLLEGE SAN FERNANDO
1. The probe was removed from the YSI casing and then lowered into the water.
2. Readings of dissolved oxygen concentration and temperature was taken from the three
samples from the lower course.
3. Steps one and two were repeated when testing for the dissolved oxygen concentration and
temperature of the middle and upper course of the river.
4. The probe was then pulled up, washed with distilled water and replaced.
5. The YSI 63 probe was removed from the casing, and then lowered into the water.
6. Readings of pH, Salinity, Conductivity and TDS was taken from the three samples from
the lower course.
7. Steps five and six were repeated when testing for the pH, Salinity, Conductivity and TDS
of the middle and upper course of the river.
8. The probe was then raised, washed with distilled water and replaced.
9. Three samples of water were taken from the lower course of the river and were later
placed in glass canisters where it was tested for nitrates using the colorimeter.
10. Step nine was repeated for the middle and upper course of the river.
Data Collection/ Results:
Test Sample
1
Sample
2
Sample
3
Total
Average
International
Standard
pH 7.80 7.79 7.81 7.80 6.5 – 9.0
Conductivity(U.S) 6503.53 6503.54 6503.55 6503.54 Below 1500 - 1800
Temperature (◦C) 29 29 29 29 23 – 30
Salinity (ppm) 4000 4001 3999 4000 500
TDS (ppt) 5500 5501 5499 5500 Below 1000 - 1200
50 BRANDON ATWELL – PRESENTATION COLLEGE SAN FERNANDO
Dissolve Oxygen (ppm) 16.12 16.13 16.14 16.13 At 29◦C 7.7
Nitrates (ppm) 0 0 0 0 Under 1ml/l
TABLE 1 ABOVE SHOWING THE RESULTS FOR THE LOWER COURSE OF THE RIVER
Test Sample
1
Sample
2
Sample
3
Total
Average
International
Standard
pH 7.6 7.8 7.7 7.7 6.5 – 9.0
Conductivity(U.S) 240.3 240.4 240.2 240.3 Below 1500 – 1800
Temperature (◦C) 29.4 29.3 29.2 29.3 23 – 30
Salinity (ppm) 111 109 110 110 500
TDS (ppt) 171 170 169 170 Below 1000 – 1200
Dissolve Oxygen (ppm) 9.9 9.9 9.9 9.9 At 29◦C 7.7
Nitrates (ppm) 0.2 0.3 0.1 0.2 Under 1ml/l
TABLE 2 ABOVE SHOWING THE RESULTS FOR THE MIDDLE COURSE OF THE RIVER
Test Lower
Average
Middle
course
Average
Upper course
Average
Total
Average
International
Standard
pH 7.80 7.7 ---- 7.75 6.5 – 9.0
Conductivity(U.S) 6503.54 240.3 ---- 3371.92 Below 1500 - 1800
51 BRANDON ATWELL – PRESENTATION COLLEGE SAN FERNANDO
Temperature (◦C) 29 29.3 ---- 29.15 23 – 30
Salinity (ppm) 4000 110 ---- 2055 500
TDS (ppt) 5500 170 ---- 2835 Below 1000 - 1200
Dissolve Oxygen (ppm) 16.13 9.9 ---- 13.01 At 29◦C 7.7
Nitrates (ppm) 0 0.2 ---- 0.1 Under 1ml/l
TABLE 3 ABOVE SHOWING THE RESULTS FOR THE ENTIRE RIVER
N:B – The reason why there isn’t any results for the upper course of the river is because
the upper course of the river was inaccessible via road and the only way we could have
gotten there was by boat and as school students we weren’t allowed to do so.
Discussion:
Water pollution is the presence in water of harmful or objectionable material in sufficient
quantity to measurably degrade the water quality, thus affecting other living organisms that
inhabit the specified body of water.
Meanwhile, as seen in the table before, all the scientific values, of pH, temperature, salinity,
total dissolved substances, conductivity, dissolved oxygen and nitrates are most definitely within
or below the acceptable range. Therefore it is a fact to conclude that the river is not polluted as
these scientific values show. Altogether, these excellent results were obtained mainly because the
activities that are done in close proximity to the river are not very harmful.
In terms of the pH of the Ortoire River, the readings were below the acceptable international
standards of 6.5 – 8.5. The pH of the river varied very closely in the lower and middle courses.
52 BRANDON ATWELL – PRESENTATION COLLEGE SAN FERNANDO

However it was noted that the average pH of the Ortoire River was 7.75 and the pH of pure water
is 7.0. Therefore the average pH of the river is close to the pH of pure water meaning that this
river will successfully sustain some aquatic life since it’s a fact that some organisms require a
specific pH for reproduction to take place.
Subsequently, the conductivity of the river was above the acceptable international standards.
However the conductivity decreased dramatically from the lower course to middle the course of
the river mainly because the lower course of the river suffered more impurities than the other
courses of the river. For example the conductivity of the lower course was 6503.54US whilst the
upper course had a reading of 240.3US. Moreover the reason for this drastic difference is solely
because the river water merges with the sea water at the lower course of the river resulting in
more impurities being present in this part of the river. Therefore since the middle course of the
river’s conductivity was so low under the acceptable level then it was safe to say that the river
could support fresh water aquatic life but only up to a certain point in the river.
Similarly, the temperature, salinity and TDS of the river were all within the international
standards. The temperature of the river varied slightly with the middle course of the river having
the highest recorded temperature. With regard to the salinity the lower course was much higher
than the acceptable standards however again this was due to the fact that the tests were taken in
the lower course of the river where the river water merges with the sea water. Additionally, this
was also the case with the TDS.
Meanwhile, the dissolved oxygen concentration was high compared to the international for
the average temperature. However this was a desirable result since the more dissolve oxygen a
body of water contains, the more aquatic life it will be able to successfully sustain
53 BRANDON ATWELL – PRESENTATION COLLEGE SAN FERNANDO
The nitrate content in the river was relatively low and below the acceptable range. Meanwhile
nitrates play an integral role in the development of a plant, however when leached into nearby
water sources it can cause devastation since a buildup of nitrates in a river leads to algae
blooming thus igniting the process of eutrophication. This then reduces the populations of all
aquatic organisms in the water since it greatly consumes the oxygen content of the water.
Nevertheless, this was not the case in the Ortoire River.
Conclusion:
The Ortoire River has little or no pollutants since our tests proved that there were no harmful
and objectionable materials in sufficient quantity to measurably degrade the water quality at the
Ortoire River.
54 BRANDON ATWELL – PRESENTATION COLLEGE SAN FERNANDO

Journal report
The topic chosen for this journal report is the factors that affect the water quality of Rivers in
Trinidad. Water pollution is the presence in water of harmful or objectionable material in
sufficient quantity to measurably degrade the water quality, thus affecting other living organisms
that inhabit the specified body of water.
The purpose of this project is to allow one to become conscious of the factors that affect the
quality of the river water that surrounds them and also the harms in which a polluted river can
cause to its aquatic life and even us the humans that may use it domestically or recreationally.
This project also intends to spark the enthusiasm of us, the students, to become knowledgeable
about what we can do as citizens of Trinidad to assist in the diminution of water pollution.55
BRANDON ATWELL – PRESENTATION COLLEGE SAN FERNANDO

The variables present in this project are the Rivers that will be focused on is the Cipero
River, Guaracara River, Godineau River, Caroni River and the Ortoire River. Additionally, the
factors that affect water quality that will be focused on in this projects are as followed; pH,
Conductivity, Temperature, Salinity, Total Dissolved Substances, Dissolved Oxygen and
Nitrates.
The methods of data collection that were used are as follows; site visits were used to conduct
various observations in and around the area of the Rivers and the use of digital meters and
scientific kits were used to test for the factors that affect the water quality of the Rivers.
A probe was lowered into the various Rivers to acquire the readings for both the Dissolved
oxygen content and the Temperature. Secondly, a YSI 63 probe was later used to obtain the
levels of pH, Salinity, conductivity and total dissolved solids in the water. Lastly, a LaMotte
colorimeter was used to acquire the amount of nitrates present in the water.
Of the fiver rivers that were tested, the upper, middle and lower courses of the rivers were
tested accept for the Ortoire river. Both the lower and middle courses were tested, but the upper
course was in accessible. The internet was used to obtain the acceptable international standards
for the various water pollutants and also information for the literature review.
56 BRANDON ATWELL – PRESENTATION COLLEGE SAN FERNANDO
1. The quality of the surface water resources of Trinidad in many places is deteriorating
due to high levels of suspended solids, organic matter, high bacteria counts and the
presence of chemical pollutants. The main causes are uncontrolled point source
discharges, in particular industrial (including mining) and domestic. The high erosion
rates in upstream area and the indiscriminate removal of vegetative cover contribute to
the high turbidity and suspended solids loads in certain watersheds. The increasing
pressure on the water resources due to population and socio-economic activities will
result in an even higher rate of pollution, if no corrective measures are instituted. (Phillip
H.W. 1998 “River water quality in Trinidad and Tobago”)
2. Domestic wastewater discharges continues to be a serious and chronic problem.
Discharged wastewater finds its way into the marine environment where it can have
negative public health effects, largely through its bacterial content. Solid wastes are
managed by sanitary land filling with minimal recycling. There is a serious potential
57 BRANDON ATWELL – PRESENTATION COLLEGE SAN FERNANDO

problem at the Beetham dump (Trinidad), situated close to the sea where seepage may be
transported to the coast via the adjoining wetlands. Agricultural and industrial pollution
are constant features of the economic development of the country. (Alexia C.R. 2009 “
Water Pollution in the northern range of Trinidad”)
3. There have been a number of reported fish kills in rivers of Trinidad and Tobago
attributed to the indiscriminate use of pesticides, fertilizers and domestic chemicals. In
Trinidad the rivers Maraval, St. Anns, Santa Cruz/San Juan, Caroni and Arima. (Bryon
E.R. 2010. “What are some factors that affect the water quality of Rivers in
Trinidad and Tobago?”)
4. Trinidad and Tobago has historically enjoyed good potable water quality. Increasing
pollution from sewage and industrial effluents combined with soil erosion and unmitigated
development are threatening the quality of potable water while increasing treatment cost. At
the same time, pollution can have significant implications for public health and natural
ecosystems. (Michelle S.I. 2007. “Importance of maintaining water quality”)
58 BRANDON ATWELL – PRESENTATION COLLEGE SAN FERNANDO
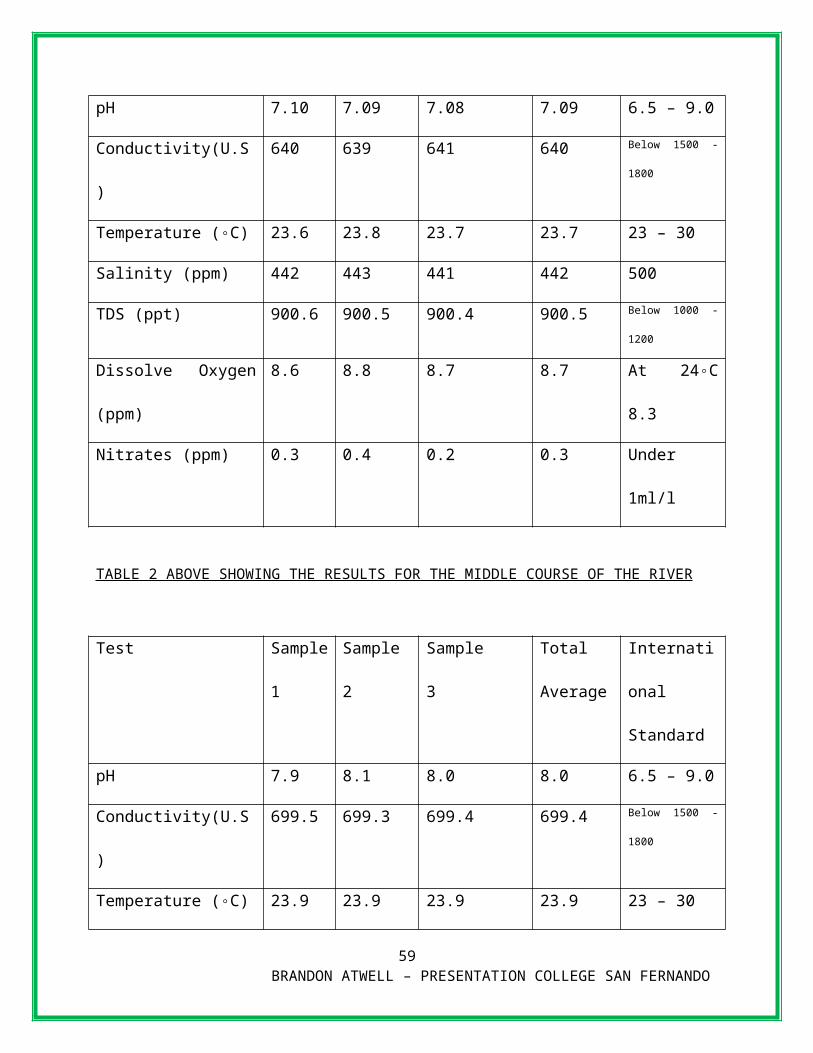
Figure 1: A colomn graph Showing the average pH of each River in comparison to the
international standard.
Cipero Guaracara Godineau Caroni Ortoire International Standard
0
2
4
6
8
10
12
59 BRANDON ATWELL – PRESENTATION COLLEGE SAN FERNANDO
The data showed the Cipero River had an average pH of 10.17, Guaracara = 9.07,
Godineau = 7.4, Caroni = 7.02, Ortoire = 7.75 and the maximum international standard of
pH = 9.0.
Figure 2: A bar graph showing the average conductivity of each River in comparison to the
international standard
Cipero
Guaracara
Godineau
Caroni
Ortoire
International Sandard
0 500 1000 1500 2000 2500 3000 3500
The data showed the Cipero River had an average conductivity of 350.6US, Guaracara =
200.6US, Godineau = 646.41US, Caroni = 280.67US, Ortoire = 3371.92US and the
maximum international standard of conductivity = 1800US.
60 BRANDON ATWELL – PRESENTATION COLLEGE SAN FERNANDO

Figure 3: A 3-D cone showing the average temperature of the entire Rivers in comparison to the
international standard.
0
5
10
15
20
25
30
61 BRANDON ATWELL – PRESENTATION COLLEGE SAN FERNANDO

The data showed the Cipero River had an average temperature of 24.6, Guaracara = 24.5 N
C, Godineau = 24.3 N C, Caroni = 26.27 N C, Ortoire = 29.15 N C and the maximum
international standard of Temperature = 30 N C.
Figure 4: A table Showing the average salinity of each River in comparison to the international
standard.
Name of River/ International Standard Average Salinity
Cipero621
Guaracara545.03
Godineau470.13
Caroni138
Ortoire2055
International Standard500
62 BRANDON ATWELL – PRESENTATION COLLEGE SAN FERNANDO
The data showed the Cipero River had an average salinity of 621ppm, Guaracara =
545.03ppm, Godineau = 470.13ppm, Caroni = 138ppm, Ortoire = 2055ppm and the
maximum international standard of salinity = 500ppm.
Figure 5: A table Showing the average TDS of each River in comparison to the international standard.
Name of River/ International Standard Average Total Dissolved Substances
Cipero 1421.6
Guaracara 1224.8
Godineau 1000.28
Caroni 190
Ortoire 2835
International Standard 1200
63 BRANDON ATWELL – PRESENTATION COLLEGE SAN FERNANDO

The data showed the Cipero River had an average TDS of 1421.6ppt, Guaracara =
1244.8ppt, Godineau = 100.28ppt, Caroni = 190ppt, Ortoire = 2835ppt and the maximum
international standard of TDS = 1200ppt
Figure 6: A table Showing the average Dissolved oxygen of each River in comparison to the
international standard.
Name of River/ International Standard Average Dissolved Oxygen
Cipero4.76
Guaracara6.09
Godineau8.58
Caroni7.74
Ortoire13.01
International Standard7.7
64 BRANDON ATWELL – PRESENTATION COLLEGE SAN FERNANDO
The data showed the Cipero River had an average Dissolved oxygen of 4.76ppm,
Guaracara = 6.09ppm, Godineau = 8.58ppm, Caroni = 7.74, Ortoire = 13.01ppm and the
maximum international standard of Dissolved oxygen = 7.7ppm
Figure 7: A clustered horizontal cylinder Showing the average amount of nitrates of each River
in comparison to the international standard.
65 BRANDON ATWELL – PRESENTATION COLLEGE SAN FERNANDO
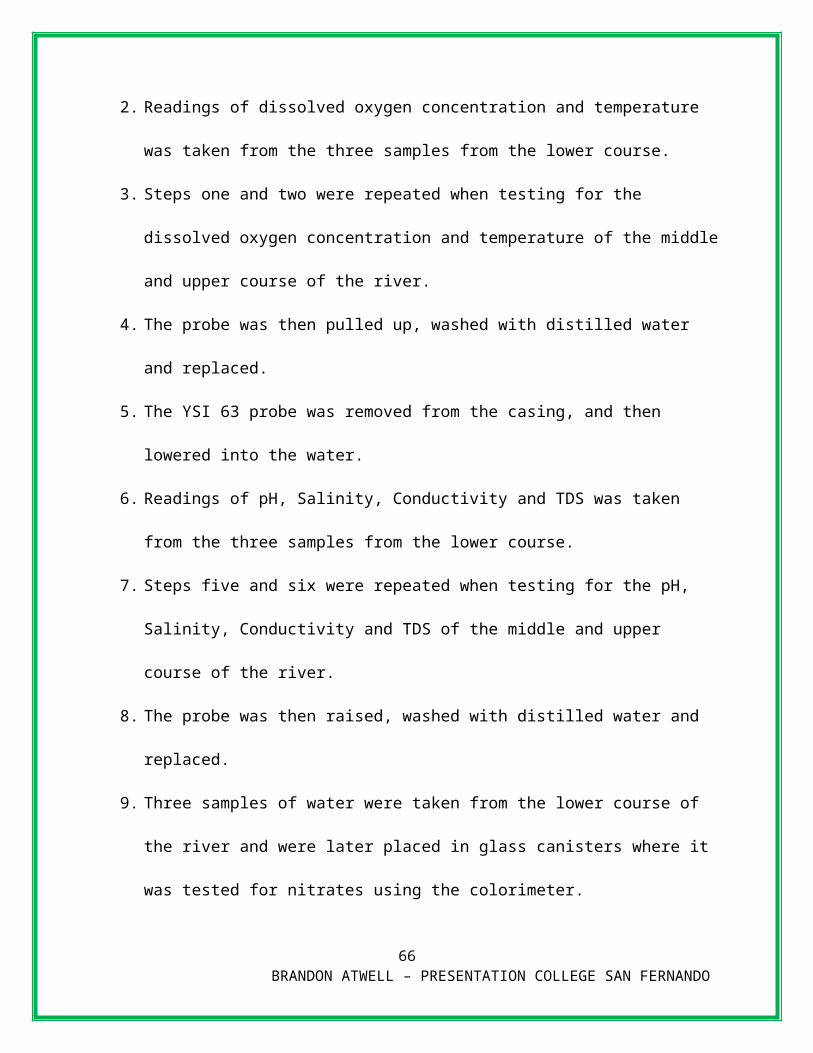
Cipero
Guaracara
Godineau
Caroni
Ortoire
International Standard
0 0.5 1 1.5 2 2.5 3 3.5 4
The data showed the Cipero River had an average reading of nitrates of 3.63ml/l,
Guaracara = 1.63ml/l, Godineau = 0.13ml/l, Caroni = 0.12ml/l, Ortoire = 0.1ml/l and the
maximum international standard of Dissolved oxygen = 1ml/l.
After the testing of the five Rivers was done, the results were collated and graphically
presented in order to facilitate further analysis.
66 BRANDON ATWELL – PRESENTATION COLLEGE SAN FERNANDO
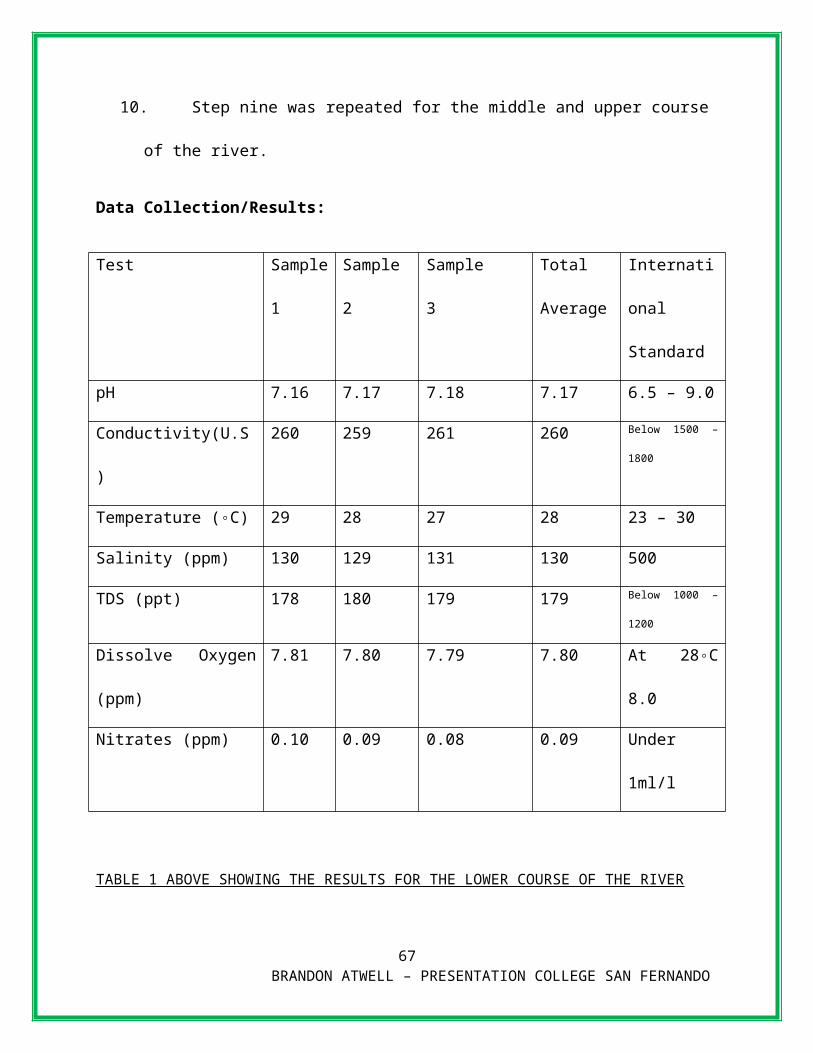
With regard to figure 1, a column graph was used to compare the different pH levels of the
five rivers that were tested. Indeed, the Cipero River had the highest pH reading, that is, 10.17,
whilst the Caroni River recorded the lowest pH reading of 7.02.
Subsequently, for figure 2 a bar graph was developed to evaluate the average conductivity of
the five Rivers. Undeniably, the maximum acceptable international standard is 1800US; however
all the Rivers were below this figure, except the Ortoire River with a conductivity level of
3371.92US.
Meanwhile, figure 3, a 3-D cone, focused on the Temperature of the water. In ascending
order, the temperature of the five rivers are as followed; Godineau = 24.3 N C, Guaracara = 24.5 N
C, Cipero = 24.6 N C, Caroni = 26.27 N C and the Ortoire River = 29.15 N C. However the
international standard for temperature as seen is 30 N C therefore all the Rivers were below.
In terms of Salinity and TDS, figure 4 and 5 represented these two factors by the use of
tables. It must be noted that the Caroni River recorded the lowest readings for both these factors;
138ppt and 190ppt respectively whilst the Ortoire River recorded the highest readings for both
these factors 2055ppt and 2835ppt respectively.
Figure 6 was also represented in a tabular format and depicted the average Dissolved oxygen
content of the five Rivers that were tested. In fact, the international standard is 7.7ppm and only
two rivers had an acceptable, rather superior Dissolved oxygen content and is as follows;
Godineau = 8.58ppm and the Ortoire with the highest at 13.01ppm.
Lastly, figure 7, a clustered horizontal cylinder illustrated the average amount of nitrates in all
the Rivers in comparison to the international standard. Alas, All the rivers were not below the
67 BRANDON ATWELL – PRESENTATION COLLEGE SAN FERNANDO
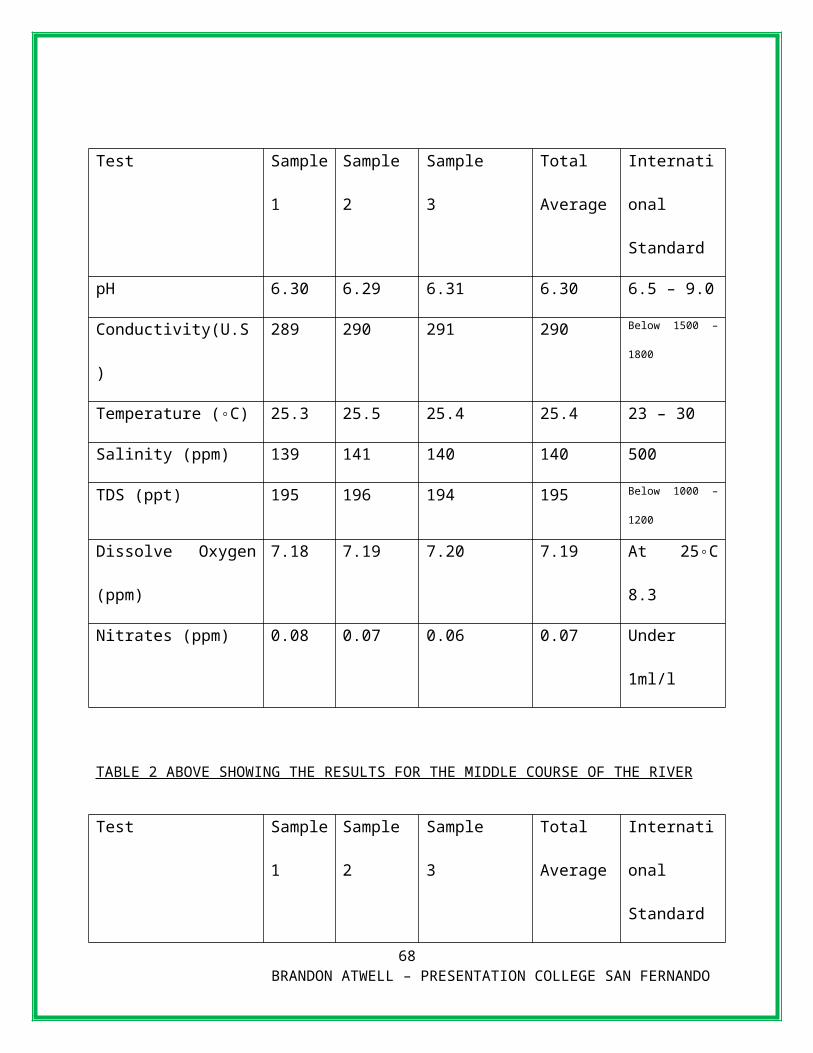
international standard of 1ml/l since both the Cipero and Guaracara were above this level with
figures of 3.63ml/l and 1.63ml/l in that order.
The results obtained indicated of the five Rivers that were tested, three of them could be
considered to be not polluted.
Water pollution is the presence in water of harmful or objectionable material in sufficient
quantity to measurably degrade the water quality, thus affecting other living organisms that
inhabit the specified body of water.
The pH of water manipulates most of its chemical processes. Pure water with no impurities
has a pH of seven; however the international standard is 9.0. Consequently both the Cipero and
68 BRANDON ATWELL – PRESENTATION COLLEGE SAN FERNANDO
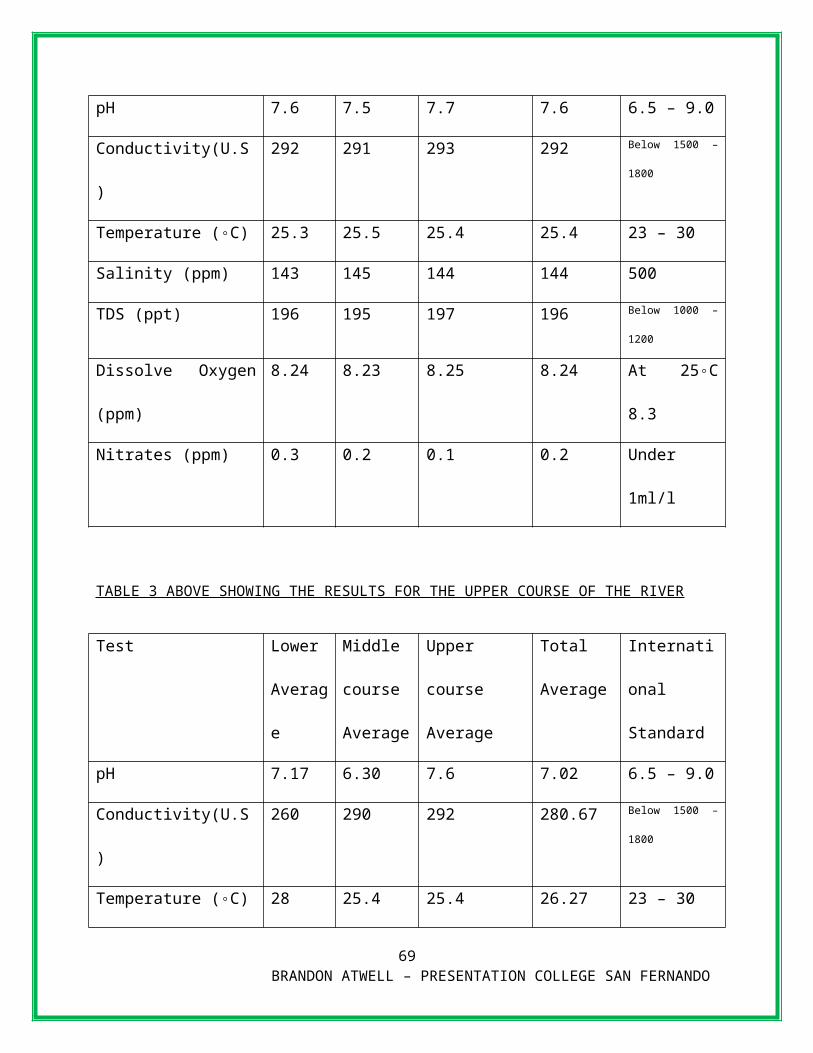
the Caroni River are above this level and this may be because of the fact that a large variety of
pesticides and fertilizers enters these two Rivers as seen during observations for the site visits.
This notion may be solidified by the statement made by Bryon E.R. when he stated that a number
of reported fish kills in rivers of Trinidad and Tobago attributed to the indiscriminate use of
pesticides, fertilizers and domestic chemicals. Nonetheless, fish eggs strive best within the range
of 7.0 – 9.0.
Undeniably, conductivity refers to how well water passes electrical current. The more
impurities in water, the greater its electrical current. All the Rivers were below the international
standard except the Ortoire River because. This river had a high conductivity because of where
the test was done which was where the ocean and river met.
Meanwhile, temperature is important for aquatic life since high temperatures reduce available
oxygen in water but at low temperature more dissolved oxygen is available for aquatic life.
However all the Rivers were within the international standard of 23 N C – 30 N C.
Salinity is simply a measure of saltiness. The weathering or dissolving of continental rocks is
one of the main ways in which a river may start carrying salt. In reality, Rivers are populated
with a myriad of fresh water aquatic life and if the water becomes high in salinity then the
dislocation of populations may occur since they will have to migrate to cleaner waters and also
some may even die. However, only the Godineau and the Caroni River had a salinity reading
below the international standard of 500ppm. A high 2055ppm was recorded for the Ortoire River
69 BRANDON ATWELL – PRESENTATION COLLEGE SAN FERNANDO
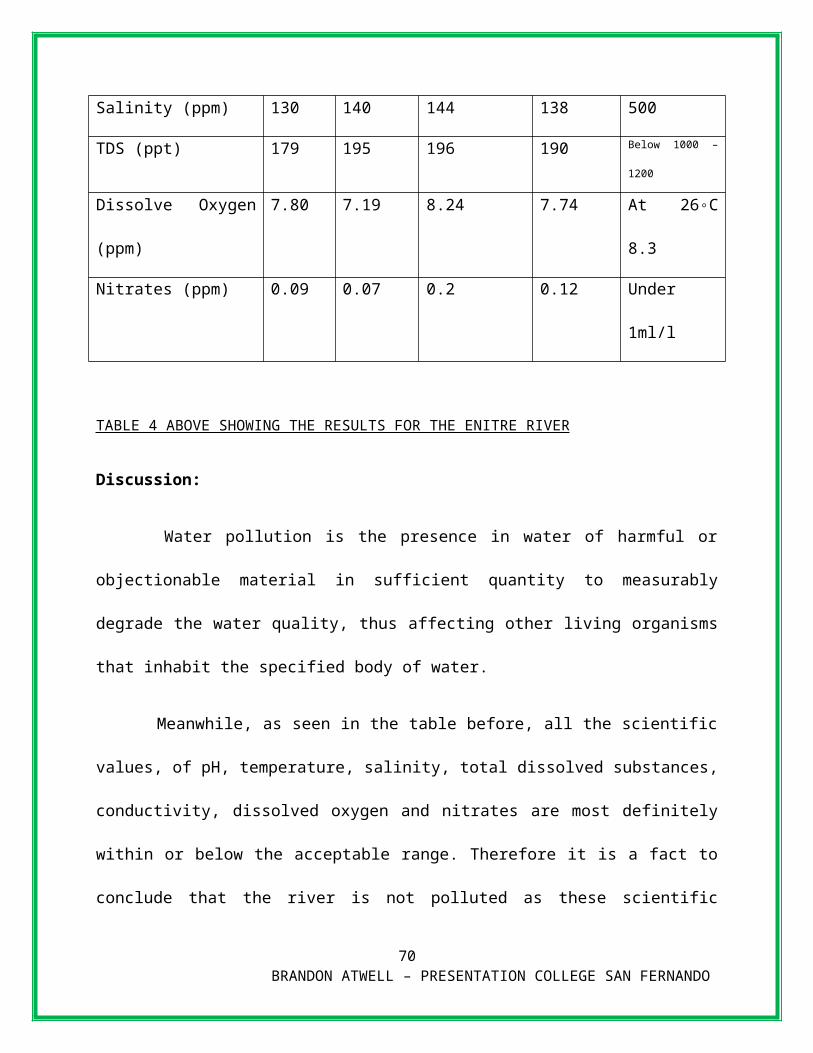
but this occurred due to the fact of where the test was taken, that is where the ocean and river
water met.
Correspondingly, in terms of the TDS of the Rivers, only the Godineau and Caroni were
below the international standard of 1200ppt. Again this was due to the fact that during
observations at the Cipero and Guaracara River a point source pollutant was seen since a pipeline
discharging effluence was seen flowing directly into the River. This premise could be reinforced
by what Phillip H.W. said in his essay on “River water quality in Trinidad and Tobago”. Phillip
claimed that the main causes are uncontrolled point source discharges, in particular industrial
(including mining) and domestic.
Dissolved oxygen is the amount of oxygen dissolved in water and is essential for the survival
of aquatic life. Only the Cipero and the Guaracara River had an awful dissolved oxygen reading.
The reading may have been dreadful since dissolved oxygen is used up when it has to breakdown
a large amount of chemicals in water.
This can be supported by what Phillip H.W said, in his essay on river water quality in
Trinidad and Tobago. He stated that the quality of the surface water resources of Trinidad in
many places is deteriorating due to the presence of chemical pollutants.
Nitrates play an integral role in the development of a plant, however when leached into
nearby water sources it can cause desolation since a buildup of nitrates in a river leads to algae
blooming thus igniting the process of eutrophication. Therefore this statement was supported by
Bryon E.R. who said that the indiscriminate use pesticides and fertilizers are some of the factors
that lead to fish kills. Undeniably, both the Cipero and Guaracara River were above the
international standard of 1ml/l. The high levels of nitrates at the Guaracara River can be
70 BRANDON ATWELL – PRESENTATION COLLEGE SAN FERNANDO

accounted for since during observations upon visiting this site, it was clear that subsistence
farming was being practice by a myriad of residents.
Ultimately, it is a necessity to conclude that based on the findings of this research, that not all
of the five Rivers that were tested are polluted. Evidently, both the Godineau and the Caroni
River are not polluted since they both had little or no pollutants since our tests proved that there
were no harmful and objectionable materials in sufficient quantity to measurably degrade the
water quality at the Rivers. Unfortunately, the area of the Ortoire River that was tested may have
71 BRANDON ATWELL – PRESENTATION COLLEGE SAN FERNANDO
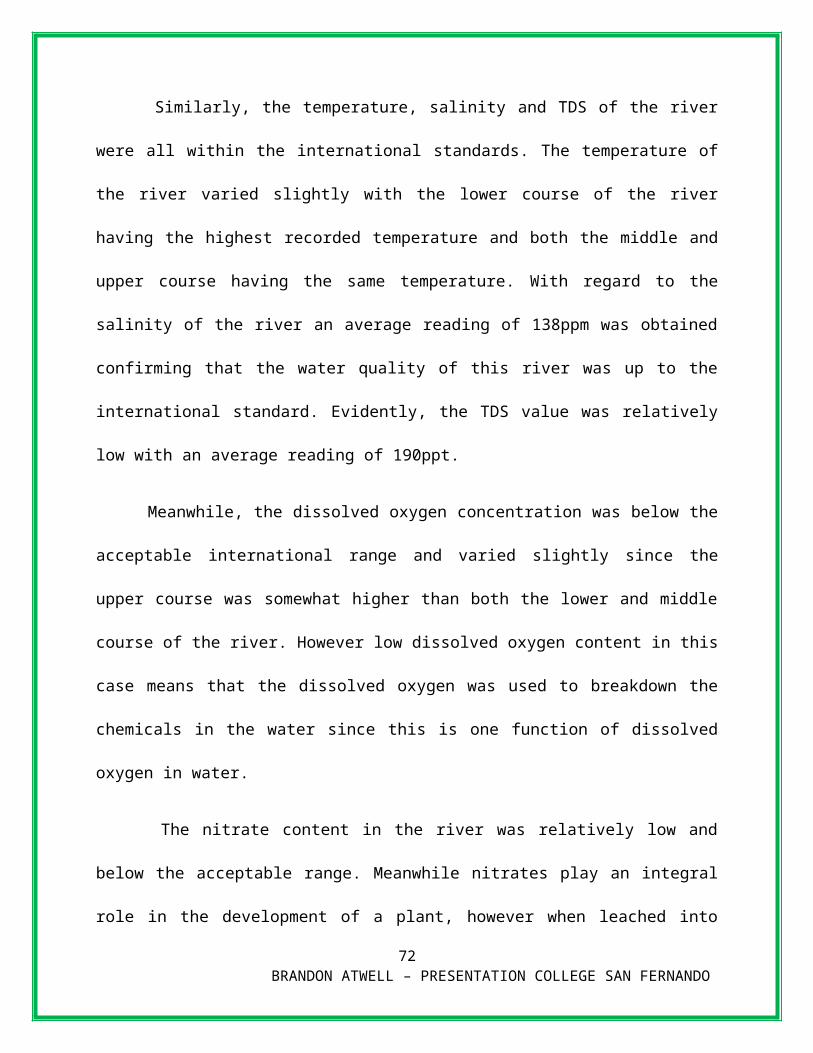
skewed our results since where the brackish water was formed in the river is where was tested.
Secondly the upper course of the River was inaccessible hence that reading was absent.
During research for the literature review, the issues that led to certain factors that affected
water quality were found and some were; agriculture, industry and commercial factors and also
what affects these factors have on the various Rivers. Therefore this went hand in hand with the
purpose of the project which was to spark the enthusiasm of us the students to become aware of
every aspect of these factors. Nevertheless, the entire research project was somewhat successful.
1. Implement various environmental legislations and penalties – Therefore the
owner of the business near the Cipero River that has a pipeline running directly into
the river discharging effluence should be penalized accordingly. Also those people
that dump garbage into this River would face the same consequences.
72 BRANDON ATWELL – PRESENTATION COLLEGE SAN FERNANDO
2. Greater emphasis on CEC's – If this is done then a reduction of some water
pollutants would be attained since only when a proposal is environmentally friendly
then it would be granted access by the EMA to further its construction. Then these
businesses near the Cipero River that pollute the River would maybe not even be in
existence.
3. Development of water treatment plants in all major rivers – As seen in the Caroni
River, the water treatment plant there greatly reduces the amount of water pollutants
there so if these plants were to be constructed in other rivers, e.g. the Guaracara
River, then it would be sanitary.
4. Protect drinking water by using less pesticides and fertilizers – This will be very
effective since according to Bryon E.R. in the literature review of this project, the
indiscriminate use of fertilizers and pesticides have been a major cause of a large
number of reported fish kills.
5. Education – The general public can be educated about how their actions may affect
the various water courses nearby and also steps that they can take in an attempt to
curb this issue.
6. Better Farming practices – The principles of GAP (Good Agricultural Practices)
should be adhered to by farmers hence their well be a drastic decrease in chemical
drifting and fertilizer run-off. Additionally even Phillip H.W. in his essay on water
73 BRANDON ATWELL – PRESENTATION COLLEGE SAN FERNANDO

quality believed that even higher rates of pollution would occur, if no corrective
measures are instituted.
1. H.W., P. (1998, January 12). EMA water pollution. Retrieved March 4, 2012, from EMA
Web site: http://www.ema.co.tt/docs/techServ/water/rewpmp.pdf
2. C.R., A. (2009, february 18). new facts: Trininetworks. Retrieved March 3, 2012, from
Trininetworks: http://trininetwork.com/news/facts.htm
74 BRANDON ATWELL – PRESENTATION COLLEGE SAN FERNANDO
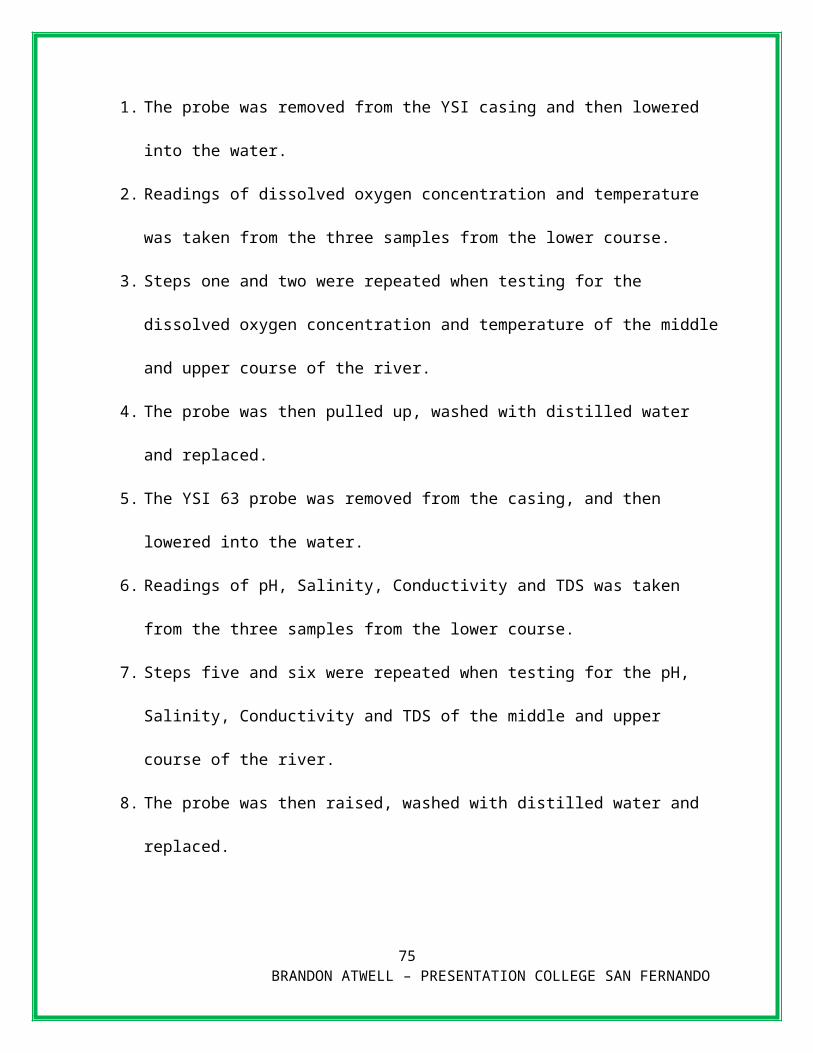
3. C.R., B. (2010, September 11). Water pollution: WRMU. Retrieved March 01, 2012,
from WRMU: http://wrmu.org.tt/uploads/policy-wrmu.pdf
4. S.I, M. (2007, July 11). Importance of water quality: Blur. Retrieved March 04, 2012,
from Blur: http://blurtit.com/q517178.html
5. Thornes, N. (2001). Bath Advanced Science. Environmental Science.
75 BRANDON ATWELL – PRESENTATION COLLEGE SAN FERNANDO