environmental services market update summer 2020
TRANSCRIPT


Practice Overview
2
The environmental services sector serves multiple end markets and is a large part of the economy. With an addressable market of more than $400 billion(1), the sector has demonstrated significant resilience and growth potential in recent times, due to the essential nature of services provided. We define the sector as companies that focus on keeping their customers:
Air-Pollution Control
Cleaning and Maintenance
Decommissioning and Deconstruction
Emergency Response
Environmental Consulting
Facility Services
Industrial, Hazardous, and Specialty Waste
Recycling and Resource Recovery
Remediation
Safety and Compliance
Soil Treatment
Solid-Waste Management
Specialty-Equipment Rental
Waste Hauling and Transportation
Waste-to-Energy
Water and Wastewater Treatment
Environmentally compliant Operating efficiently and
safely
Focused on sustainable
initiatives✓ ✓ ✓
Houlihan Lokey Environmental Services Contacts
Scott SergeantManaging [email protected]
Disha [email protected]
Jordan MendelVice [email protected]
Leon VayntraubVice [email protected]
Select Coverage Categories Broad Applications and End Markets
Industrial
Transportation
Marine
Government/Municipalities
Commercial
Oil and Gas
Retail /Restaurant
Power and Utilities
Residential
(1) Environmental Business Journal.

Houlihan Lokey’s 2020 Business Services Virtual Conference
2020 Business Services Virtual Conference
Virtual Presentations: September 29Virtual One-on-One Meetings: September 30 – October 1
Conference OverviewHoulihan Lokey is pleased to host its 2020 Business Services Virtual Conference from Tuesday, September 29, to Thursday, October 1. This conference is an excellent opportunity to develop relationships and gain insights into the market dynamics and strategies within a wide variety of sectors.
Conference FormatExecutives from high-performing services companies will showcase their businesses to an audience of prospective strategic, financial, and institutional investors and other capital providers. Conference activities include:
Detailed company presentationsOne-on-one discussions (upon request, if available, on September 30 and October 1)
Conference Attendees• Senior executives from leading companies.• Private equity and hedge fund investors with
relevant industry experience and knowledge.• Mezzanine and senior debt providers.
Participation Benefits• Network with prospective financial, institutional, and strategic investors and other capital providers.• Interact and develop new relationships with industry experts and thought leaders.• Discuss the strategies for creating value for stakeholders.• Get a time-efficient pulse check on the state of the market and other current issues.
Register here to reserve your place at the conference.3
Select Relevant Past Presenters

Current Market OverviewAs the pandemic continues to impact businesses and change the ways they operate, we review how public companies in the environmental services and waste management sectors have performed through the first half of 2020.
In recent months, companies across the environmental services and waste management industry have experienced recoveries from COVID-19-related lows in April. Economic activity has rebounded with the reopening of multiple regions across the country, but the exact pace and slope of the recovery is varied across markets and geographies. Despite the strong rebound, industry executives remain cautious and warn that the economy is not yet on fully stable footing. The recent positive trends are contingent on avoiding a "second wave" of infections this fall.
We have further split the two sectors into five subsectors to examine trends: (i) waste and recycling, (ii) specialty waste services, (iii) environmental consulting and remediation, (iv) response and restoration, and (v) industrial in-plant services. The following trends will likely continue to drive strong performance across the subsectors for the remainder of the year:
Companies across the sectors have proven to be nimble in flexing their cost structure, adjusting business mix, and maintaining pricing discipline, leading to strong margins in the face of marginal revenue declines.
Both waste and recycling and specialty waste services companies saw commercial and industrial (C&I) waste collection and transportation volumes bottom in April, with sharp recoveries for the remainder of the quarter due to increased economic activity. Residential volumes continue to remain above historical levels.
Emergency response as a service line continues to prove resilient for both industrial in-plant services companies and response and restoration names as facilities remain focused on cleaning, with a steady flow of COVID-19-related decontamination work.
Industrial in-plant service providers with energy exposure—specifically oil and gas—face the largest headwinds and are likely to remain the most challenged this year, with oil prices continuing to linger below pre-COVID-19 levels.
Environmental consulting and remediation companies are working off of existing backlog with minimal impact on nondiscretionary, ongoing projects; they are seeing some delays in large projects and temporary delays due to state/local funding dynamics. Meanwhile, bidding activity has remained high for projects coming in the next two quarters.
Companies across the sectors continue to closely monitor capex spend and have begun to reinstate originally planned expenditures that were put on hold during the initial pandemic stages. Many expect the pace of investments in their businesses to align with the slope of revenue recovery.
Most companies across the sectors reported that cash collection was strong, given the essential nature of the service, and that bad debt expense increases and cancelations were still relatively modest.
The second half of the year is expected to show improving trends with a number of companies reinstating guidance, though the full year is still expected to be below pre-COVID-19 expectations, with the slope of recovery likely to mirror industrial activity. Several companies have amended certain covenants within existing credit facilities to provide increased near-term operating flexibility.
Many management teams have noted that costs are likely to come back into their businesses more slowly than volumes and revenues recover—leading to the likelihood of longer-term margin enhancement.
Financial sponsors have gradually shifted their focus from existing portfolio company management to seeking new attractive, resilient investment opportunities to deploy significant dry powder in their funds.
Overall, the sectors are among the few outliers to come through the pandemic largely unscathed and with minimal financial impacts and, as a result, are likely to resume their pre-COVID-19 growth trajectory by the beginning of 2021, if they have not already.
Market Update
1
2
3
4
5
6
8
7
4
9
10

Environmental Services Waste Management
Average Financial Metrics(2)
0%50%
100%150%200%250%300%350%400%450%500%
Aug-10 Aug-12 Aug-14 Aug-16 Aug-18 Aug-20
S&P 500 Index Waste Management Index Environmental Services Index
Public Markets and SentimentsCompanies within the environmental services and waste management sectors have continued to prove out their resilient business models as essential service providers throughout the quarter, with performance recovering above or in line with the market rebound from April lows; valuations for the sectors remain at or above historical levels.
Long-Term Market Performance—Last 10 Years
Recent Market Performance—Since January 1, 2019
Public Company Valuation
Key TakeawaysWaste Management Index:
Strong rebound as commercial and industrial activity gradually recovered from pandemic lows with multiple regions reopening and pricing has remained relatively intact.
Environmental Services Index:
Improvement from April lows with companies with oil and gas exposure lagging in price recovery as the pandemic persists.
+40%+35%
+20%
Key Takeaways Long-term resilient markets driven by:
Essential, nondiscretionary business models with predictable revenue streams.
Proven and essential business models.
Multiple and diverse demand drivers.
5Source: S&P Capital IQ; Note: Multiples and financial statistics calculated as of 8/31/2020. Multiples represent average LTM figures over the course of the stated year. 2020 figures based on consensus estimates per S&P Capital IQ.(1) Includes impact of GFL Environmental, Inc., since IPO on the NYSE in March 2020; (2) FCF defined as EBITDA less total capex.
+355%
+234%
+39%
80%90%
100%110%120%130%140%150%160%
Jan-19 Mar-19 May-19 Jul-19 Sep-19 Nov-19 Jan-20 Mar-20 Jun-20 Aug-20
S&P 500 Index Waste Management Index Environmental Services Index
Historical Averages (2016–LTM)EV/EBITDA: 11.2x; EV/FCF: 19.4x
Historical Averages (2016–LTM)EV/EBITDA: 13.6x; EV/FCF: 22.3x
10.3x 11.1x 10.8x 12.9x 11.1x 12.0x17.4x 16.0x 17.8x
22.1x 23.5x18.0x
2016 2017 2018 2019 LTM 2020EV / EBITDA EV / FCF
11.3x 12.2x 13.0x15.7x 15.6x 15.7x
19.0x 20.1x 21.7x 24.5x 26.1x 22.7x
2016 2017 2018 2019 LTM 2020EV / EBITDA EV / FCF
LTM EBITDA Margin
15%
LTM FCF Margin
8%
2016A–2019AEBITDA CAGR
5%
LTM EBITDA Margin
25%
LTM FCF Margin
13%
2016A–2019AEBITDA CAGR
9%
(1)

Recent Large Transactions
6
Acquired By
August 2020
Business OverviewOperates a vertically integrated network of solid waste assets, including collection and hauling operations, transfer stations, material recovery facilities, and landfills across 11 U.S. states.
Transaction Rationale Expands GFL’s geographical reach, specifically in
the Midwest and Southeast through TX, FL, and MO. Provides a complementary asset network and
customer base to GFL's existing operations, including those acquired in the WM-ADSW divesture.
Funded in part with $600M of Series A convertible preferred financing from HPS Investment Partners.
June 2020
Business OverviewPortfolio of vertically integrated solid waste collection, transfer, recycling, and disposal assets across 10 U.S. states as part of the WM-ADSW divesture.
Transaction Rationale Necessary WM divesture to receive FTC approval
for its merger with ADSW. Expands GFL’s geographical reach, specifically
within the Midwest region through Wisconsin. Strengthens the operating margins through a five-
year disposal arrangement with WM that provides competitive and predictable pricing and terms.
Acquired By
Acquired By
April 2019
Business OverviewProvides integrated, nonhazardous solid waste collection, recycling, and disposal services to residential, commercial, industrial, and construction end markets.
Transaction Rationale After more than one year without approval, WM
modified the deal (due to changing economic conditions) and assumed regulatory pressure.
Announced a divesture of assets generating roughly $300 million of revenue to GFL in June 2020 to close concurrently with the WM/ADSW transaction.
ADSW acquisition expands geographical reach and customer base, specifically within the East.
Anticipate $100 million in synergies from cost savings and improvements to FCF and operating margins.
Enterprise Value ($M): $1,212EV/LTM Revenue 3.0xEV/LTM EBITDA N/A
Enterprise Value ($M): $835EV/LTM Revenue ~2.5xEV/LTM EBITDA ~9.0x
Sources: S&P Capital IQ, company press releases. (1) Closed in April 2020.
Enterprise Value ($M): ~$4,600EV/LTM Revenue ~3.5xEV/LTM EBITDA ~11.0x
Enterprise Value ($M): $463EV/LTM Revenue N/AEV/LTM EBITDA N/A
February 2020(1)
Business OverviewU.S. operations of Stericycle’s Environmental Solutions business (ESOL) that provides waste transportation (hazardous) and processing solutions to healthcare, industrial, and retail end markets.
Transaction Rationale ESOL integrated into the Clean Earth platform to
create a single-thesis, national environmental solutions leader in hazardous waste management.
Adds a network of 13 federally permitted treatment, storage, and disposal facilities and a fleet of more than 700 vehicles.
Approximately 85% of Harsco’s total revenue is expected to come from environmental solutions and services post acquisition.
Acquired By

16.2x
21.2x
16.6x
20.9x
$1.9B
$26.3B
$1.2B
$27.9B
Engineering Services Industrial Services
Current Valuation Outlook
7
Despite the recent recovery, environmental services companies are still trading at multiples below their pre-COVID-19 levels, as the fall in market capitalization has outpaced downward revisions in forward earnings estimates. For waste management companies, not only do they continue to trade at a premium to pre-COVID-19 multiples, but share prices are now trading above their February peaks.
MARKET CAPITALIZATION AS % OF EV
MARKET CAPITALIZATION
11.0x
14.4x
9.8x
15.7x
(8%)
EV/NTM EBITDA
EV/NTM FCF (1)
(36%)
Waste ManagementEnvironmental Services12/31/2019 8/31/2020 12/31/2019 8/31/2020
Waste ManagementEnvironmental Services12/31/2019 8/31/2020 12/31/2019 8/31/2020
Waste ManagementEnvironmental Services12/31/2019 8/31/2020 12/31/2019 8/31/2020
YE 2019 Q2 2020
6%
82%
18%
8/31/2020
58%
42%
8/31/2020
69%
31%
12/31/2019
$4.5BMedian EV
$3.8BMedian EV
80%
20%
12/31/2019
$32.8BMedian EV
$34.4BMedian EV
Waste ManagementEnvironmental Services
Market Capitalization
Net Debt
(15%)
Source: S&P Capital IQ. Note: Statistics represent median figures. For consistency, all forward numbers are based on analyst consensus estimates and may conflict with specific company guidance.(1) Excludes CWST and HCCI.
5%
9%
2%
(1%)

COVID-19 Impact on Q2 Performance
8
Despite the decreased revenues from lower commercial and industrial activity in Q2, sector companies were able to drive margin improvement and enhanced FCF conversion through cost-saving measures put in place at the end of Q1.
16%
28%
17%
29%
Environmental Services Waste Management
(1%)
6%
(4%) (3%)
Environmental Services Waste Management
Q2 REVENUE
Q2 EBITDA
Q2 REVENUE GROWTH (1)
Q2 EBITDA GROWTH (1)
$0.4B
$2.0B
$0.4B
$1.9B
Environmental Services Waste Management
3%
8%
(11%)
(5%)
Environmental Services Waste Management
Q2 EBITDA MARGIN
Q2 FCF MARGIN
Q2 FCF CONVERSION
Q2 FCF GROWTH (1)(2)
56%54%
65%
57%
Environmental Services Waste Management
10%
15%
9%
16%
Engineering Services Industrial Services
0%
1%
2%
(0%)
Environmental Services Waste Management
Source: S&P Capital IQ; Note: Statistics represent median figures. For consistency, all forward numbers are based on analyst consensus estimates and may conflict with specific company guidance.(1) Growth percentages represent percent change from last year’s Q2 results. (2) Excludes HCCI.
$58M
$562M
$61M
$548M
Environmental Services Waste Management
Q2 2019 Q2 2020

+23%
20%
40%
60%
80%
100%
120%
140%
160%
180%
Jan-19 Mar-19 May-19 Jul-19 Sep-19 Nov-19 Jan-20 Mar-20 May-20 Jul-20
S&P 500 Index Clean Harbors Covanta HarscoHeritage-Crystal Clean Stericycle US Ecology Veolia
Environmental Services:Company-Level Market Performance
9
The environmental services universe has experienced a sector-wide recovery since the pandemic lows in April, with the slope and pace of the rebound varying by end market and geography.
Environmental Services—Market Performance Since 2019
+74%
+22%
+40%
-38%
-23%
-41%
-30%
Operators with medical waste operations
(Stericycle) continue to thrive, while names with
oil and gas and automotive exposure
(Heritage-Crystal Clean and US Ecology) are lagging the market
recovery.
1
Companies have remained nimble in
protecting their bottom line in the face of softer revenues, successfully
implementing cost-saving initiatives and
deferring maintenance work to 2H 2020.
2
Outlook has improved with a steady rebound across areas such as
pharmaceuticals, chemicals, and food and beverage; volumes are
increasing with the uptick in industrial and
commercial activity.
3
Source: S&P Capital IQ. Note: Financial statistics calculated as of 8/31/2020.
Company Commentary Outlook
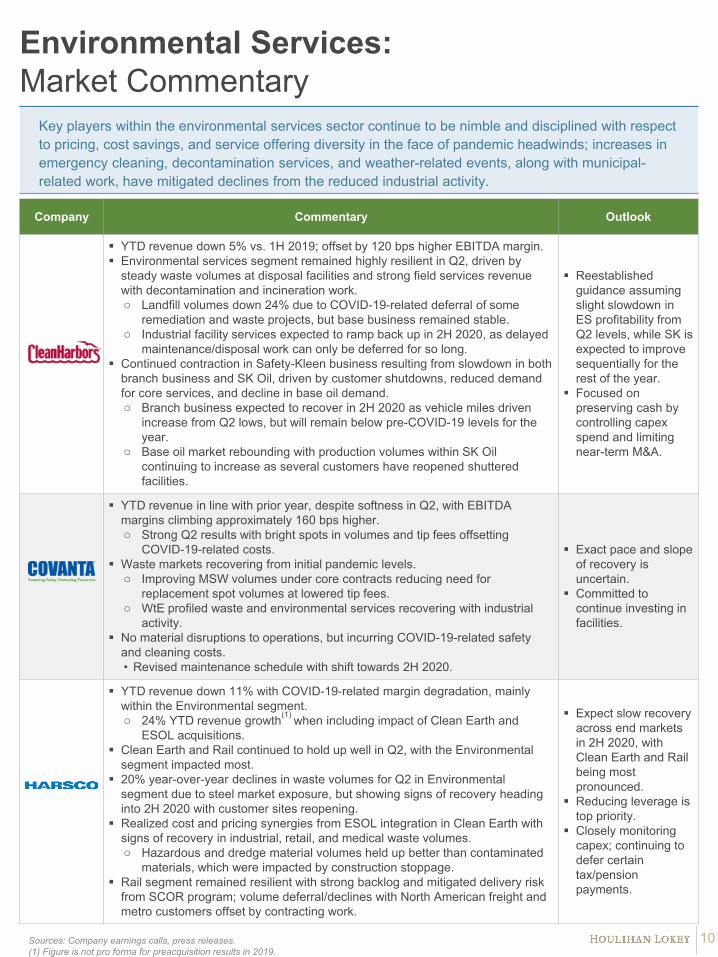
YTD revenue down 5% vs. 1H 2019; offset by 120 bps higher EBITDA margin. Environmental services segment remained highly resilient in Q2, driven by
steady waste volumes at disposal facilities and strong field services revenue with decontamination and incineration work.o Landfill volumes down 24% due to COVID-19-related deferral of some
remediation and waste projects, but base business remained stable.o Industrial facility services expected to ramp back up in 2H 2020, as delayed
maintenance/disposal work can only be deferred for so long. Continued contraction in Safety-Kleen business resulting from slowdown in both
branch business and SK Oil, driven by customer shutdowns, reduced demand for core services, and decline in base oil demand.o Branch business expected to recover in 2H 2020 as vehicle miles driven
increase from Q2 lows, but will remain below pre-COVID-19 levels for the year.
o Base oil market rebounding with production volumes within SK Oil continuing to increase as several customers have reopened shuttered facilities.
Reestablished guidance assuming slight slowdown in ES profitability from Q2 levels, while SK is expected to improve sequentially for the rest of the year.
Focused on preserving cash by controlling capex spend and limiting near-term M&A.
YTD revenue in line with prior year, despite softness in Q2, with EBITDA margins climbing approximately 160 bps higher.o Strong Q2 results with bright spots in volumes and tip fees offsetting
COVID-19-related costs. Waste markets recovering from initial pandemic levels.
o Improving MSW volumes under core contracts reducing need for replacement spot volumes at lowered tip fees.
o WtE profiled waste and environmental services recovering with industrial activity.
No material disruptions to operations, but incurring COVID-19-related safety and cleaning costs.• Revised maintenance schedule with shift towards 2H 2020.
Exact pace and slope of recovery is uncertain.
Committed to continue investing in facilities.
YTD revenue down 11% with COVID-19-related margin degradation, mainly within the Environmental segment.o 24% YTD revenue growth(1) when including impact of Clean Earth and
ESOL acquisitions. Clean Earth and Rail continued to hold up well in Q2, with the Environmental
segment impacted most. 20% year-over-year declines in waste volumes for Q2 in Environmental
segment due to steel market exposure, but showing signs of recovery heading into 2H 2020 with customer sites reopening.
Realized cost and pricing synergies from ESOL integration in Clean Earth with signs of recovery in industrial, retail, and medical waste volumes.o Hazardous and dredge material volumes held up better than contaminated
materials, which were impacted by construction stoppage. Rail segment remained resilient with strong backlog and mitigated delivery risk
from SCOR program; volume deferral/declines with North American freight and metro customers offset by contracting work.
Expect slow recovery across end markets in 2H 2020, with Clean Earth and Rail being most pronounced.
Reducing leverage is top priority.
Closely monitoring capex; continuing to defer certain tax/pension payments.
Environmental Services:Market Commentary
10
Key players within the environmental services sector continue to be nimble and disciplined with respect to pricing, cost savings, and service offering diversity in the face of pandemic headwinds; increases in emergency cleaning, decontamination services, and weather-related events, along with municipal-related work, have mitigated declines from the reduced industrial activity.
Sources: Company earnings calls, press releases.(1) Figure is not pro forma for preacquisition results in 2019.

Company Commentary Outlook
Results bottomed in Q2 with YTD revenue lagging the prior year by 7% along with meaningful margin degradation, primarily due to oil business exposure.
Softened Q2 revenue due to volume declines in most of Environmental Services’ product and service lines, partially offset by favorable pricing in parts cleaning, containerized waste, and antifreeze LOB.
Oil business continues to be hit by pandemic with demand declines for finished lubricants impacting base oil product sales; used oil collection and feedstock volumes experiencing downward pressure.o Moved up scheduled extended turnaround in re-refinery to Q2 during
reduced operating period. Multiple recent positive trends in oil segment.
o Improvement in charge-for-oil program.o Early in Q3, base oil pricing began to recover, driven by higher crude oil
pricing.
Believe the worst is behind them.
Do not expect future pandemic drawdowns on revolver.
Selectively reviewing nonessential capex and gradually restarting M&A.
YTD revenue tracking 7% lower than the prior year(1) as a result of COVID-19 impacts, but partially offset by roughly 175 bps growth in EBITDA margins.
Regulated Waste and Compliance Services revenue held up relatively flat compared to last year, despite the impact of the pandemic on elective surgeries and preventative care; continues to be deemed an essential service to the healthcare industry.
Secure Information Destruction Services and Communication and Related Services impacted by pandemic as a result of limited reopening of businesses and lower demand for hospital scheduling services and lower recall volume.
Anticipate resuming investment in the business roughly in alignment with revenue recovery.
Believe international markets will lag North America for certain services.
Legacy ECOL business revenue up 4% year-over-year with EBITDA margins essentially flat; strong Q1 offset by performance decline in Q2.
Environmental Services’ base business experienced softness due to nationwide shutdowns, partially offset by growth in higher-margin events segments.
Field and Industrial Services’ decline primarily driven by lower revenues in transportation and logistics and industrial services business lines, partially offset by strong growth in emergency response and small quantity generation service lines.
NRC’s businesses tied to industrial markets held up well with additional expertise in emergency response; mitigation efforts focused on those tied to the energy sector.
Energy waste disposal services segment now looking like it will be close to or near breakeven this year.
Expect 2H 2020 improvements with continued softness in base business due to lower industrial activity; partially offset by event business and decontamination work.
YTD revenue down 6% from the prior year with approximately 200 bps margin decline from impact of shelter-in-place orders globally on C&I volumes.
Recovery began in May and was very strong in June, with good momentum heading into 2H 2020.
Resilience across geographies in Q2. o Asia, Latin America, and Japan continue to grow.o Europe, Africa, Middle East, Pacific, and North America all with mitigated
revenue declines (1%–2%). In North America, compensated the loss of activities in refineries waste
recycling by transforming low-value waste acid into surfactants for industrial clients. Municipal water activity had no volume impact.
Essential municipal services continue to remain strong, but other businesses have been more impacted, such as commercial and industrial waste, construction works, and industrial maintenance.
Encouraging end to 1H 2020; aim to recover to 2019 levels as of Q4 2020.
Portion of growth capex maintained to support strategic plan; M&A program is active (including multiple hazardous waste opportunities globally, with several in the U.S.).
Environmental Services:Market Commentary (cont.)
11Sources: Company earnings calls, press releases.(1) Includes pro forma impact of ESOL divestiture.

$573 $813 $1,097 $179 $139
$140
($430) ($428)
($436) ($452)
$178 $99 $101
$425 $400
($26) $61 $25 $146
$165 $176
$135 $65 $89
($3) ($3)
$2,149 $2,435 $2,331
$2,100 $1,894 $1,894 $758 $467 $461
$756 $236 $236 $753
$809
Environmental Services:Capital Allocation Strategy—2020E
($ in millions)
$5,763
12
Sources: Thomson Reuters Eikon, company earnings releases, and equity research reports; Note: HCCI has been omitted, as projections are not publicly available. For consistency, all forward numbers are based on analyst consensus estimates and may conflict with specific company guidance.(1) Capital spend figures are net of debt borrowings and asset divestitures.(2) Figures represent the percentage change between 2020E estimates as of today against the time periods referenced; 2019A capital allocation split not shown on this page.
Environmental services companies have been closely monitoring their cash outlay throughout the pandemic to manage liquidity needs. The general sentiment is that investments in the business and returns to shareholders will roughly align with revenue recovery.
$5,033
$255 $287
($ in millions)
Reduced capex plans with
some delays in M&A strategy
Proceeds from ESOL divestiture
used to pay down debt
$178$49
Debt Paydown/(Borrowings)
Cash Dividend Payouts
Net Cash Acquisition Costs
Capital Expenditures
Share RepurchasesFigures represent breakdown of
capital spend estimates per
company for 2020E, with the
consolidated bar label
representing cumulative spend.
Controlling capex for the year;
flexibility with low leverage levels
(15%) 7% (21%)
Variance vs. 2019A(2) 39% NM 15%
Variance vs. 2020E as of
12/31(2)
13% (33%) (72%)
Variance vs. 2019A(2) 51% NM NM
Variance vs. 2020E as of
12/31(2)
2019A Capital Spend(1) $3,533 ($224) $218
2019A Capital Spend(1) $190 $7 ($49)
($ in millions)
($ in millions)
Lowered dividend to focus on
managing leverageSuspended dividend program
Acquired ESOL from SRCL in
April
$4,922 $523
$379 $294 $253
$216 $175 $197
$17 $17
($8)
$1 $595 $468
$478
$288
$111 $98 $70
$85 $68 $68
$23 $6
$6
$3 $3
$218 $147$175 $88
As of Q1 ’20 As of Today As of 12/31/19 As of Q1 ’20 As of Today As of Q1 ’20 As of Today
As of Q1 ’20 As of Today As of Q1 ’20 As of Today As of Q1 ’20 As of Today
As of 12/31/19 As of 12/31/19
As of 12/31/19 As of 12/31/19 As of 12/31/19
($ in millions) ($ in millions)
($ in millions) ($ in millions)

+40%
80%
100%
120%
140%
160%
180%
200%
220%
Jan-19 Mar-19 May-19 Jul-19 Sep-19 Nov-19 Jan-20 Mar-20 May-20 Jul-20
S&P 500 Index Casella Republic Services Waste Connections Waste Management
Waste Management:Company-Level Market Performance
13
Waste management companies showed multiple signs of resilience against the pandemic’s effect on volumes and revenue. The stock price recovery from COVID-19 lows was above or in line with the market, as the improvement in waste mix was compounded by a strong recycling quarter and industry pricing discipline.
Waste Management—Market Performance Since 2019(1)
Residential volumes are slowly moderating from
pandemic highs as economic activity
resumes in multiple regions; more than 50% of affected commercial
and industrial solid waste accounts have indicated a resumption in service.
1Recycling was a bright spot in Q2, driven by
higher commodity prices and shift to fee-for-
service model; expected to normalize as OCC prices stabilize and
commercial volumes remain below historical
levels.
2Margin profile for key
players continues to hold up as a result of improving mix,
disciplined pricing, and effective cost-control
efforts; companies with high percentages of E&P
waste saw margin degradation.
3
Source: S&P Capital IQ; Note: Financial statistics calculated as of 8/31/2020.(1) Excludes GFL Environmental due to limited trading data (IPO in March 2020).
+32%
+102%
+38%+33%

Waste Management: Market Commentary
14
Key industry participants within the waste management sector reported a sharp recovery in commercial and industrial volume declines from the lows in April to improved June levels, with volumes down mid-single digits exiting the quarter versus the mid-double digit declines in April. Several companies have noted that more than 50% of C&I customers have resumed service; most companies point to further recovery in volumes in July, but at a more measured or tapered pace than April through June.
Sources: Company earnings calls, press releases.(1) 2019 figures are not pro forma for acquisitions of American Waste in February 2020 and County Waste in January 2020.
Company Commentary Outlook
Strong YTD results with 6% growth in revenue over the prior year supplemented by 200 bps margin enhancement.
Performed well in Q2 despite declines in solid waste volumes. Actively worked with customers to adjust service levels to current waste-to-
recycling needs (and offload unprofitable work) rather than sacrifice pricing; approximately 75% of this year’s price increases were executed in Q1 2020.
Disposals volumes in Q2 were down approximately 16% (landfill tons down approximately 18.4%) due to lack of construction/industrial activity.o Volume declines were partially offset by landfill pricing increase of 6.2%.o Landfill volumes have increased since April (up 25.6% sequentially from April
through June). Collection volumes were down 10% year over year for the quarter (primarily
commercial and industrial), but collection revenue was offset by positive pricing and the rollover effect of acquisitions (completed four since April).
Strong quarter for the recycling business; higher commodity pricing by effectively passing recycling commodity risk back to customers.o Higher cardboard pricing, partially offset by lower plastics and metal pricing.
Cardboard pricing peaked in May, however, and has dropped by nearly $40 per ton; pricing in July is back to March levels.
Reintroduced 2020E guidance (conservative outlook; do not expect normal seasonal Q3 uptick).
Approximately 55% of C&I services have restarted; expect another 15%–20% to ramp up in the fall.
Robust M&A pipeline; believe there will continue to be sizable opportunities for them.
Continue to invest in planned capex at the newly acquired operations.
YTD revenue is tracking 24% over 1H 2019(1) with adjusted EBITDA margins remaining in line with the prior period.
Strong Q2 with approximately 20% revenue and continued adjusted EBITDA growth.
Sequential volume improvements in solid waste business since the end of April.o Pricing growth was offset by reduced volumes for Q2 in C&I collection;
residential continues to be resilient.o Suspended pricing initiatives but saw a higher net price for recycled
commodities, driven by the sudden spike in OCC pricing early in Q2; anticipate normalized pricing of 3.5%–4.0% for the midterm.
o Greatest volume impacts in primary Canadian markets, while secondary markets (which make up almost two-thirds of solid waste revenues) were less impacted.
Soil/infrastructure resilient due to the essential nature of large projects; small-volume, high-frequency soil remediation work beginning to return.
Liquid waste was the hardest hit segment, with lower UMO sales volumes (net pricing flat/positive); industrial activity is showing signs of recovery.
Expect positive trend as markets continue to reopen.
Signed WCA acquisition in August and purchased WM/ADSW asset divesture package in June, forming a strong base in the U.S. to pursue tuck-ins; pipeline remains robust.
Revised 2H 2020 capex estimates upwards.

Waste Management: Market Commentary (cont.)
15Sources: Company earnings calls, press releases.
Company Commentary Outlook
YTD revenue and EBITDA essentially flat versus the prior year. Mixed impact across the business with the depth of the decline in volume and
pace of recovery varied by both line of business and market. Landfill special waste volume impacted the most, decreasing 17% in Q2, primarily
due to deferral as opposed to cancelation. Pipeline remains strong.o Landfill MSW volume down 3.5%. Landfill C&D volume was essentially flat.
Expect small and large container volume to continue recovering over the remainder of the year.
Residential wastes up 10.1% for Q2; continued to convert CPI-based contracts to more favorable pricing mechanisms for the annual price adjustment.
Recycled commodity prices increased 29% to $101 per ton, compared to $78 per ton in the prior year; partially offset by an 11% decrease in inbound recycling volume.
Reinstating guidance at the low end of original estimates, as there is now greater clarity on pandemic impacts.
Deal pipeline continues to be strong and remain on track to invest approximately $600 million in acquisitions this year.
Approved a 5% increase in the quarterly dividend in July.
YTD revenue and EBITDA tracking in line with the prior year; strong Q1 offset by a dip in Q2.
Q2 2020 revenue declines were largely due to reductions in collections and closures resulting from the pandemic.o Volumes in all solid waste regions showed monthly improvement during Q2.o Excluding the most impacted markets in the Northeast and Canada, solid
waste revenues in the quarter were down about 1.3% on a year-over-year basis.
By the end of Q2, about 53% of solid waste commercial customers and 42% of associated revenue in competitive markets that had previously suspended or reduced service had reached out for a resumption in service or an increase in frequency.
Offsetting margin expansion to COVID-19-related costs was partially a result of overall pricing growth coming in at 4.3% in 2Q 2020.
Revised outlook upwards from estimates as of Q1.
M&A strategy remains robust; signed an agreement to acquire a $40 million collection and recycling company.
Renewed its share repurchase program and anticipates continuing to increase its dividend in October.
YTD revenue is down 5% from the prior year, mainly due to Q2 declines, with margins for the year flat with the prior year due to Q2 margin enhancement.
Pricing results were muted relative to expectations due to proactive customer-centric steps to temporarily suspend price increases and certain fees for customers; remain committed to pricing programs.
Total company volumes declined 10.3%.o Volumes declined almost 11% in the commercial line of business.
• Commercial business showing signs of recovery, and MSW volume continuing to improve.
• Residential wastes still high, albeit below peak COVID-19 levels; continue to work through restructuring contracts with municipalities.
o 16% in industrial and 18% in landfill, primarily related to the pandemic. Strong quarter for recycling business driven by a stronger blended commodity
rate of $57 per ton and continued progress toward a fee-for-service model. Estimate that COVID-19 business interruptions had a negative revenue impact of
approximately $400 million.
Reinstated full-year guidance with the 4%–5% revenue decline from 2019; cautiously optimistic about 2H 2020.
ADSW acquisition expected to result in more than $100 million in synergies and significant growth from ADSW’s existing base of 3 million customers.

$120 $70 $62
$84 $102 $109
$601 $567 $477
$590 $516 $550
$200 $199 $201 $100 $156 $156 $300 $192 $176
$3 $59 $182
$1,250 $1,140 $1,141
$521 $523 $523 $400 $99 $99 $200 $601 $568
($974)
$2,258 $1,568 $353
$350 $288
$13 $9
$563
$1,126 $2,274
$523 $461 $585
$1,775 $1,585 $1,602
$927 $941 $928
$1,000 $402 $402
$75 $57
($39)
$204$172
Waste Management:Capital Allocation Strategy—2020E
$4,300
16
Sources: Thomson Reuters Eikon, company earnings releases, and equity research reports. Note: For consistency, all forward numbers are based on analyst consensus estimates and may conflict with specific company guidance.(1) 2020E guidance was not publicly disclosed until the IPO in March.(2) Capital spend figures are net of debt borrowings and asset divestitures.(3) Figures represent the percentage change between 2020E estimates as of today against the time periods referenced; 2019A capital allocation split not shown on this page.
Waste management companies continue to remain bullish about the resilience of the sector, and many reported a resumption in tuck-in acquisition activity, with robust pipelines heading into 2H 2020. GFL remains the acquirer of choice, having completed two transformational acquisitions in the U.S. (WM/ADSW asset package and WCA Waste) within a matter of months.
$3,478$2,374 $2,513
$1,790 $1,560
($54)
$3,747
Restored a portion of COVID-19-
related capex cuts
Continue to invest capex in recent acquisitions
with a portion deferred until 2H 2020
(19%) N/A 6%
Variance vs. 2019A(3) 13% NM 28%Variance vs. 2020E as of 12/31(3)
(13%) (15%)
30% 38%
Debt Paydown/(Borrowings)Cash Dividend Payouts
Net Cash Acquisition CostsCapital Expenditures
Share Repurchases
2019A Capital Spend(2) $3,071 ($54) $1,957
Acquisitions of WM/ADSW
package and WCA Waste
Optimistic on M&A strategy at
attractive valuations
$1,200 $125
($ in millions)
($ in millions)
Variance vs. 2019A(3)
Variance vs. 2020E as of 12/31(3)
2019A Capital Spend(2)
$3,446$4,139
As of Q1 ’20 As of Today
$2,421
$1,630$172
2019A(1) As of Q1 ’20 As of Today As of Q1 ’20 As of Today
As of Q1 ’20 As of Today As of Q1 ’20 As of Today
As of 12/31/19 As of 12/31/19
As of 12/31/19 As of 12/31/19
Suspended share repurchase
program
($ in millions)($ in millions)
($ in millions) ($ in millions) ($ in millions)
Figures represent the breakdown of
capital spend estimates per company
for 2020E, with the consolidated bar
label representing cumulative spend.

Company-Level Debt Performance
17
Waste management companies’ bonds have proved to be less volatile than the broader credit market, while the environmental services names (with the exception of Veolia) are generally in line with market trends.
Environmental Services(1) vs. Investment Grade and High-Yield Bond Indices
Sources: S&P Capital IQ, Refinitiv (formerly Thomson Reuters), Bloomberg.Note: Financial statistics as of 8/14/2020. Tick marks represent end of respective months. (1) Environmental Services chart includes individual debt instrument closest to maturity for each company: CLH 4.8750 15-Jul-2027 '22, HSC 5.7500 31-Jul-2027 '22, SRCL 5.3750 15-Jul-2024 '21, ECOL (Term Loan B) 01-Nov-2026, VIE 23-Nov-2020 MTN.(2) Waste Management chart includes individual debt instrument closest to maturity for each company: GLERL 4.2500 01-Jun-2025 '22, RSG 5.2500 15-Nov-2021, WCN 4.2500 01-Dec-2028 '28, WM 4.6000 01-Mar-2021.
Waste Management(2) vs. Investment Grade and High-Yield Bond Indices
0.8
0.85
0.9
0.95
1
1.05
1.1
1.15
$80
$85
$90
$95
$100
$105
$110
Aug-19 Sep-19 Oct-19 Nov-19 Dec-19 Jan-20 Feb-20 Mar-20 Apr-20 May-20 Jun-20 Jul-20 Aug-20
Clean Harbors Harsco Stericycle US Ecology Veolia S&P 500 BB Index S&P 500 BBB Index
0.8
0.85
0.9
0.95
1
1.05
1.1
1.15
1.2
$90
$95
$100
$105
$110
$115
$120
$125
Aug-19 Sep-19 Oct-19 Nov-19 Dec-19 Jan-20 Feb-20 Mar-20 Apr-20 May-20 Jun-20 Jul-20 Aug-20
GFL Republic Services Waste Connections Waste Management S&P 500 BB Index S&P 500 BBB Index

18
Corporate Finance Financial RestructuringFinancial and Valuation Advisory
No. 1 U.S. M&A Advisor
Top 10 Global M&A Advisor
Leading Capital Markets Advisor
No. 1 U.S. M&A Fairness Opinion Advisor Over the Past 20 Years
1,000+ Annual Valuation Engagements
No. 1 Global Restructuring Advisor
1,000+ Transactions Completed Valued at More Than $2.5 Trillion Collectively
Our clients benefit from our local presence and global reach.
North America Europe and Middle East Asia-Pacific
Atlanta
Boston
Chicago
Dallas
Houston
Los Angeles
Miami
Minneapolis
New York
San Francisco
Washington, D.C.
Beijing
Hong Kong
Singapore
Sydney
Tokyo
Amsterdam
Dubai
Frankfurt
London
Madrid
Milan
Paris
2019 Global Distressed Debt & BankruptcyRestructuring Rankings
Advisor Deals
1 Houlihan Lokey 76
2 PJT Partners Inc 43
3 Moelis & Co 36
4 Lazard 29
5 AlixPartners 19Source: Refinitiv (formerly known as Thomson Reuters)
2000 to 2019 Global M&A Fairness Advisory Rankings
Adv isor Deals
1 Houlihan Lokey 1,057
2 JP Morgan 929
3 Duff & Phelps 734
4 Morgan Stanley 621
5 Bank of America Merrill Lynch 612Refinitiv (formerly known as Thomson Reuters). Announced or completed transactions.
2019 M&A Advisory Rankings All U.S. Transactions
Adv isor Deals
1 Houlihan Lokey 184
2 Goldman Sachs & Co 167
3 JP Morgan 141
4 Morgan Stanley 122
5 Evercore Partners 112Source: Refinitiv (formerly known as Thomson Reuters)
A leading, independent global investment bank providing sophisticated advice to corporations, investors, intermediaries, and governments around the world on financial and strategic matters at every stage of business.

Disclaimer
19
© 2020 Houlihan Lokey. All rights reserved. This material may not be reproduced in any format by any means or redistributed without the prior written consent of Houlihan Lokey.
Houlihan Lokey gathers its data from sources it considers reliable; however, it does not guarantee the accuracy or completeness of the information provided within this presentation. The material presented reflects information known to the authors at the time this presentation was written, and this information is subject to change. Houlihan Lokey makes no representations or warranties, expressed or implied, regarding the accuracy of this material. The views expressed in this material accurately reflect the personal views of the authors regarding the subject securities and issuers and do not necessarily coincide with those of Houlihan Lokey. Officers, directors, and partners in the Houlihan Lokey group of companies may have positions in the securities of the companies discussed. This presentation does not constitute advice or a recommendation, offer, or solicitation with respect to the securities of any company discussed herein, is not intended to provide information upon which to base an investment decision, and should not be construed as such. Houlihan Lokey or its affiliates may from time to time provide investment banking or related services to these companies. Like all Houlihan Lokey employees, the authors of this presentation receive compensation that is affected by overall firm profitability.
Houlihan Lokey is a trade name for Houlihan Lokey, Inc., and its subsidiaries and affiliates, which include those in (i) the United States: Houlihan Lokey Capital, Inc., an SEC-registered broker-dealer and member of FINRA (www.finra.org) and SIPC (www.sipc.org) (investment banking services); Houlihan Lokey Financial Advisors, Inc. (financial advisory services); HL Finance, LLC (syndicated leveraged finance platform); and Houlihan Lokey Real Estate Group, Inc. (real estate advisory services); (ii) Europe: Houlihan Lokey EMEA, LLP, and Houlihan Lokey (Corporate Finance) Limited, authorized and regulated by the U.K. Financial Conduct Authority; Houlihan Lokey S.p.A.; Houlihan Lokey GmbH; Houlihan Lokey (Netherlands) B.V.; Houlihan Lokey (España), S.A.; and Houlihan Lokey (Corporate Finance), S.A.; (iii) the United Arab Emirates, Dubai International Financial Centre (Dubai): Houlihan Lokey (MEA Financial Advisory) Limited, regulated by the Dubai Financial Services Authority for the provision of advising on financial products, arranging deals in investments, and arranging credit and advising on credit to professional clients only; (iv) Singapore: Houlihan Lokey (Singapore) Private Limited, an “exempt corporate finance adviser” able to provide exempt corporate finance advisory services to accredited investors only; (v) Hong Kong SAR: Houlihan Lokey (China) Limited, licensed in Hong Kong by the Securities and Futures Commission to conduct Type 1, 4, and 6 regulated activities to professional investors only; (vi) China: Houlihan Lokey Howard & Zukin Investment Consulting (Beijing) Co., Limited (financial advisory services); (vii) Japan: Houlihan Lokey K.K. (financial advisory services); and (viii) Australia: Houlihan Lokey (Australia) Pty Limited (ABN 74 601 825 227), a company incorporated in Australia and licensed by the Australian Securities and Investments Commission (AFSL number 474953) in respect of financial services provided to wholesale clients only. In the European Economic Area (EEA), Dubai, Singapore, Hong Kong, and Australia, this communication is directed to intended recipients, including actual or potential professional clients (EEA and Dubai), accredited investors (Singapore), professional investors (Hong Kong), and wholesale clients (Australia), respectively. Other persons, such as retail clients, are NOT the intended recipients of our communications or services and should not act upon this communication.

CORPORATE FINANCE
FINANCIAL RESTRUCTURING
FINANCIAL AND VALUATION ADVISORY
HL.com