environmental stewardship box gum grassy woodland...
TRANSCRIPT
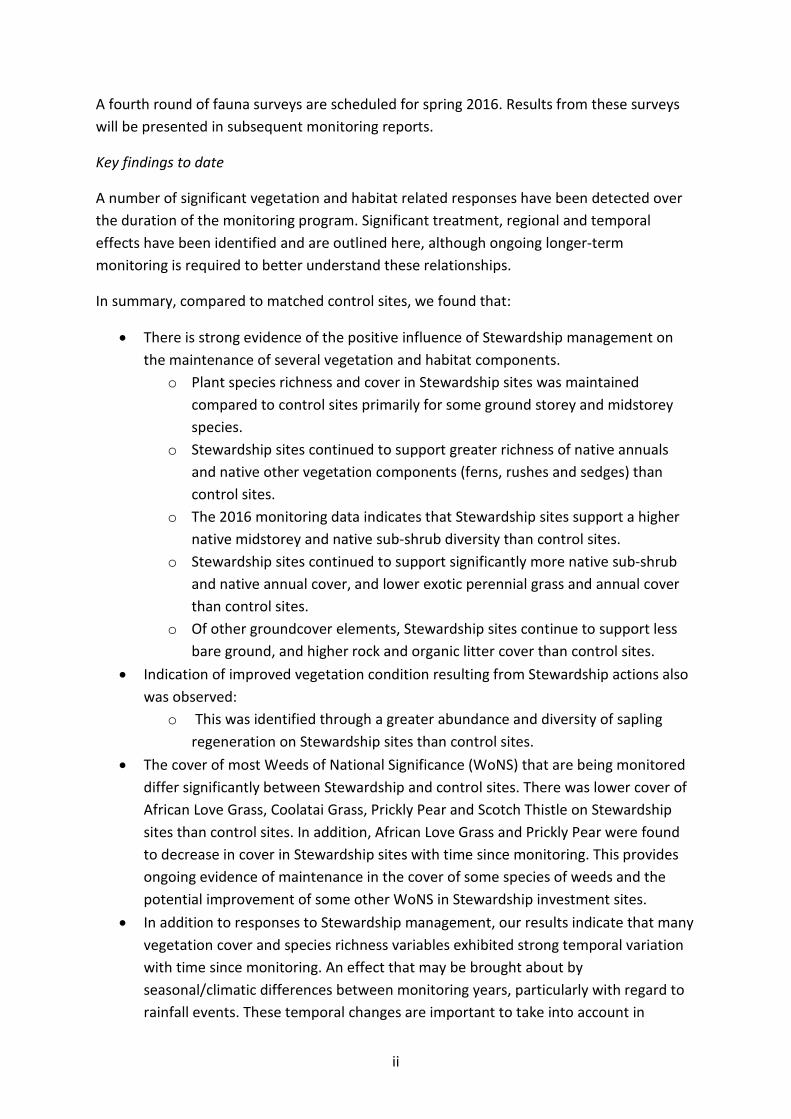
Environmental Stewardship Box Gum Grassy Woodland Monitoring Project Annual Report for the Department of the Environment Daniel Florance, Jeff Wood and David Lindenmayer June 2016
Fenner School of Environment and Society ANU College of Medicine, Biology and Environment

Conservation and Landscape Ecology Group Fenner School of Environment and Society The Australian National University 141 Linnaeus Way Canberra ACT 2601 02 61257800 http://fennerschool.anu.edu.au/research/groups/conservation-landscape-ecology
Executive Summary In 2007-08, the then Department of Sustainability, Environment, Water, Population and Communities (SEWPAC) (now Department Of The Environment [DOTE]) developed the Environmental Stewardship Program (ESP). The objective of the program is to maintain and improve the extent and condition of targeted matters of national environmental significance under the Environment Protection and Biodiversity Conservation (EPBC) Act 1999. The Critically Endangered Box Gum Grassy Woodland (BGGW) ecological community was the first matter of National Environmental Significance targeted by the Program.
To report on the achievement of this objective in box gum grassy woodland, a team from The Australian National University (ANU) was contracted by DOTE to establish a network of long-term biodiversity monitoring sites on 157 properties funded to manage box gum grassy woodland under the first four rounds of the ESP. These properties span six NSW Local Land Services (LLS) NRM regions and two NRM regions in QLD.
On each property, a biodiversity monitoring site was established within a Stewardship investment area (hereafter Stewardship sites) and a site was established in a matched reference paddock (hereafter Control sites) so as to monitor and identify changes observed as a result of ESP implementation. During 2010, baseline surveys for vegetation, herpetofauna (reptiles and amphibians) and birds were conducted, with any missed sites surveyed in the following 2011 season. Following the baseline surveys, all sites were surveyed again in 2012. To gauge the impact and effectiveness of ESP, repeat biennial surveys were scheduled throughout the term of the program. In accordance with the Continued Project Implementation Report 2013 (Florance et al. 2013), a subset of sites are to be monitored biennially from 2014-2017.
The Environmental Stewardship Program has proven to be an important social tool for aiding conservation of BGGW on private land in rural communities. Regular visits by the ANU monitoring team have acted to support on-ground actions, gain valuable perspectives from landholders, and foster continuing interest from landholders in the ESP and biodiversity conservation in agricultural landscapes more generally.
The ESP represents the most comprehensive, cost-effective, and rigorously designed agri-environment scheme implemented in Australian history. With 6 years of existing monitoring data, the program is in an excellent position to extend the monitoring program so that the long-term values of Environmental Stewardship in preserving and maintaining BGGW condition can be discerned.
The Australian National University long-term biodiversity monitoring component of the Environmental Stewardship Program continues to operate within budget. The ANU team has sufficient funds to complete all contracted milestones during 2016. This report outlines the results from recently completed 2016 vegetation monitoring, representing the fourth round of vegetation surveys.
i
A fourth round of fauna surveys are scheduled for spring 2016. Results from these surveys will be presented in subsequent monitoring reports.
Key findings to date
A number of significant vegetation and habitat related responses have been detected over the duration of the monitoring program. Significant treatment, regional and temporal effects have been identified and are outlined here, although ongoing longer-term monitoring is required to better understand these relationships.
In summary, compared to matched control sites, we found that:
• There is strong evidence of the positive influence of Stewardship management on the maintenance of several vegetation and habitat components.
o Plant species richness and cover in Stewardship sites was maintained compared to control sites primarily for some ground storey and midstorey species.
o Stewardship sites continued to support greater richness of native annuals and native other vegetation components (ferns, rushes and sedges) than control sites.
o The 2016 monitoring data indicates that Stewardship sites support a higher native midstorey and native sub-shrub diversity than control sites.
o Stewardship sites continued to support significantly more native sub-shrub and native annual cover, and lower exotic perennial grass and annual cover than control sites.
o Of other groundcover elements, Stewardship sites continue to support less bare ground, and higher rock and organic litter cover than control sites.
• Indication of improved vegetation condition resulting from Stewardship actions also was observed:
o This was identified through a greater abundance and diversity of sapling regeneration on Stewardship sites than control sites.
• The cover of most Weeds of National Significance (WoNS) that are being monitored differ significantly between Stewardship and control sites. There was lower cover of African Love Grass, Coolatai Grass, Prickly Pear and Scotch Thistle on Stewardship sites than control sites. In addition, African Love Grass and Prickly Pear were found to decrease in cover in Stewardship sites with time since monitoring. This provides ongoing evidence of maintenance in the cover of some species of weeds and the potential improvement of some other WoNS in Stewardship investment sites.
• In addition to responses to Stewardship management, our results indicate that many vegetation cover and species richness variables exhibited strong temporal variation with time since monitoring. An effect that may be brought about by seasonal/climatic differences between monitoring years, particularly with regard to rainfall events. These temporal changes are important to take into account in
ii
assessing the effectiveness of the program. By monitoring beyond short and long-term climatic cycles it is possible to minimise or isolate the noise of climatic effects. Large regional-level latitudinal effects exist in the various measures of biodiversity. In particular, from the outset of the monitoring program the starting condition of the sites in the southern regions generally supported higher weed cover and abundance than in the north. The northern regions represented the most intact and structurally diverse woodlands. Given the generally better starting condition of monitored components of vegetation in northern sites, it is likely that the northern regions may positively respond sooner to Stewardship management than sites in the southern regions.
Emergent issues for Stewardship management
• The cover of Blackberry and St John’s Wort was greater on Stewardship sites than control sites. It is assumed that this may be a response associated with the removal of grazing, or grazing not occurring during critical periods to deter seed set of these species. In addition, it may be an insufficient complimentary weed management effort.
• Macropod scats were higher in Stewardship sites than control sites, suggesting macropod abundance is higher in Stewardship sites. Scats also increased generally with time, but there was no difference between Stewardship and control sites detected with time at this stage. However, macropod activity was recorded from only 2014 onwards so it is important to monitor this variable to determine if macropod abundance becomes greater in Stewardship sites. Over-grazing and disturbance from macropods could negatively affect vegetation and habitat condition, and hence the desired outcomes of the ESP.
• It is important to flag these emergent issues early so that necessary management actions may be undertaken before a serious problem arises. Ongoing monitoring plays a role in alerting both the Australian Government and land managers to any emergent issues, such as the need for more rigorous WoNS management or macropod control.
Acknowledgements A large number of people helped gather the information provided in this final report. We would like to thank all persons involved in the monitoring over the duration of this project, in particular members of the ANU Field Team for their efforts, particularly in often challenging survey conditions. Support from ANU statisticians, DOTE collaborators as well as the State Government Catchment Management Authorities was invaluable. A special thanks is due to Kirstin Proft for all her assistance with graphs and figures. We also thank the land managers involved in the study for their ongoing contributions and support.
iii
Contents
Executive Summary i
Acknowledgements iii
Contents iv
Introduction 1
Methodology 1
Field analysis 1 Statistical analysis 2
Results: Vegetation 5
Species richness 5 Native vegetation 8 Exotic vegetation 11 Biometrics 13 Native vegetation cover 16 Exotic vegetation cover 19 Biophysical elements 21 Macropod scats 24 Vegetation plot features 26
Habitat composition 26 Weeds of National Significance 31
Weed presence 31 Weed percentage cover 31 Overstorey elements and saplings 32
Discussion 49
Species richness 49 Percentage cover (biometrics) 49 Structural habitat composition 50 Overstorey elements and saplings 50 Macropod grazing pressure 51 Latitudinal effects 51 Weeds of National Significance 52 Emergent issues 52 Value of monitoring 54 Value of BGGW ESP 54
Ecological benefits 54 Social benefits 55 Scientific benefits 56
Operational comments 56 Conclusions 58
References 59
iv
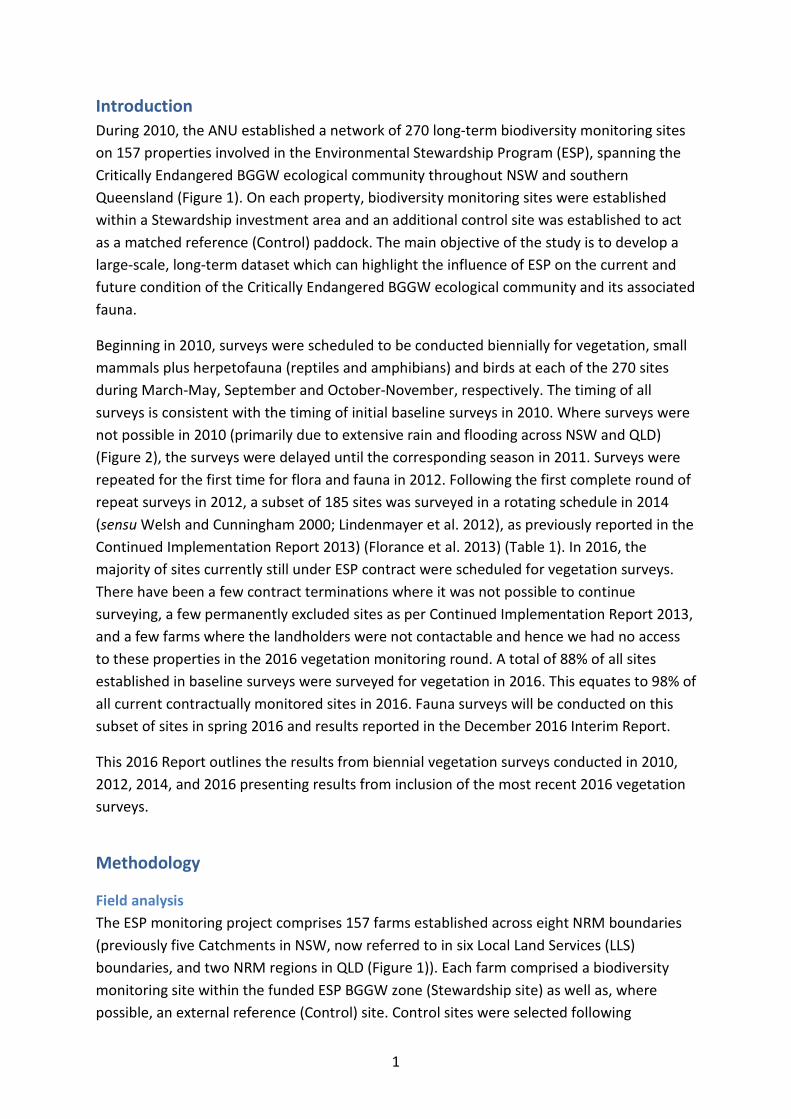
Introduction During 2010, the ANU established a network of 270 long-term biodiversity monitoring sites on 157 properties involved in the Environmental Stewardship Program (ESP), spanning the Critically Endangered BGGW ecological community throughout NSW and southern Queensland (Figure 1). On each property, biodiversity monitoring sites were established within a Stewardship investment area and an additional control site was established to act as a matched reference (Control) paddock. The main objective of the study is to develop a large-scale, long-term dataset which can highlight the influence of ESP on the current and future condition of the Critically Endangered BGGW ecological community and its associated fauna.
Beginning in 2010, surveys were scheduled to be conducted biennially for vegetation, small mammals plus herpetofauna (reptiles and amphibians) and birds at each of the 270 sites during March-May, September and October-November, respectively. The timing of all surveys is consistent with the timing of initial baseline surveys in 2010. Where surveys were not possible in 2010 (primarily due to extensive rain and flooding across NSW and QLD) (Figure 2), the surveys were delayed until the corresponding season in 2011. Surveys were repeated for the first time for flora and fauna in 2012. Following the first complete round of repeat surveys in 2012, a subset of 185 sites was surveyed in a rotating schedule in 2014 (sensu Welsh and Cunningham 2000; Lindenmayer et al. 2012), as previously reported in the Continued Implementation Report 2013) (Florance et al. 2013) (Table 1). In 2016, the majority of sites currently still under ESP contract were scheduled for vegetation surveys. There have been a few contract terminations where it was not possible to continue surveying, a few permanently excluded sites as per Continued Implementation Report 2013, and a few farms where the landholders were not contactable and hence we had no access to these properties in the 2016 vegetation monitoring round. A total of 88% of all sites established in baseline surveys were surveyed for vegetation in 2016. This equates to 98% of all current contractually monitored sites in 2016. Fauna surveys will be conducted on this subset of sites in spring 2016 and results reported in the December 2016 Interim Report.
This 2016 Report outlines the results from biennial vegetation surveys conducted in 2010, 2012, 2014, and 2016 presenting results from inclusion of the most recent 2016 vegetation surveys.
Methodology
Field analysis The ESP monitoring project comprises 157 farms established across eight NRM boundaries (previously five Catchments in NSW, now referred to in six Local Land Services (LLS) boundaries, and two NRM regions in QLD (Figure 1)). Each farm comprised a biodiversity monitoring site within the funded ESP BGGW zone (Stewardship site) as well as, where possible, an external reference (Control) site. Control sites were selected following
1

extensive discussion and site inspection with the land managers to determine a paddock that represented an ‘average’ management condition of the rest of the farm more broadly. Control sites were then matched by vegetation type and condition, as well as other site characteristics such as landform, patch size and connectivity. This design comprised a total of 270 monitoring sites. Table 1 outlines the number of sites monitored during the Baseline (2010/2011) and the 2012, 2014 and 2016 surveys for vegetation, herpetofauna and birds.
Each survey round was completed successfully, with greater than 95% of all sites surveyed in 2010 and 2012, and in accordance with the Continued Project Implementation Report 2013 (Florance et al. 2013), 69% of total sites were surveyed in 2014 (Table 1) with the same eight observers being used for all surveys. During the 2010 survey, severe weather prevented the ANU from visiting all farms, particularly in the northern region of the study (Figure 2). The majority of sites missed during the 2010 survey year were subsequently surveyed the following year (and during the corresponding season), with the exception of 10 sites where safe access was not possible (Table 1). Vegetation surveys were completed at all 270 sites during 2012. Herpetofaunal and bird surveys were completed at 260 (96%) of sites in 2012 (Table 1) with safe access or expiration of Government contracts preventing surveys at the remaining sites. Vegetation surveys were completed at 185 sites (69%) in 2014. Fauna surveys were conducted in September–November 2014 on the same subset of sites except for where access was an issue (177 sites surveyed (66%)).
All vegetation surveys were conducted during February – April of 2010, 2012, 2014 and 2016 with the small number of sites missed in 2010 resurveyed during the same season in 2011. A rotating survey schedule was adopted for 2014, meaning a subset (69%) of sites was surveyed in 2014. Most funded ESP sites, with the exception of expired contracts, permanently excluded sites, and a few properties that could not be accessed, were revisited in 2016 for vegetation surveys (98% of all currently contractually monitored sites successfully surveyed in 2016). Surveys involved collection of three major datasets at each site; (i) plot-based species richness, (ii) biometric (% cover) variables and (iii) habitat composition (i.e. quantification of tree hollows, coarse woody debris). The protocols used in 2012, 2014 and 2016 were the same as those used in 2010 (Lindenmayer et al. 2010; Lindenmayer et al. 2012) but with the addition of some supplementary variables measuring the occurrence of Weeds of National Significance, and macropod activity. The projected canopy cover and the abundance of regenerating saplings of the overstorey trees was recorded, and the species richness of saplings regenerating (as a proportion of the number of overstorey species present) was calculated for each site.
Statistical analysis In accordance with the new NSW state-level NRM boundary change from Catchment Management Authorities to Local Land Services (LLS), we have adopted the LLS boundaries in our regional analyses. Vegetation measures were analysed by fitting mixed models with nested random effects. The farm effect and the site effect within farms were assumed to be
2
random. A residual term was included to account for all other random variation. The effects of LLS, Stewardship versus Control and year were taken to be fixed, as were all possible interactions between these factors. The significance of the fixed effects was tested using approximate F-tests. Variables with a very large number of zeros were excluded from the analyses.
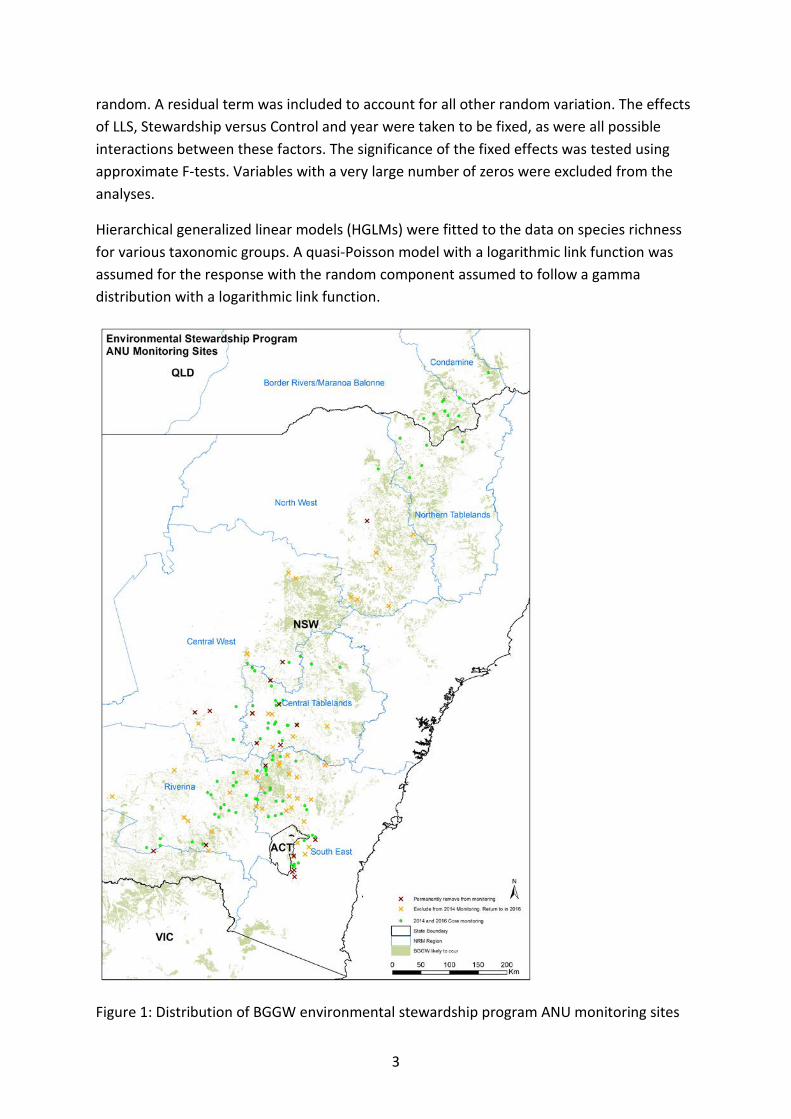
Hierarchical generalized linear models (HGLMs) were fitted to the data on species richness for various taxonomic groups. A quasi-Poisson model with a logarithmic link function was assumed for the response with the random component assumed to follow a gamma distribution with a logarithmic link function.
Figure 1: Distribution of BGGW environmental stewardship program ANU monitoring sites
3
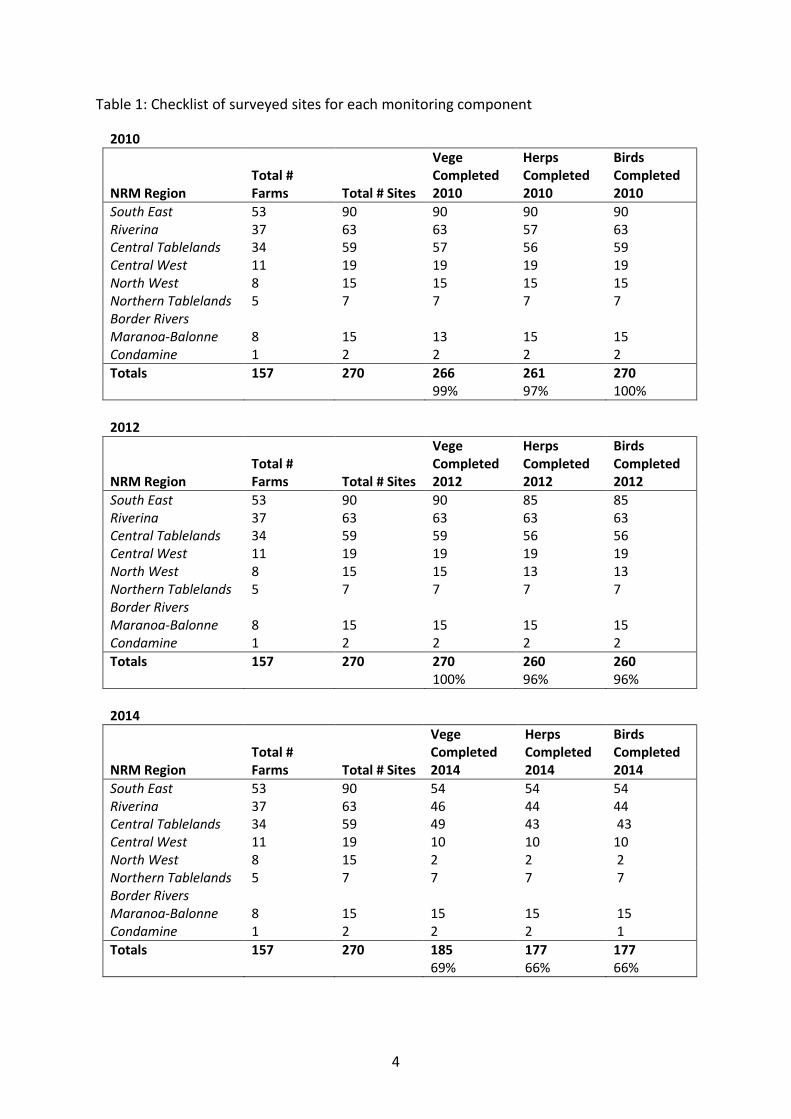
Table 1: Checklist of surveyed sites for each monitoring component
2010
NRM Region Total # Farms Total # Sites
Vege Completed 2010
Herps Completed 2010
Birds Completed 2010
South East 53 90 90 90 90 Riverina 37 63 63 57 63 Central Tablelands 34 59 57 56 59 Central West 11 19 19 19 19 North West 8 15 15 15 15 Northern Tablelands 5 7 7 7 7 Border Rivers Maranoa-Balonne 8 15 13 15 15 Condamine 1 2 2 2 2 Totals 157 270 266 261 270 99% 97% 100%
2012
NRM Region Total # Farms Total # Sites
Vege Completed 2012
Herps Completed 2012
Birds Completed 2012
South East 53 90 90 85 85 Riverina 37 63 63 63 63 Central Tablelands 34 59 59 56 56 Central West 11 19 19 19 19 North West 8 15 15 13 13 Northern Tablelands 5 7 7 7 7 Border Rivers Maranoa-Balonne 8 15 15 15 15 Condamine 1 2 2 2 2 Totals 157 270 270 260 260 100% 96% 96%
2014
NRM Region Total # Farms Total # Sites
Vege Completed 2014
Herps Completed 2014
Birds Completed 2014
South East 53 90 54 54 54 Riverina 37 63 46 44 44 Central Tablelands 34 59 49 43 43 Central West 11 19 10 10 10 North West 8 15 2 2 2 Northern Tablelands 5 7 7 7 7 Border Rivers Maranoa-Balonne 8 15 15 15 15 Condamine 1 2 2 2 1 Totals 157 270 185 177 177 69% 66% 66%
4
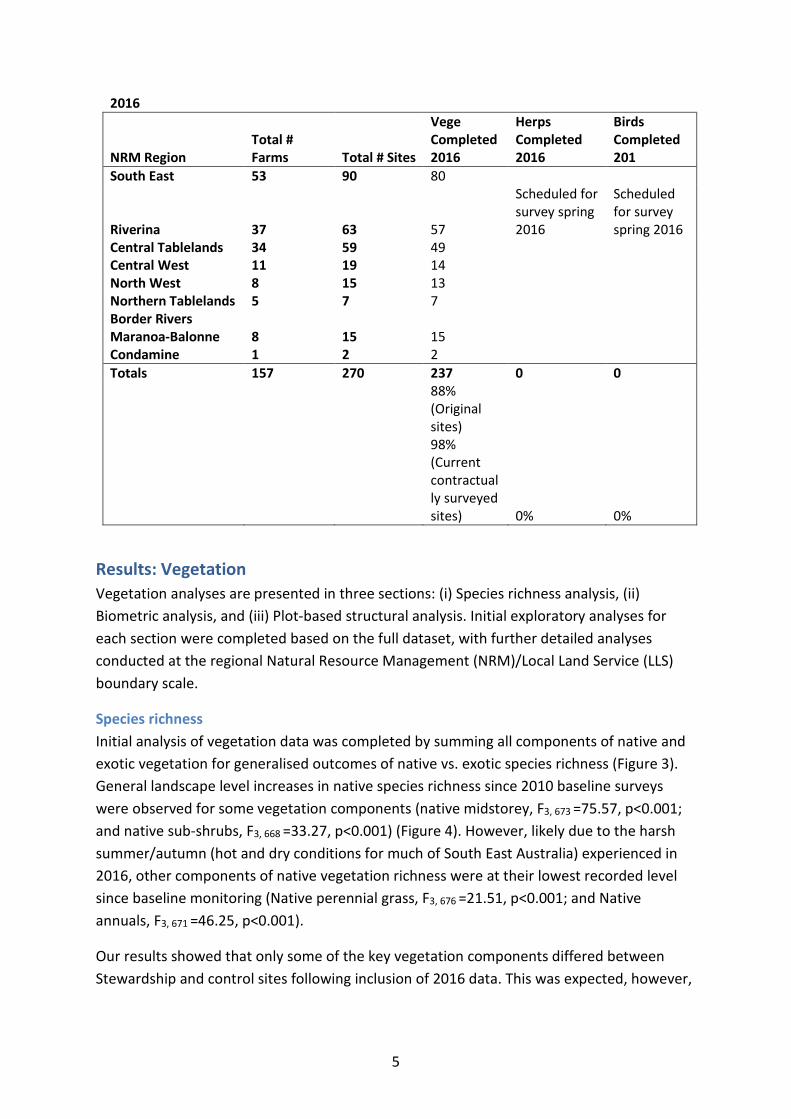
2016
NRM Region Total # Farms Total # Sites
Vege Completed 2016
Herps Completed 2016
Birds Completed 201
South East 53 90 80
Riverina 37 63 57
Scheduled for survey spring 2016
Scheduled for survey spring 2016
Central Tablelands 34 59 49 Central West 11 19 14 North West 8 15 13 Northern Tablelands 5 7 7 Border Rivers Maranoa-Balonne 8 15 15 Condamine 1 2 2 Totals 157 270 237 0 0
88% (Original sites) 98% (Current contractually surveyed sites) 0% 0%
Results: Vegetation Vegetation analyses are presented in three sections: (i) Species richness analysis, (ii) Biometric analysis, and (iii) Plot-based structural analysis. Initial exploratory analyses for each section were completed based on the full dataset, with further detailed analyses conducted at the regional Natural Resource Management (NRM)/Local Land Service (LLS) boundary scale.
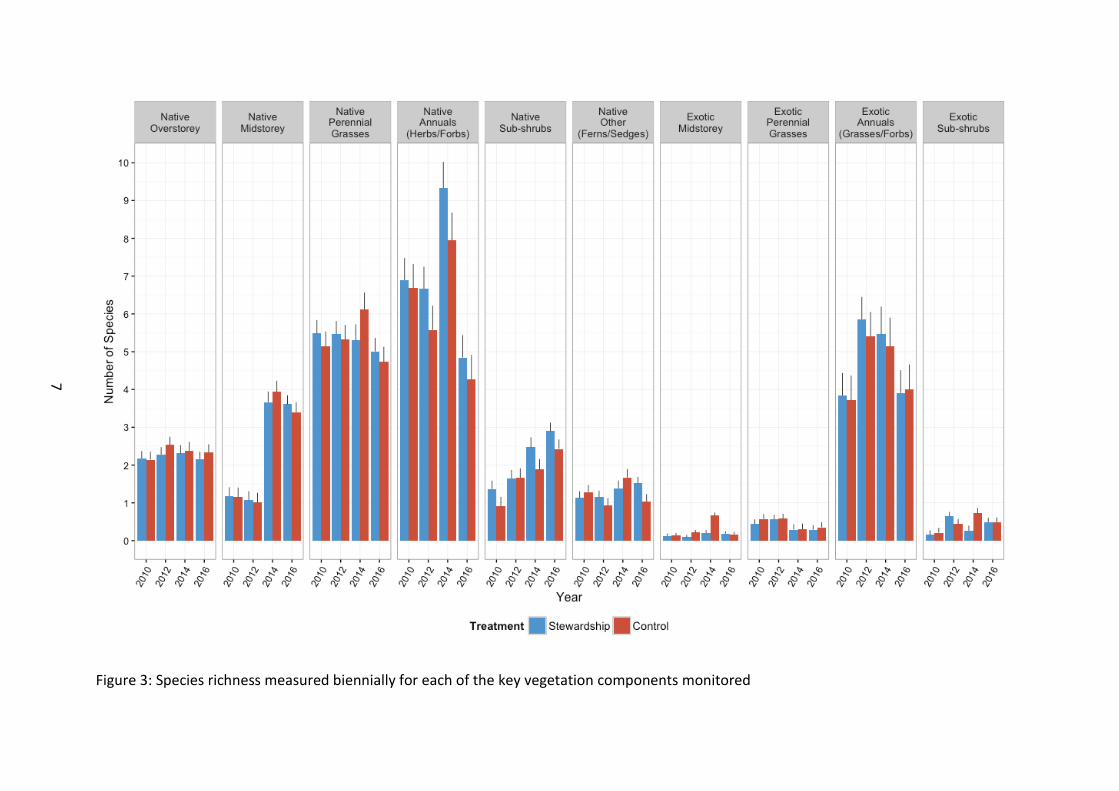
Species richness Initial analysis of vegetation data was completed by summing all components of native and exotic vegetation for generalised outcomes of native vs. exotic species richness (Figure 3). General landscape level increases in native species richness since 2010 baseline surveys were observed for some vegetation components (native midstorey, F3, 673 =75.57, p<0.001; and native sub-shrubs, F3, 668 =33.27, p<0.001) (Figure 4). However, likely due to the harsh summer/autumn (hot and dry conditions for much of South East Australia) experienced in 2016, other components of native vegetation richness were at their lowest recorded level since baseline monitoring (Native perennial grass, F3, 676 =21.51, p<0.001; and Native annuals, F3, 671 =46.25, p<0.001).
Our results showed that only some of the key vegetation components differed between Stewardship and control sites following inclusion of 2016 data. This was expected, however,
5
given the expected length of time required for ecosystem change to occur relative to the limited duration of monitoring to date.
Native midstorey richness is now higher in Stewardship sites following the inclusion of 2016 data (F1, 109 =8.40, p=0.005). Native annual richness (F1, 111 =22.73, p<0.001) and native sub-shrub richness (F1, 111 = 6.27, p=0.0.014) is maintained at a higher level in Stewardship sites, suggesting that Stewardship intervention is at a minimum maintaining some key components of native vegetation in these investment areas. Ongoing monitoring into the ESP will help determine if Stewardship management in fact improves the condition of these sites or whether they offer an important buffer for vegetation survival against harsh climatic conditions such as extended hot and dry periods and over-grazing.
There was a consistently smaller number of exotic plant species versus native species for each of the respective vegetation components across the entire study region (Figure 5). Southern sites had a greater richness of exotic annual species from the outset of baseline condition monitoring (F7, 142 =9.72, p<0.001).
None of the exotic components of vegetation differed between Stewardship and control sites (exotic midstorey, F1, 117 =0.10, p=0.754; exotic perennial grass, F1, 117 =1.52, p=0.220; exotic annuals, F1, 108 =0.66, p=0.417; exotic sub-shrubs, F1, 95 =0.69, p=0.408).
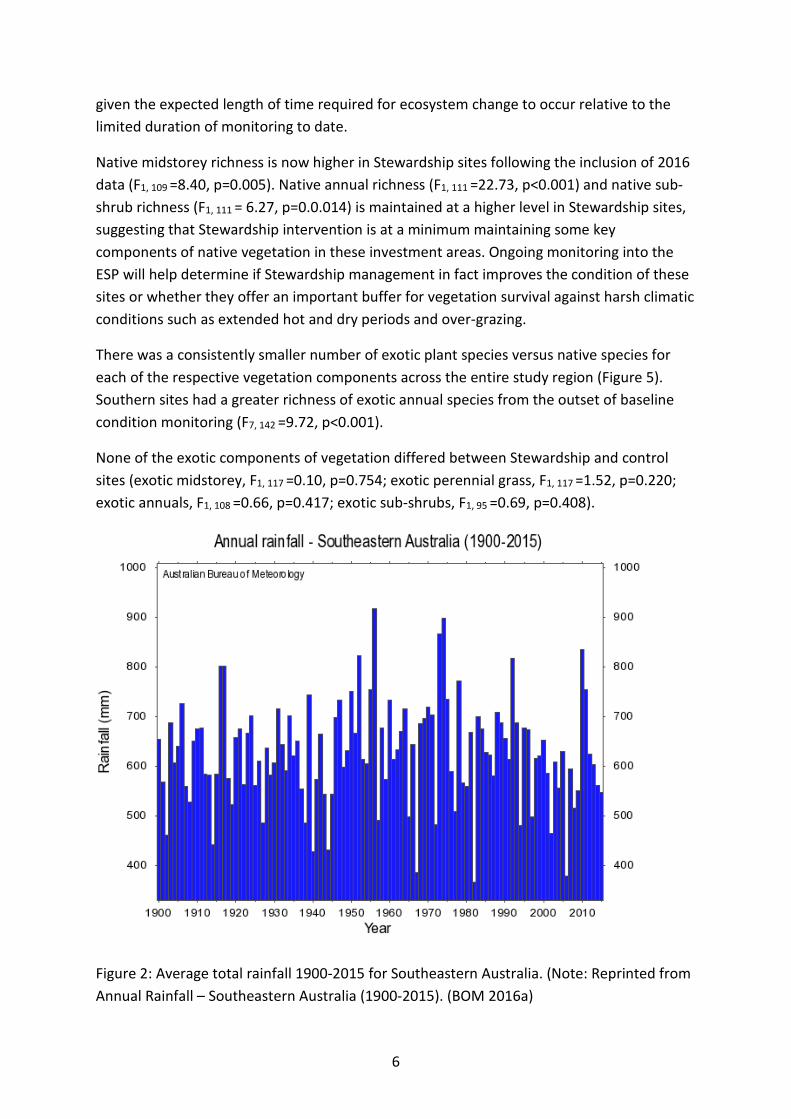
Figure 2: Average total rainfall 1900-2015 for Southeastern Australia. (Note: Reprinted from Annual Rainfall – Southeastern Australia (1900-2015). (BOM 2016a)
6
7
Figure 3: Species richness measured biennially for each of the key vegetation components monitored
Native vegetation There was no significant difference in native overstorey species richness between Stewardship and Controls (F1, 116 =0.57, p=0.452), nor was there any discernible difference between regions from the outset of baseline monitoring (F7, 142 =0.89, p=0.516) (Figure 4). There was an overall difference between years, but no obvious patterns emerged at this stage beyond expected natural fluctuation (F3, 669 =7.11, p<0.001). Effects of time may be masked by a non-significant, yet trending interaction between year and NRM regions (F21, 669
=1.45, p=0.088). Further investigation at the regional level as temporal data accrues will be needed to determine any direct change over time.
Native midstorey species richness was significantly greater on Stewardship sites across the study region (F1, 109 =8.40, p=0.005). Whilst this was true for most NRM regions, control sites had marginally higher richness in a few of the regions (northern regions – Border Rivers and Condamine as well as Central West) (F7, 110 =2.89, p=0.008), reflecting the generally better condition of native vegetation in the northern regions. As mentioned in the 2014 analysis of the dataset, native midstorey richness was in fact greater in Control sites in 2014. It is therefore promising that this monitored native vegetation component is now greater on Stewardship sites than Control sites with the inclusion of 2016 survey data. At this stage it is only a very small difference in average species richness for midstorey but an exciting emerging result.
Midstorey richness overall increased strongly across the study region with time since baseline surveys (F3, 673 =75.57, p<0.001). However as midstorey richness differed at the regional level (F7, 139 =7.84, p<0.001) with a generalised pattern of diversity increasing with latitude, the strength and direction of this change over time differed between NRM regions (F21, 672 =14.61, p<0.001). Northern regions had a stronger positive response over time with native midstorey species richness, likely a reflection of the better starting condition of northern sites.
Native perennial grass species richness did not differ between Stewardship and Controls (F1,
121 =2.14, p=0.146). Overall richness fluctuated with time elapsed since the baseline surveys (F3, 676 =21.51, p<0.001) (Figure 3). Richness generally increased with latitude, i.e. greater native perennial grass species richness in northern NRM regions (F7, 140 =3.09, p=0.005). However the strong influence of time and the difference in fluctuations within individual NRM regions means it is difficult to determine at this stage if condition of northern sites have improved in stewardship sites over time (F21, 675 =3.71, p<0.001).
Overall, native annual groundcover (forbs and herbs) species richness was significantly higher in Stewardship than Control sites (F1, 111 =22.73, p<0.001) (Figure 3). Northern sites (north of and including North West regions) typically supported higher species richness than southern sites from the outset of baseline monitoring (F7, 141 =6.24, p<0.001). Overall richness changed with time since baseline surveys commenced and appeared to fluctuate up to 2014, and 2016 represents the lowest richness recorded so far (F3, 671 =46.25,
8
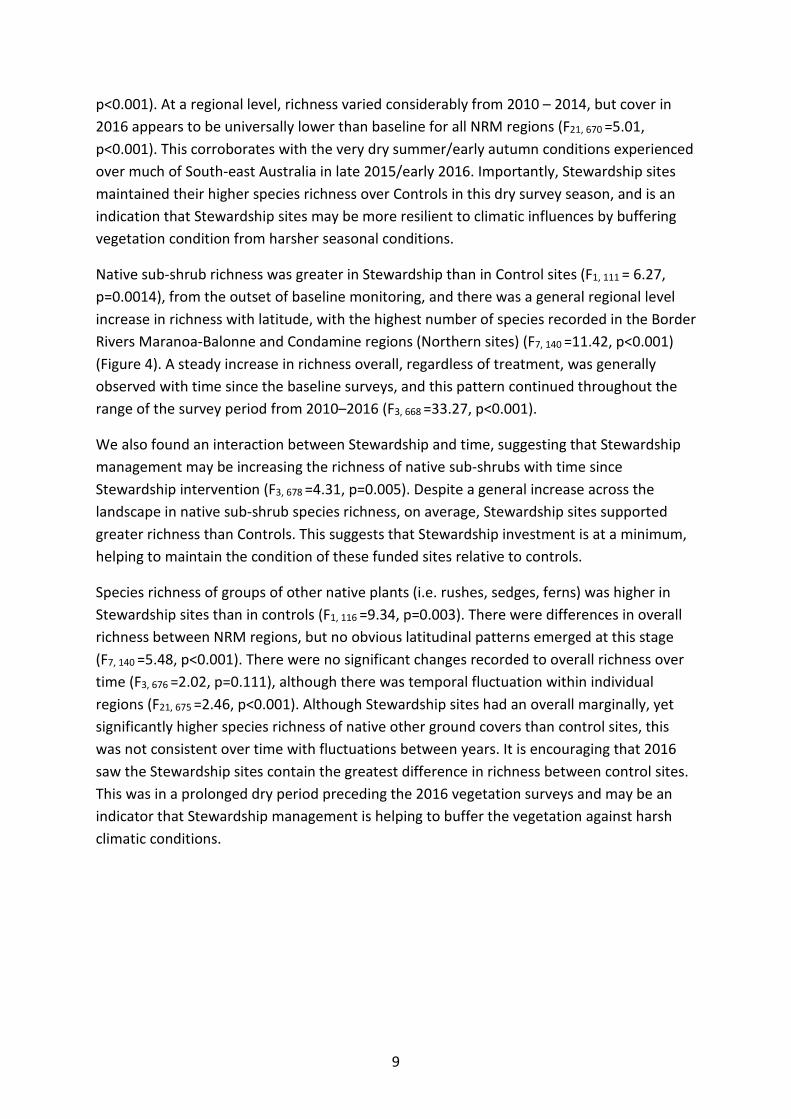
p<0.001). At a regional level, richness varied considerably from 2010 – 2014, but cover in 2016 appears to be universally lower than baseline for all NRM regions (F21, 670 =5.01, p<0.001). This corroborates with the very dry summer/early autumn conditions experienced over much of South-east Australia in late 2015/early 2016. Importantly, Stewardship sites maintained their higher species richness over Controls in this dry survey season, and is an indication that Stewardship sites may be more resilient to climatic influences by buffering vegetation condition from harsher seasonal conditions.
Native sub-shrub richness was greater in Stewardship than in Control sites (F1, 111 = 6.27, p=0.0014), from the outset of baseline monitoring, and there was a general regional level increase in richness with latitude, with the highest number of species recorded in the Border Rivers Maranoa-Balonne and Condamine regions (Northern sites) (F7, 140 =11.42, p<0.001) (Figure 4). A steady increase in richness overall, regardless of treatment, was generally observed with time since the baseline surveys, and this pattern continued throughout the range of the survey period from 2010–2016 (F3, 668 =33.27, p<0.001).
We also found an interaction between Stewardship and time, suggesting that Stewardship management may be increasing the richness of native sub-shrubs with time since Stewardship intervention (F3, 678 =4.31, p=0.005). Despite a general increase across the landscape in native sub-shrub species richness, on average, Stewardship sites supported greater richness than Controls. This suggests that Stewardship investment is at a minimum, helping to maintain the condition of these funded sites relative to controls.
Species richness of groups of other native plants (i.e. rushes, sedges, ferns) was higher in Stewardship sites than in controls (F1, 116 =9.34, p=0.003). There were differences in overall richness between NRM regions, but no obvious latitudinal patterns emerged at this stage (F7, 140 =5.48, p<0.001). There were no significant changes recorded to overall richness over time (F3, 676 =2.02, p=0.111), although there was temporal fluctuation within individual regions (F21, 675 =2.46, p<0.001). Although Stewardship sites had an overall marginally, yet significantly higher species richness of native other ground covers than control sites, this was not consistent over time with fluctuations between years. It is encouraging that 2016 saw the Stewardship sites contain the greatest difference in richness between control sites. This was in a prolonged dry period preceding the 2016 vegetation surveys and may be an indicator that Stewardship management is helping to buffer the vegetation against harsh climatic conditions.
9
10
Figure 4: Native species richness for each NRM region
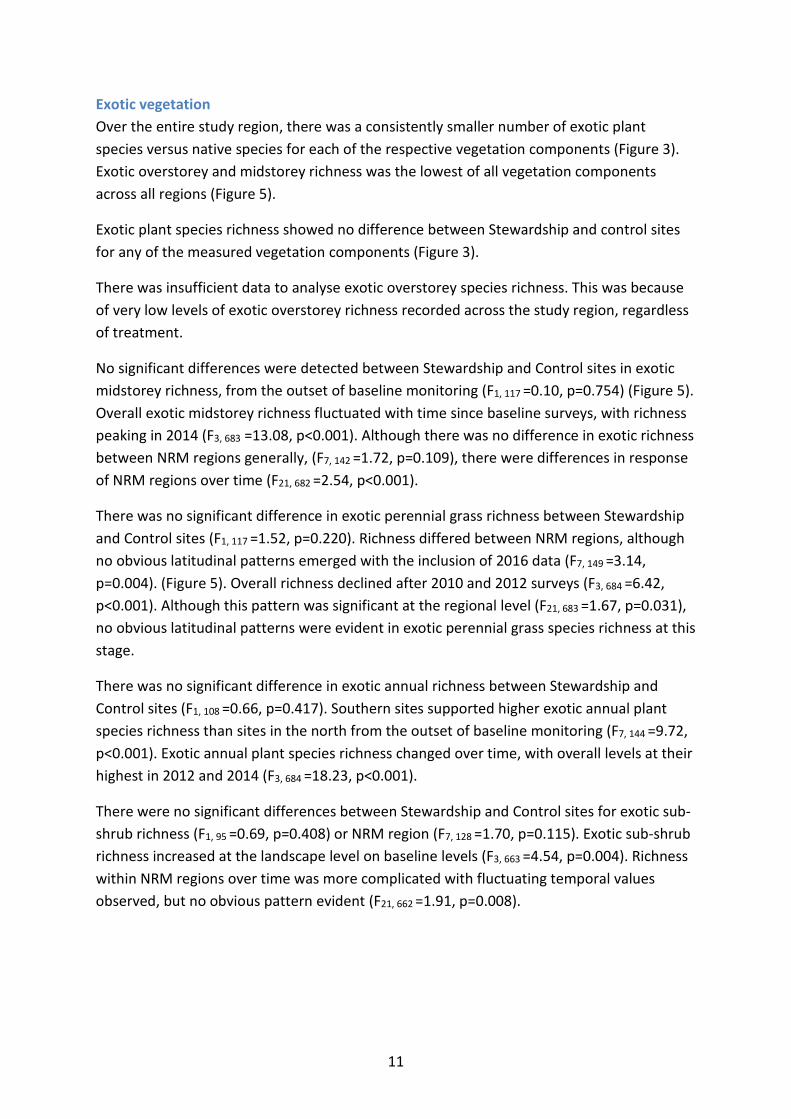
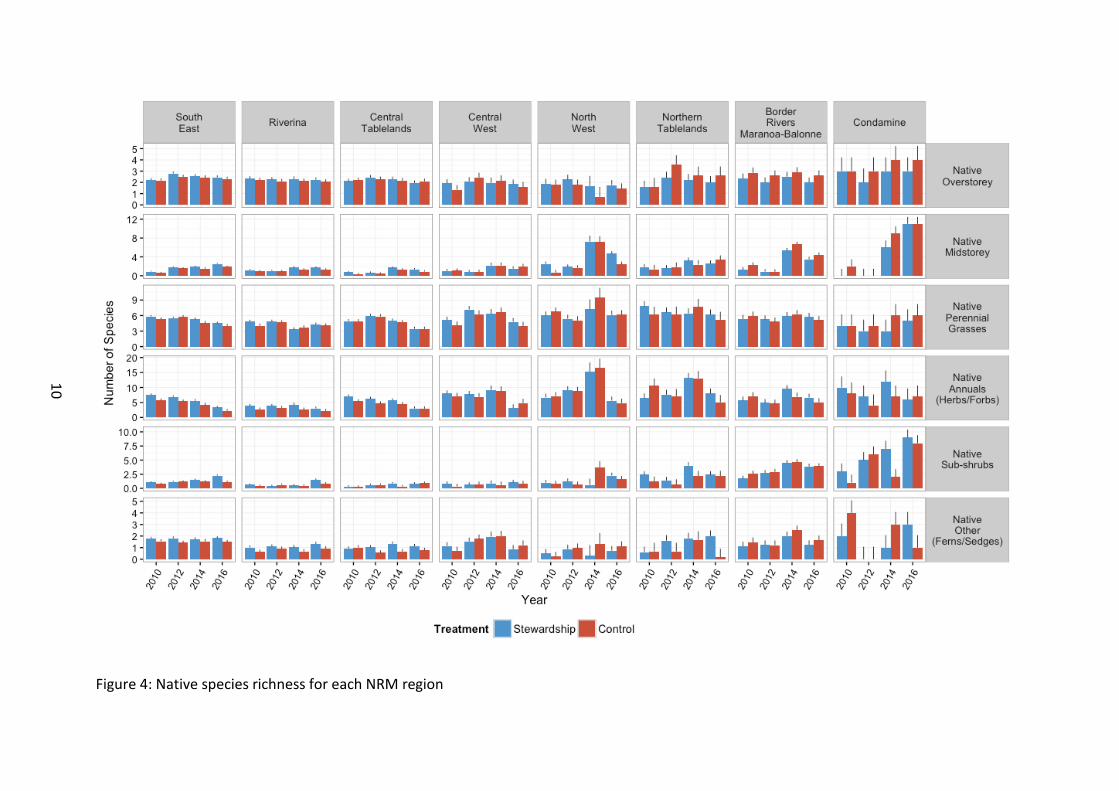
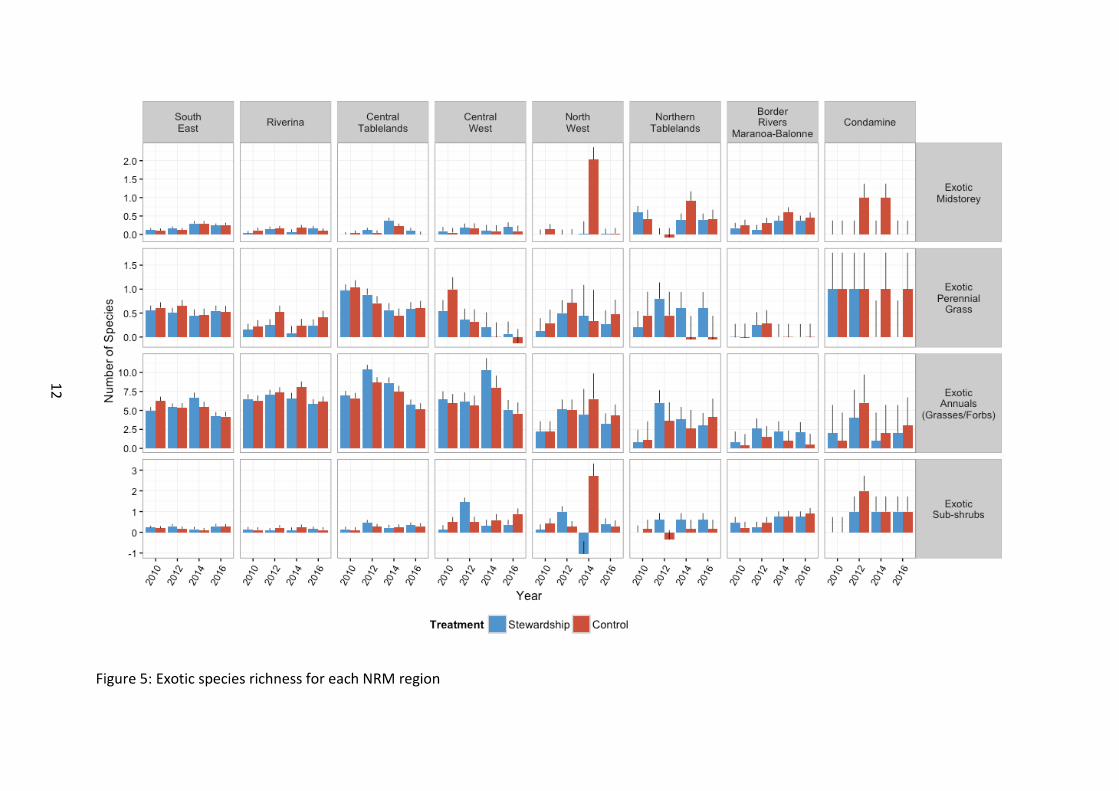
Exotic vegetation Over the entire study region, there was a consistently smaller number of exotic plant species versus native species for each of the respective vegetation components (Figure 3). Exotic overstorey and midstorey richness was the lowest of all vegetation components across all regions (Figure 5).
Exotic plant species richness showed no difference between Stewardship and control sites for any of the measured vegetation components (Figure 3).
There was insufficient data to analyse exotic overstorey species richness. This was because of very low levels of exotic overstorey richness recorded across the study region, regardless of treatment.
No significant differences were detected between Stewardship and Control sites in exotic midstorey richness, from the outset of baseline monitoring (F1, 117 =0.10, p=0.754) (Figure 5). Overall exotic midstorey richness fluctuated with time since baseline surveys, with richness peaking in 2014 (F3, 683 =13.08, p<0.001). Although there was no difference in exotic richness between NRM regions generally, (F7, 142 =1.72, p=0.109), there were differences in response of NRM regions over time (F21, 682 =2.54, p<0.001).
There was no significant difference in exotic perennial grass richness between Stewardship and Control sites (F1, 117 =1.52, p=0.220). Richness differed between NRM regions, although no obvious latitudinal patterns emerged with the inclusion of 2016 data (F7, 149 =3.14, p=0.004). (Figure 5). Overall richness declined after 2010 and 2012 surveys (F3, 684 =6.42, p<0.001). Although this pattern was significant at the regional level (F21, 683 =1.67, p=0.031), no obvious latitudinal patterns were evident in exotic perennial grass species richness at this stage.
There was no significant difference in exotic annual richness between Stewardship and Control sites (F1, 108 =0.66, p=0.417). Southern sites supported higher exotic annual plant species richness than sites in the north from the outset of baseline monitoring (F7, 144 =9.72, p<0.001). Exotic annual plant species richness changed over time, with overall levels at their highest in 2012 and 2014 (F3, 684 =18.23, p<0.001).
There were no significant differences between Stewardship and Control sites for exotic sub-shrub richness (F1, 95 =0.69, p=0.408) or NRM region (F7, 128 =1.70, p=0.115). Exotic sub-shrub richness increased at the landscape level on baseline levels (F3, 663 =4.54, p=0.004). Richness within NRM regions over time was more complicated with fluctuating temporal values observed, but no obvious pattern evident (F21, 662 =1.91, p=0.008).
11
12
Figure 5: Exotic species richness for each NRM region
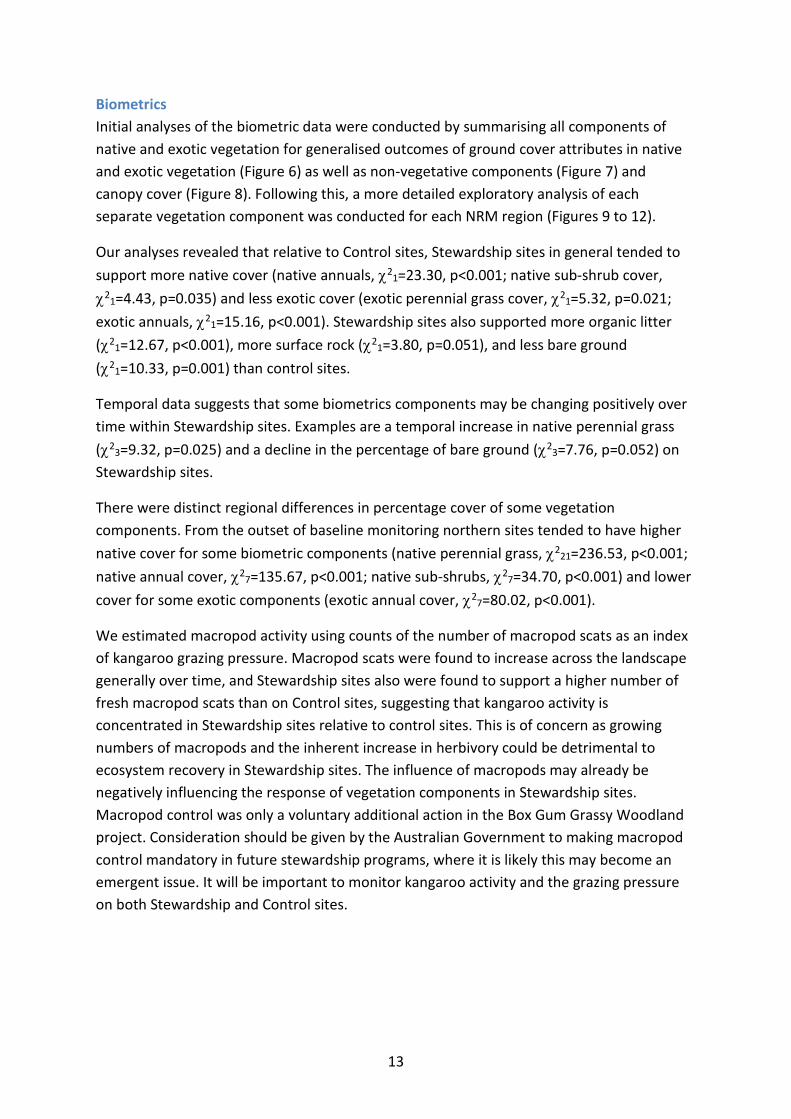
Biometrics Initial analyses of the biometric data were conducted by summarising all components of native and exotic vegetation for generalised outcomes of ground cover attributes in native and exotic vegetation (Figure 6) as well as non-vegetative components (Figure 7) and canopy cover (Figure 8). Following this, a more detailed exploratory analysis of each separate vegetation component was conducted for each NRM region (Figures 9 to 12).
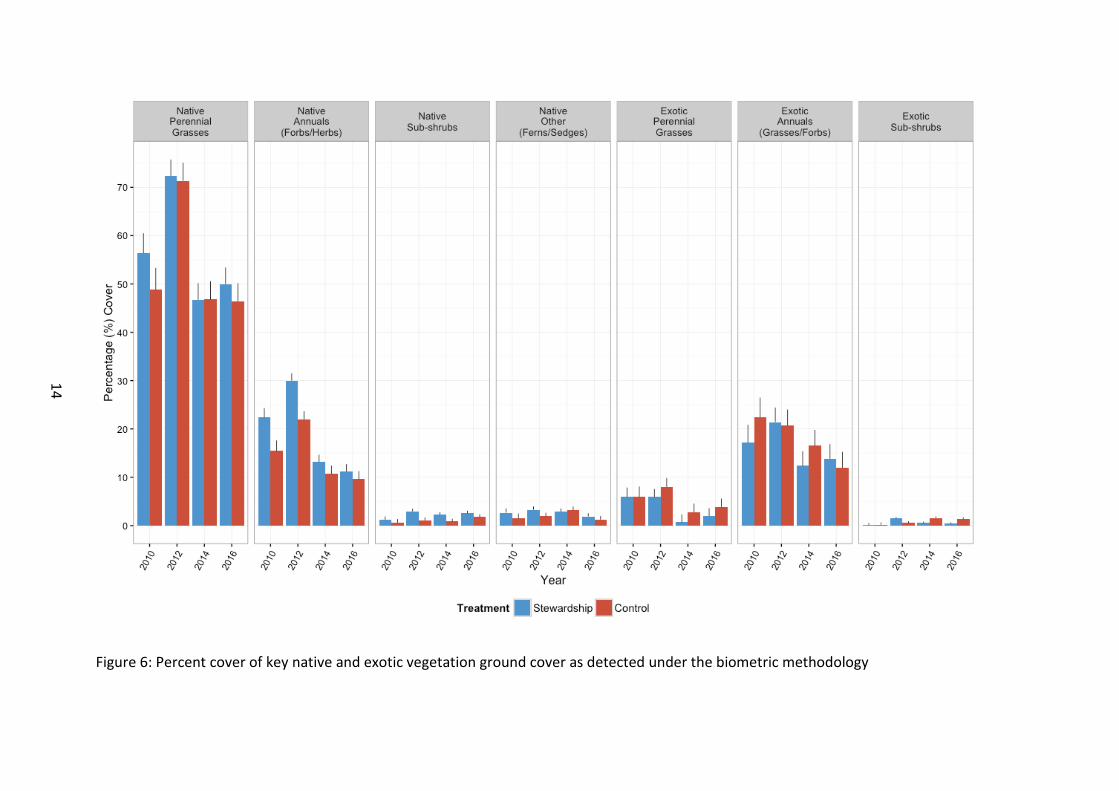
Our analyses revealed that relative to Control sites, Stewardship sites in general tended to support more native cover (native annuals, χ21=23.30, p<0.001; native sub-shrub cover, χ21=4.43, p=0.035) and less exotic cover (exotic perennial grass cover, χ21=5.32, p=0.021; exotic annuals, χ21=15.16, p<0.001). Stewardship sites also supported more organic litter (χ21=12.67, p<0.001), more surface rock (χ21=3.80, p=0.051), and less bare ground (χ21=10.33, p=0.001) than control sites.
Temporal data suggests that some biometrics components may be changing positively over time within Stewardship sites. Examples are a temporal increase in native perennial grass (χ23=9.32, p=0.025) and a decline in the percentage of bare ground (χ23=7.76, p=0.052) on Stewardship sites.
There were distinct regional differences in percentage cover of some vegetation components. From the outset of baseline monitoring northern sites tended to have higher native cover for some biometric components (native perennial grass, χ221=236.53, p<0.001; native annual cover, χ27=135.67, p<0.001; native sub-shrubs, χ27=34.70, p<0.001) and lower cover for some exotic components (exotic annual cover, χ27=80.02, p<0.001).
We estimated macropod activity using counts of the number of macropod scats as an index of kangaroo grazing pressure. Macropod scats were found to increase across the landscape generally over time, and Stewardship sites also were found to support a higher number of fresh macropod scats than on Control sites, suggesting that kangaroo activity is concentrated in Stewardship sites relative to control sites. This is of concern as growing numbers of macropods and the inherent increase in herbivory could be detrimental to ecosystem recovery in Stewardship sites. The influence of macropods may already be negatively influencing the response of vegetation components in Stewardship sites. Macropod control was only a voluntary additional action in the Box Gum Grassy Woodland project. Consideration should be given by the Australian Government to making macropod control mandatory in future stewardship programs, where it is likely this may become an emergent issue. It will be important to monitor kangaroo activity and the grazing pressure on both Stewardship and Control sites.
13
14
Figure 6: Percent cover of key native and exotic vegetation ground cover as detected under the biometric methodology
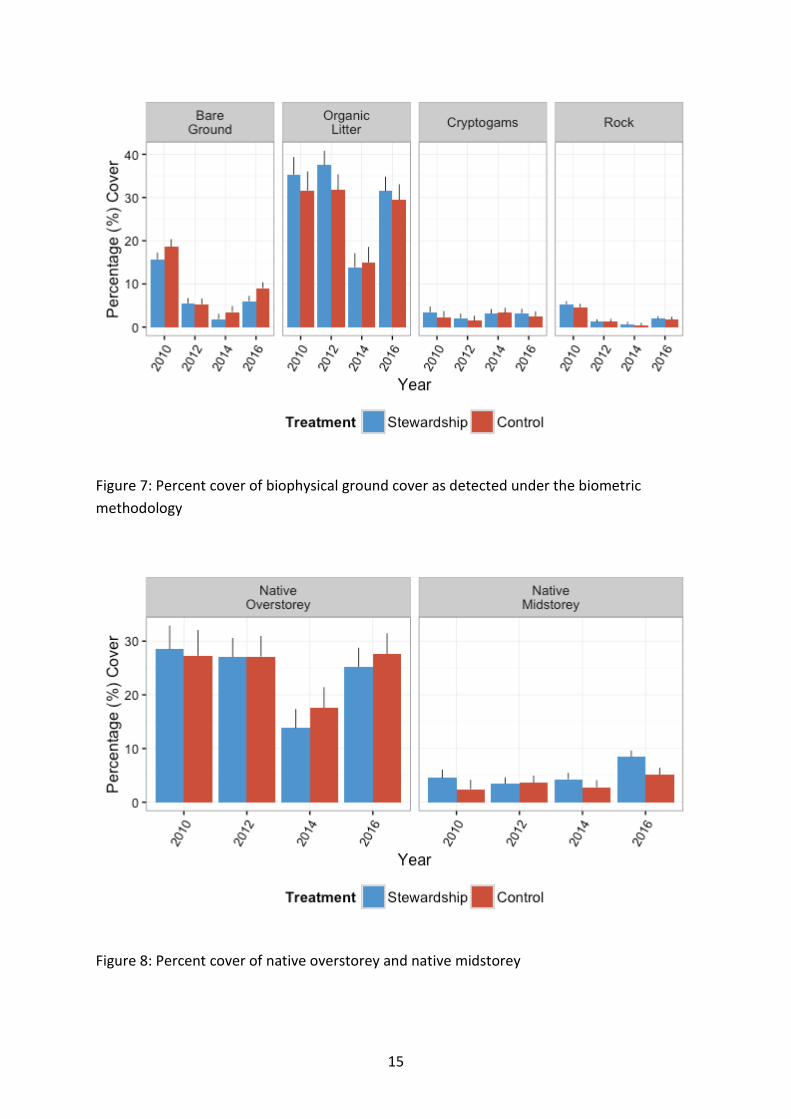
Figure 7: Percent cover of biophysical ground cover as detected under the biometric methodology
Figure 8: Percent cover of native overstorey and native midstorey
15

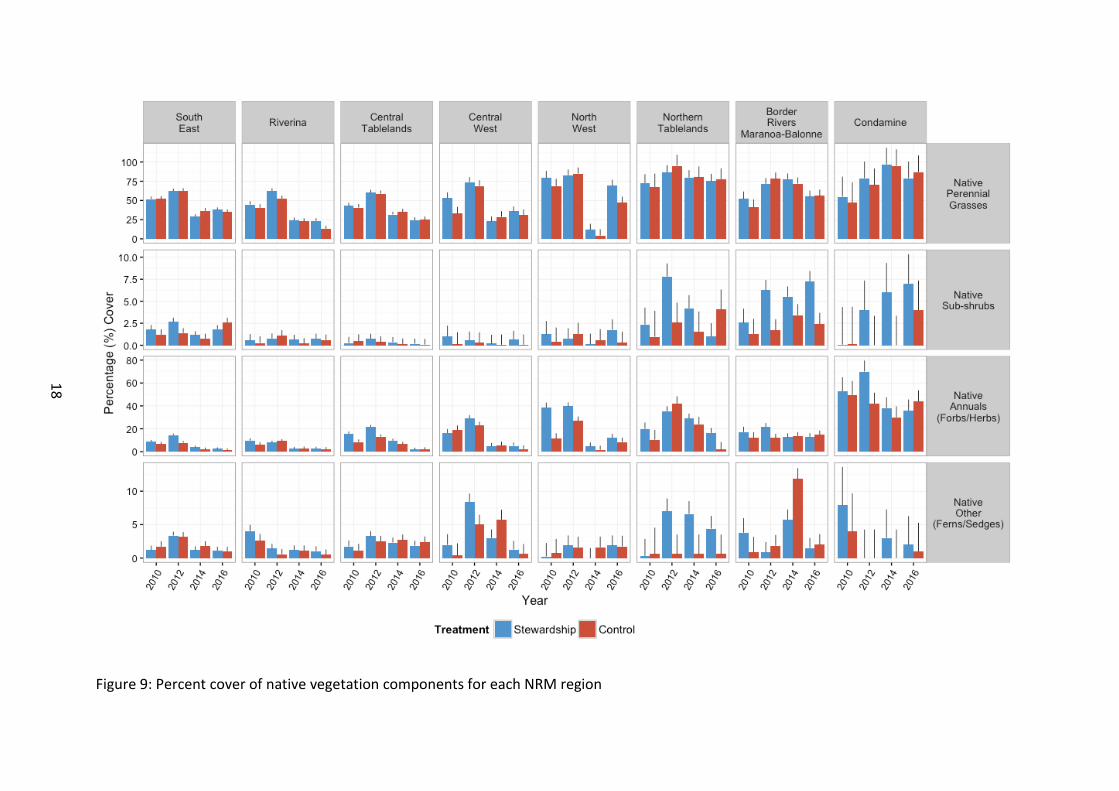
Native vegetation cover Values for native perennial grass cover were similar between Stewardship and Control sites in general (χ2 1=1.92, p=0.166) (Figure 6).
Areas north of (and including) the North West LLS were characterised by a significantly greater percentage cover of native perennial grasses than those sites to the south from the outset of baseline monitoring (χ2 7=60.83, p<0.001) (Figure 9). Native perennial grass was strongly affected by time, with peak percentage cover observed across the entire study area in 2012, followed by a reduction from 2014 onwards to levels similar to those recorded in the baseline survey (χ23=802.63, p<0.001). However, due to the differences in native perennial grass cover between NRM regions, this change over time was not consistent across all areas, with sites in the Condamine peaking in 2014 (χ221=236.53, p<0.001). Caution is needed in interpreting these results as there is only one property in the Condamine NRM region. Following the general peak in cover in 2012, sites overall typically declined in 2014 and 2016 surveys. Perennial grass cover in southern sites exhibited a decline in 2016 relative to baseline (2010) levels, whilst sites north of and including Northern Tablelands exhibited an increase in 2016 relative to 2010 baseline levels.
We found an interaction between Stewardship treatment and time for native perennial grass cover, indicating that Stewardship and Controls may have become more similar during 2014 and 2016 compared to earlier years (χ23=9.32, p=0.025). There is substantial temporal fluctuation but the general pattern appears to be a peak in perennial grass cover in 2012, likely in response to good rainfall in the years prior, and then a general decline since (2014 and 2016 surveys). Whilst the decline on 2012 cover appears consistent across all NRM regions, the percentage cover post-2012 relative to baseline appears to differ with latitude. Also, perennial grass cover in 2016 indicates that Stewardship sites have a higher recorded perennial grass cover than controls in the same year, and may be an indicator that Stewardship sites are showing initial signs of improving for this ground cover. The strong differences between years and hence the strong year effect on native perennial grass cover may be masking any true effects of Stewardship management and hence more time may help resolve the responses to climatic influences vs Stewardship management.
There was significantly greater cover of native annuals in Stewardship than Control sites (χ21=23.30, p<0.001) from the outset of baseline monitoring. Up until 2014 surveys, this result was inconsistent across NRM regions, but following the inclusion of 2016 surveys, this pattern indicates a trend to consistency across all NRM regions i.e. although not significant, all NRM regions, are showing a trend of supporting a higher annual cover in Stewardship sites than Controls (χ27=12.51, p=0.085) (Figure 8 and 9). There are however substantial differences in overall cover between NRM regions, with northern sites supporting significantly more native annual cover than their southern counterparts, which is a reflection of the better starting condition of more northern sites (χ27=135.67, p<0.001).
16
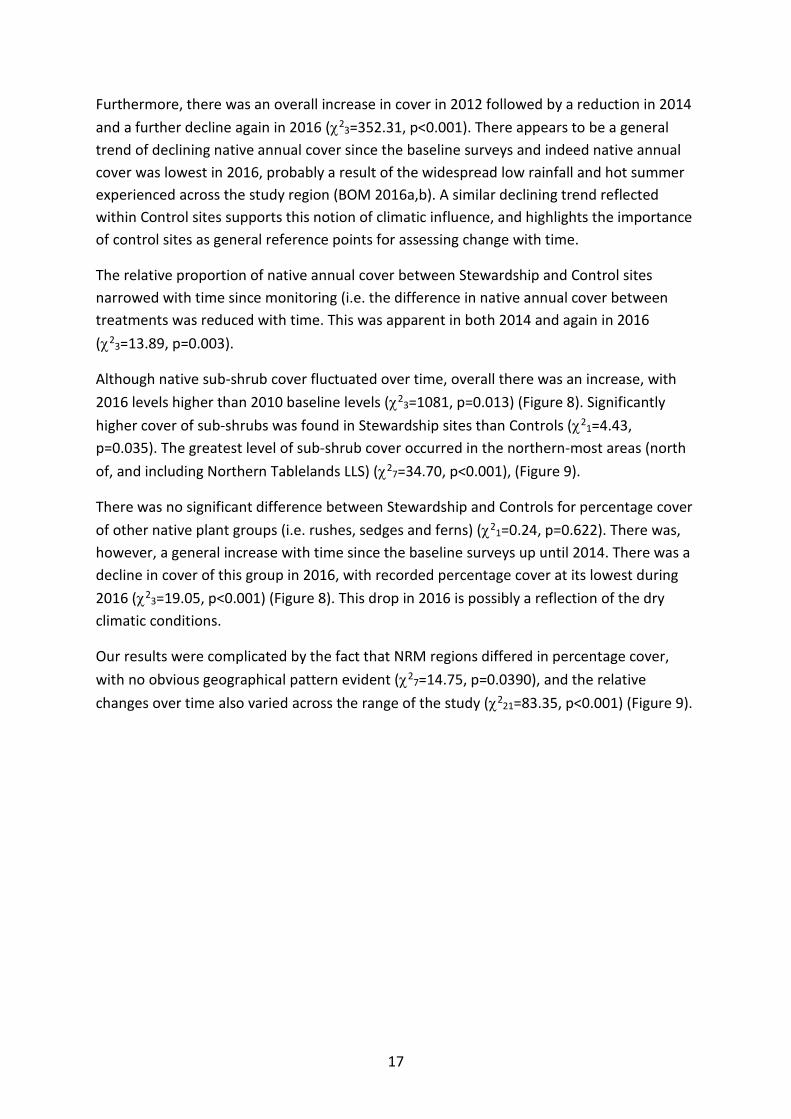
Furthermore, there was an overall increase in cover in 2012 followed by a reduction in 2014 and a further decline again in 2016 (χ23=352.31, p<0.001). There appears to be a general trend of declining native annual cover since the baseline surveys and indeed native annual cover was lowest in 2016, probably a result of the widespread low rainfall and hot summer experienced across the study region (BOM 2016a,b). A similar declining trend reflected within Control sites supports this notion of climatic influence, and highlights the importance of control sites as general reference points for assessing change with time.
The relative proportion of native annual cover between Stewardship and Control sites narrowed with time since monitoring (i.e. the difference in native annual cover between treatments was reduced with time. This was apparent in both 2014 and again in 2016 (χ23=13.89, p=0.003).
Although native sub-shrub cover fluctuated over time, overall there was an increase, with 2016 levels higher than 2010 baseline levels (χ23=1081, p=0.013) (Figure 8). Significantly higher cover of sub-shrubs was found in Stewardship sites than Controls (χ21=4.43, p=0.035). The greatest level of sub-shrub cover occurred in the northern-most areas (north of, and including Northern Tablelands LLS) (χ27=34.70, p<0.001), (Figure 9).
There was no significant difference between Stewardship and Controls for percentage cover of other native plant groups (i.e. rushes, sedges and ferns) (χ21=0.24, p=0.622). There was, however, a general increase with time since the baseline surveys up until 2014. There was a decline in cover of this group in 2016, with recorded percentage cover at its lowest during 2016 (χ23=19.05, p<0.001) (Figure 8). This drop in 2016 is possibly a reflection of the dry climatic conditions.
Our results were complicated by the fact that NRM regions differed in percentage cover, with no obvious geographical pattern evident (χ27=14.75, p=0.0390), and the relative changes over time also varied across the range of the study (χ221=83.35, p<0.001) (Figure 9).
17
18
Figure 9: Percent cover of native vegetation components for each NRM region

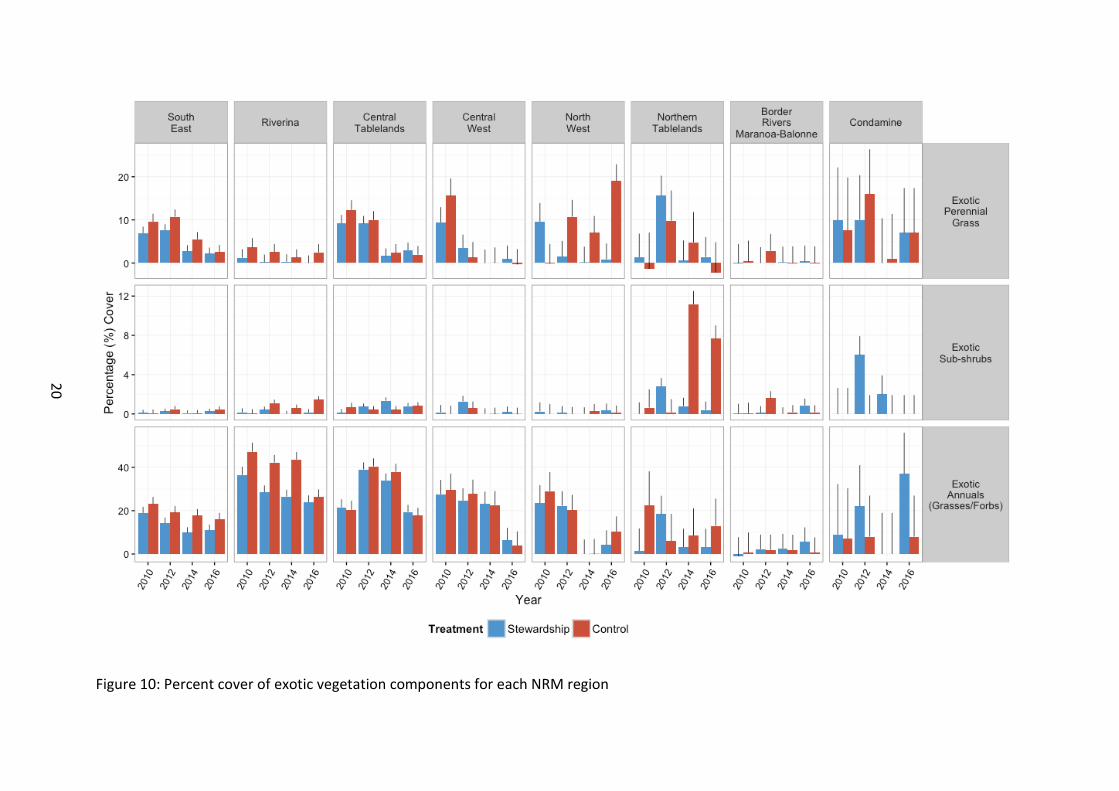
Exotic vegetation cover Exotic perennial grass cover remained lower in Stewardship than Control sites (χ21=5.32, p=0.021) (Figure 8). Cover was significantly lower in 2014 and 2016 than preceding years (χ23=99.73, p<0.001). Although cover was observed to increase overall in 2016 on 2014 levels, average cover across the study region in 2016 was still below that of 2010 baseline and the peak in 2012 cover. This pattern of overall decline with time, fluctuated between different NRM regions (χ221=78.63, p<0.001) (Figure 10).
Exotic annual cover was higher in Control sites (χ21=15.16, p<0.001), except the Condamine where cover was trending to a greater percentage cover in Stewardship (χ27=13.72, p=0.056) (Figure 8 and Figure 10). The degree of difference also varied across NRM regions with southern sites supporting significantly higher exotic annual cover than their northern counterparts (χ27=80.02, p<0.001).
There was a general decrease in exotic annual cover across the study region with time since 2010 baseline surveys (χ23=79.87, p<0.001). There was however temporal fluctuation to this average pattern in declining exotic annual cover observed at the NRM regional level, however all but the Condamine NRM region had an observed cover in 2016 below that of baseline levels (χ221=113.99, p<0.001).
Exotic sub-shrub cover was low and exhibited no significant difference between Stewardship and Control sites, although there was a trend for Controls to support a higher percentage cover of exotic sub-shrubs (χ21=2.76, p=0.096). There were differences at the NRM regional level, with Northern tablelands having significantly higher cover than any other NRM region (χ27=23.59, p=0.001).
Although there was no difference between Stewardship and Control sites in general, there were strong interaction effects between NRM areas and Stewardship treatment, such that the relative bias in cover between treatments differed between NRM regions (χ27=34.10, p<0.001).
19
20
Figure 10: Percent cover of exotic vegetation components for each NRM region
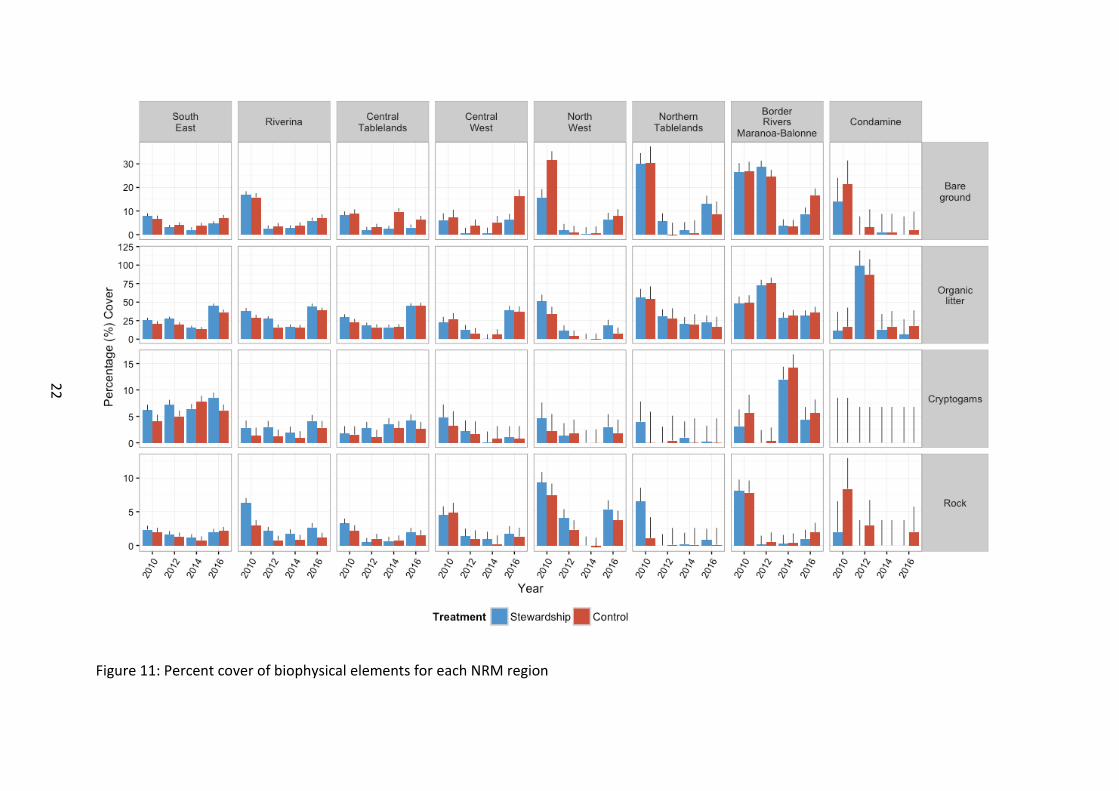
Biophysical elements The amount of bare ground was significantly lower in Stewardship sites than Control sites from the outset of baseline monitoring (χ21=10.33, p=0.001) (Figure 7). There was a general decrease in bare ground relative to baseline levels across the study region with time (χ23=197.01, p<0.001). Cover in 2016 was below that of baseline values across the study region except for sites in the Central West (χ221=226.71, p<0.001) (
Figure 11). Northern sites typically supported a higher recorded level of bare ground, with the exception of the single farm in the Condamine region, which supported levels similar to the more southern sites (χ27=49.09, p<0.001). There was a trend of declining bare ground cover in Stewardship sites with time compared to Controls, with this trend appearing to strengthen since 2014 (χ23=7.76, p=0.052). Ongoing surveys will help resolve this emerging pattern.
Organic litter cover was higher in Stewardship sites than in the Controls from the outset of baseline monitoring (χ21=12.67, p<0.001) (Figure 7). Northern areas typically supported higher levels of cover than southern sites from the outset of baseline monitoring (χ27=25.66, p<0.001). There was a significant decline in cover in 2014 across the study region, which appeared to rise again in 2016 (χ23=334.75, p<0.001). The direction of change in 2016 recorded cover on baseline levels differed with NRM region (χ221=224.31, p<0.001). Southern sites appeared to generally increase in 2016 on baseline levels, whilst sites north of and including North West appeared to decline on baseline levels.
Although cryptogamic cover did not differ significantly between Stewardship and Controls, there was a trend for Stewardship sites to support a marginally higher level of cover (χ21=3.28, p=0.070). Cover differed significantly between NRM region, but no obvious spatial pattern was discernible (χ27=35.40, p<0.001), nor were there any obvious patterns in the significant interaction effects of NRM region and year of survey (χ221=66.50, p<0.001) (
Figure 11). Cover overall did differ between years, with an observed peak in 2014 (χ23=11.63, p=0.009).
Percentage rock cover was highest in Stewardship sites (χ21=3.80, p=0.051) (Figure 7). A steady decline in rock cover since baseline across all sites in general also occurred (χ23=144.15, p<0.001), however the relative level of decline differed between NRM regions (χ221=90.20, p<0.001).
21
22
Figure 11: Percent cover of biophysical elements for each NRM region
23
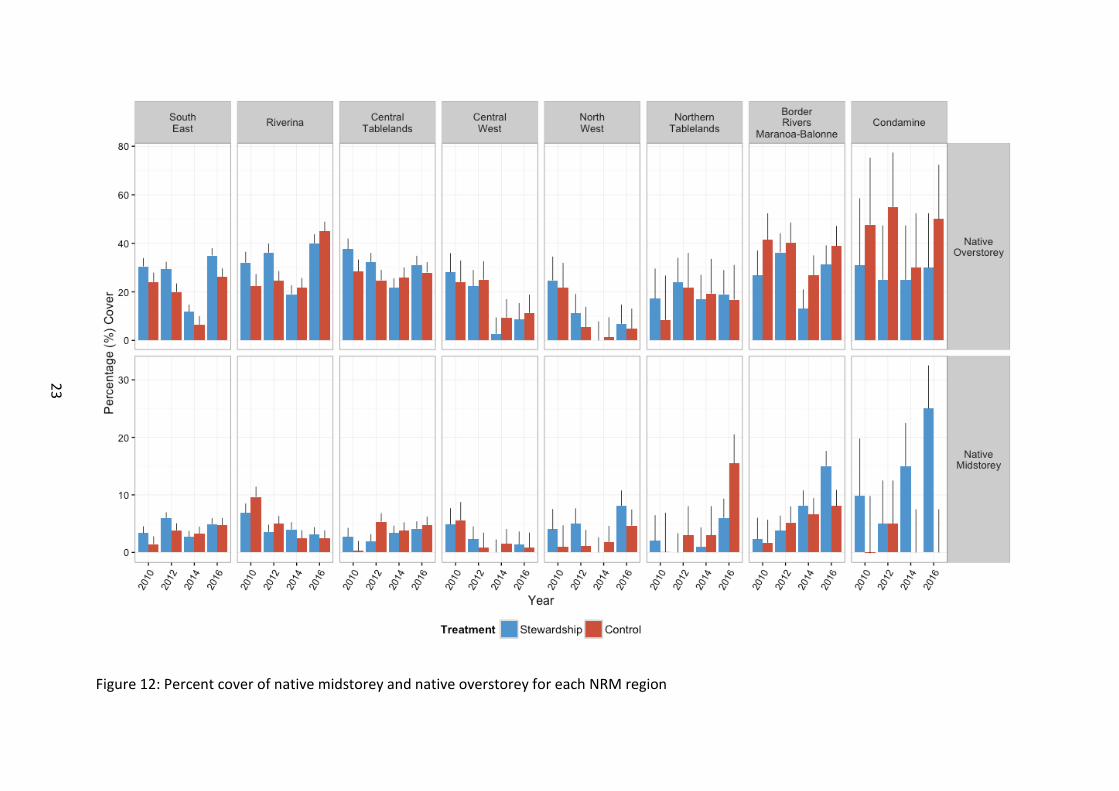
Figure 12: Percent cover of native midstorey and native overstorey for each NRM region
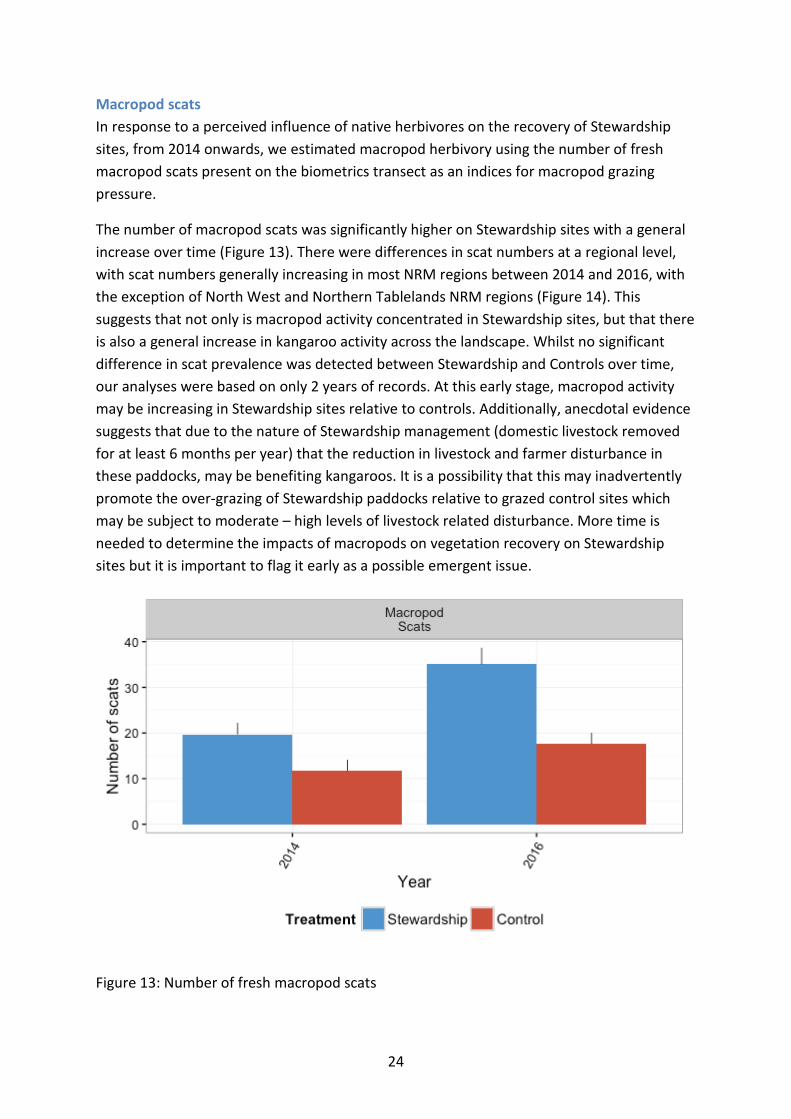
Macropod scats In response to a perceived influence of native herbivores on the recovery of Stewardship sites, from 2014 onwards, we estimated macropod herbivory using the number of fresh macropod scats present on the biometrics transect as an indices for macropod grazing pressure.
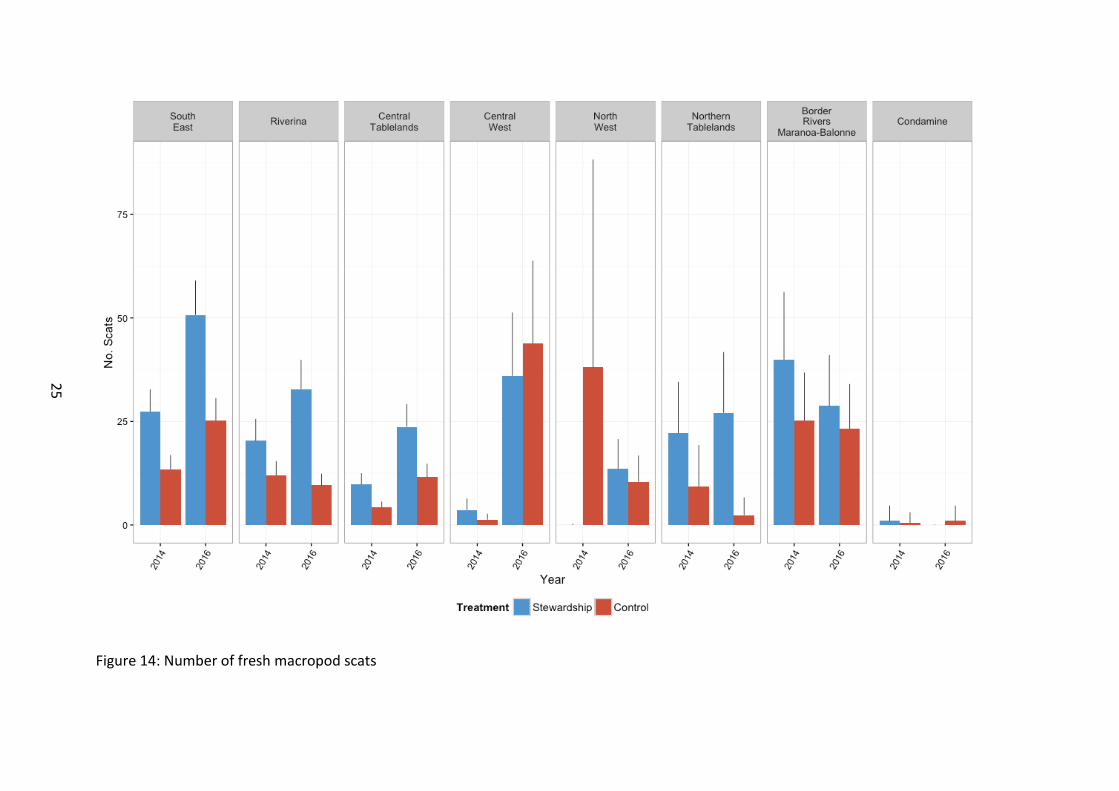
The number of macropod scats was significantly higher on Stewardship sites with a general increase over time (Figure 13). There were differences in scat numbers at a regional level, with scat numbers generally increasing in most NRM regions between 2014 and 2016, with the exception of North West and Northern Tablelands NRM regions (Figure 14). This suggests that not only is macropod activity concentrated in Stewardship sites, but that there is also a general increase in kangaroo activity across the landscape. Whilst no significant difference in scat prevalence was detected between Stewardship and Controls over time, our analyses were based on only 2 years of records. At this early stage, macropod activity may be increasing in Stewardship sites relative to controls. Additionally, anecdotal evidence suggests that due to the nature of Stewardship management (domestic livestock removed for at least 6 months per year) that the reduction in livestock and farmer disturbance in these paddocks, may be benefiting kangaroos. It is a possibility that this may inadvertently promote the over-grazing of Stewardship paddocks relative to grazed control sites which may be subject to moderate – high levels of livestock related disturbance. More time is needed to determine the impacts of macropods on vegetation recovery on Stewardship sites but it is important to flag it early as a possible emergent issue.
Figure 13: Number of fresh macropod scats
24
25
Figure 14: Number of fresh macropod scats
Vegetation plot features
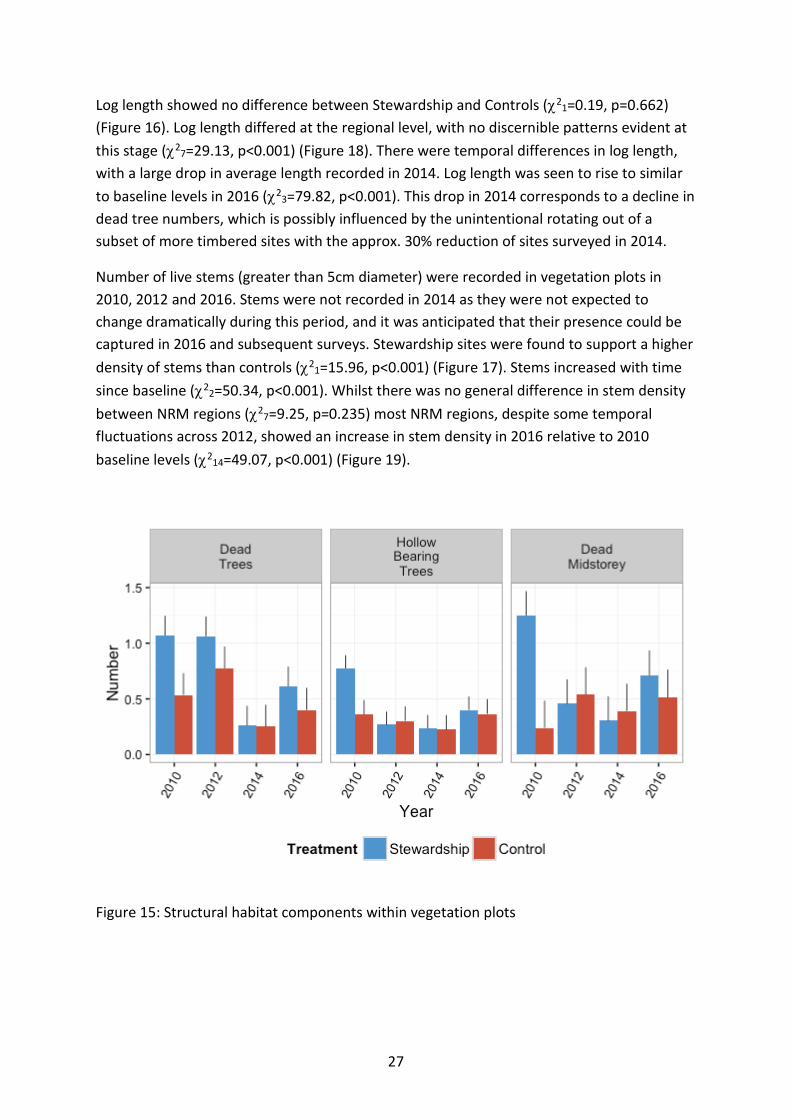
Habitat composition Of the structural habitat components recorded, the only variable to differ between Stewardship and controls was number of stems, which was higher in Stewardship sites (χ21=15.96, p<0.001) (Figure 17). Several habitat components dropped in 2014 following the rotation out of approx. 30% of all sites from surveys. Dead trees, dead midstorey and log length all appeared to show a decline in 2014 surveys, but numbers were up again in 2016 with the surveying of all sites in the schedule (Figure 15; Figure 16). This is probably a survey artefact and subsequent temporal surveys will help ascertain the true drivers of this pattern.
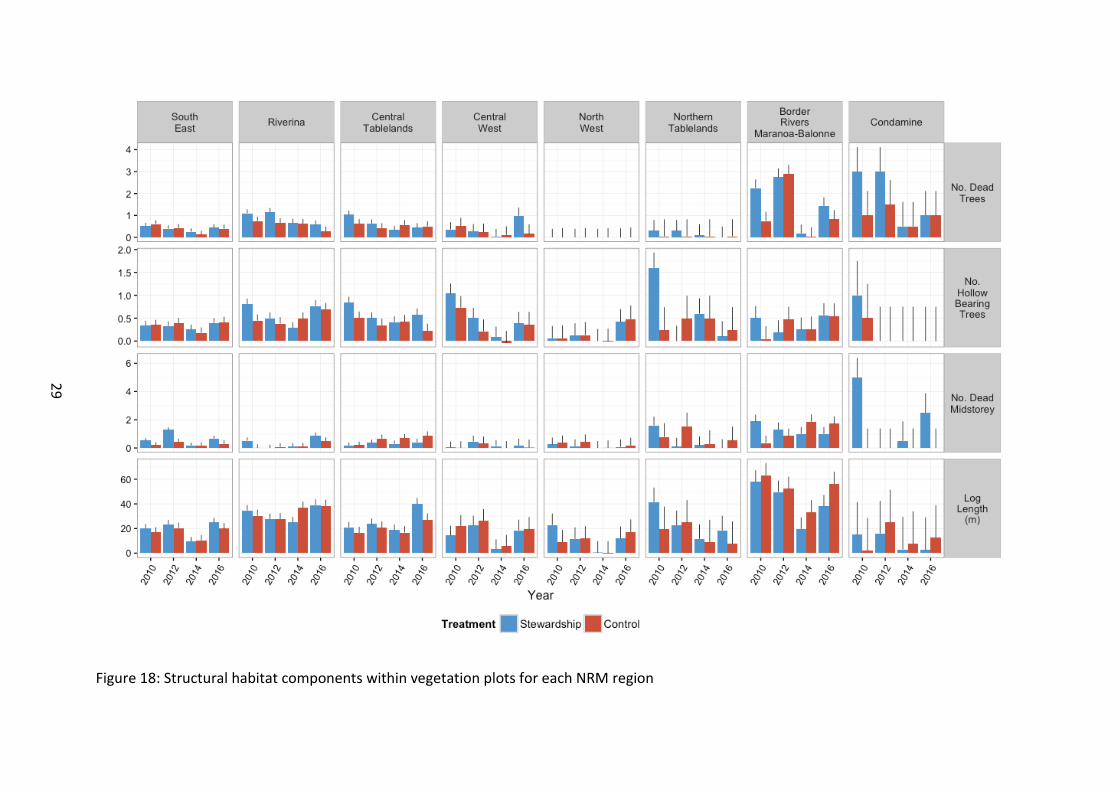
Dead trees showed no difference between Stewardship and Controls (χ21=2.37, p=0.123). At the regional level, there were significantly more dead trees in northern sites (Border Rivers Maranoa-Balonne and Condamine) than in other regions from the outset of baseline monitoring (Figure 15; Figure 18). There was a large decline in number of dead trees in 2014 (χ23=44.88, p<0.001), however given that approx. 30% of sites were rotated out of the survey schedule in 2014, the observed 2014 decline could be driven by an unintentional bias to rotate out more heavily timbered sites with dead trees during the 2014 round of surveys. The majority of NRM regions however showed declines in 2016 on baseline levels (χ221=90.41, p<0.001), which is more concerning, as all currently contracted Stewardship sites were surveyed in 2016. Some properties have been permanently lost from the monitoring programme due to terminated or expired contracts, so additional time will help resolve if this is a true decline over time from the landscape, or just an unfortunate loss of more heavily timbered sites from the monitoring programme.
Although no significant difference was detected for number of hollow bearing trees between Stewardship and Controls, there was a trend for Stewardship sites to contain marginally more hollow bearing trees (χ21=3.08, p=0.079). Hollow bearing trees declined across the study region, with time since baseline, although 2016 levels appeared to increase again on 2012 and 2014 levels (χ23=34.85, p<0.001) (Figure 15). There was variation in temporal response at the regional level (χ221=51.04, p<0.001) (Figure 18).
Dead midstorey remained consistently low and did not differ with Stewardship treatment (χ21=1.86, p=0.173) (Figure 15). Northern regions tended to support a greater number of dead midstorey from the outset of baseline monitoring (χ27=21.37, p=0.003), likely a reflection of northern sites supporting a higher number of live midstorey and stems (Figure 18). There was a trend across the study region for a decline with time on baseline levels, although 2016 saw a subsequent rise on 2012 and 2014, indicating that this habitat variable may be increasing again (χ23=9.40, p=0.024). At this stage, there is trending evidence that this is occurring within some NRM regions (i.e. the more southern sites appear to be increasing relative to 2012/2014 levels (χ23=4.72, p=0.081).
26
Log length showed no difference between Stewardship and Controls (χ21=0.19, p=0.662) (Figure 16). Log length differed at the regional level, with no discernible patterns evident at this stage (χ27=29.13, p<0.001) (Figure 18). There were temporal differences in log length, with a large drop in average length recorded in 2014. Log length was seen to rise to similar to baseline levels in 2016 (χ23=79.82, p<0.001). This drop in 2014 corresponds to a decline in dead tree numbers, which is possibly influenced by the unintentional rotating out of a subset of more timbered sites with the approx. 30% reduction of sites surveyed in 2014.
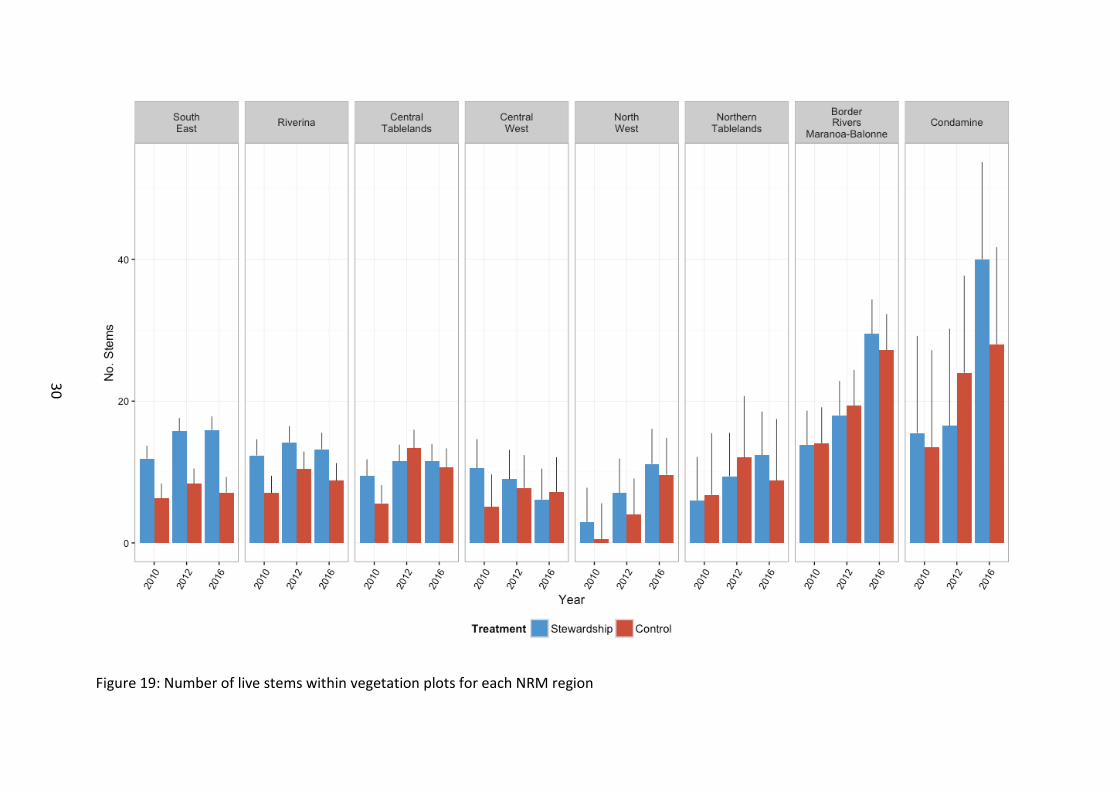
Number of live stems (greater than 5cm diameter) were recorded in vegetation plots in 2010, 2012 and 2016. Stems were not recorded in 2014 as they were not expected to change dramatically during this period, and it was anticipated that their presence could be captured in 2016 and subsequent surveys. Stewardship sites were found to support a higher density of stems than controls (χ21=15.96, p<0.001) (Figure 17). Stems increased with time since baseline (χ22=50.34, p<0.001). Whilst there was no general difference in stem density between NRM regions (χ27=9.25, p=0.235) most NRM regions, despite some temporal fluctuations across 2012, showed an increase in stem density in 2016 relative to 2010 baseline levels (χ214=49.07, p<0.001) (Figure 19).
Figure 15: Structural habitat components within vegetation plots
27
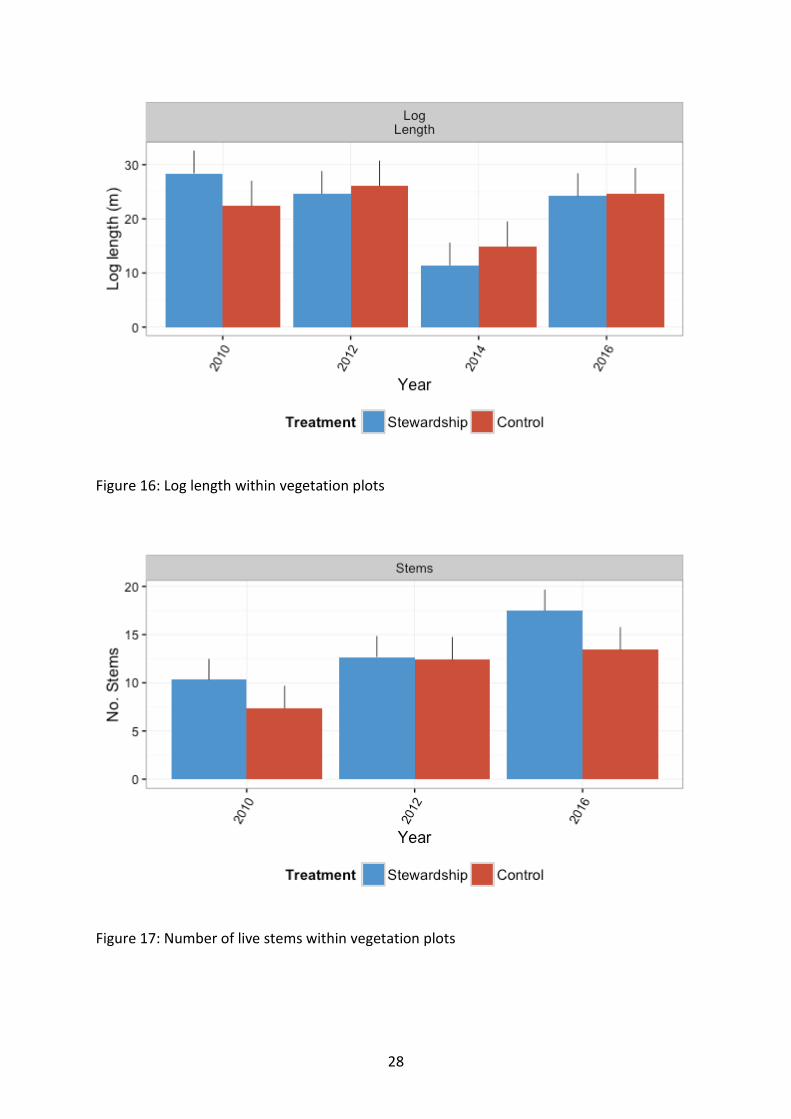
Figure 16: Log length within vegetation plots
Figure 17: Number of live stems within vegetation plots
28
29
Figure 18: Structural habitat components within vegetation plots for each NRM region
30
Figure 19: Number of live stems within vegetation plots for each NRM region
Weeds of National Significance
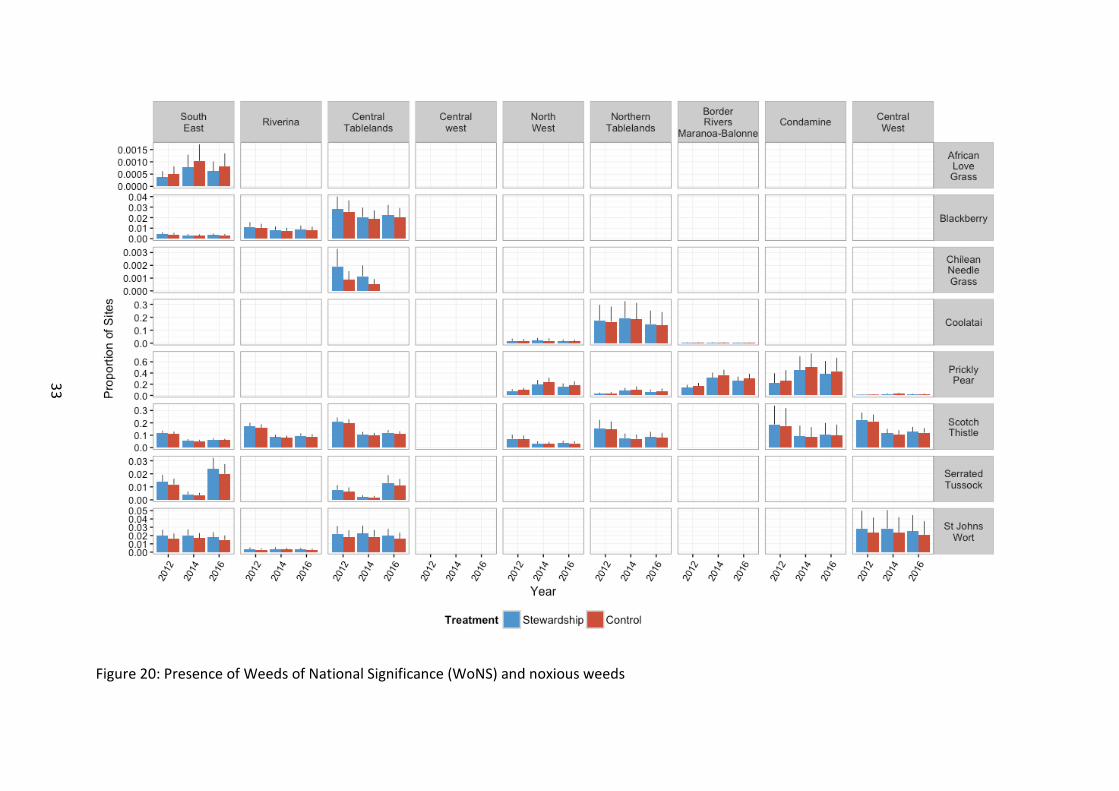
Weed presence The presence of Weeds of National Significance (WoNS) onsite were recorded in the vegetation plots (Figure 20). This measure is designed to assess the composition of WoNS species on site (as opposed to their abundance).
The presence of St John’s Wort did not differ across the study between Stewardship and Controls (χ21=1.714, p=0.190), or over time (χ22=0.765, p=0.682). There were regional differences in the occurrence of this species, with a higher presence of St John’s Wort in southern sites (χ23=8.480, =0.037).
Coolatai Grass presence did not differ between Stewardship and Controls (χ21=0.068, p=0.794), or years (χ22=1.071, p=0.585). Coolatai was more likely to occur on northern sites (χ22=9.193, p=0.010).
Serrated Tussock presence exhibited no difference between Stewardship and Controls (χ21=0.74, p=0.388), but there was a difference with time, seen as a reduction in occurrence in 2014 (χ22=28.60, p<0.001).
Scotch Thistle presence did not differ between Stewardship and Controls (χ21=0.43, p=0.511), but was present on the more southern sites (χ26=12.90, p=0.045).There was also a decline in presence with time (χ22=36.89, p<0.001).
Blackberry presence showed no difference with time or Stewardship treatment (χ21=0.541, p=0.462), but there was a higher presence on southern sites (χ22=12.594, p=0.002).
Prickly Pear presence did not differ between Stewardship and Controls (χ21=0.81, p=0.368), and was present only in the more northern sites (χ24=20.79, p<0.001). There was also an overall increase in the number of sites with Prickly Pear present over time (χ22=14.23, p<0.001).
African Love Grass was the only WoNS that showed any difference in presence between Stewardship and Control sites (χ21=5.23, p=0.022), with Controls having a higher presence. There was also a temporal effect, with 2014 representing the peak (χ22=27.76, p<0.001).
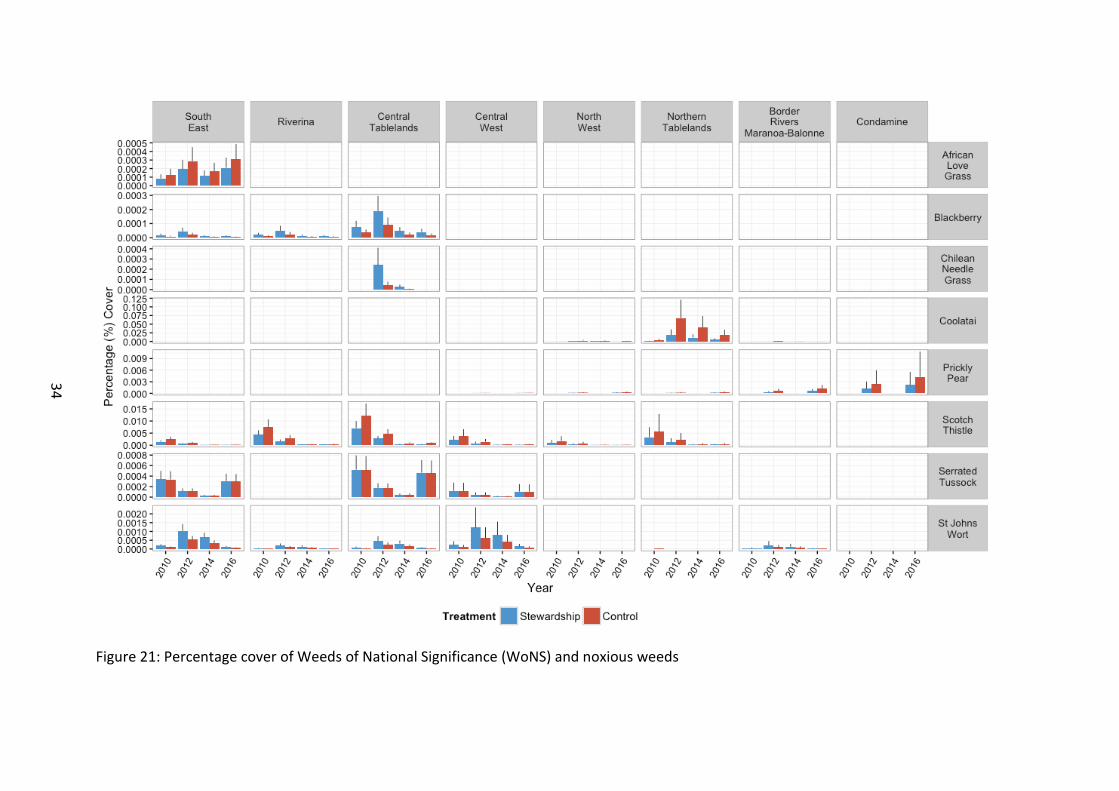
Weed percentage cover The percentage cover of Weeds of National Significance (WoNS) were recorded in biometric plots. This measure records the abundance, and change of abundance, of WoNS on site.
Eight species (as reported in the WoNS presence findings above) were uncommon or rare (Figure 21). Importantly, most species exhibited a significant difference between Stewardship and control sites, with the cover of African Love Grass (χ21=18.18, p<0.001), Coolatai Grass (χ21=144.6, p<0.001), Prickly Pear (χ21=11.10, p<0.001) and Scotch Thistle
31
(χ21=27.7, p<0.001) found to be lower on Stewardship sites. Conversely, the cover of Blackberry (χ21=38.12, p<0.001) and St John’s Wort (χ21=43.2, p<0.001) were greater on Stewardship sites. Serrated Tussock exhibited no difference between Stewardship and Controls (χ21=0.01, p=0.910), Chilean Needle Grass was too rarely detected to analyse.
All species exhibited significant differences between survey years. The response of individual weeds over time was complex, with Blackberry (χ23=142.97, p<0.001), Coolatai Grass (χ23=184.5, p<0.001), and St John’s Wort (χ23=255.2, p<0.001) all exhibiting a peak in cover during 2012 and an apparent decline in 2016 to levels similar, or below baseline levels. Scotch Thistle declined with time (χ23=269.4, p<0.001) whilst Prickly Pear (χ21=13.84, p<0.001) and African Love Grass appeared to increase with time (χ23=67.85, p<0.001). Serrated Tussock appeared to decline with time to 2014, however there was an increase to near baseline levels in 2016 (χ23=102.91, p<0.001).
Finally, there were regional differences, with southern areas supporting a distinctly different assemblage of WoNS than the northern areas.
Note that analysis of WoNS is complicated by the very low numbers of WoNS recorded and results need to be interpreted with caution.
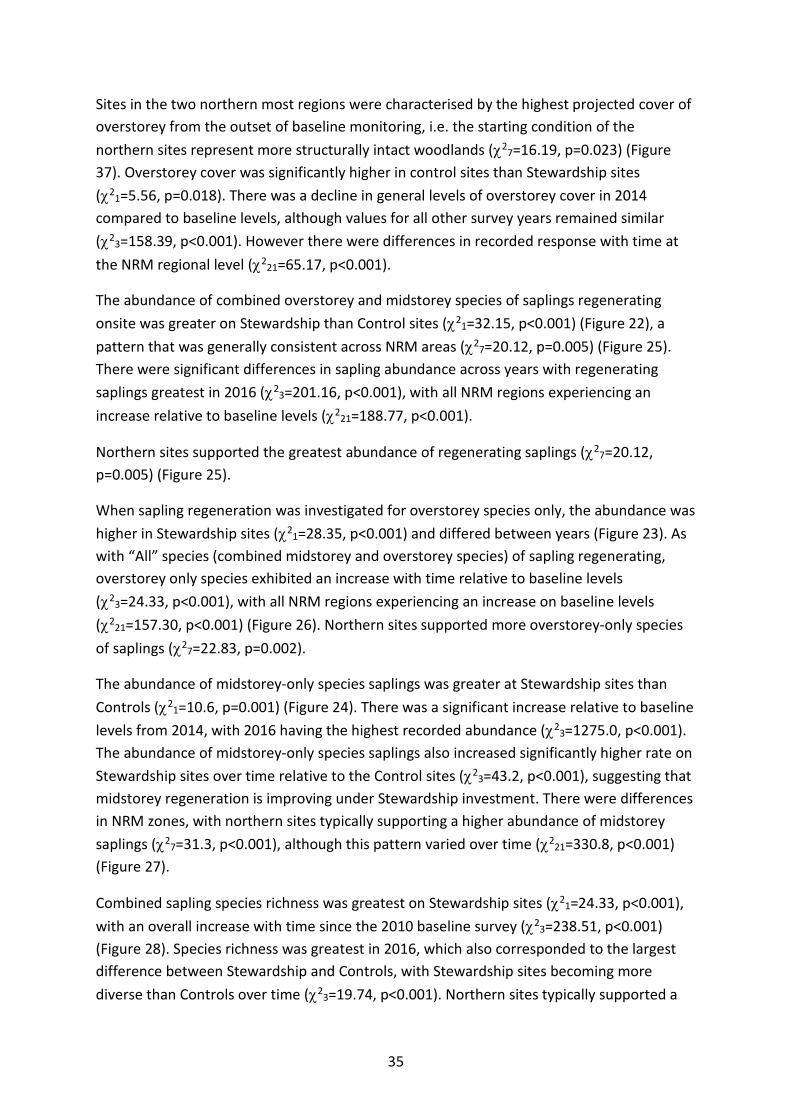
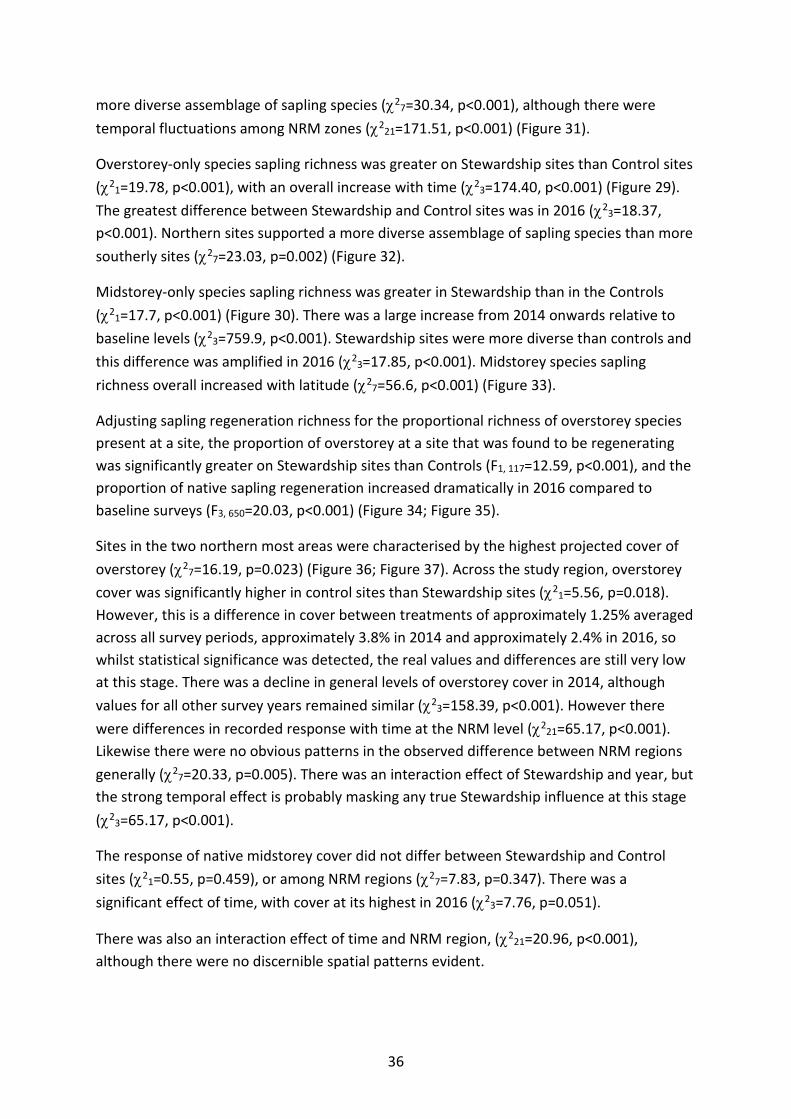
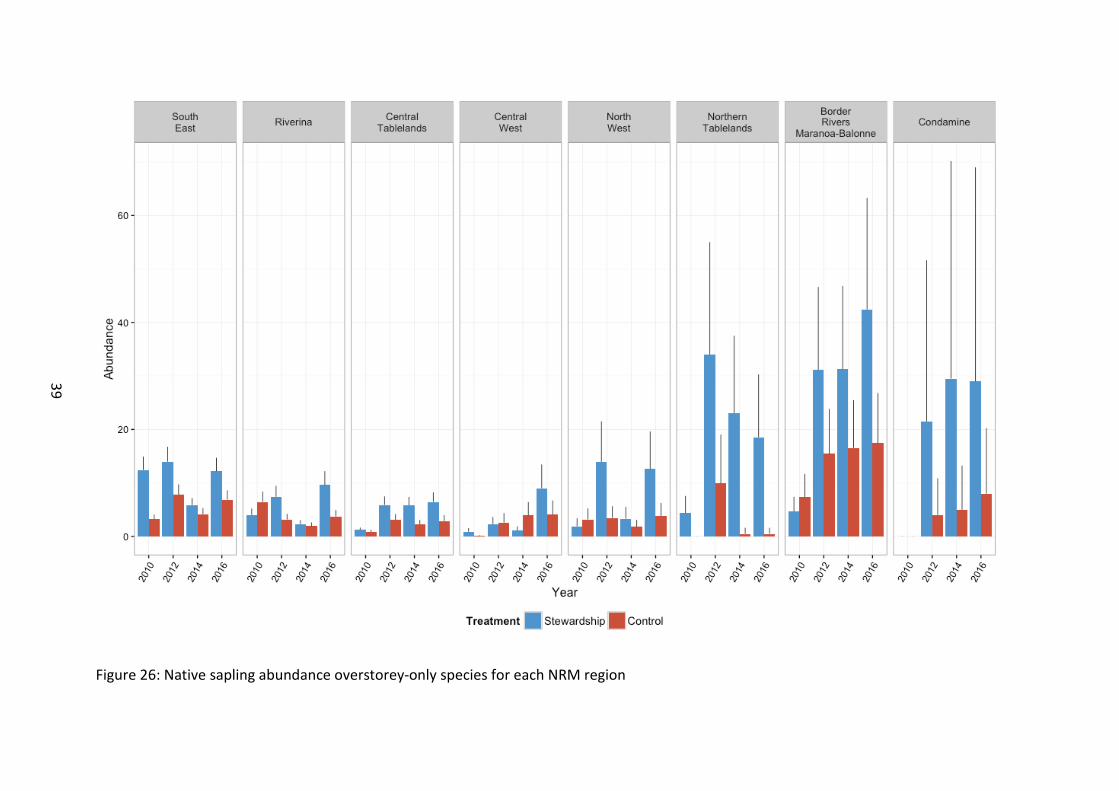
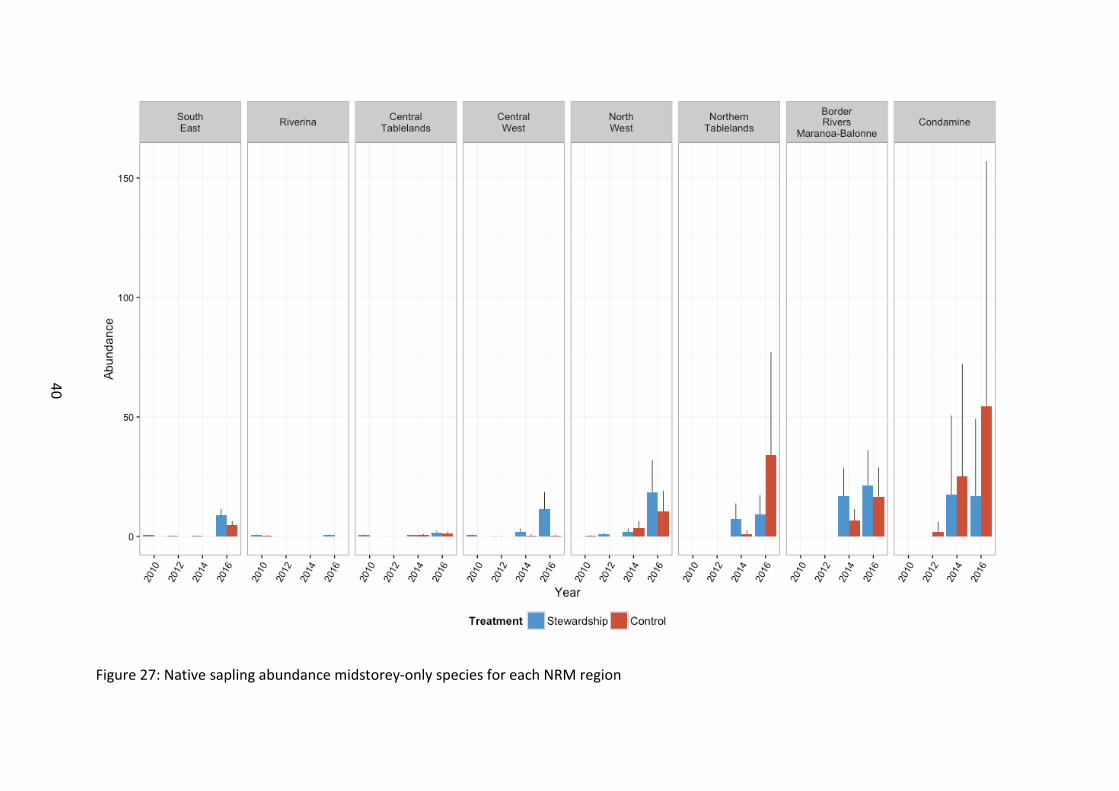
Overstorey elements and saplings Stewardship sites supported a higher abundance of regenerating saplings onsite relative to Control sites (χ21=32.15, p<0.001) (Figure 22). This was true for both overstorey (χ21=28.35, p<0.001) (Figure 23) and midstorey (χ21=10.6, p=0.001) (Figure 24) species of saplings. Stewardship sites also supported a greater richness of regenerating sapling species on site (χ21=24.33, p<0.001) (Figure 25). This was true for overstorey (χ21=19.78, p<0.001) (Figure 26) and midstorey (χ21=17.7, p<0.001) (Figure 27) species of saplings.
Sapling abundance (combined, overstorey only and midstorey only) increased with time. Sapling abundance of midstorey-only species in Stewardship sites was significantly greater than controls with time, suggesting an improvement of this important vegetation component.
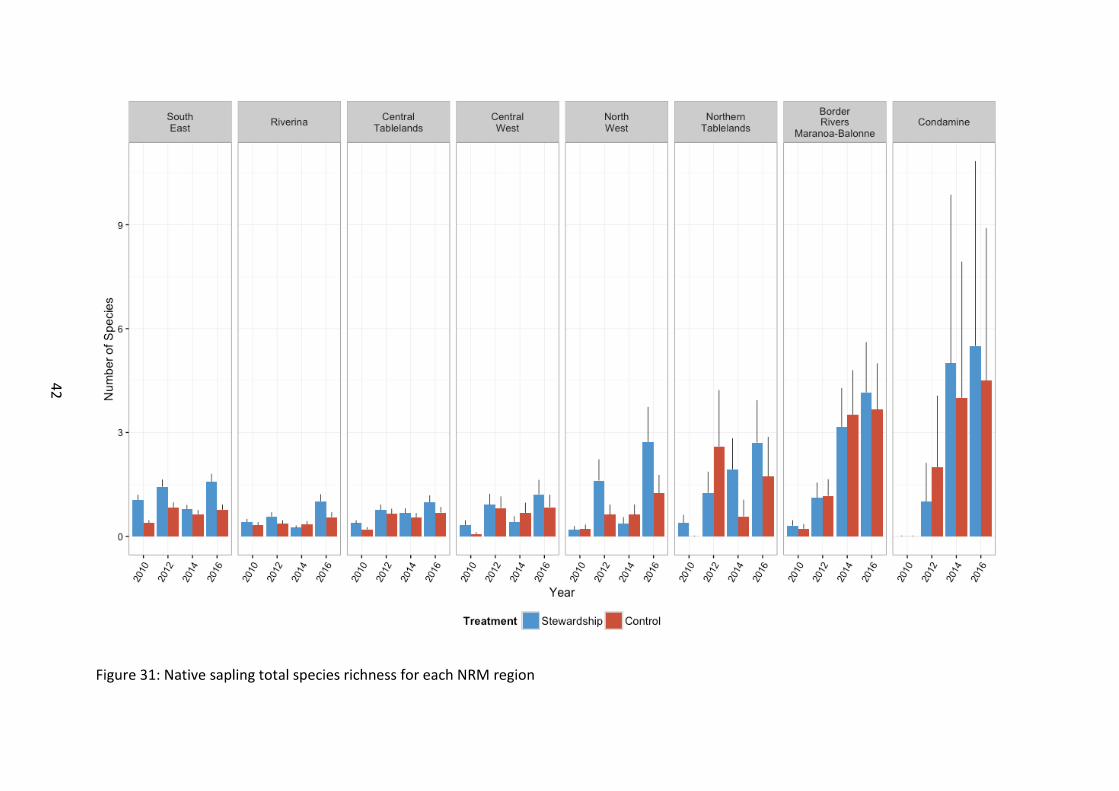
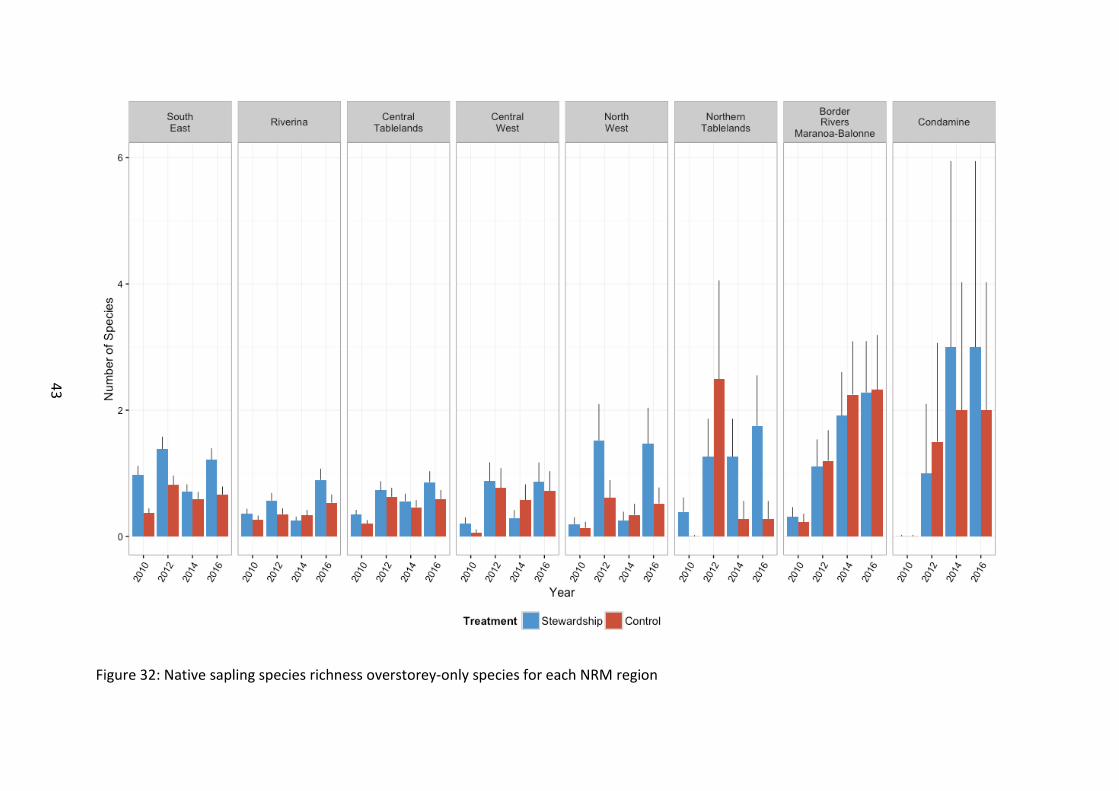
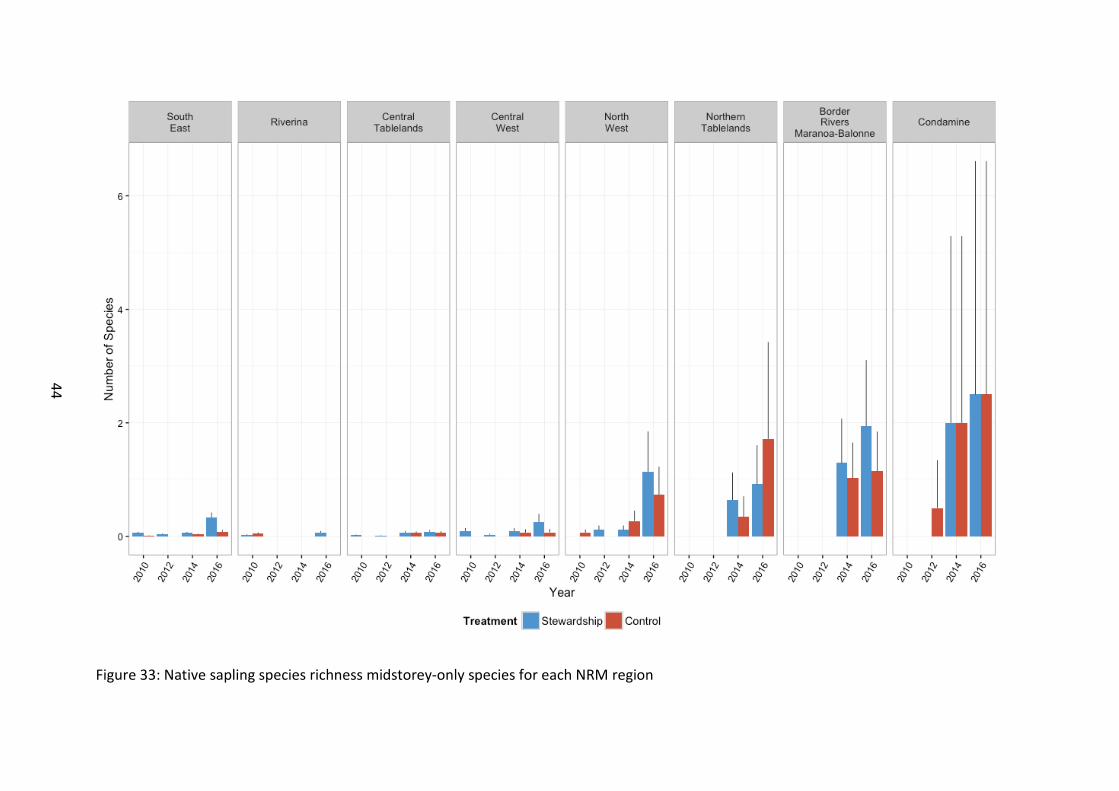
Stewardship sites supported a greater combined sapling species richness (χ21=24.33, p<0.001) (Figure 28). This was also true for both overstorey-only species (χ21=19.78, p<0.001) (Figure 29) and midstorey-only species (χ21=17.7, p<0.001) (Figure 30).
Sapling diversity (combined, overstorey only and midstorey only) increased over time. Sapling diversity of all components of sapling species richness (combined, overstorey only, and midstorey only) were all significantly higher in Stewardship sites over time.
The proportion of regenerating overstorey saplings with parent trees onsite was greater in Stewardship sites than Controls, with the highest proportion of onsite parent species regenerating recorded in 2016 (Figure 36).
32
33
Figure 20: Presence of Weeds of National Significance (WoNS) and noxious weeds
34
Figure 21: Percentage cover of Weeds of National Significance (WoNS) and noxious weeds
Sites in the two northern most regions were characterised by the highest projected cover of overstorey from the outset of baseline monitoring, i.e. the starting condition of the northern sites represent more structurally intact woodlands (χ27=16.19, p=0.023) (Figure 37). Overstorey cover was significantly higher in control sites than Stewardship sites (χ21=5.56, p=0.018). There was a decline in general levels of overstorey cover in 2014 compared to baseline levels, although values for all other survey years remained similar (χ23=158.39, p<0.001). However there were differences in recorded response with time at the NRM regional level (χ221=65.17, p<0.001).
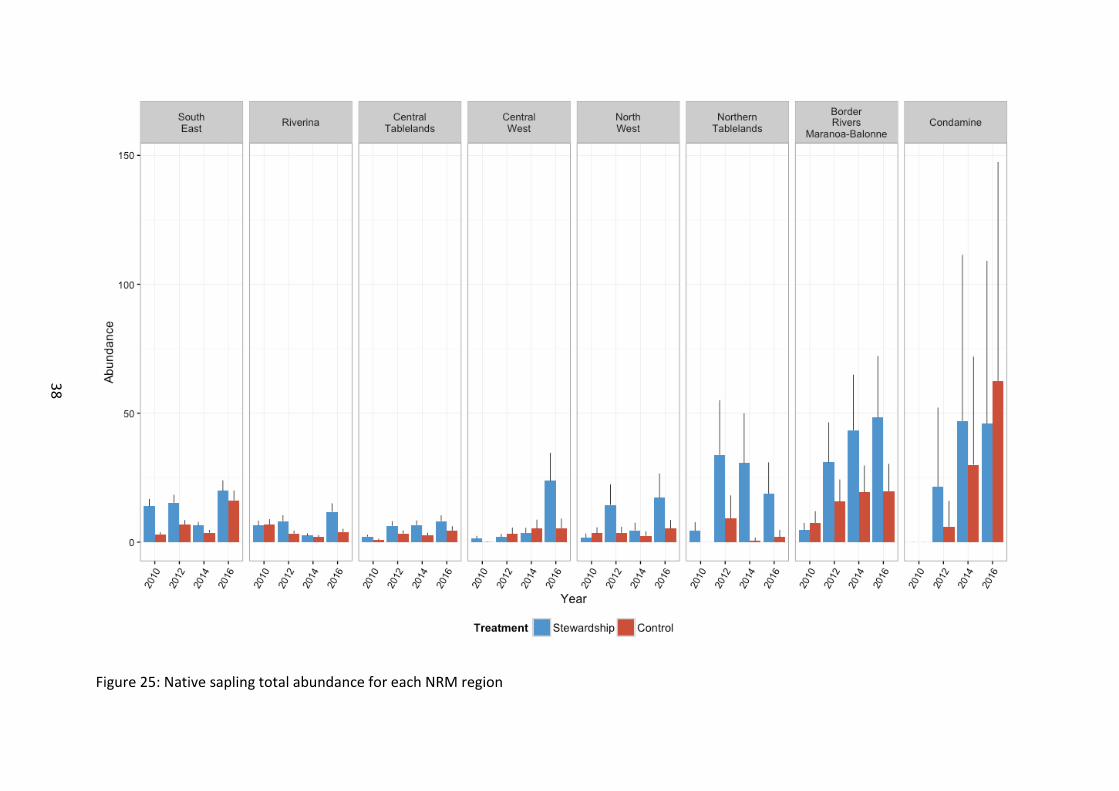
The abundance of combined overstorey and midstorey species of saplings regenerating onsite was greater on Stewardship than Control sites (χ21=32.15, p<0.001) (Figure 22), a pattern that was generally consistent across NRM areas (χ27=20.12, p=0.005) (Figure 25). There were significant differences in sapling abundance across years with regenerating saplings greatest in 2016 (χ23=201.16, p<0.001), with all NRM regions experiencing an increase relative to baseline levels (χ221=188.77, p<0.001).
Northern sites supported the greatest abundance of regenerating saplings (χ27=20.12, p=0.005) (Figure 25).
When sapling regeneration was investigated for overstorey species only, the abundance was higher in Stewardship sites (χ21=28.35, p<0.001) and differed between years (Figure 23). As with “All” species (combined midstorey and overstorey species) of sapling regenerating, overstorey only species exhibited an increase with time relative to baseline levels (χ23=24.33, p<0.001), with all NRM regions experiencing an increase on baseline levels (χ221=157.30, p<0.001) (Figure 26). Northern sites supported more overstorey-only species of saplings (χ27=22.83, p=0.002).
The abundance of midstorey-only species saplings was greater at Stewardship sites than Controls (χ21=10.6, p=0.001) (Figure 24). There was a significant increase relative to baseline levels from 2014, with 2016 having the highest recorded abundance (χ23=1275.0, p<0.001). The abundance of midstorey-only species saplings also increased significantly higher rate on Stewardship sites over time relative to the Control sites (χ23=43.2, p<0.001), suggesting that midstorey regeneration is improving under Stewardship investment. There were differences in NRM zones, with northern sites typically supporting a higher abundance of midstorey saplings (χ27=31.3, p<0.001), although this pattern varied over time (χ221=330.8, p<0.001) (Figure 27).
Combined sapling species richness was greatest on Stewardship sites (χ21=24.33, p<0.001), with an overall increase with time since the 2010 baseline survey (χ23=238.51, p<0.001) (Figure 28). Species richness was greatest in 2016, which also corresponded to the largest difference between Stewardship and Controls, with Stewardship sites becoming more diverse than Controls over time (χ23=19.74, p<0.001). Northern sites typically supported a
35
more diverse assemblage of sapling species (χ27=30.34, p<0.001), although there were temporal fluctuations among NRM zones (χ221=171.51, p<0.001) (Figure 31).
Overstorey-only species sapling richness was greater on Stewardship sites than Control sites (χ21=19.78, p<0.001), with an overall increase with time (χ23=174.40, p<0.001) (Figure 29). The greatest difference between Stewardship and Control sites was in 2016 (χ23=18.37, p<0.001). Northern sites supported a more diverse assemblage of sapling species than more southerly sites (χ27=23.03, p=0.002) (Figure 32).
Midstorey-only species sapling richness was greater in Stewardship than in the Controls (χ21=17.7, p<0.001) (Figure 30). There was a large increase from 2014 onwards relative to baseline levels (χ23=759.9, p<0.001). Stewardship sites were more diverse than controls and this difference was amplified in 2016 (χ23=17.85, p<0.001). Midstorey species sapling richness overall increased with latitude (χ27=56.6, p<0.001) (Figure 33).
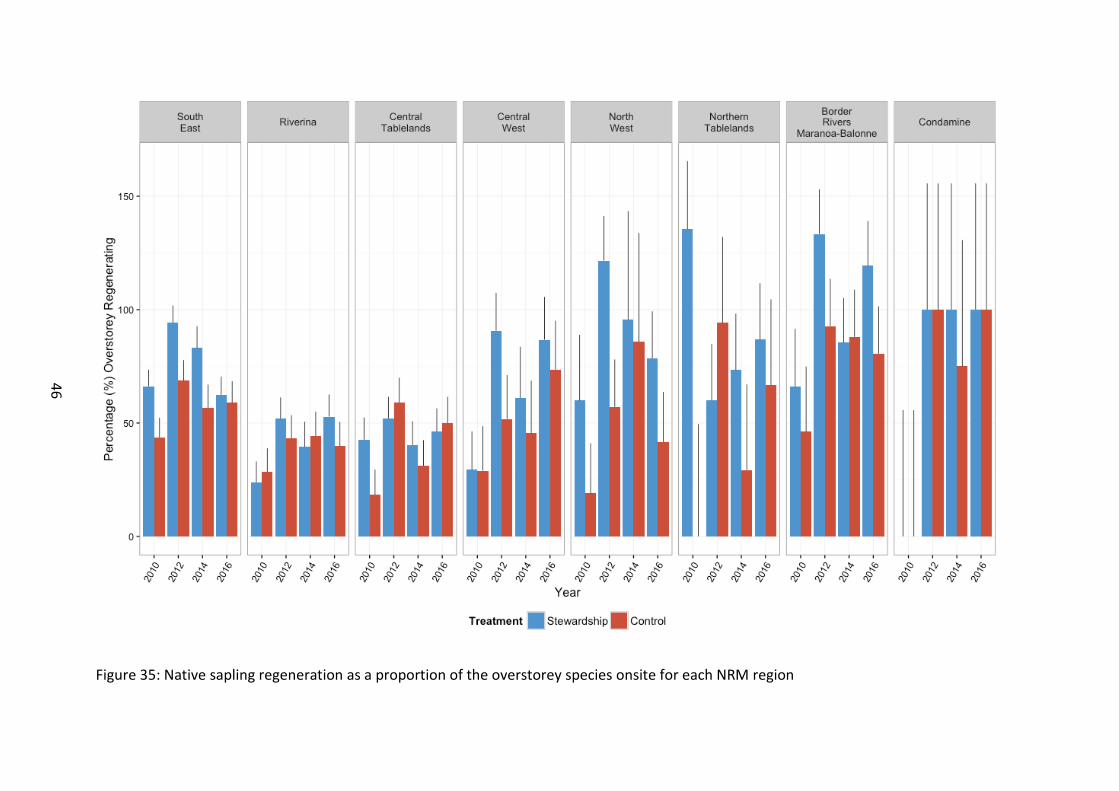
Adjusting sapling regeneration richness for the proportional richness of overstorey species present at a site, the proportion of overstorey at a site that was found to be regenerating was significantly greater on Stewardship sites than Controls (F1, 117=12.59, p<0.001), and the proportion of native sapling regeneration increased dramatically in 2016 compared to baseline surveys (F3, 650=20.03, p<0.001) (Figure 34; Figure 35).
Sites in the two northern most areas were characterised by the highest projected cover of overstorey (χ27=16.19, p=0.023) (Figure 36; Figure 37). Across the study region, overstorey cover was significantly higher in control sites than Stewardship sites (χ21=5.56, p=0.018). However, this is a difference in cover between treatments of approximately 1.25% averaged across all survey periods, approximately 3.8% in 2014 and approximately 2.4% in 2016, so whilst statistical significance was detected, the real values and differences are still very low at this stage. There was a decline in general levels of overstorey cover in 2014, although values for all other survey years remained similar (χ23=158.39, p<0.001). However there were differences in recorded response with time at the NRM level (χ221=65.17, p<0.001). Likewise there were no obvious patterns in the observed difference between NRM regions generally (χ27=20.33, p=0.005). There was an interaction effect of Stewardship and year, but the strong temporal effect is probably masking any true Stewardship influence at this stage (χ23=65.17, p<0.001).
The response of native midstorey cover did not differ between Stewardship and Control sites (χ21=0.55, p=0.459), or among NRM regions (χ27=7.83, p=0.347). There was a significant effect of time, with cover at its highest in 2016 (χ23=7.76, p=0.051).
There was also an interaction effect of time and NRM region, (χ221=20.96, p<0.001), although there were no discernible spatial patterns evident.
36
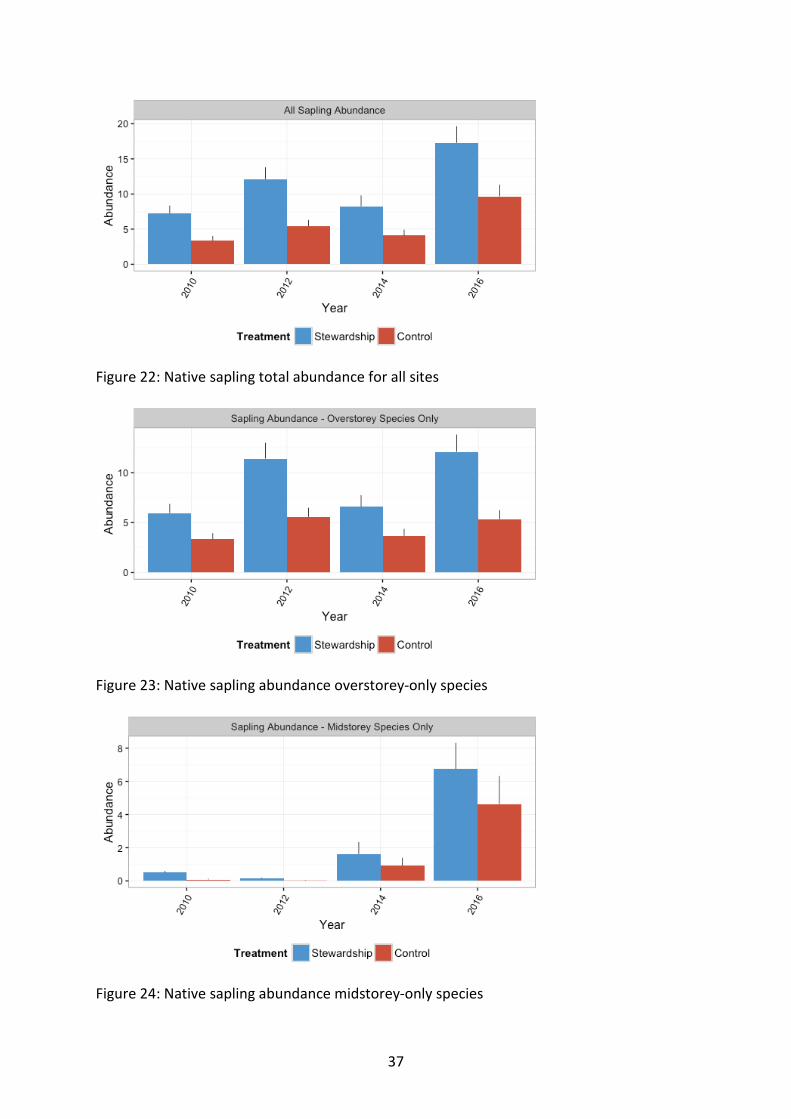
Figure 22: Native sapling total abundance for all sites
Figure 23: Native sapling abundance overstorey-only species
Figure 24: Native sapling abundance midstorey-only species
37
38
Figure 25: Native sapling total abundance for each NRM region
39
Figure 26: Native sapling abundance overstorey-only species for each NRM region
40
Figure 27: Native sapling abundance midstorey-only species for each NRM region
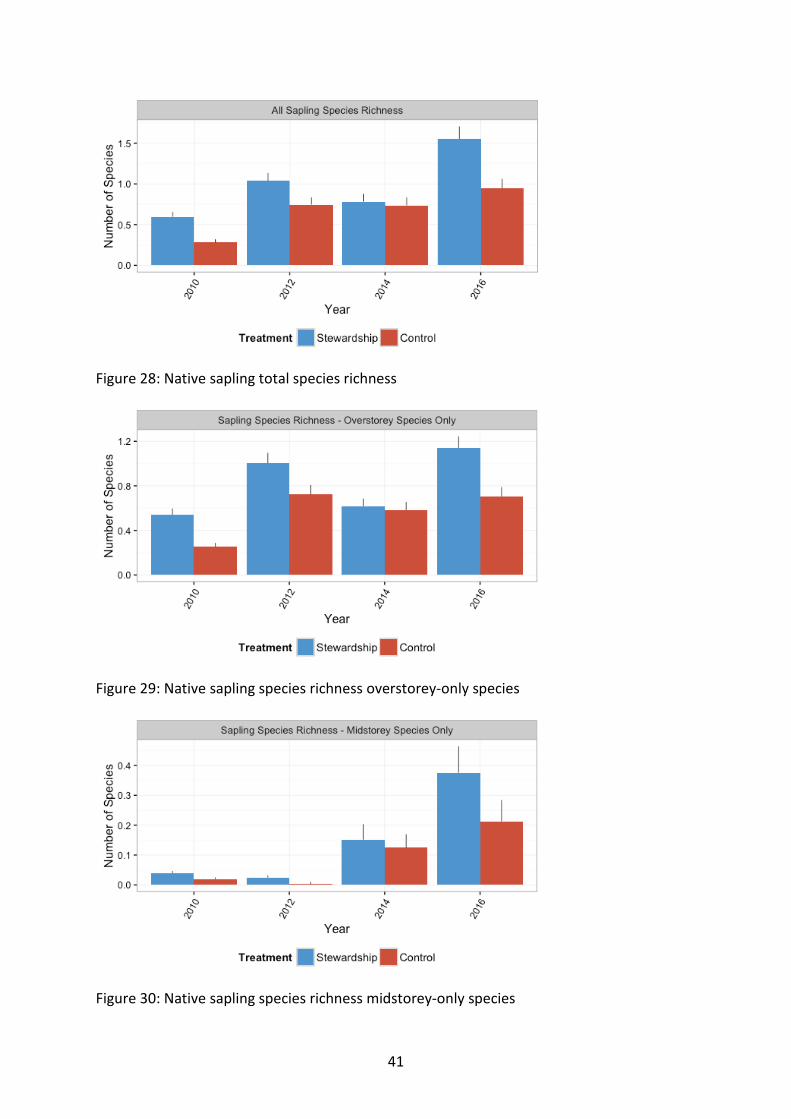
Figure 28: Native sapling total species richness
Figure 29: Native sapling species richness overstorey-only species
Figure 30: Native sapling species richness midstorey-only species
41
42
Figure 31: Native sapling total species richness for each NRM region
43
Figure 32: Native sapling species richness overstorey-only species for each NRM region
44
Figure 33: Native sapling species richness midstorey-only species for each NRM region
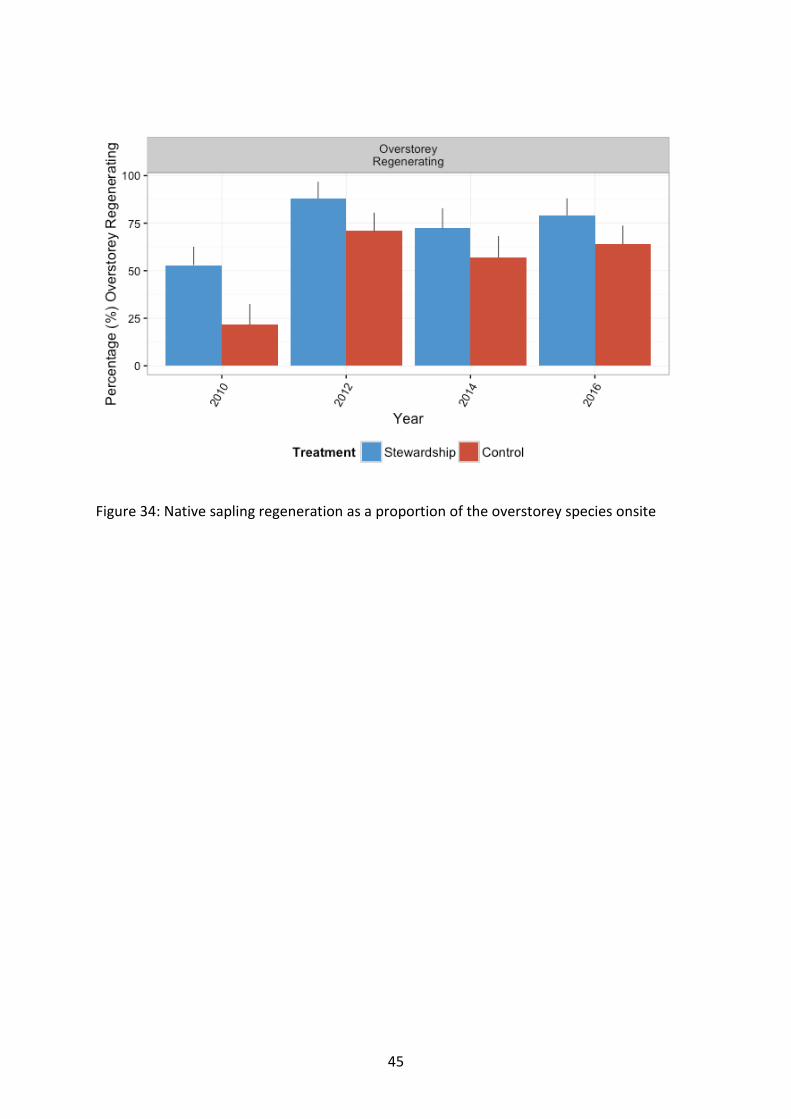
Figure 34: Native sapling regeneration as a proportion of the overstorey species onsite
45
46
Figure 35: Native sapling regeneration as a proportion of the overstorey species onsite for each NRM region
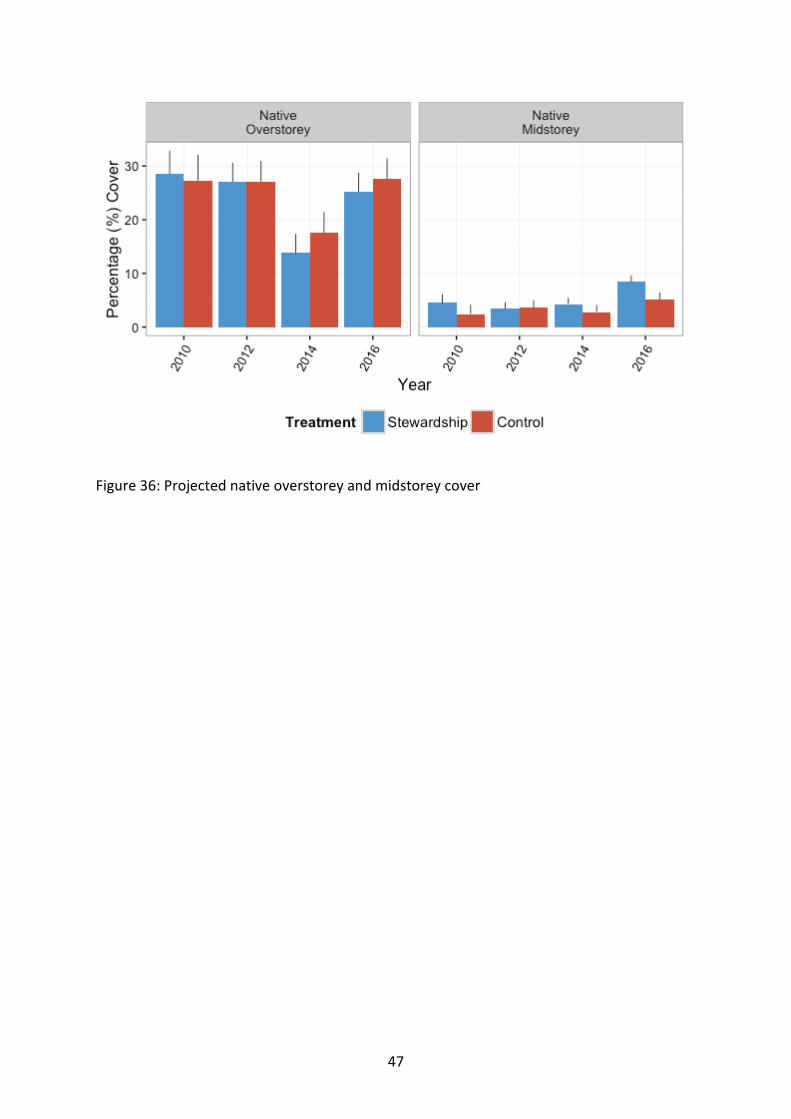
Figure 36: Projected native overstorey and midstorey cover
47

48
Figure 37: Projected native overstorey and midstorey cover for each NRM region
Discussion The focus of the ESP monitoring program was to detect changes in the condition of BGGW, and to assess the impact of the Australian Government’s Environmental Stewardship Program as an effective investment strategy to conserve the plants and animals in this Endangered Ecological Community. The level of survey effort on private land conducted in this study has never previously been attempted across the extent of the BGGW ecological community and the results demonstrate some important findings, outlined below.
Vegetation and biophysical responses in the study are many and complex.
Identifying key trends and patterns from a suite of sites that span a myriad of different baseline conditions, patch sizes and locations, management actions, livestock stocking rates and grazing regimes, weather conditions and rainfall patterns was challenging. The array of responses observed in the monitoring program, indicate a positive outcome beginning to emerge from Stewardship intervention.
Species richness Exotic vegetation richness was lower than the equivalent native plant species component for all recorded vegetation attributes, with exotic overstorey, midstorey and sub-shrubs the lowest of all components. There was no direct difference detected between Stewardship and control sites on any component of exotic vegetation richness, nor were there any detected improvements to sites (reductions in exotic richness) under Stewardship management compared to control sites.
We found some early indications of improvement in native vegetation species richness at Stewardship sites compared to Control sites. Native midstorey and native sub-shrub richness were greater in Stewardship sites following 2016 surveys, and native annual, and native other components (rush, sedge and fern) richness was maintained at a higher level in Stewardship sites than control sites. This suggests that Stewardship sites are beginning to improve in some components of native vegetation diversity as well as maintain their condition above that of the surrounding landscape for other components. Our data suggest that suitable sites were placed under Stewardship agreements from the outset of the ESP.
Percentage cover (biometrics) Stewardship sites typically supported a higher proportion of appropriate ground cover than Control sites. Native annuals and native sub-shrub cover was higher in Stewardship sites, whilst exotic perennial grass and exotic annual ground cover was lower. Stewardship sites also supported more organic litter, surface rock and had a lower amount of bare ground present onsite relative to Control sites. The result further confirms that there was appropriate establishment of Stewardship investment sites from the outset.
Our analyses also suggest that some biometrics components may be beginning to change in positive ways under Stewardship management, i.e. an improvement in condition. Native
49
perennial grass appears to be increasing in cover, whilst the amount of bare ground declined with time since Stewardship intervention.
There are also many general temporal differences evident, and seasonal fluctuation appears to be a major factor explaining many of the significant effects observed over the duration of the study. There was a consistent and widespread increase in the cover of native groundcover components (including perennial grasses, sub-shrubs, mid-storey and wetland species such as rushes and sedges) from the 2010 baseline year to 2014 across the entire study. Conversely, strong year effects indicate that many vegetation components response with time was not linear. For example, richness of some exotic components, including sub-shrubs, perennial grasses, and annuals peaked in 2012, but subsequently declined in 2014. Several components appear to be at their lowest in 2016. Such variation in cover is likely to be associated with the above-average seasonal rainfall in 2010 and 2011, which represented the second and third wettest rainfall events in New South Wales since rainfall records began in 1900 (Figure 2). This observed peak of 2012 was followed by declines in many components of vegetation during 2014, a result consistent with the hot and dry summer that preceded the surveys. The very hot, dry summer at the beginning of 2016 surveys also explains the low levels recorded for some of the vegetation components in 2016 surveys. These results highlight the need for ongoing monitoring, particularly in drier years to confirm whether climatic conditions are masking differences between treatments, and whether Stewardship intervention may buffer aspects of vegetation condition in periods of harsher climatic conditions.
Strong interaction effects between Stewardship, year and NRM region suggest that some components of exotic vegetation (exotic mid-storey, exotic sub-shrub richness), whilst not declining on Stewardship sites, are in fact increasing in Controls. Therefore, while Stewardship sites may not be improving for some exotic vegetation components per se, further degradation due to exotic richness encroachment is not increasing in Stewardship areas relative to Control sites (i.e. Stewardship sites are maintaining a better condition relative to surrounding landscape). This demonstrates the value of a matched control monitoring study in identifying and quantifying the effects of Stewardship management.
Structural habitat composition Live stem density was the only habitat component to differ between Stewardship and control sites, and it was higher on Stewardship sites and increased over time.
Overstorey elements and saplings Stewardship sites supported a higher abundance and diversity of regenerating saplings onsite. The first major indication of an improvement to vegetation condition under Stewardship management comes from midstorey sapling abundance and “All” sapling species diversity increasing on Stewardship sites with time since Stewardship intervention.
50
Macropod grazing pressure The number of macropod scats increased over time and were consistently higher in Stewardship sites relative to the Controls. This suggests that macropod herbivory is higher in Stewardship sites, possibly a direct result of reduced disturbance from domestic livestock, and the fact that in the harsher periods when livestock grazing is excluded from the Stewardship paddocks these areas may offer a good food resource to native herbivores relative to surrounding grazed paddocks. Macropod activity and influence needs to be monitored over time as there is the potential that if unchecked may prove to be detrimental to vegetation recovery in Stewardship managed patches.
Latitudinal effects Strong latitudinal differences were identified at NRM boundary scales for biodiversity. Latitudinal effects were identified for several vegetation components. Exotic annuals (forbs and grasses) were more diverse and abundant in the southern regions. (Figure 5). This probably reflects the prolonged and more intense disturbance history of these southern sites (fertiliser application, over-grazing etc.). Furthermore, sites in the north of the study (North West, Northern Tablelands, Border Rivers Maranoa-Balonne and Condamine) supported higher diversity and cover of important (poorly represented) structural layers in BGGW, including native perennial grasses, native annuals, native sub-shrubs and native midstorey. Following inclusion of 2016 data, native annual cover is now universally greater in Stewardship across all NRM regions. This suggests that Stewardship management is beginning to have a demonstrable effect on several of the measured vegetation components.
Log abundance and the number of dead trees was greatest in the Border Rivers Maranoa-Balonne zone which is likely to be indicative of a history of land-clearing and woodland thinning in this NRM region (Figure 10).
The abundance and diversity of sapling regeneration, including the proportion of overstorey species regenerating, was greater on Stewardship sites than Controls and also exhibited a general increase across all sites relative to the baseline surveys. These findings are consistent with those of other studies which have demonstrated that the wetter years of 2010/2011 represent an important ‘pulse’ in tree regeneration for eastern Australia more broadly (Gibbons et al. unpublished data). A general peak in sapling abundance in 2012, followed by a reduction in 2014 supports the notion of seasonal pulse responses to favourable conditions, and also indicates that northern regions, which had highest sapling abundance in 2014, differ in response to these conditions. That all NRM zones experienced an increase in 2016 relative to baseline levels in both Stewardship and Control sites suggests that the landscape may still be experiencing the effects of a pulse response. The fact that Stewardship sites have begun to improve beyond Controls following inclusion of 2016 surveys suggests that the effect of Stewardship is now starting to positively influence regeneration.
51

Strong regional effects have been identified for several components of monitored vegetation when data is grouped and analysed at the NSW Local Land Services/QLD NRM boundary level. These groupings are arbitrary and congruent with Government and NRM organisations. The groupings have been used as a means to reduce the geographic range of survey sites to areas of more manageable size for analysis. What is becoming apparent is that regardless of the method to categorise sites, there are large regional differences and, as such, ongoing management of the ESP should be considered at a more localised level. Sites were originally categorised at the regional level to reflect state government boundaries at the time and guide the relevant NRM agencies charged with delivering the ESP. Future analyses will investigate stratifying sites at the bioregional level, to determine if there are detectable regional differences and whether this represents a suitable alternative to site stratification.
Weeds of National Significance Weeds of National Significance had varied responses to Stewardship treatment. Cover of Weeds of National Significance (WoNS) and other recorded noxious weeds was generally low over the entire study. Distinct differences in WoNS between north and south regions also were detected. Importantly, weeds differed significantly between Stewardship and control sites.
African Love Grass was the only WoNS that exhibited a difference in presence between Stewardship and Controls, with presence higher in Controls.
Most WoNS species however exhibited a difference in percentage cover (biometrics) between Stewardship and Controls. The cover of African Love Grass, Coolatai Grass, Prickly Pear and Scotch Thistle were all lower in cover on Stewardship sites. Blackberry and St John’s Wort was greater on Stewardship sites. A higher percentage of St John’s Wort in particular in Stewardship sites may be in response to a changed grazing regime as part of Stewardship management. The removal of grazing disturbance in spring and early summer may be allowing St John’s Wort to perpetuate in Stewardship sites. Thus St John’s Wort is a WoNS that will need ongoing evaluation due to its sensitivity to grazing regimes.
The cover of weeds also varied significantly between years with some species increasing and others decreasing over time. Scotch Thistle and Serrated Tussock declined with time; whilst African Love Grass peaked in 2014; these responses may reflect specific management actions at the site level, such as grazing intensity and history, as well as abiotic factors such as favourable timing of rainfall.
Emergent issues There are two emerging issues with regards to ecosystem response and recovery identified at this stage through program monitoring that are worth flagging as potential inadvertent detriments to the outcomes of the ESP.
52
The first of these is the presence and cover of Weeds of National Significance (WoNS). There is emerging evidence that some WoNS, particularly St John’s Wort in the southern regions of the ESP, may be increasing in Stewardship funded sites. Whilst landholders may be contractually obliged to control WoNS under ESP funding requirements, it is of potential concern that some species of WoNS may have increased since Stewardship intervention relative to matched control sites and suggests that a change of land management may be influencing this measured increase in weed cover. One possible driver of this observed finding is the change in grazing regimes. For example, the spring/summer livestock grazing exclusion period may be inadvertently benefiting St. John’s Wort by not grazing this WoNS in spring prior to seed-set and whilst the phytotoxins are at a lower level and hence more palatable to livestock. It is worth flagging this as a weed to keep a close eye on, to ensure that it does not severely worsen within Stewardship sites.
Recorded levels for all WoNS are very low, and appear to have temporally fluctuated so this may not prove to be a large scale management issue and may resolve with time. Nevertheless it is worth remaining vigilant and monitoring closely.
The second emerging issue of concern is that of macropod herbivory within Stewardship sites. Data suggests that macropod activity is heightened in Stewardship patches relative to control sites. Monitoring data also suggest that macropod activity across the general landscape has also increased with time since this variable was first recorded (2014), but that the greatest temporal increase has been recorded in Stewardship sites. This appears to be a phenomenon observed across the entire study region.
This is of concern if macropods are hampering, or masking the ecosystem recovery within Stewardship sites.
Again the change in management, particularly regarding livestock grazing regimes, within Stewardship sites is a possible candidate for this observed bias of macropods in Stewardship sites. Again grazing timing (spring/summer exclusion) may be a contributing factor to this response. Stewardship patches are contractually destocked for 6 months per year, but are often destocked for longer than this at the land manager’s discretion. Not only is there reduced competition for resources for macropods with domestic livestock, there is also reduced disturbance from land managers around livestock activities (mustering etc.). It is possible that this reduction in competition and disturbance within Stewardship sites and the possibility that the better recovering vegetation condition (i.e. more feed) in these Stewardship patches, particularly in the drier periods when Stewardship sites are locked up, is favouring macropod activity compared to surrounding paddocks (currently stocked, less feed etc.). Macropod activity and herbivory is an issue that needs to be monitored closely in coming years to determine if this is an inadvertent detriment to Stewardship management. It may be that more intensive macropod control is required to reduce the impact on a recovering ecosystem, especially if macropod numbers grow. Or perhaps livestock grazing
53
regimes may need to be investigated further to investigate if a more flexible grazing approach may in fact provide better outcomes to woodland recovery.
Value of monitoring The adoption of agri-environmental schemes to conserve biodiversity in agricultural contexts has gained growing popularity in recent years. However, one common shortfall and criticism of these agri-environmental schemes is a lack of monitoring to assess outcomes. Not only does this mean the effectiveness of specific investment cannot be readily quantified, but also that future investment programs cannot be appropriately guided and designed based on outcomes of previous schemes.
The BGGW ESP is a clear exception with ecological monitoring incorporated into the design of the entire program and a proportion of the funding budget allocated accordingly. Outcomes detected through ongoing monitoring of BGGW specific to the ESP allow for the assessment of efficacy of investment and allow for improvement of both BGGW and similar future Stewardship programs.
The ANU team was contracted to monitor the specific ecological outcomes of the BGGW ESP. The ANU team specialises in long-term, landscape scale ecological field monitoring and research. Consequently, our regionally based team consists of highly experienced field ecologists with considerable practical experience in working within woodland ecosystems. Through our various ongoing studies and monitoring programs, we have developed strong working relationships with landholders, government departments and NRM groups. This support network has led to, for example, the addition of farms voluntarily participating in the Grazing Management Study and Native Forb Enhancement Study.
Extensive work in woodland ecosystems means also that the ANU team has a wealth of knowledge to draw upon and allow cross-referencing of data between different studies to further guide future management actions.
Hence, the ANU team is well suited for such a large scale undertaking as is involved with the ESP.
Value of BGGW ESP
Ecological benefits Given that many vegetation communities are poorly represented in the current formal reserve system, novel approaches to conservation such as integrating primary production and biodiversity values on private land, as demonstrated in the ESP, become an important contribution to conservation.
Ecological values gained from ESP investment are the most important outcome to the program. Initial baseline data reveals that suitable areas have been targeted for investment to “maintain and improve the condition and extent of targeted Matters of National
54
Environmental Significance”. This highlights the value of appropriate investment within this Endangered Ecological Community from the outset of the Stewardship Program.
Ecological change can be slow and subsequently difficult to detect. It is therefore a very positive outcome, that after 6 years, native sapling regeneration and several native groundcover attributes are responding positively to Stewardship intervention and that some Weeds of National Significance (WoNS) are responding negatively to Stewardship intervention.
Grants for scientific studies and NRM investment typically last for 3 – 5 years. The investment into Stewardship payments and hence the time frame that landholders are required to undertake certain management actions is substantially longer (up to 15 years). This represents a critically important opportunity for monitoring over a realistic time period to detect changes as a result of management actions. This would allow for seasonal variables to be accounted for, such as a return to drier climatic conditions following consecutive wet years after the ESP implementation.
Social benefits Repeat visits to farms since 2010 from our team has led to the establishment of working relationships between the ANU team and landholders. As access to many of the monitoring sites is difficult, good working relationships with landholders is essential for monitoring operations. For some time now, the ANU team are the only face-to-face contact that many of the landholders have had in the BGGW ESP in the program. This has proven a valuable aspect of monitoring, as it keeps landholders informed of our findings, engages and maintains their interest within the program, and provides landholders with a platform to share their opinions and experiences regarding the program.
The social value of the ESP, although difficult to quantify, extends beyond an exchange of information between stakeholders and is a very important component of the program. In the longer term, we suggest the ongoing funding model of the ESP, consisting of annual payments, will be superior to the traditional approach to NRM investment, where landholders receive a once-off payment for funded works, with no follow up to gauge the success of such investment. An annual payment not only means that compliance with required management actions is achieved regularly, but it also ensures the longevity of success through ongoing maintenance and management from the landholder. As the ESP extends over many years, it provides some flexibility with the implementation of management actions. For example, in more typical NRM investment programs, a landholder may be forced to revegetate in less than ideal conditions to meet a funding deadline, which may result in management having limited success. Follow up and maintenance on many of these traditional programs may not be a stipulation of funding or may not have any compliance undertaken to assess success of funded works beyond initial work being completed.
55

Certainty of longer term funding allows landholders to factor these Stewardship payments into their operational budgets and, for many, provides a reliable supplementary income, particular during less favourable farming conditions. This security may not only provide ample time to implement certain management actions, but also help facilitate change in landholder attitudes to management. Ultimately, it may provide a catalyst for implementing alternative management practices where previously the financial burden of breaking an existing land management habit and experimenting with different approaches may have been difficult and financially risky.
The ESP also creates awareness from other non-participating landholders by talking to neighbours and friends about the program. Many participating landholders have reported other landholders, who after seeing the ESP in operation, have become interested in not just the direct financial incentives but also a more holistic approach to land management.
Scientific benefits The establishment of a robust monitoring program consistent in design with a suite of other (but broadly) similar long-term woodland studies means the ESP is making a significant contribution to scientific understanding beyond just ESP monitoring. There are many flow-on effects through PhD studies and additional collaborative studies utilising a broad scale network of established monitoring points and stakeholder networks. This value-adds to the ESP with the exchange of information between different studies and a deeper analysis of the mechanisms underpinning the effectiveness of the ESP.
Additional studies being conducted as a direct result of the ESP include:
• Reptile conservation and management across the ESP (PhD program undertaken by Geoff Kay).
• Quantification of patterns of regeneration in response to management interventions (led by Dr Chloe Sato).
• Quantification of the effects of Stewardship grazing on plant species richness and weed species (led by Dr Chloe Sato).
• Quantification of the effects of Stewardship grazing on birds (led by Professor David Lindenmayer and Dr Ayesha Tulloch).
• Quantification of the effects of Stewardship grazing on ants (led by Dr Philip Barton). • Quantification of the effects of Stewardship grazing on carbon and soil condition
(PhD program undertaken by Pandora Holliday).
Operational comments Following the successful completion of the 2010 baseline and the 2012, 2014 and 2016 surveys, it is important to highlight some of the difficulties encountered so that they may be managed in the future. During much of the early stages of the field program, record rainfall created significant logistical challenges for the completion of the field program, especially in the initial year of monitoring in 2010. Despite this, > 96% of all vegetation, bird and
56
herpetofaunal surveys were completed successfully within critical seasonal timeframes. This was achieved because of the support of a dedicated team of ecologists highly experienced in working in rural settings. Furthermore, a good working relationship with landholders was critical for ensuring ready access to farms. Lastly, it was important that access to farms during these times was possible, and although some sites were not accessible due to landholder availability, physical limitations or safety concerns for the monitoring team.
It is important that future Stewardship monitoring programs consider the efficacy of monitoring such a large landscape compared with the program objectives achieved. There are significantly fewer sites in the northern half of the monitoring region (North West, Northern Tablelands, Border Rivers Maranoa-Balonne and Condamine) and this led to low levels of site replication and subsequently higher variance in the datasets in these areas, as well as poor monitoring time efficiency. As such, future monitoring programs need to evaluate whether these sites are critical for inclusion into the monitoring program. Should this be the case, we recommend that more sites be added to these regions to address these data and time-related issues.
Weeds of National Significance were recorded in vegetation surveys. This brings with it the question of “to control or to monitor?” as landholders are encouraged to remove weeds from ESP sites. Efforts to control invasive plants may, however, alter the nature of the treatment contrast between the Stewardship and Control sites. Nevertheless, an Adaptive Monitoring approach (sensu Lindenmayer & Likens, 2009; Lindenmayer et al. 2011) in the ESP monitoring program may enable key additional changes, such as weed removal to be made.
We identified significant regional-scale effects, such as weed encroachment. Where possible activities like additional weed control should be accommodated in the Stewardship monitoring framework. In addition, we suggest it is important that future monitoring programs integrate Stewardship policy with practical management concerns at the farm-level (e.g. farm-level weed control).
Finally, it is important to emphasise the mutual value gained by maintaining close contact between the ANU monitoring team and the ESP land managers. Ongoing continuity of the ANU field team over the past 6 years has encouraged good communication and knowledge sharing with land managers. It enabled land managers to discuss the effectiveness of existing and developing management practices, to compare results with other land Stewards, and have access to new knowledge to guide management. For this reason, the ANU regularly and widely distribute survey results, newsletters and calendars and is involved in field days to keep land managers abreast of monitoring results and provide feedback about management actions.
57
Conclusions The Environmental Stewardship Program represents an important and unique example of Australian agricultural and environmental policy (Lindenmayer et al., 2012). A number of significant outcomes, for both land managers and policy makers, have begun to emerge from monitoring of the ESP, and must be used to continue to inform and guide the ongoing delivery of the ESP. Our results from the past 6 years of work highlight several challenges for achieving broad-scale positive outcomes for managing for improved BGGW condition. A key challenge is to maintain the monitoring program to further quantify changes associated with treatments and separate them from temporal and catchment scale variation.
The ESP will need to be monitored closely to identify any emergent issues as early as possible. The longer-term delivery of the ESP affords not just the capacity for ongoing monitoring, but also allows for the possibility of adaptive management to counter any identified issues to program outcomes. Increases in some weed species and macropod grazing impacts within Stewardship sites are responses identified at this stage, that will need to be monitored closely to ensure they don’t inadvertently detriment the desired outcomes of ESP.
58
References Australian Government Bureau of Meteorology (BOM) (2016a). Annual Rainfall – Southeastern Australia (1900 – 2015) [Graph]. Retrieved from: http://www.bom.gov.au/climate/change/#tabs=Tracker&tracker=timeseries
Australian Government Bureau of Meteorology (BOM) (2016b). Climate Change and variability. Retrieved from: http://www.bom.gov.au/climate/change/#tabs=Tracker&tracker=timeseries
Florance, D., Kay, G., Wood, J., Lindenmayer, D.B. (2013). Continued Project Implementation Report. Report to the Department of Sustainability, Environment, Water, Population and Communities. The Australian National University, Canberra.
Lindenmayer, D.B., Likens, G.E. (2009). Adaptive monitoring: a new paradigm for long-term research and monitoring. Trends in Ecology & Evolution, 24(9), 482–486.
Lindenmayer, D.B., Kay, G.M., Cunningham, R. (2010). Final Monitoring Protocol Report for the Environmental Stewardship Program. Report to the Department of Sustainability, Environment, Water, Population and Communities. The Australian National University, Canberra.
Lindenmayer, D.B., Likens, G.E., Haywood, A., Miezis, L. (2011). Adaptive monitoring in the real world: proof of concept. Trends in Ecology & Evolution, 26(12), 641–646.
Lindenmayer, D.B., Zammit, C., Attwood, S.J., Burns, E., Shepherd, C.L., Kay, G., Wood, J. (2012). A novel and cost-effective monitoring approach for outcomes in an Australian biodiversity conservation incentive program. PLOS One, 7(12), e50872.
Welsh, A.H., Cunningham, R.B., Chambers, R.L. (2000). Methodology for estimating the abundance of rare animals: seabird nesting on North East Herald Cay. Biometrics, 56(1), 22–30.
59