environmental sustainability assessment comparing...
TRANSCRIPT

Environmental sustainability assessment comparing
through the means of lifecycle assessment the
potential environmental impacts of the use of
alternative feedstock (biomass, recycled plastics,
CO2) for plastic articles in comparison to using
current feedstock (oil and gas)
Draft report for stakeholder consultation (part 2):
- Selection of relevant plastic articles
- Screening LCA case studies
Authors: Nessi S., Bulgheroni C.,
Garbarino E., Garcia-Gutierrez P.,
Orveillon G., Sinkko T., Tonini D.,
Pant R. (project leader)
Deadline for consultation comments December 19, 2018
EUR XXXXX XX
This publication is a Technical report by the Joint Research Centre (JRC), the European Commission’s science
and knowledge service. It aims to provide evidence-based scientific support to the European policymaking
process. The scientific output expressed does not imply a policy position of the European Commission. Neither
the European Commission nor any person acting on behalf of the Commission is responsible for the use that
might be made of this publication.
Ispra: European Commission, 2018
© European Union, 2018
The reuse policy of the European Commission is implemented by Commission Decision 2011/833/EU of 12
December 2011 on the reuse of Commission documents (OJ L 330, 14.12.2011, p. 39). Reuse is authorised,
provided the source of the document is acknowledged and its original meaning or message is not distorted. The
European Commission shall not be liable for any consequence stemming from the reuse. For any use or
reproduction of photos or other material that is not owned by the EU, permission must be sought directly from
the copyright holders.
All content © European Union, 2018
How to cite this report: Author(s), Title, EUR (where available), Publisher, Publisher City, Year of Publication,
ISBN 978-92-79-XXXXX-X (where available), doi:10.2760/XXXXX (where available), JRCXXXXXX

Administrative Arrangement
JRC. 34854-2017
DG GROW N SI2.762599
"Environmental sustainability assessment comparing through the means of
lifecycle assessment the potential environmental impacts of the use of
alternative feedstock (biomass, recycled plastics, CO2) for plastic articles in
comparison to using current feedstock (oil and gas)"
Draft report for stakeholder consultation (part II):
- Selection of relevant plastic articles
- Screening LCA case studies
Status: November 20, 2018
Deadline for consultation comments: December 19, 2018
Authors: Nessi S., Bulgheroni C., Garbarino E., Garcia-Gutierrez P., Orveillon G., Sinkko T.,
Tonini D., Pant R. (project leader)

Comparative LCA of alternative feedstock for plastics production – DRAFT FOR STAKEHOLDER CONSULTATION Part II
4
Contents 1. Introduction .................................................................................................................................... 8
2. Selected case studies and scenarios .............................................................................................. 8
3. Overall modelling approach ........................................................................................................... 9
3.1 Data sources and limitations................................................................................................... 9
3.2 Impact categories, assessment methods and limitations ....................................................... 9
4. Case study 1: beverage bottles .................................................................................................... 12
4.1 Assessed scenarios ................................................................................................................ 12
4.2 Functional Unit and reference flow ...................................................................................... 13
4.3 System Boundary .................................................................................................................. 14
4.4 Life Cycle Inventory ............................................................................................................... 18
4.4.1 Polymer production ...................................................................................................... 32
4.4.2 Transport to article production site .............................................................................. 33
4.4.3 Article production ......................................................................................................... 33
4.4.4 Transport to final client ................................................................................................. 34
4.4.5 End of Life ..................................................................................................................... 34
4.5 Life cycle impact assessment results .................................................................................... 42
4.6 Interpretation........................................................................................................................ 50
4.6.1 Case study results ......................................................................................................... 50
4.7 Learnings from applying the draft methodology .................................................................. 56
4.7.1 Implications of the methodological choices on the results .......................................... 56
4.7.2 Options to be explored for further improvement ........................................................ 58
5. Case study 2: flexible food packaging film .................................................................................. 60
5.1 Assessed scenarios ................................................................................................................ 60
5.2 Functional unit and reference flow ....................................................................................... 62
5.3 System boundary .................................................................................................................. 63
5.4 Life Cycle Inventory ............................................................................................................... 67
5.4.1 Polymer production ...................................................................................................... 81
5.4.2 Transport to article production site .............................................................................. 83
5.4.3 Article production ......................................................................................................... 83
5.4.4 Transport to final client ................................................................................................. 83
5.4.5 End of Life ..................................................................................................................... 84
5.5 Life cycle impact assessment results .................................................................................... 86
5.6 Interpretation........................................................................................................................ 95
5.6.1 Case study results ......................................................................................................... 95

Comparative LCA of alternative feedstock for plastics production – DRAFT FOR STAKEHOLDER CONSULTATION Part II
5
5.7 Learnings from applying the draft methodology .................................................................. 99
5.7.1 Implications of the methodological choices on the results .......................................... 99
5.7.2 Options to be explored for further improvement ...................................................... 101
6. Case study 3: mulching film ....................................................................................................... 103
6.1 Assessed scenarios .............................................................................................................. 103
6.2 Functional Unit and reference flow ..................................................................................... 105
6.3 System Boundary ................................................................................................................. 105
6.4 Life Cycle Inventory ............................................................................................................. 109
6.4.1 Polymer production ..................................................................................................... 118
6.4.2 Transport to article production site............................................................................. 118
6.4.3 Article production ........................................................................................................ 119
6.4.4 Transport to final client ............................................................................................... 119
6.4.5 End of Life .................................................................................................................... 119
6.5 Life cycle impact assessment results ................................................................................... 122
6.6 Interpretation ...................................................................................................................... 130
6.6.1 Case study results ........................................................................................................ 130
6.7 Learnings from applying the draft methodology ................................................................ 135
6.7.1 Implications of the methodological choices on the results ........................................ 135
6.7.2 Options to be explored for further improvement ...................................................... 136
7. Case study 4: insulation board ................................................................................................... 139
7.1 Assessed scenarios .............................................................................................................. 139
7.2 Functional Unit and reference flow .................................................................................... 140
7.3 System Boundary ................................................................................................................ 140
7.4 Life Cycle Inventory ............................................................................................................. 143
7.4.1 Polymer production .................................................................................................... 155
7.4.2 Transport to article production site ............................................................................ 156
7.4.3 Article production ....................................................................................................... 156
7.4.4 Transport to final consumer ....................................................................................... 156
7.4.5 End of Life ................................................................................................................... 156
7.5 Life cycle impact assessment results .................................................................................. 158
7.6 Interpretation...................................................................................................................... 165
7.6.1 Case study results ....................................................................................................... 165
7.7 Learnings from applying the draft methodology ................................................................ 171
7.7.1 Implications of methodological choices on the results .............................................. 171
7.7.2 Options to be explored for further improvement ...................................................... 172
8. Case study 5: automotive interior panel ................................................................................... 174

Comparative LCA of alternative feedstock for plastics production – DRAFT FOR STAKEHOLDER CONSULTATION Part II
6
8.1 Assessed scenarios .............................................................................................................. 174
8.2 Functional Unit and reference flow ..................................................................................... 176
8.3 System Boundary ................................................................................................................. 178
8.4 Life Cycle Inventory ............................................................................................................. 182
8.4.1 Polymer production ..................................................................................................... 195
8.4.2 Transport to article production site............................................................................. 195
8.4.3 Article production ........................................................................................................ 196
8.4.4 Transport to final client ............................................................................................... 196
8.4.5 End of Life .................................................................................................................... 196
8.5 Life cycle impact assessment results ................................................................................... 198
8.6 Interpretation ...................................................................................................................... 206
8.6.1 Case study results ........................................................................................................ 206
8.7 Learnings from applying the draft methodology ................................................................ 212
8.7.1 Implications of the methodological choices on the results ........................................ 212
8.7.2 Options to be explored for further improvement ...................................................... 214
9. Common learnings from the screening studies ......................................................................... 215
9.1 Aggregated datasets .................................................................................................................. 215
9.2 Reliability of some screening results for Resource Use (mineral and metals) and Water Use .. 215
9.3 Land Use Changes (dLUC/iLUC) ................................................................................................. 216
9.4 Modelling of EoL options ........................................................................................................... 216
9.5 Delayed carbon emissions of long-lived articles ........................................................................ 217
9.6 Handling of recycled material input .......................................................................................... 217
10. Options to be explored for further improvement................................................................. 217
10.1 Aggregated datasets ........................................................................................................... 217
10.2 Reliability of LCIA results for Resource Use (minerals and metals) and Water Use ........... 217
10.3 Land Use Changes (dLUC/iLUC) ........................................................................................... 218
10.4 Modelling of EoL options .................................................................................................... 218
10.5 Modelling of the EoL of conventional mulch film ............................................................... 218
10.6 Littering ............................................................................................................................... 219
10.7 Assessment of potential impacts on biodiversity ............................................................... 219
10.8 Carbon storage and delayed carbon emissions (long-lived articles) .................................. 220
10.9 Handling of recycled material input .................................................................................... 220
11. References .............................................................................................................................. 221
Annex A. Selection criteria for and list of selected plastic articles ................................................... 227
A.1 Introduction .............................................................................................................................. 227
A.2 Criteria for the scoring of relevant plastic articles ................................................................... 229

Comparative LCA of alternative feedstock for plastics production – DRAFT FOR STAKEHOLDER CONSULTATION Part II
7
A.3 Additional criteria for the selection of relevant plastic articles ............................................... 230
A.4 Preliminary list of articles ......................................................................................................... 232
References ...................................................................................................................................... 245
Annex B. Additional LCIA results of the screening case studies ....................................................... 252
B.1 Beverage bottle LCA scenarios ................................................................................................. 252
B.2 Packaging film LCA scenarios .................................................................................................... 254
B.3 Mulch film LCA scenarios .......................................................................................................... 256
B.4 Insulation board LCA scenarios ................................................................................................. 258
B.5 Automotive interior panel LCA scenarios ................................................................................. 260

Comparative LCA of alternative feedstock for plastics production – DRAFT FOR STAKEHOLDER CONSULTATION Part II
8
1. Introduction 1
To test the draft methodological framework outlined in this project to assess potential 2
environmental impacts of plastics articles derived from alternative feedstocks, five screening LCA 3
case studies were conducted. It has to be noted that, at this stage of development, the main 4
objective is not to assess the different plastic articles, but to gain insights on the draft methodology 5
and its application. 6
Based on the outcome of this screening assessment and of a subsequent stakeholder consultation, a 7
final method will be developed, and will be applied to 10 full LCA case studies. 8
This document describes: (i) the case studies selected for the screening exercise and the related 9
scenarios and sub-scenarios (Section 2); (ii) the adopted selection criteria and the resulting 10
(preliminary) list of suggested articles to be considered for full LCA case studies (Annex A); as well as 11
(iii) the approach and the outcome of the five screening case studies. 12
2. Selected case studies and scenarios 13
According to the selection criteria described in Annex A, the following articles were selected for the 14
screening case studies: 15
1. Beverage bottles; 16
2. Food flexible packaging film; 17
3. Mulch film; 18
4. Insulation material; and 19
5. Car interior panels 20
Table 1 provides an overview of the functional unit (FU) selected for each article. Further details on 21
the reasons for choosing such FUs can be found in the sections related to the specific case studies. 22
These sections also describe the examined scenarios in terms of material, related feedstock and End 23
of Life (EoL) options explored. 24
Table 1: Functional unit (FU) selected for each article included in the screening case studies 25
Article Functional unit
Beverage bottle Delivering 1000 litres of beverage by means of 0.5 litre bottles, ensuring a comparable shelf life of the packaged product
Food flexible packaging film 100 m2 of food flexible packaging film with an average thickness of 30 µm and ensuring a similar overall shelf life of the packaged product
Mulch film Mulching 1 ha of cultivated land in Europe
Insulation material Delivering an insulation board with area equal to 1 m2 that provides a thermal resistance (R) equal to 1 m2∙K∙W-1
Car interior panel Covering an area of 1 m2 of car door with a thickness of 0.8 mm
26
Comparative LCA of alternative feedstock for plastics production – DRAFT FOR STAKEHOLDER CONSULTATION Part II
9
3. Overall modelling approach 1
3.1 Data sources and limitations 2
Inventory data for foreground processes included in the system boundary of each scenario were 3
preferentially sourced from Environmental Footprint (EF)-compliant datasets, whenever available. 4
When this was not the case, datasets from the GaBi database were used, as these are normally 5
developed with an approach similar to the one used for EF-compliant datasets related to plastics 6
supply and end-of-life. Alternatively, disaggregated ecoinvent datasets were employed, by replacing 7
default background datasets (related to e.g. energy supply) with EF-compliant datasets, when 8
available. Finally, if no suitable datasets were available in such databases, dedicated inventories 9
were developed based on literature activity data. The latter were combined with background 10
datasets selected according to the same hierarchy followed for foreground datasets, i.e., EF-11
compliant, GaBi, or ecoinvent datasets, depending on availability (and according to the secondary 12
dataset selection criteria specified in the methodology document -Report I-). 13
All EF-compliant, and most GaBi datasets provide a completely aggregated, cradle-to-gate process 14
inventory. For instance, for polymer production, single, aggregated datasets covering the burdens of 15
all stages from feedstock extraction (or production) up to product manufacturing is normally 16
available. The use of this type of datasets had two main consequences, on the modelling exercise: (i) 17
predefined methodological choices had to be used (e.g. regarding multifunctionality), making it 18
difficult to ensure consistency within the same product life cycle and across the different analysed 19
scenarios; and (ii) the level of granularity of the contribution analysis was bound to the level of 20
aggregation of the used datasets, which is particularly high for processes in the upstream part of the 21
supply chain. For this reason, the impacts of feedstock production could not be generally separated 22
by those of downstream processes of intermediate and polymer production. 23
3.2 Impact categories, assessment methods and limitations 24
The potential environmental and human health impacts of the examined plastic articles were 25
assessed with reference to the whole set of default impact categories and related impact 26
assessment methods recommended in the (Product Environmental Footprint) PEF context, and 27
reported in the methodology document (Report I). The full list of assessed categories is reported in 28

Comparative LCA of alternative feedstock for plastics production – DRAFT FOR STAKEHOLDER CONSULTATION Part II
10
Table 2. 1
2

Comparative LCA of alternative feedstock for plastics production – DRAFT FOR STAKEHOLDER CONSULTATION Part II
11
Table 2: Impact categories and related impact assessment methods used in the screening studies 1
Impact Category Unit Impact Assessment Model
Climate Change kg CO2 eq. Baseline model of the IPCC over a 100 year time horizon (IPCC, 2013)
Ozone Depletion kg CFC-11 eq. Steady- state model of the World Meteorological Organization over an infinite time horizon (WMO, 1999)
Human Toxicity – cancer CTUh USEtox model (Rosenbaum et al., 2008)
Human Toxicity – non-cancer
CTUh USEtox model (Rosenbaum et al., 2008)
Particulate Matter Disease incidence
PM method recommended by UNEP (UNEP, 2016)
Ionising Radiation kBq U235 eq. Human Health effect model (Dreicer et al., 1995)
Photochemical Ozone Formation
kg NMVOC eq. LOTOS-EUROS model (Van Zelm et al., 2008) as implemented in ReCiPe
Acidification mol H+ eq. Accumulated Exceedance model (Seppälä et al., 2006; Posch et al., 2008)
Eutrophication Terrestrial mol N eq. Accumulated Exceedance model (Seppälä et al., 2006; Posch et al., 2008)
Eutrophication Freshwater kg P eq. EUTREND model (Struijs et al., 2009) as implemented in ReCiPe
Eutrophication Marine kg N eq. EUTREND model (Struijs et al., 2009) as implemented in ReCiPe
Ecotoxicity Freshwater CTUe USEtox model, (Rosenbaum et al, 2008)
Water use m3 world eq. Available WAter REmaining (AWARE) as recommended by
UNEP, 2016
Resource Use – minerals and metals
Kg Sb eq. CML 2002 (Guinée et al., 2002) as updated in Van Oers et al. (2002)
Resource Use – fossils MJ CML 2002 (Guinée et al., 2002) as updated in Van Oers et al. (2002)
Land Use Pt Soil quality index based on LANCA (Beck et al., 2010 and Bos et al., 2016)
2
The relevance of potential biodiversity impacts for the studied systems (which involve agricultural 3
production) is also acknowledged. Due to the lack of an established framework for quantitative 4
assessment of biodiversity impacts, no quantitative indicators were included at this stage in the 5
assessment. However, aspects relevant to biodiversity are indeed covered e.g. by the following mid-6
point impact categories: Climate Change, Acidification, Eutrophication (terrestrial, freshwater, 7
marine), Water Use, and Land Use. 8
9
As reported in the methodology document (Report I), qualitative or semi-quantitative information 10
can be provided as “additional environmental information”, if feedstock coming from biotic 11
production systems managed so as to maintain biodiversity (e.g. organic production) are used for 12
plastic manufacturing. Any statement shall be supported by proper evidence. 13
In addition, potential impacts from littering are recognised to play a relevant role for some plastic 14
products, due to their important contribution to the littering phenomenon, especially in countries 15
where a well developed waste collection system is still lacking. At this stage no assessment of the 16
potential environmental impacts of littering could be performed, due to the lack of data, and lack of 17
understanding of the fate, exposure and subsequent (physical and toxicological) effects on 18
ecosystems and humans. In addition, estimating the share of product littered at EoL involves 19

Comparative LCA of alternative feedstock for plastics production – DRAFT FOR STAKEHOLDER CONSULTATION Part II
12
significant uncertainties, as it is not straightforward to relate currently available quantitative 1
evidence (e.g. data from beach counts), with a corresponding percentage of product littered. 2
The version of the impact assessment methodology used in this screening exercise is the latest 3
implemented in GaBi (i.e. 1.8.9), which is not the latest one released by the JRC (2.0). The latter 4
could not be imported for use in GaBi, as it was not possible to ensure full consistency between the 5
nomenclature of elementary flows used in it (which is ILCD-compliant), with the nomenclature used 6
in GaBi databases. 7
Similarly, it was not possible to have a 100% consistent import of EF-compliant datasets into GaBi, 8
due to the different nomenclature of elementary flows used in the two databases. For this reason, at 9
this stage the LCIA results obtained from these screening case studies need to be interpreted with 10
caution, as reliability could not be achieved for all impact categories. To better understand the 11
consequences of operating under these conditions, for some selected EF-compliant datasets we 12
performed an analysis of the discrepancies between the LCIA results calculated with GaBi, and the 13
correct results calculated with a specific tool developed by the JRC1, using the same version of the 14
impact assessment methodology. This analysis showed that for some datasets from the different 15
providers contributing to the pool of EF-compliant data, there can be a significant difference 16
between calculated and expected results in the categories of Resource Use – minerals and metals 17
(from 5% to 200%) and Water Use (larger than 100%). Moreover, depending on the data provider, 18
there can also be important differences for toxicity-related indicators (35%-380%), and 19
Photochemical Ozone Formation (larger than 100%). For Climate Change and all other impact 20
categories, the results can be seen as aligned. 21
4. Case study 1: beverage bottles 22
4.1 Assessed scenarios 23
The use of different materials and/or feedstock for bottle manufacturing was explored by assessing a 24
number of alternative scenarios (Table 3). Two reference scenarios based on fossil-based plastics 25
(PET and HDPE) were analysed first. The use of recycled (fossil-based) post-consumer plastic (PET) is 26
also explored (Scenario 3), assuming a 100% recycled content. Although different shares of recycled 27
material can be mixed with virgin material to be used as input to bottle production, this study 28
focuses on bottles relying entirely on recycled input as an extreme case. This allows assessing the 29
effects of a complete substitution of the virgin material. In the case of partially bio-based PET 30
(Scenario 4), fossil-based mono ethylene glycol (MEG), constituting nearly 30% of the polymer by 31
weight, is replaced with bio-based MEG derived from sugarcane-based ethanol sourced in Brazil. 32
Despite bio-based PET partially incorporates renewable bio-based material, it is not biodegradable, 33
as the final polymer has the same characteristics as fossil-based PET ("drop-in solution"). Conversely, 34
polylactic acid (PLA) bottles are aerobically biodegradable under controlled composting conditions, 35
and, to a lower extent, under specific anaerobic conditions typical of biogasification plants. The use 36
of PLA-based bottles is assessed in Scenario 5, considering corn grown in the United States as a 37
primary feedstock. Finally, a fully bio-based alternative to fossil-based PET is assessed in Scenario 6, 38
where (non-biodegradable) polyethylene furanoate (PEF) bottles are used. This polymer, which is 39
not available at the commercial scale yet, is seen as a promising bio-based replacement for fossil-40
based PET, but with potentially better mechanical and barrier properties. Compared to partially bio-41
based PET (where only fossil-based MEG is replaced with its bio-based counterpart), in the case of 42
1 Look@LCI
Comparative LCA of alternative feedstock for plastics production – DRAFT FOR STAKEHOLDER CONSULTATION Part II
13
PEF also fossil-based pufrified terephthalic acid is replaced with a bio-based alternative, i.e. 2,5 furan 1
dicarboxylic acid (FDCA). In this study, MEG is derived from Brazilian sugarcane-based ethanol (as for 2
partially bio-based PET), while FDCA is derived from starch-based sugars from maize harvested in the 3
US. Due to the relative early stage development level of the technology for FDCA production, only 4
laboratory-scale data were available to compile a LCI of the process. Therefore, the results obtained 5
in this assessment are not representative of real industrial production and should be interpreted by 6
keeping in mind that technologies with very different levels of maturity are compared, as expressed 7
by the Technology Readiness Level (TRL). 8
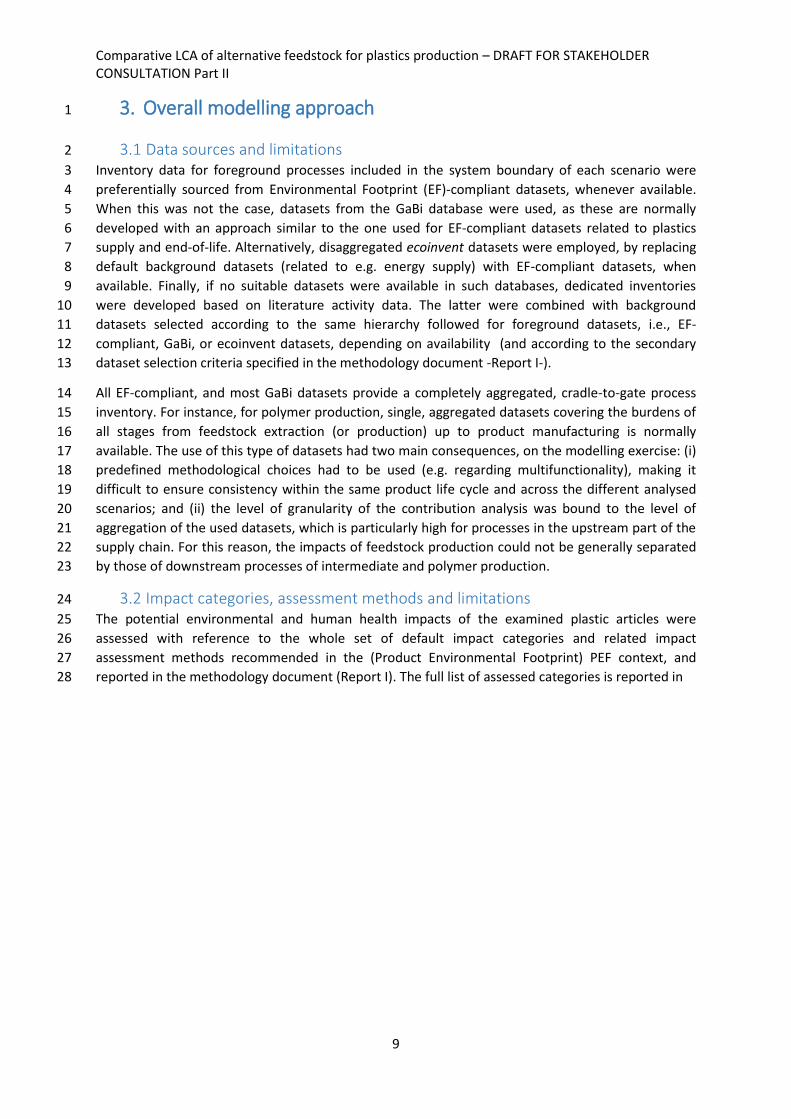
Table 3: LCA scenarios assessed for the beverage bottle screening case study 9
Scenario Polymer Monomer/Co-polymer
Feedstock EoL options(a)
1 - Conventional polymer 1 PET MEG(b) PTA(c)
Fossil-based (oil/natural gas)
Recycling Incineration Landfilling
2 - Conventional polymer 2 HDPE Ethylene Fossil-based (oil/natural gas)
Recycling Incineration Landfilling
3 - Alternative polymer 1 r-PET MEG(b) PTA(c)
Fossil-based (oil/natural gas)
Recycling Incineration Landfilling
4 - Alternative polymer 2 Bio-PET Bio-MEG(b) PTA(c)
Sugarcane (Brazil) Fossil-based
Recycling Incineration Landfilling
5 - Alternative polymer 3 PLA Lactic Acid Maize (USA) Recycling Composting (Industrial) Anaerobic digestion Incineration Landfilling
6 - Alternative polymer 4 PEF Bio-MEG(b) FDCA(d)
Sugarcane (Brazil) Maize (USA)
Recycling Incineration Landfilling
(a) The impacts of scenarios were individually assessed for each listed EoL option, as well as for a 10 combination of such options reflecting as far as possible the average situation at the EU level. 11
(b) MEG: mono ethylene glycol 12 (c) PTA: purified terephthalic acid 13 (d) FDCA: furan dicarboxylic acid 14
4.2 Functional Unit and reference flow 15
The main function of the studied article is beverage delivery from producers to final customers. The 16
functional unit of this case study was thus defined as “delivering 1000 litres of beverage by means of 17
0.5 litre bottles, ensuring a comparable shelf life of the packaged product”. The 0.5 litre size was 18
specifically chosen due to its higher potential of leakage into the environmental compared to larger 19
sizes. These are normally used for indoor consumption, where proper waste collection is more likely 20
to take place (at least at the EU level). 21
The reference flow of each scenario (i.e. the amount of bottle material required in order to fulfil the 22
functional unit), was calculated considering an average mass of PET bottles equal to 10 g (according 23
to PETRA, 2015). The same mass has been assumed also for R-PET, partially bio-based PET, and for 24
those bottle materials normally intended to be used as an alternative to PET (i.e. PEF and PLA). For 25
HDPE bottles, an average mass of 26.6 g was estimated, based on the values reported in Markwardt 26

Comparative LCA of alternative feedstock for plastics production – DRAFT FOR STAKEHOLDER CONSULTATION Part II
14
et al. (2017) for bottles of the same material but different sizes2. Table 4 summarises the reference 1
flow of bottle material in each scenario. 2
Table 4: Reference flow calculation for each beverage bottle LCA scenario 3
Material Bottle mass (g) Reference flow (kg/FU)
PET (fossil-based, recycled-based, bio-based)
10 20
HDPE 26.6 53
PLA 10 20
PEF 10 20
4
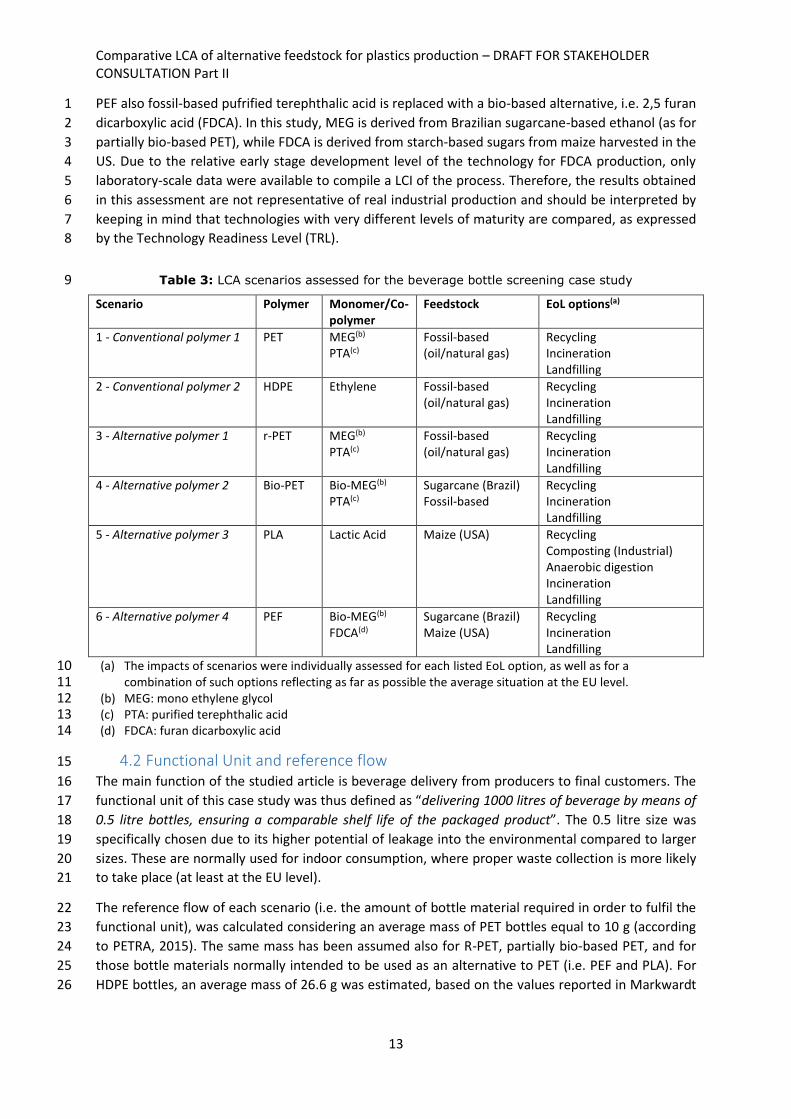
4.3 System Boundary 5
In all scenarios, the system boundary was set in order to cover the most relevant stages of the full 6
product life cycle (cradle-to-grave perspective), as better depicted in Figures 1 to 6. Relevant 7
transport activities between the different life cycle stages were considered in the study, as was the 8
indirect land use change of crops. In principle, to completely fulfil the functional of the study (i.e. 9
beverage delivery), additional packaging items would be required (e.g. caps, labels, secondary and 10
transport packaging). However, given the focus of the study on a specific article (i.e. bottles), these 11
additional items are excluded from the assessment. This omission has no effects on the outcome of 12
the comparison among the different scenarios, as it can be reasonably assumed that the same 13
additional packaging items are employed regardless of the material or feedstock used for bottle 14
manufacturing. The use stage is also excluded, as other than being the same for all the examined 15
product systems, it can be assumed to involve negligible burdens. Finally, it has to be noted that 16
additives were not included in the assessment, due to lack of (consistent) data and information on 17
the use of additives for the examined plastic materials, and for plastics in general. This is 18
acknowledged as a limitation of this screening study, as additive production can account for a non-19
negligible portion of climate impact (up to 45%, see section 2.3.2.10 in Report I). Moreover, 20
additives can also be relevant at the end-of-life stage, where they can be released, as such or after 21
degradation/conversion into different compound(s), in the environment (i.e. the soil in case of 22
biodegradable plastics routed to biological treatments or subject to in-situ degradation). 23
24
2 A linear regression on four data points was performed, and the resulting relationship was used to estimate the mass of 0.5 litre HDPE bottles. The following size-mass data pairs were considered: 350 ml-22.51 g; 380 ml-22.07 g; 900 ml-37.87 g; 1000 ml-44.73 g
Comparative LCA of alternative feedstock for plastics production – DRAFT FOR STAKEHOLDER CONSULTATION Part II
15
1
Oil extraction & refining
Production of PTA and
MEGEnergy
Energy production
Waste
Recycling
Incineration
Landfilling EnergyEnergy
production
Production of PET
Production of bottles
PET Resource extraction
Resource extraction
Recycled Material*
ProductionResource extraction
Consumer
2
Figure 1: System boundary for fossil-based PET beverage bottles (Scenario 1). (*) Handled according to the Circular Footprint Formula 3
4
Oil extraction & refining
Production of Ethylene Energy
Energy production
Waste
Recycling
Incineration
Landfilling EnergyEnergy
production
Production of HDPE
Production of bottles
HDPE Resource extraction
Resource extraction
Recycled Material*
ProductionResource extraction
Consumer
5
Figure 2: System boundary for fossil-based HDPE beverage bottles (Scenario 2). (*) Handled according to the Circular Footprint Formula 6

Comparative LCA of alternative feedstock for plastics production – DRAFT FOR STAKEHOLDER CONSULTATION Part II
16
Production of bottles Energy
Energy production
Waste PET*
Recycling
Incineration
Landfilling EnergyEnergy
production
Waste Resource extraction
Resource extraction
Recycled Material*
ProductionResource extraction
Recycling + SSP **
rPETConsumer
1
Figure 3: System boundary for recycled fossil-based PET beverage bottles (Scenario 3). (*) Modelled according to the Circular Footprint Formula, (**) 2 Solid-state polycondensation 3
4
iLUC
Production of MEG
Sugarcane cultivation
EnergyEnergy
production
Waste
Recycling
Incineration
Landfilling EnergyEnergy
production
Production of Bio-based
PET
Production of bottles
PET Resource extraction
Resource extraction
Recycled Material*
ProductionResource extraction
Consumer
Production of PTA
Oil extraction &
refining 5
Figure 4: System boundary for partially bio-based PET beverage bottles (Scenario 4). (*) Handled according to the Circular Footprint Formula 6
Comparative LCA of alternative feedstock for plastics production – DRAFT FOR STAKEHOLDER CONSULTATION Part II
17
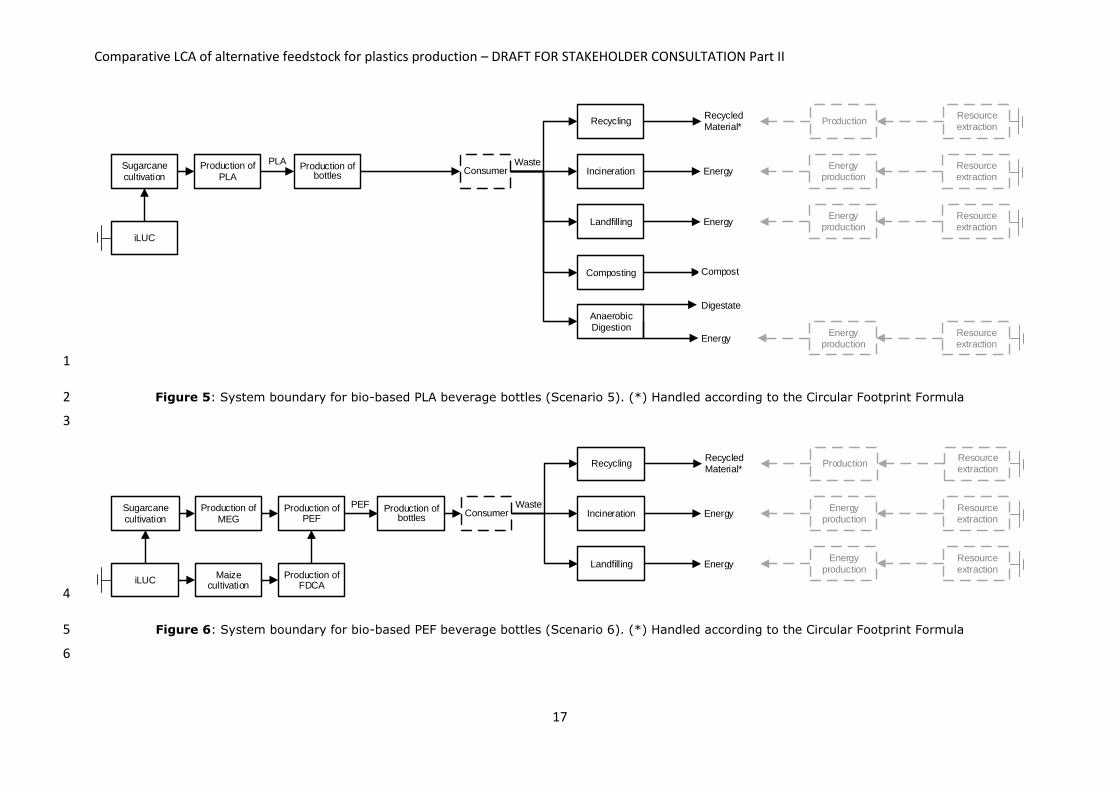
iLUC
Production of PLA
Sugarcane cultivation
EnergyEnergy
production
Waste
Recycling
Incineration
Landfilling EnergyEnergy
production
Production of bottles
Resource extraction
Resource extraction
Recycled Material*
ProductionResource extraction
Consumer
Composting
Anaerobic Digestion
Energy production
EnergyResource extraction
PLA
Compost
Digestate
1
Figure 5: System boundary for bio-based PLA beverage bottles (Scenario 5). (*) Handled according to the Circular Footprint Formula 2
3
iLUC
Production of MEG
Sugarcane cultivation
EnergyEnergy
production
Waste
Recycling
Incineration
Landfilling EnergyEnergy
production
Production of PEF
Production of bottles
PEF Resource extraction
Resource extraction
Recycled Material*
ProductionResource extraction
Consumer
Production of FDCA
Maize cultivation
4
Figure 6: System boundary for bio-based PEF beverage bottles (Scenario 6). (*) Handled according to the Circular Footprint Formula 5
6
Comparative LCA of alternative feedstock for plastics production – DRAFT FOR STAKEHOLDER CONSULTATION Part II
18
4.4 Life Cycle Inventory 1
This section describes the overall approach for building the LCI of the analysed scenarios, along with 2
related assumptions and data sources. The description is separated by major lifecycle stages. The list 3
of processes and related data sources are provided in Tables 5 to 10. 4
5
Comparative LCA of alternative feedstock for plastics production – DRAFT FOR STAKEHOLDER CONSULTATION Part II
19
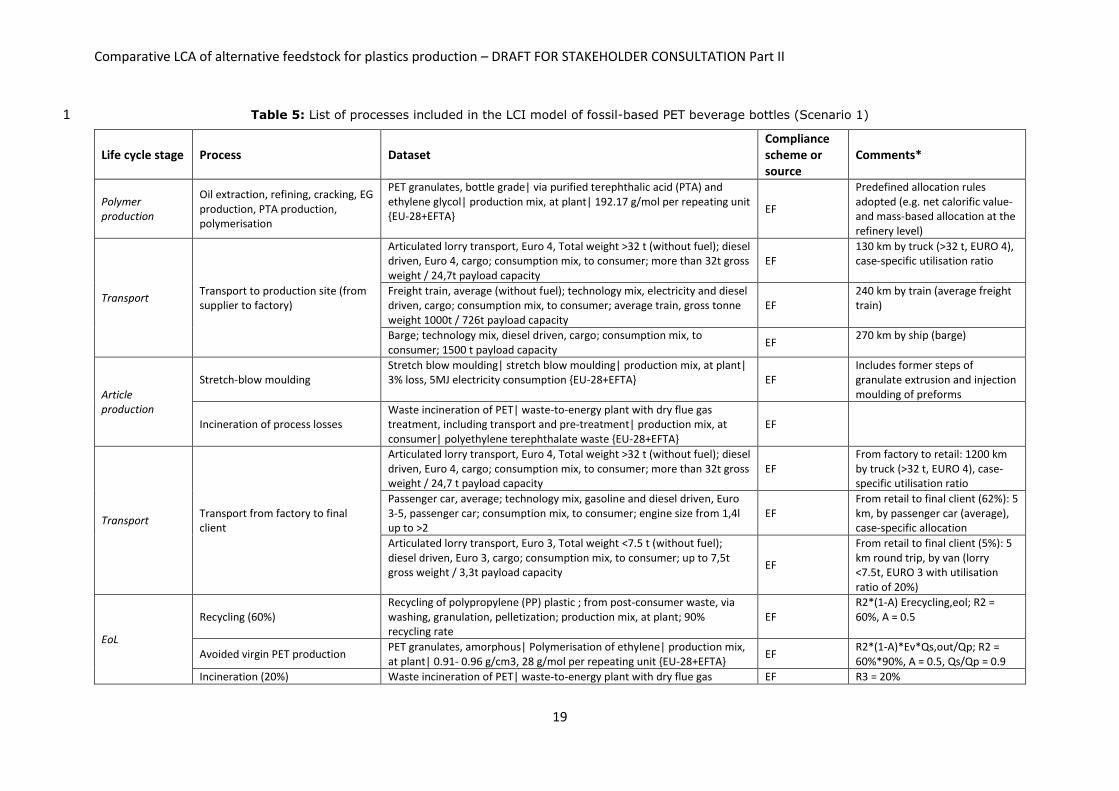
Table 5: List of processes included in the LCI model of fossil-based PET beverage bottles (Scenario 1) 1
Life cycle stage Process Dataset Compliance scheme or source
Comments*
Polymer production
Oil extraction, refining, cracking, EG production, PTA production, polymerisation
PET granulates, bottle grade| via purified terephthalic acid (PTA) and ethylene glycol| production mix, at plant| 192.17 g/mol per repeating unit {EU-28+EFTA}
EF
Predefined allocation rules adopted (e.g. net calorific value- and mass-based allocation at the refinery level)
Transport Transport to production site (from supplier to factory)
Articulated lorry transport, Euro 4, Total weight >32 t (without fuel); diesel driven, Euro 4, cargo; consumption mix, to consumer; more than 32t gross weight / 24,7t payload capacity
EF 130 km by truck (>32 t, EURO 4), case-specific utilisation ratio
Freight train, average (without fuel); technology mix, electricity and diesel driven, cargo; consumption mix, to consumer; average train, gross tonne weight 1000t / 726t payload capacity
EF 240 km by train (average freight train)
Barge; technology mix, diesel driven, cargo; consumption mix, to consumer; 1500 t payload capacity
EF 270 km by ship (barge)
Article production
Stretch-blow moulding Stretch blow moulding| stretch blow moulding| production mix, at plant| 3% loss, 5MJ electricity consumption {EU-28+EFTA} EF
Includes former steps of granulate extrusion and injection moulding of preforms
Incineration of process losses Waste incineration of PET| waste-to-energy plant with dry flue gas treatment, including transport and pre-treatment| production mix, at consumer| polyethylene terephthalate waste {EU-28+EFTA}
EF
Transport Transport from factory to final client
Articulated lorry transport, Euro 4, Total weight >32 t (without fuel); diesel driven, Euro 4, cargo; consumption mix, to consumer; more than 32t gross weight / 24,7 t payload capacity
EF From factory to retail: 1200 km by truck (>32 t, EURO 4), case-specific utilisation ratio
Passenger car, average; technology mix, gasoline and diesel driven, Euro 3-5, passenger car; consumption mix, to consumer; engine size from 1,4l up to >2
EF From retail to final client (62%): 5 km, by passenger car (average), case-specific allocation
Articulated lorry transport, Euro 3, Total weight <7.5 t (without fuel); diesel driven, Euro 3, cargo; consumption mix, to consumer; up to 7,5t gross weight / 3,3t payload capacity
EF
From retail to final client (5%): 5 km round trip, by van (lorry <7.5t, EURO 3 with utilisation ratio of 20%)
EoL
Recycling (60%) Recycling of polypropylene (PP) plastic ; from post-consumer waste, via washing, granulation, pelletization; production mix, at plant; 90% recycling rate
EF R2*(1-A) Erecycling,eol; R2 = 60%, A = 0.5
Avoided virgin PET production PET granulates, amorphous| Polymerisation of ethylene| production mix, at plant| 0.91- 0.96 g/cm3, 28 g/mol per repeating unit {EU-28+EFTA}
EF R2*(1-A)*Ev*Qs,out/Qp; R2 = 60%*90%, A = 0.5, Qs/Qp = 0.9
Incineration (20%) Waste incineration of PET| waste-to-energy plant with dry flue gas EF R3 = 20%

Comparative LCA of alternative feedstock for plastics production – DRAFT FOR STAKEHOLDER CONSULTATION Part II
20
treatment, including transport and pre-treatment| production mix, at consumer| polyethylene terephthalate waste {EU-28+EFTA}
Landfill (20%) Landfill of plastic waste| landfill including leachate treatment and with transport without collection and pre-treatment| production mix (region specific sites), at landfill site {EU-28+EFTA}
EF (1-R2-R3) = 20%
(*) The meaning of the parameters of the Circular Footprint Formula reported for EoL options (R1, R2, R3, A, Qs/Qp) are explained in section 5.5.8.11 of Report I. 1
2

Comparative LCA of alternative feedstock for plastics production – DRAFT FOR STAKEHOLDER CONSULTATION Part II
21
Table 6: List of processes included in the LCI model of fossil-based HDPE beverage bottles (Scenario 2) 1
Life cycle stage
Process Dataset Compliance scheme or source
Comments*
Polymer production
Oil extraction, refining, cracking, EG production, PTA production, polymerisation
HDPE granulates| Polymerisation of ethylene| production mix, at plant| 0.91- 0.9
EF Account for 0.1% losses at the production stage
Transport Transport to production site (from supplier to factory)
Articulated lorry transport, Euro 4, Total weight >32 t (without fuel); diesel driven, Euro 4, cargo; consumption mix, to consumer; more than 32t gross weight / 24,7t payload capacity
EF
130 km by truck (>32 t, EURO 4; UUID 938d5ba6-17e4-4f0d-bef0-481608681f57), case-specific utilisation ratio
Freight train, average (without fuel); technology mix, electricity and diesel driven, cargo; consumption mix, to consumer; average train, gross tonne weight 1000t / 726t payload capacity
EF 240 km by train (average freight train; UUID 02e87631-6d70-48ce-affd-1975dc36f5be)
Barge; technology mix, diesel driven, cargo; consumption mix, to consumer; 1500 t payload capacity
EF 270 km by ship (barge; UUID 4cfacea0-cce4-4b4d-bd2b-223c8d4c90ae)
Article production
Stretch blow moulding Blow moulding| blow moulding| production mix, at plant| PET, HDPE and PP {EU-28+EFTA} [LCI result]
EF
Incineration of loss from injection moulding
Waste incineration of PET| waste-to-energy plant with dry flue gas treatment, including transport and pre-treatment| production mix, at consumer| polyethylene terephthalate waste {EU-28+EFTA} [LCI result]
EF
Transport Transport from factory to final client
Articulated lorry transport, Euro 4, Total weight >32 t (without fuel); diesel driven, Euro 4, cargo; consumption mix, to consumer; more than 32t gross weight / 24,7 t payload capacity
EF
From factory to retail local supply chain: 1'200 km by truck (>32 t, EURO 4; UUID 938d5ba6-17e4-4f0d-bef0-481608681f57), case-specific utilisation ratio
Passenger car, average; technology mix, gasoline and diesel driven, Euro 3-5, passenger car; consumption mix, to consumer; engine size from 1,4l up to >2
EF
From retail to final client (62% car) 62%: 5 km, by passenger car (average; UUID 1ead35dd-fc71-4b0c-9410-7e39da95c7dc), case-specific allocation
Articulated lorry transport, Euro 3, Total weight <7.5 t (without fuel); diesel driven, Euro 3, cargo; consumption mix, to consumer; up to 7,5t gross weight / 3,3t payload capacity
EF
From retail to final client (5% delivery van) 5%: 5 km round trip, by van (lorry <7.5t, EURO 3 with utilisation ratio of 20%; UUID aea613ae-573b-443a-aba2-6a69900ca2ff)

Comparative LCA of alternative feedstock for plastics production – DRAFT FOR STAKEHOLDER CONSULTATION Part II
22
EoL
Recycling (60%) Recycling of polypropylene (PP) plastic; from post-consumer waste, via washing, granulation, pelletization; production mix, at plant; 90% recycling rate
EF R2*(1-A) Erecycling,eol; R2 = 60%, A = 0.5 (Value to recall the dataset)
Avoided virgin HDPE production HDPE granulates| Polymerisation of ethylene| production mix, at plant| 0.91- 0.9
EF
R2*(1-A)*Ev*Qs/Qp; R2 = 60%*90%, A = 0.5, Qs/Qp = 0.9 Assuming moreover 90% efficiency according to the dataset
Incineration (20%)
Waste incineration of PET| waste-to-energy plant with dry flue gas treatment, including transport and pre-treatment| production mix, at consumer| polyethylene terephthalate waste {EU-28+EFTA} [LCI result]
EF R3 = 20%
Landfill (20%) Landfill of plastic waste| landfill including leachate treatment and with transport without collection and pre-treatment| production mix (region specific sites), at landfill site {EU-28+EFTA} [LCI result]
EF (1-R2-R3) = 20%
(*) The meaning of the parameters of the Circular Footprint Formula reported for EoL options (R1, R2, R3, A, Qs/Qp) are explained in section 5.5.8.11 of Report I. 1
2
3
Comparative LCA of alternative feedstock for plastics production – DRAFT FOR STAKEHOLDER CONSULTATION Part II
23
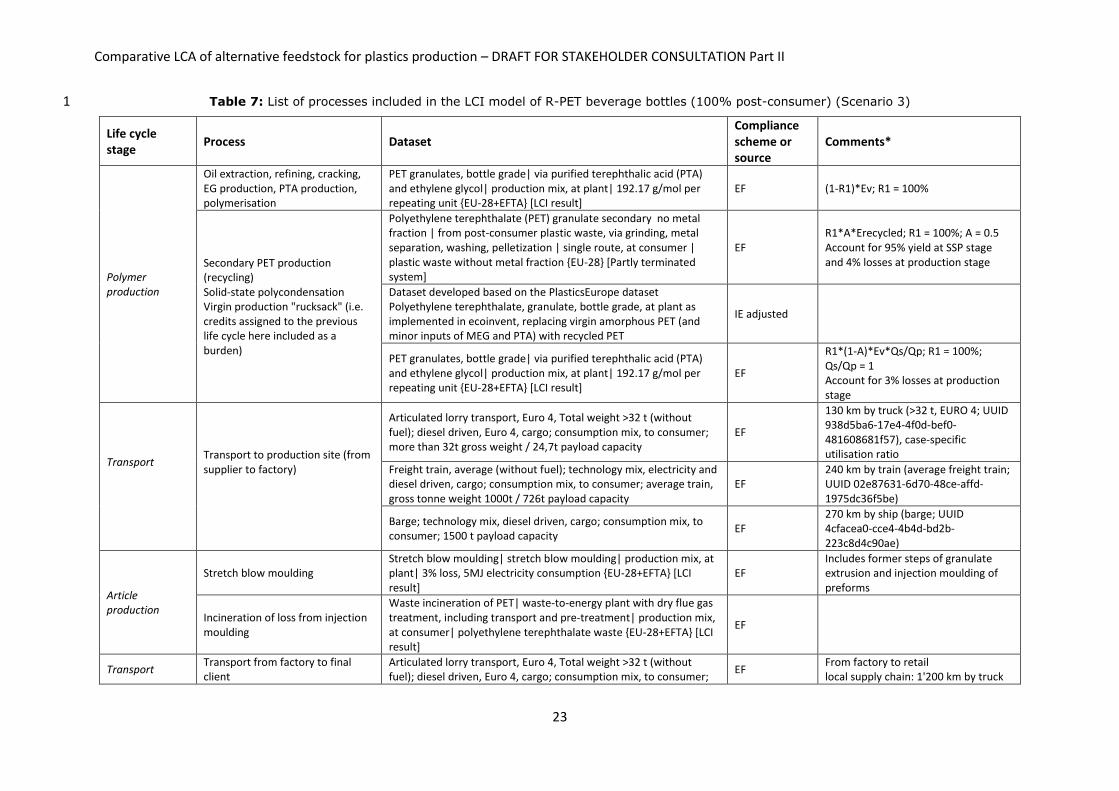
Table 7: List of processes included in the LCI model of R-PET beverage bottles (100% post-consumer) (Scenario 3) 1
Life cycle stage
Process Dataset Compliance scheme or source
Comments*
Polymer production
Oil extraction, refining, cracking, EG production, PTA production, polymerisation
PET granulates, bottle grade| via purified terephthalic acid (PTA) and ethylene glycol| production mix, at plant| 192.17 g/mol per repeating unit {EU-28+EFTA} [LCI result]
EF (1-R1)*Ev; R1 = 100%
Secondary PET production (recycling) Solid-state polycondensation Virgin production "rucksack" (i.e. credits assigned to the previous life cycle here included as a burden)
Polyethylene terephthalate (PET) granulate secondary no metal fraction | from post-consumer plastic waste, via grinding, metal separation, washing, pelletization | single route, at consumer | plastic waste without metal fraction {EU-28} [Partly terminated system]
EF R1*A*Erecycled; R1 = 100%; A = 0.5 Account for 95% yield at SSP stage and 4% losses at production stage
Dataset developed based on the PlasticsEurope dataset Polyethylene terephthalate, granulate, bottle grade, at plant as implemented in ecoinvent, replacing virgin amorphous PET (and minor inputs of MEG and PTA) with recycled PET
IE adjusted
PET granulates, bottle grade| via purified terephthalic acid (PTA) and ethylene glycol| production mix, at plant| 192.17 g/mol per repeating unit {EU-28+EFTA} [LCI result]
EF
R1*(1-A)*Ev*Qs/Qp; R1 = 100%; Qs/Qp = 1 Account for 3% losses at production stage
Transport
Transport to production site (from supplier to factory)
Articulated lorry transport, Euro 4, Total weight >32 t (without fuel); diesel driven, Euro 4, cargo; consumption mix, to consumer; more than 32t gross weight / 24,7t payload capacity
EF
130 km by truck (>32 t, EURO 4; UUID 938d5ba6-17e4-4f0d-bef0-481608681f57), case-specific utilisation ratio
Freight train, average (without fuel); technology mix, electricity and diesel driven, cargo; consumption mix, to consumer; average train, gross tonne weight 1000t / 726t payload capacity
EF 240 km by train (average freight train; UUID 02e87631-6d70-48ce-affd-1975dc36f5be)
Barge; technology mix, diesel driven, cargo; consumption mix, to consumer; 1500 t payload capacity
EF 270 km by ship (barge; UUID 4cfacea0-cce4-4b4d-bd2b-223c8d4c90ae)
Article production
Stretch blow moulding Stretch blow moulding| stretch blow moulding| production mix, at plant| 3% loss, 5MJ electricity consumption {EU-28+EFTA} [LCI result]
EF Includes former steps of granulate extrusion and injection moulding of preforms
Incineration of loss from injection moulding
Waste incineration of PET| waste-to-energy plant with dry flue gas treatment, including transport and pre-treatment| production mix, at consumer| polyethylene terephthalate waste {EU-28+EFTA} [LCI result]
EF
Transport Transport from factory to final client
Articulated lorry transport, Euro 4, Total weight >32 t (without fuel); diesel driven, Euro 4, cargo; consumption mix, to consumer;
EF From factory to retail local supply chain: 1'200 km by truck

Comparative LCA of alternative feedstock for plastics production – DRAFT FOR STAKEHOLDER CONSULTATION Part II
24
more than 32t gross weight / 24,7 t payload capacity (>32 t, EURO 4; UUID 938d5ba6-17e4-4f0d-bef0-481608681f57), case-specific utilisation ratio
Passenger car, average; technology mix, gasoline and diesel driven, Euro 3-5, passenger car; consumption mix, to consumer; engine size from 1,4l up to >2
EF
From retail to final client (62% car) 62%: 5 km, by passenger car (average; UUID 1ead35dd-fc71-4b0c-9410-7e39da95c7dc), case-specific allocation
Articulated lorry transport, Euro 3, Total weight <7.5 t (without fuel); diesel driven, Euro 3, cargo; consumption mix, to consumer; up to 7,5t gross weight / 3,3t payload capacity
EF
From retail to final client (5% delivery van) 5%: 5 km round trip, by van (lorry <7.5t, EURO 3 with utilisation ratio of 20%; UUID aea613ae-573b-443a-aba2-6a69900ca2ff)
EoL
Recycling (60%) Recycling of polypropylene (PP) plastic ; from post-consumer waste, via washing, granulation, pelletization; production mix, at plant; 90% recycling rate
EF
R2*(1-A) Erecycling,eol; R2 = 60%, A = 0.5 (Value to recall the dataset) We assume the same recycling rate as the baseline (even if in plrinciple it should decrease)
Avoided virgin PET production PET granulates, amorphous| Polymerisation of ethylene| production mix, at plant| 0.91- 0.96 g/cm3, 28 g/mol per repeating unit {EU-28+EFTA} [LCI result]
EF
R2*(1-A)*Ev*Qs/Qp; R2 = 60%*90%, A = 0.5, Qs/Qp = 0.9 Assuming moreover 90% efficiency according to the dataset
Incineration (20%)
Waste incineration of PET| waste-to-energy plant with dry flue gas treatment, including transport and pre-treatment| production mix, at consumer| polyethylene terephthalate waste {EU-28+EFTA} [LCI result]
EF R3 = 20%
Landfill (20%) Landfill of plastic waste| landfill including leachate treatment and with transport without collection and pre-treatment| production mix (region specific sites), at landfill site {EU-28+EFTA} [LCI result]
EF (1-R2-R3) = 20%
(*) The meaning of the parameters of the Circular Footprint Formula reported for EoL options (R1, R2, R3, A, Qs/Qp) are explained in section 5.5.8.11 of Report I. 1
2
3
Comparative LCA of alternative feedstock for plastics production – DRAFT FOR STAKEHOLDER CONSULTATION Part II
25
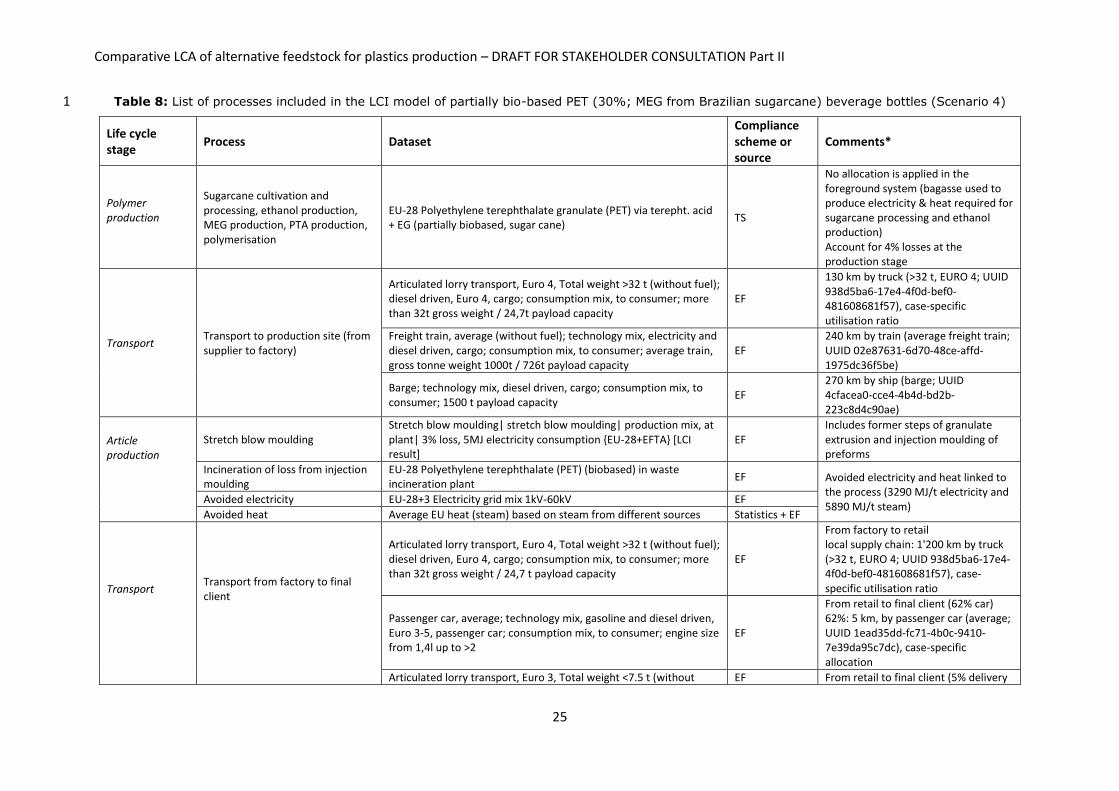
Table 8: List of processes included in the LCI model of partially bio-based PET (30%; MEG from Brazilian sugarcane) beverage bottles (Scenario 4) 1
Life cycle stage
Process Dataset Compliance scheme or source
Comments*
Polymer production
Sugarcane cultivation and processing, ethanol production, MEG production, PTA production, polymerisation
EU-28 Polyethylene terephthalate granulate (PET) via terepht. acid + EG (partially biobased, sugar cane)
TS
No allocation is applied in the foreground system (bagasse used to produce electricity & heat required for sugarcane processing and ethanol production) Account for 4% losses at the production stage
Transport Transport to production site (from supplier to factory)
Articulated lorry transport, Euro 4, Total weight >32 t (without fuel); diesel driven, Euro 4, cargo; consumption mix, to consumer; more than 32t gross weight / 24,7t payload capacity
EF
130 km by truck (>32 t, EURO 4; UUID 938d5ba6-17e4-4f0d-bef0-481608681f57), case-specific utilisation ratio
Freight train, average (without fuel); technology mix, electricity and diesel driven, cargo; consumption mix, to consumer; average train, gross tonne weight 1000t / 726t payload capacity
EF 240 km by train (average freight train; UUID 02e87631-6d70-48ce-affd-1975dc36f5be)
Barge; technology mix, diesel driven, cargo; consumption mix, to consumer; 1500 t payload capacity
EF 270 km by ship (barge; UUID 4cfacea0-cce4-4b4d-bd2b-223c8d4c90ae)
Article production
Stretch blow moulding Stretch blow moulding| stretch blow moulding| production mix, at plant| 3% loss, 5MJ electricity consumption {EU-28+EFTA} [LCI result]
EF Includes former steps of granulate extrusion and injection moulding of preforms
Incineration of loss from injection moulding
EU-28 Polyethylene terephthalate (PET) (biobased) in waste incineration plant
EF Avoided electricity and heat linked to the process (3290 MJ/t electricity and 5890 MJ/t steam)
Avoided electricity EU-28+3 Electricity grid mix 1kV-60kV EF
Avoided heat Average EU heat (steam) based on steam from different sources Statistics + EF
Transport
Transport from factory to final client
Articulated lorry transport, Euro 4, Total weight >32 t (without fuel); diesel driven, Euro 4, cargo; consumption mix, to consumer; more than 32t gross weight / 24,7 t payload capacity
EF
From factory to retail local supply chain: 1'200 km by truck (>32 t, EURO 4; UUID 938d5ba6-17e4-4f0d-bef0-481608681f57), case-specific utilisation ratio
Passenger car, average; technology mix, gasoline and diesel driven, Euro 3-5, passenger car; consumption mix, to consumer; engine size from 1,4l up to >2
EF
From retail to final client (62% car) 62%: 5 km, by passenger car (average; UUID 1ead35dd-fc71-4b0c-9410-7e39da95c7dc), case-specific allocation
Articulated lorry transport, Euro 3, Total weight <7.5 t (without EF From retail to final client (5% delivery

Comparative LCA of alternative feedstock for plastics production – DRAFT FOR STAKEHOLDER CONSULTATION Part II
26
fuel); diesel driven, Euro 3, cargo; consumption mix, to consumer; up to 7,5t gross weight / 3,3t payload capacity
van) 5%: 5 km round trip, by van (lorry <7.5t, EURO 3 with utilisation ratio of 20%6; UUID aea613ae-573b-443a-aba2-6a69900ca2ff)
EoL
Recycling (60%) Recycling of polypropylene (PP) plastic; from post-consumer waste, via washing, granulation, pelletization; production mix, at plant; 90% recycling rate
EF R2*(1-A) Erecycling,eol; R2 = 60%, A = 0.5 (Value to recall the dataset)
Avoided virgin PET production PET granulates, amorphous| Polymerisation of ethylene| production mix, at plant| 0.91- 0.96 g/cm3, 28 g/mol per repeating unit {EU-28+EFTA} [LCI result]
EF
R2*(1-A)*Ev*Qs/Qp; R2 = 60%*90%, A = 0.5, Qs/Qp = 0.9 Assuming moreover 90% efficiency according to the dataset
Incineration (20%) EU-28 Polyethylene terephthalate (PET) (biobased) in waste incineration plant
TS R3 = 20%
Avoided electricity EU-28+3 Electricity grid mix 1kV-60kV EF
Avoided heat Average EU heat (steam) based on steam from different sources Statistics + EF
Landfill (20%) Landfill of plastic waste| landfill including leachate treatment and with transport without collection and pre-treatment| production mix (region specific sites), at landfill site {EU-28+EFTA} [LCI result]
EF
(1-R2-R3) = 20% Fossil CO2 emission set as zero, added as biogenic CO2 emission
(*) The meaning of the parameters of the Circular Footprint Formula reported for EoL options (R1, R2, R3, A, Qs/Qp) are explained in section 5.5.8.11 of Report I. 1
2
3
Comparative LCA of alternative feedstock for plastics production – DRAFT FOR STAKEHOLDER CONSULTATION Part II
27
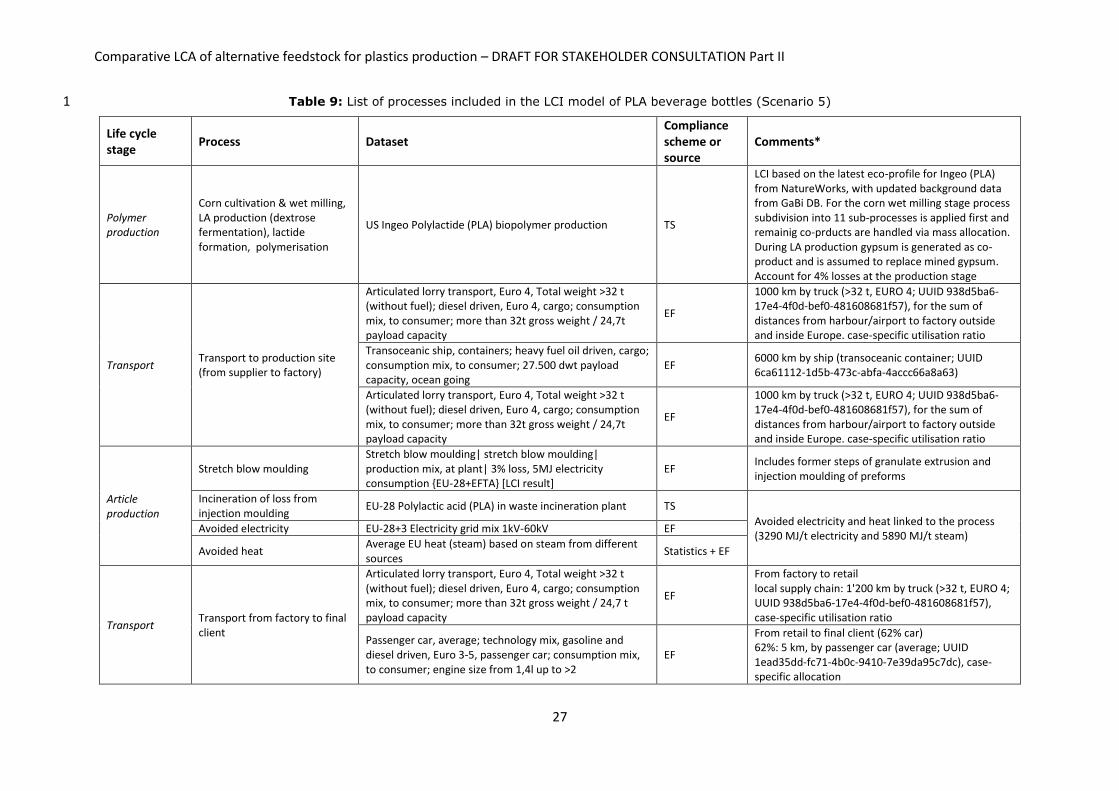
Table 9: List of processes included in the LCI model of PLA beverage bottles (Scenario 5) 1
Life cycle stage
Process Dataset Compliance scheme or source
Comments*
Polymer production
Corn cultivation & wet milling, LA production (dextrose fermentation), lactide formation, polymerisation
US Ingeo Polylactide (PLA) biopolymer production TS
LCI based on the latest eco-profile for Ingeo (PLA) from NatureWorks, with updated background data from GaBi DB. For the corn wet milling stage process subdivision into 11 sub-processes is applied first and remainig co-prducts are handled via mass allocation. During LA production gypsum is generated as co-product and is assumed to replace mined gypsum. Account for 4% losses at the production stage
Transport Transport to production site (from supplier to factory)
Articulated lorry transport, Euro 4, Total weight >32 t (without fuel); diesel driven, Euro 4, cargo; consumption mix, to consumer; more than 32t gross weight / 24,7t payload capacity
EF
1000 km by truck (>32 t, EURO 4; UUID 938d5ba6-17e4-4f0d-bef0-481608681f57), for the sum of distances from harbour/airport to factory outside and inside Europe. case-specific utilisation ratio
Transoceanic ship, containers; heavy fuel oil driven, cargo; consumption mix, to consumer; 27.500 dwt payload capacity, ocean going
EF 6000 km by ship (transoceanic container; UUID 6ca61112-1d5b-473c-abfa-4accc66a8a63)
Articulated lorry transport, Euro 4, Total weight >32 t (without fuel); diesel driven, Euro 4, cargo; consumption mix, to consumer; more than 32t gross weight / 24,7t payload capacity
EF
1000 km by truck (>32 t, EURO 4; UUID 938d5ba6-17e4-4f0d-bef0-481608681f57), for the sum of distances from harbour/airport to factory outside and inside Europe. case-specific utilisation ratio
Article production
Stretch blow moulding Stretch blow moulding| stretch blow moulding| production mix, at plant| 3% loss, 5MJ electricity consumption {EU-28+EFTA} [LCI result]
EF Includes former steps of granulate extrusion and injection moulding of preforms
Incineration of loss from injection moulding
EU-28 Polylactic acid (PLA) in waste incineration plant TS
Avoided electricity and heat linked to the process (3290 MJ/t electricity and 5890 MJ/t steam)
Avoided electricity EU-28+3 Electricity grid mix 1kV-60kV EF
Avoided heat Average EU heat (steam) based on steam from different sources
Statistics + EF
Transport Transport from factory to final client
Articulated lorry transport, Euro 4, Total weight >32 t (without fuel); diesel driven, Euro 4, cargo; consumption mix, to consumer; more than 32t gross weight / 24,7 t payload capacity
EF
From factory to retail local supply chain: 1'200 km by truck (>32 t, EURO 4; UUID 938d5ba6-17e4-4f0d-bef0-481608681f57), case-specific utilisation ratio
Passenger car, average; technology mix, gasoline and diesel driven, Euro 3-5, passenger car; consumption mix, to consumer; engine size from 1,4l up to >2
EF
From retail to final client (62% car) 62%: 5 km, by passenger car (average; UUID 1ead35dd-fc71-4b0c-9410-7e39da95c7dc), case-specific allocation
Comparative LCA of alternative feedstock for plastics production – DRAFT FOR STAKEHOLDER CONSULTATION Part II
28
Articulated lorry transport, Euro 3, Total weight <7.5 t (without fuel); diesel driven, Euro 3, cargo; consumption mix, to consumer; up to 7,5t gross weight / 3,3t payload capacity
EF
From retail to final client (5% delivery van) 5%: 5 km round trip, by van (lorry <7.5t, EURO 3 with utilisation ratio of 20%6; UUID aea613ae-573b-443a-aba2-6a69900ca2ff)
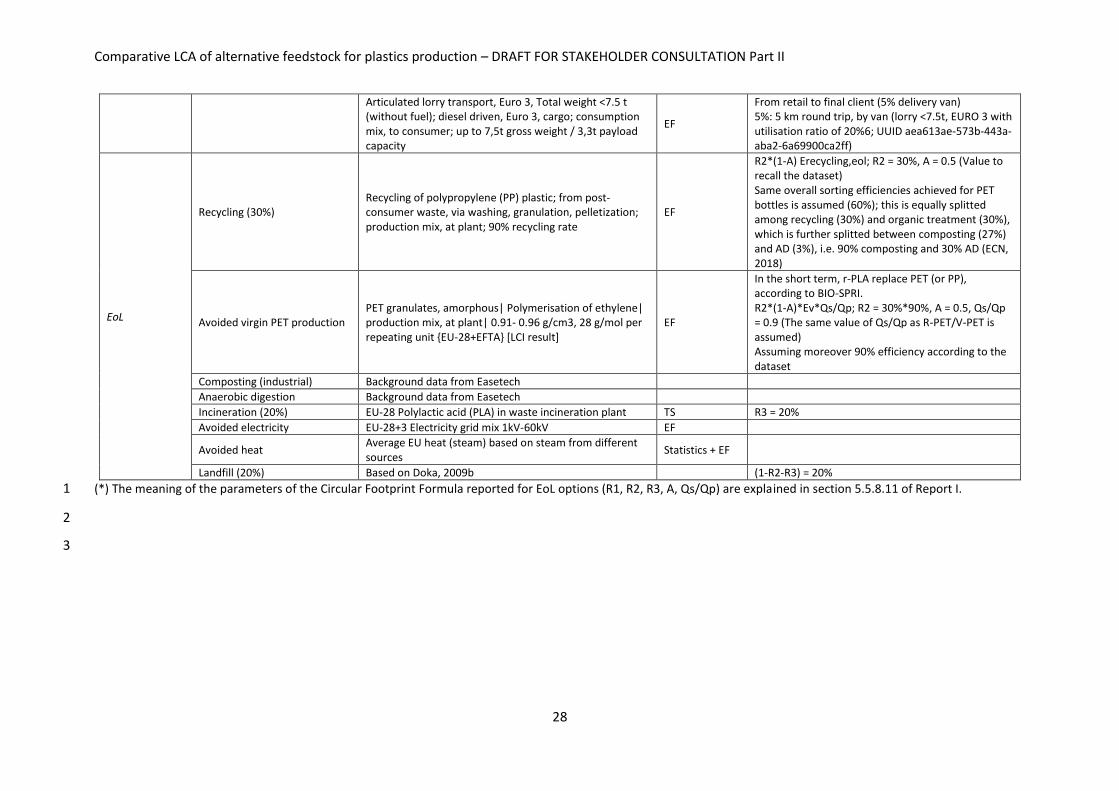
EoL
Recycling (30%) Recycling of polypropylene (PP) plastic; from post-consumer waste, via washing, granulation, pelletization; production mix, at plant; 90% recycling rate
EF
R2*(1-A) Erecycling,eol; R2 = 30%, A = 0.5 (Value to recall the dataset) Same overall sorting efficiencies achieved for PET bottles is assumed (60%); this is equally splitted among recycling (30%) and organic treatment (30%), which is further splitted between composting (27%) and AD (3%), i.e. 90% composting and 30% AD (ECN, 2018)
Avoided virgin PET production PET granulates, amorphous| Polymerisation of ethylene| production mix, at plant| 0.91- 0.96 g/cm3, 28 g/mol per repeating unit {EU-28+EFTA} [LCI result]
EF
In the short term, r-PLA replace PET (or PP), according to BIO-SPRI. R2*(1-A)*Ev*Qs/Qp; R2 = 30%*90%, A = 0.5, Qs/Qp = 0.9 (The same value of Qs/Qp as R-PET/V-PET is assumed) Assuming moreover 90% efficiency according to the dataset
Composting (industrial) Background data from Easetech
Anaerobic digestion Background data from Easetech
Incineration (20%) EU-28 Polylactic acid (PLA) in waste incineration plant TS R3 = 20%
Avoided electricity EU-28+3 Electricity grid mix 1kV-60kV EF
Avoided heat Average EU heat (steam) based on steam from different sources
Statistics + EF
Landfill (20%) Based on Doka, 2009b (1-R2-R3) = 20%
(*) The meaning of the parameters of the Circular Footprint Formula reported for EoL options (R1, R2, R3, A, Qs/Qp) are explained in section 5.5.8.11 of Report I. 1
2
3
Comparative LCA of alternative feedstock for plastics production – DRAFT FOR STAKEHOLDER CONSULTATION Part II
29
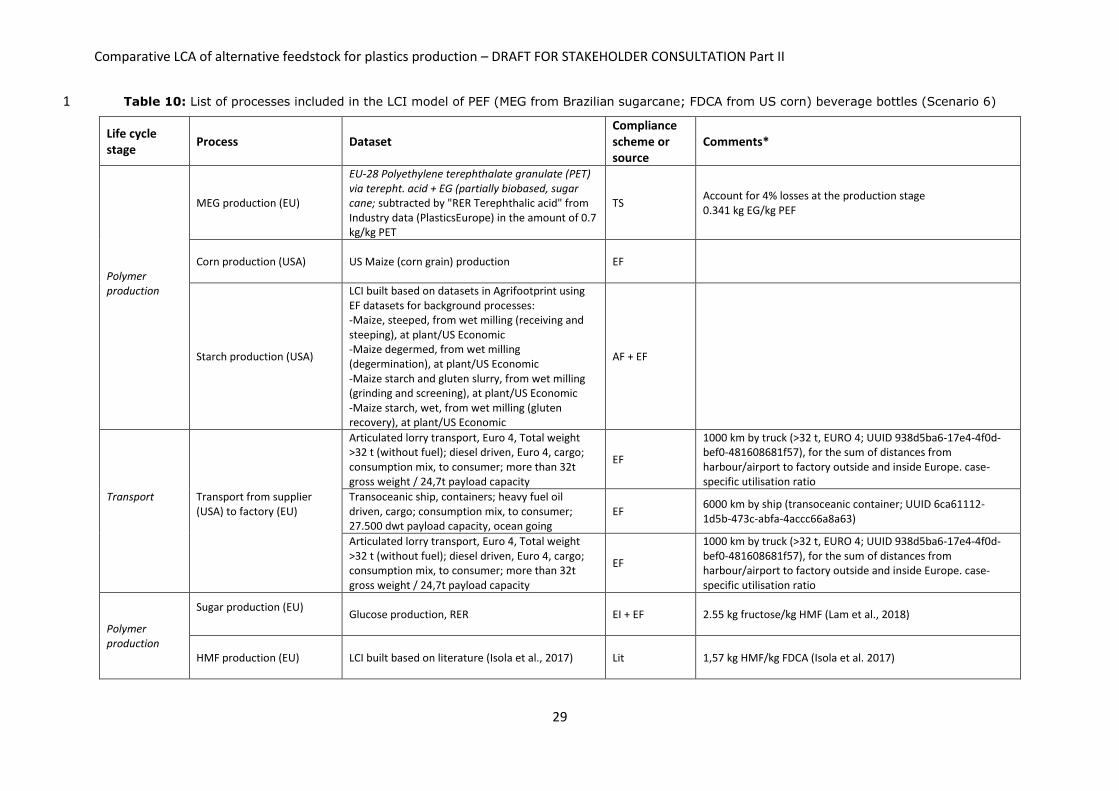
Table 10: List of processes included in the LCI model of PEF (MEG from Brazilian sugarcane; FDCA from US corn) beverage bottles (Scenario 6) 1
Life cycle stage
Process Dataset Compliance scheme or source
Comments*
Polymer production
MEG production (EU)
EU-28 Polyethylene terephthalate granulate (PET) via terepht. acid + EG (partially biobased, sugar cane; subtracted by "RER Terephthalic acid" from Industry data (PlasticsEurope) in the amount of 0.7 kg/kg PET
TS Account for 4% losses at the production stage 0.341 kg EG/kg PEF
Corn production (USA) US Maize (corn grain) production EF
Starch production (USA)
LCI built based on datasets in Agrifootprint using EF datasets for background processes: -Maize, steeped, from wet milling (receiving and steeping), at plant/US Economic -Maize degermed, from wet milling (degermination), at plant/US Economic -Maize starch and gluten slurry, from wet milling (grinding and screening), at plant/US Economic -Maize starch, wet, from wet milling (gluten recovery), at plant/US Economic
AF + EF
Transport
Transport from supplier (USA) to factory (EU)
Articulated lorry transport, Euro 4, Total weight >32 t (without fuel); diesel driven, Euro 4, cargo; consumption mix, to consumer; more than 32t gross weight / 24,7t payload capacity
EF
1000 km by truck (>32 t, EURO 4; UUID 938d5ba6-17e4-4f0d-bef0-481608681f57), for the sum of distances from harbour/airport to factory outside and inside Europe. case-specific utilisation ratio
Transoceanic ship, containers; heavy fuel oil driven, cargo; consumption mix, to consumer; 27.500 dwt payload capacity, ocean going
EF 6000 km by ship (transoceanic container; UUID 6ca61112-1d5b-473c-abfa-4accc66a8a63)
Articulated lorry transport, Euro 4, Total weight >32 t (without fuel); diesel driven, Euro 4, cargo; consumption mix, to consumer; more than 32t gross weight / 24,7t payload capacity
EF
1000 km by truck (>32 t, EURO 4; UUID 938d5ba6-17e4-4f0d-bef0-481608681f57), for the sum of distances from harbour/airport to factory outside and inside Europe. case-specific utilisation ratio
Polymer production
Sugar production (EU)
Glucose production, RER EI + EF 2.55 kg fructose/kg HMF (Lam et al., 2018)
HMF production (EU) LCI built based on literature (Isola et al., 2017) Lit 1,57 kg HMF/kg FDCA (Isola et al. 2017)
Comparative LCA of alternative feedstock for plastics production – DRAFT FOR STAKEHOLDER CONSULTATION Part II
30
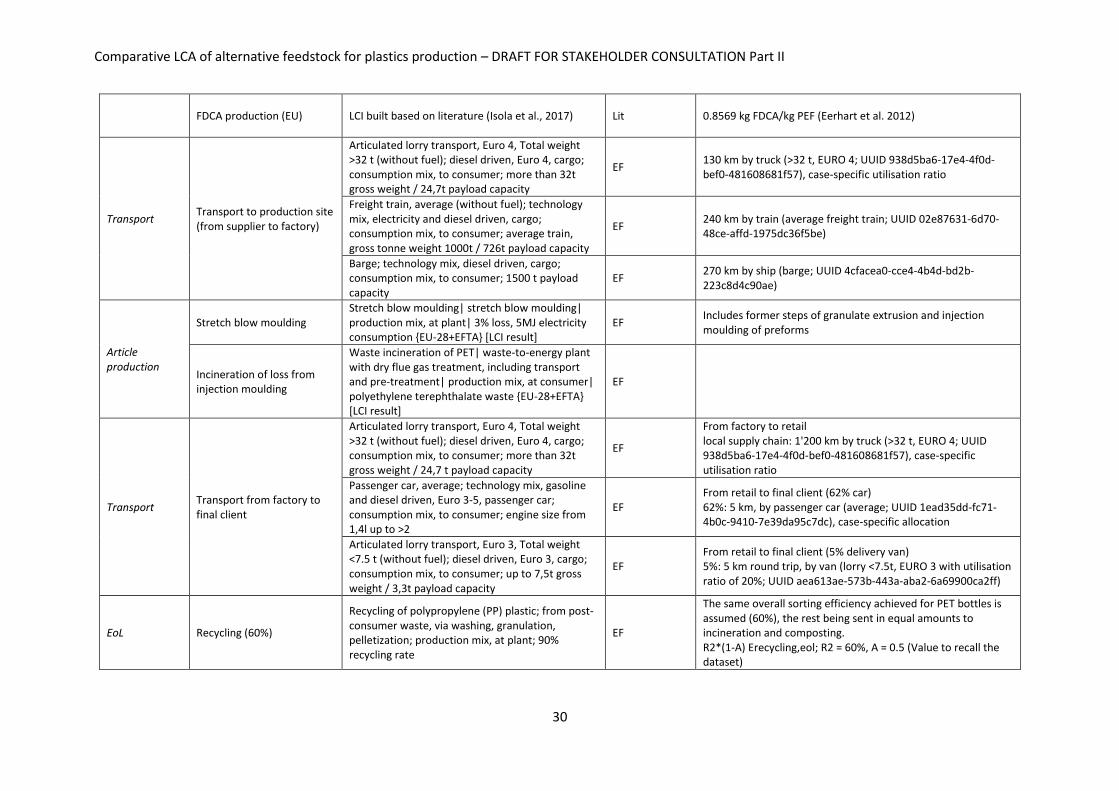
FDCA production (EU) LCI built based on literature (Isola et al., 2017) Lit 0.8569 kg FDCA/kg PEF (Eerhart et al. 2012)
Transport Transport to production site (from supplier to factory)
Articulated lorry transport, Euro 4, Total weight >32 t (without fuel); diesel driven, Euro 4, cargo; consumption mix, to consumer; more than 32t gross weight / 24,7t payload capacity
EF 130 km by truck (>32 t, EURO 4; UUID 938d5ba6-17e4-4f0d-bef0-481608681f57), case-specific utilisation ratio
Freight train, average (without fuel); technology mix, electricity and diesel driven, cargo; consumption mix, to consumer; average train, gross tonne weight 1000t / 726t payload capacity
EF 240 km by train (average freight train; UUID 02e87631-6d70-48ce-affd-1975dc36f5be)
Barge; technology mix, diesel driven, cargo; consumption mix, to consumer; 1500 t payload capacity
EF 270 km by ship (barge; UUID 4cfacea0-cce4-4b4d-bd2b-223c8d4c90ae)
Article production
Stretch blow moulding Stretch blow moulding| stretch blow moulding| production mix, at plant| 3% loss, 5MJ electricity consumption {EU-28+EFTA} [LCI result]
EF Includes former steps of granulate extrusion and injection moulding of preforms
Incineration of loss from injection moulding
Waste incineration of PET| waste-to-energy plant with dry flue gas treatment, including transport and pre-treatment| production mix, at consumer| polyethylene terephthalate waste {EU-28+EFTA} [LCI result]
EF
Transport Transport from factory to final client
Articulated lorry transport, Euro 4, Total weight >32 t (without fuel); diesel driven, Euro 4, cargo; consumption mix, to consumer; more than 32t gross weight / 24,7 t payload capacity
EF
From factory to retail local supply chain: 1'200 km by truck (>32 t, EURO 4; UUID 938d5ba6-17e4-4f0d-bef0-481608681f57), case-specific utilisation ratio
Passenger car, average; technology mix, gasoline and diesel driven, Euro 3-5, passenger car; consumption mix, to consumer; engine size from 1,4l up to >2
EF From retail to final client (62% car) 62%: 5 km, by passenger car (average; UUID 1ead35dd-fc71-4b0c-9410-7e39da95c7dc), case-specific allocation
Articulated lorry transport, Euro 3, Total weight <7.5 t (without fuel); diesel driven, Euro 3, cargo; consumption mix, to consumer; up to 7,5t gross weight / 3,3t payload capacity
EF From retail to final client (5% delivery van) 5%: 5 km round trip, by van (lorry <7.5t, EURO 3 with utilisation ratio of 20%; UUID aea613ae-573b-443a-aba2-6a69900ca2ff)
EoL Recycling (60%)
Recycling of polypropylene (PP) plastic; from post-consumer waste, via washing, granulation, pelletization; production mix, at plant; 90% recycling rate
EF
The same overall sorting efficiency achieved for PET bottles is assumed (60%), the rest being sent in equal amounts to incineration and composting. R2*(1-A) Erecycling,eol; R2 = 60%, A = 0.5 (Value to recall the dataset)

Comparative LCA of alternative feedstock for plastics production – DRAFT FOR STAKEHOLDER CONSULTATION Part II
31
Avoided virgin PET production
PET granulates, amorphous| Polymerisation of ethylene| production mix, at plant| 0.91- 0.96 g/cm3, 28 g/mol per repeating unit {EU-28+EFTA} [LCI result]
EF
Similarly to PLA in BIO-SPRI, r-PEF is assumed to replace PET in the short term. R2*(1-A)*Ev*Qs/Qp; R2 = 60%*90%, A = 0.5, Qs/Qp = 0.9 (The same value of Qs/Qp as R-PET/V-PET is assumed) Assuming moreover 90% efficiency according to the dataset
Incineration (20%) Based on Doka, 2009a R3 = 20%
Landfill (20%) Based on Doka, 2009b (1-R2-R3) = 20%
(*) The meaning of the parameters of the Circular Footprint Formula reported for EoL options (R1, R2, R3, A, Qs/Qp) are explained in section 5.5.8.11 of Report I. 1
2
Comparative LCA of alternative feedstock for plastics production – DRAFT FOR STAKEHOLDER CONSULTATION Part II
32
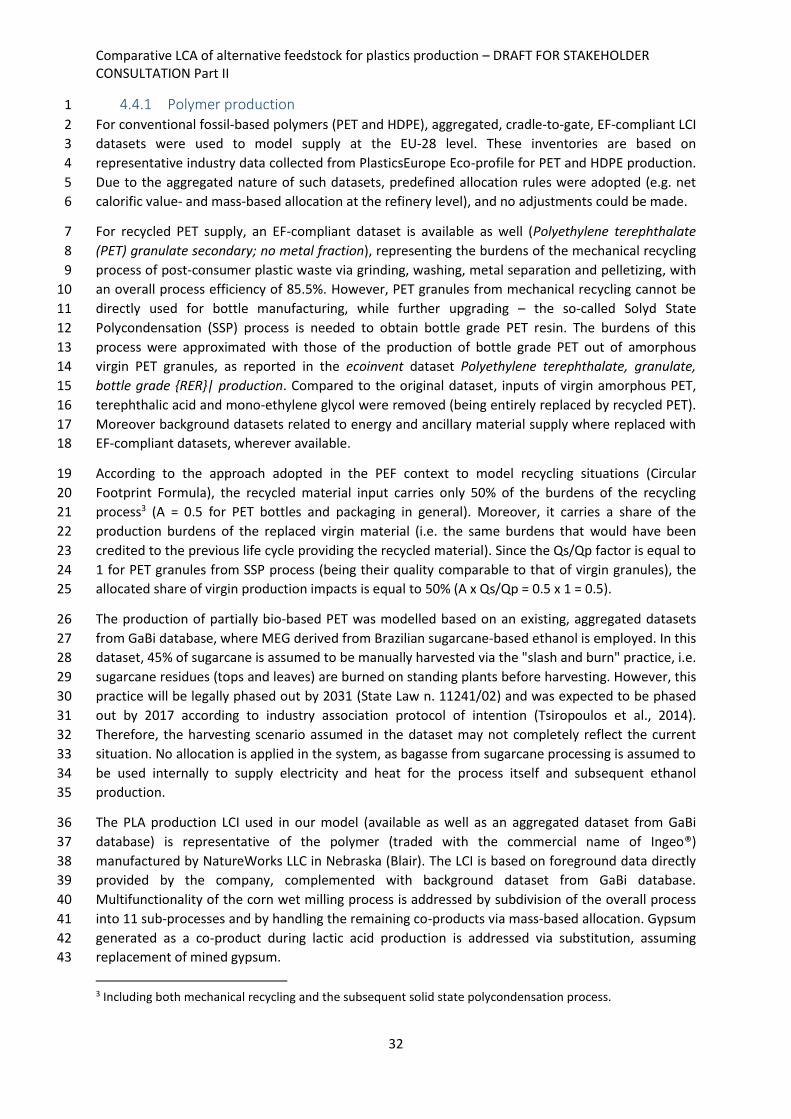
4.4.1 Polymer production 1
For conventional fossil-based polymers (PET and HDPE), aggregated, cradle-to-gate, EF-compliant LCI 2
datasets were used to model supply at the EU-28 level. These inventories are based on 3
representative industry data collected from PlasticsEurope Eco-profile for PET and HDPE production. 4
Due to the aggregated nature of such datasets, predefined allocation rules were adopted (e.g. net 5
calorific value- and mass-based allocation at the refinery level), and no adjustments could be made. 6
For recycled PET supply, an EF-compliant dataset is available as well (Polyethylene terephthalate 7
(PET) granulate secondary; no metal fraction), representing the burdens of the mechanical recycling 8
process of post-consumer plastic waste via grinding, washing, metal separation and pelletizing, with 9
an overall process efficiency of 85.5%. However, PET granules from mechanical recycling cannot be 10
directly used for bottle manufacturing, while further upgrading – the so-called Solyd State 11
Polycondensation (SSP) process is needed to obtain bottle grade PET resin. The burdens of this 12
process were approximated with those of the production of bottle grade PET out of amorphous 13
virgin PET granules, as reported in the ecoinvent dataset Polyethylene terephthalate, granulate, 14
bottle grade {RER}| production. Compared to the original dataset, inputs of virgin amorphous PET, 15
terephthalic acid and mono-ethylene glycol were removed (being entirely replaced by recycled PET). 16
Moreover background datasets related to energy and ancillary material supply where replaced with 17
EF-compliant datasets, wherever available. 18
According to the approach adopted in the PEF context to model recycling situations (Circular 19
Footprint Formula), the recycled material input carries only 50% of the burdens of the recycling 20
process3 (A = 0.5 for PET bottles and packaging in general). Moreover, it carries a share of the 21
production burdens of the replaced virgin material (i.e. the same burdens that would have been 22
credited to the previous life cycle providing the recycled material). Since the Qs/Qp factor is equal to 23
1 for PET granules from SSP process (being their quality comparable to that of virgin granules), the 24
allocated share of virgin production impacts is equal to 50% (A x Qs/Qp = 0.5 x 1 = 0.5). 25
The production of partially bio-based PET was modelled based on an existing, aggregated datasets 26
from GaBi database, where MEG derived from Brazilian sugarcane-based ethanol is employed. In this 27
dataset, 45% of sugarcane is assumed to be manually harvested via the "slash and burn" practice, i.e. 28
sugarcane residues (tops and leaves) are burned on standing plants before harvesting. However, this 29
practice will be legally phased out by 2031 (State Law n. 11241/02) and was expected to be phased 30
out by 2017 according to industry association protocol of intention (Tsiropoulos et al., 2014). 31
Therefore, the harvesting scenario assumed in the dataset may not completely reflect the current 32
situation. No allocation is applied in the system, as bagasse from sugarcane processing is assumed to 33
be used internally to supply electricity and heat for the process itself and subsequent ethanol 34
production. 35
The PLA production LCI used in our model (available as well as an aggregated dataset from GaBi 36
database) is representative of the polymer (traded with the commercial name of Ingeo®) 37
manufactured by NatureWorks LLC in Nebraska (Blair). The LCI is based on foreground data directly 38
provided by the company, complemented with background dataset from GaBi database. 39
Multifunctionality of the corn wet milling process is addressed by subdivision of the overall process 40
into 11 sub-processes and by handling the remaining co-products via mass-based allocation. Gypsum 41
generated as a co-product during lactic acid production is addressed via substitution, assuming 42
replacement of mined gypsum. 43
3 Including both mechanical recycling and the subsequent solid state polycondensation process.

Comparative LCA of alternative feedstock for plastics production – DRAFT FOR STAKEHOLDER CONSULTATION Part II
33
For PEF production, no “ready-to-use” LCI is currently available, due to the relatively early stage of 1
development of the related production technologies. Therefore, a new LCI has been developed on 2
purpose, according to the following procedure. First of all, an aggregated dataset approximating the 3
burdens of the sole MEG production and of the final polymerisation steps was developed, based on 4
the aggregated LCI relating to partially bio-based PET production, but subtracting the burdens of PTA 5
production (represented by the GaBi dataset Terephthalic acid). A dataset representing the burdens 6
of FDCA production was then developed and added to the overall PEF production datasets. This was 7
based on literature data related to experimental and kinetic modelling studies (Lam et al., 2018), as 8
well as laboratory scale reactors (Isola et al., 2017), as no data were available for pilot plants (to the 9
authors knowledge, no full-scale plants are currently in place). The developed dataset includes the 10
cradle-to-gate burdens of FDCA production, including: (i) maize cultivation in the US (based on EF-11
compliant dataset); (ii) starch production via maize wet milling (based on foreground data from 12
Agrifootprint database and background EF-compliant datasets); (iii) transport of starch from the US 13
to Europe4; (iv) glucose production (based on foreground data from ecoinvent database and 14
background EF-compliant datasets, whenever available), (v) HMF (Hydroxymethylfurfural) 15
production (based on foreground data from Lam et al. (2018) and EF-compliant background 16
datasets, where available), and (vi) FDCA production (based on foreground data from Isola et al. 17
(2017) and EF-compliant background datasets, where available). 18
4.4.2 Transport to article production site 19
Modelling of transport of polymer resin from the place of production (inside or outside the EU), to 20
the article manufacturing site in Europe, is based on standard distances and vehicle types specified 21
in the methodology document (Report I) for the route supplier-to-factory. In the case of suppliers 22
located inside Europe (i.e. for all polymer types except for PLA), the following routes were thus 23
considered: (i) 130 km by articulated lorry (total weight >32 t; Euro 4); (ii) 240 km by train (average 24
freight); and (iii) 270 km by ship (barge, technology mix). For PLA (manufactured in the US), a 25
transoceanic transport along a distance of 6000 km (New York-Rotterdam) was considered, in 26
combination with road transport to and from the harbour in both the exporting and importing 27
country (i.e. the EU). Road transport is made by lorry (total weight >32 t; Euro 4) along a distance of 28
1000 km. LCIs for all types of vehicles are available as EF-compliant datasets, which were used in the 29
modelling. 30
4.4.3 Article production 31
Regardless of the feedstock used, production of PET bottles normally takes place in two steps. First, 32
preforms are obtained via injection moulding of melted plastic granules (directly at bottling plants 33
or, frequently, in separate facilities). Preforms are then converted into bottles through stretch-blow 34
moulding process. The same process applies also to PLA and, in the future, to PEF. 35
The burdens of the overall conversion process of PET, PLA and PEF plastic granules into bottles were 36
modelled through the aggregated, EF-compliant dataset Stretch blow moulding {EU-28+EFTA}, which 37
accounts for 3% polymer losses during the process. The burdens of the respective disposal process 38
4 Transport modelling is based on standard distances and vehicle types specified in the methodology report for the route supplier-to-factory, in the case of suppliers located outside Europe. The following routes were considered: 1000 km by articulated lorry (total weight >32 t; Euro 4) from factory to harbour and vice versa (both in the exporting and importing country); and 6000 km by ship (transoceanic container), considering the adequate distance from the producer country (US) and Europe (here calculated assuming the route New York-Rotterdam). LCIs for both types of vehicles are available as EF-compliant dataset.

Comparative LCA of alternative feedstock for plastics production – DRAFT FOR STAKEHOLDER CONSULTATION Part II
34
were additionally included in the model, assuming that they are entirely sent to incineration (for 1
further details about the modelling of this process, see the section 4.4.5 on EoL modelling). 2
HDPE bottles are normally manufactured through a partially different process compared to PET 3
bottles, i.e. via extrusion-blow moulding of melted plastic granules. The process consists of two steps 4
taking place consecutively, including a first extrusion of melted polymer into a hollow shape, which 5
is then placed into a metal mould to be converted into a bottle by air inflation. The burdens of this 6
process were modelled through the aggregated, EF-compliant dataset Blow moulding {EU-28+EFTA}, 7
which was deemed a good approximation of the real process. In this case, the efficiency of the 8
process is equal to 99.9%. 9
4.4.4 Transport to final client 10
The transport of the article from the production site to the final client was modelled assuming the 11
route factory -> retail -> final client specified in the methodology document (Report I), and 12
considering the corresponding default transport scenario. The following routes were thus 13
considered: (i) 1200 km by articulated lorry (total weight >32 t; Euro 4) from factory to retailers; (ii) 5 14
km by passenger car for 62% of the roundtrips from retailers to final clients; (iii) 5 km by van for 5% 15
of the roundtrips from retailers to final clients; and (iv) no burdens assigned to 33% of the roundtrips 16
from retailers to final clients (assumed to take place with no motorised vehicles). LCIs for all types of 17
vehicles are available as EF-compliant datasets, which were used in the modelling. 18
4.4.5 End of Life 19
4.4.5.1 Definition of EoL scenarios 20
Regardless of the type of feedstock, the average EoL scenario of PET bottles was assumed to include 21
60% recycling after separate collection, 20% incineration and 20% landfilling. The recycling rate was 22
estimated considering that nearly 1.9 million tonnes of PET bottles were collected for recycling in 23
Europe in 2016 (EPBP, 2018), while 106 billion bottles (corresponding to 2.97 million tonnes)5 were 24
sold during the same year (Packaging Europe, 2017). The resulting recycling rate (63%) was then 25
rounded to 60%. No data on the amount of PET bottles incinerated or landfilled was available, while 26
incineration and landfill rates of plastic in waste in general are reported to be 39% and 31%, 27
respectively (EC, 2018). Therefore, the remaining share of non-recycled PET bottles (40%) was 28
assumed to be routed to the two alternatives according to these proportions (i.e. 22% incineration 29
and 18% landfill). 30
The same recycling rate estimated for PET bottles was also assumed for HDPE and PEF bottles. Data 31
focusing only on HDPE bottle recycling are scarce, and thus it was deemed reasonable to assume the 32
same recycling rate. Conversely, PEF is primarily intended as a potential replacement material for 33
PET, so that, in principle, it would be introduced in a similar collection and recycling scheme (and 34
recycling plants are equipped with suitable sorting devices). 35
As for PLA, the average EoL scenario was defined assuming that the same overall separate collection 36
rate estimated for PET bottles (60%) can be achieved (i.e. consumers would sort out PLA bottles with 37
the same efficiency). However, sorted bottles can be either collected for recycling or with organic 38
waste for biological treatment. In this screening assessment, we assumed that both collection routes 39
are undertaken to the same proportion (i.e. 30%). Moreover, bottles collected with organic waste 40
5 The mass of sold bottles is calculated considering that more than 60 billion PET bottles, corresponding to 1.68 million tonnes were collected for recycling in 2012 (Plasteurope.com, 2018). This results in a specific mass of 28 tonnes per million bottles, which is used for conversion purposes.

Comparative LCA of alternative feedstock for plastics production – DRAFT FOR STAKEHOLDER CONSULTATION Part II
35
were further split between composting (27%) and anaerobic digestion (3%), considering that, at the 1
EU level, over 90% of separately collected bio-waste is processed into compost (ECN, 2018), the rest 2
being handled through anaerobic digestion processes. The proportions of non-separately collected 3
bottles sent to incineration and landfilling remain unchanged compared to the PET bottle scenarios 4
(i.e. 20%). 5
4.4.5.2 Modelling of recycling 6
In all scenarios, mechanical recycling of bottles was modelled with the same aggregated, EF-7
compliant dataset (Recycling of polypropylene (PP) plastic | from post-consumer waste, via washing, 8
granulation, pelletization | production mix, at plant | 90% recycling rate). The dataset specifically 9
refers to PP recycling, but it can be reasonably assumed to be representative of all plastic recycling 10
processes, as these are usually based on similar combinations of the same unit operations (e.g. 11
grinding/shredding, washing/flotation and granulation). The overall recycling efficiency is set to 12
85.5% of the input material6, the rejects being sent to landfilling. The fate of rejects could not be 13
changed, as already implemented in aggregated inventory dataset. However, a common route for 14
rejects from plastic recycling is currently incineration or co-combustion in cement kilns, due to the 15
high calorific value of this residual stream (Rigamonti et al., 2014). 16
The recycled material output is assumed to replace the corresponding virgin polymer, whose 17
primary production burdens are credited to the system. Exceptions are recycled PLA and PEF, which 18
were both assumed to replace the corresponding conventional polymer (i.e. virgin PET) in a short 19
term perspective. Moreover, to account for the lower overall quality of recycled polymers compared 20
to the replaced virgin material, a substitution ratio equal to 0.9 was considered, according to default 21
values specified in the PEF context for PET and HDPE. In the absence of more specific indications, the 22
same value was also considered for PLA and PEF replacing virgin PET. 23
Finally, according to the approach adopted in the PEF context to model recycling situations (Circular 24
Footprint Formula), only 50% of the burdens of the EoL recycling process are allocated to the system 25
(A = 0.5 for PET bottles and plastic packaging in general). Similarly, only 50% of the benefits from 26
avoided virgin material production are assigned to the system itself. 27
4.4.5.3 Modelling of composting 28
For PLA composting, a waste-specific LCI was specifically developed according to the general 29
modelling principles specified in the methodology document (Report I), while relying on process-30
specific burdens and transfer coefficients available in the EASETECH model. Note that the EASETECH 31
model was not applied directly, as it was not possible to have, in reasonable time, neither a 32
consistent import of the relevant EF impact assessment method into this tool, nor a consistent 33
export of the EASETECH aggregated LCI for subsequent import into GaBi (in order to ensure a 34
consistent impact assessment across all lifecycle stages). This is partly due to the lack of mapping 35
information specifying how the ILCD flow list has been actually implemented into the model. On the 36
other hand, an additional modelling effort was required to implement the developed, disaggregated 37
composting inventory into GaBi. 38
For modelling purposes, an indoor composting facility (tunnel composting) is considered, as 39
bioplastics are more likely to be collected along with kitchen waste (rather than garden waste), 40
6 Albeit the efficiency specified in the name of the dataset is 90%, an actual value of 85.5% is considered in the corresponding LCI.
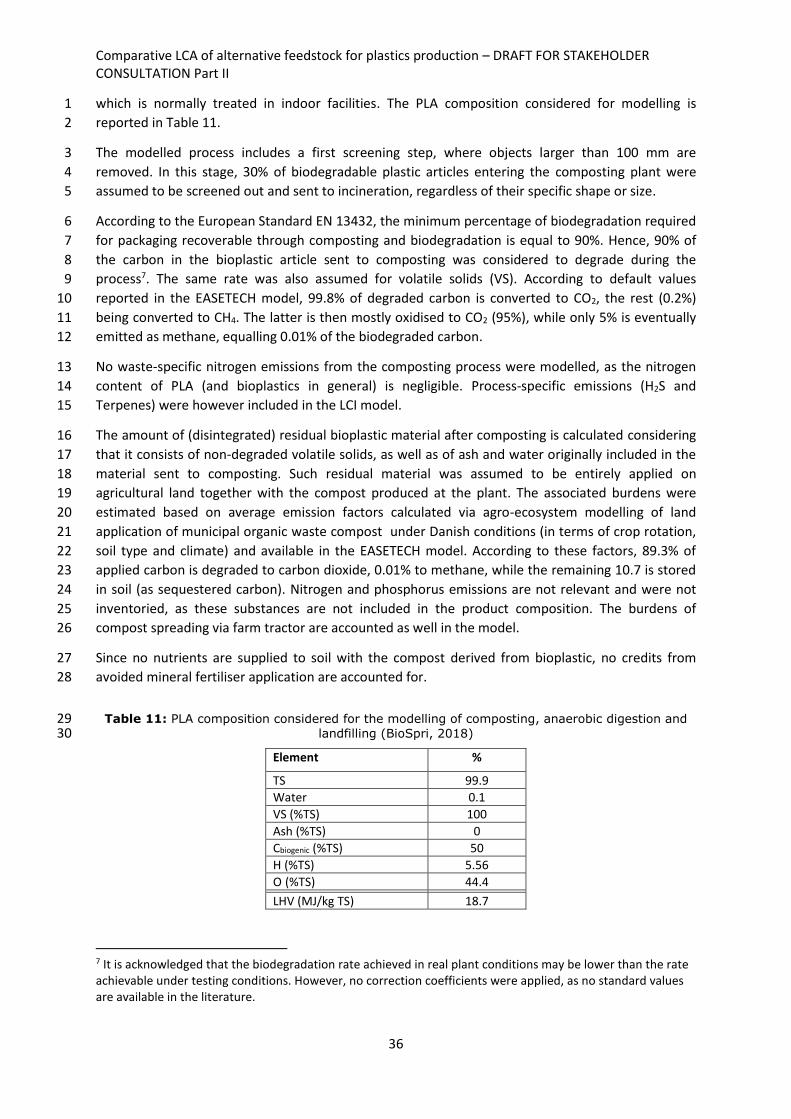
Comparative LCA of alternative feedstock for plastics production – DRAFT FOR STAKEHOLDER CONSULTATION Part II
36
which is normally treated in indoor facilities. The PLA composition considered for modelling is 1
reported in Table 11. 2
The modelled process includes a first screening step, where objects larger than 100 mm are 3
removed. In this stage, 30% of biodegradable plastic articles entering the composting plant were 4
assumed to be screened out and sent to incineration, regardless of their specific shape or size. 5
According to the European Standard EN 13432, the minimum percentage of biodegradation required 6
for packaging recoverable through composting and biodegradation is equal to 90%. Hence, 90% of 7
the carbon in the bioplastic article sent to composting was considered to degrade during the 8
process7. The same rate was also assumed for volatile solids (VS). According to default values 9
reported in the EASETECH model, 99.8% of degraded carbon is converted to CO2, the rest (0.2%) 10
being converted to CH4. The latter is then mostly oxidised to CO2 (95%), while only 5% is eventually 11
emitted as methane, equalling 0.01% of the biodegraded carbon. 12
No waste-specific nitrogen emissions from the composting process were modelled, as the nitrogen 13
content of PLA (and bioplastics in general) is negligible. Process-specific emissions (H2S and 14
Terpenes) were however included in the LCI model. 15
The amount of (disintegrated) residual bioplastic material after composting is calculated considering 16
that it consists of non-degraded volatile solids, as well as of ash and water originally included in the 17
material sent to composting. Such residual material was assumed to be entirely applied on 18
agricultural land together with the compost produced at the plant. The associated burdens were 19
estimated based on average emission factors calculated via agro-ecosystem modelling of land 20
application of municipal organic waste compost under Danish conditions (in terms of crop rotation, 21
soil type and climate) and available in the EASETECH model. According to these factors, 89.3% of 22
applied carbon is degraded to carbon dioxide, 0.01% to methane, while the remaining 10.7 is stored 23
in soil (as sequestered carbon). Nitrogen and phosphorus emissions are not relevant and were not 24
inventoried, as these substances are not included in the product composition. The burdens of 25
compost spreading via farm tractor are accounted as well in the model. 26
Since no nutrients are supplied to soil with the compost derived from bioplastic, no credits from 27
avoided mineral fertiliser application are accounted for. 28
Table 11: PLA composition considered for the modelling of composting, anaerobic digestion and 29 landfilling (BioSpri, 2018) 30
Element %
TS 99.9
Water 0.1
VS (%TS) 100
Ash (%TS) 0
Cbiogenic (%TS) 50
H (%TS) 5.56
O (%TS) 44.4
LHV (MJ/kg TS) 18.7
7 It is acknowledged that the biodegradation rate achieved in real plant conditions may be lower than the rate achievable under testing conditions. However, no correction coefficients were applied, as no standard values are available in the literature.

Comparative LCA of alternative feedstock for plastics production – DRAFT FOR STAKEHOLDER CONSULTATION Part II
37
4.4.5.4 Modelling of anaerobic digestion 1
Similarly to composting, a waste-specific LCI was developed for anaerobic digestion of bioplastics. 2
The modelling was carried out according to the general principles specified in the methodology 3
document (Report I), while relying on relevant process-specific burdens and transfer coefficients 4
available in the EASETECH model. As detailed in section 4.4.5.3, the model was not applied directly, 5
while a disaggregated LCI was developed and implemented into GaBi, thus requiring an additional 6
modelling effort. Since some bioplastics anaerobically degrade only under wet thermophilic 7
conditions (e.g. PLA), this technology was considered as a reference for modelling purposes. 8
Moreover, since bioplastic degradation under anaerobic conditions is only partial, a further post-9
composting stage of the residual material contained in the digestate output from the process is 10
modelled. The residual, non-degraded material is finally applied on agricultural land as soil 11
amendment. The PLA composition considered in the modelling is specified in Table 11. 12
Prior to digestion, the incoming waste stream was assumed to undergo a pre-treatment stage, 13
where 30% of biodegradable plastic articles are removed, regardless of their specific shape or size. 14
According to the European Standard EN 13432, a percentage of biodegradation of the packaging 15
material (expressed as percentage of gasified carbon) equal to at least 50%, shall be achieved under 16
anaerobic conditions. However, this value refers to laboratory test conditions, and may not be 17
achieved in real, full-scale plants. Only 70% of this “theoretically” digestible carbon was thus 18
assumed to be actually converted into biogas (i.e. 35% biodegradation was assumed), according to 19
the default gas yield typically adopted for generic organic waste (Angelidaki and Batstone, 2010). 20
Moreover, 63% of gasified carbon was assumed to be converted to CH4, the rest being transformed 21
into CO2, in line with the average (volumetric) biogas composition adopted by default in EASETECH. 22
Comparative LCA of alternative feedstock for plastics production – DRAFT FOR STAKEHOLDER CONSULTATION Part II
38
Table 12 summarises the parameters relevant to the modelling of carbon and VS degradation in the 1
digestion process. 2
A share (2%) of the methane contained in the generated biogas is leaked to the environment within 3
the digestion plant, while the remaining biogas is entirely sent to combustion in stationary engines 4
for combined heat and power production. Engines operate with a net electricity efficiency equal to 5
39%, and a net heat efficiency of 51%. Generated electricity was assumed to replace electricity from 6
the EU grid, while generated heat replaces average EU heat supply at the EU level. 7
The amount of residual bioplastic in the digestate is calculated by assuming a ratio between 8
degraded VS and degraded carbon equal to 1.89 (according to the default value applied in the 9
EASETECH model for generic organic waste). Moreover, water and ash in the bioplastic are entirely 10
transferred to the residual material in the digestate. Post-composting of such residual material and 11
subsequent land application of the residual fraction in the resulting compost were modelled 12
according to the same approach described for biodegradable plastic composting, in the absence of 13
more specific data. 14
15

Comparative LCA of alternative feedstock for plastics production – DRAFT FOR STAKEHOLDER CONSULTATION Part II
39
Table 12: Parameters used in the modelling of carbon and VS degradation in the anaerobic 1 digestion process 2
Parameter Value Comment
Bio-gasified (biodegraded) C
35% 70% of minimum anaerobically degradable carbon under laboratory testing conditions (50%; EN 13432)
C degraded to CH4 63% Based on average (volumetric) composition of organic waste biogas (from EASETECH model) C degraded to CO2 37%
CH4 leakage in the plant 2% of CH4 produced Based on process-specific emission factor (from EASETECH model)
Degraded VS/Degraded C 1.89 Default value for organic waste (from EASETECH model)
Digested (residual) bioplastic material
Non-degraded VS + initial ash & water in the material
Assumption
4.4.5.5 Modelling of incineration 3
For the incineration process of conventional (fossil-based) plastics, aggregated, material-specific, EF-4
compliant LCI datasets are available and were used in the modelling. Similarly, for some bio-based 5
and/or biodegradable plastics (including bio-based PET, bio-based LDPE and PLA), partially 6
aggregated material-specific LCIs from GaBi database were applied. 7
In line with the general approach to handle energy recovery specified in the methodology document 8
(Report I), the generator of the waste material sent to incineration takes the full burdens from the 9
incineration process. Moreover, it is also credited for 100% of the benefits from avoided primary 10
production of any recovered energy (electricity and heat). While in EF-compliant datasets these 11
credits are already accounted in the aggregated inventory, for GaBi datasets they need to be added 12
to the main process inventory. For this purpose, the EU electricity grid mix (as inventoried in the EF 13
dataset Electricity grid mix 1kV-60kV) was credited to the amount of recovered electricity, while an 14
EU-average heat supply mix was created to calculate credits for recovered heat. The LCI of the mix is 15
based on background EF datasets for each specific heat source included in the mix, i.e. 54% natural 16
gas, 40% hard coal, and 6% heavy fuel oil. 17
For PEF, no ready-to-use incineration datasets were available to have a fully consistent modelling. A 18
disaggregated, material-specific inventory was thus purposefully developed, based on the 19
calculation tool developed by Doka (2009a) for the modelling of material incineration within 20
municipal solid waste incineration plants. The application of a tool delivering disaggregated 21
inventories was preferred to entirely developing new LCIs based on transfer coefficients and 22
process-specific burdens from a waste LCA model such as EASETECH (as done for the composting 23
and anaerobic digestion processes). The transformations and sub-processes to be modelled are 24
indeed more numerous compared to such biological treatments, thus making any modelling from 25
scratch too time demanding and prone to the risk of introducing errors in the calculations. On the 26
other hand, the direct application of the EASETECH model to obtain characterised LCIA results or an 27
aggregated inventory for import into GaBi was prevented, for the reasons reported in 4.4.5.3. 28
According to the prescription in the methodology document (Report I), the selected tool allows the 29
practitioner to account for the specific composition and energy content of the incinerated waste in 30
the background calculations used for the development of the inventory (Table 13). However, 31
compared to the original tool, energy generation was calculated based on updated average energy 32
efficiencies at the EU level, i.e. 13.5% net electricity efficiency and 31% net heat efficiency. These 33

Comparative LCA of alternative feedstock for plastics production – DRAFT FOR STAKEHOLDER CONSULTATION Part II
40
efficiencies account for the share of waste routed to incineration plants operating without any 1
energy recovery (estimated to be 10% for municipal waste)8, while considering that plants with 2
energy recovery are characterised by an average net electricity efficiency equal to 14.9%, and by an 3
average heat efficiency equal to 34.6% (CEWEP, 2012). Credits associated with recovered energy 4
were calculated as described above for non-EF datasets available from GaBi database. 5
Table 13: PEF composition considered for the modelling of incineration and landfilling9 6
Element %
TS 1.0E+02
Water 0.0E+00
VS (%TS) 9.89E+01
Ash (%TS) 1.10E+00
Cbiogenic (%TS) 0.00E+00
Cfossil (%TS) 5.20E+01
H (%TS) 3.25E+00
O (%TS) 4.39E+01
Cl (%TS) 1.98E-01
F (%TS) 1.56E-03
N (%TS) 9.89E-02
S (%TS) 3.12E-02
As (%TS) 1.07E-03
Br (%TS) 9.84E-05
Cd (%TS) 1.54E-04
Co (%TS) 4.62E-04
Cr (%TS) 1.50E-03
Cu (%TS) 9.74E-03
Hg (%TS) 8.43E-06
Mn (%TS) 3.95E-03
Mo (%TS) 4.92E-04
Ni (%TS) 1.03E-03
Pb (%TS) 1.14E-02
Sb (%TS) 9.82E-04
Si (%TS) 5.13E-01
Ti (%TS) 2.46E-05
V (%TS) 4.91E-03
Zn (%TS) 1.26E-02
LHV (MJ/kg TS) 1.77E+01
7
4.4.5.6 Modelling of landfilling 8
Landfilling of conventional (fossil-based) plastic materials was modelled based on the same 9
aggregated EF-compliant dataset (Landfill of plastic waste| landfill including leachate treatment and 10
with transport without collection and pre-treatment| production mix (region specific sites), at landfill 11
site). The related inventory is material-specific, but refers to the average composition and energy 12
8 Based on Eurostat data on municipal waste management in the EU for the years 2013, 2015 and 2016 -no figures are available for 2015 for incineration without energy recovery- (Eurostat, 2018). 9 The PEF composition was defined based on stoichiometric content of C; H and N in the polymer, while relying for the remaining elements (essentially metals) on composition data assumed for PET in the GaBi database. Values in kg per tonne of material from GaBi and from the chemical formula were initially combined, and an updated percentage composition was then calculated accordingly.

Comparative LCA of alternative feedstock for plastics production – DRAFT FOR STAKEHOLDER CONSULTATION Part II
41
characteristics of plastic waste, rather than to specific polymers. However, it was considered suitable 1
for the purposes of this screening exercise. If landfilling would turn out to be a relevant contributor 2
to the overall lifecycle impacts of the studied articles, an alternative, more specific modelling 3
approach should be considered. 4
The same plastic-generic dataset was also employed as a proxy for partially bio-based PET and bio-5
based LDPE landfilling. The degradation of conventional plastic materials in landfill is generally very 6
low (usually a value of 1% over 100 years is considered), and a negligible emission of fossil CO2 is 7
expected. However, as in the original, completely aggregated dataset it is not possible to distinguish 8
between fossil CO2 emission from degradation and from background activities, for the two bio-based 9
plastics the whole emission of fossil CO2 was converted to biogenic CO2. This approach is in favour of 10
these bio-based plastic material. 11
For the other bio-based plastics (PLA and PEF), material-specific LCIs were developed based on the 12
calculation tool developed by Doka (2009b) for the modelling of waste disposal into sanitary landfill. 13
Similarly to the waste incineration tool, it allows for calculating material-specific landfill inventories 14
that account for the composition and other relevant chemo-physical properties of the landfilled 15
waste (Table 13). The reasons for choosing this tool rather than a waste LCA model such as 16
EASETECH (applied as such or only used as data source) are the same as those explained for 17
incineration in 4.4.5.5. 18
One of the most relevant parameter to be set in the model is the degradability of the waste (or 19
better, of the carbon in the waste) within 100 years. For non-degradable bio-based plastics (e.g. 20
PEF), this parameter was set to 1%, for consistency with the values considered in the same model for 21
conventional plastics. For biodegradable plastics (PLA and starch-based copolymer), material-specific 22
degradability values were defined based on relevant literature (Table 14). 23
Table 14: Degradability values considered for landfilled biodegradable plastics within 100 years 24 from deposition 25
Material Degradability Source
PLA 1% Kolstad et al. (2012); Rossi et al. (2015)
Starch-based polymer 74%* Hottle et al. (2017); Rossi et al. (2015); Guo et al. (2013)
(*) The average of the values reported in the mentioned sources 26 (i.e. 32.4%, 99%, and 91%) was considered. 27
In the model, 53% of the generated landfill gas is captured, the rest being directly emitted to the 28
environment over 100 years. Captured landfill gas is mostly (66%) used for energy generation in 29
stationary engines, while 34% is directly flared without any kind of energy recovery. Engines operate 30
with a net electricity efficiency of 13.5%, and a net heat efficiency of 27.8%. Overall, these values are 31
representative of average Swiss conditions as of 2007, and, at this screening level, were not updated 32
to represent the current average situation in the EU. However, they seem to be at least partially 33
aligned with the EU-average situation depicted by Couturier et al. (2010) for the year 2008, where 34
49% of landfill gas is collected, 45% of which is used for energy recovery (mostly in gas engine), the 35
rest being flared. 36

Comparative LCA of alternative feedstock for plastics production – DRAFT FOR STAKEHOLDER CONSULTATION Part II
42
4.5 Life cycle impact assessment results 1
The characterised potential impacts of the examined scenarios (with and without the iLUC 2
contribution to Climate Change) are reported in Figures 7 to 9. These also show the breakdown of 3
contributions from the main lifecycle stages, which include: i) Polymer production (i.e. all cradle-to-4
gate processes involved in the production and supply of the relevant polymer); ii) Article production 5
(i.e. activities to convert the polymer into a finished article, e.g. stretch-blow moulding); iii) 6
Transport (including all transport processes throughout the life cycle); and (iv) Waste management 7
(i.e. waste treatment processes and any credits from downstream displacement of materials and 8
energy). Normalised and weighted results are reported in Annex B.1. Note that scenario impacts 9
presented in Figures 7 to 9 refer to the EU-average EoL scenario (as described is section 4.4.5), and 10
represent net impacts from waste management, resulting from the balance between real burdens 11
and benefits (if any). Potential impacts calculated assuming 100% of post-consumer bottles being 12
routed to each viable EoL option are presented in Figures 10 to 12. 13
As a first comment to overall scenario impacts shown in Figures 7 to 9, we notice a substantially high 14
impact of PEF bottles (compared to the other materials) in all the assessed impact categories. This 15
requires a careful interpretation, which needs to be made in light of the nature of the data used in 16
the modelling (referring to the laboratory scale) and potentially preventing a level-playing field 17
comparison with the other scenarios (see Section 4.6). 18
If we leave this exception apart, the picture of results obtained for individual scenarios appears to be 19
reasonable for many impact categories, while some issues are identified for others. For Resource 20
Use – minerals and metals, unreliable results seem to be achieved, being the overall impact of bio-21
PET and PLA negative in sign, and that of HDPE two orders of magnitude lower than those of 22
remaining scenarios. This may apparently be a consequence of a partly inconsistent mapping of 23
flows from imported datasets and/or impact assessment methods. However, a closer investigation 24
revealed that an explanation can be found in the overwhelming impact of PET production (and its 25
avoided production from recycling), compared to those of the production of the other polymers and 26
remaining life cycle stages. Consumption of Antimony appears to be responsible for this picture, 27
being its use in PET production four to seven orders of magnitude greater than the compared 28
materials (bio-PET, PLA and HDPE). No further investigation could be made, due to the use of 29
aggregated datasets to model polymer production. 30
A similar picture is observed for the Water Use impact category, where fossil-based PET and HDPE, 31
as well as bio-based PEF show an overall negative impact. This is mostly due to the negative 32
contribution from polymer production and, to a lower extent, of subsequent article production. 33
Again, a specific flow seems to be specifically responsible for this, i.e. water from turbine use 34
returned to the environment, which has a negative characterisation factor, and is included in PET 35
and HDPE production, while this is not the case for e.g. PLA. A flawed water balance in the 36
production inventories of the two fossil-based polymers may contribute as well to this outcome. 37
Issues associated with reliability of results for the two mentioned resource-related categories are 38
expected to be solved in next project steps, by identifying and removing any errors and 39
inconsistencies in the implementation of EF-compliant datasets and related impact assessment 40
methods in the used LCA software. If this would not prove sufficient (due e.g. to inconsistencies in 41
the modelling of resource and water flows across datasets from different sources, or flawed water 42
balances), the validity of the datasets will be checked, and alternative sources will be explored, if 43
available (see section 10 for further discussion). 44
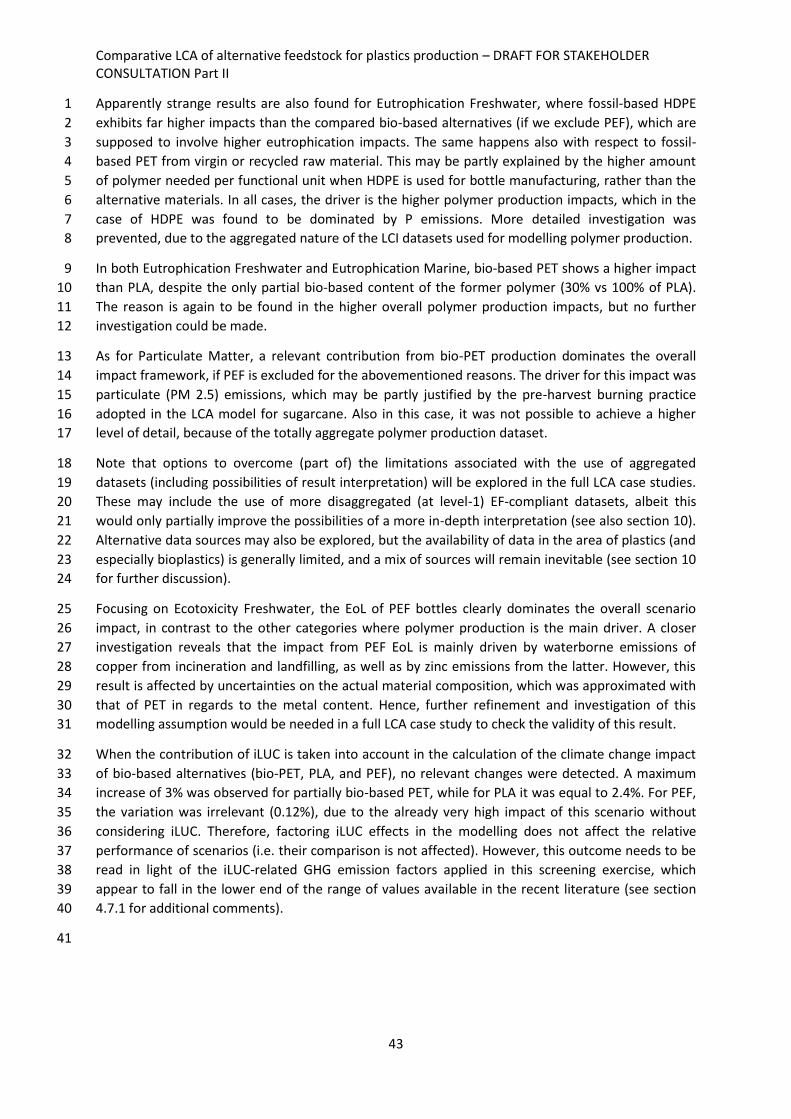
Comparative LCA of alternative feedstock for plastics production – DRAFT FOR STAKEHOLDER CONSULTATION Part II
43
Apparently strange results are also found for Eutrophication Freshwater, where fossil-based HDPE 1
exhibits far higher impacts than the compared bio-based alternatives (if we exclude PEF), which are 2
supposed to involve higher eutrophication impacts. The same happens also with respect to fossil-3
based PET from virgin or recycled raw material. This may be partly explained by the higher amount 4
of polymer needed per functional unit when HDPE is used for bottle manufacturing, rather than the 5
alternative materials. In all cases, the driver is the higher polymer production impacts, which in the 6
case of HDPE was found to be dominated by P emissions. More detailed investigation was 7
prevented, due to the aggregated nature of the LCI datasets used for modelling polymer production. 8
In both Eutrophication Freshwater and Eutrophication Marine, bio-based PET shows a higher impact 9
than PLA, despite the only partial bio-based content of the former polymer (30% vs 100% of PLA). 10
The reason is again to be found in the higher overall polymer production impacts, but no further 11
investigation could be made. 12
As for Particulate Matter, a relevant contribution from bio-PET production dominates the overall 13
impact framework, if PEF is excluded for the abovementioned reasons. The driver for this impact was 14
particulate (PM 2.5) emissions, which may be partly justified by the pre-harvest burning practice 15
adopted in the LCA model for sugarcane. Also in this case, it was not possible to achieve a higher 16
level of detail, because of the totally aggregate polymer production dataset. 17
Note that options to overcome (part of) the limitations associated with the use of aggregated 18
datasets (including possibilities of result interpretation) will be explored in the full LCA case studies. 19
These may include the use of more disaggregated (at level-1) EF-compliant datasets, albeit this 20
would only partially improve the possibilities of a more in-depth interpretation (see also section 10). 21
Alternative data sources may also be explored, but the availability of data in the area of plastics (and 22
especially bioplastics) is generally limited, and a mix of sources will remain inevitable (see section 10 23
for further discussion). 24
Focusing on Ecotoxicity Freshwater, the EoL of PEF bottles clearly dominates the overall scenario 25
impact, in contrast to the other categories where polymer production is the main driver. A closer 26
investigation reveals that the impact from PEF EoL is mainly driven by waterborne emissions of 27
copper from incineration and landfilling, as well as by zinc emissions from the latter. However, this 28
result is affected by uncertainties on the actual material composition, which was approximated with 29
that of PET in regards to the metal content. Hence, further refinement and investigation of this 30
modelling assumption would be needed in a full LCA case study to check the validity of this result. 31
When the contribution of iLUC is taken into account in the calculation of the climate change impact 32
of bio-based alternatives (bio-PET, PLA, and PEF), no relevant changes were detected. A maximum 33
increase of 3% was observed for partially bio-based PET, while for PLA it was equal to 2.4%. For PEF, 34
the variation was irrelevant (0.12%), due to the already very high impact of this scenario without 35
considering iLUC. Therefore, factoring iLUC effects in the modelling does not affect the relative 36
performance of scenarios (i.e. their comparison is not affected). However, this outcome needs to be 37
read in light of the iLUC-related GHG emission factors applied in this screening exercise, which 38
appear to fall in the lower end of the range of values available in the recent literature (see section 39
4.7.1 for additional comments). 40
41

Comparative LCA of alternative feedstock for plastics production – DRAFT FOR STAKEHOLDER CONSULTATION Part II
44
Figure 7: Potential impact of beverage bottle LCA scenarios for the categories of Climate Change, Ozone Depletion, Human Toxicity - cancer, Human 1 Toxicity – non-cancer, Particulate Matter and Ionising Radiation. Note: PEF results are out of scale and were truncated. 2
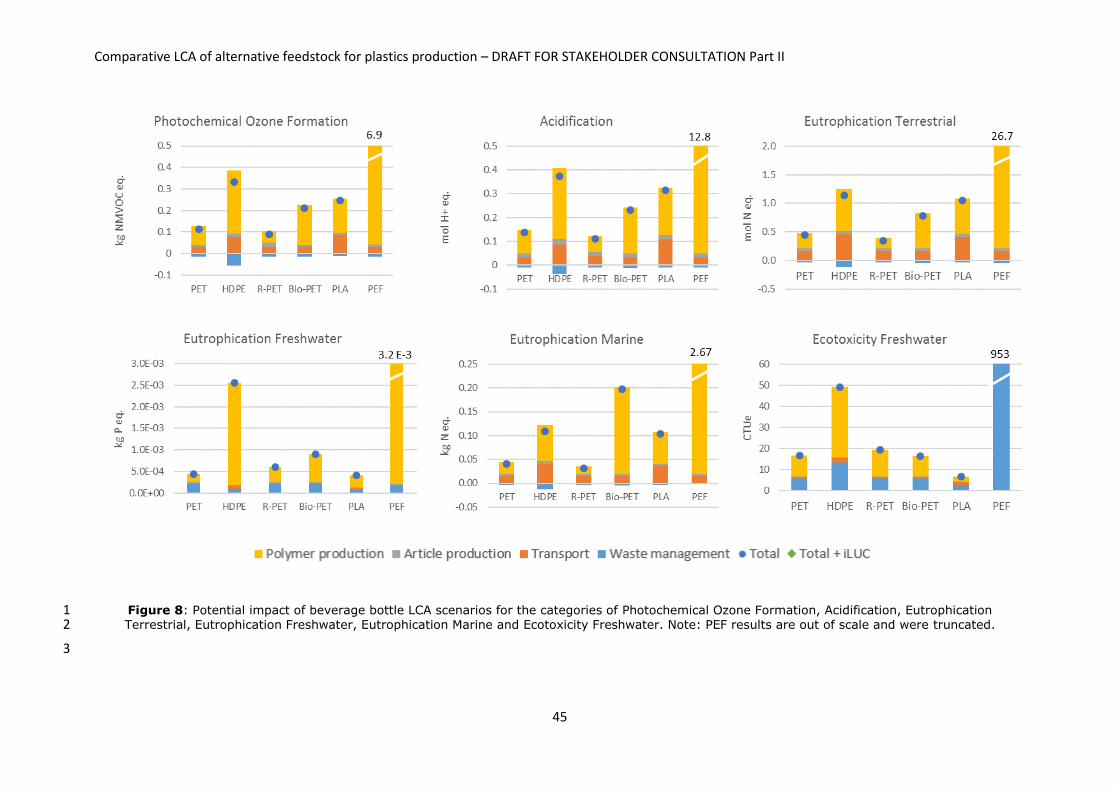
Comparative LCA of alternative feedstock for plastics production – DRAFT FOR STAKEHOLDER CONSULTATION Part II
45
Figure 8: Potential impact of beverage bottle LCA scenarios for the categories of Photochemical Ozone Formation, Acidification, Eutrophication 1 Terrestrial, Eutrophication Freshwater, Eutrophication Marine and Ecotoxicity Freshwater. Note: PEF results are out of scale and were truncated. 2
3

Comparative LCA of alternative feedstock for plastics production – DRAFT FOR STAKEHOLDER CONSULTATION Part II
46
Figure 9: Potential impact of beverage bottle LCA scenarios for the categories of Land Use, Water Use, Resource Use - minerals and metals, and 1 Resource Use - fossils. Note: PEF results are out of scale and were truncated. 2
3

Comparative LCA of alternative feedstock for plastics production – DRAFT FOR STAKEHOLDER CONSULTATION Part II
47
Figure 10: Potential impact of beverage bottle LCA scenarios for different EoL options, for the categories of Climate Change, Ozone Depletion, Human 1 Toxicity - cancer, Human Toxicity – non-cancer, Particulate Matter and Ionising Radiation. Note, PEF results are out of the scale and were excluded. 2

Comparative LCA of alternative feedstock for plastics production – DRAFT FOR STAKEHOLDER CONSULTATION Part II
48
Figure 11: Potential impact of beverage bottle LCA scenarios for different EoL options, for the categories of Photochemical Ozone Formation, 1 Acidification, Eutrophication Terrestrial, Eutrophication Freshwater, Eutrophication Marine and Ecotoxicity Freshwater. Note, PEF results are out of the 2
scale and were excluded. 3

Comparative LCA of alternative feedstock for plastics production – DRAFT FOR STAKEHOLDER CONSULTATION Part II
49
Figure 12: Potential impact of beverage bottle LCA scenarios for different EoL options, for the categories of Land Use, Water Use, Resource Use - 1 minerals and metals, and Resource Use - fossils. Note, PEF results are out of the scale and were excluded. 2
3
4

Comparative LCA of alternative feedstock for plastics production – DRAFT FOR STAKEHOLDER CONSULTATION Part II
50
4.6 Interpretation 1
In the interpretation of case study results, scenario impacts calculated for both the EU-average EoL 2
scenario and the individual EoL options are firstly compared (4.6.1). Most relevant impact categories 3
and lifecycle stages are then identified (4.6.1.1 and 4.6.1.2, respectively). Identification of most 4
relevant processes was not undertaken at this stage, as in the majority of scenarios the whole, 5
cradle-to-gate process-chain involved in polymer production was modelled through a single, 6
vertically aggregated dataset, already representing the corresponding lifecycle stage. Therefore, no 7
additional insights would be gained with this exercise for such stage, which is expected to include a 8
number of relevant lifecycle processes. Moreover, while for some scenarios a greater level of 9
disaggregation could be achieved (e.g. for PEF), a more in-depth investigation of relevant processes 10
would provide an "unbalanced" picture compared to the other scenarios. 11
4.6.1 Case study results 12
Focusing on the two fossil based-reference scenarios, HDPE bottles show a higher impact compared 13
to PET ones in all impact categories except for Mineral and Metal Resource use. However, results 14
obtained for this category cannot be considered totally reliable at this stage, as better explained in 15
Section 3.2. The reason for the overall better performance of PET is a consequence of the higher 16
mass of material used per functional unit in the case of HDPE bottles. In the subsequent 17
comparative considerations with alternative materials, PET bottles will only be considered as a 18
reference, this being the benchmark that needs to be outperformed. Moreover, such materials are 19
(mainly) intended as a replacement for PET. 20
The use of 100% recycled PET in bottle manufacturing provides obvious environmental benefits 21
compared to virgin PET, if we exclude the categories of Ecotoxicity Freshwater, Eutrophication 22
Freshwater and Ozone Depletion. These exceptions are due to higher impacts from polymer supply, 23
i.e. mechanical recycling and/or solid state polycondensation. However, the specific reasons were 24
not investigated further at this screening stage. 25
Replacing fossil-based MEG with bio-based MEG in PET production (i.e. in partially bio-based PET) is 26
not proven to be beneficial for the majority of the assessed categories except for Ozone Depletion, 27
Resource Use - minerals and metals and Water Use. However, results obtained for bio-based PET 28
were not reliable for the Resource Use category, and the same happened to PET in the case of Water 29
Use. The reason of this worsened performance is again to be searched in the higher polymer 30
production impact compared to entirely, fossil based PET. A deeper investigation could not be 31
performed, however, due to the aggregated nature of the LCI dataset used for the modelling of 32
polymer production. 33
When the current, EU-average EoL scenario is considered, PLA bottles show an advantage compared 34
to virgin, fossil-based PET for a few impact categories, including Resource Use (both fossils and 35
minerals and metals) and the three toxicity-related categories. However, for the remaining 36
categories, the performance of PLA bottles is worse (in most cases) or comparable to that of PET. 37
This is mostly due to higher production and/or transport impacts compared to PET (which was 38
assumed to be manufactured in Europe, in contrast to US for PLA). It must be noted, however, that a 39
fully consistent modelling of transport activities of feedstock/resin to EU could not be ensured for 40
these two polymers, due to the aggregated nature of the LCI datasets used in the modelling (which 41
in the case of PET already include transport of feedstock to EU). In addition, PLA bottles show the 42
highest land use impact due to cultivation of bio-based raw material (maize) used as a feedstock (if 43
PEF bottle is not considered, see the explanation below). The impact is much higher also when 44
compared to partially bio-based PET, because bio-based material content of the latter is only 30%. 45

Comparative LCA of alternative feedstock for plastics production – DRAFT FOR STAKEHOLDER CONSULTATION Part II
51
1
As for PEF, a separate comment is needed, as this preliminary assessment revealed an impact that in 2
most categories is 40 to 90 times higher compared to virgin, fossil-based PET (thus explaining the 3
curtailment of PEF impacts in Figures 7 to 9 and their omission in Figures 10 to 12). This is likely due 4
to the nature of the data used in the modelling, which refer to the laboratory scale. Therefore, even 5
by applying scaling factors suggested by the authors of the considered data source to energy 6
consumption involved in production, it was not possible to achieve comparability with the other 7
scenarios. This suggests that, at this stage, the developed methodological framework may not be 8
suitable for the assessment of materials or technologies that are still at an early stage of 9
development or, however, for which no full-scale production data are available. 10
Because of the generally moderate contribution of the EoL stage to the overall scenario impacts, the 11
above picture of results does not substantially change by considering 100% of a specific EoL option 12
rather than the EU-average EoL scenario considered as a baseline. Within this generally limited range 13
of variation, it can be however observed that incineration of fossil-based and partially bio-based 14
bottles for obvious reasons shows the worst performance in terms of Climate Change, while it is the 15
least impacting alternative for few categories including Ionising Radiation, Ozone Depletion and, to a 16
lower extent, Acidification and Eutrophication Freshwater. Moreover, in a number of impact 17
categories (Acidification, Resource Use - fossils, Photochemical Ozone Formation, Human Toxicity - 18
non-cancer, Eutrophication Terrestrial, Eutrophication Marine, Eutrophication Freshwater, and 19
Ionising Radiation), 100% landfilling can be considered to be the least favourable option, at least in 20
some of the assessed scenarios. This is in line with the, priority order outlined in the waste 21
hierarchy, which set disposal at the last place. Conversely, for a couple of categories, i.e. Human 22
Toxicity – cancer and, to a lower extent, Ecotoxocity Freshwater, recycling turns out to be the worst 23
option. This appears to be a consequence of waterborne emissions of chromium, which dominates 24
recycling impacts in such categories. The specific source and reliability of chromium emissions could 25
not be investigated further, because of the aggregated nature of the recycling LCI dataset. On the 26
other hand, it is recognised that characterisation factors for toxicity-related categories, and 27
especially for metals, are still debated, and represent a source of uncertainty. However, updated 28
characterisation factors for toxicity-related impact categories are currently under development by 29
the JRC in the Environmental Footprint framework, and their application may be considered or 30
explored in the full LCA casestudies. In a number of impact categories (i.e. Eutrophication Marine, 31
Eutrophication Terrestrial, Land Use, Photochemical Ozone Formation, Resource Use – fossils and 32
Particulate Matter) recycling is aligned with incineration and the EU average scenario (which 33
included a high share of recycling). The recycling option is only preferable for Human Toxicity – non-34
cancer and Resource Use – minerals and metals. 35
Focusing on biodegradable -compostable- alternatives (i.e. only PLA bottles in this case), no general 36
advantages are found when biological treatment options (composting and anaerobic digestion) are 37
considered individually and no substantial changes occur in the comparison with fossil-based non-38
biodegradable materials. Therefore, when proper waste collection can be achieved, the use of 39
compostable materials for bottle production does not represent, per se, a solution to achieve an 40
improved environmental performance compared to conventional (fossil-based) materials, especially 41
if these come from recycled feedstock. On the other hand, it must be kept in mind that these results 42
exclude the potential impact from the share of product that may end up as littering into the 43
environment, for the reasons outlined in section 3.2. However, this share is not expected to be 44
substantial in regions with a well developed waste management infrastructure like most EU 45
countries, and no dramatic changes in the overall picture may take place. Moreover, PLA (as other 46
biodegradable plastics) can be typically biodegraded only within proper industrial biological 47
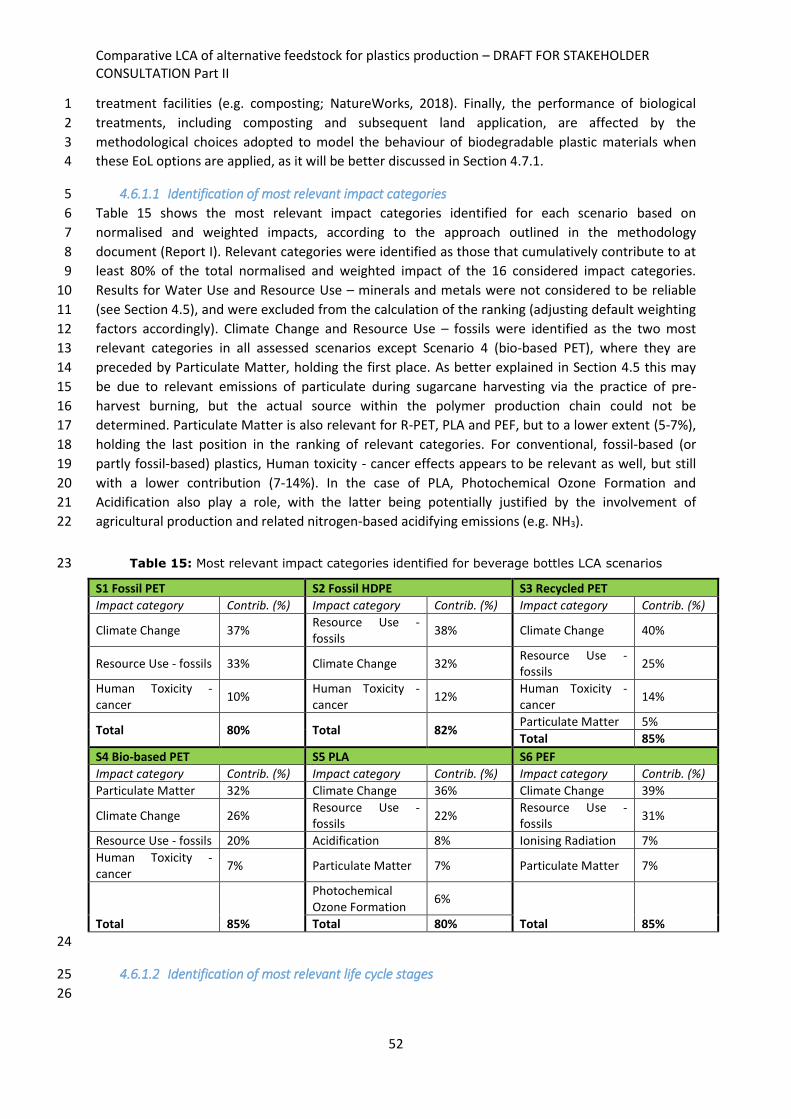
Comparative LCA of alternative feedstock for plastics production – DRAFT FOR STAKEHOLDER CONSULTATION Part II
52
treatment facilities (e.g. composting; NatureWorks, 2018). Finally, the performance of biological 1
treatments, including composting and subsequent land application, are affected by the 2
methodological choices adopted to model the behaviour of biodegradable plastic materials when 3
these EoL options are applied, as it will be better discussed in Section 4.7.1. 4
4.6.1.1 Identification of most relevant impact categories 5
Table 15 shows the most relevant impact categories identified for each scenario based on 6
normalised and weighted impacts, according to the approach outlined in the methodology 7
document (Report I). Relevant categories were identified as those that cumulatively contribute to at 8
least 80% of the total normalised and weighted impact of the 16 considered impact categories. 9
Results for Water Use and Resource Use – minerals and metals were not considered to be reliable 10
(see Section 4.5), and were excluded from the calculation of the ranking (adjusting default weighting 11
factors accordingly). Climate Change and Resource Use – fossils were identified as the two most 12
relevant categories in all assessed scenarios except Scenario 4 (bio-based PET), where they are 13
preceded by Particulate Matter, holding the first place. As better explained in Section 4.5 this may 14
be due to relevant emissions of particulate during sugarcane harvesting via the practice of pre-15
harvest burning, but the actual source within the polymer production chain could not be 16
determined. Particulate Matter is also relevant for R-PET, PLA and PEF, but to a lower extent (5-7%), 17
holding the last position in the ranking of relevant categories. For conventional, fossil-based (or 18
partly fossil-based) plastics, Human toxicity - cancer effects appears to be relevant as well, but still 19
with a lower contribution (7-14%). In the case of PLA, Photochemical Ozone Formation and 20
Acidification also play a role, with the latter being potentially justified by the involvement of 21
agricultural production and related nitrogen-based acidifying emissions (e.g. NH3). 22
Table 15: Most relevant impact categories identified for beverage bottles LCA scenarios 23
S1 Fossil PET S2 Fossil HDPE S3 Recycled PET
Impact category Contrib. (%) Impact category Contrib. (%) Impact category Contrib. (%)
Climate Change 37% Resource Use - fossils 38% Climate Change 40%
Resource Use - fossils 33% Climate Change 32% Resource Use - fossils
25%
Human Toxicity - cancer
10% Human Toxicity - cancer
12% Human Toxicity - cancer
14%
Total 80% Total 82% Particulate Matter 5%
Total 85%
S4 Bio-based PET S5 PLA S6 PEF
Impact category Contrib. (%) Impact category Contrib. (%) Impact category Contrib. (%)
Particulate Matter 32% Climate Change 36% Climate Change 39%
Climate Change 26% Resource Use - fossils
22% Resource Use - fossils
31%
Resource Use - fossils 20% Acidification 8% Ionising Radiation 7%
Human Toxicity - cancer
7% Particulate Matter 7% Particulate Matter 7%
Total 85%
Photochemical Ozone Formation
6%
Total 85% Total 80%
24
4.6.1.2 Identification of most relevant life cycle stages 25
26

Comparative LCA of alternative feedstock for plastics production – DRAFT FOR STAKEHOLDER CONSULTATION Part II
53
Table 16 shows the most relevant lifecycle stages in the relevant impact categories identified for 1
each scenario in Section 4.6.1.1., and the associated contribution, quantified according to the 2
approach detailed in the methodology document (Report I). Most relevant stages include those that 3
together contribute to at least 80% of the total scenario impact10, and are highlighted in 4
10 Note that, according to the calculation procedure detailed in the methodology document (Report I), absolute values of lifecycle stage impacts were considered (i.e. any negative contribution is changed in sign). Therefore, the total value of impacts considered for quantification purposes is the one recalculated as the sum of absolute impact values.

Comparative LCA of alternative feedstock for plastics production – DRAFT FOR STAKEHOLDER CONSULTATION Part II
54
Table 16. For a more exhaustive picture, the contributions of remaining lifecycle stages are reported 1
as well. 2
Across all scenarios, the most relevant lifecycle stage identified for the vast majority of relevant 3
categories is Polymer Production, which accounts for 60% to nearly 100% of the total score. For 4
those scenarios where Human Toxicity – cancer is identified as a relevant category (i.e. PET and R-5
PET), the largest contribution comes from EoL (55-57%), followed by Polymer Production (40%). 6
However, this result is affected by the substantial impact of recycling in such categories, which may 7
be questioned at this stage (see Section 4.5). 8
In most scenarios, a second relevant lifecycle stage is also identified, this being represented by EoL 9
(Resource Use – fossils), Article Production (Climate Change), or Transport (Particulate Matter). 10
However, the incidence of these stages (in the range of 12-22%) is lower compared to that of 11
Polymer Production discussed above. Conversely, for PLA, transport appears as the second largest 12
contributor (11-33% of total impact) to most of the identified relevant categories (i.e. all but 13
Resource Use –fossils, where EoL is more relevant). This is due to the additional distance travelled to 14
import the polymer from US to Europe, compared to the other materials. However, for the latter, 15
the impacts of transport across the supply chain may be underestimated (see Section 4.6.1). 16
In the case of PEF, Polymer Production is alone responsible for more than 99% of the impact in all 17
identified relevant categories. However, this is affected by the overwhelming impact of the FDCA 18
process chain, which is very likely overestimated at this stage (see Section 4.6.1). 19
20

Comparative LCA of alternative feedstock for plastics production – DRAFT FOR STAKEHOLDER CONSULTATION Part II
55
Table 16: Lifecycle stages and associated contribution for beverage bottle LCA scenarios. 1 Highlighted in orange are the most relevant lifecycle stages, i.e. those that together contribute 2
with more than 80% to the total characterised impact in the category. 3
S1 Fossil PET
Climate Change Resource Use - fossils Human Toxicity - cancer
Life cycle stage Contrib. (%) Life cycle stage Contrib. (%) Life cycle stage Contrib. (%)
Polymer production 77.3% Polymer production
73.3% EoL 55.0%
Article production 12.2% EoL 14.9% Polymer production
40.5%
Transport 7.4% Article production 6.0% Transport 3.8%
EoL 3.1% Transport 3.7% Article production 0.7%
S2 Fossil HDPE
Resource Use - fossils Climate Change Human Toxicity - cancer
Life cycle stage Contrib. (%) Life cycle stage Contrib. (%) Contrib. (%) Contrib. (%)
Polymer production 78.0% Polymer production
81.3% Polymer production
55.0
EoL 16.6% Transport 8.6% EoL 41.5%
Transport 3.1% Article production 5.2% Transport 3.2%
Article production 2.3% EoL 4.9% Article production 0.3%
S3 Recycled PET
Climate Change Resource Use - fossils Human Toxicity - cancer
Life cycle stage Contrib. (%) Life cycle stage Contrib. (%) Life cycle stage Contrib. (%)
Polymer production 71.0% Polymer production
64.0% EoL 57.3%
Article production 15.6% EoL 21.8% Polymer production
38.1%
Transport 9.5% Article production 8.8% Transport 3.9%
EoL 3.9% Transport 5.4% Article production 0.8%
Particulate Matter
Life cycle stage Contrib. (%)
Polymer production 60.2%
Transport 14.9%
EoL 13.8%
Article production 11.1%
S4 Bio-based PET
Particulate Matter Climate Change Resource Use - fossils
Life cycle stage Contrib. (%) Life cycle stage Contrib. (%) Life cycle stage Contrib. (%)
Polymer production 96.8% Polymer production
85.2% Polymer production
76.6%
Transport 1.2% Article production 8.9% EoL 14.1%
EoL 1.2% Transport 5.7% Article production 5.7%
Article production 0.9% EoL 0.2% Transport 3.5%
Human Toxicity - cancer
Life cycle stage Contrib. (%)
Polymer production 52.3%
EoL 44.1%
Transport 3.0%
Article production 0.9%
S5 PLA
Climate Change Resource Use - fossils Acidification
Life cycle stage Contrib. (%) Life cycle stage Contrib. (%) Life cycle stage Contrib. (%)
Polymer production 72.7% Polymer production
66.7% Polymer production
58.9%

Comparative LCA of alternative feedstock for plastics production – DRAFT FOR STAKEHOLDER CONSULTATION Part II
56
Transport 11.5% EoL 14.1% Transport 33.3%
Article production 7.9% Transport 10.0% Article production 4.6%
EoL 7.8% Article production 9.2% EoL 3.2%
Particulate Matter Photochemical Ozone Formation
Life cycle stage Contrib. (%) Life cycle stage Contrib. (%)
Polymer production 66.7% Polymer production
59.8%
Transport 31.1% Transport 32.3%
Article production 6.6% Article production 4.1%
EoL 6.6% EoL 3.8%
S6 PEF
Climate Change Resource Use - fossils Ionising Radiation
Life cycle stage Contrib. (%) Life cycle stage Contrib. (%) Life cycle stage Contrib. (%)
Polymer production 99.7% Polymer production
99.5% Polymer production
99.8%
Article production 0.2% EoL 0.3% Article production 0.2%
Transport 0.1% Article production 0.1% EoL 0.0%
EoL 0.0% Transport 0.1% Transport 0.0%
Particulate Matter
Life cycle stage Contrib. (%)
Polymer production 99.6%
Transport 0.2%
Article production 0.1%
EoL 0.1%
1
4.7 Learnings from applying the draft methodology 2
This section summarises the main learnings from applying the draft methodology to this specific case 3
study. The discussion separately addresses the main implications and limitations of the applied 4
method (and data) on the overall results (4.7.1), as well as the possible options that will or can be 5
undertaken to overcome such limitations, or explored to further improve the assessment (4.7.2). 6
4.7.1 Implications of the methodological choices on the results 7
This section discusses the main implications and limitations resulting from applying the draft 8
methodology in this screening case study. In general, these relates to: i) use of aggregated (EF-9
compliant or GaBi datasets), ii) modelling of EoL options, iii) assumptions regarding biodegradability 10
under biological treatments (composting and anaerobic digestion) and subsequent land application 11
of composted material, iv) exclusion of potential impacts of littering, v) approach used to quantify 12
the iLUC contribution, and vi) data used to model PEF production. 13
First, the use of aggregated (EF-compliant or GaBi datasets) implied the use of pre-defined 14
methodological choices, which prevented a fully consistent modelling of the same process or 15
lifecycle stage across all the scenarios. For instance, it was not possible to apply a consistent 16
approach to address multifunctionality (e.g. the same allocation key), nor to ensure the same 17
treatment route to the rejects from EoL processes such as recycling and incineration. While the 18
latter can be expected to only have minor consequences on the results, this is normally not the case 19
when different approaches are used to handle multifunctionality. Moreover, it was not possible to 20
have a fully consistent modelling of upstream transport activities of feedstock and/or polymers from 21
producing countries to EU, these being in some cases included into the aggregated polymer 22
production datasets used in the model, and in other cases modelled additionally in the system 23
(consistently with the provisions in the methodology document -Report I-). In addition, while the 24
documentation of such aggregated datasets is generally quite extensive, it frequently omits 25

Comparative LCA of alternative feedstock for plastics production – DRAFT FOR STAKEHOLDER CONSULTATION Part II
57
important details such as the specific allocation criteria and/or the specific point(s) in the process 1
chain where they were applied. Finally, on the interpretation side, the use of aggregated datasets 2
affected the level of detail of the analysis of contributions to scenario impacts, which in the case of, 3
e.g., polymer production, could be conducted only at the level of overall lifecycle stage. In addition, 4
the identification of specific emission sources responsible for process impacts was totally or partially 5
prevented, and with this also the possibility to thoroughly check any apparently "strange" result. 6
Regarding the modelling of specific EoL options, and especially incineration and landfilling, it was not 7
possible to apply a completely consistent approach across all the assessed scenarios. This is because 8
waste-specific, EF-compliant or GaBi datasets (both developed according to the same modelling 9
approach) are not available for all the investigated plastic materials. Although a waste-specific model 10
(Doka, 2009a, Doka, 2009b) was used to develop LCIs for any missing material, it may be based on a 11
different approach and assumptions (e.g. transfer coefficients, conversion efficiencies, etc.) 12
compared to those applied in the available datasets (which are not disclosed). However, considering 13
the generally moderate contribution of the EoL stage to the overall scenario impacts (not larger than 14
22% in all relevant categories except for Human Toxicity –cancer), the use of a potentially different 15
modelling approach should not involve substantial effects on the results of this specific case study. 16
Focusing more specifically on biological treatment options for biodegradable plastic materials (i.e. 17
composting and anaerobic digestion), the results are bound to the assumptions performed on 18
material degradability during treatment and subsequent land application of composted (or post-19
composted) material. As detailed in Sections 4.4.5.3 and 4.4.5.4, degradability during aerobic and 20
anaerobic treatment was defined according to minimum requirements in relevant EN standards (e.g. 21
EN 13432:2000) and was set to 90% for composting and 50% for anaerobic digestion. However, 22
these values refer to laboratory testing conditions, which may not fully reflect those of real 23
treatment plants. In the case of anaerobic digestion, the mentioned degradation rate was reduced 24
to 35%, according to the biogas yield typically considered for organic waste (70% of anaerobically 25
degradable carbon), which may not be identically applied to plastic materials. Overall, this 26
represents a source of uncertainty that ultimately affects the potential benefits from biological 27
treatments (i.e. carbon supply to soil with compost, and avoided energy generation from biogasified 28
carbon). Moreover, bio-degradation of residual, non-degraded plastic materials in compost applied 29
to soil was only addressed in terms of airborne emissions from carbon degradation. Emissions (and 30
potential impacts) of any non-degradable substance (e.g. additives and metals) could not be 31
quantified, due to the very limited availability of composition data (which are restricted to basic 32
elements). 33
As this screening exercise excluded the impact of any amount of littered product, the obtained 34
framework of results may not provide a full picture of the environmental consequences (advantages 35
or disadvantages) of using a biodegradable material in bottle production rather than a non-36
biodegradable one. However, this omission is deemed to only partially affect this specific case study, 37
as a low share of post-consumer bottles is expected to be littered overall in countries with a well 38
established waste collection system, and PLA is typically biodegraded only under controlled 39
composting conditions. 40
The iLUC effect on climate change impact calculated in this screening may be underestimated. The 41
GHG emission factors used for quantification purposes (derived from Directive 2015/1513 (EC, 42
2015)) were found to fall in the lower end of the range available in the recent literature (see 43
methodology document-Report I-). The reasons for this could be related to the exclusion of 44
intensification-related impacts (i.e. only expansion on nature is included), the assumptions taken in 45
the underlying economic models, and the approach used to handle carbon emissions (i.e. 46
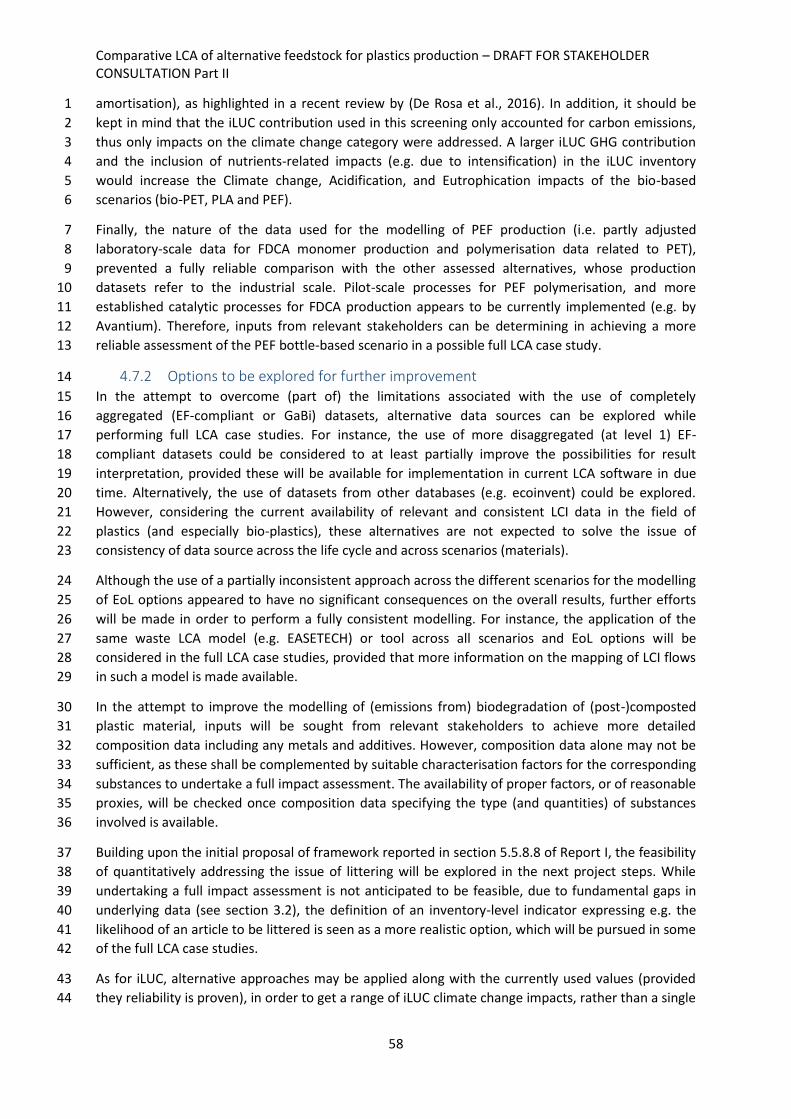
Comparative LCA of alternative feedstock for plastics production – DRAFT FOR STAKEHOLDER CONSULTATION Part II
58
amortisation), as highlighted in a recent review by (De Rosa et al., 2016). In addition, it should be 1
kept in mind that the iLUC contribution used in this screening only accounted for carbon emissions, 2
thus only impacts on the climate change category were addressed. A larger iLUC GHG contribution 3
and the inclusion of nutrients-related impacts (e.g. due to intensification) in the iLUC inventory 4
would increase the Climate change, Acidification, and Eutrophication impacts of the bio-based 5
scenarios (bio-PET, PLA and PEF). 6
Finally, the nature of the data used for the modelling of PEF production (i.e. partly adjusted 7
laboratory-scale data for FDCA monomer production and polymerisation data related to PET), 8
prevented a fully reliable comparison with the other assessed alternatives, whose production 9
datasets refer to the industrial scale. Pilot-scale processes for PEF polymerisation, and more 10
established catalytic processes for FDCA production appears to be currently implemented (e.g. by 11
Avantium). Therefore, inputs from relevant stakeholders can be determining in achieving a more 12
reliable assessment of the PEF bottle-based scenario in a possible full LCA case study. 13
4.7.2 Options to be explored for further improvement 14
In the attempt to overcome (part of) the limitations associated with the use of completely 15
aggregated (EF-compliant or GaBi) datasets, alternative data sources can be explored while 16
performing full LCA case studies. For instance, the use of more disaggregated (at level 1) EF-17
compliant datasets could be considered to at least partially improve the possibilities for result 18
interpretation, provided these will be available for implementation in current LCA software in due 19
time. Alternatively, the use of datasets from other databases (e.g. ecoinvent) could be explored. 20
However, considering the current availability of relevant and consistent LCI data in the field of 21
plastics (and especially bio-plastics), these alternatives are not expected to solve the issue of 22
consistency of data source across the life cycle and across scenarios (materials). 23
Although the use of a partially inconsistent approach across the different scenarios for the modelling 24
of EoL options appeared to have no significant consequences on the overall results, further efforts 25
will be made in order to perform a fully consistent modelling. For instance, the application of the 26
same waste LCA model (e.g. EASETECH) or tool across all scenarios and EoL options will be 27
considered in the full LCA case studies, provided that more information on the mapping of LCI flows 28
in such a model is made available. 29
In the attempt to improve the modelling of (emissions from) biodegradation of (post-)composted 30
plastic material, inputs will be sought from relevant stakeholders to achieve more detailed 31
composition data including any metals and additives. However, composition data alone may not be 32
sufficient, as these shall be complemented by suitable characterisation factors for the corresponding 33
substances to undertake a full impact assessment. The availability of proper factors, or of reasonable 34
proxies, will be checked once composition data specifying the type (and quantities) of substances 35
involved is available. 36
Building upon the initial proposal of framework reported in section 5.5.8.8 of Report I, the feasibility 37
of quantitatively addressing the issue of littering will be explored in the next project steps. While 38
undertaking a full impact assessment is not anticipated to be feasible, due to fundamental gaps in 39
underlying data (see section 3.2), the definition of an inventory-level indicator expressing e.g. the 40
likelihood of an article to be littered is seen as a more realistic option, which will be pursued in some 41
of the full LCA case studies. 42
As for iLUC, alternative approaches may be applied along with the currently used values (provided 43
they reliability is proven), in order to get a range of iLUC climate change impacts, rather than a single 44

Comparative LCA of alternative feedstock for plastics production – DRAFT FOR STAKEHOLDER CONSULTATION Part II
59
point value. Moreover, approaches that allows for quantification of consequences on additional 1
impact categories (due to e.g. intensification) may be explored. 2
Finally, should beverage bottles be selected as an article to undergo a full LCA case study, relevant 3
stakeholders will be invited to provide representative data for FDCA production and subsequent PEF 4
polymerisation, which are closer to real industrial conditions. 5
In conclusion, for this screening case study, stakeholders are invited to provide relevant inputs on 6
the following aspects (other than on any performed methodological choice): i) (more) detailed 7
composition data for (bottle grade) PLA and PEF, especially with regard to metals, and additives used 8
during polymerisation and preform production (if any); and ii) input/output data for FDCA 9
production and subsequent PEF polymerisation, suitable for building an LCI as closest as possible to 10
real industrial conditions, thus improving reliability of results in the comparison with alternative 11
bottle materials. 12
13
Comparative LCA of alternative feedstock for plastics production – DRAFT FOR STAKEHOLDER CONSULTATION Part II
60
5. Case study 2: flexible food packaging film 1
5.1 Assessed scenarios 2
The different combinations of material and feedstock explored in the scenarios selected for the food 3
flexible packaging film screening case study are summarised in 4
Comparative LCA of alternative feedstock for plastics production – DRAFT FOR STAKEHOLDER CONSULTATION Part II
61
Table 17, which also reports the EoL options assessed for each scenario. Conventional, fossil-based 1
materials considered as a reference for packaging film manufacturing are, polypropylene (PP, 2
Scenario 1) and low-density polyethylene (LDPE; Scenario 2). A fully bio-based, drop-in alternative to 3
the latter material (bio-LDPE) is modelled in Scenario 3, where bio-ethylene derived from Brazilian 4
sugarcane is used as a feedstock. Two additional bio-based alternative materials are also considered, 5
i.e. PLA (totally bio-based, Scenario 3) and a starch-based copolyester (partially bio-based, scenario 6
4). These materials are characterised by an oxygen transmission rate similar to that of (oriented) PP, 7
and represent a possible alternative to the latter in food packaging applications (e.g. for fresh(-cut) 8
vegetable packaging). On the other hand, the water vapour transmission rate of PLA and starch-9
based copolyesters is normally higher compared to PP, and this may be beneficial for products with 10
high respiration rates. As for the beverage bottle case study, PLA derived from US maize was 11
modelled, while starch used for copolyester production is derived from European maize (one of the 12
largest producers of this type of starch blends is located Europe). 13
The use of an innovative feedstock for PP production, i.e. CO2 captured from point emission sources, 14
is finally explored in scenario 6. Capture from coal-fired power plants and cement kilns (the two 15
largest stationary sources of CO2 emissions according to IPCC, 2005) was specifically considered. 16
Captured CO2 is then converted to methanol and, finally, to propylene via the methanol-to-olefin 17
route. Due to the innovative nature of this alternative route, LCI data used in the modelling mostly 18
derive from process simulation and modelling exercise found in the literature, rather than real 19
production facilities. Therefore, a fully appropriate and consistent comparison with the other 20
scenarios assessed for this case study could not be ensured. 21
22

Comparative LCA of alternative feedstock for plastics production – DRAFT FOR STAKEHOLDER CONSULTATION Part II
62
Table 17: LCA scenarios assessed for the food flexible packaging film screening case study 1
Scenario Polymer Monomer/Co-polymer Feedstock EoL options(a)
1 - Conventional polymer 1
PP Propylene Fossil-based (oil/natural gas)
Recycling Incineration Landfilling
2 - Conventional polymer 2
LDPE Ethylene Fossil-based (oil/natural gas)
Recycling Incineration Landfilling
3 - Alternative polymer 1 Bio-LDPE Bio-ethylene Sugarcane (Brazil) Recycling Incineration Landfilling
4 - Alternative polymer 2 PLA Lactic Acid Maize (USA) Recycling Composting (Industrial) Anaerobic digestion Incineration Landfilling
5 - Alternative polymer 3 Starch-based polymer
Starch Co-polyester (biodegradable)
Corn (EU) Fossil-based
Composting (Industrial) Anaerobic digestion Incineration Landfilling
6 - Alternative polymer 4 CO2-based PP Propylene CO2 (coal fired power plant; cement kiln)
Recycling Incineration Landfilling
(a) The impacts of scenarios were individually assessed for each listed EoL option, as well as for a 2 combination of such options reflecting as far as possible the average situation at the EU level. 3
5.2 Functional unit and reference flow 4
The main function of the studied article would be, once converted into a specific packaging item 5
with a defined size and product content, the delivery of the specific packaged product to final 6
customers. A possible functional could thus be "delivering 1 kg of packaged product ensuring the 7
same overall product (shelf) life". However, given the broader focus of this screening case study on 8
generic food packaging film, rather than on film for packing a specific product11, a more general, 9
extension-based functional unit (usually referred to as declared unit) has been chosen, i.e. "100 m2 10
of food flexible packaging film with an average thickness of 30 µm and ensuring a similar overall 11
shelf life of the packaged product". 12
According to the abovementioned article-based approach, we also avoided the definition of a 13
narrower functional (declared) unit, requiring, e.g. specific values of mechanical and barrier 14
properties such as tensile strength, oxygen transmission rate, or water vapour transmission rate. 15
This would require, again, restricting the scope of the assessment to specific food products, while 16
the aim of this screening exercise is rather to explore the widest, reasonable range of materials and 17
feedstocks available for a given application. We therefore assumed that, whenever one of the 18
examined film material is used for a given food product, all available technical solutions required to 19
11 In line with the overall project objectives, the focus of screening (and full) is on generic plastic articles (e.g. beverage bottles), rather than on specific products (e.g. water bottles). This choice was made in order to have more flexibility in the combinations of materials and feedstocks (as well as EoL options) assessable within a single case study, compared to focusing on specific products.

Comparative LCA of alternative feedstock for plastics production – DRAFT FOR STAKEHOLDER CONSULTATION Part II
63
make its mechanical and permeability properties suitable for that product would be undertaken. For 1
instance, perforation is performed on LDPE film if it is to be used for high-respiration vegetables 2
requiring higher gas permeability. Conversely, a barrier layer could be added to a highly permeable 3
material (e.g. PLA), if it was to be used for products demanding lower gas transmission rates. 4
The reference flow of each scenario (i.e. the amount of film material required in order to fulfil the 5
functional unit), was calculated based on specific material densities and the required film thickness 6
(30 µm; Table 18). It is clear that this calculation procedure results in higher demand of polymer(s) 7
per functional unit for those materials with higher densities. In this regard, it may be argued that 8
denser materials may require a lower thickness to achieve a defined mechanical performance. 9
However, there was no clear evidence showing that denser materials are used in films with lower 10
thicknesses. 11
Table 18: Reference flow calculation for each food flexible packaging film LCA scenario 12
Material Density (g/cm3) Reference flow (kg/FU)
PP (fossil-based, CO2-based)
0.9 2.7
LDPE (fossil-based, bio-based)
0.927 2,78
PLA 1.24 3.72
Starch-based copolymer 1.22 3.66
13
5.3 System boundary 14
In all scenarios, the system boundary was set in order to cover the most relevant stages of the full 15
product life cycle (cradle-to-grave perspective). Relevant transport activities between the different 16
life cycle stages were considered in the study, as was the indirect land use change of crops. The use 17
stage is excluded, as other than being the same for all the examined product systems, it can be 18
assumed to involve negligible burdens. It has also to be noted that additives were not included in the 19
assessment, due to lack of (consistent) data and information on the use of additives for the 20
examined plastic materials, and for plastics in general. This is acknowledged as a limitation of this 21
screening study, as additive production can account for a non-negligible portion of climate impact 22
(up to 45%, see section 2.3.2.10 in Report I). Moreover, additives can also be relevant at the end-of-23
life stage, where they can be released, as such or after degradation/conversion into different 24
compound(s), in the environment (i.e. the soil in case of biodegradable plastics routed to biological 25
treatments or subject to in-situ degradation). 26
27

Comparative LCA of alternative feedstock for plastics production – DRAFT FOR STAKEHOLDER CONSULTATION Part II
64
1
Oil extraction & refining
Production of propylene Energy
Energy production
Waste
Recycling
Incineration
Landfilling EnergyEnergy
production
Production of Polypropylene
PP
Production of bottles
PP Resource extraction
Resource extraction
Recycled Material*
ProductionResource extraction
Consumer
2
Figure 13: System boundary for fossil-based PP food flexible packaging film (Scenario 1). (*) Handled according to the Circular Footprint Formula 3
Oil extraction & refining
Production of Ethylene Energy
Energy production
Waste
Recycling
Incineration
Landfilling EnergyEnergy
production
Production of LDPE
Production of LDPE film
LDPE Resource extraction
Resource extraction
Recycled Material*
ProductionResource extraction
Consumer
4
Figure 14: System boundary for fossil-based LDPE food flexible packaging film (Scenario 2). (*) Handled according to the Circular Footprint Formula 5

Comparative LCA of alternative feedstock for plastics production – DRAFT FOR STAKEHOLDER CONSULTATION Part II
65
iLUC
Production of bioethanol
Sugarcane cultivation
EnergyEnergy
production
Waste
Recycling
Incineration
Landfilling EnergyEnergy
production
Production of Bio-based
LDPE
Production of LDPE film
LDPE Resource extraction
Resource extraction
Recycled Material*
ProductionResource extraction
Consumer
1
Figure 15: System boundary for bio-based LDPE food flexible packaging film (Scenario 3). (*) Handled according to the Circular Footprint Formula 2
iLUC
Production of PLA
Sugarcane cultivation
EnergyEnergy
production
Waste
Recycling
Incineration
Landfilling EnergyEnergy
production
Production of PLA film
Resource extraction
Resource extraction
Recycled Material*
ProductionResource extraction
Consumer
Composting
Anaerobic Digestion
Energy production
EnergyResource extraction
PLA
Compost
Digestate
3
Figure 16: System boundary for bio-based PLA food flexible packaging film (Scenario 4). (*) Handled according to the Circular Footprint Formula 4

Comparative LCA of alternative feedstock for plastics production – DRAFT FOR STAKEHOLDER CONSULTATION Part II
66
iLUC
Production of starch
Maize cultivation
EnergyEnergy
production
Waste
Anaerobic Digestion
Incineration
Landfilling EnergyEnergy
production
Production of starch-based
film
Resource extraction
Resource extraction
EnergyEnergy
productionResource extraction
Consumer
Composting
Starch
Compost
1
Figure 17: System boundary for starch-based food flexible packaging film (Scenario 5) 2
Production of PP film Energy
Energy production
CO2 stream
Recycling
Incineration
Landfilling EnergyEnergy
production
Waste Resource extraction
Resource extraction
Recycled Material*
ProductionResource extraction
Production of PP
PPConsumer
Capture and Production of
PP
3
Figure 18: System boundary for CO2-based PP food flexible packaging film (Scenario 6). (*) Handled according to the Circular Footprint Formula 4
5

Comparative LCA of alternative feedstock for plastics production – DRAFT FOR STAKEHOLDER CONSULTATION Part II
67
5.4 Life Cycle Inventory 1
This section describes the overall approach for building the LCI of the analysed scenarios, along with 2
related assumptions and data sources. The description is separated by major lifecycle stages. The list 3
of processes and related data sources are provided in Tables 19 to 24. 4
5
6
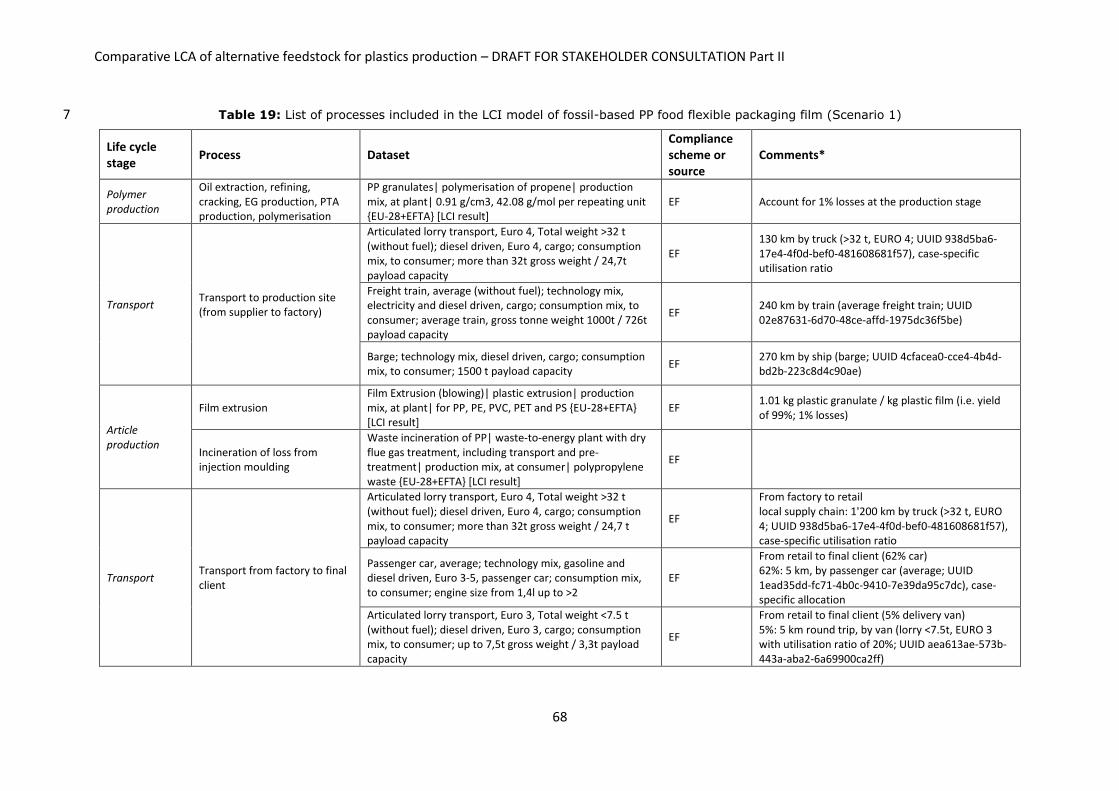
Comparative LCA of alternative feedstock for plastics production – DRAFT FOR STAKEHOLDER CONSULTATION Part II
68
Table 19: List of processes included in the LCI model of fossil-based PP food flexible packaging film (Scenario 1) 7
Life cycle stage
Process Dataset Compliance scheme or source
Comments*
Polymer production
Oil extraction, refining, cracking, EG production, PTA production, polymerisation
PP granulates| polymerisation of propene| production mix, at plant| 0.91 g/cm3, 42.08 g/mol per repeating unit {EU-28+EFTA} [LCI result]
EF Account for 1% losses at the production stage
Transport Transport to production site (from supplier to factory)
Articulated lorry transport, Euro 4, Total weight >32 t (without fuel); diesel driven, Euro 4, cargo; consumption mix, to consumer; more than 32t gross weight / 24,7t payload capacity
EF 130 km by truck (>32 t, EURO 4; UUID 938d5ba6-17e4-4f0d-bef0-481608681f57), case-specific utilisation ratio
Freight train, average (without fuel); technology mix, electricity and diesel driven, cargo; consumption mix, to consumer; average train, gross tonne weight 1000t / 726t payload capacity
EF 240 km by train (average freight train; UUID 02e87631-6d70-48ce-affd-1975dc36f5be)
Barge; technology mix, diesel driven, cargo; consumption mix, to consumer; 1500 t payload capacity
EF 270 km by ship (barge; UUID 4cfacea0-cce4-4b4d-bd2b-223c8d4c90ae)
Article production
Film extrusion Film Extrusion (blowing)| plastic extrusion| production mix, at plant| for PP, PE, PVC, PET and PS {EU-28+EFTA} [LCI result]
EF 1.01 kg plastic granulate / kg plastic film (i.e. yield of 99%; 1% losses)
Incineration of loss from injection moulding
Waste incineration of PP| waste-to-energy plant with dry flue gas treatment, including transport and pre-treatment| production mix, at consumer| polypropylene waste {EU-28+EFTA} [LCI result]
EF
Transport Transport from factory to final client
Articulated lorry transport, Euro 4, Total weight >32 t (without fuel); diesel driven, Euro 4, cargo; consumption mix, to consumer; more than 32t gross weight / 24,7 t payload capacity
EF
From factory to retail local supply chain: 1'200 km by truck (>32 t, EURO 4; UUID 938d5ba6-17e4-4f0d-bef0-481608681f57), case-specific utilisation ratio
Passenger car, average; technology mix, gasoline and diesel driven, Euro 3-5, passenger car; consumption mix, to consumer; engine size from 1,4l up to >2
EF
From retail to final client (62% car) 62%: 5 km, by passenger car (average; UUID 1ead35dd-fc71-4b0c-9410-7e39da95c7dc), case-specific allocation
Articulated lorry transport, Euro 3, Total weight <7.5 t (without fuel); diesel driven, Euro 3, cargo; consumption mix, to consumer; up to 7,5t gross weight / 3,3t payload capacity
EF
From retail to final client (5% delivery van) 5%: 5 km round trip, by van (lorry <7.5t, EURO 3 with utilisation ratio of 20%; UUID aea613ae-573b-443a-aba2-6a69900ca2ff)
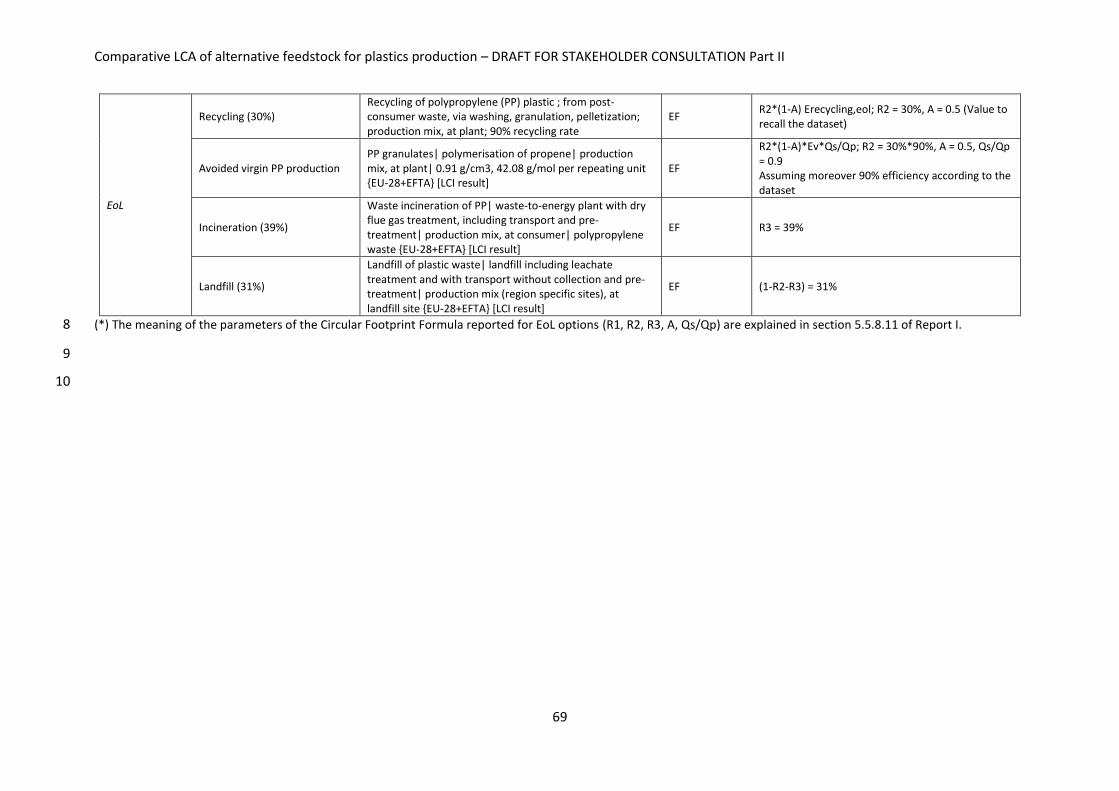
Comparative LCA of alternative feedstock for plastics production – DRAFT FOR STAKEHOLDER CONSULTATION Part II
69
EoL
Recycling (30%) Recycling of polypropylene (PP) plastic ; from post-consumer waste, via washing, granulation, pelletization; production mix, at plant; 90% recycling rate
EF R2*(1-A) Erecycling,eol; R2 = 30%, A = 0.5 (Value to recall the dataset)
Avoided virgin PP production PP granulates| polymerisation of propene| production mix, at plant| 0.91 g/cm3, 42.08 g/mol per repeating unit {EU-28+EFTA} [LCI result]
EF
R2*(1-A)*Ev*Qs/Qp; R2 = 30%*90%, A = 0.5, Qs/Qp = 0.9 Assuming moreover 90% efficiency according to the dataset
Incineration (39%)
Waste incineration of PP| waste-to-energy plant with dry flue gas treatment, including transport and pre-treatment| production mix, at consumer| polypropylene waste {EU-28+EFTA} [LCI result]
EF R3 = 39%
Landfill (31%)
Landfill of plastic waste| landfill including leachate treatment and with transport without collection and pre-treatment| production mix (region specific sites), at landfill site {EU-28+EFTA} [LCI result]
EF (1-R2-R3) = 31%
(*) The meaning of the parameters of the Circular Footprint Formula reported for EoL options (R1, R2, R3, A, Qs/Qp) are explained in section 5.5.8.11 of Report I. 8
9
10
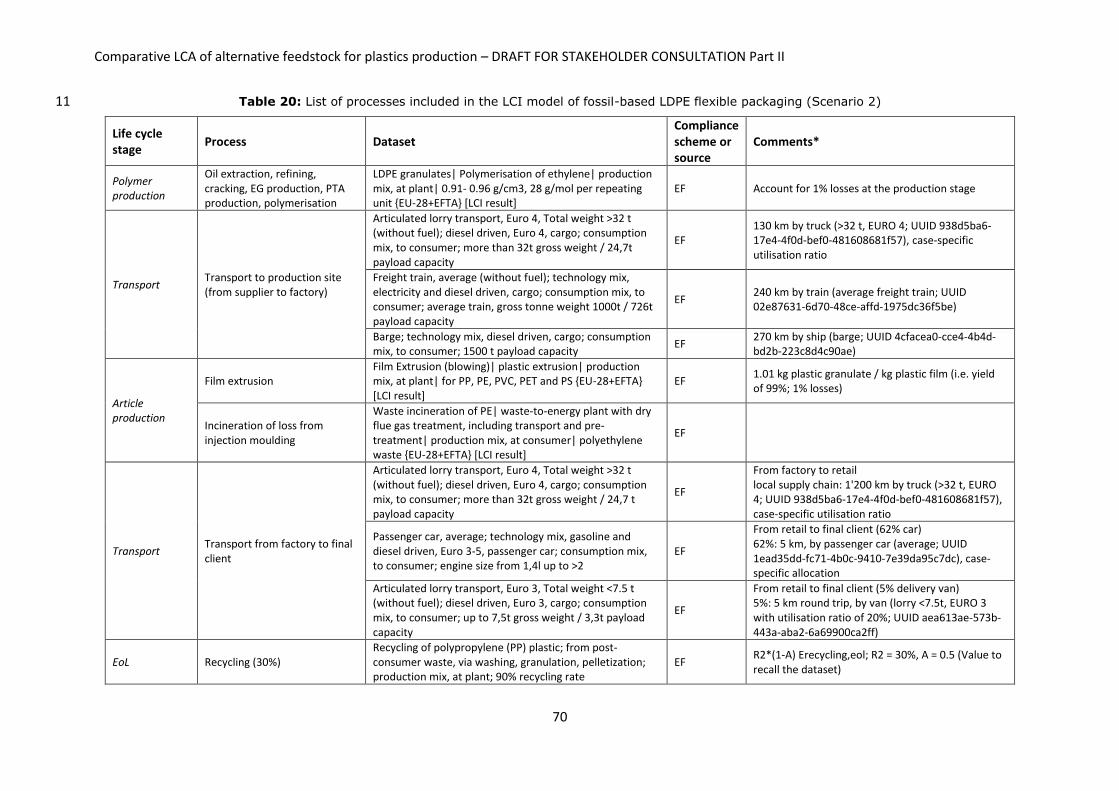
Comparative LCA of alternative feedstock for plastics production – DRAFT FOR STAKEHOLDER CONSULTATION Part II
70
Table 20: List of processes included in the LCI model of fossil-based LDPE flexible packaging (Scenario 2) 11
Life cycle stage
Process Dataset Compliance scheme or source
Comments*
Polymer production
Oil extraction, refining, cracking, EG production, PTA production, polymerisation
LDPE granulates| Polymerisation of ethylene| production mix, at plant| 0.91- 0.96 g/cm3, 28 g/mol per repeating unit {EU-28+EFTA} [LCI result]
EF Account for 1% losses at the production stage
Transport Transport to production site (from supplier to factory)
Articulated lorry transport, Euro 4, Total weight >32 t (without fuel); diesel driven, Euro 4, cargo; consumption mix, to consumer; more than 32t gross weight / 24,7t payload capacity
EF 130 km by truck (>32 t, EURO 4; UUID 938d5ba6-17e4-4f0d-bef0-481608681f57), case-specific utilisation ratio
Freight train, average (without fuel); technology mix, electricity and diesel driven, cargo; consumption mix, to consumer; average train, gross tonne weight 1000t / 726t payload capacity
EF 240 km by train (average freight train; UUID 02e87631-6d70-48ce-affd-1975dc36f5be)
Barge; technology mix, diesel driven, cargo; consumption mix, to consumer; 1500 t payload capacity
EF 270 km by ship (barge; UUID 4cfacea0-cce4-4b4d-bd2b-223c8d4c90ae)
Article production
Film extrusion Film Extrusion (blowing)| plastic extrusion| production mix, at plant| for PP, PE, PVC, PET and PS {EU-28+EFTA} [LCI result]
EF 1.01 kg plastic granulate / kg plastic film (i.e. yield of 99%; 1% losses)
Incineration of loss from injection moulding
Waste incineration of PE| waste-to-energy plant with dry flue gas treatment, including transport and pre-treatment| production mix, at consumer| polyethylene waste {EU-28+EFTA} [LCI result]
EF
Transport Transport from factory to final client
Articulated lorry transport, Euro 4, Total weight >32 t (without fuel); diesel driven, Euro 4, cargo; consumption mix, to consumer; more than 32t gross weight / 24,7 t payload capacity
EF
From factory to retail local supply chain: 1'200 km by truck (>32 t, EURO 4; UUID 938d5ba6-17e4-4f0d-bef0-481608681f57), case-specific utilisation ratio
Passenger car, average; technology mix, gasoline and diesel driven, Euro 3-5, passenger car; consumption mix, to consumer; engine size from 1,4l up to >2
EF
From retail to final client (62% car) 62%: 5 km, by passenger car (average; UUID 1ead35dd-fc71-4b0c-9410-7e39da95c7dc), case-specific allocation
Articulated lorry transport, Euro 3, Total weight <7.5 t (without fuel); diesel driven, Euro 3, cargo; consumption mix, to consumer; up to 7,5t gross weight / 3,3t payload capacity
EF
From retail to final client (5% delivery van) 5%: 5 km round trip, by van (lorry <7.5t, EURO 3 with utilisation ratio of 20%; UUID aea613ae-573b-443a-aba2-6a69900ca2ff)
EoL Recycling (30%) Recycling of polypropylene (PP) plastic; from post-consumer waste, via washing, granulation, pelletization; production mix, at plant; 90% recycling rate
EF R2*(1-A) Erecycling,eol; R2 = 30%, A = 0.5 (Value to recall the dataset)

Comparative LCA of alternative feedstock for plastics production – DRAFT FOR STAKEHOLDER CONSULTATION Part II
71
Avoided virgin LDPE production LDPE granulates| Polymerisation of ethylene| production mix, at plant| 0.91- 0.96 g/cm3, 28 g/mol per repeating unit {EU-28+EFTA} [LCI result]
EF
R2*(1-A)*Ev*Qs/Qp; R2 = 30%*90%, A = 0.5, Qs/Qp = 0.9 Assuming moreover 90% efficiency according to the dataset
Incineration (39%)
Waste incineration of PE| waste-to-energy plant with dry flue gas treatment, including transport and pre-treatment| production mix, at consumer| polyethylene waste {EU-28+EFTA} [LCI result]
EF R3 = 39%
Landfill (31%)
Landfill of plastic waste| landfill including leachate treatment and with transport without collection and pre-treatment| production mix (region specific sites), at landfill site {EU-28+EFTA} [LCI result]
EF (1-R2-R3) = 31%
(*) The meaning of the parameters of the Circular Footprint Formula reported for EoL options (R1, R2, R3, A, Qs/Qp) are explained in section 5.5.8.11 of Report I. 12
13
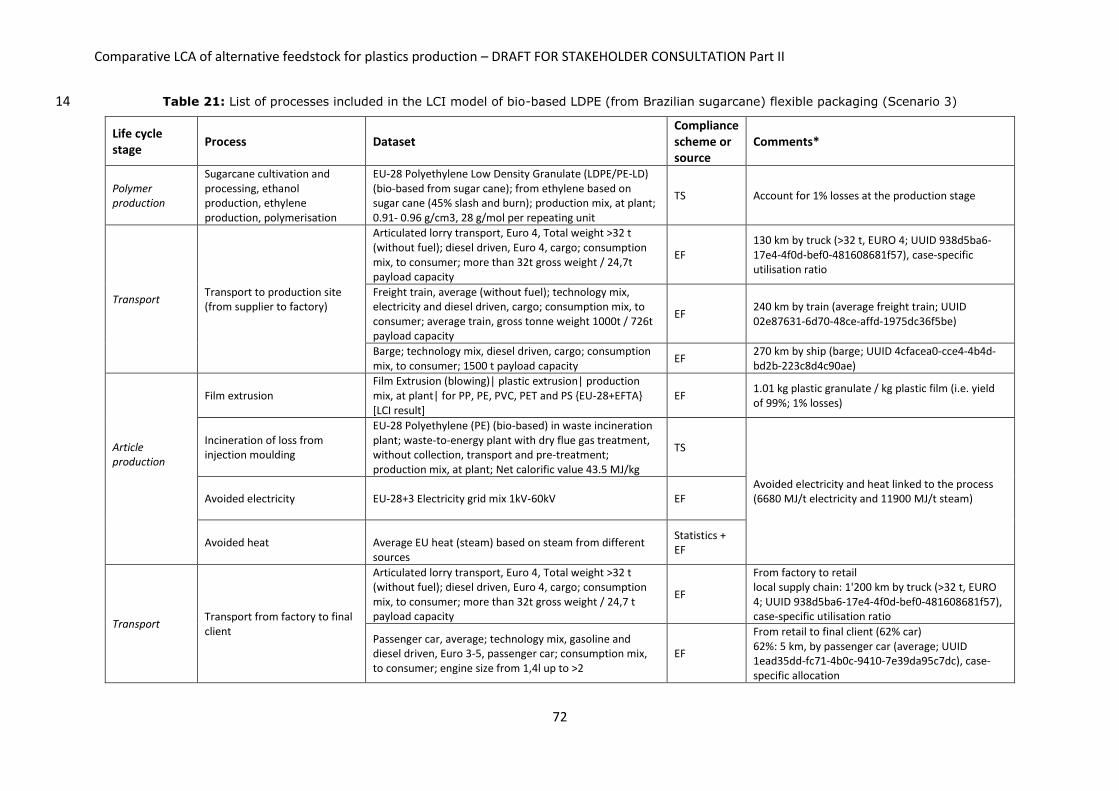
Comparative LCA of alternative feedstock for plastics production – DRAFT FOR STAKEHOLDER CONSULTATION Part II
72
Table 21: List of processes included in the LCI model of bio-based LDPE (from Brazilian sugarcane) flexible packaging (Scenario 3) 14
Life cycle stage
Process Dataset Compliance scheme or source
Comments*
Polymer production
Sugarcane cultivation and processing, ethanol production, ethylene production, polymerisation
EU-28 Polyethylene Low Density Granulate (LDPE/PE-LD) (bio-based from sugar cane); from ethylene based on sugar cane (45% slash and burn); production mix, at plant; 0.91- 0.96 g/cm3, 28 g/mol per repeating unit
TS Account for 1% losses at the production stage
Transport Transport to production site (from supplier to factory)
Articulated lorry transport, Euro 4, Total weight >32 t (without fuel); diesel driven, Euro 4, cargo; consumption mix, to consumer; more than 32t gross weight / 24,7t payload capacity
EF 130 km by truck (>32 t, EURO 4; UUID 938d5ba6-17e4-4f0d-bef0-481608681f57), case-specific utilisation ratio
Freight train, average (without fuel); technology mix, electricity and diesel driven, cargo; consumption mix, to consumer; average train, gross tonne weight 1000t / 726t payload capacity
EF 240 km by train (average freight train; UUID 02e87631-6d70-48ce-affd-1975dc36f5be)
Barge; technology mix, diesel driven, cargo; consumption mix, to consumer; 1500 t payload capacity
EF 270 km by ship (barge; UUID 4cfacea0-cce4-4b4d-bd2b-223c8d4c90ae)
Article production
Film extrusion Film Extrusion (blowing)| plastic extrusion| production mix, at plant| for PP, PE, PVC, PET and PS {EU-28+EFTA} [LCI result]
EF 1.01 kg plastic granulate / kg plastic film (i.e. yield of 99%; 1% losses)
Incineration of loss from injection moulding
EU-28 Polyethylene (PE) (bio-based) in waste incineration plant; waste-to-energy plant with dry flue gas treatment, without collection, transport and pre-treatment; production mix, at plant; Net calorific value 43.5 MJ/kg
TS
Avoided electricity and heat linked to the process (6680 MJ/t electricity and 11900 MJ/t steam) Avoided electricity EU-28+3 Electricity grid mix 1kV-60kV EF
Avoided heat Average EU heat (steam) based on steam from different sources
Statistics + EF
Transport Transport from factory to final client
Articulated lorry transport, Euro 4, Total weight >32 t (without fuel); diesel driven, Euro 4, cargo; consumption mix, to consumer; more than 32t gross weight / 24,7 t payload capacity
EF
From factory to retail local supply chain: 1'200 km by truck (>32 t, EURO 4; UUID 938d5ba6-17e4-4f0d-bef0-481608681f57), case-specific utilisation ratio
Passenger car, average; technology mix, gasoline and diesel driven, Euro 3-5, passenger car; consumption mix, to consumer; engine size from 1,4l up to >2
EF
From retail to final client (62% car) 62%: 5 km, by passenger car (average; UUID 1ead35dd-fc71-4b0c-9410-7e39da95c7dc), case-specific allocation

Comparative LCA of alternative feedstock for plastics production – DRAFT FOR STAKEHOLDER CONSULTATION Part II
73
Articulated lorry transport, Euro 3, Total weight <7.5 t (without fuel); diesel driven, Euro 3, cargo; consumption mix, to consumer; up to 7,5t gross weight / 3,3t payload capacity
EF
From retail to final client (5% delivery van) 5%: 5 km round trip, by van (lorry <7.5t, EURO 3 with utilisation ratio of 20%; UUID aea613ae-573b-443a-aba2-6a69900ca2ff)
EoL
Recycling (30%) Recycling of polypropylene (PP) plastic ; from post-consumer waste, via washing, granulation, pelletization; production mix, at plant; 90% recycling rate
EF R2*(1-A) Erecycling,eol; R2 = 30%, A = 0.5 (Value to recall the dataset)
Avoided virgin LDPE production LDPE granulates| Polymerisation of ethylene| production mix, at plant| 0.91- 0.96 g/cm3, 28 g/mol per repeating unit {EU-28+EFTA} [LCI result]
EF
R2*(1-A)*Ev*Qs/Qp; R2 = 30%*90%, A = 0.5, Qs/Qp = 0.9 Assuming moreover 90% efficiency according to the dataset
Incineration (39%)
EU-28 Polyethylene (PE) (biobased) in waste incineration plant; waste-to-energy plant with dry flue gas treatment, without collection, transport and pre-treatment; production mix, at plant; Net calorific value 43.5 MJ/kg
EF R3 = 39%
Avoided electricity EU-28+3 Electricity grid mix 1kV-60kV EF
Avoided heat Average EU heat (steam) based on steam from different sources
Statistics + EF
Landfill (31%)
Landfill of plastic waste| landfill including leachate treatment and with transport without collection and pre-treatment| production mix (region specific sites), at landfill site {EU-28+EFTA} [LCI result]
EF (1-R2-R3) = 31% Fossil CO2 set as zero in the dataset, replaced with biogenic CO2
(*) The meaning of the parameters of the Circular Footprint Formula reported for EoL options (R1, R2, R3, A, Qs/Qp) are explained in section 5.5.8.11 of Report I. 15
16

Comparative LCA of alternative feedstock for plastics production – DRAFT FOR STAKEHOLDER CONSULTATION Part II
74
Table 22: List of processes included in the LCI model of bio-based PLA flexible packaging (Scenario 4) 17
Life cycle stage
Process Dataset Compliance scheme or source
Comments*
Polymer production
Corn cultivation & wet milling, LA production (dextrose fermentation), lactide formation, polymerisation
US Ingeo Polylactide (PLA) biopolymer production
TS
LCI based on the latest eco-profile for Ingeo (PLA) from NatureWorks, with updated background data from GaBi DB. For the corn wet milling stage process subdivision into 11 sub-processes is applied first and remainig co-prducts are handled via mass allocation. During LA production gypsum is generated as co-product and is assumed to replace mined gypsum. Account for 1% losses at the production stage
Transport Transport to production site (from supplier to factory)
Articulated lorry transport, Euro 4, Total weight >32 t (without fuel); diesel driven, Euro 4, cargo; consumption mix, to consumer; more than 32t gross weight / 24,7t payload capacity
EF
1000 km by truck (>32 t, EURO 4; UUID 938d5ba6-17e4-4f0d-bef0-481608681f57), for the sum of distances from harbour/airport to factory outside and inside Europe. case-specific utilisation ratio
Freight train, average (without fuel); technology mix, electricity and diesel driven, cargo; consumption mix, to consumer; average train, gross tonne weight 1000t / 726t payload capacity
EF 6000 km by ship (transoceanic container; UUID 6ca61112-1d5b-473c-abfa-4accc66a8a63)
Barge; technology mix, diesel driven, cargo; consumption mix, to consumer; 1500 t payload capacity
EF
1000 km by truck (>32 t, EURO 4; UUID 938d5ba6-17e4-4f0d-bef0-481608681f57), for the sum of distances from harbour/airport to factory outside and inside Europe. case-specific utilisation ratio
Article production
Film extrusion Film Extrusion (blowing)| plastic extrusion| production mix, at plant| for PP, PE, PVC, PET and PS {EU-28+EFTA} [LCI result]
EF 1.01 kg plastic granulate / kg plastic film (i.e. yield of 99%; 1% losses)
Incineration of loss from injection moulding
EU-28 Polylactic acid (PLA) in waste incineration plant
TS
Avoided electricity and heat linked to the process (2600 MJ/t electricity and 4680 MJ/t steam)
Avoided electricity EU-28+3 Electricity grid mix 1kV-60kV EF
Avoided heat Average EU heat (steam) based on steam from different sources
Statistics + EF
Transport Transport from factory to final client
Articulated lorry transport, Euro 4, Total weight >32 t (without fuel); diesel driven, Euro 4, cargo; consumption mix, to consumer; more than 32t gross weight / 24,7 t payload capacity
EF
From factory to retail local supply chain: 1'200 km by truck (>32 t, EURO 4; UUID 938d5ba6-17e4-4f0d-bef0-481608681f57), case-specific utilisation ratio

Comparative LCA of alternative feedstock for plastics production – DRAFT FOR STAKEHOLDER CONSULTATION Part II
75
Passenger car, average; technology mix, gasoline and diesel driven, Euro 3-5, passenger car; consumption mix, to consumer; engine size from 1,4l up to >2
EF From retail to final client (62% car) 62%: 5 km, by passenger car (average; UUID 1ead35dd-fc71-4b0c-9410-7e39da95c7dc), case-specific allocation
Articulated lorry transport, Euro 3, Total weight <7.5 t (without fuel); diesel driven, Euro 3, cargo; consumption mix, to consumer; up to 7,5t gross weight / 3,3t payload capacity
EF From retail to final client (5% delivery van) 5%: 5 km round trip, by van (lorry <7.5t, EURO 3 with utilisation ratio of 20%; UUID aea613ae-573b-443a-aba2-6a69900ca2ff)
EoL
Recycling (15%)
Recycling of polypropylene (PP) plastic; from post-consumer waste, via washing, granulation, pelletization; production mix, at plant; 90% recycling rate
EF
R2*(1-A) Erecycling,eol; R2 = 15%, A = 0.5 (Value to recall the dataset) The same overall sorting efficiency achieved for conventionally collected plastic film (PP/PE) is assumed (30%); this is equally splitted among recycling (15%) and organic treatment (15%), which is further splitted bewteen composting (13.5%) and AD (1.5%), i.e. 90% composting and 30% AD (ECN, 2018)
Avoided virgin PP production
PP granulates| polymerisation of propene| production mix, at plant| 0.91 g/cm3, 42.08 g/mol per repeating unit {EU-28+EFTA} [LCI result]
EF
In the short term, r-PLA replace PP (or PET), according to BIO-SPRI. R2*(1-A)*Ev*Qs/Qp; R2 = 15%*90%, A = 0.5, Qs/Qp = 0.9 (The same value of Qs/Qp as R-PP/V-PP is assumed) Assuming moreover 90% efficiency according to the dataset
Composting (industrial; 27%)
Background data from Easetech
Anaerobic digestion (3%) Background data from Easetech
Incineration (39%) EU-28 Polylactic acid (PLA) in waste incineration plant
TS R3 = 39%
Avoided electricity EU-28+3 Electricity grid mix 1kV-60kV EF
Avoided heat Average EU heat (steam) based on steam from different sources
Statistics + EF
Landfill (31%) Based on Doka, 2009b (1-R2-R3) = 31%
(*) The meaning of the parameters of the Circular Footprint Formula reported for EoL options (R1, R2, R3, A, Qs/Qp) are explained in section 5.5.8.11 of Report I. 18

Comparative LCA of alternative feedstock for plastics production – DRAFT FOR STAKEHOLDER CONSULTATION Part II
76
Table 23: List of processes included in the LCI model of Starch-copolyester biodegradable polymer (from EU corn) flexible packaging (Scenario 5) 19
Life cycle stage
Process Dataset Compliance scheme or source
Comments*
Polymer production
Corn cultivation & wet milling, copolyesther production, granulate production via extrusion
Dataset developed based on the EI dataset Polyester-complexed starch biopolymer production/RER Corn production: EU-28 Maize (corn grain) production (EF) Wet milling based on the Agrifootprint datasets: -Maize, steeped, from wet milling (receiving and steeping), at plant/US Economic -Maize degermed, from wet milling (degermination), at plant/US Economic -Maize starch and gluten slurry, from wet milling (grinding and screening), at plant/US Economic -Maize starch, wet, from wet milling (gluten recovery), at plant/US Economic
EI (foreground) + EF for background
The background datasets replaced with EF/TS datasets where possible Electricity consumption changed to 0.402 kWh/kg (BioSpri, 2018)
Transport Transport to production site (from supplier to factory)
Articulated lorry transport, Euro 4, Total weight >32 t (without fuel); diesel driven, Euro 4, cargo; consumption mix, to consumer; more than 32t gross weight / 24,7t payload capacity
EF 1300 km by truck (>32 t, EURO 4; UUID 938d5ba6-17e4-4f0d-bef0-481608681f57), case-specific utilisation ratio
Freight train, average (without fuel); technology mix, electricity and diesel driven, cargo; consumption mix, to consumer; average train, gross tonne weight 1000t / 726t payload capacity
EF 240 km by train (average freight train; UUID 02e87631-6d70-48ce-affd-1975dc36f5be)
Barge; technology mix, diesel driven, cargo; consumption mix, to consumer; 1500 t payload capacity
EF 270 km by ship (barge; UUID 4cfacea0-cce4-4b4d-bd2b-223c8d4c90ae)
Article production
Film extrusion Film Extrusion (blowing)| plastic extrusion| production mix, at plant| for PP, PE, PVC, PET and PS {EU-28+EFTA} [LCI result]
EF 1.01 kg plastic granulate / kg plastic film (i.e. yield of 99%; 1% losses)
Incineration of loss from injection moulding
Based on Doka, 2009a TS Avoided electricity and heat linked to the process (2870 MJ/t electricity and 5000 MJ/t steam)
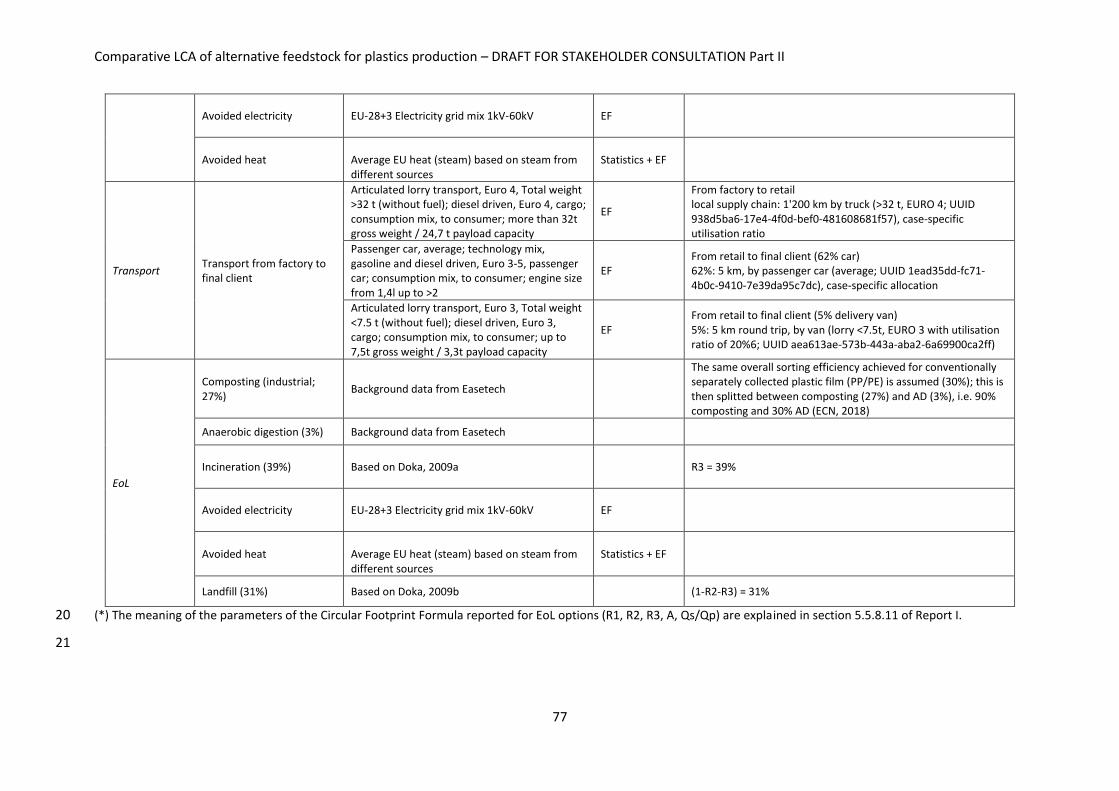
Comparative LCA of alternative feedstock for plastics production – DRAFT FOR STAKEHOLDER CONSULTATION Part II
77
Avoided electricity EU-28+3 Electricity grid mix 1kV-60kV EF
Avoided heat Average EU heat (steam) based on steam from different sources
Statistics + EF
Transport Transport from factory to final client
Articulated lorry transport, Euro 4, Total weight >32 t (without fuel); diesel driven, Euro 4, cargo; consumption mix, to consumer; more than 32t gross weight / 24,7 t payload capacity
EF
From factory to retail local supply chain: 1'200 km by truck (>32 t, EURO 4; UUID 938d5ba6-17e4-4f0d-bef0-481608681f57), case-specific utilisation ratio
Passenger car, average; technology mix, gasoline and diesel driven, Euro 3-5, passenger car; consumption mix, to consumer; engine size from 1,4l up to >2
EF From retail to final client (62% car) 62%: 5 km, by passenger car (average; UUID 1ead35dd-fc71-4b0c-9410-7e39da95c7dc), case-specific allocation
Articulated lorry transport, Euro 3, Total weight <7.5 t (without fuel); diesel driven, Euro 3, cargo; consumption mix, to consumer; up to 7,5t gross weight / 3,3t payload capacity
EF From retail to final client (5% delivery van) 5%: 5 km round trip, by van (lorry <7.5t, EURO 3 with utilisation ratio of 20%6; UUID aea613ae-573b-443a-aba2-6a69900ca2ff)
EoL
Composting (industrial; 27%)
Background data from Easetech
The same overall sorting efficiency achieved for conventionally separately collected plastic film (PP/PE) is assumed (30%); this is then splitted between composting (27%) and AD (3%), i.e. 90% composting and 30% AD (ECN, 2018)
Anaerobic digestion (3%) Background data from Easetech
Incineration (39%) Based on Doka, 2009a R3 = 39%
Avoided electricity EU-28+3 Electricity grid mix 1kV-60kV EF
Avoided heat Average EU heat (steam) based on steam from different sources
Statistics + EF
Landfill (31%) Based on Doka, 2009b (1-R2-R3) = 31%
(*) The meaning of the parameters of the Circular Footprint Formula reported for EoL options (R1, R2, R3, A, Qs/Qp) are explained in section 5.5.8.11 of Report I. 20
21
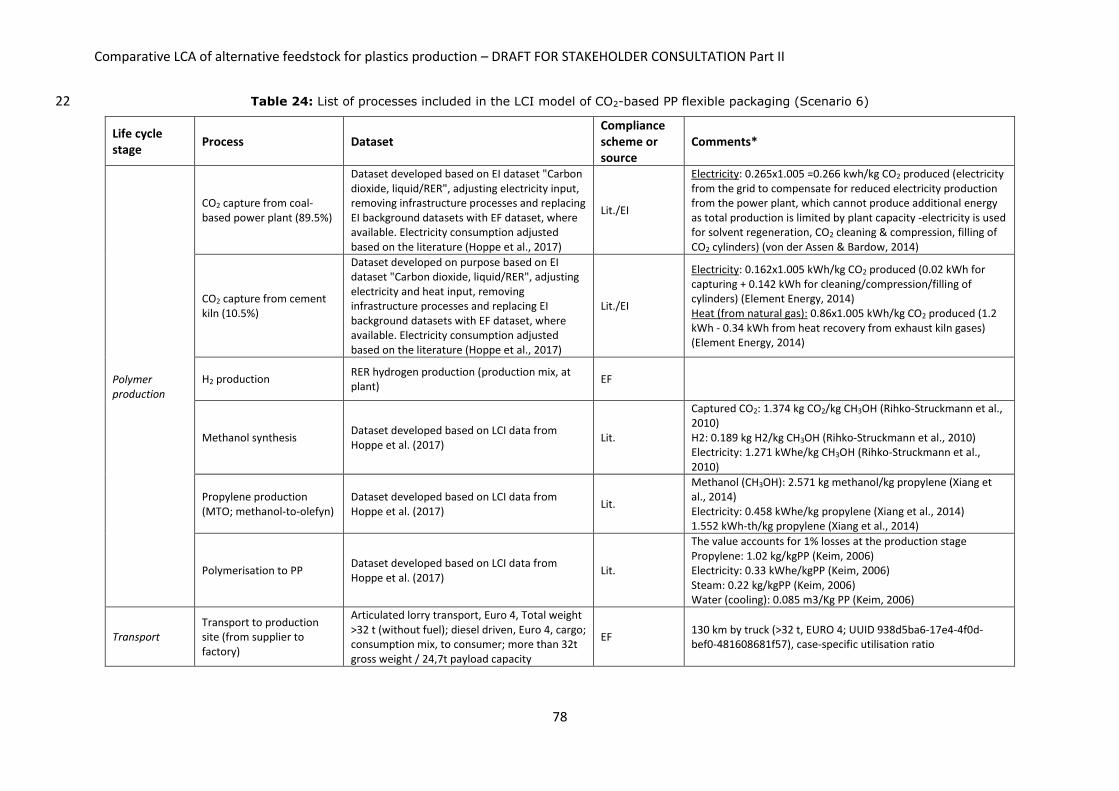
Comparative LCA of alternative feedstock for plastics production – DRAFT FOR STAKEHOLDER CONSULTATION Part II
78
Table 24: List of processes included in the LCI model of CO2-based PP flexible packaging (Scenario 6) 22
Life cycle stage
Process Dataset Compliance scheme or source
Comments*
Polymer production
CO2 capture from coal-based power plant (89.5%)
Dataset developed based on EI dataset "Carbon dioxide, liquid/RER", adjusting electricity input, removing infrastructure processes and replacing EI background datasets with EF dataset, where available. Electricity consumption adjusted based on the literature (Hoppe et al., 2017)
Lit./EI
Electricity: 0.265x1.005 =0.266 kwh/kg CO2 produced (electricity from the grid to compensate for reduced electricity production from the power plant, which cannot produce additional energy as total production is limited by plant capacity -electricity is used for solvent regeneration, CO2 cleaning & compression, filling of CO2 cylinders) (von der Assen & Bardow, 2014)
CO2 capture from cement kiln (10.5%)
Dataset developed on purpose based on EI dataset "Carbon dioxide, liquid/RER", adjusting electricity and heat input, removing infrastructure processes and replacing EI background datasets with EF dataset, where available. Electricity consumption adjusted based on the literature (Hoppe et al., 2017)
Lit./EI
Electricity: 0.162x1.005 kWh/kg CO2 produced (0.02 kWh for capturing + 0.142 kWh for cleaning/compression/filling of cylinders) (Element Energy, 2014) Heat (from natural gas): 0.86x1.005 kWh/kg CO2 produced (1.2 kWh - 0.34 kWh from heat recovery from exhaust kiln gases) (Element Energy, 2014)
H2 production RER hydrogen production (production mix, at plant)
EF
Methanol synthesis Dataset developed based on LCI data from Hoppe et al. (2017)
Lit.
Captured CO2: 1.374 kg CO2/kg CH3OH (Rihko-Struckmann et al., 2010) H2: 0.189 kg H2/kg CH3OH (Rihko-Struckmann et al., 2010) Electricity: 1.271 kWhe/kg CH3OH (Rihko-Struckmann et al., 2010)
Propylene production (MTO; methanol-to-olefyn)
Dataset developed based on LCI data from Hoppe et al. (2017)
Lit.
Methanol (CH3OH): 2.571 kg methanol/kg propylene (Xiang et al., 2014) Electricity: 0.458 kWhe/kg propylene (Xiang et al., 2014) 1.552 kWh-th/kg propylene (Xiang et al., 2014)
Polymerisation to PP Dataset developed based on LCI data from Hoppe et al. (2017)
Lit.
The value accounts for 1% losses at the production stage Propylene: 1.02 kg/kgPP (Keim, 2006) Electricity: 0.33 kWhe/kgPP (Keim, 2006) Steam: 0.22 kg/kgPP (Keim, 2006) Water (cooling): 0.085 m3/Kg PP (Keim, 2006)
Transport Transport to production site (from supplier to factory)
Articulated lorry transport, Euro 4, Total weight >32 t (without fuel); diesel driven, Euro 4, cargo; consumption mix, to consumer; more than 32t gross weight / 24,7t payload capacity
EF 130 km by truck (>32 t, EURO 4; UUID 938d5ba6-17e4-4f0d-bef0-481608681f57), case-specific utilisation ratio

Comparative LCA of alternative feedstock for plastics production – DRAFT FOR STAKEHOLDER CONSULTATION Part II
79
Freight train, average (without fuel); technology mix, electricity and diesel driven, cargo; consumption mix, to consumer; average train, gross tonne weight 1000t / 726t payload capacity
EF 240 km by train (average freight train; UUID 02e87631-6d70-48ce-affd-1975dc36f5be)
Barge; technology mix, diesel driven, cargo; consumption mix, to consumer; 1500 t payload capacity
EF 270 km by ship (barge; UUID 4cfacea0-cce4-4b4d-bd2b-223c8d4c90ae)
Article production
Film extrusion Film Extrusion (blowing)| plastic extrusion| production mix, at plant| for PP, PE, PVC, PET and PS {EU-28+EFTA} [LCI result]
EF 1.01 kg plastic granulate / kg plastic film (i.e. yield of 99%; 1% losses)
Incineration of loss from injection moulding
Waste incineration of PP| waste-to-energy plant with dry flue gas treatment, including transport and pre-treatment| production mix, at consumer| polypropylene waste {EU-28+EFTA} [LCI result]
EF
Transport Transport from factory to final client
Articulated lorry transport, Euro 4, Total weight >32 t (without fuel); diesel driven, Euro 4, cargo; consumption mix, to consumer; more than 32t gross weight / 24,7 t payload capacity
EF
From factory to retail local supply chain: 1'200 km by truck (>32 t, EURO 4; UUID 938d5ba6-17e4-4f0d-bef0-481608681f57), case-specific utilisation ratio
Passenger car, average; technology mix, gasoline and diesel driven, Euro 3-5, passenger car; consumption mix, to consumer; engine size from 1,4l up to >2
EF From retail to final client (62% car) 62%: 5 km, by passenger car (average; UUID 1ead35dd-fc71-4b0c-9410-7e39da95c7dc), case-specific allocation
Articulated lorry transport, Euro 3, Total weight <7.5 t (without fuel); diesel driven, Euro 3, cargo; consumption mix, to consumer; up to 7,5t gross weight / 3,3t payload capacity
EF From retail to final client (5% delivery van) 5%: 5 km round trip, by van (lorry <7.5t, EURO 3 with utilisation ratio of 20%; UUID aea613ae-573b-443a-aba2-6a69900ca2ff)
EoL
Recycling (30%)
Recycling of polypropylene (PP) plastic ; from post-consumer waste, via washing, granulation, pelletization; production mix, at plant; 90% recycling rate
EF R2*(1-A) Erecycling,eol; R2 = 30%, A = 0.5 (Value to recall the dataset)
Avoided virgin PP production
PP granulates| polymerisation of propene| production mix, at plant| 0.91 g/cm3, 42.08 g/mol per repeating unit {EU-28+EFTA} [LCI result]
EF R2*(1-A)*Ev*Qs/Qp; R2 = 30%*90%, A = 0.5, Qs/Qp = 0.9 Assuming moreover 90% efficiency according to the dataset
Incineration (39%)
Waste incineration of PP| waste-to-energy plant with dry flue gas treatment, including transport and pre-treatment| production mix, at consumer| polypropylene waste {EU-
EF R3 = 39%

Comparative LCA of alternative feedstock for plastics production – DRAFT FOR STAKEHOLDER CONSULTATION Part II
80
28+EFTA} [LCI result]
Landfill (31%)
Landfill of plastic waste| landfill including leachate treatment and with transport without collection and pre-treatment| production mix (region specific sites), at landfill site {EU-28+EFTA} [LCI result]
EF (1-R2-R3) = 31%
(*) The meaning of the parameters of the Circular Footprint Formula reported for EoL options (R1, R2, R3, A, Qs/Qp) are explained in section 5.5.8.11 of Report I. 23
24

Comparative LCA of alternative feedstock for plastics production – DRAFT FOR STAKEHOLDER CONSULTATION Part II
81
5.4.1 Polymer production 1
For conventional fossil-based polymers (PP and LDPE), aggregated, cradle-to-gate, EF-compliant LCI 2
datasets were used to model supply at the EU-28 level. These inventories are based on 3
representative industry data collected from PlasticsEurope Eco-profiles. Due to the aggregated 4
nature of such datasets, predefined allocation rules were adopted (e.g. net calorific value- and mass-5
based allocation at the refinery level), and no adjustments could be made. 6
The production of bio-based LDPE was modelled based on an existing, aggregated datasets from 7
GaBi database. Similarly to bio-based MEG used for partially bio-based PET manufacturing (Case 8
study 1), bio-ethylene used for polymerisation is derived from Brazilian sugarcane-based ethanol. In 9
this dataset, 45% of sugarcane is assumed to be manually harvested via the "slash and burn" 10
practice, i.e. sugarcane residues (tops and leaves) are burned on standing plants before harvesting. 11
However, this practice will be legally phased out by 2031 in the State of São Paulo (State Law n. 12
11241/02) and was phased out by 2017 by industrial protocol (Tsiropoulos et al., 2014). No 13
allocation is applied in the system, as bagasse from sugarcane processing is assumed to be used 14
internally to supply electricity and heat for the process itself and subsequent ethanol production. 15
The LCI dataset used for modelling PLA production has been already described for the beverage 16
bottles case study (Case study 1), where the reader is referred to for further details (section 4.4.1). 17
The inventory is available as an aggregated dataset from GaBi database, and is representative of PLA 18
resin produced in Nebraska by NatureWorks LLC (under the commercial name of Ingeo®). 19
For the production of starch-based copolymer, the ecoinvent dataset Polyester-complexed starch 20
biopolymer production/RER, was used as a source of foreground inventory data. The inventory 21
approximates the production of Materbi®, based on calculations and extrapolations of highly 22
aggregated data from an Environmental Product Declaration dating back to 2004. Moreover, as the 23
actual copolyester is not known, in such inventory its production burdens were approximated with 24
those of naphtha production, which may only be a very rough proxy for the real copolymer. Hence, 25
in a possible full LCA case study including starch-based copolymers, this modelling approach may 26
need to be checked further and potentially updated. 27
28
Compared to the original ecoinvent dataset, background inventory datasets were replaced with 29
existing EF-compliant datasets, when available, in the attempt to ensure a consistent modelling 30
(within the scenario and across scenarios). In particular, for maize starch production, a specific 31
background dataset was developed by combining the sub-processes of: (i) maize cultivation in the 32
EU (EF-compliant dataset), and (ii) starch production via wet milling of maize (based on foreground 33
data from Agrifootprint database and background EF-compliant datasets). Infrastructure processes 34
were removed. 35
Captured-CO2 used as a feedstock for PP production via the methanol-to-olefin route was assumed 36
to be a waste stream from the point source generating the emission. Therefore, no upstream 37
burdens (from e.g. coal extraction and combustion in a power plant) were attributed to such flow. 38
Moreover, no waste treatment costs were assumed to be applied to the captured CO2, which is 39
accepted by the utilisation process (methanol synthesis) without charging any fee. The burdens of 40
the utilisation process were thus entirely allocated to its useful output (i.e. methanol). 41
42
To model the entire part of the chain from CO2 capture to PP synthesis, a new inventory was 43
developed based on literature data, partly complemented with data from existing database sources. 44
CO2 capture from both coal-based power plants and cement kiln was modelled based on the 45

Comparative LCA of alternative feedstock for plastics production – DRAFT FOR STAKEHOLDER CONSULTATION Part II
82
ecoinvent dataset Carbon dioxide, liquid/RER, which refers to the use of a 15-20% 1
monoethanolamine solution for the extraction of carbon dioxide out of flue gas streams from 2
industrial production process. Compared to the original dataset, background datasets were replaced 3
with EF-compliant datasets, where available. Moreover, the electricity consumption for CO2 capture 4
from coal-fired power plants was adjusted based on the values reported in Von der Assen and 5
Bardow (2014; 0.266 kWh/kg CO2 produced), which specifically refers to extraction from this type of 6
source. Similarly, in the case of capturing from cement kilns, electricity and heat consumption was 7
calculated by combining data from Hoppe et al. (2017) for the capturing process, and data from Von 8
der Assen and Bardow (2014) for subsequent cleaning, compression and filling of cylinders (see 9

Comparative LCA of alternative feedstock for plastics production – DRAFT FOR STAKEHOLDER CONSULTATION Part II
83
Table 24 for details). In both cases, infrastructure processes were excluded. 1
2
The inventory related to average hydrogen production at the EU level (Sub-scenario 1) was available 3
as EF-compliant dataset, which refers to the (crude oil) steam cracking route and is based on data 4
from a study commissioned by PlasticsEurope. Conversely, foreground inventory data for hydrogen 5
production via hydrolysis were taken from the literature (Hoppe et al., 2017), and were 6
complemented with background EF datasets, where available. 7
8
The same source of foreground LCI data (Hoppe et al., 2017) was also considered for the subsequent 9
processes of methanol synthesis from captured CO2 and hydrogen, and for methanol conversion into 10
propylene monomers via the methanol-to-olefine route. For both processes, data derive from 11
simulation and modelling activities, and do not refer to real, full-scale production plants. 12
13
For the last step of polymerisation, literature data from Keim et al (2006) were considered (so as 14
reported in Hoppe at al., 2017). As the EF-compliant dataset used for fossil-based PP is fully 15
aggregated (as it is the case of the other available datasets related to PP production) no useful data 16
related to the polymerisation phase could be extracted for the modelling. Therefore, a consistent 17
modelling of a same material across different feedstock could not be achieved. Overall, we assumed 18
that all the mentioned processes take place in proximity, so that no specific transport activities were 19
included in the model. 20
5.4.2 Transport to article production site 21
Modelling of transport of polymer resin from the place of production (inside or outside the EU), to 22
the article manufacturing site in Europe, was made in accordance with standard distances and 23
vehicle types specified in the methodology report for the route supplier-to-factory. The 24
combinations of routes considered in the modelling were already described in section 4.4.2, where 25
the reader is referred to for further details. In this case study, all polymers were assumed to be 26
manufactured inside the EU except for PLA, which comes from the US. LCIs with transport burdens 27
for each type of vehicle were available as EF-compliant datasets and were used in the modelling. 28
5.4.3 Article production 29
In all the examined scenarios, packaging film was assumed to be manufactured via blown film 30
extrusion. However, PLA as such is only suitable for cast film extrusion (Jamshidian et al., 2010). To 31
allow PLA to be processed through blown film extrusion, an improved use of additives is normally 32
needed (in terms of usage ratio among different additives or of their sequence of introduction into 33
the extruder; Mallet et al., 2013). Although additives are excluded from the system boundary in this 34
screening exercise (due to lack of data), we assumed that all proper technical and blending solutions 35
are adopted to have all film materials suitable for blown extrusion. 36
Inventory data for the mentioned conversion process were taken from the EF-compliant dataset Film 37
Extrusion (blowing) {EU-28+EFTA}. The latter accounts for a loss of polymer equal to 1%, which was 38
assumed to be entirely sent to incineration (see Section 5.4.5.4 for further details on the modelling 39
of this process). 40
5.4.4 Transport to final client 41
The transport of the article from the production site to the final client was modelled assuming the 42
route factory -> retail -> final client specified in the methodology document (Report I), and 43
considering the corresponding default transport scenario. Further detail about the considered routes 44

Comparative LCA of alternative feedstock for plastics production – DRAFT FOR STAKEHOLDER CONSULTATION Part II
84
(distance and vehicle combinations) is provided in section 4.4.4. LCIs used in the modelling for all 1
types of vehicles are derived from EF-compliant datasets. 2
5.4.5 End of Life 3
5.4.5.1 Definition of EoL scenarios 4
The same EU-average EoL scenario was assumed for packaging film made out of conventional plastic 5
materials (PP and LDPE), regardless of the feedstock used for production(fossil-based, bio-based or 6
CO2). In the absence of specific data on waste plastic film recycling and management in the EU, the 7
shares of viable EoL options were defined according to available statistics on overall plastic waste 8
management at the EU level. The considered scenario thus includes 30% recycling, 39% incineration 9
and 31% landfilling (EC, 2018). Note, however, that the assumed recycling rate may be 10
overestimated, as often only rigid plastic articles (e.g. bottles, containers) are collected for recycling 11
(or are actually recycled even if separately collected). On the other hand, the assumed value is partly 12
supported by figures available for UK, where 20% of packaging film was recycled in 2015 (BPF, 2018). 13
Similarly to the beverage bottle case study, PLA and starch based film was assumed to be sorted out 14
for separate collection with the same efficiency as conventional plastic film separately collected for 15
recycling (i.e. 30%). In the absence of specific data, for PLA this share was then equally split between 16
mechanical recycling and biological treatment. For the starch-based polymer, only the biological 17
treatment route was considered. In both cases, such route was assumed to include 90% composting 18
and 10% anaerobic digestion, according to general figures available for organic waste produced in 19
the EU (ECN, 2018). Non-separately collected film is routed to incineration and landfilling in the 20
same proportion as above, i.e. 39% incineration and 31% landfilling. 21
5.4.5.2 Modelling of recycling 22
Recycling was modelled according to the overall approach and LCI data sources described in section 23
4.4.5.2. All types of recycled polymers were assumed to replace the corresponding (fossil-based) 24
virgin polymer, except for PLA, which was assumed to replace the corresponding conventional virgin 25
polymer in the specific cases study (i.e. PP), in a short term perspective. A substitution ratio equal to 26
0.9 was considered for PP, while for LDPE it was set to 0.75, according to the default values specified 27
in the PEF context for these packaging materials. In the application of the Circular Footprint Formula, 28
the burdens and benefits from EoL recycling were allocated to the analysed system with a factor of 29
0.5 (A = 50% for PP, PE and generic plastic packaging). 30
5.4.5.3 Modelling of composting and anaerobic digestion 31
Waste-specific LCIs were developed to model composting and anaerobic digestion of PLA and of the 32
starch-based copolymer, following the approach reported in sections 4.4.5.3 and 4.4.5.4. The 33
composting inventory also includes land application of residual biodegradable plastic material in 34
compost, while the anaerobic digestion inventory also accounts for biogas utilisation, post-35
composting of digested matter, and land application of residual material in the resulting compost. 36
The PLA composition considered for modelling purposes has already been reported in Table 11 in 37
Section 4.4.5.3, while Table 25 below provides the composition assumed for the starch-based 38
copolymer. 39
5.4.5.4 Modelling of incineration 40
Incineration of conventional plastics, including PP (fossil-based and CO2-based) and LDPE, was 41
inventoried based on aggregated, material specific, EF-compliant LCI datasets. Material-specific, 42
partially terminated inventories from GaBi database were used for bio-based LDPE and PLA, instead. 43
For further detail about handling of credits from energy recovery when applying these datasets, the 44

Comparative LCA of alternative feedstock for plastics production – DRAFT FOR STAKEHOLDER CONSULTATION Part II
85
reader is referred to section 4.4.5.5. As for the starch-based copolymer, a disaggregated, material 1
specific inventory was developed based on the calculation tool by Doka (2009a), considering the 2
material composition reported in Table 25. The reasons for choosing this model, as well as the 3
updated, EU-average energy generation efficiencies introduced into the model for calculation 4
purposes can be found in section 4.4.5.5. 5
Table 25: Composition of the starch-based copolymer considered for the modelling of a waste-6 specific industrial composting inventory 7
Element %
TS 99.5
Water 0.5
VS (%TS) 99.9
Ash (%TS) 0.1
Cbiogenic (%TS) 11.3
Cfossil (%TS) 47.3
H (%TS) 6.7
O (%TS) 34.6
LHV (MJ/kg TS) 24.5
8
5.4.5.5 Modelling of landfilling 9
Landfilling of conventional (fossil-based) plastic materials was modelled based on the same 10
aggregated EF-compliant dataset (Landfill of plastic waste| landfill including leachate treatment and 11
with transport without collection and pre-treatment| production mix (region specific sites), at landfill 12
site). The related inventory is material-specific, but refers to the average composition and energy 13
characteristics of plastic waste, rather than to specific polymers. However, it was considered suitable 14
for the purposes of this screening exercise. If landfilling would turn out to be a relevant contributor 15
to the overall lifecycle impacts of the studied articles, an alternative, more specific modelling 16
approach should be considered. 17
The same plastic-generic dataset was also employed as a proxy for bio-based LDPE landfilling. The 18
degradation of conventional plastic materials in landfill is generally very low (usually a value of 1% 19
over 100 years is considered), and a negligible emission of fossil CO2 is expected. However, as in the 20
original, completely aggregated dataset it is not possible to distinguish between fossil CO2 emission 21
from degradation and from background activities, for the two bio-based plastics the whole emission 22
of fossil CO2 was converted to biogenic CO2. This approach is in favour of these bio-based plastic 23
materials. 24
For the other bio-based plastics (PLA and starch-based copolymer), disaggregated, material-specific 25
LCIs were developed based on the calculation tool developed by Doka (2009b) for the modelling of 26
waste disposal into sanitary landfill. Similarly to the waste incineration tool, it allows for calculating 27
material-specific landfill inventories that account for the composition and other relevant chemo-28
physical properties of the landfilled waste (see 29
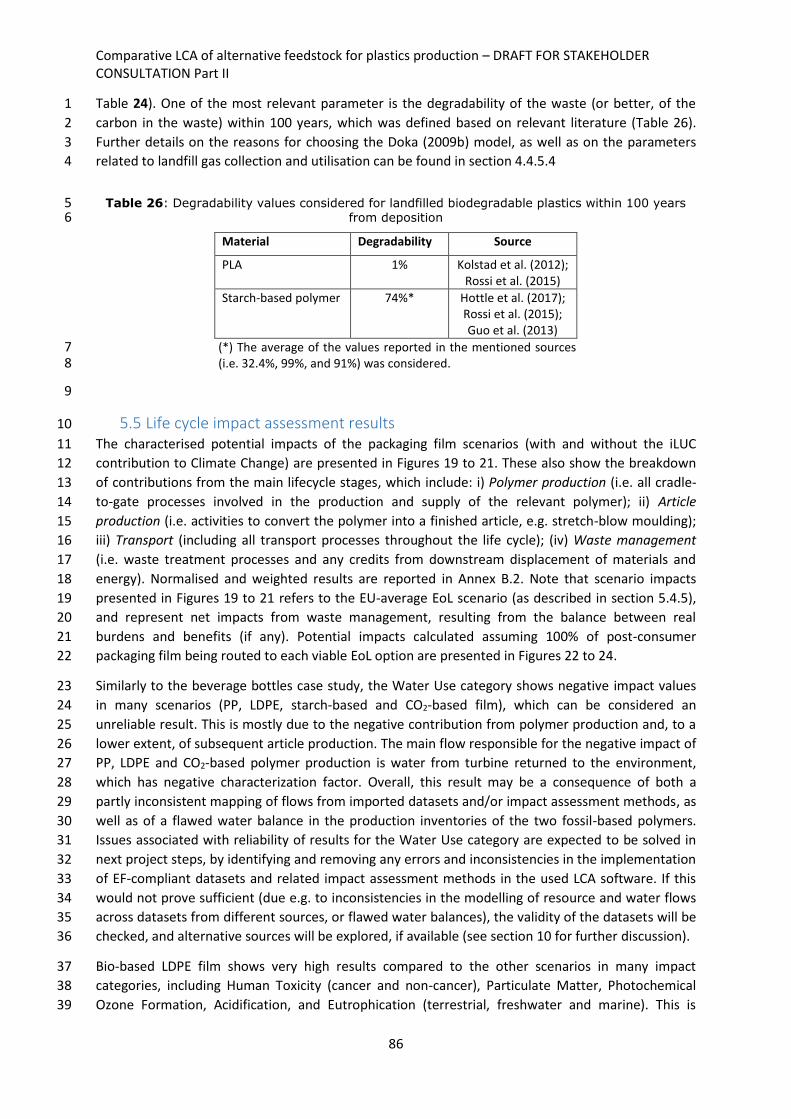
Comparative LCA of alternative feedstock for plastics production – DRAFT FOR STAKEHOLDER CONSULTATION Part II
86
Table 24). One of the most relevant parameter is the degradability of the waste (or better, of the 1
carbon in the waste) within 100 years, which was defined based on relevant literature (Table 26). 2
Further details on the reasons for choosing the Doka (2009b) model, as well as on the parameters 3
related to landfill gas collection and utilisation can be found in section 4.4.5.4 4
Table 26: Degradability values considered for landfilled biodegradable plastics within 100 years 5 from deposition 6
Material Degradability Source
PLA 1% Kolstad et al. (2012); Rossi et al. (2015)
Starch-based polymer 74%* Hottle et al. (2017); Rossi et al. (2015); Guo et al. (2013)
(*) The average of the values reported in the mentioned sources 7 (i.e. 32.4%, 99%, and 91%) was considered. 8
9
5.5 Life cycle impact assessment results 10
The characterised potential impacts of the packaging film scenarios (with and without the iLUC 11
contribution to Climate Change) are presented in Figures 19 to 21. These also show the breakdown 12
of contributions from the main lifecycle stages, which include: i) Polymer production (i.e. all cradle-13
to-gate processes involved in the production and supply of the relevant polymer); ii) Article 14
production (i.e. activities to convert the polymer into a finished article, e.g. stretch-blow moulding); 15
iii) Transport (including all transport processes throughout the life cycle); (iv) Waste management 16
(i.e. waste treatment processes and any credits from downstream displacement of materials and 17
energy). Normalised and weighted results are reported in Annex B.2. Note that scenario impacts 18
presented in Figures 19 to 21 refers to the EU-average EoL scenario (as described in section 5.4.5), 19
and represent net impacts from waste management, resulting from the balance between real 20
burdens and benefits (if any). Potential impacts calculated assuming 100% of post-consumer 21
packaging film being routed to each viable EoL option are presented in Figures 22 to 24. 22
Similarly to the beverage bottles case study, the Water Use category shows negative impact values 23
in many scenarios (PP, LDPE, starch-based and CO2-based film), which can be considered an 24
unreliable result. This is mostly due to the negative contribution from polymer production and, to a 25
lower extent, of subsequent article production. The main flow responsible for the negative impact of 26
PP, LDPE and CO2-based polymer production is water from turbine returned to the environment, 27
which has negative characterization factor. Overall, this result may be a consequence of both a 28
partly inconsistent mapping of flows from imported datasets and/or impact assessment methods, as 29
well as of a flawed water balance in the production inventories of the two fossil-based polymers. 30
Issues associated with reliability of results for the Water Use category are expected to be solved in 31
next project steps, by identifying and removing any errors and inconsistencies in the implementation 32
of EF-compliant datasets and related impact assessment methods in the used LCA software. If this 33
would not prove sufficient (due e.g. to inconsistencies in the modelling of resource and water flows 34
across datasets from different sources, or flawed water balances), the validity of the datasets will be 35
checked, and alternative sources will be explored, if available (see section 10 for further discussion). 36
Bio-based LDPE film shows very high results compared to the other scenarios in many impact 37
categories, including Human Toxicity (cancer and non-cancer), Particulate Matter, Photochemical 38
Ozone Formation, Acidification, and Eutrophication (terrestrial, freshwater and marine). This is 39

Comparative LCA of alternative feedstock for plastics production – DRAFT FOR STAKEHOLDER CONSULTATION Part II
87
mostly caused by polymer production impacts, which dominate the overall score. The GaBi dataset 1
used to model bio-based LDPE production is aggregated and does not allow in-depth understanding 2
of the sub-processes responsible for the emissions and associated impacts. It is only possible to 3
investigate flows contributing to the overall impact. For most of the mentioned categories, there is 4
only one flow accounting for the majority of the impact, i.e. PM2.5 (Particulate Matter), nitrogen 5
oxides (Photochemical Ozone Formation), phosphate (Eutrophication Freshwater) and nitrate 6
(Eutrophication Marine). No further investigation could be made, although particulate (PM2.5) 7
emissions may be attributed to the practice of pre-harvest burning adopted for sugarcane cultivation 8
in the used LCI dataset. 9
In contrast to the mentioned categories, some bio-based LDPE film results show negative impact (i.e. 10
Resource Use – fossil and Ozone Depletion), due to negative (or very low) impacts from polymer 11
production. In fact, fossil resource use impact of polymer production is negative due to negative 12
natural gas input, which might be a result of substitutions associated with (surplus) energy 13
generated through bagasse from sugarcane processing. 14
Starch-based film shows the greatest climate change impact, due to the higher contribution from the 15
EoL stage compared to the other materials. This is mainly a consequence of larger (fossil-based) 16
carbon emissions from landfilling, which reflect the greater degradability assumed for starch-based 17
film (74%) compared to other assessed materials (1% for PLA, and a likely similar value for PP and 18
LDPE12). However, such degradation rate was estimated as the average of a few literature values 19
varying in a wide range (from 32% to 99%) and may be subject to uncertainty, as well as further 20
refinement may be needed. On the other hand, the EoL of starch-based film provides is extremely 21
beneficial in the Ionising Radiation category, resulting in an overall negative impact. The main driver 22
could be identified in replaced electricity from incineration, which in contrast to the other assessed 23
materials was modelled on purpose, and this may partially explain the discrepancy. Finally, the high 24
impact of starch based film in Ecotoxicity Freshwater is due to maize cultivation. 25
CO2-based PP film shows very high results in two impact categories, i.e. Ozone Depletion and 26
Ionising Radiation. These high impacts are associated with hydrogen production (Ozone Depletion) 27
and electricity used in methanol synthesis (Ionising Radiation). Hydrogen production is again 28
modelled through an aggregated dataset, and only the elementary flow(s) responsible for the high 29
impact could be investigated. Hence, the majority of Ozone Depletion impact of hydrogen 30
production was found to result from R22 (chlorodifluoromethane) emissions, but no further insights 31
could be gained. Conversely, ionising radiation impacts from methanol synthesis may be affected by 32
the quantification of electricity use in the respective LCI, which was based on process simulation, 33
and do not refer to real, full-scale production plants. 34
Focusing on the Land Use category, the impact of bio-based LDPE film and PLA film is much higher 35
compared to the other (bio-based) alternatives included in the assessment. However, this may be 36
explained by the lower bio-based content of the starch-based film (34%), which only requires an 37
amount of maize equal to 0.43 kg per kg starch (wet). Similar amounts for bio-based LDPE and PLA 38
polymer are not available, because datasets were aggregated, but they can assumed to be higher, 39
because land use impact is higher. 40
12 The level of degradation assumed in the used EF-compliant landfill dataset is not disclosed, but it is expected to be very low (e.g. in the order of 1%, as assumed in ecoinvent landfill datasets for fossil-based plastics)
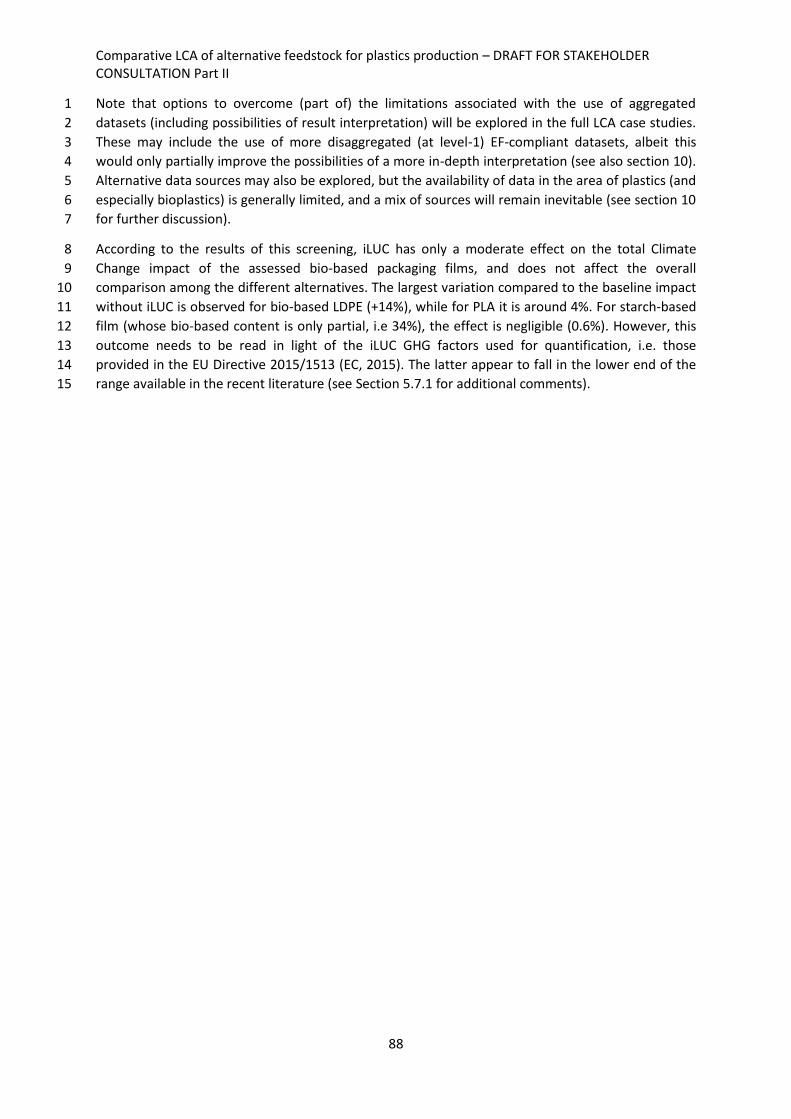
Comparative LCA of alternative feedstock for plastics production – DRAFT FOR STAKEHOLDER CONSULTATION Part II
88
Note that options to overcome (part of) the limitations associated with the use of aggregated 1
datasets (including possibilities of result interpretation) will be explored in the full LCA case studies. 2
These may include the use of more disaggregated (at level-1) EF-compliant datasets, albeit this 3
would only partially improve the possibilities of a more in-depth interpretation (see also section 10). 4
Alternative data sources may also be explored, but the availability of data in the area of plastics (and 5
especially bioplastics) is generally limited, and a mix of sources will remain inevitable (see section 10 6
for further discussion). 7
According to the results of this screening, iLUC has only a moderate effect on the total Climate 8
Change impact of the assessed bio-based packaging films, and does not affect the overall 9
comparison among the different alternatives. The largest variation compared to the baseline impact 10
without iLUC is observed for bio-based LDPE (+14%), while for PLA it is around 4%. For starch-based 11
film (whose bio-based content is only partial, i.e 34%), the effect is negligible (0.6%). However, this 12
outcome needs to be read in light of the iLUC GHG factors used for quantification, i.e. those 13
provided in the EU Directive 2015/1513 (EC, 2015). The latter appear to fall in the lower end of the 14
range available in the recent literature (see Section 5.7.1 for additional comments). 15

Comparative LCA of alternative feedstock for plastics production – DRAFT FOR STAKEHOLDER CONSULTATION Part II
89
Figure 19: Potential impact of packaging film LCA scenarios for the categories of Climate Change, Ozone Depletion, Human Toxicity –cancer, Human 16 Toxicity – non-cancer, Particulate Matter and Ionising Radiation. Note: Some impacts are out of the scale of figures. 17

Comparative LCA of alternative feedstock for plastics production – DRAFT FOR STAKEHOLDER CONSULTATION Part II
90
Figure 20: Potential impact of packaging film LCA scenarios for the categories of Photochemical Ozone Formation, Acidification, Eutrophication 18 Terrestrial, Eutrophication Freshwater, Eutrophication Marine and Ecotoxicity Freshwater. Note: Some impacts are out of the scale of figures. 19
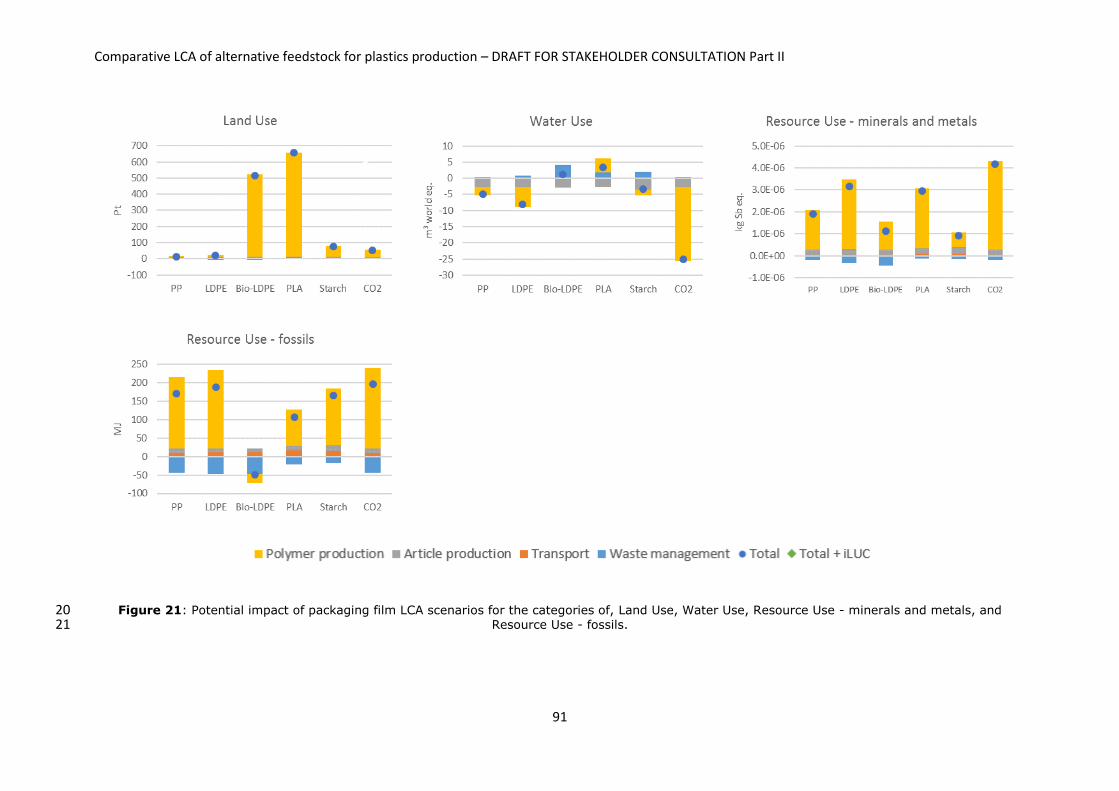
Comparative LCA of alternative feedstock for plastics production – DRAFT FOR STAKEHOLDER CONSULTATION Part II
91
Figure 21: Potential impact of packaging film LCA scenarios for the categories of, Land Use, Water Use, Resource Use - minerals and metals, and 20 Resource Use - fossils. 21
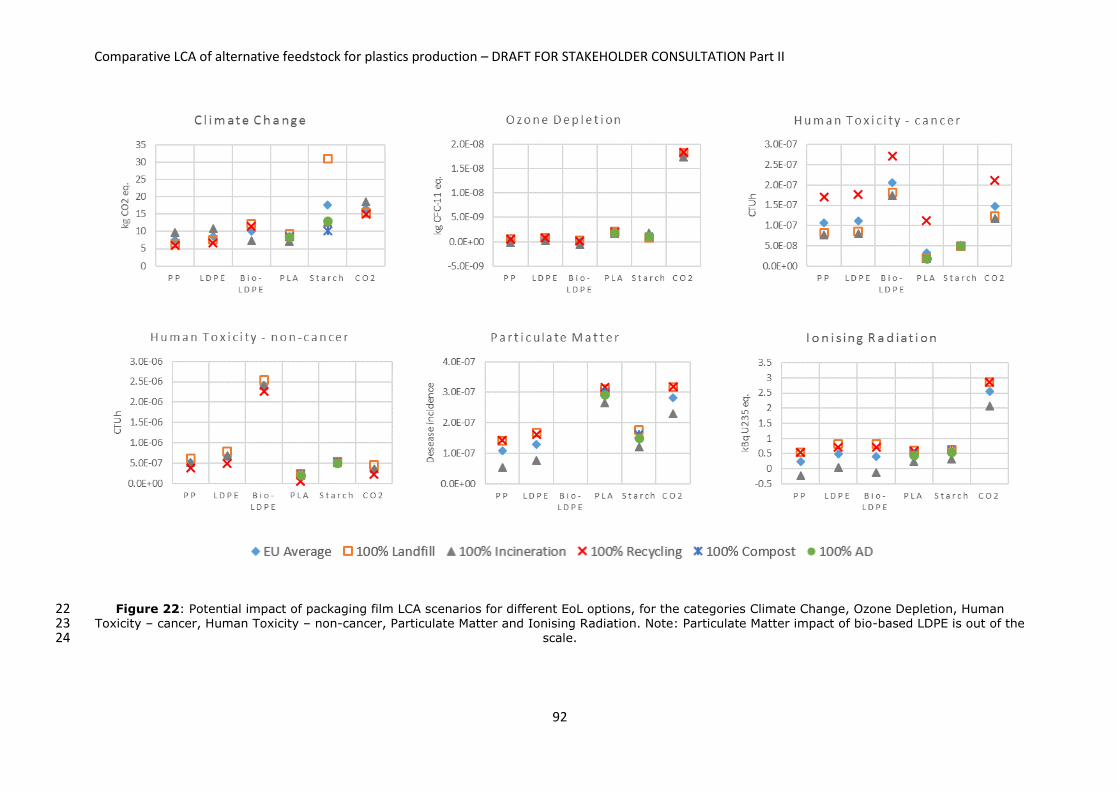
Comparative LCA of alternative feedstock for plastics production – DRAFT FOR STAKEHOLDER CONSULTATION Part II
92
Figure 22: Potential impact of packaging film LCA scenarios for different EoL options, for the categories Climate Change, Ozone Depletion, Human 22 Toxicity – cancer, Human Toxicity – non-cancer, Particulate Matter and Ionising Radiation. Note: Particulate Matter impact of bio-based LDPE is out of the 23
scale. 24

Comparative LCA of alternative feedstock for plastics production – DRAFT FOR STAKEHOLDER CONSULTATION Part II
93
Figure 23: Potential impact of packaging film LCA scenarios for different EoL options, for the categories Photochemical Ozone Formation, Acidification, 25 Eutrophication Terrestrial, Eutrophication Freshwater, Eutrophication Marine and Ecotoxicity Freshwater. Note: Eutrophication Freshwater and 26
Eutrophication Marine of bio-based LDPE are out of the scale. 27
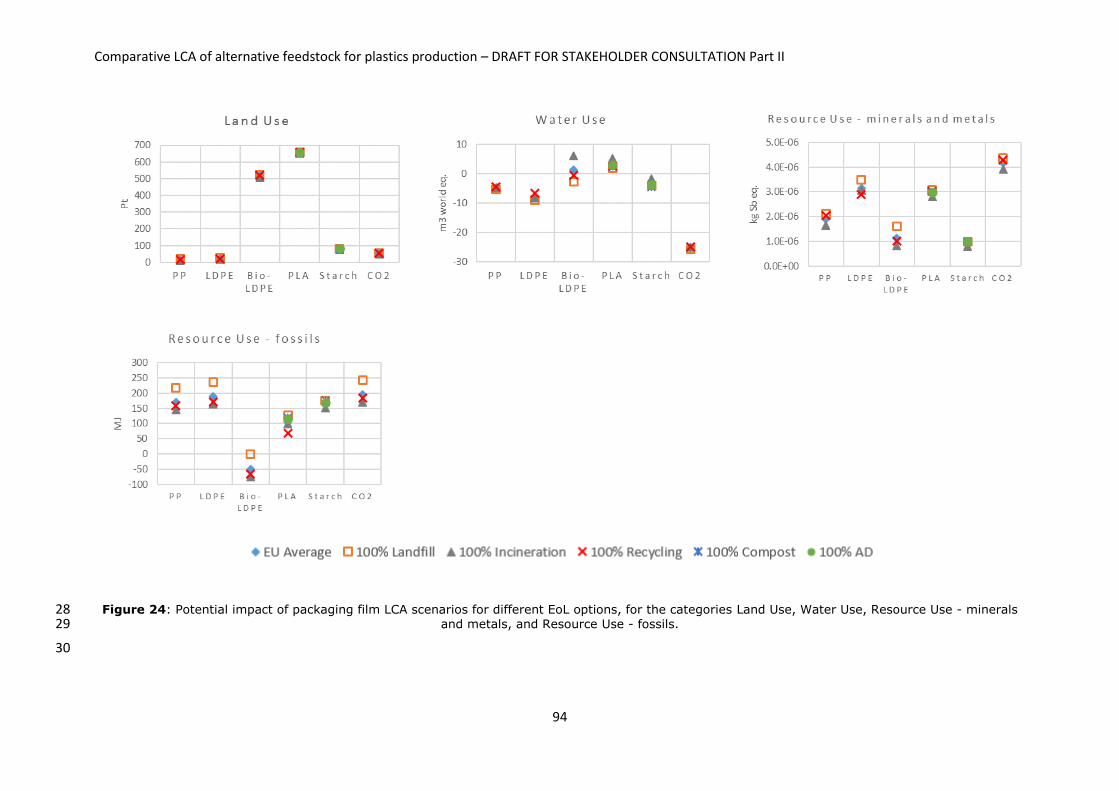
Comparative LCA of alternative feedstock for plastics production – DRAFT FOR STAKEHOLDER CONSULTATION Part II
94
Figure 24: Potential impact of packaging film LCA scenarios for different EoL options, for the categories Land Use, Water Use, Resource Use - minerals 28 and metals, and Resource Use - fossils. 29
30
Comparative LCA of alternative feedstock for plastics production – DRAFT FOR STAKEHOLDER CONSULTATION Part II
95
5.6 Interpretation 1
In the interpretation of case study results, scenario impacts calculated for both the EU-average EoL 2
scenario and the individual EoL options are firstly compared (5.6.1). Most relevant impact categories 3
and lifecycle stages are then identified (5.6.1.1 and 5.6.1.2, respectively). Identification of most 4
relevant processes was not undertaken at this stage, as in the majority of scenarios the whole, 5
cradle-to-gate process-chain involved in polymer production was modelled through a single, 6
vertically aggregated dataset, already representing the corresponding lifecycle stage. Therefore, no 7
additional insights would be gained with this exercise for such stage, which is expected to include a 8
number of relevant lifecycle processes. Moreover, while for some scenarios a greater level of 9
disaggregation could be achieved (e.g. for CO2-based PP), a more in-depth investigation of relevant 10
processes would provide an "unbalanced" picture compared to the other scenarios. 11
5.6.1 Case study results 12
Focusing on the two fossil based-reference scenarios, LDPE film shows a higher impact compared to 13
PP in all impact categories except for Human Toxicity – cancer and Resource Use - fossils, where the 14
two materials show a comparable performance. However, in a number of categories (Climate 15
Change, Ecotoxicity Freshwater, Particulate Matter, Acidification, Eutrophication Freshwater, 16
Eutrophication Terrestrial), the observed difference is not dramatic, being in the range of 20%. The 17
reason for this overall picture can be found in the larger LDPE production impacts, and, to a lower 18
extent, in the moderately higher mass of material used per functional unit in the case of LDPE. In the 19
subsequent comparative considerations with alternative materials, PP film will be mostly considered 20
as a reference, this being the benchmark that needs to be outperformed. In addition, as discussed in 21
Section 5.5, results obtained at this stage for Water Use (and, to a lower extent, Ionising Radiation) 22
appear to be unreliable, and are thus not taken into account in the following comparison. 23
In many impact categories, the bio-based LDPE film shows the highest impact, mainly due to the 24
relevant polymer production impacts compared to the other materials. Exceptions include Ozone 25
Depletion, Resource Use – minerals and metals, and, for obvious reasons, Resource Use – fossils, 26
where PP and fossil-based LDPE are both outperformed (for the latter this also happens for Ionising 27
Radiation). Therefore, at this screening stage, the use of bio-based ethylene derived from dedicated 28
crop (sugarcane), as a drop-in solution for LDPE production, does not appear to be an 29
environmentally sound alternative. 30
CO2-based PP also shows high impacts in many categories. This appears related to high energy 31
consumption in polymer production (e.g. in Climate Change, Ionising Radiation, Resource Use - 32
fossils), or chemicals used in CO2 capture and methanol synthesis (e.g. in Human Toxicity – cancer, 33
Ecotoxicity Freshwater and Ozone Depletion). The overall performance of the use of this alternative 34
feedstock for PP production is thus worse compared to its fossil-based counterpart in the majority of 35
the categories (i.e. all but Eutrophication Freshwater and Human Toxicity – non-cancer). However, it 36
must be kept in mind that the CO2-based route was mostly modelled based on data from process 37
simulation, which may prevent a fair comparison with more established alternatives. It should also 38
be noticed that no credits were assigned to captured CO2 used as a feedstock (i.e. no negative CO2 39
emissions were credited to the system), being this CO2 sourced from coal-fired power plants and 40
cement kilns. In respect to this, there is no common approach, and alternative views exist which 41
support crediting the capture and storage process with the otherwise released carbon. Applying this 42
alternative approach would improve the Climate change impact of the CO2-based scenario. Finally, 43
alternative pathways may be considered for hydrogen production, such as electrolysis fuelled with 44
renewable energy, but this alternative energy source could be equally applied to any other process 45
in the supply chain, and is not a peculiarity of this production route. 46
Comparative LCA of alternative feedstock for plastics production – DRAFT FOR STAKEHOLDER CONSULTATION Part II
96
When the current, EU-average EoL scenario is considered, the use of a compostable film made out of 1
PLA appears to be beneficial compared to PP in a number of impact categories, including Human 2
Toxicity – cancer and non-cancer, Ecotoxicity Freshwater, Eutrophication Freshwater, and Resource 3
Use – fossils. However, for the remaining categories, the performance of PLA film is worse than PP 4
(or comparable in the case of Climate Change). This is in most cases due to higher production and/or 5
transport impacts compared to PP (which was assumed to be manufactured in Europe, in contrast to 6
US for PLA). It must be noted, however, that a fully consistent modelling of transport activities of 7
feedstock/resin to EU could not be ensured for these two polymers, due to the aggregated nature of 8
the LCI datasets used in the modelling (which in the case of PP already includes transport of 9
feedstock to EU). 10
A similar picture can be observed also for the starch-based film, which is preferable to PP in three 11
categories (Human Toxicity - cancer, Eutrophication Freshwater and Resource Use - minerals and 12
metals), while it exhibits a worst or comparable performance in the remainder of the categories. For 13
Climate Change, the reason has to be found in the higher EoL impacts due mostly to landfilling of the 14
material, as already discussed in Section 5.5 (along with the limitations associated with this result). 15
For the other categories, the worse performance is again a consequence of larger polymer 16
production impacts compared to remaining materials. In this case, transport plays a less relevant 17
role, as the feedstock (maize) is sourced in the EU (in contrast to PLA, which is imported from the 18
US). 19
Because of the generally low contribution of the EoL stage to the overall scenario impacts, the 20
overall picture of results does not substantially change by considering 100% of a specific EoL option 21
rather than the EU-average EoL scenario considered as a baseline (Figures 22 to 24). However, in a 22
number of impact categories (Human Toxicity – non-cancer, Photochemical Ozone Formation, 23
Eutrophication Terrestrial, Eutrophication Freshwater, Eutrophication Marine, and Resource Use - 24
fossils), 100% landfilling can be considered to be the least favourable option, at least in some of the 25
assessed scenarios (in line with the priority order set out by the waste hierarchy). Conversely, 26
recycling has the highest Human Toxicity - cancer and Ecotoxicity Freshwater impact, which is in 27
both cases dominated by waterborne emissions of chromium from the recycling process. The actual 28
source and reliability of chromium emissions could not be investigated further, because of the 29
aggregated nature of the recycling LCI dataset. On the other hand, it is recognised that 30
characterisation factors for toxicity-related categories, and especially for metals, are still debated, 31
and can contribute to uncertainty. In some impact categories (Particulate Matter, Acidification, 32
Ionising Radiation), the 100% incineration shows the lowest impacts compared to other EoL 33
scenarios. Finally, the impact on Ecotoxicity Freshwater is clearly higher if 100% of starch co-34
polyester polymer film is sent to anaerobic digestion. This is due to emissions from biogas 35
combustion and digestate composting, which can include uncertainty. 36
If we exclude this exception, the biodegradable film alternatives (PLA and starch-based), show no 37
general advantages when biological treatment options (composting and anaerobic digestion) are 38
considered individually. Moreover, no substantial changes occur in the comparison with fossil-based 39
non-biodegradable materials. Therefore, when proper waste collection can be achieved, the use of 40
compostable materials for film production does not represent, per se, a solution to achieve an 41
improved environmental performance compared to conventional (fossil-based) materials. However, 42
this assessment does not account for the impact of any residual contamination from the packed 43
food, which may find a more proper EoL option in composting or anaerobic digestion rather than 44
incineration and landfilling. In addition, it must be kept in mind that these results exclude the 45
potential impact from the share of product that may end up as littering into the environment (for 46
Comparative LCA of alternative feedstock for plastics production – DRAFT FOR STAKEHOLDER CONSULTATION Part II
97
the reasons outlined in section 3.2). Hence, some of the benefits associated with the use of a 1
biodegradable material can be disregarded, albeit degradability of the assessed materials typically 2
refers to conditions found in biological treatment plants, and not in the natural environment. Finally, 3
the performance of biological treatments, including composting and subsequent land application, 4
are affected by the methodological choices adopted to model the behaviour of biodegradable 5
materials when these EoL options are applied, as it will be better discussed in Section 5.7.1. 6
5.6.1.1 Identification of the most relevant impact categories 7
Table 27 shows the most relevant impact categories identified for each scenario based on 8
normalised and weighted impacts, according to the approach outlined in the methodology 9
document (Report I). Relevant categories were identified as those that cumulatively contribute to at 10
least 80% of the total normalised and weighted impact of the 16 considered impact categories. 11
Results for Water Use were not considered to be reliable (see Section 4.5), and were excluded from 12
the calculation of the ranking (adjusting default weighting factors accordingly). Climate Change 13
impact is the most relevant impact category, and second relevant Resource Use - fossils for scenarios 14
S4 (PLA), S5 (starch co-polyester) and S6 (CO2-based PP). For fossil-based PP and LDPE, the order is 15
opposite, the most relevant is Resource Use - fossils and second relevant Climate Change. In case of 16
bio-based LDPE, the most relevant impact category is Particulate Matter and second relevant 17
Climate Change. 18
Table 27: The most relevant impact categories of the packaging film scenarios contributing at 19 least 80% 20
S1 Fossil PP S2 Fossil LDPE S3 Bio-based LDPE
Impact category Contrib. (%) Impact category Contrib. (%) Impact category Contrib. (%)
Resource Use - fossils 38% Resource Use - fossils 37% Particulate Matter 68%
Climate Change 36% Climate Change 35% Climate Change 10%
Human Toxicity - cancer
10% Human Toxicity - cancer
9% Eutrophication Marine
5%
Total 84% Total 82% Total 83%
S4 PLA S5 Starch co-polyester polymer S6 CO2-based PP
Impact category Contrib. (%) Impact category Contrib. (%) Impact category Contrib. (%)
Climate Change 37% Climate Change 57% Climate Change 47%
Resource Use - fossils 23% Resource Use - fossils
25% Resource Use - fossils
26%
Acidification 8%
Total 82%
Human Toxicity - cancer
9%
Particulate Matter 7%
Total 82%
Land Use 7%
Total 81%
21
5.6.1.2 Identification of the most relevant life cycle stages 22
The most relevant life cycle stages related to the most relevant impact categories of the each 23
packaging film scenario are presented in Table 28. Calculated contributions are based on 24
characterized results of the packaging film scenarios. Polymer production is the most relevant life 25
cycle stage in almost all scenarios, except in Climate Change impact of starch co-polyester polymer 26
film (S5) in which the EoL is the most contributing process with 50% contribution due to CO2 27
emissions from the landfill after degradation. EoL can also be identified as relevant life cycle stage in 28
many scenarios, being the second relevant stage in almost all scenarios. In case of PLA, 29
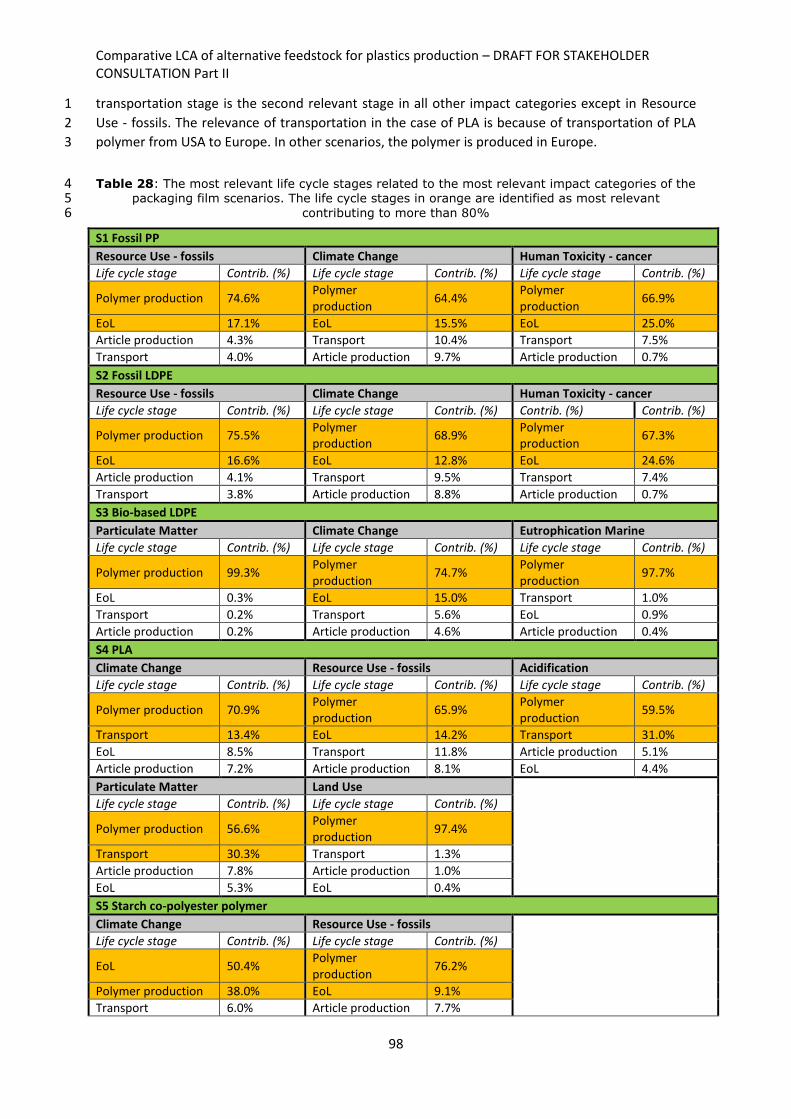
Comparative LCA of alternative feedstock for plastics production – DRAFT FOR STAKEHOLDER CONSULTATION Part II
98
transportation stage is the second relevant stage in all other impact categories except in Resource 1
Use - fossils. The relevance of transportation in the case of PLA is because of transportation of PLA 2
polymer from USA to Europe. In other scenarios, the polymer is produced in Europe. 3
Table 28: The most relevant life cycle stages related to the most relevant impact categories of the 4 packaging film scenarios. The life cycle stages in orange are identified as most relevant 5
contributing to more than 80% 6
S1 Fossil PP
Resource Use - fossils Climate Change Human Toxicity - cancer
Life cycle stage Contrib. (%) Life cycle stage Contrib. (%) Life cycle stage Contrib. (%)
Polymer production 74.6% Polymer production
64.4% Polymer production
66.9%
EoL 17.1% EoL 15.5% EoL 25.0%
Article production 4.3% Transport 10.4% Transport 7.5%
Transport 4.0% Article production 9.7% Article production 0.7%
S2 Fossil LDPE
Resource Use - fossils Climate Change Human Toxicity - cancer
Life cycle stage Contrib. (%) Life cycle stage Contrib. (%) Contrib. (%) Contrib. (%)
Polymer production 75.5% Polymer production
68.9% Polymer production
67.3%
EoL 16.6% EoL 12.8% EoL 24.6%
Article production 4.1% Transport 9.5% Transport 7.4%
Transport 3.8% Article production 8.8% Article production 0.7%
S3 Bio-based LDPE
Particulate Matter Climate Change Eutrophication Marine
Life cycle stage Contrib. (%) Life cycle stage Contrib. (%) Life cycle stage Contrib. (%)
Polymer production 99.3% Polymer production
74.7% Polymer production
97.7%
EoL 0.3% EoL 15.0% Transport 1.0%
Transport 0.2% Transport 5.6% EoL 0.9%
Article production 0.2% Article production 4.6% Article production 0.4%
S4 PLA
Climate Change Resource Use - fossils Acidification
Life cycle stage Contrib. (%) Life cycle stage Contrib. (%) Life cycle stage Contrib. (%)
Polymer production 70.9% Polymer production
65.9% Polymer production
59.5%
Transport 13.4% EoL 14.2% Transport 31.0%
EoL 8.5% Transport 11.8% Article production 5.1%
Article production 7.2% Article production 8.1% EoL 4.4%
Particulate Matter Land Use
Life cycle stage Contrib. (%) Life cycle stage Contrib. (%)
Polymer production 56.6% Polymer production
97.4%
Transport 30.3% Transport 1.3%
Article production 7.8% Article production 1.0%
EoL 5.3% EoL 0.4%
S5 Starch co-polyester polymer
Climate Change Resource Use - fossils
Life cycle stage Contrib. (%) Life cycle stage Contrib. (%)
EoL 50.4% Polymer production
76.2%
Polymer production 38.0% EoL 9.1%
Transport 6.0% Article production 7.7%

Comparative LCA of alternative feedstock for plastics production – DRAFT FOR STAKEHOLDER CONSULTATION Part II
99
Article production 5.6% Transport 7.0%
S6 CO2-based PP
Climate Change Resource Use - fossils Human Toxicity - cancer
Life cycle stage Contrib. (%) Life cycle stage Contrib. (%) Life cycle stage Contrib. (%)
Polymer production 83.7% Polymer production
76.9% Polymer production
76.0%
EoL 7.1% EoL 15.6% EoL 18.1%
Transport 4.8% Article production 3.9% Transport 5.4%
Article production 4.4% Transport 3.7% Article production 0.5%
1
5.7 Learnings from applying the draft methodology 2
This section summarises the main learnings from applying the draft methodology to this specific case 3
study. The discussion separately addresses the main implications and limitations of the applied 4
method (and data) on the overall results (5.7.1), as well as the possible options that will or can be 5
undertaken to overcome such limitations, or explored to further improve the assessment (5.7.2). 6
5.7.1 Implications of the methodological choices on the results 7
This section discusses the main implications and limitations resulting from applying the draft 8
methodology in this screening case study. In general, these relates to: i) definition of the functional 9
unit, ii) use of aggregated (EF-compliant or GaBi datasets), iii) modelling of starch-based polymer and 10
CO2-based PP production iv) modelling of EoL options, v) assumptions regarding biodegradability 11
under biological treatments (composting and anaerobic digestion) and subsequent land application 12
of composted material, vi) approach used to handle the CO2 captured and converted into chemicals, 13
vii) exclusion of potential impacts of littering, and viii) approach used to quantify the iLUC 14
contribution. 15
The results of this screening case study are affected by the choice made in the functional unit to 16
have films of the same thickness, regardless of the type of material used in manufacturing (Section 17
5.2). This is partly in favour of materials with lower densities (PP and LDPE), compared to those 18
exhibiting higher material densities (PLA and Starch-based copolymer). A larger amount of polymer 19
is indeed needed per unit of surface with a given thickness (in this case 30 µm). At this stage, no 20
clear evidence was found showing that denser materials are used in film applications with lower 21
thicknesses.. 22
Similarly to the beverage bottles case study, the use of aggregated (EF-compliant or GaBi datasets) 23
implied the use of pre-defined methodological choices, which prevented a fully consistent modelling 24
of the same process or lifecycle stage across all the scenarios. For instance, it was not possible to 25
apply a consistent approach to address multifunctionality (e.g. the same allocation key), nor to 26
ensure the same treatment route to the rejects from EoL processes such as recycling and 27
incineration. While the latter can be expected to only have minor consequences on the results, this 28
is normally not the case when different approaches are used to handle multifunctionality. Moreover, 29
it was not possible to have a fully consistent modelling of upstream transport activities of feedstock 30
and/or polymers from producing countries to EU, these being in some cases included into the 31
aggregated polymer production datasets used in the model, and in other cases modelled additionally 32
in the system (consistently with the provisions in the methodology document -Report I-). In addition, 33
while the documentation of such aggregated datasets in generally quite extensive, it frequently 34
omits important details such as the specific allocation criteria and/or the specific point(s) in the 35
process chain where they were applied. Finally, on the interpretation side, the use of aggregated 36
datasets affected the level of detail of the analysis of contributions to scenario impacts, which in the 37
Comparative LCA of alternative feedstock for plastics production – DRAFT FOR STAKEHOLDER CONSULTATION Part II
100
case of, e.g., polymer production, could be conducted only at the level of overall lifecycle stage. In 1
addition, the identification of specific emission sources responsible for process impacts was totally 2
or partially prevented, and with this also the possibility to thoroughly check any apparently "strange" 3
result. 4
According to the foreground ecoinvent data used to model the manufacturing of the starch-based 5
polymer, the fossil-based copolyester was assumed to be Naphtha, which may be a very rough 6
approximation for the actual compound(s) used for blending. Due to the potential influence on the 7
overall LCA results, the modelling should be refined when performing a full LCA case study. Similar 8
considerations apply to the production of the CO2-based PP building blocks (methanol and 9
propylene), whose modelling was mostly based on literature data deriving from process simulation 10
and modelling. Data that are more representative of real industrial production conditions should be 11
collected or estimated to improve the reliability of the comparison with the other examined 12
materials, whose production inventories refer to processes benefitting from decades or years of 13
technology improvements. 14
Regarding the modelling of specific EoL options, and especially incineration and landfilling, it was not 15
possible to apply a completely consistent approach across all the assessed scenarios. This is because 16
waste-specific, EF-compliant or GaBi datasets (both developed according to the same modelling 17
approach) are not available for all the investigated plastic materials. Although a waste-specific model 18
(Doka, 2009a, Doka, 2009b) was used to develop LCIs for any missing material, it may be based on a 19
different approach and assumptions (e.g. transfer coefficients, conversion efficiencies, etc.) 20
compared to those applied in the available datasets (which are not disclosed). However, considering 21
the generally moderate contribution of the EoL stage to the overall scenario impacts (not larger than 22
17% in all relevant categories except for Human Toxicity – cancer, and Climate Change of starch-23
based film), the use of a potentially different modelling approach should not involve substantial 24
effects on the results of this specific case study. On the other hand, the degradation rate assumed 25
for landfilled starch-based film (74%), clearly affected the Climate Change impact from the EoL of 26
this alternative and its overall performance. As such degradation rate was estimated as the average 27
of literature values varying in a relatively wide range (32-99%), further refinement of this assumption 28
may be needed in a possible full LCA case study for a more accurate picture of what happens in 29
reality. 30
Focusing more specifically on biological treatment options for biodegradable plastic materials (i.e. 31
composting and anaerobic digestion), the results are bound to the assumptions performed on 32
material degradability during treatment and subsequent land application of composted (or post-33
composted) material. As detailed in Sections 4.4.5.3 and 4.4.5.4, degradability during aerobic and 34
anaerobic treatment was defined according to minimum requirements in relevant EN standards (e.g. 35
EN 13432:2000) and was set to 90% for composting and 50% for anaerobic digestion. However, 36
these values refer to laboratory testing conditions, which may not fully reflect those of real 37
treatment plants. In the case of anaerobic digestion, the mentioned degradation rate was reduced 38
to 35%, according to the biogas yield typically considered for organic waste (70% of anaerobically 39
degradable carbon), which may not be identically applied to plastic materials. Overall, this 40
represents a source of uncertainty that ultimately affects the potential benefits from biological 41
treatments (i.e. carbon supply to soil with compost, and avoided energy generation from biogasified 42
carbon). Moreover, bio-degradation of residual, non-degraded plastic materials in compost applied 43
to soil was only addressed in terms of airborne emissions from carbon degradation. Emissions (and 44
potential impacts) of any non-degradable substance (e.g. additives and metals) could not be 45

Comparative LCA of alternative feedstock for plastics production – DRAFT FOR STAKEHOLDER CONSULTATION Part II
101
quantified, due to the very limited availability of composition data (which are restricted to basic 1
elements). 2
As this screening exercise excluded the impact of any amount of littered product, the obtained 3
framework of results may not provide a full picture of the environmental consequences (advantages 4
or disadvantages) of using a biodegradable material in film production rather than a non-5
biodegradable one. The implications of this omissions may be more relevant than the beverage 6
bottle case study, as packaging film is potentially more prone to littering, even in countries with a 7
well established waste collection system such as Europe. However, PLA and starch-based polymers 8
are typically biodegraded only under controlled composting conditions (e.g. NatureWorks, 2018). 9
As for the modelling of feedstock CO2, it should be noticed that in this screening case study no 10
credits were assigned to the flow of CO2 captured and subsequently used in the PP supply chain. This 11
is because such flow was assumed to be fossil CO2 from the combustion of coal and other fossil fuels 12
for energy generation and cement production, or from chemical reactions involved in the latter 13
process. However, alternative views exist, which support crediting the capture and storage process 14
with the otherwise released carbon dioxide. Following a similar approach, would improve the 15
Climate Change performance of the CO2-based scenario. 16
Finally, the iLUC effect on Climate Change impact calculated in this screening may be 17
underestimated. The GHG emission factors used for quantification purposes (derived from Directive 18
2015/1513 (EC, 2015)) were indeed found to fall in the lower end of the range available in the recent 19
literature (see methodology document -Report I-). The reasons for this could be related to the 20
exclusion of intensification-related impacts (i.e. only expansion on nature is included), the 21
assumptions taken in the underlying economic models, and the approach used to handle carbon 22
emissions (i.e. amortisation), as highlighted in a recent review by (De Rosa et al., 2016). In addition, 23
it should be kept in mind that the iLUC contribution used in this screening only accounted for carbon 24
emissions, thus only impacts on the climate change category were addressed. A larger iLUC GHG 25
contribution and the inclusion of nutrients-related impacts (e.g. intensification) in the iLUC inventory 26
would (further) worsen the Climate Change, Acidification, and Eutrophication performance of the 27
bio-based scenarios (bio-LDPE, PLA and starch-based film). 28
5.7.2 Options to be explored for further improvement 29
As noted in section 5.7.1, the functional unit of this screening assessment assumes films of the same 30
thickness, regardless of the type of material used in film manufacturing. This assumption may be 31
refined for a possible full LCA case study, if clearer data and information is made available in the 32
meanwhile (e.g. via relevant stakeholder input). For this purpose, clear evidence should be provided 33
that material densities actually affect film thickness in real production practices (e.g. higher densities 34
imply lower thicknesses to achieve the same mechanical properties). 35
In the attempt to overcome (part of) the limitations associated with the use of completely 36
aggregated (EF-compliant or GaBi) datasets, alternative data sources can be explored while 37
performing full LCA case studies. For instance, the use of more disaggregated (at level 1) EF-38
compliant datasets could be considered to at least partially improve the possibilities for result 39
interpretation, provided these will be available for implementation in current LCA software in due 40
time. Alternatively, the use of datasets from other databases (e.g. ecoinvent) could be explored. 41
However, considering the current availability of relevant and consistent LCI data in the field of 42
plastics (and especially bio-plastics), these alternatives are not expected to solve the issue of 43
consistency of data source across the life cycle and across scenarios (materials). 44

Comparative LCA of alternative feedstock for plastics production – DRAFT FOR STAKEHOLDER CONSULTATION Part II
102
Alternative data sources are currently not available to improve the modelling of starch-based 1
polymer production. Hence, input will be sought from relevant stakeholders in the attempt to clarify 2
the actual (nature of) the co-polyester blended with starch, collect related production LCI data, or 3
valuable opinions on which compound could be used as a closer proxy for modelling purposes, 4
without the risk of underestimating actual production impacts. Similarly, in the attempt to improve 5
the reliability of (comparative) results for CO2-based film and polymers in general, stakeholder input 6
will be asked to better understand if upscaling efforts for relevant conversion processes have been 7
undertaken in the meanwhile, and if options are available to collect more representative data for 8
(hypothetical) industrial production conditions. 9
Although the use of a partially inconsistent approach across the different scenarios for the modelling 10
of EoL options appeared to have no significant consequences on the overall results, further efforts 11
will be made in order to perform a fully consistent modelling. For instance, the application of the 12
same waste LCA model (e.g. EASETECH) or tool across all scenarios and EoL options will be 13
considered in the full LCA case studies, provided that more information on the mapping of LCI flows 14
in such a model is made available. Moreover, feedback from relevant stakeholders will be asked with 15
regard to the assumed degradation rate of starch-based polymer in landfill conditions, and possible 16
suggestions for refinement will be properly taken into account. 17
In the attempt to improve the modelling of (emissions from) biodegradation of (post-)composted 18
plastic material, inputs will be sought from relevant stakeholders to achieve more detailed 19
composition data including any metals and additives. However, composition data alone may not be 20
sufficient, as these shall be complemented by suitable characterisation factors for the corresponding 21
substances to undertake a full impact assessment. The availability of proper factors, or of reasonable 22
proxies, will be checked once composition data specifying the type (and quantities) of substances 23
involved is available. 24
Building upon the initial proposal of framework reported in section 5.5.8.8 of Report I, the feasibility 25
of quantitatively addressing the issue of littering will be explored in the next project steps. While 26
undertaking a full impact assessment is not anticipated to be feasible, due to fundamental gaps in 27
underlying data (see section 3.2), the definition of an inventory-level indicator expressing e.g. the 28
likelihood of an article to be littered is seen as a more realistic option, which will be pursued in some 29
of the full LCA case studies. 30
Finally, for iLUC modelling alternative approaches may be applied along with the currently used 31
values (provided they reliability is proven), in order to get a range of iLUC climate change impacts, 32
rather than a single point value. Moreover, approaches that allows for quantification of 33
consequences on additional impact categories (due to e.g. intensification) may be explored. 34
In conclusion, for this screening case study, stakeholders are invited to provide relevant inputs on 35
the following aspects (other than on any performed methodological choice): i) improved information 36
on the (fossil-based) copolyester(s) used for starch-based polymer production and suitable LCI data 37
to be used for modelling; ii) inventory data on conversion steps of captured CO2 into polymers, 38
which are more representative for (hypothetical) industrial production conditions; iii) degradation 39
rate of starch-based polymer(s) in landfill conditions; and iv) more detailed composition data for 40
(film grade) PLA and starch-based polymer(s), especially with regard to metals, and additives used 41
during polymerisation, blending and film production (if any). 42

Comparative LCA of alternative feedstock for plastics production – DRAFT FOR STAKEHOLDER CONSULTATION Part II
103
6. Case study 3: mulching film 1
Plastic mulching is an agricultural practice consisting in the mechanical application of a plastic film 2
(black, white or transparent, with low thickness) onto the soil. Seedlings and young plants are 3
planted punching holes in the film. 4
The primary function of plastic mulch films is seedlings and shoots protection, by insulating and 5
preventing evaporation (Tarara, 2000), but it is also used to reduce pests (McKenzie and Duncan, 6
2001). Additional advantages of plastic mulching are recognized, such as yield increase, earlier 7
development of seeds and fruits, weeds control, and consequently a reduction in fertilizer and 8
pesticides input (Scarascia-Mungozza, 2011; Chalker-Scott, 2007). Thanks to the economic and 9
agronomic benefits it brings to cultivation, it has become a widely used technique in the global 10
agriculture. In Europe, plastic mulching is used mainly in horticulture. 11
Due to high flexibility and durability characteristics, the most commonly used material for the 12
production of mulch film, is Polyethylene (PE), with Low Density Poly Ethylene (LDPE) being the most 13
diffused type (Scarascia-Mungozza, 2011). 14
6.1 Assessed scenarios 15
The life cycle of mulch film manufactured by different polymers and/or feedstock was explored by 16
modelling different scenarios ( 17

Comparative LCA of alternative feedstock for plastics production – DRAFT FOR STAKEHOLDER CONSULTATION Part II
104
Table 29), approximating possible alternatives currently available for agricultural use. Conventional 1
mulch film, produced by fossil-based (LDPE) was defined as the reference scenario (S1). The use of 2
recycled (fossil-based) post-consumer plastic (LDPE) was also assessed, by assuming 100% of the 3
manufacturing input coming from recycling (S2). Even though recycled material can be mixed with 4
virgin material at different shares, the analysis focused on mulch film production entirely relying on 5
recycled input, with the aim of assessing the effect of a complete substitution of the virgin material. 6
Partially bio-based and biodegradable alternatives were explored in scenario 3 (S3) and in scenario 4 7
(S4) where the mulch films are produced by starch plastics. In S3 the mulching film is manufactured 8
by processing a starch-based co-polymer, obtained by blending maize starch with fossil-based co-9
polyester. Contrarily, in S4, the mulching film is produced by PLA-based co-polymer, a blend of 10
polylactic acid (PLA) obtained by maize, and polybutyrate adipate terephthalate (PBAT) of fossil 11
origins. As a matter of fact, the blending of starch with biodegradable polyesters attains 100% 12
biodegradable mulch films, thus complete in-situ biodegradation is considered in both scenarios S3 13
and S4. 14
As for the beverage bottle and flexible food packaging film case studies (sections 4.4.1 and 5.4.1), 15
PLA derived from US maize was modelled, while starch used for co-polymer production is assumed 16
to be derived from EU-28 maize (one of the largest producers of this type of starch blends is located 17
Europe). 18
19

Comparative LCA of alternative feedstock for plastics production – DRAFT FOR STAKEHOLDER CONSULTATION Part II
105
Table 29: LCA scenarios assessed for the mulching film screening case study 1
Scenario Polymer Monomer/ Co-polymer
Feedstock EoL options(a)
S1 Conventional polymer (reference)
LDPE(b) Ethylene Fossil-based (oil/natural gas)
Recycling Incineration Landfilling
S2 Recycled conventional polymer
r-LDPE Ethylene Fossil-based (oil/natural gas)
Recycling Incineration Landfilling
S3 Alternative polymer 1 Starch based-co-polymer Starch Co-polymer
Maize (EU-28) Fossil-based (oil/natural gas)
In-situ biodegradation
S4 Alternative polymer 2 PLA based-co-polymer PLA(c) PBAT(d)
Maize (US) Fossil-based (oil/natural gas)
In-situ biodegradation
(a) The impacts of scenarios were individually assessed for each listed EoL option, as well as for 2 a combination of such options reflecting as far as possible the average situation at the EU level. 3 (b) LDPE: Low Density Poly Ethylene 4 (c) PLA: PolyLactic Acid 5 (d) PBAT: PolyButylene Adipate Terephthalate 6 7
6.2 Functional Unit and reference flow 8
The main function of mulch film is to provide field mulching, in order to protect the crop. Thus the 9
functional unit is defined as “mulching 1 ha of cultivated land in Europe”. 10
Mulching films currently used in the European agriculture differ in the physical properties depending 11
on the polymer they are made of. Different thickness and density result in different film mass 12
required to mulch 1 ha. Table 30 shows the reference flows used in the scenarios assessed 13
calculated according thickness and density of the fossil-based and bio-based polymers constituting 14
the mulch films explored. 15
Table 30: Reference flow calculated for each mulching films scenario 16
Material Thickness (μm)
Density (kg/m3)
Reference flow(a)
(kg/FU)
LDPE; r-LDPE 35 (15-50)(b)
0.925 (0.92-0.93)(c)
194.25
Starch based-co-polymer
12 (12-18)(d)
1.27 (1.23-1.29)(d)
91.40
PLA based-co-polymer 10(e) 1.38 (1.34-1.40)(e)
82.80
(a) On average, the mulch film needed for mulching 1 ha is considered to be 0.6 ha. 17 (b) OWS - Organic Waste System (2017). 18 (c) Scarascia-Mungozza (2011). 19 (d) Novamont Mater-Bi® http://materbi.com/en/wp-20
content/uploads/sites/2/2018/06/scheda-pacciamatura_EN_LR_TUV.pdf 21 (e) BASF ecovio® 22
23
6.3 System Boundary 24
The system boundary was set according to a cradle-to-grave perspective to cover the most relevant 25
stages of the mulch film life cycle. As shown in Figures 25 to 28, the system boundaries of the 26
assessed scenarios include feedstock production, polymer production, article manufacturing and the 27

Comparative LCA of alternative feedstock for plastics production – DRAFT FOR STAKEHOLDER CONSULTATION Part II
106
end of life stage. Relevant transport activities between the different life cycle stages were also 1
included in the study, as was the indirect land use change of crops. The consumer use stage is 2
excluded, because, being the same for all the explored product systems, it can be neglected under 3
comparative perspectives. 4
Note that, despite the mulch film properties is deeply modified by the use of additives (e.g. 5
plasticizers, ultraviolet stabilizers, etc.) in the manufacturing stage, additives were excluded from the 6
system boundary (both in terms of production and possible fate at the end of life stage) due to the 7
lack of data. This is acknowledged as a limitation of this screening study, as additive production can 8
account for a non-negligible portion of climate impact (up to 45%, see section 2.3.2.10 in Report I). 9
Moreover, additives can also be relevant at the end-of-life stage, where they can be released, as 10
such or after degradation/conversion into different compound(s), in the environment (i.e. the soil in 11
case of biodegradable plastics routed to biological treatments or subject to in-situ degradation). 12
13

Comparative LCA of alternative feedstock for plastics production – DRAFT FOR STAKEHOLDER CONSULTATION Part II
107
Production of mulch film
ElectricityElectricity production
Fossil fuel extraction &
refining
Recycling
Incineration
Landfilling ElectricityElectricity production
Waste Resource extraction
Resource extraction
Recycled Product*
Virgin LDPE Production
Resource extraction
Production of LDPE
T T
ConsumerCollection of used LDPE mulch film
T
LDPE
14 Figure 25: System boundary for fossil-based LDPE mulch film (Scenario S1). (*) Handled according to the Circular Footprint Formula 15
Production of mulch film
ElectricityElectricity production
Waste LDPE
Recycling
Incineration
Landfilling ElectricityElectricity production
rLDPE Resource extraction
Resource extraction
Recycled Product*
Virgin LDPE Production
Resource extraction
Recycling of LDPE
T TConsumer
Collection of used mulch filmT
16 Figure 26: System boundary for recycled LDPE mulch film (Scenario S2). Note: supply of recycled LDPE is modelled according to the Circular Footprint 17
Formula. (*) Handled according to the Circular Footprint Formula 18

Comparative LCA of alternative feedstock for plastics production – DRAFT FOR STAKEHOLDER CONSULTATION Part II
108
Production of mulch film
Corn production
Production of starch
T
ConsumerT
iLUC
Co-polymer production
Production of starch-based polymer
fossil-based co-polymer
starch
In-situbiodegradation
Biodegradable waste
Fossil fuel extraction &
refining
corn
T
19 Figure 27: System boundary for starch-based mulch film (Scenario S3) 20
Production of mulch film
Corn production
PLA production
T
ConsumerT
iLUC
PBAT production
Production of PLA-based polymer
PBAT
PLA
In-situbiodegradation
Biodegradable waste
Fossil fuel extraction &
refining
corn
T
21 Figure 28: System boundary for PLA-based mulch film (Scenario S4) 22
23
24

Comparative LCA of alternative feedstock for plastics production – DRAFT FOR STAKEHOLDER CONSULTATION Part II
109
6.4 Life Cycle Inventory 1
This section describes the overall approach for building the LCI of the analysed scenarios, along with 2
related assumptions and data sources. The description is separated by major lifecycle stages. The list 3
of processes and related data sources are provided in Tables 31 to 34. 4
5
6

Comparative LCA of alternative feedstock for plastics production – DRAFT FOR STAKEHOLDER CONSULTATION Part II
110
Table 31: List of processes included in the LCI model of fossil-based LDPE mulch film (conventional polymer, scenario 1) 7
Life cycle stage Process Dataset Compliance scheme or source
Comments
Polymer production Oil extraction, refining, cracking, distillation, compression, polymerization (LDPE production)
LDPE granulates| Polymerisation of ethylene| production mix, at plant| 0.91- 0.96 g/cm3, 28 g/mol per repeating unit {EU-28+EFTA} [LCI result]
EF
Transport Transport to production site (from supplier to factory)
Articulated lorry transport, Euro 4, Total weight >32 t (without fuel); diesel driven, Euro 4, cargo; consumption mix, to consumer; more than 32t gross weight / 24,7t payload capacity
EF Transport set accordingly to the methodology document and consistently across scenarios. Distances: 130 Km lorry, 240 Km train, 270 Km ship (See methodology).
Freight train, average (without fuel); technology mix, electricity and diesel driven, cargo; consumption mix, to consumer; average train, gross tonne weight 1000t / 726t payload capacity
EF
Barge; technology mix, diesel driven, cargo; consumption mix, to consumer; 1500 t payload capacity
EF
Article production Blowing film extrusion Film Extrusion (blowing)| plastic extrusion| production mix, at plant| for PP, PE, PVC, PET and PS {EU-28+EFTA} [LCI result]
EF
1.01 kg of LDPE granulates are needed to produce 1.0 kg of film (according to dataset documentation)
Transport Transport (from factory to distribution centre)
Articulated lorry transport, Euro 4, Total weight >32 t (without fuel); diesel driven, Euro 4, cargo; consumption mix, to consumer; more than 32t gross weight / 24,7 t payload capacity
EF Local supply chain: 1200 km by truck (see methodology)
Articulated lorry transport, Euro 3, Total weight <7.5 t (without fuel); diesel driven, Euro 3, cargo; consumption mix, to consumer; up to 7,5t gross weight / 3,3t payload capacity
EF 250 km round trip by van (see methodology)
Collection Collection of mulching film GLO | Soil cultivation; stubble cleaning (medium, 67 kW)
TS
Agricultural operations needed to remove the film. Collection rate = 90%
EoL
Incineration Waste incineration of PE [EU-28+EFTA] EF 53% of the collected film
-Avoided Electricity prod. Thermal energy for waste incineration | {EU-28+EFTA} [LCI result]
EF Already included in the dataset
-Avoided Heat prod. Steam for waste incineration | {EU-28+EFTA} [LCI EF Already included in the

Comparative LCA of alternative feedstock for plastics production – DRAFT FOR STAKEHOLDER CONSULTATION Part II
111
result] dataset
Landfill
Landfill of plastic waste| landfill including leachate treatment and with transport without collection and pre-treatment| production mix (region specific sites), at landfill site {EU-28+EFTA} [LCI result]
EF 42% of the collected film
Recycling (5%) Recycling of polypropylene (PP) plastic | from post-consumer waste, via washing,
EF 5% of the collected film.
Avoided virgin LDPE production LDPE granulates| Polymerisation of ethylene| production mix, at plant| 0.91- 0.96 g/cm3, 28 g/mol per repeating unit {EU-28+EFTA} [LCI result]
EF Efficiency = 90%
8

Comparative LCA of alternative feedstock for plastics production – DRAFT FOR STAKEHOLDER CONSULTATION Part II
112
Table 32: List of processes included in the LCI model of fossil-based recycled LDPE mulch film (scenario 2) 9
Life cycle stage Process Dataset Compliance scheme or source
Comments
Polymer recycling
LDPE Collection, LDPE recycling Recycling of polypropylene (PP) plastic | from post-consumer waste, via washing,
EF Approximation LDPE PP
Polymer production (virgin)
Oil extraction, refining, cracking, distillation, compression, polymerization (LDPE production)
LDPE granulates| Polymerisation of ethylene| production mix, at plant| 0.91- 0.96 g/cm3, 28 g/mol per repeating unit {EU-28+EFTA} [LCI result]
EF
Transport Transport to production site (from supplier to factory)
Articulated lorry transport, Euro 4, Total weight >32 t (without fuel); diesel driven, Euro 4, cargo; consumption mix, to consumer; more than 32t gross weight / 24,7t payload capacity
EF Same amounts transported as the 100% virgin-LDPE scenario. Transport set accordingly to the methodology document and consistently across scenarios. Distances: 130 Km lorry, 240 Km train, 270 Km ship (See methodology).
Freight train, average (without fuel); technology mix, electricity and diesel driven, cargo; consumption mix, to consumer; average train, gross tonne weight 1000t / 726t payload capacity
EF
Barge; technology mix, diesel driven, cargo; consumption mix, to consumer; 1500 t payload capacity
EF
Article production
Blowing film extrusion Film Extrusion (blowing)| plastic extrusion| production mix, at plant| for PP, PE, PVC, PET and PS {EU-28+EFTA} [LCI result]
EF
1.01 kg of LDPE granulates are needed to produce 1.0 kg of film (according to dataset documentation)
Transport Transport (from factory to distribution centre)
Articulated lorry transport, Euro 4, Total weight >32 t (without fuel); diesel driven, Euro 4, cargo; consumption mix, to consumer; more than 32t gross weight / 24,7 t payload capacity
EF Local supply chain: 1200 km by truck (see methodology)
Articulated lorry transport, Euro 3, Total weight <7.5 t (without fuel); diesel driven, Euro 3, cargo; consumption mix, to consumer; up to 7,5t gross weight / 3,3t payload capacity
EF 250 km round trip by van (see methodology)
Collection Collection of mulching film GLO | Soil cultivation; stubble cleaning (medium, 67 kW) TS Thinkstep Agricultural operations needed to remove the film. Collection rate = 90%
EoL
Incineration Waste incineration of plastics (unspecified)| waste-to-energy plant with dry flu
EF 53% of the collected film
-Avoided Electricity prod. Thermal energy for waste incineration | {EU-28+EFTA} [LCI result] EF Already included in the dataset
-Avoided Heat prod. Steam for waste incineration | {EU-28+EFTA} [LCI result] EF Already included in the dataset
Landfill Landfill of plastic waste| landfill including leachate treatment and with transport without collection and pre-treatment| production mix (region
EF 42% of the collected film

Comparative LCA of alternative feedstock for plastics production – DRAFT FOR STAKEHOLDER CONSULTATION Part II
113
specific sites), at landfill site {EU-28+EFTA} [LCI result]
Recycling Recycling of polypropylene (PP) plastic | from post-consumer waste, via washing,
EF 5% of the collected film.
Avoided virgin LDPE production LDPE granulates| Polymerisation of ethylene| production mix, at plant| 0.91- 0.96 g/cm3, 28 g/mol per repeating unit {EU-28+EFTA} [LCI result]
EF Efficiency = 90%
10

Comparative LCA of alternative feedstock for plastics production – DRAFT FOR STAKEHOLDER CONSULTATION Part II
114
Table 33: List of processes included in the LCI model of Bio-based (partially) + Biodegradable (100%) mulch film (starch-based polymer, scenario 3) 11
Life cycle stage
Process Dataset Compliance scheme or source
Comments
Polymer production
Corn cultivation & wet milling, co-polyester production, granulate production via extrusion
Dataset developed based on the EI dataset Polyester-complexed starch biopolymer production/RER, replacing where possible the background dataset with EF/TS datasets as follow: - Corn production: EU-28 Maize (corn grain) production (EF); - Wet milling: based on the following Agrifootprint datasets
(replacing background datasets with EF equivalents): - Maize, steeped, from wet milling (receiving and steeping), at
plant/US Economic; - Maize degermed, from wet milling (degermination), at plant/US
Economic; - Maize starch and gluten slurry, from wet milling (grinding and
screening), at plant/US Economic; - Maize starch, wet, from wet milling (gluten recovery), at
plant/US Economic. - Other inputs/outputs: replacing existing datasets with EF
equivalents (electricity consumption 0.402 kWh/kg)
E (foreground) + EF (background)
Transport Transport to production site (from supplier to factory)
Articulated lorry transport, Euro 4, Total weight >32 t (without fuel); diesel driven, Euro 4, cargo; consumption mix, to consumer; more than 32t gross weight / 24,7t payload capacity
EF Transport set accordingly to the methodology document and consistently across scenarios. Distances: 130 Km lorry, 240 Km train, 270 Km ship (See methodology).
Freight train, average (without fuel); technology mix, electricity and diesel driven, cargo; consumption mix, to consumer; average train, gross tonne weight 1000t / 726t payload capacity
EF
Barge; technology mix, diesel driven, cargo; consumption mix, to consumer; 1500 t payload capacity
EF
Article production
Blowing film extrusion Film Extrusion (blowing)| plastic extrusion| production mix, at plant| for PP, PE, PVC, PET and PS {EU-28+EFTA} [LCI result]
EF
1.01 kg of LDPE granulates are needed to produce 1.0 kg of film (according to dataset documentation)
Transport Transport (from factory to distribution centre)
Articulated lorry transport, Euro 4, Total weight >32 t (without fuel); diesel driven, Euro 4, cargo; consumption mix, to consumer; more than 32t gross weight / 24,7 t payload capacity
EF Local supply chain: 1200 km by truck (see methodology)
Articulated lorry transport, Euro 3, Total weight <7.5 t (without fuel); diesel driven, Euro 3, cargo; consumption mix, to consumer; up to 7,5t gross weight / 3,3t payload capacity
EF 250 km round trip by van (see methodology)
EoL Biodegradation in soil - CO2 emission (biogenic) Dataset Standard degradation rate=
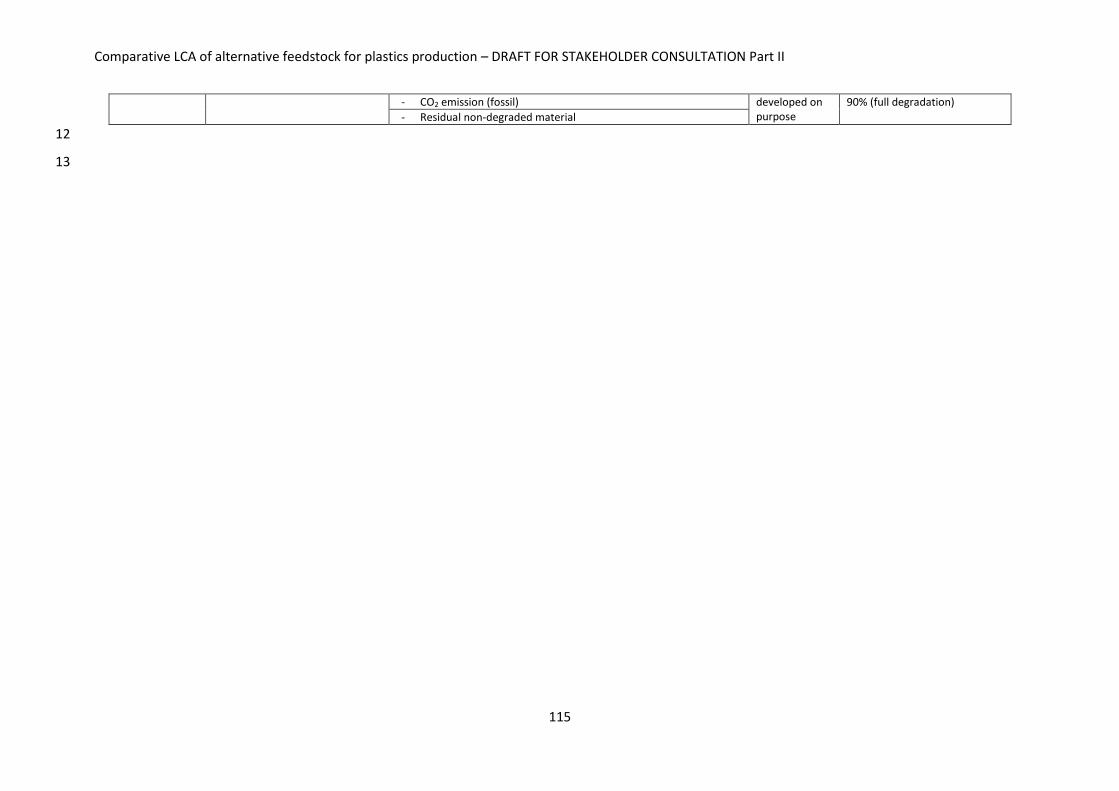
Comparative LCA of alternative feedstock for plastics production – DRAFT FOR STAKEHOLDER CONSULTATION Part II
115
- CO2 emission (fossil) developed on purpose
90% (full degradation)
- Residual non-degraded material
12
13

Comparative LCA of alternative feedstock for plastics production – DRAFT FOR STAKEHOLDER CONSULTATION Part II
116
Table 34: List of processes included in the LCI model of Bio-based (partially) + Biodegradable (100%) mulch film (PLA-based polymer, scenario 4) 14
Life cycle stage
Process Dataset Compliance scheme or source
Comments
Polymer production
Fossil: PBAT Oil extraction, refining, cracking, distillation, compression, polymerization
EU-28 Polybutylene Terephthalate (PBT) Granulate| from dimethyl terephtalate and 1,4 butanediol |production mix, at plant
EF
Approximation of PBAT production process, with PBT production process (note: adipic acid is missing) PBAT = 55%.
Bio-based: (PLA) Cultivation, transport to the mill, receiving and steeping, degermination, grinding and screening, starch and gluten separation and dewatering + drying
US Ingeo polylactide (PLA) biopolymer production TS Thinkstep PLA = 45%
Transport Transport to production site (from supplier to factory) -from US to EU
Articulated lorry transport, Euro 4, Total weight >32 t (without fuel); diesel driven, Euro 4, cargo; consumption mix, to consumer; more than 32t gross weight / 24,7t payload capacity
EF 1000 km by truck, for the sum of distances from harbour/airport to factory outside Europe. (see methodology)
Transoceanic ship, containers; heavy fuel oil driven, cargo; consumption mix, to consumer; 27.500 dwt payload capacity, ocean going
EF
6000 km by ship. Distance determined using http://www.searates.com/services/routes-explorer, assuming materials moving from New York to Rotterdam.
Articulated lorry transport, Euro 4, Total weight >32 t (without fuel); diesel driven, Euro 4, cargo; consumption mix, to consumer; more than 32t gross weight / 24,7t payload capacity
EF 1000 km by truck for the sum of distances from harbour/airport to factory inside Europe.
Polymer production
Polymerization /Blending Polyester-complexed starch biopolymer production, RER Ecoinvent
Dataset modified by removing Maize Starch and Naphtha inputs and adding PLA and PBT, according to their content in the polymer (i.e. 0.55 kg PBT/kg Polymer + 0.45 kg PLA/kg Polymer). Background datasets replaced with EF datasets, when available.
Transport Transport to production site (from supplier to factory)
Articulated lorry transport, Euro 4, Total weight >32 t (without fuel); diesel driven, Euro 4, cargo; consumption mix, to consumer; more than 32t gross weight / 24,7t payload capacity
EF Transport set accordingly to the methodology document and consistently across scenarios. Distances: 130 Km lorry, 240 Km train, 270 Km ship (See methodology).
Freight train, average (without fuel); technology mix, electricity and diesel driven, cargo; consumption mix, to consumer; average train, gross tonne weight 1000t / 726t payload capacity
EF

Comparative LCA of alternative feedstock for plastics production – DRAFT FOR STAKEHOLDER CONSULTATION Part II
117
Barge; technology mix, diesel driven, cargo; consumption mix, to consumer; 1500 t payload capacity
EF
Article production
Blowing film extrusion Film Extrusion (blowing)| plastic extrusion| production mix, at plant| for PP, PE, PVC, PET and PS {EU-28+EFTA} [LCI result]
EF 1.01 kg of LDPE granulates are needed to produce 1.0 kg of film (according to dataset documentation)
Transport Transport (from factory to distribution centre)
Articulated lorry transport, Euro 4, Total weight >32 t (without fuel); diesel driven, Euro 4, cargo; consumption mix, to consumer; more than 32t gross weight / 24,7 t payload capacity
EF Local supply chain: 1200 km by truck (see methodology)
Articulated lorry transport, Euro 3, Total weight <7.5 t (without fuel); diesel driven, Euro 3, cargo; consumption mix, to consumer; up to 7,5t gross weight / 3,3t payload capacity
EF 250 km round trip by van (see methodology)
EoL Biodegradation in soil
CO2 emission (biogenic) Dataset developed on purpose
Standard degradation rate= 90% (full degradation). C-bio PLA = 50%, PLA = 45% C-fossil PBAT = 63.3*%, PBAT = 55%
CO2 emission (fossil)
Residual non-degraded material
15

Comparative LCA of alternative feedstock for plastics production – DRAFT FOR STAKEHOLDER CONSULTATION Part II
118
1
6.4.1 Polymer production 2
Following the same approach explained in section 4.4.1 for conventional fossil-based polymer (LDPE) 3
explored in the reference scenario, an aggregated, cradle-to-gate, EF-compliant LCI dataset (LDPE 4
granulates| Polymerisation of ethylene|production mix, at plant) was used to model supply at the 5
EU-28 level, with an overall process efficiency of 99.9%. The limitations derived by the aggregated 6
nature of such inventory are the same mentioned in section 4.4.1 for fossil-based HDPE (i.e. 7
predefined allocation rules, no adjustments, etc.). 8
Contrarily, for recycled LDPE supply, an EF-compliant dataset is not available, thus the LCI dataset on 9
the Recycling of polypropylene (PP) plastic|from post-consumer waste, via washing, was chosen as 10
proxy of recycled LDPE supply. As for case study 1 (section 4.4.1) the Circular Footprint Formula was 11
applied to model recycling situations (Circular Footprint Formula), so the recycled material input 12
carries only 50% of the burdens of the recycling process (we assumed A = 0.5 for recycled LDPE). 13
Moreover, it carries a share of the production burdens of the replaced virgin material (i.e. the same 14
burdens that would have been credited to the previous life cycle providing the recycled material). 15
Since the Qs/Qp factor is equal to 0.75 for recycled LDPE, the allocated share of virgin production 16
impacts is equal to 37% (A x Qs/Qp = 0.5 x 0.75= 0.37). 17
For the production of starch-based copolymer in S3, the Ecoinvent dataset Polyester-complexed 18
starch biopolymer production/RER, was used as a source of foreground inventory data, as done for 19
case study 2 (section 5.4.1). The inventory approximates the production of Mater-Bi®, based on 20
calculations and extrapolations of highly aggregated data from an Environmental Product 21
Declaration dating back to 2004. To carry out a full LCA study, such inventory need to be investigated 22
further and possible updated. Moreover, as the actual copolyester is not known, its production 23
burdens were approximated with those of naphtha production, which may only be a rough proxy for 24
the real copolymer. 25
26
Compared to the original Ecoinvent dataset, background inventory datasets were replaced with 27
existing EF-compliant datasets, when available, in the attempt to ensure a consistent modelling 28
(within the scenario and across scenarios). In particular, for maize starch, a specific background 29
dataset was developed by combining the sub-processes of: (i) maize cultivation in the EU (EF-30
compliant dataset), and (ii) starch production via wet milling of maize (based on foreground data 31
from Agrifootprint database and background EF-compliant datasets). Infrastructure processes were 32
removed. 33
Lastly, for the supply of PLA-based polymer in S4, the LCI aggregated dataset for PLA production 34
sourced from Thinkstep Database, and representative of Ingeo® resin manufactured by NatureWorks 35
LLC in Nebraska was used (see section 4.4.1 for further details). For the fossil-based copolymer, the 36
EF-compliant, aggregated, LCI dataset for PBT was used in the modelling, as a proxy of the PBAT 37
mixed to PLA in the reference PLA-based copolymer production (ECOVIO®). Before PLA and fossil-38
based copolymer are blended, the transport of PLA from US supplier to European PLA-based 39
polymer producer had to be introduced in the modelling (see section 6.4.2). Ecoinvent 3.4. dataset 40
Polyester-complexed starch biopolymer production, RER was implemented in the model to represent 41
the blending of the PLA and PBAT and the final polymerization. 42
6.4.2 Transport to article production site 43
The modelling approach applied to the transport of polymer resin to the article production site is the 44
same used in section 4.4.2 Thus, also in the explored mulch film scenarios, the routes considered are 45

Comparative LCA of alternative feedstock for plastics production – DRAFT FOR STAKEHOLDER CONSULTATION Part II
119
the followings: (i) 130 km by articulated lorry (total weight >32 t; Euro 4); (ii) 240 km by train 1
(average freight); and (iii) 270 km by ship (barge, technology mix). LCIs for all types of vehicles are 2
available as EF-compliant datasets, which were used in the modelling. 3
In addition, for PLA-based polymer in S4, transport from US PLA supplier to European PLA-based 4
polymer producer had to be included in the model. Similarly to the case of flexible packaging film 5
(Par. 5.4.2), the modelling is based on standard distances and vehicle types specified in the 6
methodology report for the route supplier-to-factory, considering the case of suppliers located 7
outside Europe. The considered routes are as follows: (i) 1000 km by articulated lorry inside the 8
supplier country (total weight >32 t; Euro 4), (ii) 6000 km by transoceanic ship containers (assuming 9
the distance between New York and Rotterdam harbours13), and (iii) 1000 km by articulated lorry 10
inside the factory country (total weight >32 t; Euro 4). 11
6.4.3 Article production 12
Analogously to the case study on packaging film (section 5.4.3), mulch film was assumed to be 13
manufactured via blown film extrusion in all the explored scenarios. However, PLA as such is only 14
suitable for cast film extrusion (Jamshidian et al., 2010). To allow PLA to be processed through blown 15
film extrusion, and an improved use of additives is normally needed (in terms of usage ratio among 16
different additives or of their sequence of introduction into the extruder; Mallet et al., 2013). 17
Although additives are excluded from the system boundary in this screening exercise (due to lack of 18
data), we assumed that all proper technical and blending solutions are adopted to have all film 19
materials suitable for blown extrusion. 20
Inventory data for the mentioned conversion process were taken from the EF-compliant dataset Film 21
Extrusion (blowing) {EU-28+EFTA}. The latter accounts for a loss of polymer equal to 1%, which was 22
assumed to be entirely sent to incineration (see Section 5.4.3 for further details on the modelling of 23
this process). 24
6.4.4 Transport to final client 25
The transport of the article from the production site to the final client was modelled assuming the 26
route factory distribution centre final client specified in the methodology document (Report I), 27
and considering the corresponding default transport scenario. The following routes were thus 28
considered: (i) 1200 km by articulated lorry (total weight >32 t; Euro 4) from factory to distribution 29
centre (100% local supply chain); and (ii) 250 km round trip by van (lorry <7.5t, EURO 3) from 30
distribution centre to final client (100% local supply). LCIs for all types of vehicles are available as EF-31
compliant datasets, which were used in the modelling. 32
6.4.5 End of Life 33
6.4.5.1 Definition of EoL scenarios 34
The end-of-life options available for mulch film depend on the nature of the polymer they are made 35
of. For the fossil-based LDPE mulch film incineration, landfilling and recycling options were defined, 36
according to the following EoL mix for EU-28: (i) 53% incineration, (ii) 42% landfilling, and (ii) 5% 37
recycling (BioSpri, 2018). 38
Incineration is the most viable option for mulch film, because its contamination with soil and 39
agrochemicals poses a relevant issue both in the landfill disposal and in the recycling of the film 40
13 Source: http://www.searates.com/services/routes-explorer, as specified in the methodology report in case of known producer origin.

Comparative LCA of alternative feedstock for plastics production – DRAFT FOR STAKEHOLDER CONSULTATION Part II
120
itself. The landfilling of soil contaminated mulch film becomes extremely costly because of the 1
increased volume of material to be treated, and of soil removal operations. Recycling of used mulch 2
film, despite being a desired alternative to landfilling, is only possible for low contaminated material 3
(soil contamination less than 5% of mulch weight), with the actual contamination being very high 4
(40% - 50 %, Steinmetz et al., 2016). In Europe, only Germany and Ireland recycle a consistent 5
amount of used mulch film, thanks to an advanced collection system (PRE, 2017).At this stage, the 6
effects of soil contamination and soil removal from used mulch film are not addressed. 7
All EoL options defined for LDPE mulch film require the mulching to be collected after use. The 8
collection was included as separate process preceding the EoL treatments. The collection rate varies 9
with the film thickness: the thicker the film, the higher the collection rate. Thinner LDPE mulch films 10
are easily damaged by sunlight and weather conditions, resulting in a partial collection and 11
increasing the residual mulch film left on the soil (Steinmetz et al., 2016). However, the relation 12
between collection rate and thickness is uncertain. Plastic Recyclers Europe assumes 60% collection 13
rate for mulch film of 25 μm, while Organic Waste System estimates that up to the 68% may remain 14
uncollected in the soil, for a 10 μm thick mulching film (OWS, 2017), with the collection rate 15
increasing up to 90% for mulch film thicker than 25 μm. 16
Our modelling refers to a thick LDPE mulch film, according with the EN 13655 standards, thus a 90% 17
collection rate is assumed. Negative environmental effects due to the accumulation in soil of 18
uncollected LDPE mulch film are acknowledged, but cannot currently be taken into account in a 19
quantitative manner, in this screening LCA. 20
The in-situ biodegradation was the unique end of life option explored for bio-based mulch films, 21
assumed as completely biodegradable. 22
6.4.5.2 Modelling of recycling 23
In S1 and S2 scenarios, mechanical recycling of fossil-based mulch film was modelled with the same 24
aggregated, EF-compliant dataset (Recycling of polypropylene (PP) plastic | from post-consumer 25
waste, via washing, granulation, pelletization | production mix, at plant | 90% recycling rate). As 26
explained in section 4.4.5.2, the dataset specifically refers to PP recycling, but it can be reasonably 27
assumed to be representative of all plastic recycling processes, as these are usually based on similar 28
combinations of the same unit operations (e.g. grinding/shredding, washing/flotation and 29
granulation). It is highlighted that the removal of soil possibly contaminating the mulch film collected 30
from the field after use is not addressed. The overall recycling efficiency is set to 90% of the input 31
material, the rejects being sent to landfilling. 32
The recycled material output is assumed to replace the corresponding virgin polymer, whose 33
primary production burdens are credited to the system. Moreover, to account for the lower overall 34
quality of recycled polymers compared to the replaced virgin material, a substitution ratio equal to 35
0.9 was considered, according to default values specified in the PEF context for PET and LDPE. 36
Finally, according to the Circular Footprint Formula adopted in the PEF context to model recycling 37
options, only 50% of the burdens of the EoL recycling process are allocated to the system (A = 0.5 for 38
LDPE film). Similarly, only 50% of the benefits from avoided virgin material production are assigned 39
to the system itself. 40
6.4.5.3 Modelling of incineration 41
For the incineration process of LDPE mulch film, the conventional (fossil-based) PE, aggregated, EF-42
compliant LCI dataset (Waste incineration of PE [EU-28+EFTA]) was used in the modelling. As 43
mentioned in section 4.4.5.5, the generator of the waste material sent to incineration takes the full 44

Comparative LCA of alternative feedstock for plastics production – DRAFT FOR STAKEHOLDER CONSULTATION Part II
121
burdens from the incineration process, for consistency to the general approach to handle energy 1
recovery, specified in the methodology document (Report I). Moreover, it is also credited for 100% 2
of the benefits from avoided primary production of any recovered energy (electricity and heat). In 3
EF-compliant datasets these credits are already accounted in the aggregated inventory. 4
Note that the incineration of soil contaminating the used mulch film collected from the field is not 5
addressed. 6
6.4.5.4 Modelling of landfilling 7
For the landfilling process of LDPE mulch film, the conventional (fossil-based) plastic waste, 8
aggregated, EF-compliant LCI dataset (Landfill of plastic waste [EU-28+EFTA| at landfill site) was 9
used in the modelling. It includes leachate treatment and transport, excluding collection and pre-10
treatment. The related inventory is material-specific, but refers to the average composition and 11
energy characteristics of plastic waste, rather than to specific polymers. However, it was considered 12
suitable for the purposes of this screening exercise. If landfilling would turn out to be a relevant 13
contributor to the overall lifecycle impacts of the studied articles, an alternative, more specific 14
modelling approach should be considered. 15
As for incineration, the landfilling of soil contaminating used mulch film collected from the field is 16
not addressed. 17
6.4.5.5 Modelling of in-situ degradation 18
According to the overall approach outlined in the methodology document (Report I), in-situ 19
biodegradation was modelled by assuming an overall biodegradation rate in soil equal to 90% (in line 20
with the requirements of EN 17033). The inventory included carbon emissions calculated in 21
accordance with this overall degradation rate (which expresses the share of organic carbon in the 22
material converted to CO2 under testing conditions), and assuming that all degraded carbon is 23
aerobically converted to CO2. Moreover, as the material composition used for modelling purposes 24
(which may be incomplete; Table 35), does not include any metal that would not be degraded, no 25
soil emissions of these substances were accounted for in this screening exercise. Finally, similarly to 26
the non-biodegradable mulch film, the effects of any (unknown) residual compounds from 27
biodegradation or non-degraded plastic part could not be modelled at this stage due to lack of data 28
and established modelling approach. 29
Table 35: Composition of biodegradable mulch film considered for the modelling of in-situ 30 biodegradation 31
Element Starch-based film
PLA-based film
PLA (45%) PBAT (55%)*
TS (%) 99.5 99.9 -
Water (%) 0.5 0.1 -
VS (%TS) 99.9 100 -
Ash (%TS) 0.1 0 -
Cbiogenic (%TS) 11.3 50 -
Cfossil (%TS) 47.3 - 63.3
O (%TS) 3.46 44.4 -
H (%TS) 6.7 5.56 -
32

Comparative LCA of alternative feedstock for plastics production – DRAFT FOR STAKEHOLDER CONSULTATION Part II
122
6.5 Life cycle impact assessment results 1
The characterised potential impacts of the examined scenarios (with and without the iLUC 2
contribution to Climate Change) are reported in Figures 29 to 31. These also show the breakdown of 3
contributions from the main lifecycle stages, which include: i) Polymer production (i.e. all cradle-to-4
gate processes involved in the production and supply of the relevant polymer); ii) Article production 5
(i.e. activities to convert the polymer into a finished article, e.g. stretch-blow moulding); iii) 6
Transport (including all transport processes throughout the life cycle); and (iv) Waste management 7
(i.e. waste treatment processes and any credits from downstream displacement of materials and 8
energy). Normalised and weighted results are reported in Annex B.3. Note that scenario impacts 9
presented in Figures 29 to 31 refer to the EU-average EoL scenario (as described in section 4.4.5), 10
and represent net impacts from waste management, resulting from the balance between real 11
burdens and benefits (if any). Potential impacts calculated assuming 100% of post-consumer bottles 12
being routed to each viable EoL option are presented in Figures 32 to 34. 13
The picture of results obtained for individual scenarios appears reasonable for many impact 14
categories, while some issues are observed for others. Firstly, very high impacts in terms of Human 15
Toxicity – cancer are identified for both fossil-based scenarios, especially R-LDPE, compared to the 16
two bio-based alternatives. Moreover, the production of recycled LDPE shows a worse performance 17
than the production of its virgin counterpart, due to the burdens of the recycling process providing 18
recycled material. In particular, a more detailed investigation revealed that the higher impact of 19
recycling scenario is due to the waterborne emissions of chromium which dominates recycling 20
impact. However, it is acknowledged that the Chromium characterization factor may lead to an 21
overestimated contribution of this substance, which in turn may strongly affect the overall impact 22
also in case of very low chromium emissions. Updated characterisation factors for toxicity-related 23
impact categories are currently under development by the JRC in the Environmental Footprint 24
framework, and their application may be considered or explored in the full LCA case studies. 25
For Eutrophication Freshwater impact category we notice a substantially higher impact of fossil-26
based mulch films, both virgin and recycled material, compared to biodegradable alternatives. This 27
appears to be strange considering that the latter partially incorporate bio-based feedstocks, 28
obtained through agricultural production processes which typically impact on the Eutrophication. 29
The reason behind such relatively higher impact of fossil-based polymer production could not be 30
identified due to the aggregated nature of LCI datasets used in the modelling. This prevented from 31
clarifying this finding. For Eutrophication – Marine and Terrestrial, the same tendency is observed, 32
but only with respect to the starch-based polymer, while the PLA-based polymer performance is 33
similar with fossil-based alternatives, especially the R-LDPE one 34
The results on Ecotoxicity Freshwater impact category show almost aligned impacts for all the 35
scenarios assessed, with the exception of PLA-based mulch film whose impact is substantially lower 36
than the other counterparts. Apparently, any obvious reason can be found behind this result and 37
further investigation was not possible at this stage because of the use of aggregated LCI datasets, as 38
mentioned above. Note, however, that options to overcome (part of) the limitations associated with 39
the use of aggregated datasets (including possibilities of result interpretation) will be explored in the 40
full LCA case studies. These may include the use of more disaggregated (at level-1) EF-compliant 41
datasets, albeit this would only partially improve the possibilities of a more in-depth interpretation 42
(see also section 10). Alternative data sources may also be explored, but the availability of data in 43
the area of plastics (and especially bioplastics) is generally limited, and a mix of sources will remain 44
inevitable (see section 10 for further discussion). 45

Comparative LCA of alternative feedstock for plastics production – DRAFT FOR STAKEHOLDER CONSULTATION Part II
123
Land Use impact category results highlight the greatest impact of PLA-based mulch film. It looks like 1
extremely high also in comparison with the starch-based counterpart, but the different bio-based 2
content in these materials (34% starch-based vs 45% PLA-based) does not justify such a discrepancy. 3
The results for the impact category Water Use appeared to be unreliable. The overall impact is 4
negative for all scenarios, showing a saving of water use in place of a burden in all lifecycle stages, 5
except EoL where a burden is expected. On this basis, we excluded these results from further 6
interpretation in this screening. Nevertheless, the issue of reliability of results for the Water Use 7
category is expected to be solved in next project steps, by identifying and removing any errors and 8
inconsistencies in the implementation of EF-compliant datasets and related impact assessment 9
methods in the used LCA software. If this would not prove sufficient (due e.g. to inconsistencies in 10
the modelling of resource and water flows across datasets from different sources, or flawed water 11
balances), the validity of the datasets will be checked, and alternative sources will be explored, if 12
available (see section 10 for further discussion). 13
When the contribution of iLUC is taken into account in the calculation of the Climate Change impact 14
of bio-based alternatives (starch-based, PLA-based), no relevant changes were detected. An increase 15
in the range of 1% was observed for both alternatives. Therefore, as mentioned in previous case 16
studies, factoring iLUC effects in the modelling does not affect the relative performance of scenarios. 17
However, this outcome needs to be read in light of the iLUC-related GHG emission factors applied in 18
this screening exercise, which appear to fall in the lower end of the range of values available in the 19
recent literature (see section 6.7.1). 20

Comparative LCA of alternative feedstock for plastics production – DRAFT FOR STAKEHOLDER CONSULTATION Part II
124
Figure 29: Potential impact of mulch film LCA scenarios for the categories of Climate Change, Ozone Depletion, Human Toxicity - cancer, Human Toxicity 1 – non-cancer, Particulate Matter and Ionising Radiation. 2
Note: LDPE = LDPE mulch film explored in scenario 1 (S1), R-LDPE = recycled-LDPE mulch film explored in scenario 2 (S2), Starch-based = bio-based 3 mulch film explored in scenario 3 (S3), PLA-based = bio-based mulch film explored in scenario 4 (S4). 4
0
100
200
300
400
500
600
700
LDPE R-LDPE Starch-based PLA-based
kg C
O2
eq
.Climate Change

Comparative LCA of alternative feedstock for plastics production – DRAFT FOR STAKEHOLDER CONSULTATION Part II
125
Figure 30: Potential impact of mulch film LCA scenarios for the categories of Photochemical Ozone Formation, Acidification, Eutrophication Terrestrial, 1 Eutrophication Freshwater, Eutrophication Marine, and Ecotoxicity Freshwater. 2
Note: LDPE = LDPE mulch film explored in scenario 1 (S1), R-LDPE = recycled-LDPE mulch film explored in scenario 2 (S2), Starch-based = bio-based 3 mulch film explored in scenario 3 (S3), PLA-based = bio-based mulch film explored in scenario 4 (S4). 4

Comparative LCA of alternative feedstock for plastics production – DRAFT FOR STAKEHOLDER CONSULTATION Part II
126
Figure 31: Potential impact of mulch film LCA scenarios for the categories of Land Use, Water Use, Resource Use - minerals and metals, and Resource 1 Use - fossils. 2
Note: LDPE = LDPE mulch film explored in scenario 1 (S1), R-LDPE = recycled-LDPE mulch film explored in scenario 2 (S2), Starch-based = bio-based 3 mulch film explored in scenario 3 (S3), PLA-based = bio-based mulch film explored in scenario 4 (S4). 4
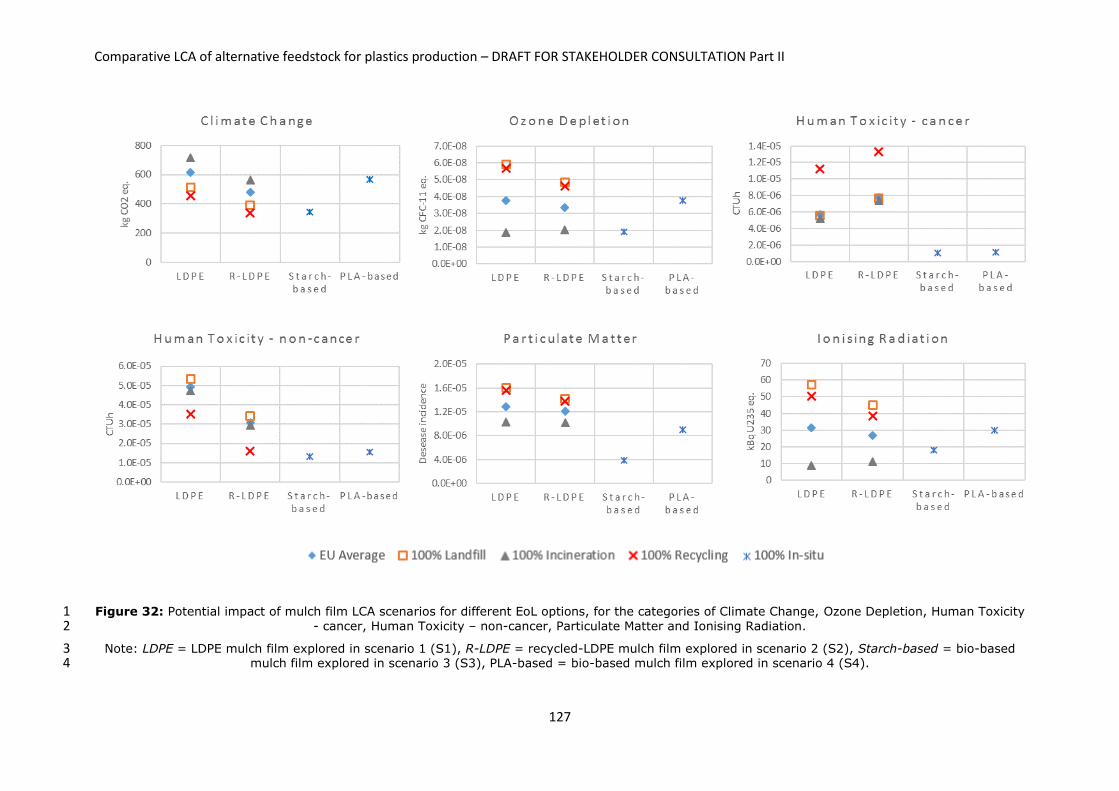
Comparative LCA of alternative feedstock for plastics production – DRAFT FOR STAKEHOLDER CONSULTATION Part II
127
Figure 32: Potential impact of mulch film LCA scenarios for different EoL options, for the categories of Climate Change, Ozone Depletion, Human Toxicity 1 - cancer, Human Toxicity – non-cancer, Particulate Matter and Ionising Radiation. 2
Note: LDPE = LDPE mulch film explored in scenario 1 (S1), R-LDPE = recycled-LDPE mulch film explored in scenario 2 (S2), Starch-based = bio-based 3 mulch film explored in scenario 3 (S3), PLA-based = bio-based mulch film explored in scenario 4 (S4). 4
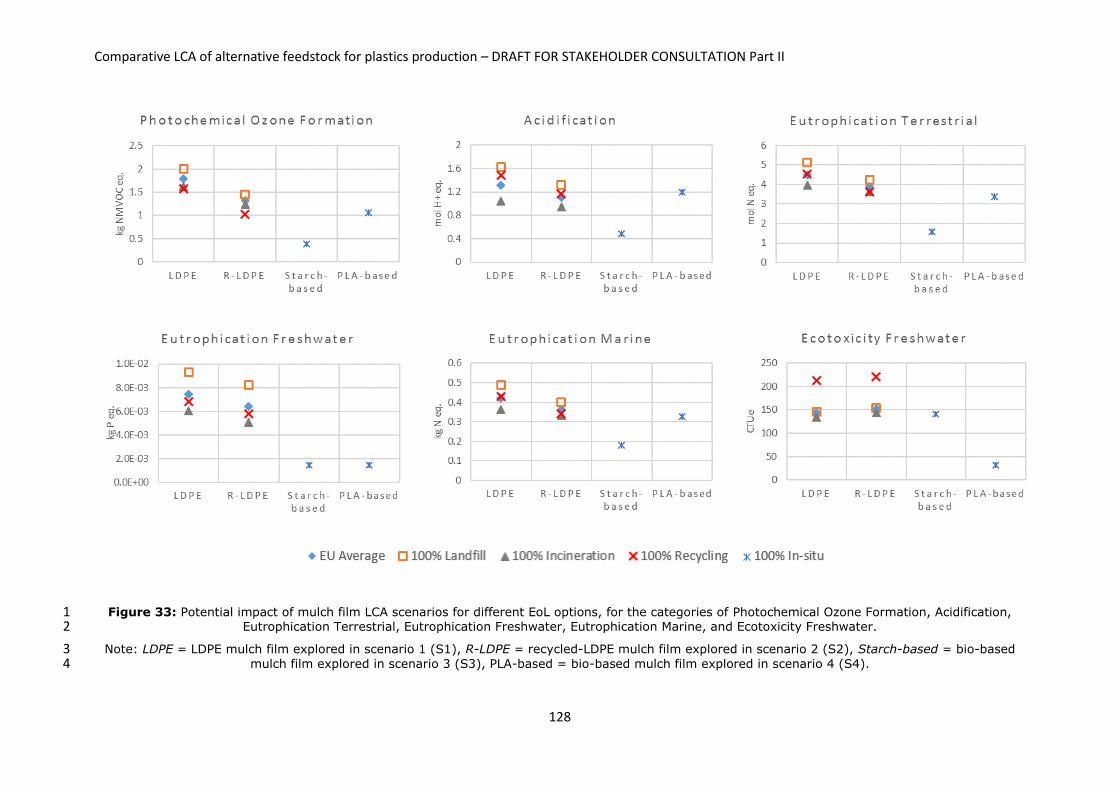
Comparative LCA of alternative feedstock for plastics production – DRAFT FOR STAKEHOLDER CONSULTATION Part II
128
Figure 33: Potential impact of mulch film LCA scenarios for different EoL options, for the categories of Photochemical Ozone Formation, Acidification, 1 Eutrophication Terrestrial, Eutrophication Freshwater, Eutrophication Marine, and Ecotoxicity Freshwater. 2
Note: LDPE = LDPE mulch film explored in scenario 1 (S1), R-LDPE = recycled-LDPE mulch film explored in scenario 2 (S2), Starch-based = bio-based 3 mulch film explored in scenario 3 (S3), PLA-based = bio-based mulch film explored in scenario 4 (S4). 4

Comparative LCA of alternative feedstock for plastics production – DRAFT FOR STAKEHOLDER CONSULTATION Part II
129
Figure 34: Potential impact of mulch film LCA scenarios for different EoL options, for the categories of Land Use, Water Use, Resource Use – minerals 1 and metals, and Resource Use - fossils. 2
Note: LDPE = LDPE mulch film explored in scenario 1 (S1), R-LDPE = recycled-LDPE mulch film explored in scenario 2 (S2), Starch-based = bio-based 3 mulch film explored in scenario 3 (S3), PLA-based = bio-based mulch film explored in scenario 4 (S4). 4

Comparative LCA of alternative feedstock for plastics production – DRAFT FOR STAKEHOLDER CONSULTATION Part II
130
6.6 Interpretation 1
In the interpretation of case study results, scenario impacts calculated for both the EU-average EoL 2
scenario and the individual EoL options are firstly compared (6.6.1). Most relevant impact categories 3
and lifecycle stages are then identified (6.6.1.1 and 6.6.1.2, respectively). Identification of most 4
relevant processes was not undertaken at this stage, as in the majority of scenarios the whole, 5
cradle-to-gate process-chain involved in polymer production was modelled through a single, 6
vertically aggregated dataset, already representing the corresponding lifecycle stage. Therefore, no 7
additional insights would be gained with this exercise for such stage, which is expected to include a 8
number of relevant lifecycle processes. Moreover, while for some scenarios a greater level of 9
disaggregation could be achieved (e.g. for starch based-co-polymer), a more in-depth investigation 10
of relevant processes would provide an "unbalanced" picture compared to the other scenarios. 11
6.6.1 Case study results 12
Focusing on the first alternative feedstock (i.e. R-LDPE) a general lower impact compared to the 13
virgin fossil-based reference scenario (i.e. LDPE) is noticed for all the impact categories, except for 14
carcinogenic Human toxicity. This is due to the higher impact associated with recycled feedstock 15
supply, even though the actual emission driving such additional impact could not be identified, due 16
to the aggregated nature of the datasets used at this stage. 17
18
It is also highlighted that the R-LDPE feedstock was not derived from closed loop recycling of mulch 19
film. This assumption disregards the effect of the mulch film contamination by soil, which may play a 20
key role in the film recycling stage. Plastic Recyclers quantifies the soil remaining on the mulch film 21
after collection in 3 kg per kg of plastic film. The removal of such soil quantity may increase the 22
recycling stage impact, due to additional energy consumption and disposal of removed material. 23
Concerning the first bio-based and biodegradable alternative material (e.g. starch-based polymer) 24
assessed for mulch film production, an overall improved environmental performance is observed in 25
the vast majority of the categories with respect to both virgin and recycled LDPE. An exception is, as 26
it may be expected, land use. However, the results of this screening phase are affected by the 27
polymer manufacturing modelling, where the fossil-based co-polymer (34%) was roughly 28
approximated with naphtha. 29
A similar situation is observed for the second bio-based and biodegradable alternative (e.g. PLA-30
based polymer) when compared to virgin LDPE. However, in this case the impact can be considered 31
comparable, in terms of Ozone Depletion and few other categories (e.g. Climate Change and 32
Acidification). Compared to R-LDPE, PLA-based polymer achieves better performances in a reduced 33
number of impact categories, with Climate Change, Ionizing Radiation and Ozone Depletion showing 34
a worsened performance. Similarly to starch-based polymer, the PLA-based polymer manufacturing 35
was approximated with production LCI data for a simpler compound (i.e. PBT in place of PBAT). 36
In general, the starch-based biodegradable film exhibits a lower impact than its PLA-based 37
counterpart in most of the categories. However, a worse performance in terms of Ecotoxicity 38
Freshwater and Ozone Depletion (due to higher production impacts) is identified, while a 39
comparable impact in Human Toxicity (both cancer and non-cancer) and Eutrophication Freshwater 40
is shown. It is worth highlighting that these preliminary results need to be interpreted in light of the 41
approximated inventories used to model the production phase of both bio-based polymers. 42
Finally, it has to be highlighted that the above comparative considerations need to be read in light of 43
the partial modelling of in-situ biodegradation (which only addresses C emissions), and the lack of a 44
proper modelling for plastic accumulation in soil due to the quota of non-biodegradable, fossil-based 45
Comparative LCA of alternative feedstock for plastics production – DRAFT FOR STAKEHOLDER CONSULTATION Part II
131
mulch film remaining uncollected in the field, and soil contamination of mulch film collected after 1
use at the end of crop season. Due to the possible relevant influence of these aspects on the EoL 2
options assessed, an overarching comparison between recycling and in-situ biodegradation, could 3
not be performed at this stage. 4
Focusing on the results for the individual EoL options, the only viable option modelled for 5
biodegradable mulch films is the in-situ biodegradation. As a consequence, the following discussion 6
addresses only the impact of fossil-based mulch film scenarios. 7
Due to the generally low contribution of the EoL stage to the overall scenario impact, results do not 8
dramatically change when considering 100% of a specific EoL option in place of the EU-average EoL 9
option assumed as a baseline. However, within this limited range of variation, it is observed that 10
fossil-based mulch films incineration has the worst performance in terms of Climate Change, while 11
being the least impacting alternative for few categories, including Particulate Matter, Acidification, 12
Ozone Depletion, Ionizing Radiation, Eutrophication Freshwater. 13
As a general tendency, the landfilling is represented as the worst performing option for many impact 14
categories (i.e. Photochemical Ozone Formation, Acidification, Resource Use – fossils, Human 15
Toxicity – non-cancer, Ionizing Radiation, Eutrophication Terrestrial, Freshwater and Marine, 16
Resource Use – minerals and metals), in line with the priority ranking set by waste hierarchy. 17
Conversely, the outcomes for recycling are not entirely aligned with the waste treatment ranking, as 18
it appears to be the least contributing option only for few categories (i.e. Climate Change, 19
Photochemical Ozone Formation, Human Toxicity – non-cancer, Resource Use – minerals and 20
metals). Moreover, for Human Toxicity – cancer and Ecotoxicity Freshwater it unexpectedly turns 21
out as the worst option. This is mainly due to chromium emissions to water from recycling process, 22
as already mentioned in section 6.5. 23
6.6.1.1 Identification of most relevant impact categories 24
25

Comparative LCA of alternative feedstock for plastics production – DRAFT FOR STAKEHOLDER CONSULTATION Part II
132
Table 36 shows the most relevant impact categories identified for each scenario based on 1
normalised and weighted impacts, according to the approach outlined in the methodology 2
document (Report I). Relevant categories were thus identified as those that cumulatively contribute 3
to at least 80% of the total normalised and weighted impact of the 16 considered impact categories. 4
Results for Water Use were not considered to be reliable (see Section 4.5), and were excluded from 5
the calculation of the ranking (adjusting default weighting factors accordingly). 6
Climate change and Resource Use – fossils were identified as the two most relevant categories in all 7
the assessed scenarios. In addition to these, Human toxicity – cancer appears to be relevant for 8
three scenarios over the four assessed, being replaced by Acidification in scenario 4 (PLA-based 9
mulch film). However, the contribution of the last two categories is limited (lower than 13%). 10
11

Comparative LCA of alternative feedstock for plastics production – DRAFT FOR STAKEHOLDER CONSULTATION Part II
133
Table 36: Most relevant impact categories identified for mulch film LCA scenarios 1
S1 Fossil LDPE S2 Recycled LDPE
Impact category Contrib. (%) Impact category Contrib. (%)
Climate Change 40% Climate Change 40%
Resource Use- fossils 40% Resource Use - fossils 33%
Human Toxicity - cancer 7% Human Toxicity - cancer 13%
Total 87% Total 86%
S3 Starch-based S4 PLA-based
Impact category Contrib. (%) Impact category Contrib. (%)
Climate Change 52% Climate Change 48%
Resource Use - fossils 31% Resource Use - fossils 36%
Human Toxicity - Cancer 3% Acidification 4%
Total 86% Total 88%
6.6.1.2 Identification of most relevant life cycle stages / processes 2
In 3

Comparative LCA of alternative feedstock for plastics production – DRAFT FOR STAKEHOLDER CONSULTATION Part II
134
Table 37 the life cycle stages which impact the most in the assessed mulch film scenarios are 1
presented for the most relevant impact categories (as identified in 6.6.1.1). The contributions are 2
calculated on the basis of characterized results of mulch film scenarios, consistently to the approach 3
detailed in the methodology document (Report I). 4
As a general tendency, polymer production appears to be the most relevant life cycle stage in all 5
scenarios, across all the categories under assessment, showing itself a contribution greater than 80% 6
to Human toxicity – cancer and Resource Use – fossils. The only exception is R-LDPE mulch film 7
where the 80% contribution for Resource Use – fossils is provided by polymer production (75.7%) 8
with EoL (15.2%). 9
EoL can also be identified as relevant life cycle stage, being the second relevant stage in all scenarios, 10
in terms of Climate Change impact. 11
Concerning article production and transport stages the contribution across all identified relevant 12
impact categories is minor in all scenarios. 13
14

Comparative LCA of alternative feedstock for plastics production – DRAFT FOR STAKEHOLDER CONSULTATION Part II
135
Table 37: Most relevant life cycle stages for mulch film LCA scenarios. Note: life cycle stages in 1 orange contribute to more than 80%. 2
S1 Fossil LDPE
Climate Change Resource Use - fossils Human Toxicity - cancer
Life cycle stage Contrib. (%) Life cycle stage Contrib. (%) Life cycle stage Contrib. (%)
Polymer production
66.50% Polymer production
80.20% Polymer production
92.10%
EoL 21.30% EoL 13.80% EoL 4.50%
Article production 8.60% Article production 4.30% Article production 2.50%
Transport 3.60% Transport 1.70% Transport 0.90%
S2 Recycled LDPE
Climate Change Resource Use - fossils Human Toxicity - cancer
Life cycle stage Contrib. (%) Life cycle stage Contrib. (%) Life cycle stage Contrib. (%)
Polymer production
60.60% Polymer production
75.70% Polymer production
93.80%
EoL 23.60% EoL 15.20% EoL 3.70%
Article production 11.00% Article production 6.60% Transport 1.80%
Transport 4.70% Transport 2.50% Article production 0.70%
S3 Starch-based
Climate Change Resource Use - fossils Human Toxicity - cancer
Life cycle stage Contrib. (%) Life cycle stage Contrib. (%) Life cycle stage Contrib. (%)
Polymer production
48.80% Polymer production
87.80% Polymer production
88.40%
EoL 41.00% Article production 8.90% Transport 7.19%
Article production 7.10% Transport 3.30% Article production 4.41%
Transport 3.10% EoL 0.00% EoL 0.00%
S4 PLA-based
Climate Change Resource Use - fossils Acidification
Life cycle stage Contrib. (%) Life cycle stage Contrib. (%) Life cycle stage Contrib. (%)
Polymer production
77.60% Polymer production
94.80% Polymer production
87.87%
EoL 16.80% Article production 3.80% Transport 5.58%
Article production 3.90% Transport 1.40% Article production 5.55%
Transport 1.70% EoL 0.00% EoL 0.00%
3
6.7 Learnings from applying the draft methodology 4
This section summarises the main learnings from applying the draft methodology to this specific case 5
study. The discussion separately addresses the main implications and limitations of the applied 6
method (and data) on the overall results (6.7.1), as well as the possible options that will or can be 7
undertaken to overcome such limitations, or explored to further improve the assessment (6.7.2). 8
6.7.1 Implications of the methodological choices on the results 9
This section summarises some of the key methodological choices affecting the results and the 10
interpretation reported in the previous paragraphs. These are identified in: i) modelling of the 11
production of bio-based polymers, ii) handling of plastic accumulation in soil due to incomplete 12
collection of conventional (fossil-based) mulch film after use, iii) modelling of in-situ biodegradation 13
of biodegradable mulch films, iv) handling of soil contamination of collected non-biodegradable 14
mulch film, and v) approach used to quantify the iLUC contribution. 15

Comparative LCA of alternative feedstock for plastics production – DRAFT FOR STAKEHOLDER CONSULTATION Part II
136
Due to limited data availability, potentially relevant simplifying assumptions had to be performed in 1
the modelling of bio-based polymer production (i.e. starch-based and PLA-based polymers). In 2
particular, the fossil-based copolyester blended in the starch-based polymer was roughly 3
approximated to Naphtha, according to the assumption performed in the ecoinvent dataset used as 4
a source of foreground data. Moreover, the PBAT copolymer used in the PLA-based polymer was 5
approximated to PBT, while the blending process was assumed to be the same as the starch-based 6
polymer. Due to the potential influence on the overall results, the modelling of bio-polymer 7
production should be refined when performing a full LCA study. 8
Regarding the EoL of conventional, non-biodegradable mulch film remaining uncollected in the soil 9
at the end of the cropping cycle (assumed to be 10% of applied film), this screening assessment did 10
not consider any possible impact due to plastic accumulation in soil (e.g. detrimental effects on soil 11
quality and potential toxicity-related impacts from residual plastic compounds including 12
microplastics). A decrease in soil quality caused by plastic accumulation may lead to reduced yield in 13
the cropping cycle following mulch application. For instance, a yield decrease has been observed to 14
be particularly heavy (up to -23%) for cotton cultivation in China (BASF, 2016). However, it is 15
acknowledged also in European countries of the Mediterranean basin (e.g. Spain; European 16
Bioplastics, 2018). Such an effect has not been addressed at this stage due to lack of robust and 17
consistent evidence for EU. Moreover, potential (toxicological) impacts from residual plastic 18
materials accumulated in soils (including any subsequently formed microplastic) were not accounted 19
for, due to the lack of fundamental fate-exposure-effect data for impact assessment. 20
In-situ degradation of biodegradable mulch film was only partially modelled, i.e. only in terms of 21
airborne emissions from carbon degradation. Emissions (and related effects) of any residual (non-22
degradable) substance (e.g. additives and metals) could not be addressed, due to the very limited 23
availability of material composition data (which are restricted to basic elements like C, H and O). 24
However, the modelling should be complemented with composition data to be used as an input for 25
estimating emissions to soil of residual compounds and, in the presence of suitable characterisation 26
factors (which cannot be taken for granted), the corresponding potential impacts. In particular, 27
composition data should account for additives used in the blending of polymers, even though 28
detailed information on substances added in the production of agriculture mulch film may be not 29
disclosed by the industry. 30
The burdens of the EoL recycling option for LDPE mulch film were approximated to those of PP 31
recycling, assuming the two processes are based on similar combinations of the same unit 32
operations, but excluding those possibly needed for the removal of soil contaminating the mulch 33
film collected from the field after use. Similarly, any effects of soil contamination of conventional 34
mulch film were not addressed also for the other viable EoL options, i.e. incineration and landfilling. 35
Finally, it should be kept in mind that the iLUC contribution used in this screening only accounted for 36
carbon emissions, thus only impacts on the climate change category were addressed. A larger iLUC 37
GHG contribution and the inclusion of nutrients-related impacts (due to e.g. intensification) in the 38
iLUC inventory may worsen the Climate Change, Acidification, and Eutrophication performances of 39
the two bio-based mulch-film scenarios. 40
6.7.2 Options to be explored for further improvement 41
As for the modelling of starch-based polymer production, alternative data sources providing an 42
improved inventory for the fossil-based copolyester are currently not available. Hence, input will be 43
sought from relevant stakeholders in the attempt to clarify the actual (nature of) the co-polyester, 44
collect related production LCI data, or to gather valuable opinions on which compound could be 45

Comparative LCA of alternative feedstock for plastics production – DRAFT FOR STAKEHOLDER CONSULTATION Part II
137
used as a closer proxy for modelling purposes, without the risk of underestimating actual production 1
impacts. Similarly, more specific data will be required with respects to PBAT production (quantities 2
of each co-monomer and burdens of the polymerisation process), as well as for the blending process 3
of PLA and PBAT used as input for obtaining the compound used for film production. 4
To perform an assessment of the potential environmental consequences from a decrease in soil 5
quality (and resulting crop yield) due to the accumulation of uncollected conventional mulch film in 6
soil, more robust and consistent quantitative evidence of this phenomenon in EU countries is 7
needed. The availability of any (undisclosed) studies and information will be checked with relevant 8
stakeholder and, in case, properly collected and assessed. If an improved evidence base will 9
ultimately be available, a future full LCA case study may address the effects of a decreased 10
production per hectare due to soil contamination both in terms of increased need for agricultural 11
inputs, and additional land demand to compensate for production loss. However, this may require a 12
change in the functional unit to e.g. the cultivation of 1 ha of a specific mulched crop, thus partially 13
loosing the connection with the primary function of the assessed plastic article (i.e. providing 14
mulching), and potentially restricting the validity of results to the selected crop. A quantitative 15
assessment of the potential toxicological effects of (micro)plastics accumulating in soil is not 16
foreseen to be feasible, due to the lack of fundamental (fate-exposure-effect) data to be applied in a 17
LCA context. 18
In the attempt to improve the modelling of (emissions from) in-situ degradation of biodegradable 19
mulch film, the availability of more detailed material composition data (including any metals and 20
additives) will be checked with relevant stakeholders. However, composition data alone may not be 21
sufficient, as these shall be complemented by suitable characterisation factors for the corresponding 22
substances to undertake a full impact assessment. The availability of proper factors, or of reasonable 23
proxies, will be checked once composition data specifying the type (and quantities) of substances 24
involved is available. 25
In a full LCA case study, the effects of soil particles contaminating collected conventional mulch film 26
may be taken into account in the modelling of each viable EoL options, both in terms of additional 27
burdens and benefits (if any). For instance, energy consumption from conventional recycling 28
processes may be increased in proportion to the mass of contaminating soil to be treated/removed, 29
and the burdens associated with its disposal as a reject may be taken into account. Moreover, the 30
modelling of incineration could account for the burdens and any benefits associated with the 31
combustion of such a mass of soil. 32
Finally, for iLUC alternative approaches may be applied along with the currently used values 33
(provided they reliability is proven), in order to get a range of iLUC climate change impacts, rather 34
than a single point value. Moreover, approaches that allows for quantification of consequences on 35
additional impact categories (due to e.g. intensification) may be explored. 36
In conclusion, for this screening case study, stakeholders are invited to provide relevant inputs on 37
the following aspects (other than on any performed methodological choice): i) improved information 38
on the (fossil-based) copolyester(s) used for starch-based polymer production and on suitable LCI 39
data to be used for modelling; ii) more specific LCI data for PBAT production and for the subsequent 40
blending process to obtain the PLA-based biodegradable polymer; iii) any robust, quantitative 41
evidence on the effects of soil accumulation of conventional mulch film on soil quality and crop 42
production yield; iv) more detailed composition data for (film grade) starch- and PLA-based 43
biodegradable polymers, especially with regard to metals, and additives used during polymerisation, 44

Comparative LCA of alternative feedstock for plastics production – DRAFT FOR STAKEHOLDER CONSULTATION Part II
138
blending and film production (if any); and v) any robust quantitative data on contamination of 1
conventional plastic film after removal from soil. 2
3

Comparative LCA of alternative feedstock for plastics production – DRAFT FOR STAKEHOLDER CONSULTATION Part II
139
7. Case study 4: insulation board 1
7.1 Assessed scenarios 2
The use of different materials and/or feedstock for manufacturing of insulation boards was explored 3
by assessing a number of alternative scenarios (Table 38). Two reference scenarios based on fossil-4
based plastics (PUR and EPS) were analysed. The use of recycled (fossil-based) post-consumer plastic 5
(PET) was also explored (Scenario 3), assuming a 100% recycled content. Although different shares of 6
recycled material can be mixed with virgin material to be used as input for the production of 7
insulation, this study focuses on articles relying entirely on recycled input. This allows assessing the 8
effects of a complete substitution of the virgin material. The use of CO2 captured from point 9
emission sources was explored in scenario 4. Capture from coal-fired power plants and cement kilns 10
(the two largest stationary sources of CO2 emissions according to IPCC, 2005) was specifically 11
considered. Captured CO2 is then converted to methanol first, then to propylene via the methanol-12
to-olefin route and finally to propylene oxide by oxidation. This is then used as ingredient for the 13
production of polyols in place of conventional propylene oxide. Due to the innovative nature of this 14
alternative route, the LCI data used in the modelling mostly derive from process simulations and 15
modelling exercise found in the literature, rather than full-scale production facilities. Therefore, a 16
fully appropriate and consistent comparison with the other scenarios assessed for this scenario 17
could not be ensured. A partly bio-based alternative to fossil-based insulation material was assessed 18
in Scenario 5, where soy-based PUR was considered. This is obtained by replacing fossil-based 19
polyols with soy-based polyols in the PUR production process. Owing to the fact that the 20
market/production of soy-based polyols is still relatively small, little information was available to 21
compile a LCI of the production process. Therefore, the results obtained may not be representative 22
of full-scale industrial production and should be used carefully. 23
Table 38: LCA scenarios assessed for the insulation material screening case study. Notice that 24 CO2-PUR and Bio-PUR are only partly CO2- and bio-based. 25
Scenario Polymer Monomer(s) Feedstock EoL options(a)
1 - Conventional polymer 1 PUR PO(b) EO(c) MDI(d)
Fossil-based (oil/natural gas) Recycling Incineration Landfilling
2 - Conventional polymer 2 EPS Styrene Fossil-based (oil/natural gas) Recycling Incineration Landfilling
3 - Alternative polymer 1 R-PET MEG(e) PTA(f)
Fossil-based (oil/natural gas) Recycling Incineration Landfilling
4 - Alternative polymer 2 CO2-PUR PO(b)
EO(c)
MDI(d)
Fossil-based CO2
Fossil-based (oil/natural gas) Recycling Incineration Landfilling
5 - Alternative polymer 3 Bio-PUR PO(b)
EO(c)
MDI(d)
Soybean (EU) Fossil-based (oil/natural gas)
Recycling Incineration Landfilling
(a) The impacts of scenarios were individually assessed for each listed EoL option, as well as for a 26 combination of such options reflecting as far as possible the average situation at the EU level. 27
(b) PO: propylene oxide 28 (c) EO: ethylene oxide 29 (d) MDI: methylene diphenyl diisocyanate 30 (e) MEG: mono ethylene glycol 31 (f) PTA: purified terephthalic acid 32
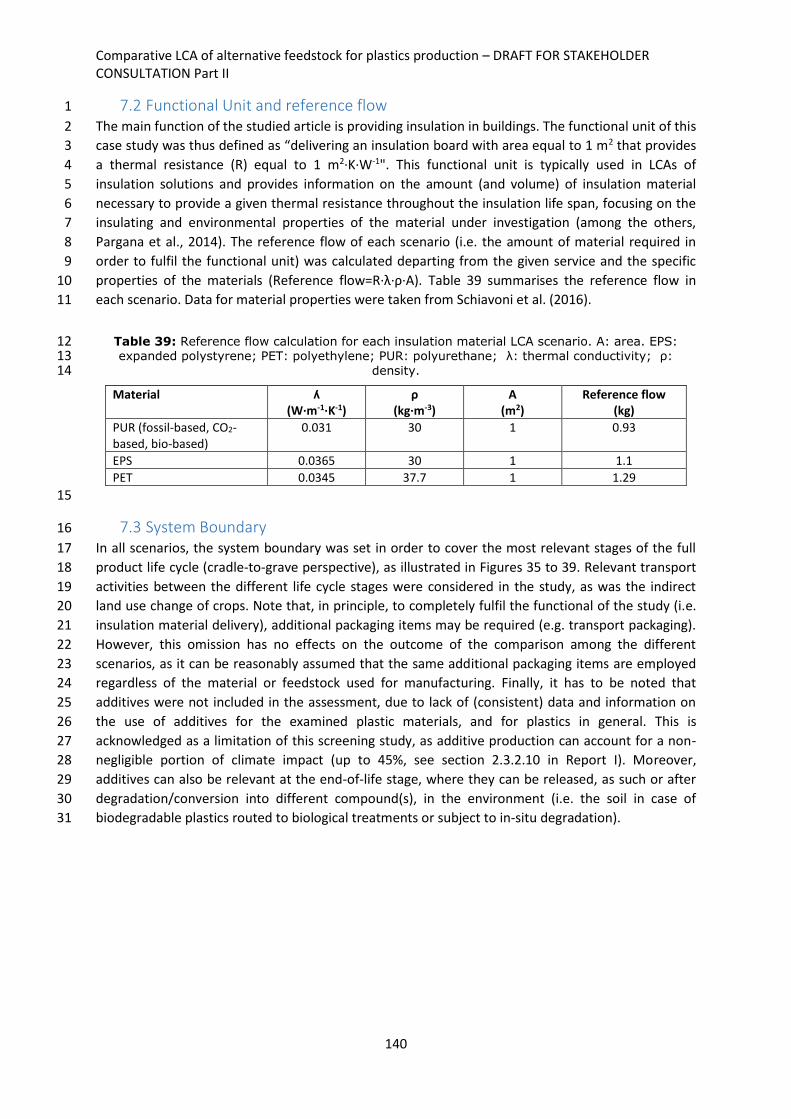
Comparative LCA of alternative feedstock for plastics production – DRAFT FOR STAKEHOLDER CONSULTATION Part II
140
7.2 Functional Unit and reference flow 1
The main function of the studied article is providing insulation in buildings. The functional unit of this 2
case study was thus defined as “delivering an insulation board with area equal to 1 m2 that provides 3
a thermal resistance (R) equal to 1 m2∙K∙W-1". This functional unit is typically used in LCAs of 4
insulation solutions and provides information on the amount (and volume) of insulation material 5
necessary to provide a given thermal resistance throughout the insulation life span, focusing on the 6
insulating and environmental properties of the material under investigation (among the others, 7
Pargana et al., 2014). The reference flow of each scenario (i.e. the amount of material required in 8
order to fulfil the functional unit) was calculated departing from the given service and the specific 9
properties of the materials (Reference flow=R∙λ∙ρ∙A). Table 39 summarises the reference flow in 10
each scenario. Data for material properties were taken from Schiavoni et al. (2016). 11
Table 39: Reference flow calculation for each insulation material LCA scenario. A: area. EPS: 12 expanded polystyrene; PET: polyethylene; PUR: polyurethane; λ: thermal conductivity; ρ: 13
density. 14
Material ʎ (W∙m-1∙K-1)
ρ (kg∙m-3)
A (m2)
Reference flow (kg)
PUR (fossil-based, CO2-based, bio-based)
0.031 30 1 0.93
EPS 0.0365 30 1 1.1
PET 0.0345 37.7 1 1.29
15
7.3 System Boundary 16
In all scenarios, the system boundary was set in order to cover the most relevant stages of the full 17
product life cycle (cradle-to-grave perspective), as illustrated in Figures 35 to 39. Relevant transport 18
activities between the different life cycle stages were considered in the study, as was the indirect 19
land use change of crops. Note that, in principle, to completely fulfil the functional of the study (i.e. 20
insulation material delivery), additional packaging items may be required (e.g. transport packaging). 21
However, this omission has no effects on the outcome of the comparison among the different 22
scenarios, as it can be reasonably assumed that the same additional packaging items are employed 23
regardless of the material or feedstock used for manufacturing. Finally, it has to be noted that 24
additives were not included in the assessment, due to lack of (consistent) data and information on 25
the use of additives for the examined plastic materials, and for plastics in general. This is 26
acknowledged as a limitation of this screening study, as additive production can account for a non-27
negligible portion of climate impact (up to 45%, see section 2.3.2.10 in Report I). Moreover, 28
additives can also be relevant at the end-of-life stage, where they can be released, as such or after 29
degradation/conversion into different compound(s), in the environment (i.e. the soil in case of 30
biodegradable plastics routed to biological treatments or subject to in-situ degradation). 31

Comparative LCA of alternative feedstock for plastics production – DRAFT FOR STAKEHOLDER CONSULTATION Part II
141
1
2
Figure 35: System boundary for fossil-based PUR insulation (Scenario 1). R: thermal resistance. (*) Handled according to the Circular Footprint Formula 3
4
Figure 36: System boundary for fossil-based EPS insulation (Scenario 2). R: thermal resistance. (*) Handled according to the Circular Footprint Formula 5
6
Figure 37: System boundary for fossil-based R-PET insulation (Scenario 3). (*) Modelled according to the Circular Footprint Formula. R: thermal 7 resistance. 8
Fossil fuel extraction and
refiningEnergy
Energy
production
Waste
Recycling
Incineration
Landfilling EnergyEnergy
production
Production of
PUR
Production of insulation board
R=1
Resource
extraction
Resource
extraction
Approach A
Recycled
material*Production
Resource
extraction
Fossil fuel extraction and
refiningElectricity
Electricity
production
Waste
Recycling
Incineration
Landfilling ElectricityElectricity
production
Production of
PUR
Production of insulation board
R=1
PURResource
extraction
Resource
extraction
Approach B
(Base adjusted)Recycled
ProductProduction
Resource
extraction
Fossil fuel extraction and
refiningElectricity
Electricity
production
Waste
Recycling
Incineration
Landfilling ElectricityElectricity
production
Production of
PUR
Production of insulation board
R=1
PURResource
extraction
Resource
extraction
Approach C
(System expansion)Recycled
ProductProduction
Resource
extraction
NOTE:
B and C in this case are the same, as there are no other multifunctionalities. They differ for the datasets used.
Collection is here assumed to be included in “Recycling”.
Yet, in the case of Approach B and also for the EOL, the collection of Waste PET should in principle (to be 100% consistent) be different between the stream-to-Recycling (e.g. separate collection at source) and the
stream to incineration/landfilling (mixed MSW collection). However, the collection is not expected to play environmentally a big role. So, as approximation we could simply assume that all collection is the same
regardless of final treatment
(T) stands for transport. Anyway, I suggest to skip it to simplify.
Consumer
Consumer
PUR
Consumer
Fossil fuel extraction and
refiningEnergy
Energy
production
Waste
Recycling
Incineration
Landfilling EnergyEnergy
production
Production of
EPS
Production of insulatIon board
R=1
EPSResource
extraction
Resource
extraction
Approach A
Recycled
Material*Production
Resource
extraction
Fossil fuel extraction and
refiningElectricity
Electricity
production
Waste
Recycling
Incineration
Landfilling ElectricityElectricity
production
Production of
EPS
Production of insulated panel
R=1
EPSResource
extraction
Resource
extraction
Approach B
(Base adjusted)Recycled
ProductProduction
Resource
extraction
Fossil fuel extraction and
refiningElectricity
Electricity
production
Waste
Recycling
Incineration
Landfilling ElectricityElectricity
production
Production of
EPS
Production of insulated panel
R=1
EPSResource
extraction
Resource
extraction
Approach C
(System expansion)Recycled
ProductProduction
Resource
extraction
NOTE:
B and C in this case are the same, as there are no other multifunctionalities. They differ for the datasets used.
Collection is here assumed to be included in “Recycling”.
Yet, in the case of Approach B and also for the EOL, the collection of Waste PET should in principle (to be 100% consistent) be different between the stream-to-Recycling (e.g. separate collection at source) and the
stream to incineration/landfilling (mixed MSW collection). However, the collection is not expected to play environmentally a big role. So, as approximation we could simply assume that all collection is the same
regardless of final treatment
(T) stands for transport. Anyway, I suggest to skip it to simplify.
Consumer
Production of insulatIon board
R=1Energy
Energy
productionWaste PET*
Recycling
Incineration
Landfilling EnergyEnergy
production
Waste Resource
extraction
Resource
extraction
Production of insulated panel
R=1Electricity
Electricity
productionWaste PET
Recycling
Incineration
Landfilling ElectricityElectricity
production
WasteResource
extraction
Resource
extraction
Avo
ide
d w
aste
tre
atm
en
t
Waste PET
ElectricityElectricity
productionIncineration
Landfilling ElectricityElectricity
production
Resource
extraction
Resource
extraction
Approach A
Approach B and C
(Base adjusted and System expansion)Recycled
ProductProduction
Resource
extraction
Recycled
Material*Production
Resource
extraction
RecyclingrPET
RecyclingrPET
(T)
NOTE:
B and C in this case are the same, as there are no other multifunctionalities. They differ for the datasets used.
Collection is here assumed to be included in “Recycling”.
Yet, in the case of Approach B and also for the EOL, the collection of Waste PET should in principle (to be 100% consistent) be different between the stream-to-Recycling (e.g. separate collection at source)
and the stream to incineration/landfilling (mixed MSW collection). However, the collection is not expected to play environmentally a big role. So, as approximation we could simply assume that all collection is
the same regardless of final treatment
(T) stands for transport. Anyway, I suggest to skip it to simplify.
Consumer
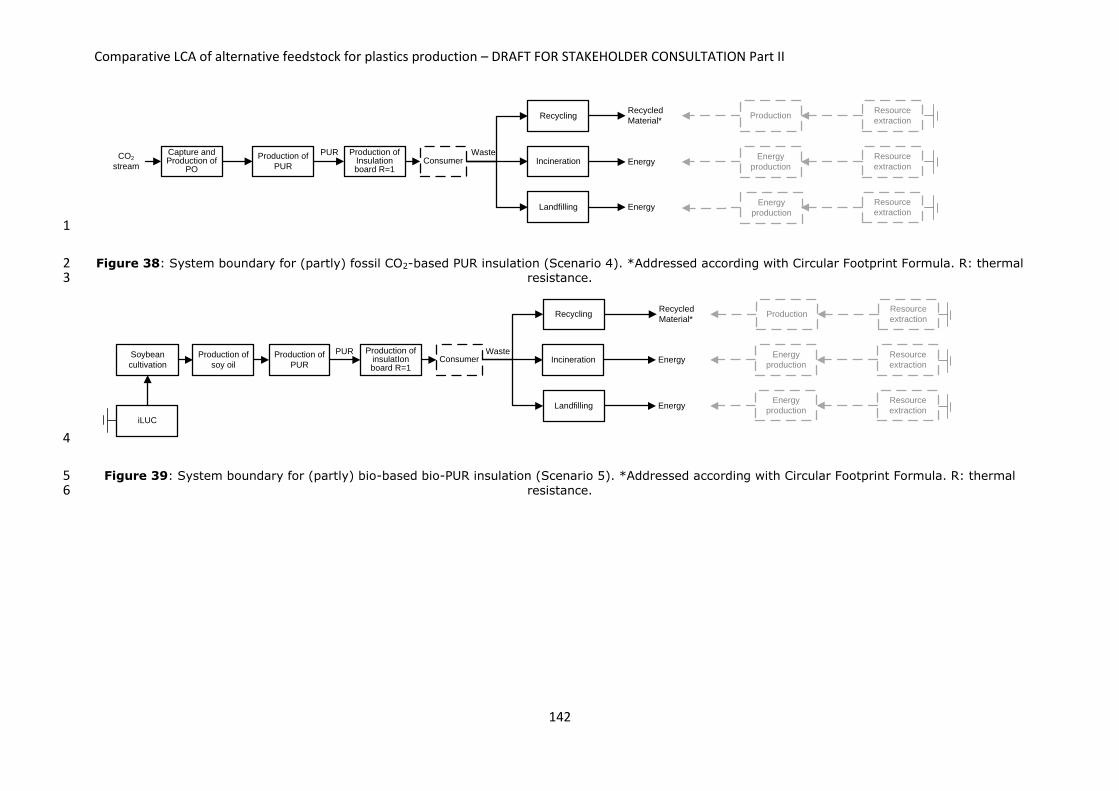
Comparative LCA of alternative feedstock for plastics production – DRAFT FOR STAKEHOLDER CONSULTATION Part II
142
1
Figure 38: System boundary for (partly) fossil CO2-based PUR insulation (Scenario 4). *Addressed according with Circular Footprint Formula. R: thermal 2 resistance. 3
4
Figure 39: System boundary for (partly) bio-based bio-PUR insulation (Scenario 5). *Addressed according with Circular Footprint Formula. R: thermal 5 resistance.6
Production of Insulation board R=1
EnergyEnergy
production
CO2
stream
Recycling
Incineration
Landfilling EnergyEnergy
production
Waste Resource
extraction
Resource
extraction
Production of insulated panel
R=1Electricity
Electricity
productionWaste PET
Recycling
Incineration
Landfilling ElectricityElectricity
production
WasteResource
extraction
Resource
extraction
Avo
ide
d w
aste
tre
atm
en
t
Waste PET
ElectricityElectricity
productionIncineration
Landfilling ElectricityElectricity
production
Resource
extraction
Resource
extraction
Approach A
Approach B and C
(Base adjusted and System expansion)Recycled
ProductProduction
Resource
extraction
Recycled
Material*Production
Resource
extraction
RecyclingrPET
Production of
PUR
PUR
(T)
NOTE:
B and C in this case are the same, as there are no other multifunctionalities. They differ for the datasets used.
Collection is here assumed to be included in “Recycling”.
Yet, in the case of Approach B and also for the EOL, the collection of Waste PET should in principle (to be 100% consistent) be different between the stream-to-Recycling (e.g. separate collection at source)
and the stream to incineration/landfilling (mixed MSW collection). However, the collection is not expected to play environmentally a big role. So, as approximation we could simply assume that all collection is
the same regardless of final treatment
(T) stands for transport. Anyway, I suggest to skip it to simplify.
ConsumerCapture and Production of
PO
iLUC
Production of
soy oil
Soybean
cultivationEnergy
Energy
production
Waste
Recycling
Incineration
Landfilling EnergyEnergy
production
Production of
PUR
Production of insulatIon board R=1
PUR Resource
extraction
Resource
extraction
Recycled
Material*Production
Resource
extraction
Approach A
Approach B
(Base adjusted)
iLUC
Production of
rape oil
Rapeseed
cultivationElectricity
Electricity
production
Waste
Recycling
Incineration
Landfilling ElectricityElectricity
production
Production of
PUR
Production of insulated panel
R=1
PUR Resource
extraction
Resource
extraction
Recycled
ProductProduction
Resource
extraction
Consumer

Comparative LCA of alternative feedstock for plastics production – DRAFT FOR STAKEHOLDER CONSULTATION Part II
143
7.4 Life Cycle Inventory 1
This section describes the overall approach for building the LCI of the scenarios under assessment 2
alongside related assumptions and data sources. The description is separated by major lifecycle 3
stages. The list of processes and related data sources are provided in Tables 40 to 44. 4
5
6

Comparative LCA of alternative feedstock for plastics production – DRAFT FOR STAKEHOLDER CONSULTATION Part II
144
Table 40: List of processes included in the LCI model of fossil-based PUR insulation board (Scenario 1) 1
Life cycle stage
Process Dataset Compliance scheme or source
Comments*
Polymer Production
Oil extraction, refining, cracking, propylene and ethylene production, polyols production, PUR production
Created based on ecoinvent and PlasticsEurope (2004) dataset using EF-compliant background datasets for energy consumptions and chemicals in input
Developed Based on PlasticsEurope (2004)
Transport Transport to production site (from supplier to factory)
Articulated lorry transport, Euro 4, Total weight >32 t (without fuel); diesel driven, Euro 4, cargo; consumption mix, to consumer; more than 32t gross weight / 24,7t payload capacity
EF 130 km by truck (>32 t, EURO 4), case-specific utilisation ratio
Freight train, average (without fuel); technology mix, electricity and diesel driven, cargo; consumption mix, to consumer; average train, gross tonne weight 1000t / 726t payload capacity
EF 240 km by train (average freight train)
Barge; technology mix, diesel driven, cargo; consumption mix, to consumer; 1500 t payload capacity
EF 270 km by ship (barge)
Article Production
Included in Polymer Production
Transport Transport from factory to final client
Articulated lorry transport, Euro 4, Total weight >32 t (without fuel); diesel driven, Euro 4, cargo; consumption mix, to consumer; more than 32t gross weight / 24,7 t payload capacity
EF From factory to retail: 1200 km by truck (>32 t, EURO 4), case-specific utilisation ratio
Passenger car, average; technology mix, gasoline and diesel driven, Euro 3-5, passenger car; consumption mix, to consumer; engine size from 1,4l up to >2
EF
From retail to final client (62%): 5 km, by passenger car (average), case-specific allocation
Articulated lorry transport, Euro 3, Total weight <7.5 t (without fuel); diesel driven, Euro 3, cargo; consumption mix, to consumer; up to 7,5t gross weight / 3,3t payload capacity
EF
From retail to final client (5%): 5 km round trip, by van (lorry <7.5t, EURO 3 with utilisation ratio of 20%)
EoL
Recycling (31.1%) Recycling of polypropylene (PP) plastic ; from post-consumer waste, via washing, granulation, pelletization; production mix, at plant; 90% recycling rate
EF R2*(1-A) Erecycling,eol; R2 = 31.1%, A = 0.5
Avoided virgin PUR production See stage "Polymer Production" EF R2*(1-A)*Ev*Qs,out/Qp; R2 =
60%*90%, A = 0.5, Qs/Qp = 1
Incineration (41.6%) Polyurethane (PU) in waste incineration plant TS R3 = 41.6%
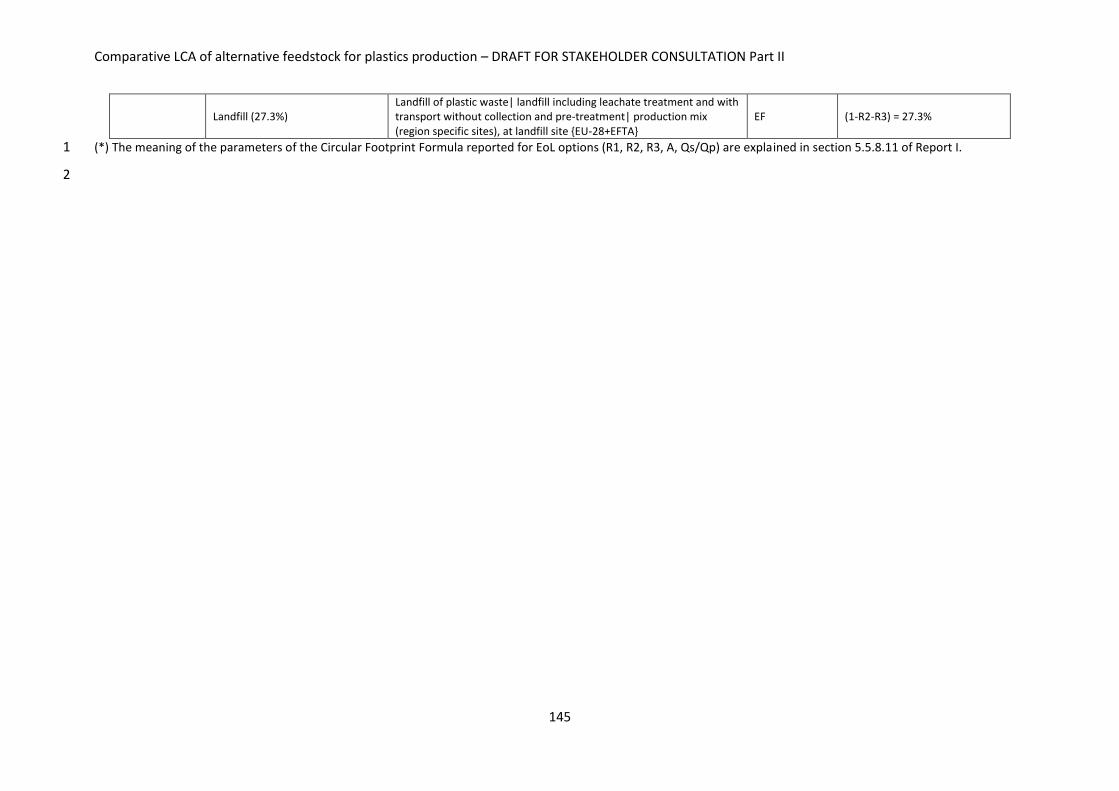
Comparative LCA of alternative feedstock for plastics production – DRAFT FOR STAKEHOLDER CONSULTATION Part II
145
Landfill (27.3%) Landfill of plastic waste| landfill including leachate treatment and with transport without collection and pre-treatment| production mix (region specific sites), at landfill site {EU-28+EFTA}
EF (1-R2-R3) = 27.3%
(*) The meaning of the parameters of the Circular Footprint Formula reported for EoL options (R1, R2, R3, A, Qs/Qp) are explained in section 5.5.8.11 of Report I. 1
2
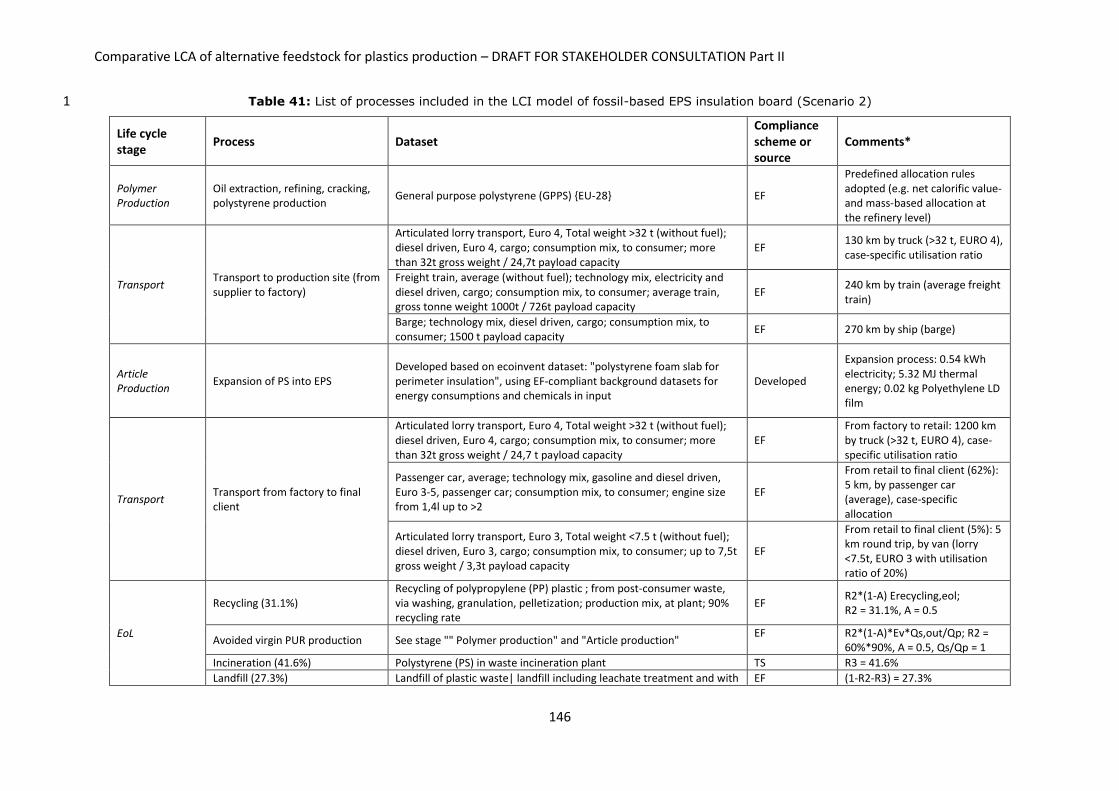
Comparative LCA of alternative feedstock for plastics production – DRAFT FOR STAKEHOLDER CONSULTATION Part II
146
Table 41: List of processes included in the LCI model of fossil-based EPS insulation board (Scenario 2) 1
Life cycle stage
Process Dataset Compliance scheme or source
Comments*
Polymer Production
Oil extraction, refining, cracking, polystyrene production
General purpose polystyrene (GPPS) {EU-28} EF
Predefined allocation rules adopted (e.g. net calorific value- and mass-based allocation at the refinery level)
Transport Transport to production site (from supplier to factory)
Articulated lorry transport, Euro 4, Total weight >32 t (without fuel); diesel driven, Euro 4, cargo; consumption mix, to consumer; more than 32t gross weight / 24,7t payload capacity
EF 130 km by truck (>32 t, EURO 4), case-specific utilisation ratio
Freight train, average (without fuel); technology mix, electricity and diesel driven, cargo; consumption mix, to consumer; average train, gross tonne weight 1000t / 726t payload capacity
EF 240 km by train (average freight train)
Barge; technology mix, diesel driven, cargo; consumption mix, to consumer; 1500 t payload capacity
EF 270 km by ship (barge)
Article Production
Expansion of PS into EPS Developed based on ecoinvent dataset: "polystyrene foam slab for perimeter insulation", using EF-compliant background datasets for energy consumptions and chemicals in input
Developed
Expansion process: 0.54 kWh electricity; 5.32 MJ thermal energy; 0.02 kg Polyethylene LD film
Transport Transport from factory to final client
Articulated lorry transport, Euro 4, Total weight >32 t (without fuel); diesel driven, Euro 4, cargo; consumption mix, to consumer; more than 32t gross weight / 24,7 t payload capacity
EF From factory to retail: 1200 km by truck (>32 t, EURO 4), case-specific utilisation ratio
Passenger car, average; technology mix, gasoline and diesel driven, Euro 3-5, passenger car; consumption mix, to consumer; engine size from 1,4l up to >2
EF
From retail to final client (62%): 5 km, by passenger car (average), case-specific allocation
Articulated lorry transport, Euro 3, Total weight <7.5 t (without fuel); diesel driven, Euro 3, cargo; consumption mix, to consumer; up to 7,5t gross weight / 3,3t payload capacity
EF
From retail to final client (5%): 5 km round trip, by van (lorry <7.5t, EURO 3 with utilisation ratio of 20%)
EoL
Recycling (31.1%) Recycling of polypropylene (PP) plastic ; from post-consumer waste, via washing, granulation, pelletization; production mix, at plant; 90% recycling rate
EF R2*(1-A) Erecycling,eol; R2 = 31.1%, A = 0.5
Avoided virgin PUR production See stage "" Polymer production" and "Article production" EF R2*(1-A)*Ev*Qs,out/Qp; R2 =
60%*90%, A = 0.5, Qs/Qp = 1
Incineration (41.6%) Polystyrene (PS) in waste incineration plant TS R3 = 41.6%
Landfill (27.3%) Landfill of plastic waste| landfill including leachate treatment and with EF (1-R2-R3) = 27.3%

Comparative LCA of alternative feedstock for plastics production – DRAFT FOR STAKEHOLDER CONSULTATION Part II
147
transport without collection and pre-treatment| production mix (region specific sites), at landfill site {EU-28+EFTA}
(*) The meaning of the parameters of the Circular Footprint Formula reported for EoL options (R1, R2, R3, A, Qs/Qp) are explained in section 5.5.8.11 of Report I. 1
2
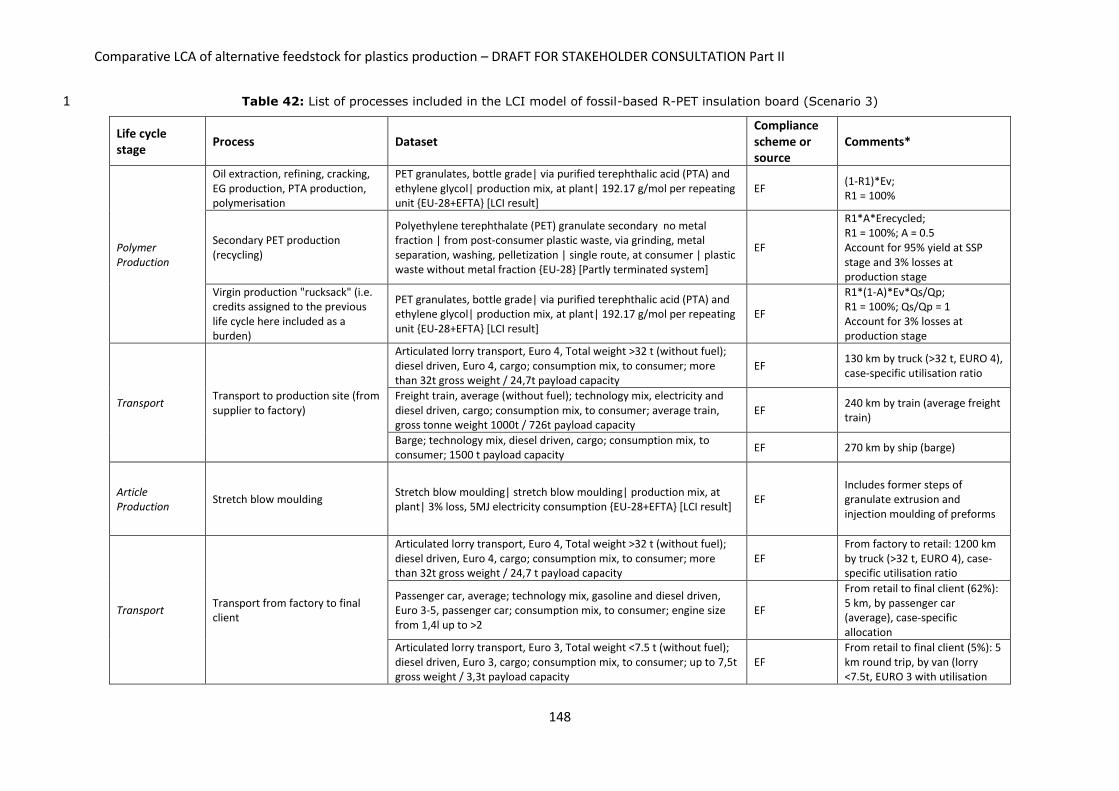
Comparative LCA of alternative feedstock for plastics production – DRAFT FOR STAKEHOLDER CONSULTATION Part II
148
Table 42: List of processes included in the LCI model of fossil-based R-PET insulation board (Scenario 3) 1
Life cycle stage
Process Dataset Compliance scheme or source
Comments*
Polymer Production
Oil extraction, refining, cracking, EG production, PTA production, polymerisation
PET granulates, bottle grade| via purified terephthalic acid (PTA) and ethylene glycol| production mix, at plant| 192.17 g/mol per repeating unit {EU-28+EFTA} [LCI result]
EF (1-R1)*Ev; R1 = 100%
Secondary PET production (recycling)
Polyethylene terephthalate (PET) granulate secondary no metal fraction | from post-consumer plastic waste, via grinding, metal separation, washing, pelletization | single route, at consumer | plastic waste without metal fraction {EU-28} [Partly terminated system]
EF
R1*A*Erecycled; R1 = 100%; A = 0.5 Account for 95% yield at SSP stage and 3% losses at production stage
Virgin production "rucksack" (i.e. credits assigned to the previous life cycle here included as a burden)
PET granulates, bottle grade| via purified terephthalic acid (PTA) and ethylene glycol| production mix, at plant| 192.17 g/mol per repeating unit {EU-28+EFTA} [LCI result]
EF
R1*(1-A)*Ev*Qs/Qp; R1 = 100%; Qs/Qp = 1 Account for 3% losses at production stage
Transport Transport to production site (from supplier to factory)
Articulated lorry transport, Euro 4, Total weight >32 t (without fuel); diesel driven, Euro 4, cargo; consumption mix, to consumer; more than 32t gross weight / 24,7t payload capacity
EF 130 km by truck (>32 t, EURO 4), case-specific utilisation ratio
Freight train, average (without fuel); technology mix, electricity and diesel driven, cargo; consumption mix, to consumer; average train, gross tonne weight 1000t / 726t payload capacity
EF 240 km by train (average freight train)
Barge; technology mix, diesel driven, cargo; consumption mix, to consumer; 1500 t payload capacity
EF 270 km by ship (barge)
Article Production
Stretch blow moulding Stretch blow moulding| stretch blow moulding| production mix, at plant| 3% loss, 5MJ electricity consumption {EU-28+EFTA} [LCI result]
EF Includes former steps of granulate extrusion and injection moulding of preforms
Transport Transport from factory to final client
Articulated lorry transport, Euro 4, Total weight >32 t (without fuel); diesel driven, Euro 4, cargo; consumption mix, to consumer; more than 32t gross weight / 24,7 t payload capacity
EF From factory to retail: 1200 km by truck (>32 t, EURO 4), case-specific utilisation ratio
Passenger car, average; technology mix, gasoline and diesel driven, Euro 3-5, passenger car; consumption mix, to consumer; engine size from 1,4l up to >2
EF
From retail to final client (62%): 5 km, by passenger car (average), case-specific allocation
Articulated lorry transport, Euro 3, Total weight <7.5 t (without fuel); diesel driven, Euro 3, cargo; consumption mix, to consumer; up to 7,5t gross weight / 3,3t payload capacity
EF From retail to final client (5%): 5 km round trip, by van (lorry <7.5t, EURO 3 with utilisation

Comparative LCA of alternative feedstock for plastics production – DRAFT FOR STAKEHOLDER CONSULTATION Part II
149
ratio of 20%)
EoL
Recycling (31.1%) Recycling of polypropylene (PP) plastic ; from post-consumer waste, via washing, granulation, pelletization; production mix, at plant; 90% recycling rate
EF R2*(1-A) Erecycling,eol; R2 = 31.1%, A = 0.5
Avoided virgin PUR production See stage "Polymer Production" in Table 40 EF R2*(1-A)*Ev*Qs,out/Qp; R2 = 60%*90%, A = 0.5, Qs/Qp = 1
Incineration (41.6%) Polyurethane (PU) in waste incineration plant TS R3 = 41.6%
Landfill (27.3%) Landfill of plastic waste| landfill including leachate treatment and with transport without collection and pre-treatment| production mix (region specific sites), at landfill site {EU-28+EFTA}
EF (1-R2-R3) = 27.3%
1
2

Comparative LCA of alternative feedstock for plastics production – DRAFT FOR STAKEHOLDER CONSULTATION Part II
150
Table 43: List of processes included in the LCI model of fossil-based CO2-based PUR insulation board (Scenario 4) 1
Life cycle stage
Process Dataset Compliance scheme or source
Comments*
Polymer Production
CO2 capture from coal-based power plant (89.5%)
Developed based on dataset "Carbon dioxide, liquid/RER", adjusting electricity input, removing infrastructure processes and replacing EI background datasets with EF dataset, where available. Electricity consumption to be adjusted based on the literature (Hoppe et al., 2017), as described in the comments field
Developed
Electricity: 0.265x1.005 =0.266 kwh/kg CO2 produced (electricity from the grid to compensate for reduced electricity production from the power plant, which cannot produce additional energy as total production is limited by plant capacity -electricity is used for solvent regeneration, CO2 cleaning & compression, filling of CO2 cylinders) (von der Assen & Bardow, 2014) Monoethanolamide: 0.013 kg/kg CO2 (EI) Tap water: 0.026 kg/kg CO2 (EI) + other flows from EI dataset "Carbon dioxide, liquid/RER", excluding infrastructure, electricity & heat inputs"
CO2 capture from cement kiln (10.5%)
Developed based on ecoinvent electricity dataset "Carbon dioxide, liquid/RER", adjusting electricity and heat input, removing infrastructure processes and replacing EI background datasets with EF dataset, where available. Electricity consumption to be adjusted based on the literature (Hoppe et al., 2017), as described in the comments field
Developed
Electricity: 0.162x1.005 kWh/kg CO2 produced (0.02 kWh for capturing + 0.142 kWh for cleaning/compression/filling of cylinders) (Element Energy, 2014) Heat (from natural gas): 0.86x1.005 kWh/kg CO2 produced (1.2 KWh - 0.34 kWh from heat recovery from exhaust kiln gases) (Element Energy, 2014) Monoethanolamide: 0.013 kg/kg CO2 (EI) Tap water: 0.026 kg/kg CO2 (EI) + other flows from EI dataset

Comparative LCA of alternative feedstock for plastics production – DRAFT FOR STAKEHOLDER CONSULTATION Part II
151
"Carbon dioxide, liquid/RER", excluding infrastructure, electricity & heat inputs"
H2 production Developed based on the ecoinvent dataset "RER hydrogen production (production mix, at plant)" using EF-compliant background datasets for energy consumptions and chemicals in input
Developed
EF dataset refer to steam cracking (of crude oil) modelled based on data from IFEU that conducted a study for PlasticsEurope.
Methanol synthesis Developed based on LCI data from Hoppe et al. (2017) Developed
Captured CO2: 1.374 kg CO2/kg CH3OH (Rihko-Struckmann et al., 2010) H2: 0.189 kg H2/kg CH3OH (Rihko-Struckmann et al., 2010) Electricity: 1.271 kWh/kg CH3OH (Rihko-Struckmann et al., 2010) Heat (output): 0.10 kWh/ kg CH3OH (negligible) (Rihko-Struckmann et al., 2010)
Propylene production (MTO; methanol-to-olefin)
Developed based on LCI data from Hoppe et al. (2017) Developed
Methanol (CH3OH): 2.571 kg methanol/kg propylene (Xiang et al., 2014) Electricity: 0.458 kWh/kg Propylene (Xiang et al., 2014) Heat: 1.552 kWh heat/kg propylene (Xiang et al., 2014)
Oxidation of propylene to propylene oxide (PO)
Developed based on the ecoinvent dataset "Production of propylene oxide, liquid, at plant RER" using EF-compliant background datasets for energy consumptions and chemicals in input
Developed
Electricity: 0.33 kWh/kg PO Propylene: 0.763 kg PP/kg PO Cl: 1.28 kg/kg PO NaOH: 1.38 kg NaOH/kg PO Heat: 2 MJ/kg PO Water: 62 kg/kg PP
Polyols production from propylene oxide (PO)
Developed based on the information provided in Fernández-Dacosta et al. (2017). The PO produced from soy oil is used in the polyols production process in place of conventional fossil-based propylene oxide, assuming one-to-one substitution (perfect substitutability).
Developed
Electricity: 0.01 kWh/kg polyols Glycerol: 0.02 kg/kg polyols Propylene glycol: 0.01 kg/kg PO: 0.81 kg/kg polyols Heat: 0.122 MJ/kg polyols Water: 1.69 kg/kg polyols
Oil extraction, refining, cracking, propylene and ethylene
Developed based on ecoinvent and PlasticsEurope (2004) dataset using EF-compliant background datasets for consumptions and
Developed Predefined allocation rules adopted (e.g. net calorific value-

Comparative LCA of alternative feedstock for plastics production – DRAFT FOR STAKEHOLDER CONSULTATION Part II
152
production, polyols production, PUR production
chemicals in input. and mass-based allocation at the refinery level)
Transport Transport to production site (from supplier to factory)
Articulated lorry transport, Euro 4, Total weight >32 t (without fuel); diesel driven, Euro 4, cargo; consumption mix, to consumer; more than 32t gross weight / 24,7t payload capacity
EF 130 km by truck (>32 t, EURO 4), case-specific utilisation ratio
Freight train, average (without fuel); technology mix, electricity and diesel driven, cargo; consumption mix, to consumer; average train, gross tonne weight 1000t / 726t payload capacity
EF 240 km by train (average freight train)
Barge; technology mix, diesel driven, cargo; consumption mix, to consumer; 1500 t payload capacity
EF 270 km by ship (barge)
Article Production
Included in Polymer Production
Transport Transport from factory to final client
Articulated lorry transport, Euro 4, Total weight >32 t (without fuel); diesel driven, Euro 4, cargo; consumption mix, to consumer; more than 32t gross weight / 24,7 t payload capacity
EF From factory to retail: 1200 km by truck (>32 t, EURO 4), case-specific utilisation ratio
Passenger car, average; technology mix, gasoline and diesel driven, Euro 3-5, passenger car; consumption mix, to consumer; engine size from 1,4l up to >2
EF
From retail to final client (62%): 5 km, by passenger car (average), case-specific allocation
Articulated lorry transport, Euro 3, Total weight <7.5 t (without fuel); diesel driven, Euro 3, cargo; consumption mix, to consumer; up to 7,5t gross weight / 3,3t payload capacity
EF
From retail to final client (5%): 5 km round trip, by van (lorry <7.5t, EURO 3 with utilisation ratio of 20%)
EoL
Recycling (31.1%) Recycling of polypropylene (PP) plastic ; from post-consumer waste, via washing, granulation, pelletization; production mix, at plant; 90% recycling rate
EF R2*(1-A)*Erecycling,eol; R2 = 31.1%, A = 0.5
Avoided virgin PUR production See stage "Polymer Production" in Table 40 EF R2*(1-A)*Ev*Qs,out/Qp;
R2=60%*90%, A = 0.5,Qs/Qp = 1
Incineration (41.6%) Polyurethane (PU) in waste incineration plant TS R3 = 41.6%
Landfill (27.3%) Landfill of plastic waste| landfill including leachate treatment and with transport without collection and pre-treatment| production mix (region specific sites), at landfill site {EU-28+EFTA}
EF (1-R2-R3) = 27.3%
(*) The meaning of the parameters of the Circular Footprint Formula reported for EoL options (R1, R2, R3, A, Qs/Qp) are explained in section 5.5.8.11 of Report I. 1
2
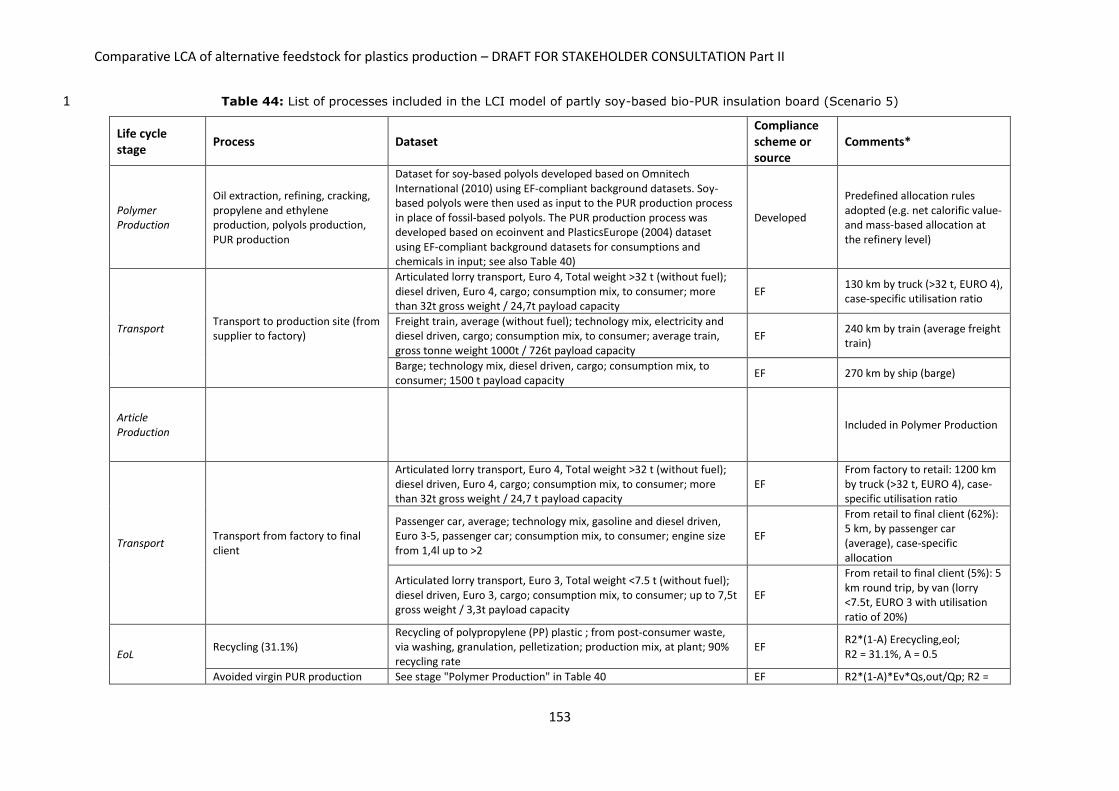
Comparative LCA of alternative feedstock for plastics production – DRAFT FOR STAKEHOLDER CONSULTATION Part II
153
Table 44: List of processes included in the LCI model of partly soy-based bio-PUR insulation board (Scenario 5) 1
Life cycle stage
Process Dataset Compliance scheme or source
Comments*
Polymer Production
Oil extraction, refining, cracking, propylene and ethylene production, polyols production, PUR production
Dataset for soy-based polyols developed based on Omnitech International (2010) using EF-compliant background datasets. Soy-based polyols were then used as input to the PUR production process in place of fossil-based polyols. The PUR production process was developed based on ecoinvent and PlasticsEurope (2004) dataset using EF-compliant background datasets for consumptions and chemicals in input; see also Table 40)
Developed
Predefined allocation rules adopted (e.g. net calorific value- and mass-based allocation at the refinery level)
Transport Transport to production site (from supplier to factory)
Articulated lorry transport, Euro 4, Total weight >32 t (without fuel); diesel driven, Euro 4, cargo; consumption mix, to consumer; more than 32t gross weight / 24,7t payload capacity
EF 130 km by truck (>32 t, EURO 4), case-specific utilisation ratio
Freight train, average (without fuel); technology mix, electricity and diesel driven, cargo; consumption mix, to consumer; average train, gross tonne weight 1000t / 726t payload capacity
EF 240 km by train (average freight train)
Barge; technology mix, diesel driven, cargo; consumption mix, to consumer; 1500 t payload capacity
EF 270 km by ship (barge)
Article Production
Included in Polymer Production
Transport Transport from factory to final client
Articulated lorry transport, Euro 4, Total weight >32 t (without fuel); diesel driven, Euro 4, cargo; consumption mix, to consumer; more than 32t gross weight / 24,7 t payload capacity
EF From factory to retail: 1200 km by truck (>32 t, EURO 4), case-specific utilisation ratio
Passenger car, average; technology mix, gasoline and diesel driven, Euro 3-5, passenger car; consumption mix, to consumer; engine size from 1,4l up to >2
EF
From retail to final client (62%): 5 km, by passenger car (average), case-specific allocation
Articulated lorry transport, Euro 3, Total weight <7.5 t (without fuel); diesel driven, Euro 3, cargo; consumption mix, to consumer; up to 7,5t gross weight / 3,3t payload capacity
EF
From retail to final client (5%): 5 km round trip, by van (lorry <7.5t, EURO 3 with utilisation ratio of 20%)
EoL Recycling (31.1%)
Recycling of polypropylene (PP) plastic ; from post-consumer waste, via washing, granulation, pelletization; production mix, at plant; 90% recycling rate
EF R2*(1-A) Erecycling,eol; R2 = 31.1%, A = 0.5
Avoided virgin PUR production See stage "Polymer Production" in Table 40 EF R2*(1-A)*Ev*Qs,out/Qp; R2 =
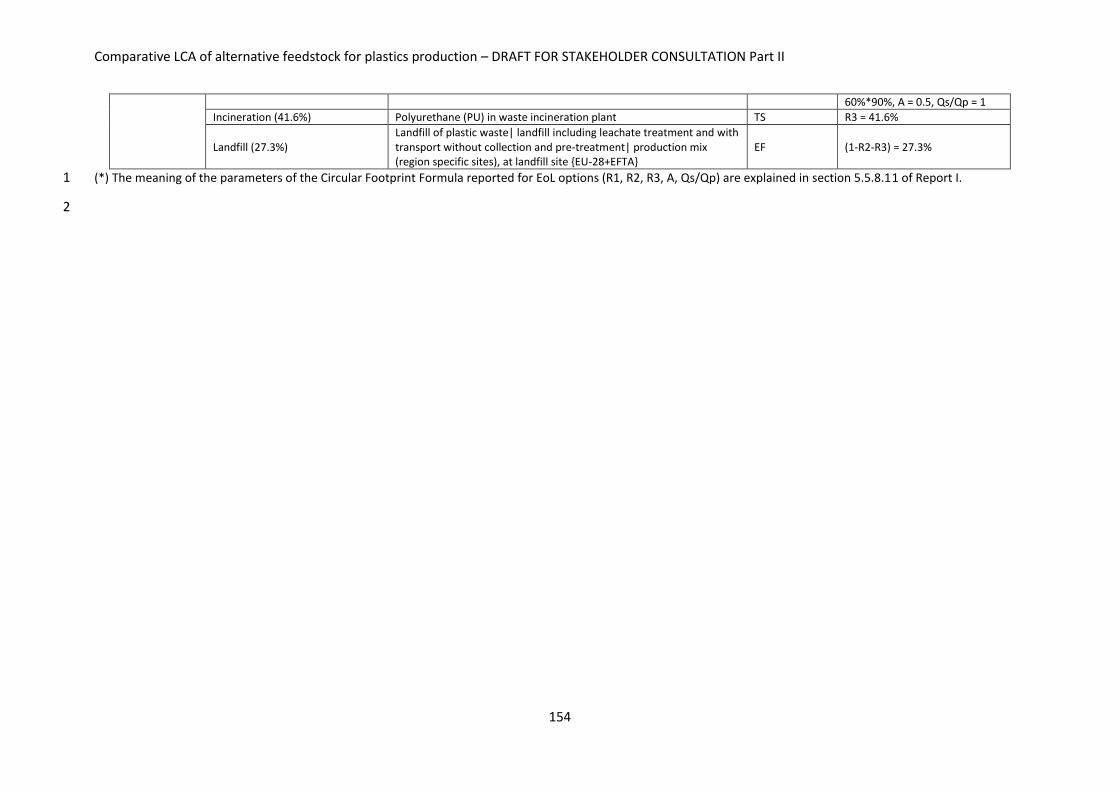
Comparative LCA of alternative feedstock for plastics production – DRAFT FOR STAKEHOLDER CONSULTATION Part II
154
60%*90%, A = 0.5, Qs/Qp = 1
Incineration (41.6%) Polyurethane (PU) in waste incineration plant TS R3 = 41.6%
Landfill (27.3%) Landfill of plastic waste| landfill including leachate treatment and with transport without collection and pre-treatment| production mix (region specific sites), at landfill site {EU-28+EFTA}
EF (1-R2-R3) = 27.3%
(*) The meaning of the parameters of the Circular Footprint Formula reported for EoL options (R1, R2, R3, A, Qs/Qp) are explained in section 5.5.8.11 of Report I. 1
2
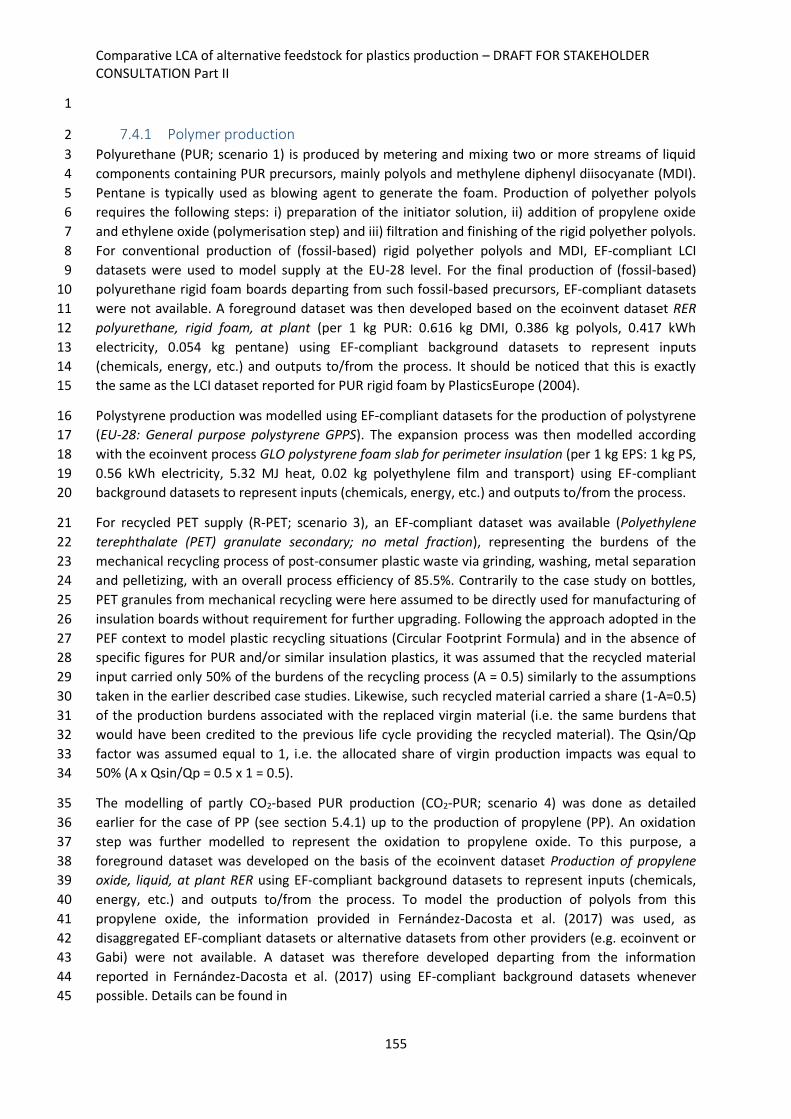
Comparative LCA of alternative feedstock for plastics production – DRAFT FOR STAKEHOLDER CONSULTATION Part II
155
1
7.4.1 Polymer production 2
Polyurethane (PUR; scenario 1) is produced by metering and mixing two or more streams of liquid 3
components containing PUR precursors, mainly polyols and methylene diphenyl diisocyanate (MDI). 4
Pentane is typically used as blowing agent to generate the foam. Production of polyether polyols 5
requires the following steps: i) preparation of the initiator solution, ii) addition of propylene oxide 6
and ethylene oxide (polymerisation step) and iii) filtration and finishing of the rigid polyether polyols. 7
For conventional production of (fossil-based) rigid polyether polyols and MDI, EF-compliant LCI 8
datasets were used to model supply at the EU-28 level. For the final production of (fossil-based) 9
polyurethane rigid foam boards departing from such fossil-based precursors, EF-compliant datasets 10
were not available. A foreground dataset was then developed based on the ecoinvent dataset RER 11
polyurethane, rigid foam, at plant (per 1 kg PUR: 0.616 kg DMI, 0.386 kg polyols, 0.417 kWh 12
electricity, 0.054 kg pentane) using EF-compliant background datasets to represent inputs 13
(chemicals, energy, etc.) and outputs to/from the process. It should be noticed that this is exactly 14
the same as the LCI dataset reported for PUR rigid foam by PlasticsEurope (2004). 15
Polystyrene production was modelled using EF-compliant datasets for the production of polystyrene 16
(EU-28: General purpose polystyrene GPPS). The expansion process was then modelled according 17
with the ecoinvent process GLO polystyrene foam slab for perimeter insulation (per 1 kg EPS: 1 kg PS, 18
0.56 kWh electricity, 5.32 MJ heat, 0.02 kg polyethylene film and transport) using EF-compliant 19
background datasets to represent inputs (chemicals, energy, etc.) and outputs to/from the process. 20
For recycled PET supply (R-PET; scenario 3), an EF-compliant dataset was available (Polyethylene 21
terephthalate (PET) granulate secondary; no metal fraction), representing the burdens of the 22
mechanical recycling process of post-consumer plastic waste via grinding, washing, metal separation 23
and pelletizing, with an overall process efficiency of 85.5%. Contrarily to the case study on bottles, 24
PET granules from mechanical recycling were here assumed to be directly used for manufacturing of 25
insulation boards without requirement for further upgrading. Following the approach adopted in the 26
PEF context to model plastic recycling situations (Circular Footprint Formula) and in the absence of 27
specific figures for PUR and/or similar insulation plastics, it was assumed that the recycled material 28
input carried only 50% of the burdens of the recycling process (A = 0.5) similarly to the assumptions 29
taken in the earlier described case studies. Likewise, such recycled material carried a share (1-A=0.5) 30
of the production burdens associated with the replaced virgin material (i.e. the same burdens that 31
would have been credited to the previous life cycle providing the recycled material). The Qsin/Qp 32
factor was assumed equal to 1, i.e. the allocated share of virgin production impacts was equal to 33
50% (A x Qsin/Qp = 0.5 x 1 = 0.5). 34
The modelling of partly CO2-based PUR production (CO2-PUR; scenario 4) was done as detailed 35
earlier for the case of PP (see section 5.4.1) up to the production of propylene (PP). An oxidation 36
step was further modelled to represent the oxidation to propylene oxide. To this purpose, a 37
foreground dataset was developed on the basis of the ecoinvent dataset Production of propylene 38
oxide, liquid, at plant RER using EF-compliant background datasets to represent inputs (chemicals, 39
energy, etc.) and outputs to/from the process. To model the production of polyols from this 40
propylene oxide, the information provided in Fernández-Dacosta et al. (2017) was used, as 41
disaggregated EF-compliant datasets or alternative datasets from other providers (e.g. ecoinvent or 42
Gabi) were not available. A dataset was therefore developed departing from the information 43
reported in Fernández-Dacosta et al. (2017) using EF-compliant background datasets whenever 44
possible. Details can be found in 45

Comparative LCA of alternative feedstock for plastics production – DRAFT FOR STAKEHOLDER CONSULTATION Part II
156
Table 43. These polyols were then used as input to the PUR production process in place of fossil-1
based polyols, as described earlier. In this, perfect substitutability of fossil-based polyols with CO2-2
derived polyols was assumed, in the absence of more specific information. 3
The production of partly bio-based PUR (bio-PUR; scenario 5) was modelled by substituting the 4
precursor (fossil-based) polyols with soy-based polyols. The foreground LCI representing the 5
production process of soy-based polyols was developed on the basis of the information detailed in 6
Omnitech International (2010). EF-compliant background datasets were used to model inputs 7
(chemicals, energy, etc.) and outputs to/from the process. Within the soy oil refining process, no 8
relevant co-products were generated (negligible amounts of soap). Soy-based polyols were then 9
used as input to the PUR production process in place of fossil-based polyols. In this, perfect 10
substitutability of fossil-based polyols with soy-based polyols was assumed, in the absence of more 11
specific information. 12
7.4.2 Transport to article production site 13
Modelling of transport of polymer resin to the article production site in Europe was based on 14
standard distances and vehicle types specified in the methodology report for the route supplier-to-15
factory, in the case of suppliers located inside Europe. The following routes were thus considered: (i) 16
130 km by articulated lorry (total weight >32 t; Euro 4); (ii) 240 km by train (average freight); and (iii) 17
270 km by ship (barge, technology mix). LCIs for all types of vehicles are available as EF-compliant 18
datasets, which were used in the modelling. 19
7.4.3 Article production 20
The activities associated with the production of the final articles (i.e. insulation boards) for the case 21
of PUR and EPS boards were included in the LCI dataset for polymer production. Such activities 22
mainly included minor operations of cutting and eventual final packaging of the boards. For R-PET, it 23
was assumed that the recycled granulates underwent an extrusion process to produce the R-PET 24
insulation boards. This was modelled using the EF-compliant dataset EU-28: Film Extrusion (blowing). 25
7.4.4 Transport to final consumer 26
The transport of the article from the production site to the final client was modelled assuming the 27
route factory -> retail -> final client specified in the methodology document (Report I), and 28
considering the corresponding default transport scenario. The following routes were thus 29
considered: (i) 1200 km by articulated lorry (total weight >32 t; Euro 4) from factory to retailers; (ii) 5 30
km by passenger car for 62% of the roundtrips from retailers to final clients; (iii) 5 km by van for 5% 31
of the roundtrips from retailers to final clients; and (iv) no burdens assigned to 33% of the roundtrips 32
from retailers to final clients (assumed to take place with no motorised vehicles). LCIs for all types of 33
vehicles are available as EF-compliant datasets, which were used in the modelling. 34
7.4.5 End of Life 35
7.4.5.1 Definition of EoL scenarios 36
Regardless of the type of feedstock, the average EoL scenario of the investigated insulation boards 37
was assumed to reflect the current EoL of (generic) plastic waste in Europe (i.e. 31.6% recycling, 38
41.6% incineration and 27.3% landfilling) conforming with the figures reported in PlasticsEurope 39
(2018). This choice reflects an average situation in the absence of more detailed information on, for 40
example, the EoL of PUR and EPS boards. A document from Sopa (2005) reports a recycling rate for 41
PUR equal to ca. 9.6% and a share sent to energy recovery of 13.7% as for year 2003, with a total 42
separation at the source of ca. 23.3%; according with the same, the remaining PUR waste (not 43

Comparative LCA of alternative feedstock for plastics production – DRAFT FOR STAKEHOLDER CONSULTATION Part II
157
source separated) is estimated to be incinerated or landfilled alongside (not source separated) MSW. 1
Yet, these figures were not used in the assessment as the report was considered to be outdated. 2
7.4.5.2 Modelling of recycling 3
In all scenarios, mechanical recycling of plastic insulation material was modelled with the same 4
aggregated, EF-compliant dataset (Recycling of polypropylene (PP) plastic | from post-consumer 5
waste, via washing, granulation, pelletization | production mix, at plant | 90% recycling rate). The 6
dataset specifically refers to PP recycling, but it can be reasonably assumed to be representative of 7
all plastic recycling processes, as these are usually based on similar combinations of the same unit 8
operations (e.g. grinding/shredding, washing/flotation and granulation). The overall recycling 9
efficiency was set to 85% of the input material, the rejects being sent to landfilling. 10
The recycled material output was assumed to replace the corresponding virgin polymer, whose 11
primary production burdens were credited to the system. This was the case for (fossil-based, partly 12
CO2-based, and partly bio-based) PUR and for EPS. An exception was represented by the recycled 13
PET (R-PET; scenario 3), assumed to replace virgin PUR (instead of virgin PET) with an open-loop 14
recycling. It was indeed assumed that R-PET boards used for insulation purposes could eventually be 15
recycled for the same applications at the end of the lifetime, thus displacing virgin PUR, this being 16
the typical material used for insulation. In other words, we excluded that recycled PET boards could 17
be further recycled for food packaging (and similar) applications with consequent displacement of 18
virgin PET. A substitution ratio equal to 1 (Qsout/Qp) was considered in the absence of more specific 19
indications. Finally, following the approach adopted in the PEF context to model recycling situations 20
(Circular Footprint Formula), only 50% of the burdens of the EoL recycling process were assigned to 21
the system (A = 0.5). Similarly, only 50% of the benefits from avoided virgin material production 22
were assigned to the system itself. 23
7.4.5.3 Modelling of incineration 24
For the incineration process of (fossil-based, partly CO2-based, and partly bio-based) PUR and of EPS 25
partially aggregated material-specific LCIs from GaBi datasets were applied. For the incineration of R-26
PET, aggregated, material-specific, EF-compliant LCI datasets were used in the modelling. In line with 27
the general approach to handle energy recovery specified in the methodology document (Report I), 28
the generator of the waste material sent to incineration takes the full burdens from the incineration 29
process. Moreover, it is also credited for 100% of the benefits from avoided primary production of 30
any recovered energy (electricity and heat). While in EF-compliant datasets these credits are already 31
accounted in the aggregated inventory, for GaBi datasets they need to be added to the main process 32
inventory. For this purpose, the EU electricity grid mix (as inventoried in the EF dataset Electricity 33
grid mix 1kV-60kV) was used to credit electricity recovery, while a EU-average heat supply mix 34
dataset was developed to credit the recovered heat. The LCI of this mix was built using EF-compliant 35
background datasets (54% natural gas, 40% hard coal, and 6% heavy fuel oil). 36
7.4.5.4 Modelling of landfilling 37
Landfilling of the plastic materials was modelled using the same aggregated EF-compliant dataset as 38
earlier detailed for the other case studies. The inventory is material-specific, but refers to the 39
average composition and energy characteristics of plastic waste, rather than to specific polymers. 40
However, it was considered suitable for the purposes of this screening exercise. If landfilling will turn 41
out to be a relevant contributor to the overall lifecycle impacts of the studied articles, an alternative, 42
more specific modelling approach should be considered. 43

Comparative LCA of alternative feedstock for plastics production – DRAFT FOR STAKEHOLDER CONSULTATION Part II
158
7.5 Life cycle impact assessment results 1
The characterised potential impacts of the examined scenarios are reported in Figures 40 to 42, 2
which also show the breakdown of the contributions from the main lifecycle stages. The latter 3
include: i) Polymer Production (i.e. all cradle-to-gate processes involved in the production and supply 4
of the relevant polymer); ii) Article Production (i.e. activities to convert the polymer into a finished 5
article, e.g. stretch-blow moulding); iii) Transport (including all transport processes throughout the 6
life cycle); and (iv) Waste Management (i.e. waste treatment processes and any credits from 7
downstream displacement of materials and energy). Normalised and weighted results are reported 8
in Annex B.4. Note that scenario impacts presented in Figures 40 to 42 refer to the EU-average EoL 9
scenario (as described in section 7.4.5), and represent net impacts from waste management, 10
resulting from the balance between actual burdens and benefits (if any). Positive values (above zero 11
axis) represent burdens to the environment, while negative values represent savings. The impacts 12
calculated assuming that 100% of post-consumer boards are routed to each viable EoL option (i.e. 13
100% to recycling, 100% to incineration, 100% to landfilling) are presented in Figures 43 to 45. 14
The results for the impact category Water Use appeared to be unreliable. For selected lifecycle 15
stages, such as transportation, the LCIA results obtained using EF-compliant transport datasets were 16
negative, i.e. showing a saving of water use in place of a burden. On this basis, we infer that these 17
results should therefore not be considered for further interpretation in this screening. Likewise, the 18
results obtained for scenario 2 (EPS-based boards) for the category Ozone Depletion, Eutrophication 19
Freshwater, and Ecotoxicity Freshwater also appeared to be unreliable because of the null impacts 20
associated with the polystyrene production stage. This is likely due to lack of relevant (for these 21
categories) emission exchanges in the EF-compliant dataset used. 22
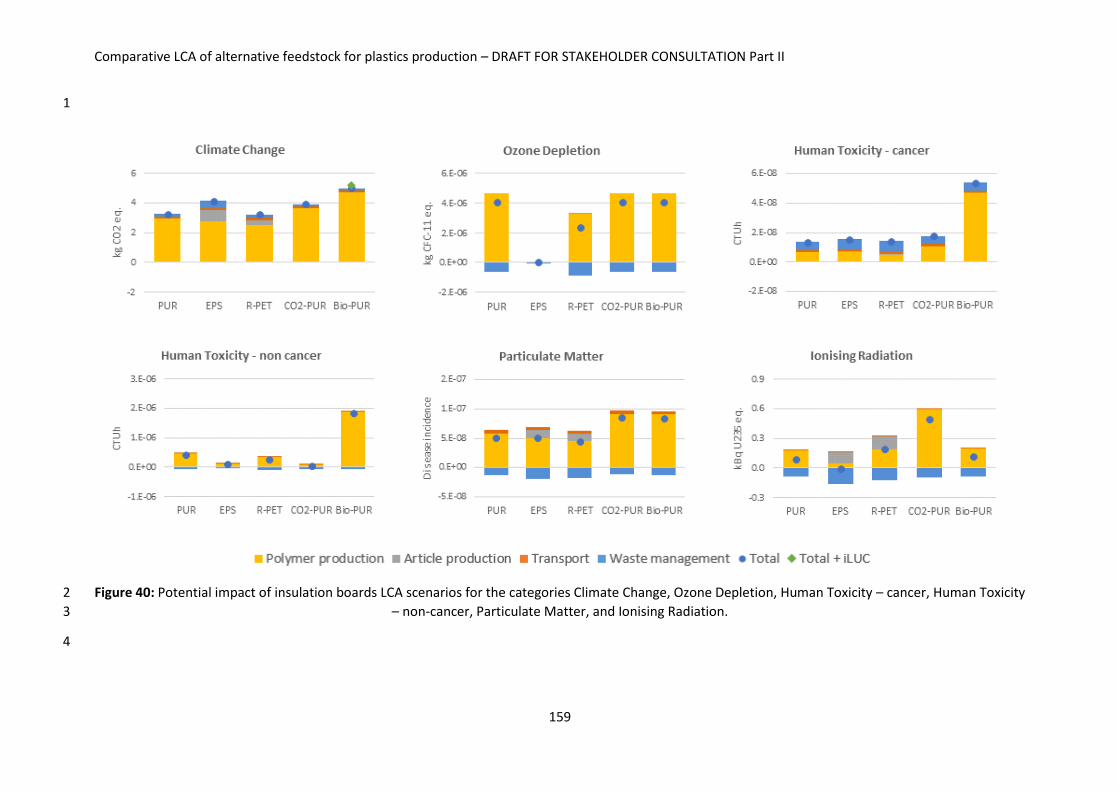
Comparative LCA of alternative feedstock for plastics production – DRAFT FOR STAKEHOLDER CONSULTATION Part II
159
1
Figure 40: Potential impact of insulation boards LCA scenarios for the categories Climate Change, Ozone Depletion, Human Toxicity – cancer, Human Toxicity 2
– non-cancer, Particulate Matter, and Ionising Radiation. 3
4
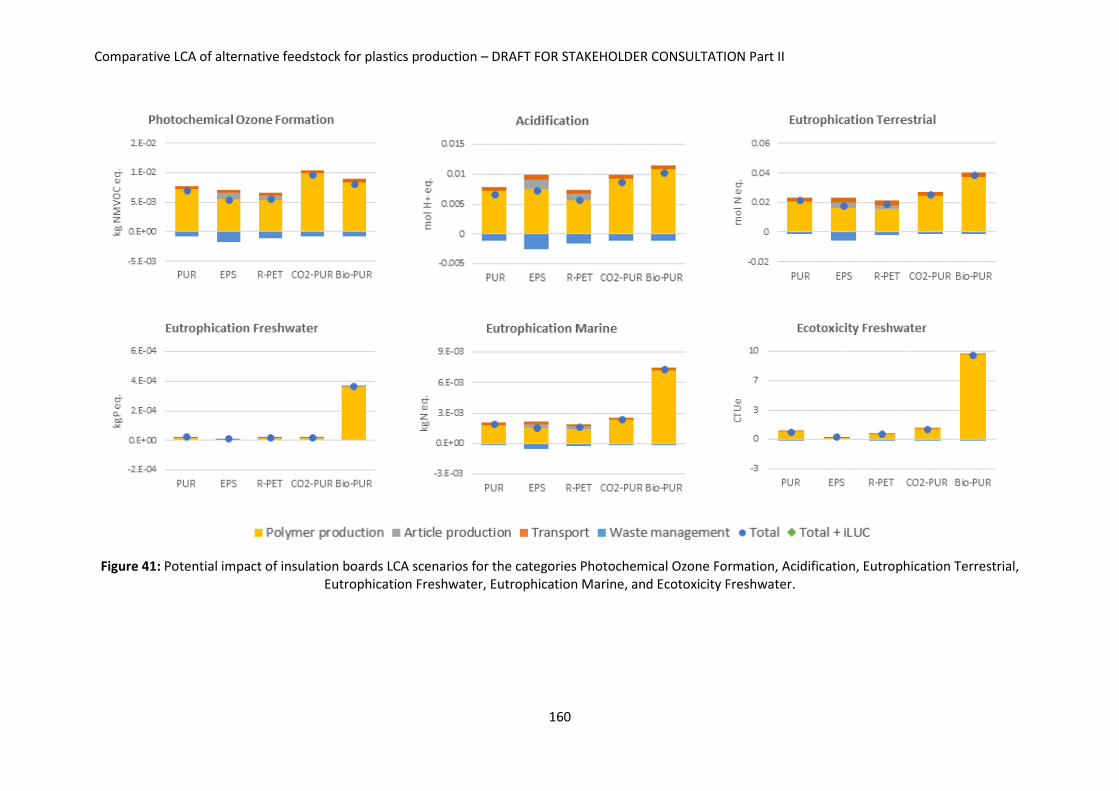
Comparative LCA of alternative feedstock for plastics production – DRAFT FOR STAKEHOLDER CONSULTATION Part II
160
Figure 41: Potential impact of insulation boards LCA scenarios for the categories Photochemical Ozone Formation, Acidification, Eutrophication Terrestrial, Eutrophication Freshwater, Eutrophication Marine, and Ecotoxicity Freshwater.
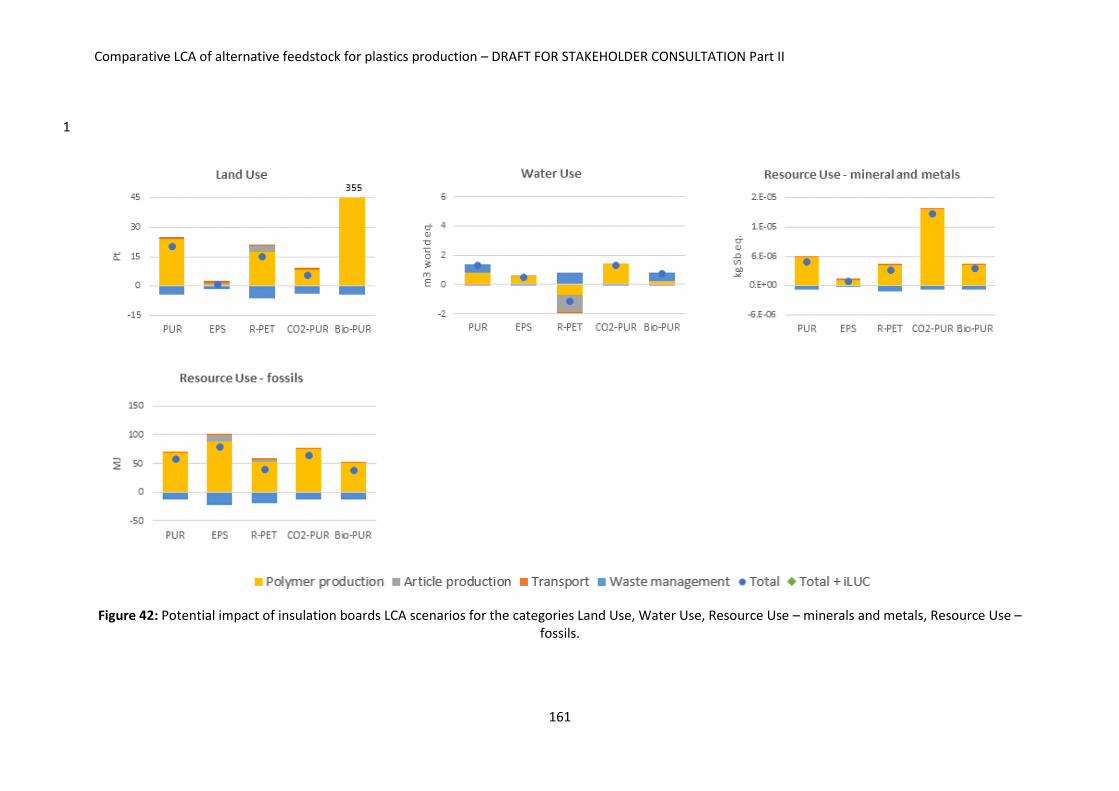
Comparative LCA of alternative feedstock for plastics production – DRAFT FOR STAKEHOLDER CONSULTATION Part II
161
1
Figure 42: Potential impact of insulation boards LCA scenarios for the categories Land Use, Water Use, Resource Use – minerals and metals, Resource Use – fossils.
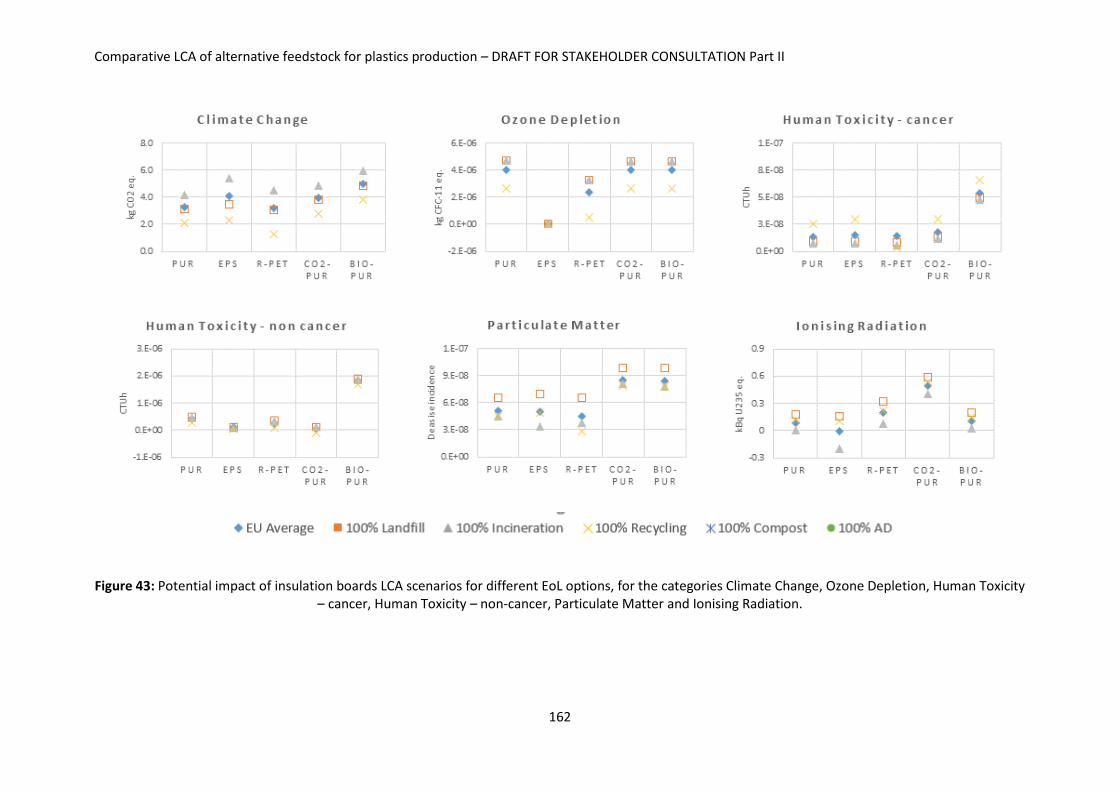
Comparative LCA of alternative feedstock for plastics production – DRAFT FOR STAKEHOLDER CONSULTATION Part II
162
Figure 43: Potential impact of insulation boards LCA scenarios for different EoL options, for the categories Climate Change, Ozone Depletion, Human Toxicity – cancer, Human Toxicity – non-cancer, Particulate Matter and Ionising Radiation.

Comparative LCA of alternative feedstock for plastics production – DRAFT FOR STAKEHOLDER CONSULTATION Part II
163
1
Figure 44: Potential impact of insulation boards LCA scenarios for different EoL options, for the categories Photochemical Ozone Formation, Acidification, 2 Eutrophication Terrestrial, Eutrophication Freshwater, Eutrophication Marine, and Ecotoxicity Freshwater. 3
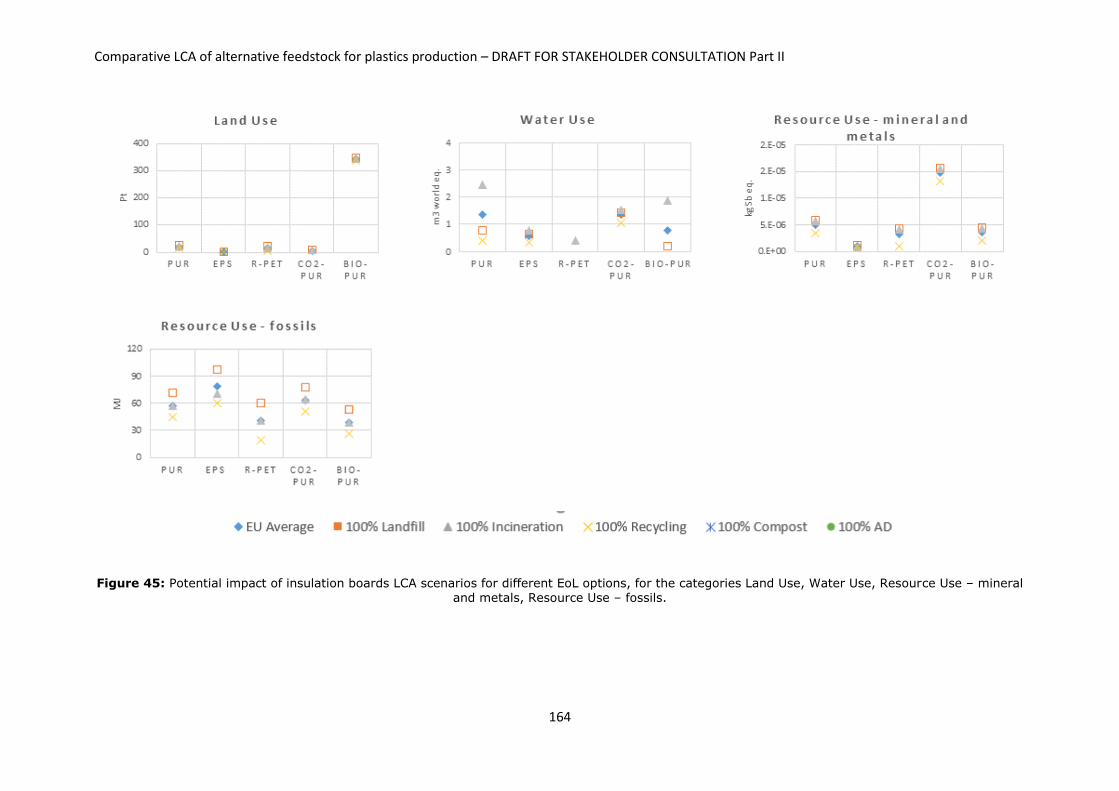
Comparative LCA of alternative feedstock for plastics production – DRAFT FOR STAKEHOLDER CONSULTATION Part II
164
Figure 45: Potential impact of insulation boards LCA scenarios for different EoL options, for the categories Land Use, Water Use, Resource Use – mineral and metals, Resource Use – fossils.
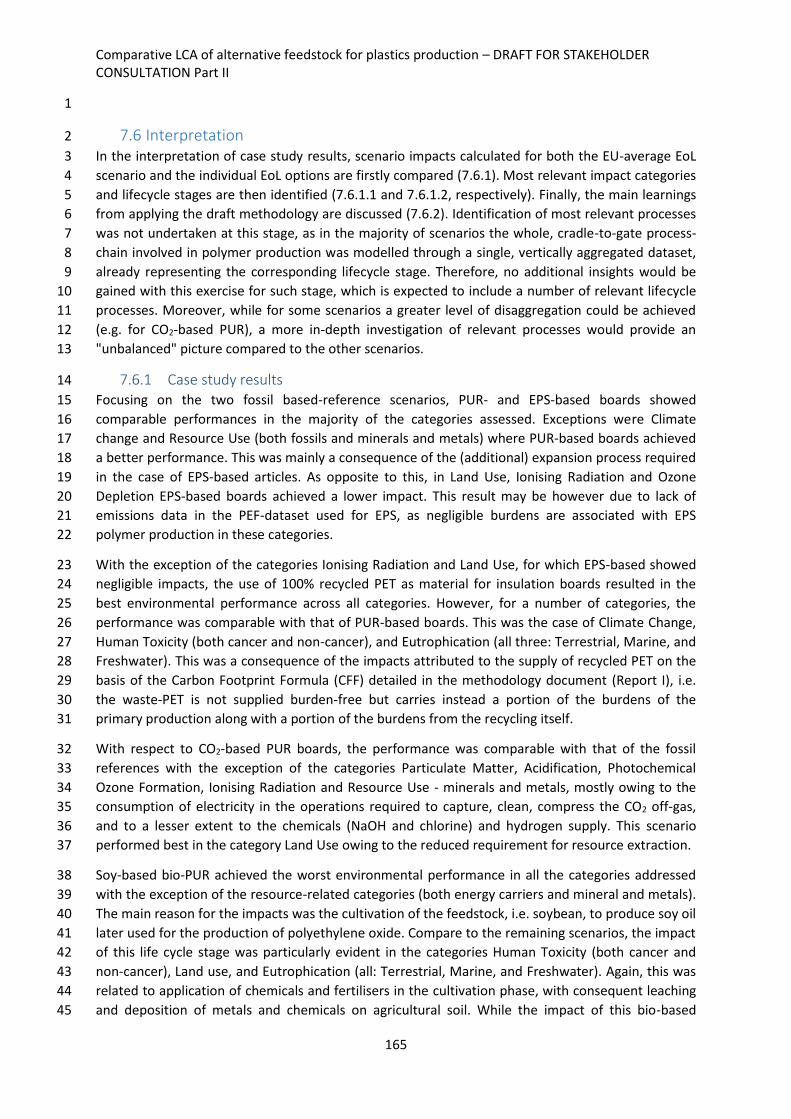
Comparative LCA of alternative feedstock for plastics production – DRAFT FOR STAKEHOLDER CONSULTATION Part II
165
1
7.6 Interpretation 2
In the interpretation of case study results, scenario impacts calculated for both the EU-average EoL 3
scenario and the individual EoL options are firstly compared (7.6.1). Most relevant impact categories 4
and lifecycle stages are then identified (7.6.1.1 and 7.6.1.2, respectively). Finally, the main learnings 5
from applying the draft methodology are discussed (7.6.2). Identification of most relevant processes 6
was not undertaken at this stage, as in the majority of scenarios the whole, cradle-to-gate process-7
chain involved in polymer production was modelled through a single, vertically aggregated dataset, 8
already representing the corresponding lifecycle stage. Therefore, no additional insights would be 9
gained with this exercise for such stage, which is expected to include a number of relevant lifecycle 10
processes. Moreover, while for some scenarios a greater level of disaggregation could be achieved 11
(e.g. for CO2-based PUR), a more in-depth investigation of relevant processes would provide an 12
"unbalanced" picture compared to the other scenarios. 13
7.6.1 Case study results 14
Focusing on the two fossil based-reference scenarios, PUR- and EPS-based boards showed 15
comparable performances in the majority of the categories assessed. Exceptions were Climate 16
change and Resource Use (both fossils and minerals and metals) where PUR-based boards achieved 17
a better performance. This was mainly a consequence of the (additional) expansion process required 18
in the case of EPS-based articles. As opposite to this, in Land Use, Ionising Radiation and Ozone 19
Depletion EPS-based boards achieved a lower impact. This result may be however due to lack of 20
emissions data in the PEF-dataset used for EPS, as negligible burdens are associated with EPS 21
polymer production in these categories. 22
With the exception of the categories Ionising Radiation and Land Use, for which EPS-based showed 23
negligible impacts, the use of 100% recycled PET as material for insulation boards resulted in the 24
best environmental performance across all categories. However, for a number of categories, the 25
performance was comparable with that of PUR-based boards. This was the case of Climate Change, 26
Human Toxicity (both cancer and non-cancer), and Eutrophication (all three: Terrestrial, Marine, and 27
Freshwater). This was a consequence of the impacts attributed to the supply of recycled PET on the 28
basis of the Carbon Footprint Formula (CFF) detailed in the methodology document (Report I), i.e. 29
the waste-PET is not supplied burden-free but carries instead a portion of the burdens of the 30
primary production along with a portion of the burdens from the recycling itself. 31
With respect to CO2-based PUR boards, the performance was comparable with that of the fossil 32
references with the exception of the categories Particulate Matter, Acidification, Photochemical 33
Ozone Formation, Ionising Radiation and Resource Use - minerals and metals, mostly owing to the 34
consumption of electricity in the operations required to capture, clean, compress the CO2 off-gas, 35
and to a lesser extent to the chemicals (NaOH and chlorine) and hydrogen supply. This scenario 36
performed best in the category Land Use owing to the reduced requirement for resource extraction. 37
Soy-based bio-PUR achieved the worst environmental performance in all the categories addressed 38
with the exception of the resource-related categories (both energy carriers and mineral and metals). 39
The main reason for the impacts was the cultivation of the feedstock, i.e. soybean, to produce soy oil 40
later used for the production of polyethylene oxide. Compare to the remaining scenarios, the impact 41
of this life cycle stage was particularly evident in the categories Human Toxicity (both cancer and 42
non-cancer), Land use, and Eutrophication (all: Terrestrial, Marine, and Freshwater). Again, this was 43
related to application of chemicals and fertilisers in the cultivation phase, with consequent leaching 44
and deposition of metals and chemicals on agricultural soil. While the impact of this bio-based 45
Comparative LCA of alternative feedstock for plastics production – DRAFT FOR STAKEHOLDER CONSULTATION Part II
166
scenario was as well larger in the remaining energy-related categories, such as Climate Change, the 1
overall magnitude of such impacts was nevertheless comparable with that of the remaining 2
scenarios (Figures 40 to 42). The lesser impact on resources was due to the reduced extraction, 3
refining and use of fossil fuels in the polymer production phase. 4
Overall, the results for EoL in Figures 40 to 42 show comparable results across scenarios. This is the 5
consequence of the assumptions taken in section 7.4.5 where it was assumed that the EoL treatment 6
routes were the same regardless of the material type, due to poor information available on the 7
material-specific EoL routes. Figures 43 to 45 documents that achieving a maximum of recycling 8
(100%) was the best EoL scenario in all environmental categories except for Human Toxicity - cancer. 9
The reason for this appears to be the emissions from the recycling process. Yet, due to the 10
aggregated nature of the PEF-dataset it was not possible to understand the specific process 11
determining this impact. All in all, the results reflected and confirmed the priority suggested by the 12
waste hierarchy where landfilling was the least favourable EoL option in almost all categories. 13
7.6.1.1 Identification of most relevant impact categories 14
15

Comparative LCA of alternative feedstock for plastics production – DRAFT FOR STAKEHOLDER CONSULTATION Part II
167
Table 45 shows the most relevant categories, as identified conforming to the approach detailed in 1
the methodology document (Report I), i.e. those impact categories for which the sum of the 2
normalised and weighted contributions equals at least 80% of the total normalised and weighted 3
impact of the 16 impact categories considered. Results for Water Use were considered not to be 4
reliable, thus the ranking was calculated without this impact category. Climate Change and Resource 5
Use – fossils were identified as the two most relevant impact categories in all the five scenarios 6
assessed. For scenario 5 (soy-based Bio-PUR) Human Toxicity categories (both cancer and non-7
cancer), Land Use, and Ecotoxicity Freshwater appeared also to be relevant. This was expected 8
because of the crop cultivation phase involved in this scenario. Human Toxicity was however 9
relevant also in the case of scenario 1 (PUR-based insulation) and 3 (R-PET based insulation). For 10
scenario 1-3-4, additional energy-related impact categories appeared also to be relevant: these were 11
identified in Ozone Depletion, Photochemical Ozone formation, and Particulate Matter. 12
13

Comparative LCA of alternative feedstock for plastics production – DRAFT FOR STAKEHOLDER CONSULTATION Part II
168
Table 45: Most relevant impact categories identified for insulation boards LCA scenarios 1
S1 PUR S2 EPS S3 R-PET
Impact category Contrib. (%) Impact category Contrib. (%) Impact category Contrib. (%)
Climate Change 38.3% Climate Change 45.6% Climate Change 45.3%
Resource Use – fossils 28.9%
Resource Use - fossils 37.2%
Resource Use - fossils 24.3%
Human Toxicity – non-cancer 7.0%
Total 82.8%
Human Toxicity –non-cancer 5.2%
Ozone Depletion 4.8%
Human Toxicity -cancer 4.1%
Photochemical Ozone Formation 3.6%
Photochemical Ozone Formation 3.4%
Total 82.6% Total 82.3%
S4 CO2-PUR S5 Bio-PUR
Impact category Contrib. (%) Impact category Contrib. (%)
Climate Change 38.9% Climate Change 35.0%
Resource Use - fossils 27.0% Human Toxicity –non-cancer 18.3%
Resource Use - minerals and metals 7.8%
Resource Use - fossils 11.5%
Particulate Matter 4.4% Human Toxicity -cancer 7.7%
Photochemical Ozone Formation 4.1% Land Use 5.3%
Total 82.2%
Ecotoxicity Freshwater 4.0%
Total 81.9%
2
7.6.1.2 Identification of most relevant life cycle stages 3
4

Comparative LCA of alternative feedstock for plastics production – DRAFT FOR STAKEHOLDER CONSULTATION Part II
169
Table 46 shows the most relevant lifecycle stages in the relevant impact categories (as identified in 1
7.6.1.1) and the associated contribution, quantified conforming to the approach detailed in the 2
methodology document (Report I). Across all the categories investigated, the major contribution to 3
the total impact was attributed to the life cycle stages "Polymer production" and "End of Life", the 4
latter as aggregation of burdens and credits. While the article production was in most cases (e.g. 5
PUR-based scenarios) aggregated with the polymer production and little can be therefore said on its 6
contribution, transportation activities consistently showed a minor contribution to the total impact 7
across all the categories investigated. As a general tendency, "Polymer Production" was the major 8
contribution to the total impact, across all the categories under assessment. However, the 9
contribution from "End of Life" was comparable, or even larger, in the category Climate Change for 10
EPS- and R-PET-based insulation boards (scenario 2 and 3, respectively). For the specific case of the 11
Toxicity- and Land-related impacts for soy-based Bio-PUR (scenario 5), the polymer production stage 12
appeared to overwhelm any remaining contribution. 13
14
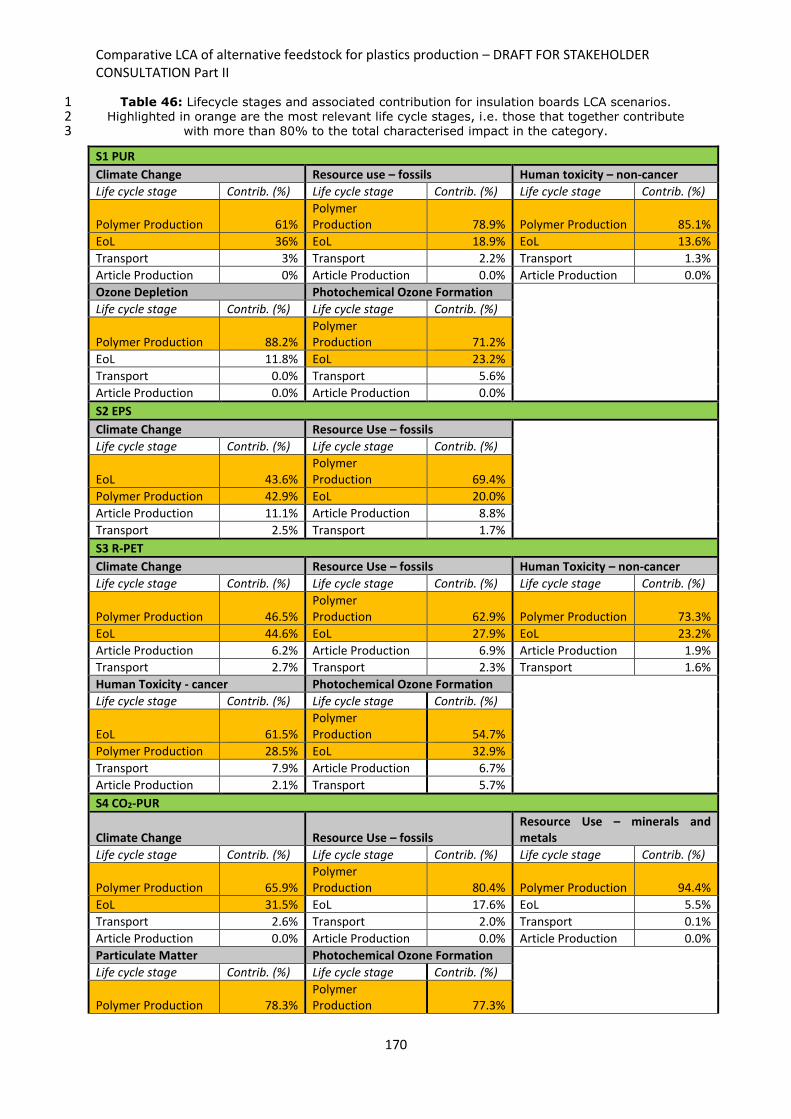
Comparative LCA of alternative feedstock for plastics production – DRAFT FOR STAKEHOLDER CONSULTATION Part II
170
Table 46: Lifecycle stages and associated contribution for insulation boards LCA scenarios. 1 Highlighted in orange are the most relevant life cycle stages, i.e. those that together contribute 2
with more than 80% to the total characterised impact in the category. 3
S1 PUR
Climate Change Resource use – fossils Human toxicity – non-cancer
Life cycle stage Contrib. (%) Life cycle stage Contrib. (%) Life cycle stage Contrib. (%)
Polymer Production 61% Polymer Production 78.9% Polymer Production 85.1%
EoL 36% EoL 18.9% EoL 13.6%
Transport 3% Transport 2.2% Transport 1.3%
Article Production 0% Article Production 0.0% Article Production 0.0%
Ozone Depletion Photochemical Ozone Formation
Life cycle stage Contrib. (%) Life cycle stage Contrib. (%)
Polymer Production 88.2% Polymer Production 71.2%
EoL 11.8% EoL 23.2%
Transport 0.0% Transport 5.6%
Article Production 0.0% Article Production 0.0%
S2 EPS
Climate Change Resource Use – fossils
Life cycle stage Contrib. (%) Life cycle stage Contrib. (%)
EoL 43.6% Polymer Production 69.4%
Polymer Production 42.9% EoL 20.0%
Article Production 11.1% Article Production 8.8%
Transport 2.5% Transport 1.7%
S3 R-PET
Climate Change Resource Use – fossils Human Toxicity – non-cancer
Life cycle stage Contrib. (%) Life cycle stage Contrib. (%) Life cycle stage Contrib. (%)
Polymer Production 46.5% Polymer Production 62.9% Polymer Production 73.3%
EoL 44.6% EoL 27.9% EoL 23.2%
Article Production 6.2% Article Production 6.9% Article Production 1.9%
Transport 2.7% Transport 2.3% Transport 1.6%
Human Toxicity - cancer Photochemical Ozone Formation
Life cycle stage Contrib. (%) Life cycle stage Contrib. (%)
EoL 61.5% Polymer Production 54.7%
Polymer Production 28.5% EoL 32.9%
Transport 7.9% Article Production 6.7%
Article Production 2.1% Transport 5.7%
S4 CO2-PUR
Climate Change Resource Use – fossils Resource Use – minerals and metals
Life cycle stage Contrib. (%) Life cycle stage Contrib. (%) Life cycle stage Contrib. (%)
Polymer Production 65.9% Polymer Production 80.4% Polymer Production 94.4%
EoL 31.5% EoL 17.6% EoL 5.5%
Transport 2.6% Transport 2.0% Transport 0.1%
Article Production 0.0% Article Production 0.0% Article Production 0.0%
Particulate Matter Photochemical Ozone Formation
Life cycle stage Contrib. (%) Life cycle stage Contrib. (%)
Polymer Production 78.3% Polymer Production 77.3%

Comparative LCA of alternative feedstock for plastics production – DRAFT FOR STAKEHOLDER CONSULTATION Part II
171
EoL 17.3% EoL 18.3%
Transport 4.3% Transport 4.4%
Article Production 0.0% Article Production 0.0%
S5 Bio-PUR
Climate Change Human Toxicity – non-cancer Resource Use – fossils
Life cycle stage Contrib. (%) Life cycle stage Contrib. (%) Life cycle stage Contrib. (%)
Polymer Production 71.4% Polymer Production 95.8% Polymer Production 73.1%
EoL 26.4% EoL 3.8% EoL 24.1%
Transport 2.2% Transport 0.4% Transport 2.8%
Article Production 0.0% Article Production 0.0% Article Production 0.0%
Human Toxicity - cancer Land Use Ecotoxicity Freshwater
Life cycle stage Contrib. (%) Life cycle stage Contrib. (%) Life cycle stage Contrib. (%)
Polymer Production 83.6% Polymer Production 98.5% Polymer Production 97.3%
EoL 13.9% EoL 1.3% EoL 2.4%
Transport 2.5% Transport 0.2% Transport 0.3%
Article Production 0.0% Article Production 0.0% Article Production 0.0%
1
7.7 Learnings from applying the draft methodology 2
This section summarises the main learnings from applying the draft methodology to this specific case 3
study. The discussion separately addresses the main implications and limitations of the applied 4
method (and data) on the overall results (7.7.1), as well as the possible options that will or can be 5
undertaken to overcome such limitations, or explored to further improve the assessment (7.7.2). 6
7.7.1 Implications of methodological choices on the results 7
This section addresses some of the key methodological choices affecting the results. These are 8
identified in: i) handling of long-term carbon emissions (timing and storage), ii) handling of EoL 9
(treatment shares and quality of secondary raw material), iii) approach used to quantify the iLUC 10
contribution, iv) approach used to handle the burdens associated with secondary raw material 11
supply, and v) use of strictly EF-compliant aggregated datasets. 12
First, timing of carbon emissions was not performed. This means that no storage credits (delayed 13
emissions) were attributed to bio-based articles (e.g. soy-based bio-PUR) or to CO2-derived. 14
Including a dynamic assessment of GHGs for the Climate change category may incur better 15
performances for scenario 4-5 (CO2-PUR and bio-PUR). 16
Second, the information available on the current EU End-of-Life treatment shares for post-consumer 17
insulation products was poor (see section 7.4.5). Because of the lack of material-specific EoL 18
information, all the materials were considered to undergo the same EoL route regardless of the type. 19
Likewise, poor information was available on the quality of the secondary raw materials (i.e. the 20
factor Qout). Both EoL treatment shares and quality factors affect the calculation in the Circular 21
Footprint Formula. 22
Third, after careful evaluation of the literature, it appears that the iLUC GHG factors provided in EU 23
2015/1513 (EC, 2015) fall in the lower end of the range found in the recent literature (see 24
methodology document -Report I-). The reasons for this could be related to the exclusion of 25
intensification-related impacts (i.e. only expansion on nature is included), the assumptions taken in 26
the economic models, and the approach used to handle carbon emissions (i.e. amortisation) as 27
highlighted in a recent review by (De Rosa, Knudsen and Hermansen, 2016). In addition, it should be 28
kept in mind that the iLUC contribution used in this screening only accounted for carbon emissions, 29
Comparative LCA of alternative feedstock for plastics production – DRAFT FOR STAKEHOLDER CONSULTATION Part II
172
thus only impacts on the climate change category were addressed. A larger iLUC GHG contribution 1
and the inclusion of nutrients-related impacts (e.g. intensification) in the iLUC inventory will further 2
worsen the Climate change, Acidification, and Eutrophication performance of the bio-PUR scenario. 3
The approach used to quantify the provision burdens for secondary raw material conformed to the 4
Circular Footprint Formula detailed in the PEF. This implies assigning to the secondary raw material 5
used a portion of the burdens from a corresponding virgin production. In other words, secondary 6
raw material carry a portion of the burdens from virgin production, assuming that they would 7
anyway be recycled or maintained in the material cycle loop. Such approach has little (or none, the 8
authors are aware of) application in the available peer-reviewed scientific literature, where 9
alternative approaches are applied (see 7.7.2). The latter in tendency increase the benefits 10
associated with use of secondary raw material. 11
The last critical issue was represented by the high-level of aggregation of the PEF-compliant 12
datasets. Such an aggregation does not allow an in-depth understanding of the sub-processes 13
responsible for the emissions and associated impacts. This is the case, for example, of the soybean 14
oil dataset used in scenario 5, which comes as an aggregated dataset where it is not possible to 15
distinguish between carbon emissions related to dLUC and to cultivation of the soybean itself. 16
The last critical issue was represented by the high-level of aggregation of the EF-compliant (or GaBi) 17
datasets used in the modelling. Such an aggregation does not allow an in-depth understanding of the 18
sub-processes responsible for the emissions and associated impacts. This is the case, for example, of 19
the soybean oil dataset used in scenario 5, which comes as an aggregated dataset where it is not 20
possible to distinguish between carbon emissions related to dLUC and to cultivation of the soybean 21
itself. The use of such type of datasets involves not only interpretation challenges, but also some 22
issues in relation to the results for the category Water Use, Ozone Depletion, Eutrophication 23
Freshwater, and Ecotoxicity Freshwater as mentioned earlier. 24
7.7.2 Options to be explored for further improvement 25
Following up on the improvement areas indicated in section 7.7.1, this section attempts to describe 26
possible methodological advancements that may be applied in a full LCA. Overall, different 27
methodological choices could be further explored in a full LCA, e.g. exemplified for one scenario. The 28
following should be seen as possible options for improvements. On these, the stakeholders are 29
strongly encouraged to provide feedbacks and suggestions. 30
First, advanced approaches for addressing the issue of emission timing exist (Faraca et al., 2018, 31
Levasseur et al., 2013, Guest et al., 2012, Cherubini et al., 2011) and may be applied in a full LCA to 32
evaluate the importance of storage, especially for biogenic carbon (affecting the partly soy-based 33
bio-PUR) and for captured CO2 (affecting the CO2-based scenario). These approaches consist in a 34
dynamic assessment of the GHGs (mainly CO2, as this is typically the most relevant GHG; see Faraca 35
et al., 2018) using an advanced time-dependent formulation of the GWP integer departing from the 36
Bern's equation (see Cherubini et al., 2011). 37
Additional information on the EoL of the articles assessed in this screening could be obtained from 38
industry and association of producers/industries, i.e. from specific market players (e.g. association of 39
EU PU). Indeed, after reviewing the available scientific literature the authors are aware of, it appears 40
evident that there is a lack of specific and readily available information on the final treatment fate of 41
insulation materials. Likewise, further information is needed in respect to quality of the secondary 42
raw materials. Relevant stakeholders may be interested in providing more detailed information on 43
these aspects. 44

Comparative LCA of alternative feedstock for plastics production – DRAFT FOR STAKEHOLDER CONSULTATION Part II
173
For iLUC, alternative pathways to EU 2015/1513 (EC 2015) may be represented by applying causal 1
deterministic models (e.g. (Schmidt, Weidema and Brandao, 2015), Tonini et al. (2016), or applying 2
the iLUC figures derived with economic equilibrium models, for example by (Valin et al., 2015). 3
Causal deterministic models depart from the assumption of full-elasticity of supply, neglecting any 4
fluctuation in food prices following short-term market shocks and are mainly intended for 5
application in consequential (change-oriented; long-term) LCA. According to these models, reduced 6
consumption and constrained suppliers (i.e. geographic areas where expansion cannot be performed 7
and where further intensification is limited) should not be part of the consequences associated with 8
the demand for additional land that ultimately incurs only expansion and intensification in the long-9
term. 10
To quantify the provision burdens for secondary raw material, an alternative approach could be to 11
apply recent literature approaches (often called consequential) accounting for the avoided burdens 12
in place of applying the CFF approach, or to adjust the CFF by including such contribution in the 13
equation. Notice that such contribution was originally present in earlier formulations of the CFF. 14
These consequential approaches depart from the principle that waste is generated regardless of the 15
market demand for a specific product and, as such, cannot be additionally supplied but only shifted 16
from one treatment options to another (assuming a constrained amount is generated, regardless of 17
the demand for the plastic-product under assessment). On this basis, the utilisation of waste as 18
secondary raw material would then avoid the conventional (prominently affected) treatment of such 19
waste, e.g. landfilling and/or incineration, which would otherwise take place. By doing so, the 20
secondary raw material supplied is credited with savings from the avoided counterfactual treatment 21
(e.g. see Cimpan et al., 2015). Academics and other stakeholders are welcomed to provide feedbacks 22
and/or suggestions on these approaches. 23
Last, possible solutions to resolve the high level of aggregation of the EF-compliant datasets may 24
consist of: i) utilising different and more disaggregated datasets (e.g. from ecoinvent) instead of the 25
strictly EF-compliant ones, albeit this will result in an additional deviation from the PEF 26
methodology; or ii) trying to ask for/obtain the original disaggregated EF-compliant datasets, if 27
available at all. The latter, however, is anticipated to be a rather difficult solution. A more 28
disaggregated version (at level 1) of EF-compliant datasets may be available in the near future, and 29
their application may be considered for full LCA case studies, bringing some improvement in the 30
interpretation possibilities. Nevertheless, in the case insulation materials will be selected for 31
performing a full LCA, we welcome interested stakeholders to provide industrial and/or up-to-date 32
data on the production of these materials. 33
34

Comparative LCA of alternative feedstock for plastics production – DRAFT FOR STAKEHOLDER CONSULTATION Part II
174
8. Case study 5: automotive interior panel 1
8.1 Assessed scenarios 2
The use of different materials and/or feedstocks for automotive interior panel manufacturing was 3
explored by assessing six alternative scenarios, as shown in 4

Comparative LCA of alternative feedstock for plastics production – DRAFT FOR STAKEHOLDER CONSULTATION Part II
175
Table 47. Three reference scenarios based on fossil-based plastics, namely PP, ABS and PBS, were 1
analysed (scenarios 1, 2 and 3). In addition to this, the use of recycled (fossil-based) post-consumer 2
PP is also explored (R-PP, Scenario 4), assuming a 100% recycled content. Although different shares 3
of recycled material can be mixed with virgin material to be used as input to panel production, this 4
study focuses on panels made entirely of recycled input. This allows assessing the effects of a 5
complete substitution of the virgin material. Two bio-based products were also assessed; bio-based 6
PBS and PLA (scenarios 5 and 6). These were considered to be fully bio-based, i.e. all building blocks 7
that compose the polymer are made from biological raw materials. Once again, this allows 8
assessment of the effects of a complete fossil raw material substitution. In the case of bio-PBS the 9
building blocks were bio-derived succinic acid and 1,4-butanediol while PLA was considered to be 10
produced via the fermentation of corn-derived dextrose followed by polymerisation of lactic acid. 11
PLA is aerobically biodegradable under controlled composting conditions, and, to a lower extent, 12
under specific anaerobic conditions typical of biogasification plants. PLA-based panels assessed in 13
Scenario 6 were considered to be made from corn grown in the United States as a primary 14
feedstock. Both fossil PBS and bio-PBS are biodegradable according to EN 13432 (PTT MCC Biochem 15
Co., 2014). Bio-PBS panels were produced from bio-derived succinic acid and 1,4-butanediol while 16
fossil PBS was produced using fossil-based succinic acid and 1,4-butanediol. Due to limitations in 17
data availability, the results for PBS and bio-PBS obtained in this assessment are not representative 18
of real industrial production and should be interpreted by keeping in mind that technologies with 19
different level of maturity are compared. 20
21

Comparative LCA of alternative feedstock for plastics production – DRAFT FOR STAKEHOLDER CONSULTATION Part II
176
Table 47: LCA scenarios assessed for the automotive interior panel screening case study 1
Scenario Polymer Monomer/Co-polymer Feedstock EoL options(a)
SC1 - Conventional polymer 1 PP Propylene Fossil-based
(oil/natural gas)
Recycling
Incineration
Landfilling
SC2 - Conventional polymer 2 ABS Acrylonitrile Butadiene
Styrene
Fossil-based
(oil/natural gas)
Recycling
Incineration
Landfilling
SC3 - Conventional polymer 3 PBS Succinic acid
1,4-butanediol (BDO)
Fossil-based
(oil/natural gas)
Recycling
Incineration
Landfilling
Composting
Anaerobic
digestion
SC4 - Alternative polymer 1 r-PP Polypropylene Fossil-based
(oil/natural gas)
Recycling
Incineration
Landfilling
SC5 - Alternative polymer 2 PLA Lactic Acid Maize (USA) Recycling
Incineration
Landfilling
Composting
Anaerobic
digestion
SC6 - Alternative polymer 3 Bio-PBS Bio-Succinic acid
Bio-BDO
Sugarcane
(Thailand)
Maize (Thailand)
Recycling
Incineration
Landfilling
Composting
Anaerobic
digestion
(a) The impacts of scenarios were individually assessed for each listed EoL option, as well as for 2
a combination of such options reflecting as far as possible the average situation at the EU 3
level. 4
5
8.2 Functional Unit and reference flow 6
The main function of the article under study is to cover the interior of a car's door from producers to 7
final customers. The functional unit of this case study was defined as “covering an area of 1 m2 of car 8
door with a thickness of 0.8 mm". The 0.8 mm thickness was chosen as a common value typically 9
found in the automotive interior panel industry (Benecke-Kaliko AG, 2018). 10
The reference flow of each scenario (i.e. the amount of panel material required in order to fulfil the 11
functional unit), was calculated considering the density of panel for each material. 12
Comparative LCA of alternative feedstock for plastics production – DRAFT FOR STAKEHOLDER CONSULTATION Part II
177
Table 48 summarises the reference flows of interior panel material in each scenario. 1
2

Comparative LCA of alternative feedstock for plastics production – DRAFT FOR STAKEHOLDER CONSULTATION Part II
178
Table 48: Reference flow calculation for each automotive interior panel LCA scenario 1
Material Panel density (kg/m3) Reference flow (kg/FU)
PP 900 0.72
ABS 1100 0.88
PBS 1240 0.99
R-PP 900 0.72
Bio-PBS 1240 0.99
PLA 1240 0.99
2
8.3 System Boundary 3
In all scenarios, the system boundary was set in order to cover the most relevant stages of the full 4
product life cycle (cradle-to-grave perspective), as depicted in Figures 46 to 51. Shaded-dashed 5
boxes in the diagrams represent system credits. Note that, in principle, to completely fulfil the 6
functional of the study (i.e. door cover), additional items might be required (e.g. accessories, trim 7
parts, etc.). However, given the focus of the study on a specific article (i.e. panels) these additional 8
items are excluded from the assessment. This omission has no effects on the outcome of the 9
comparison among the different scenarios, as it can be reasonably assumed that the same additional 10
items are employed regardless of the material or feedstock used for panel manufacturing. All 11
transport flows between different life cycle stages were considered in the study, as was the indirect 12
land use change of crops. The product's use phase was excluded from the study in order to simplify 13
data collection. Due to the small differences in panel weight for the different scenarios and, more 14
importantly, the low contribution of interior panels to the total vehicle kerb weight, this exclusion is 15
not expected to have any significant effects on the comparison among different scenarios.. Finally, it 16
has to be noted that additives were not included in the assessment, due to lack of (consistent) data 17
and information on the use of additives for the examined plastic materials, and for plastics in 18
general. This is acknowledged as a limitation of this screening study, as additive production can 19
account for a non-negligible portion of climate impact (up to 45%, see section 2.3.2.10 in Report I). 20
Moreover, additives can also be relevant at the end-of-life stage, where they can be released, as 21
such or after degradation/conversion into different compound(s), in the environment (i.e. the soil in 22
case of biodegradable plastics routed to biological treatments or subject to in-situ degradation). 23

Comparative LCA of alternative feedstock for plastics production – DRAFT FOR STAKEHOLDER CONSULTATION Part II
179
1
Figure 46: System boundary for fossil-based PP (Scenario 1). (*) Handled according to the Circular Footprint Formula 2
3
4
5
Figure 47: System boundary for ABS (Scenario 2). (*) Handled according to the Circular Footprint Formula 6
7
8

Comparative LCA of alternative feedstock for plastics production – DRAFT FOR STAKEHOLDER CONSULTATION Part II
180
1
Figure 48: System boundary for fossil-based PBS (Scenario 3) 2
3
4
5
Figure 49: System boundary for recycled PP (Scenario 4) (*). Handled according to the Circular Footprint Formula 6
7
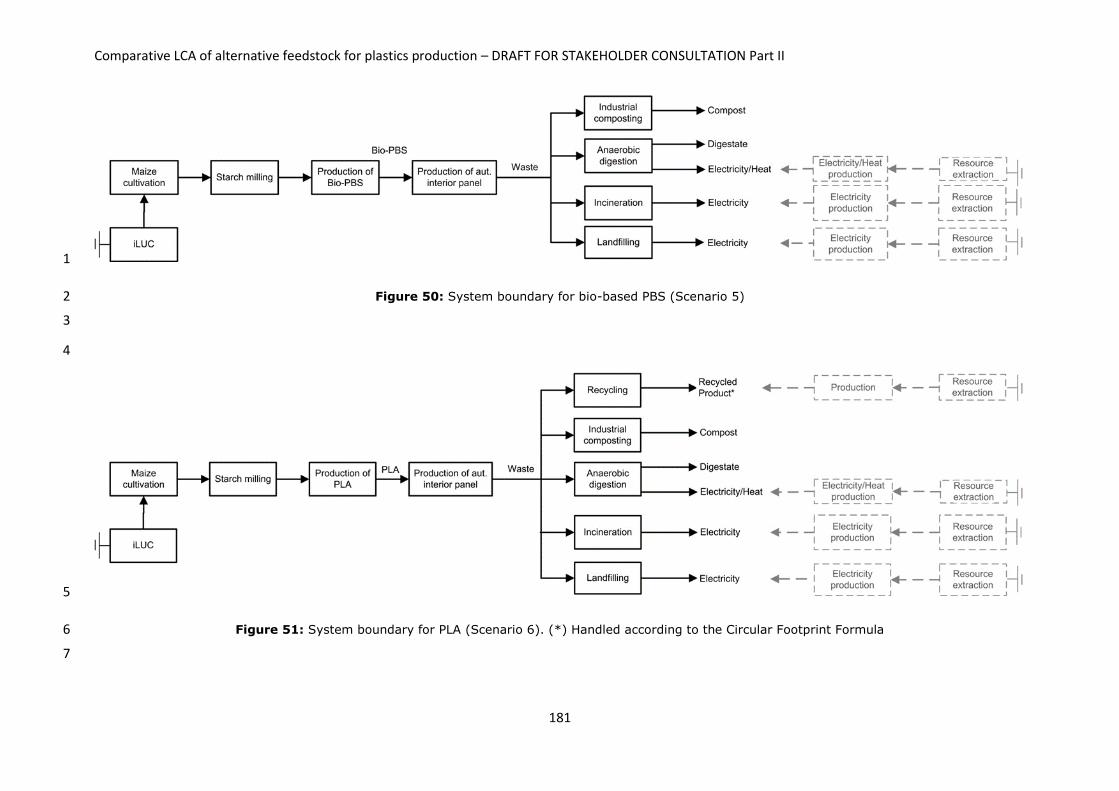
Comparative LCA of alternative feedstock for plastics production – DRAFT FOR STAKEHOLDER CONSULTATION Part II
181
1
Figure 50: System boundary for bio-based PBS (Scenario 5) 2
3
4
5
Figure 51: System boundary for PLA (Scenario 6). (*) Handled according to the Circular Footprint Formula 6
7

Comparative LCA of alternative feedstock for plastics production – DRAFT FOR STAKEHOLDER CONSULTATION Part II
182
8.4 Life Cycle Inventory 1
This section describes the overall approach for building the LCI of the analysed scenarios, along with 2
related assumptions and data sources. The description is separated by major lifecycle stages. The list 3
of processes and related data sources are provided in Tables 49 to Table 54. It must be noted that 4
different scenarios may have different technology readiness levels (TRLs). For instance, 5
manufacturing of Bio-PBS is a relatively new technology compared to the manufacturing of PP, 6
which is a well-established technology. The effect of different TRLs on the results is discussed in 7
section 8.5. 8
9
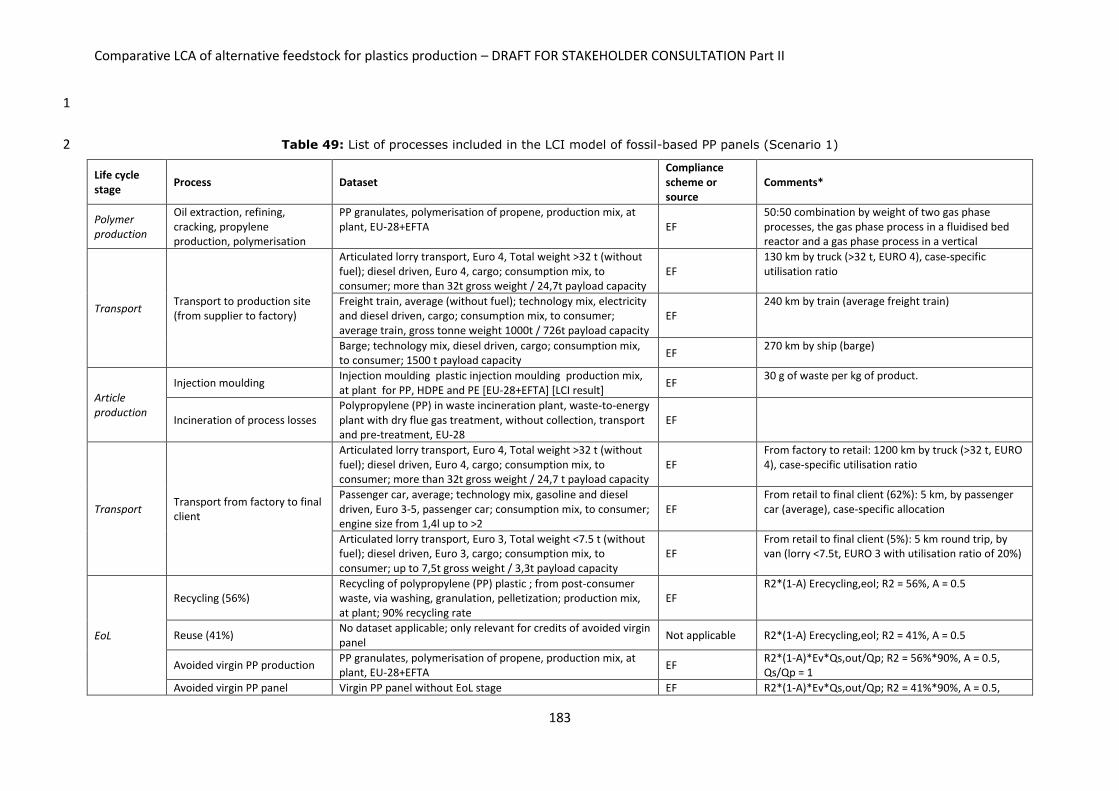
Comparative LCA of alternative feedstock for plastics production – DRAFT FOR STAKEHOLDER CONSULTATION Part II
183
1
Table 49: List of processes included in the LCI model of fossil-based PP panels (Scenario 1) 2
Life cycle stage
Process Dataset Compliance scheme or source
Comments*
Polymer production
Oil extraction, refining, cracking, propylene production, polymerisation
PP granulates, polymerisation of propene, production mix, at plant, EU-28+EFTA EF
50:50 combination by weight of two gas phase processes, the gas phase process in a fluidised bed reactor and a gas phase process in a vertical
Transport Transport to production site (from supplier to factory)
Articulated lorry transport, Euro 4, Total weight >32 t (without fuel); diesel driven, Euro 4, cargo; consumption mix, to consumer; more than 32t gross weight / 24,7t payload capacity
EF 130 km by truck (>32 t, EURO 4), case-specific utilisation ratio
Freight train, average (without fuel); technology mix, electricity and diesel driven, cargo; consumption mix, to consumer; average train, gross tonne weight 1000t / 726t payload capacity
EF 240 km by train (average freight train)
Barge; technology mix, diesel driven, cargo; consumption mix, to consumer; 1500 t payload capacity
EF 270 km by ship (barge)
Article production
Injection moulding Injection moulding plastic injection moulding production mix, at plant for PP, HDPE and PE [EU-28+EFTA] [LCI result]
EF 30 g of waste per kg of product.
Incineration of process losses Polypropylene (PP) in waste incineration plant, waste-to-energy plant with dry flue gas treatment, without collection, transport and pre-treatment, EU-28
EF
Transport Transport from factory to final client
Articulated lorry transport, Euro 4, Total weight >32 t (without fuel); diesel driven, Euro 4, cargo; consumption mix, to consumer; more than 32t gross weight / 24,7 t payload capacity
EF From factory to retail: 1200 km by truck (>32 t, EURO 4), case-specific utilisation ratio
Passenger car, average; technology mix, gasoline and diesel driven, Euro 3-5, passenger car; consumption mix, to consumer; engine size from 1,4l up to >2
EF From retail to final client (62%): 5 km, by passenger car (average), case-specific allocation
Articulated lorry transport, Euro 3, Total weight <7.5 t (without fuel); diesel driven, Euro 3, cargo; consumption mix, to consumer; up to 7,5t gross weight / 3,3t payload capacity
EF From retail to final client (5%): 5 km round trip, by van (lorry <7.5t, EURO 3 with utilisation ratio of 20%)
EoL
Recycling (56%) Recycling of polypropylene (PP) plastic ; from post-consumer waste, via washing, granulation, pelletization; production mix, at plant; 90% recycling rate
EF R2*(1-A) Erecycling,eol; R2 = 56%, A = 0.5
Reuse (41%) No dataset applicable; only relevant for credits of avoided virgin panel
Not applicable R2*(1-A) Erecycling,eol; R2 = 41%, A = 0.5
Avoided virgin PP production PP granulates, polymerisation of propene, production mix, at plant, EU-28+EFTA
EF R2*(1-A)*Ev*Qs,out/Qp; R2 = 56%*90%, A = 0.5, Qs/Qp = 1
Avoided virgin PP panel Virgin PP panel without EoL stage EF R2*(1-A)*Ev*Qs,out/Qp; R2 = 41%*90%, A = 0.5,

Comparative LCA of alternative feedstock for plastics production – DRAFT FOR STAKEHOLDER CONSULTATION Part II
184
production Qs/Qp = 1
Incineration (2%) Polypropylene (PP) in waste incineration plant, waste-to-energy plant with dry flue gas treatment, without collection, transport and pre-treatment, EU-28
EF R3 = 2%
Landfill (1%)
Landfill of plastic waste| landfill including leachate treatment and with transport without collection and pre-treatment| production mix (region specific sites), at landfill site {EU-28+EFTA}
EF (1-R2-R3) = 1%
(*) The meaning of the parameters of the Circular Footprint Formula reported for EoL options (R1, R2, R3, A, Qs/Qp) are explained in section 5.5.8.11 of Report I. 1
2
3
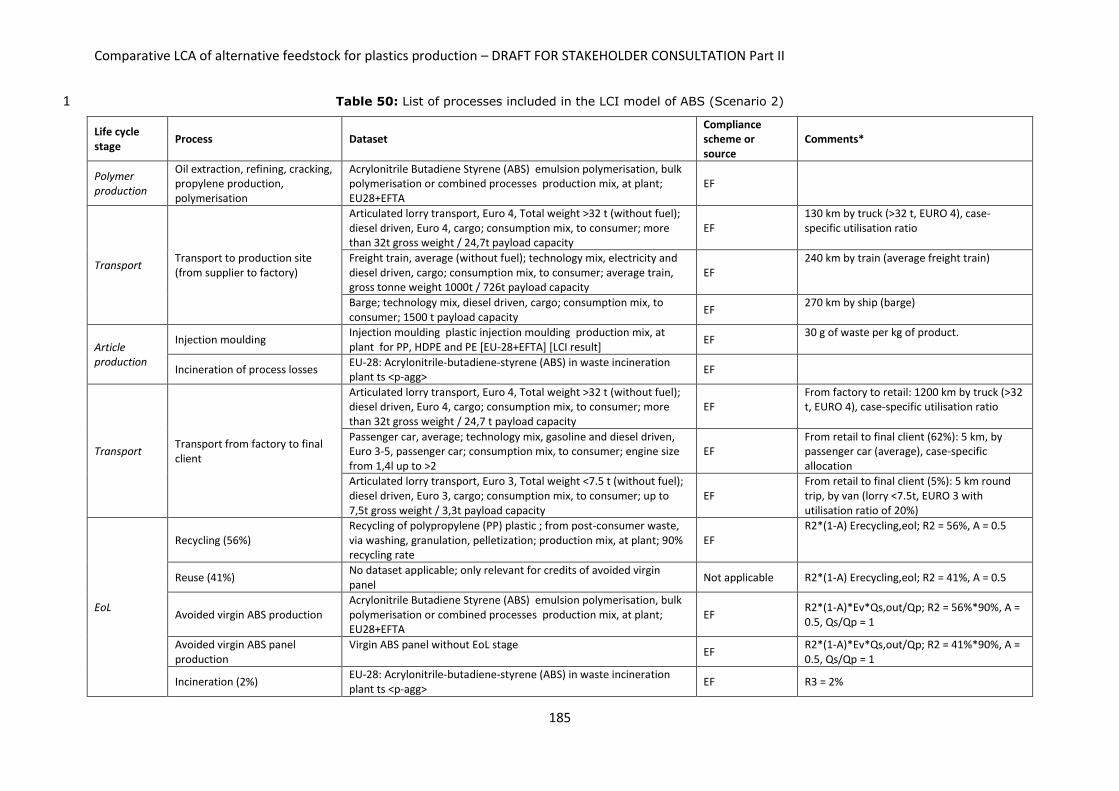
Comparative LCA of alternative feedstock for plastics production – DRAFT FOR STAKEHOLDER CONSULTATION Part II
185
Table 50: List of processes included in the LCI model of ABS (Scenario 2) 1
Life cycle stage
Process Dataset Compliance scheme or source
Comments*
Polymer production
Oil extraction, refining, cracking, propylene production, polymerisation
Acrylonitrile Butadiene Styrene (ABS) emulsion polymerisation, bulk polymerisation or combined processes production mix, at plant; EU28+EFTA
EF
Transport Transport to production site (from supplier to factory)
Articulated lorry transport, Euro 4, Total weight >32 t (without fuel); diesel driven, Euro 4, cargo; consumption mix, to consumer; more than 32t gross weight / 24,7t payload capacity
EF 130 km by truck (>32 t, EURO 4), case-specific utilisation ratio
Freight train, average (without fuel); technology mix, electricity and diesel driven, cargo; consumption mix, to consumer; average train, gross tonne weight 1000t / 726t payload capacity
EF 240 km by train (average freight train)
Barge; technology mix, diesel driven, cargo; consumption mix, to consumer; 1500 t payload capacity
EF 270 km by ship (barge)
Article production
Injection moulding Injection moulding plastic injection moulding production mix, at plant for PP, HDPE and PE [EU-28+EFTA] [LCI result]
EF 30 g of waste per kg of product.
Incineration of process losses EU-28: Acrylonitrile-butadiene-styrene (ABS) in waste incineration plant ts <p-agg>
EF
Transport Transport from factory to final client
Articulated lorry transport, Euro 4, Total weight >32 t (without fuel); diesel driven, Euro 4, cargo; consumption mix, to consumer; more than 32t gross weight / 24,7 t payload capacity
EF From factory to retail: 1200 km by truck (>32 t, EURO 4), case-specific utilisation ratio
Passenger car, average; technology mix, gasoline and diesel driven, Euro 3-5, passenger car; consumption mix, to consumer; engine size from 1,4l up to >2
EF From retail to final client (62%): 5 km, by passenger car (average), case-specific allocation
Articulated lorry transport, Euro 3, Total weight <7.5 t (without fuel); diesel driven, Euro 3, cargo; consumption mix, to consumer; up to 7,5t gross weight / 3,3t payload capacity
EF From retail to final client (5%): 5 km round trip, by van (lorry <7.5t, EURO 3 with utilisation ratio of 20%)
EoL
Recycling (56%) Recycling of polypropylene (PP) plastic ; from post-consumer waste, via washing, granulation, pelletization; production mix, at plant; 90% recycling rate
EF R2*(1-A) Erecycling,eol; R2 = 56%, A = 0.5
Reuse (41%) No dataset applicable; only relevant for credits of avoided virgin panel
Not applicable R2*(1-A) Erecycling,eol; R2 = 41%, A = 0.5
Avoided virgin ABS production Acrylonitrile Butadiene Styrene (ABS) emulsion polymerisation, bulk polymerisation or combined processes production mix, at plant; EU28+EFTA
EF R2*(1-A)*Ev*Qs,out/Qp; R2 = 56%*90%, A = 0.5, Qs/Qp = 1
Avoided virgin ABS panel production
Virgin ABS panel without EoL stage EF
R2*(1-A)*Ev*Qs,out/Qp; R2 = 41%*90%, A = 0.5, Qs/Qp = 1
Incineration (2%) EU-28: Acrylonitrile-butadiene-styrene (ABS) in waste incineration plant ts <p-agg>
EF R3 = 2%

Comparative LCA of alternative feedstock for plastics production – DRAFT FOR STAKEHOLDER CONSULTATION Part II
186
Landfill (1%) Landfill of plastic waste| landfill including leachate treatment and with transport without collection and pre-treatment| production mix (region specific sites), at landfill site {EU-28+EFTA}
EF (1-R2-R3) = 1%
(*) The meaning of the parameters of the Circular Footprint Formula reported for EoL options (R1, R2, R3, A, Qs/Qp) are explained in section 5.5.8.11 of Report I. 1
2
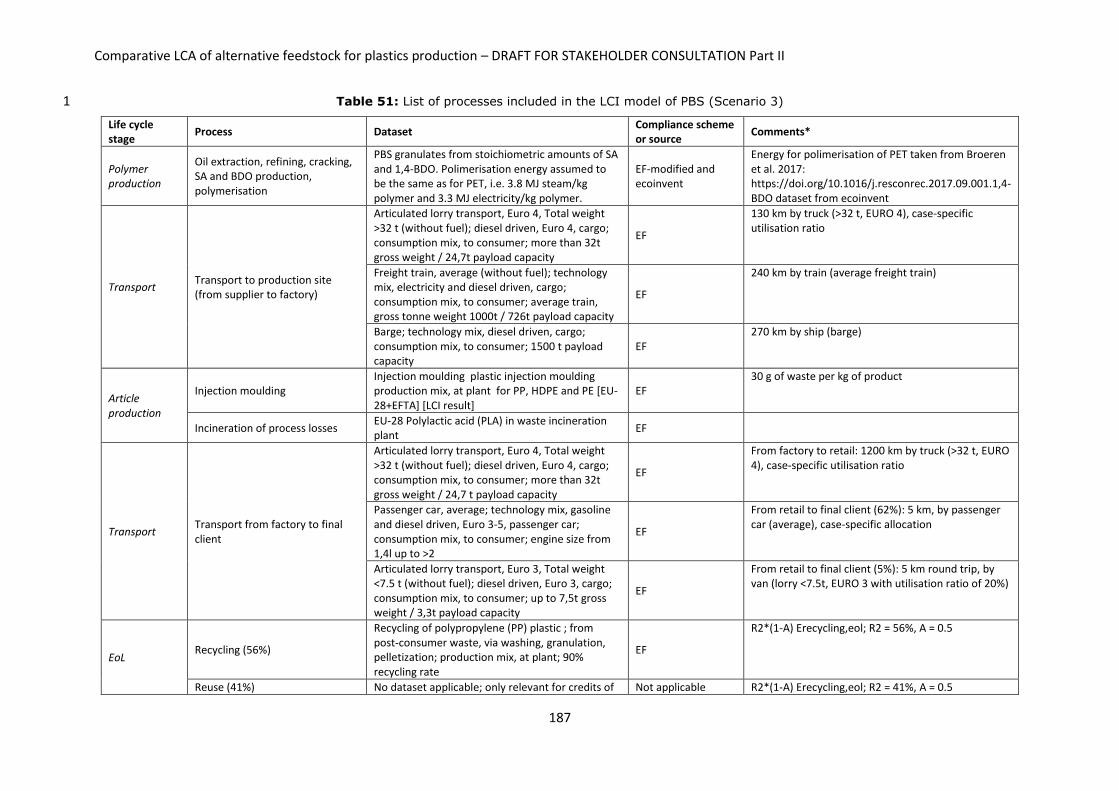
Comparative LCA of alternative feedstock for plastics production – DRAFT FOR STAKEHOLDER CONSULTATION Part II
187
Table 51: List of processes included in the LCI model of PBS (Scenario 3) 1
Life cycle stage
Process Dataset Compliance scheme or source
Comments*
Polymer production
Oil extraction, refining, cracking, SA and BDO production, polymerisation
PBS granulates from stoichiometric amounts of SA and 1,4-BDO. Polimerisation energy assumed to be the same as for PET, i.e. 3.8 MJ steam/kg polymer and 3.3 MJ electricity/kg polymer.
EF-modified and ecoinvent
Energy for polimerisation of PET taken from Broeren et al. 2017: https://doi.org/10.1016/j.resconrec.2017.09.001.1,4-BDO dataset from ecoinvent
Transport Transport to production site (from supplier to factory)
Articulated lorry transport, Euro 4, Total weight >32 t (without fuel); diesel driven, Euro 4, cargo; consumption mix, to consumer; more than 32t gross weight / 24,7t payload capacity
EF
130 km by truck (>32 t, EURO 4), case-specific utilisation ratio
Freight train, average (without fuel); technology mix, electricity and diesel driven, cargo; consumption mix, to consumer; average train, gross tonne weight 1000t / 726t payload capacity
EF
240 km by train (average freight train)
Barge; technology mix, diesel driven, cargo; consumption mix, to consumer; 1500 t payload capacity
EF 270 km by ship (barge)
Article production
Injection moulding Injection moulding plastic injection moulding production mix, at plant for PP, HDPE and PE [EU-28+EFTA] [LCI result]
EF 30 g of waste per kg of product
Incineration of process losses EU-28 Polylactic acid (PLA) in waste incineration plant
EF
Transport Transport from factory to final client
Articulated lorry transport, Euro 4, Total weight >32 t (without fuel); diesel driven, Euro 4, cargo; consumption mix, to consumer; more than 32t gross weight / 24,7 t payload capacity
EF
From factory to retail: 1200 km by truck (>32 t, EURO 4), case-specific utilisation ratio
Passenger car, average; technology mix, gasoline and diesel driven, Euro 3-5, passenger car; consumption mix, to consumer; engine size from 1,4l up to >2
EF
From retail to final client (62%): 5 km, by passenger car (average), case-specific allocation
Articulated lorry transport, Euro 3, Total weight <7.5 t (without fuel); diesel driven, Euro 3, cargo; consumption mix, to consumer; up to 7,5t gross weight / 3,3t payload capacity
EF
From retail to final client (5%): 5 km round trip, by van (lorry <7.5t, EURO 3 with utilisation ratio of 20%)
EoL Recycling (56%)
Recycling of polypropylene (PP) plastic ; from post-consumer waste, via washing, granulation, pelletization; production mix, at plant; 90% recycling rate
EF
R2*(1-A) Erecycling,eol; R2 = 56%, A = 0.5
Reuse (41%) No dataset applicable; only relevant for credits of Not applicable R2*(1-A) Erecycling,eol; R2 = 41%, A = 0.5
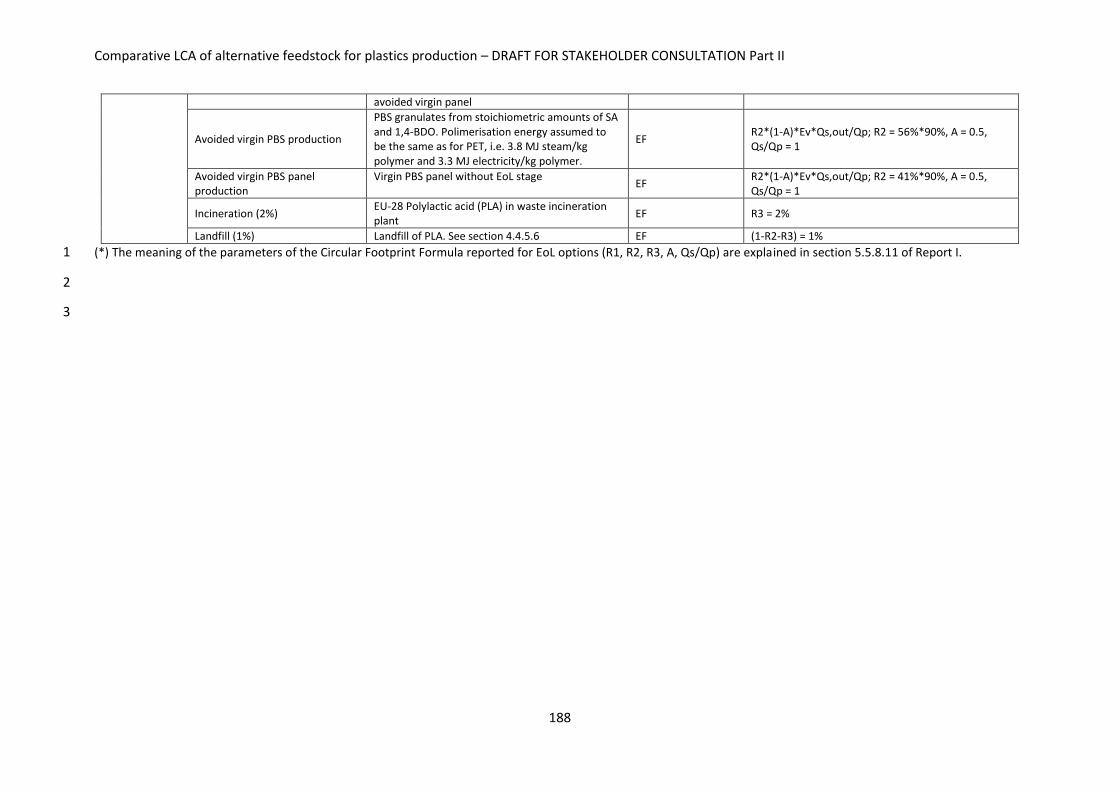
Comparative LCA of alternative feedstock for plastics production – DRAFT FOR STAKEHOLDER CONSULTATION Part II
188
avoided virgin panel
Avoided virgin PBS production
PBS granulates from stoichiometric amounts of SA and 1,4-BDO. Polimerisation energy assumed to be the same as for PET, i.e. 3.8 MJ steam/kg polymer and 3.3 MJ electricity/kg polymer.
EF R2*(1-A)*Ev*Qs,out/Qp; R2 = 56%*90%, A = 0.5, Qs/Qp = 1
Avoided virgin PBS panel production
Virgin PBS panel without EoL stage EF
R2*(1-A)*Ev*Qs,out/Qp; R2 = 41%*90%, A = 0.5, Qs/Qp = 1
Incineration (2%) EU-28 Polylactic acid (PLA) in waste incineration plant
EF R3 = 2%
Landfill (1%) Landfill of PLA. See section 4.4.5.6 EF (1-R2-R3) = 1%
(*) The meaning of the parameters of the Circular Footprint Formula reported for EoL options (R1, R2, R3, A, Qs/Qp) are explained in section 5.5.8.11 of Report I. 1
2
3

Comparative LCA of alternative feedstock for plastics production – DRAFT FOR STAKEHOLDER CONSULTATION Part II
189
Table 52: List of processes included in the LCI model of recycled PP (Scenario 4) 1
Life cycle stage
Process Dataset Compliance scheme or source
Comments*
Polymer production
Secondary PP production (recycling)
Plastic granulate secondary (low metal contamination) from post-consumer plastic waste, via grinding, metal separation, washing, pelletization, plastic waste with low metal fraction
EF R1*A*Erecycled; R1 = 100%; A = 0.5
Transport Transport to production site (from supplier to factory)
Articulated lorry transport, Euro 4, Total weight >32 t (without fuel); diesel driven, Euro 4, cargo; consumption mix, to consumer; more than 32t gross weight / 24,7t payload capacity
EF 130 km by truck (>32 t, EURO 4), case-specific utilisation ratio
Freight train, average (without fuel); technology mix, electricity and diesel driven, cargo; consumption mix, to consumer; average train, gross tonne weight 1000t / 726t payload capacity
EF 240 km by train (average freight train)
Barge; technology mix, diesel driven, cargo; consumption mix, to consumer; 1500 t payload capacity
EF 270 km by ship (barge)
Article production
Injection moulding Injection moulding plastic injection moulding production mix, at plant for PP, HDPE and PE [EU-28+EFTA] [LCI result]
EF 30 g of waste per kg of product.
Incineration of process losses
Polypropylene (PP) in waste incineration plant, waste-to-energy plant with dry flue gas treatment, without collection, transport and pre-treatment, EU-28
EF
Transport Transport from factory to final client
Articulated lorry transport, Euro 4, Total weight >32 t (without fuel); diesel driven, Euro 4, cargo; consumption mix, to consumer; more than 32t gross weight / 24,7 t payload capacity
EF From factory to retail: 1200 km by truck (>32 t, EURO 4), case-specific utilisation ratio
Passenger car, average; technology mix, gasoline and diesel driven, Euro 3-5, passenger car; consumption mix, to consumer; engine size from 1,4l up to >2
EF From retail to final client (62%): 5 km, by passenger car (average), case-specific allocation
Articulated lorry transport, Euro 3, Total weight <7.5 t (without fuel); diesel driven, Euro 3, cargo; consumption mix, to consumer; up to 7,5t gross weight / 3,3t payload capacity
EF From retail to final client (5%): 5 km round trip, by van (lorry <7.5t, EURO 3 with utilisation ratio of 20%)
EoL
Recycling (56%) Recycling of polypropylene (PP) plastic ; from post-consumer waste, via washing, granulation, pelletization; production mix, at plant; 90% recycling rate
EF R2*(1-A) Erecycling,eol; R2 = 56%, A = 0.5
Reuse (41%) No dataset applicable; only relevant for credits of avoided virgin panel Not applicable R2*(1-A) Erecycling,eol; R2 = 41%, A = 0.5
Avoided virgin PP production
PP granulates, polymerisation of propene, production mix, at plant, EU-28+EFTA
EF R2*(1-A)*Ev*Qs,out/Qp; R2 = 56%*90%, A = 0.5, Qs/Qp = 1
Avoided virgin PP panel production
Virgin PP panel without EoL stage EF
R2*(1-A)*Ev*Qs,out/Qp; R2 = 41%*90%, A = 0.5, Qs/Qp = 1
Incineration (2%) Polypropylene (PP) in waste incineration plant, waste-to-energy plant with dry flue gas treatment, without collection, transport and pre-treatment, EU-28
EF R3 = 2%
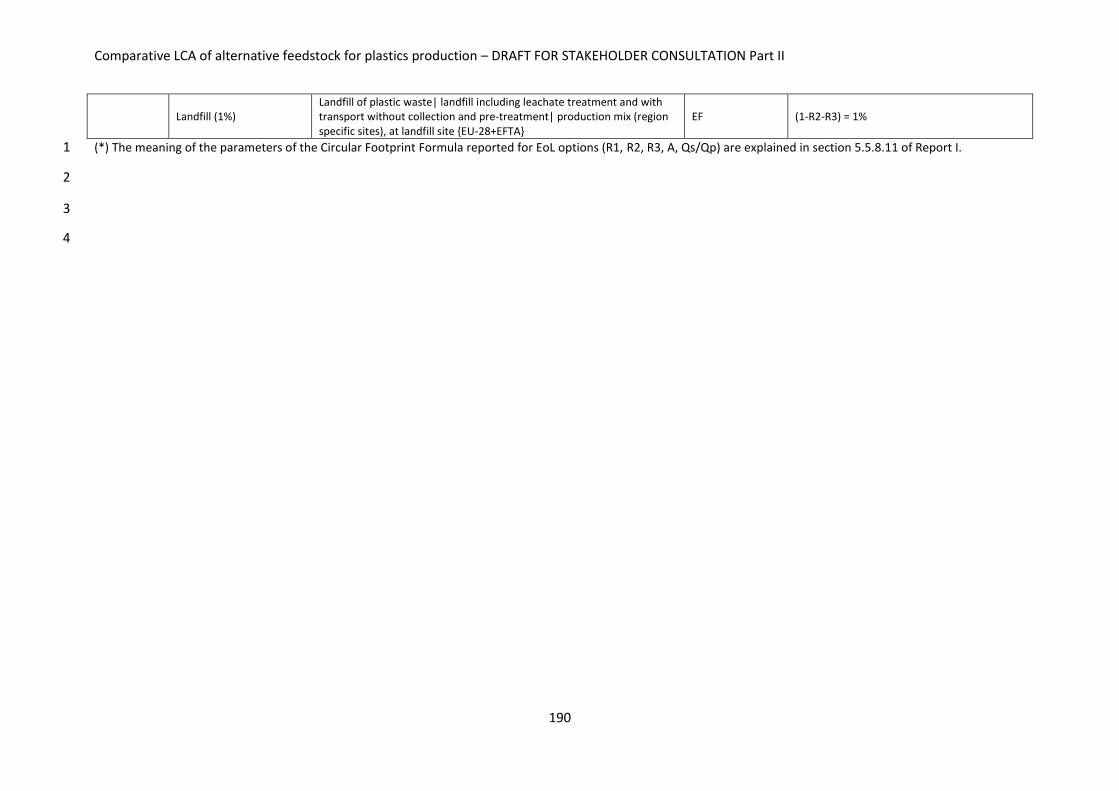
Comparative LCA of alternative feedstock for plastics production – DRAFT FOR STAKEHOLDER CONSULTATION Part II
190
Landfill (1%) Landfill of plastic waste| landfill including leachate treatment and with transport without collection and pre-treatment| production mix (region specific sites), at landfill site {EU-28+EFTA}
EF (1-R2-R3) = 1%
(*) The meaning of the parameters of the Circular Footprint Formula reported for EoL options (R1, R2, R3, A, Qs/Qp) are explained in section 5.5.8.11 of Report I. 1
2
3
4
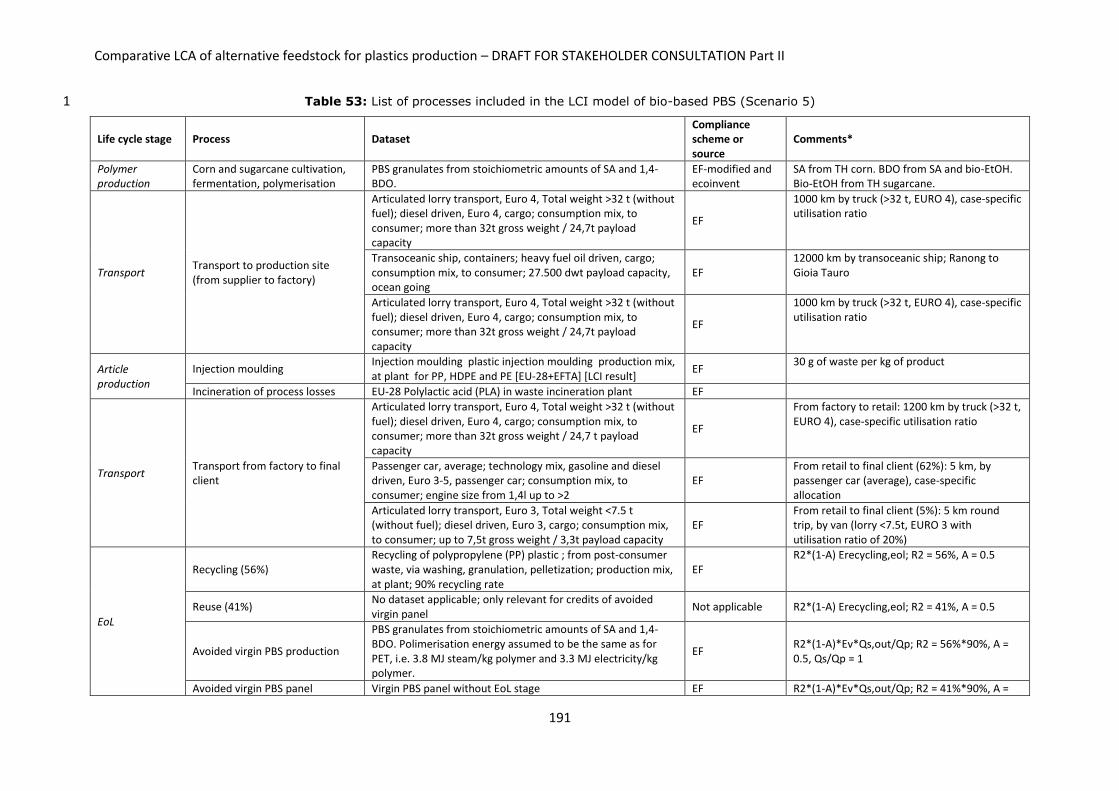
Comparative LCA of alternative feedstock for plastics production – DRAFT FOR STAKEHOLDER CONSULTATION Part II
191
Table 53: List of processes included in the LCI model of bio-based PBS (Scenario 5) 1
Life cycle stage Process Dataset Compliance scheme or source
Comments*
Polymer production
Corn and sugarcane cultivation, fermentation, polymerisation
PBS granulates from stoichiometric amounts of SA and 1,4-BDO.
EF-modified and ecoinvent
SA from TH corn. BDO from SA and bio-EtOH. Bio-EtOH from TH sugarcane.
Transport Transport to production site (from supplier to factory)
Articulated lorry transport, Euro 4, Total weight >32 t (without fuel); diesel driven, Euro 4, cargo; consumption mix, to consumer; more than 32t gross weight / 24,7t payload capacity
EF
1000 km by truck (>32 t, EURO 4), case-specific utilisation ratio
Transoceanic ship, containers; heavy fuel oil driven, cargo; consumption mix, to consumer; 27.500 dwt payload capacity, ocean going
EF 12000 km by transoceanic ship; Ranong to Gioia Tauro
Articulated lorry transport, Euro 4, Total weight >32 t (without fuel); diesel driven, Euro 4, cargo; consumption mix, to consumer; more than 32t gross weight / 24,7t payload capacity
EF
1000 km by truck (>32 t, EURO 4), case-specific utilisation ratio
Article production
Injection moulding Injection moulding plastic injection moulding production mix, at plant for PP, HDPE and PE [EU-28+EFTA] [LCI result]
EF 30 g of waste per kg of product
Incineration of process losses EU-28 Polylactic acid (PLA) in waste incineration plant EF
Transport Transport from factory to final client
Articulated lorry transport, Euro 4, Total weight >32 t (without fuel); diesel driven, Euro 4, cargo; consumption mix, to consumer; more than 32t gross weight / 24,7 t payload capacity
EF
From factory to retail: 1200 km by truck (>32 t, EURO 4), case-specific utilisation ratio
Passenger car, average; technology mix, gasoline and diesel driven, Euro 3-5, passenger car; consumption mix, to consumer; engine size from 1,4l up to >2
EF From retail to final client (62%): 5 km, by passenger car (average), case-specific allocation
Articulated lorry transport, Euro 3, Total weight <7.5 t (without fuel); diesel driven, Euro 3, cargo; consumption mix, to consumer; up to 7,5t gross weight / 3,3t payload capacity
EF From retail to final client (5%): 5 km round trip, by van (lorry <7.5t, EURO 3 with utilisation ratio of 20%)
EoL
Recycling (56%) Recycling of polypropylene (PP) plastic ; from post-consumer waste, via washing, granulation, pelletization; production mix, at plant; 90% recycling rate
EF R2*(1-A) Erecycling,eol; R2 = 56%, A = 0.5
Reuse (41%) No dataset applicable; only relevant for credits of avoided virgin panel
Not applicable R2*(1-A) Erecycling,eol; R2 = 41%, A = 0.5
Avoided virgin PBS production
PBS granulates from stoichiometric amounts of SA and 1,4-BDO. Polimerisation energy assumed to be the same as for PET, i.e. 3.8 MJ steam/kg polymer and 3.3 MJ electricity/kg polymer.
EF R2*(1-A)*Ev*Qs,out/Qp; R2 = 56%*90%, A = 0.5, Qs/Qp = 1
Avoided virgin PBS panel Virgin PBS panel without EoL stage EF R2*(1-A)*Ev*Qs,out/Qp; R2 = 41%*90%, A =

Comparative LCA of alternative feedstock for plastics production – DRAFT FOR STAKEHOLDER CONSULTATION Part II
192
production 0.5, Qs/Qp = 1
Incineration (2%) EU-28 Polylactic acid (PLA) in waste incineration plant EF R3 = 2%
Landfill (1%) Landfill of PLA. See section 4.4.5.6 EF (1-R2-R3) = 1%
(*) The meaning of the parameters of the Circular Footprint Formula reported for EoL options (R1, R2, R3, A, Qs/Qp) are explained in section 5.5.8.11 of Report I. 1
2
3

Comparative LCA of alternative feedstock for plastics production – DRAFT FOR STAKEHOLDER CONSULTATION Part II
193
Table 54: List of processes included in the LCI model of PLA (Scenario 6) 1
Life cycle stage
Process Dataset Compliance scheme or source
Comments*
Polymer production
Corn cultivation & wet milling, lactic acid production (dextrose fermentation), lactide formation, polymerisation
US Ingeo Polylactide (PLA) biopolymer production TS
Transport Transport to production site (from supplier to factory)
Articulated lorry transport, Euro 4, Total weight >32 t (without fuel); diesel driven, Euro 4, cargo; consumption mix, to consumer; more than 32t gross weight / 24,7t payload capacity
EF
1000 km by truck (>32 t, EURO 4), case-specific utilisation ratio
Transoceanic ship, containers; heavy fuel oil driven, cargo; consumption mix, to consumer; 27.500 dwt payload capacity, ocean going
EF 6000 km by transoceanic ship; New York to Rotterdam
Articulated lorry transport, Euro 4, Total weight >32 t (without fuel); diesel driven, Euro 4, cargo; consumption mix, to consumer; more than 32t gross weight / 24,7t payload capacity
EF
1000 km by truck (>32 t, EURO 4), case-specific utilisation ratio
Article production
Injection moulding Injection moulding plastic injection moulding production mix, at plant for PP, HDPE and PE [EU-28+EFTA] [LCI result]
EF 30 g of waste per kg of product
Incineration of process losses EU-28 Polylactic acid (PLA) in waste incineration plant EF
Transport Transport from factory to final client
Articulated lorry transport, Euro 4, Total weight >32 t (without fuel); diesel driven, Euro 4, cargo; consumption mix, to consumer; more than 32t gross weight / 24,7 t payload capacity
EF
From factory to retail: 1200 km by truck (>32 t, EURO 4), case-specific utilisation ratio
Passenger car, average; technology mix, gasoline and diesel driven, Euro 3-5, passenger car; consumption mix, to consumer; engine size from 1,4l up to >2
EF From retail to final client (62%): 5 km, by passenger car (average), case-specific allocation
Articulated lorry transport, Euro 3, Total weight <7.5 t (without fuel); diesel driven, Euro 3, cargo; consumption mix, to consumer; up to 7,5t gross weight / 3,3t payload capacity
EF From retail to final client (5%): 5 km round trip, by van (lorry <7.5t, EURO 3 with utilisation ratio of 20%)
EoL
Recycling (56%) Recycling of polypropylene (PP) plastic ; from post-consumer waste, via washing, granulation, pelletization; production mix, at plant; 90% recycling rate
EF R2*(1-A) Erecycling,eol; R2 = 56%, A = 0.5
Reuse (41%) No dataset applicable; only relevant for credits of avoided virgin panel
Not applicable R2*(1-A) Erecycling,eol; R2 = 41%, A = 0.5
Avoided virgin PBS production US Ingeo Polylactide (PLA) biopolymer production
EF R2*(1-A)*Ev*Qs,out/Qp; R2 = 56%*90%, A = 0.5, Qs/Qp = 1
Avoided virgin PBS panel production Virgin PP panel without EoL stage
EF R2*(1-A)*Ev*Qs,out/Qp; R2 = 41%*90%, A = 0.5, Qs/Qp = 1

Comparative LCA of alternative feedstock for plastics production – DRAFT FOR STAKEHOLDER CONSULTATION Part II
194
Incineration (2%) EU-28 Polylactic acid (PLA) in waste incineration plant EF R3 = 2%
Landfill (1%) Landfill of PLA. See section 4.4.5.6 EF (1-R2-R3) = 1%
(*) The meaning of the parameters of the Circular Footprint Formula reported for EoL options (R1, R2, R3, A, Qs/Qp) are explained in section 5.5.8.11 of Report I.1
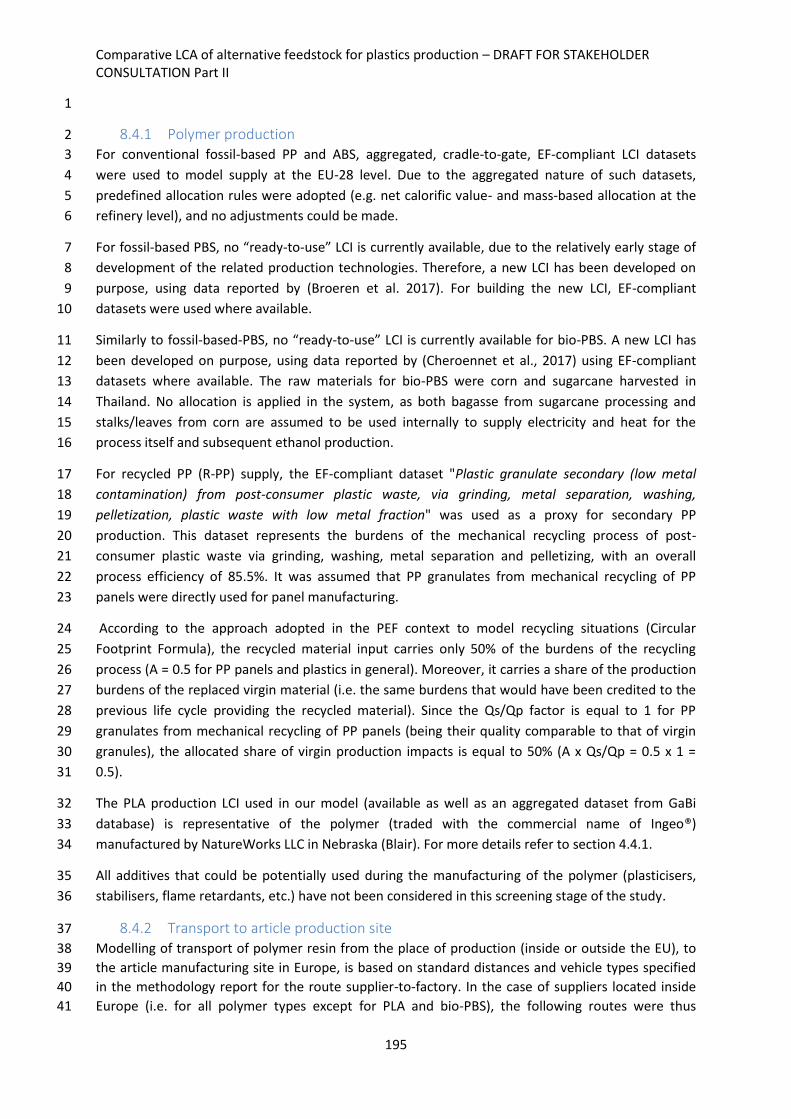
Comparative LCA of alternative feedstock for plastics production – DRAFT FOR STAKEHOLDER CONSULTATION Part II
195
1
8.4.1 Polymer production 2
For conventional fossil-based PP and ABS, aggregated, cradle-to-gate, EF-compliant LCI datasets 3
were used to model supply at the EU-28 level. Due to the aggregated nature of such datasets, 4
predefined allocation rules were adopted (e.g. net calorific value- and mass-based allocation at the 5
refinery level), and no adjustments could be made. 6
For fossil-based PBS, no “ready-to-use” LCI is currently available, due to the relatively early stage of 7
development of the related production technologies. Therefore, a new LCI has been developed on 8
purpose, using data reported by (Broeren et al. 2017). For building the new LCI, EF-compliant 9
datasets were used where available. 10
Similarly to fossil-based-PBS, no “ready-to-use” LCI is currently available for bio-PBS. A new LCI has 11
been developed on purpose, using data reported by (Cheroennet et al., 2017) using EF-compliant 12
datasets where available. The raw materials for bio-PBS were corn and sugarcane harvested in 13
Thailand. No allocation is applied in the system, as both bagasse from sugarcane processing and 14
stalks/leaves from corn are assumed to be used internally to supply electricity and heat for the 15
process itself and subsequent ethanol production. 16
For recycled PP (R-PP) supply, the EF-compliant dataset "Plastic granulate secondary (low metal 17
contamination) from post-consumer plastic waste, via grinding, metal separation, washing, 18
pelletization, plastic waste with low metal fraction" was used as a proxy for secondary PP 19
production. This dataset represents the burdens of the mechanical recycling process of post-20
consumer plastic waste via grinding, washing, metal separation and pelletizing, with an overall 21
process efficiency of 85.5%. It was assumed that PP granulates from mechanical recycling of PP 22
panels were directly used for panel manufacturing. 23
According to the approach adopted in the PEF context to model recycling situations (Circular 24
Footprint Formula), the recycled material input carries only 50% of the burdens of the recycling 25
process (A = 0.5 for PP panels and plastics in general). Moreover, it carries a share of the production 26
burdens of the replaced virgin material (i.e. the same burdens that would have been credited to the 27
previous life cycle providing the recycled material). Since the Qs/Qp factor is equal to 1 for PP 28
granulates from mechanical recycling of PP panels (being their quality comparable to that of virgin 29
granules), the allocated share of virgin production impacts is equal to 50% (A x Qs/Qp = 0.5 x 1 = 30
0.5). 31
The PLA production LCI used in our model (available as well as an aggregated dataset from GaBi 32
database) is representative of the polymer (traded with the commercial name of Ingeo®) 33
manufactured by NatureWorks LLC in Nebraska (Blair). For more details refer to section 4.4.1. 34
All additives that could be potentially used during the manufacturing of the polymer (plasticisers, 35
stabilisers, flame retardants, etc.) have not been considered in this screening stage of the study. 36
8.4.2 Transport to article production site 37
Modelling of transport of polymer resin from the place of production (inside or outside the EU), to 38
the article manufacturing site in Europe, is based on standard distances and vehicle types specified 39
in the methodology report for the route supplier-to-factory. In the case of suppliers located inside 40
Europe (i.e. for all polymer types except for PLA and bio-PBS), the following routes were thus 41

Comparative LCA of alternative feedstock for plastics production – DRAFT FOR STAKEHOLDER CONSULTATION Part II
196
considered: (i) 130 km by articulated lorry (total weight >32 t; Euro 4); (ii) 240 km by train (average 1
freight); and (iii) 270 km by ship (barge, technology mix). For PLA (manufactured in the US), a 2
transoceanic transport along a distance of 6000 km (New York-Rotterdam) was considered, in 3
combination with road transport to and from the harbour in both the exporting and importing 4
country (i.e. the EU). Road transport is made by lorry (total weight >32 t; Euro 4) along a distance of 5
1000 km. For bio-PBS (manufactured in Thailand), a transoceanic transport along a distance of 12000 6
km (Ranong-Gioia Tauro) was considered, in combination with road transport to and from the 7
harbour in both the exporting and importing country (i.e. the EU). LCIs for all types of vehicles are 8
available as EF-compliant datasets, which were used in the modelling. 9
8.4.3 Article production 10
Regardless of the feedstock used, production of automotive interior panels normally takes place via 11
injection moulding of melted plastic granules. The burdens of the injection moulding process of all 12
polymer material granulates into door panels were modelled through the aggregated, EF-compliant 13
dataset Injection moulding, plastic injection moulding, production mix, at plant [EU-28+EFTA]], 14
which accounts for 3% polymer losses during the process. The burdens of the respective disposal 15
process were additionally included in the model, assuming that they are entirely sent to incineration 16
(for further details about the modelling of this process, see the next section on EoL modelling). 17
8.4.4 Transport to final client 18
The transport of the article from the production site to the final client was modelled assuming the 19
route factory -> retail -> final client specified in the methodology document (Report I), and 20
considering the corresponding default transport scenario. The following routes were thus 21
considered: (i) 1200 km by articulated lorry (total weight >32 t; Euro 4) from factory to retailers; (ii) 5 22
km by passenger car for 62% of the roundtrips from retailers to final clients; (iii) 5 km by van for 5% 23
of the roundtrips from retailers to final clients; and (iv) no burdens assigned to 33% of the roundtrips 24
from retailers to final clients (assumed to take place with no motorised vehicles). LCIs for all types of 25
vehicles are available as EF-compliant datasets, which were used in the modelling. 26
8.4.5 End of Life 27
8.4.5.1 Definition of EoL scenarios 28
Regardless of the type of feedstock, the average EoL scenario of automotive car panels was assumed 29
to include 56% recycling after separate collection, 41% reuse, 2% incineration and 1% landfilling. 30
These rates are based on average EU-28 data for EOL vehicles (large plastic components) as reported 31
by EUROSTAT (2018). The recycling process was credited with virgin polymer granulates, while the 32
reuse process was credited with virgin polymer panel (without EoL). 33
In order to evaluate the burdens of each EoL option, namely landfill, incineration, recycling, 34
composting and anaerobic digestion (AD), additional scenarios were modelled considering 100% of 35
the waste flow sent to either one of the aforementioned EoL options. This allows direct comparison 36
of the different waste treatment technologies for EoL of automotive interior panels. 37
8.4.5.2 Modelling of recycling 38
In all scenarios, mechanical recycling of panels were modelled with the same aggregated, EF-39
compliant dataset (Recycling of polypropylene (PP) plastic | from post-consumer waste, via washing, 40
granulation, pelletization | production mix, at plant | 90% recycling rate). The dataset specifically 41
refers to PP recycling, but it can be reasonably assumed to be representative of all plastic recycling 42
processes, as these are usually based on similar combinations of the same unit operations (e.g. 43

Comparative LCA of alternative feedstock for plastics production – DRAFT FOR STAKEHOLDER CONSULTATION Part II
197
grinding/shredding, washing/flotation and granulation). The overall recycling efficiency is set to 90% 1
of the input material, with the rejects being sent to landfilling. 2
The recycled material output is assumed to replace the corresponding virgin polymer, whose 3
primary production burdens are credited to the system. Exceptions are recycled PLA, PBS and Bio-4
PBS, which were both assumed to replace the corresponding conventional polymer (i.e. virgin PP) in 5
a short term perspective. 6
Finally, according to the approach adopted in the PEF context to model recycling situations (Circular 7
Footprint Formula), only 50% of the burdens of the EoL recycling process are allocated to the system 8
(A = 0.5 for automotive car panels and plastics in general). Similarly, only 50% of the benefits from 9
avoided virgin material production are assigned to the system itself. 10
8.4.5.3 Modelling of composting 11
For PLA composting please refer to Section 4.4.5.3 for modelling details. The same modelling 12
approach was followed for composting of PBS and Bio-PBS, which can also be biodegradable under 13
the European Standard EN 13432, depending on the polymer grade. Although PLA and PBS/Bio-PBS 14
do not have identical compositions, the composition of PBS/Bio-PBS are considered to be close 15
enough to PLA to allow the approximation, as shown in Table 55. 16
Table 55: PBS/Bio-PBS composition considered for the modelling of a waste-specific industrial 17 composting inventory 18
Element %
TS 99.9
Water 0.1
VS (%TS) 100
Ash (%TS) 0
Cbiogenic (%TS) 55.8
H (%TS) 7.0
O (%TS) 37.2
LHV (MJ/kg TS)14 18.7
19
8.4.5.4 Modelling of anaerobic digestion 20
Similarly to composting, for PLA anaerobic digestion please refer to Section 4.4.5.4 for modelling 21
details. Once again, the approach followed to model the anaerobic digestion of PLA was also used to 22
model the anaerobic digestion of PBS/Bio-PBS, due to the very similar compositions of PLA and PBS 23
and biodegradability under the European Standard EN 13432 24
8.4.5.5 Modelling of incineration 25
For the incineration process of conventional (fossil-based) plastics, aggregated, material-specific, EF-26
compliant LCI datasets are available and were used in the modelling. Similarly, for PLA, partially 27
aggregated material-specific LCIs from GaBi database were applied. See section 4.4.5.5 for details on 28
the modelling of recovered heat and electricity from the incineration process. 29
For PBS and Bio-PBS, no ready-to-use incineration datasets were available to have a fully consistent 30
modelling. A disaggregated, material-specific inventory was thus purposefully developed, based on 31
14 Due to limitations in data availability from manufacturers, the LHV of PBS/Bio-PBS was considered the same as PLA.
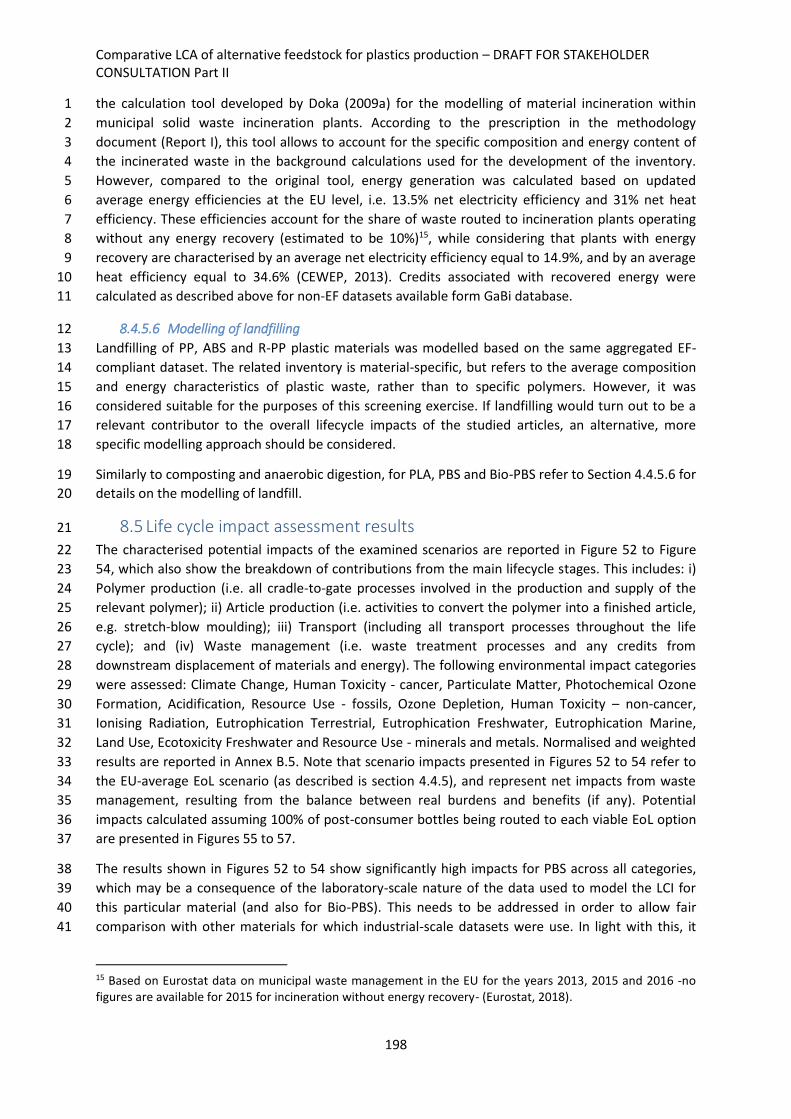
Comparative LCA of alternative feedstock for plastics production – DRAFT FOR STAKEHOLDER CONSULTATION Part II
198
the calculation tool developed by Doka (2009a) for the modelling of material incineration within 1
municipal solid waste incineration plants. According to the prescription in the methodology 2
document (Report I), this tool allows to account for the specific composition and energy content of 3
the incinerated waste in the background calculations used for the development of the inventory. 4
However, compared to the original tool, energy generation was calculated based on updated 5
average energy efficiencies at the EU level, i.e. 13.5% net electricity efficiency and 31% net heat 6
efficiency. These efficiencies account for the share of waste routed to incineration plants operating 7
without any energy recovery (estimated to be 10%)15, while considering that plants with energy 8
recovery are characterised by an average net electricity efficiency equal to 14.9%, and by an average 9
heat efficiency equal to 34.6% (CEWEP, 2013). Credits associated with recovered energy were 10
calculated as described above for non-EF datasets available form GaBi database. 11
8.4.5.6 Modelling of landfilling 12
Landfilling of PP, ABS and R-PP plastic materials was modelled based on the same aggregated EF-13
compliant dataset. The related inventory is material-specific, but refers to the average composition 14
and energy characteristics of plastic waste, rather than to specific polymers. However, it was 15
considered suitable for the purposes of this screening exercise. If landfilling would turn out to be a 16
relevant contributor to the overall lifecycle impacts of the studied articles, an alternative, more 17
specific modelling approach should be considered. 18
Similarly to composting and anaerobic digestion, for PLA, PBS and Bio-PBS refer to Section 4.4.5.6 for 19
details on the modelling of landfill. 20
8.5 Life cycle impact assessment results 21
The characterised potential impacts of the examined scenarios are reported in Figure 52 to Figure 22
54, which also show the breakdown of contributions from the main lifecycle stages. This includes: i) 23
Polymer production (i.e. all cradle-to-gate processes involved in the production and supply of the 24
relevant polymer); ii) Article production (i.e. activities to convert the polymer into a finished article, 25
e.g. stretch-blow moulding); iii) Transport (including all transport processes throughout the life 26
cycle); and (iv) Waste management (i.e. waste treatment processes and any credits from 27
downstream displacement of materials and energy). The following environmental impact categories 28
were assessed: Climate Change, Human Toxicity - cancer, Particulate Matter, Photochemical Ozone 29
Formation, Acidification, Resource Use - fossils, Ozone Depletion, Human Toxicity – non-cancer, 30
Ionising Radiation, Eutrophication Terrestrial, Eutrophication Freshwater, Eutrophication Marine, 31
Land Use, Ecotoxicity Freshwater and Resource Use - minerals and metals. Normalised and weighted 32
results are reported in Annex B.5. Note that scenario impacts presented in Figures 52 to 54 refer to 33
the EU-average EoL scenario (as described is section 4.4.5), and represent net impacts from waste 34
management, resulting from the balance between real burdens and benefits (if any). Potential 35
impacts calculated assuming 100% of post-consumer bottles being routed to each viable EoL option 36
are presented in Figures 55 to 57. 37
The results shown in Figures 52 to 54 show significantly high impacts for PBS across all categories, 38
which may be a consequence of the laboratory-scale nature of the data used to model the LCI for 39
this particular material (and also for Bio-PBS). This needs to be addressed in order to allow fair 40
comparison with other materials for which industrial-scale datasets were use. In light with this, it 41
15 Based on Eurostat data on municipal waste management in the EU for the years 2013, 2015 and 2016 -no figures are available for 2015 for incineration without energy recovery- (Eurostat, 2018).

Comparative LCA of alternative feedstock for plastics production – DRAFT FOR STAKEHOLDER CONSULTATION Part II
199
becomes clear that real data from manufacturing facilities of PBS and Bio-PBS are needed. In any 1
case, using data from laboratory-scale manufacturing of PBS, the high impacts were a result of the 2
succinic acid and and 1,4-butanediol used in the manufacturing of PBS. In turn, maleic anhydride, 3
which is used in succinic acid production seems to be responsible for the high impacts of the latter. 4
Overall, the results obtained for all scenarios across all impact categories seem reasonable. An 5
exception to this would be the category of Water use, for which all materials show no impact or in 6
fact negative impact (PBS). This may be a consequence of a partly inconsistent mapping of flows 7
from imported datasets and/or impact assessment methods. To solve this issue, a full review of all 8
flows contributing towards water use will be carried out in order to identify those flows that are 9
missing or incorrectly imported. Refer to section 10 for further comments. 10
The contribution of indirect land use change emissions (iLUC) to the total Climate Change potential is 11
moderate in all bio-based products considered in this study, i.e Bio-PBS and PLA, amounting to 13% 12
and 4% of the total climate change potential respectively (EU-average EoL). 13
14

Comparative LCA of alternative feedstock for plastics production – DRAFT FOR STAKEHOLDER CONSULTATION Part II
200
1
Figure 52: Potential impact of automotive interior panel LCA scenarios for the categories of Climate Change, Ozone Depletion, Human Toxicity –cancer, 2 Human Toxicity – non-cancer, Particulate Matter and Ionising Radiation. 3

Comparative LCA of alternative feedstock for plastics production – DRAFT FOR STAKEHOLDER CONSULTATION Part II
201
1
Figure 53: Potential impact of automotive interior panel LCA scenarios for the categories of Photochemical Ozone Formation, Acidification, Eutrophication 2 Terrestrial, Eutrophication Freshwater, Eutrophication Marine and Ecotoxicity Freshwater. 3
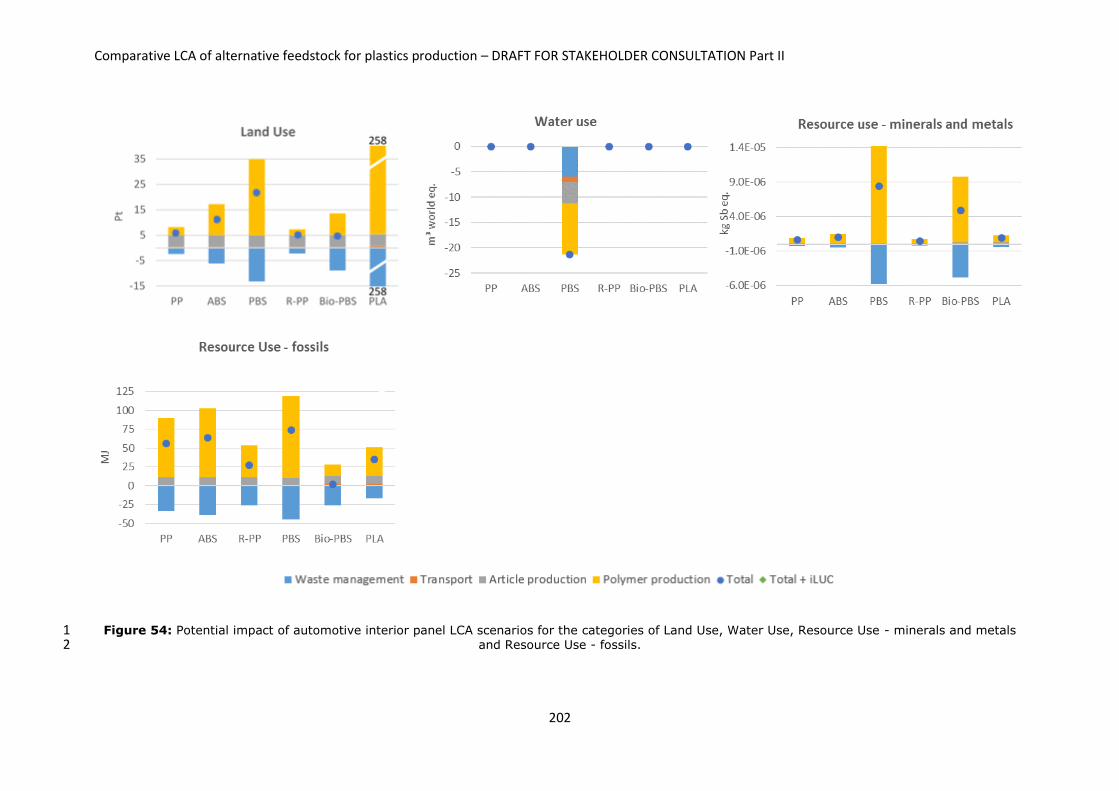
Comparative LCA of alternative feedstock for plastics production – DRAFT FOR STAKEHOLDER CONSULTATION Part II
202
Figure 54: Potential impact of automotive interior panel LCA scenarios for the categories of Land Use, Water Use, Resource Use - minerals and metals 1 and Resource Use - fossils. 2
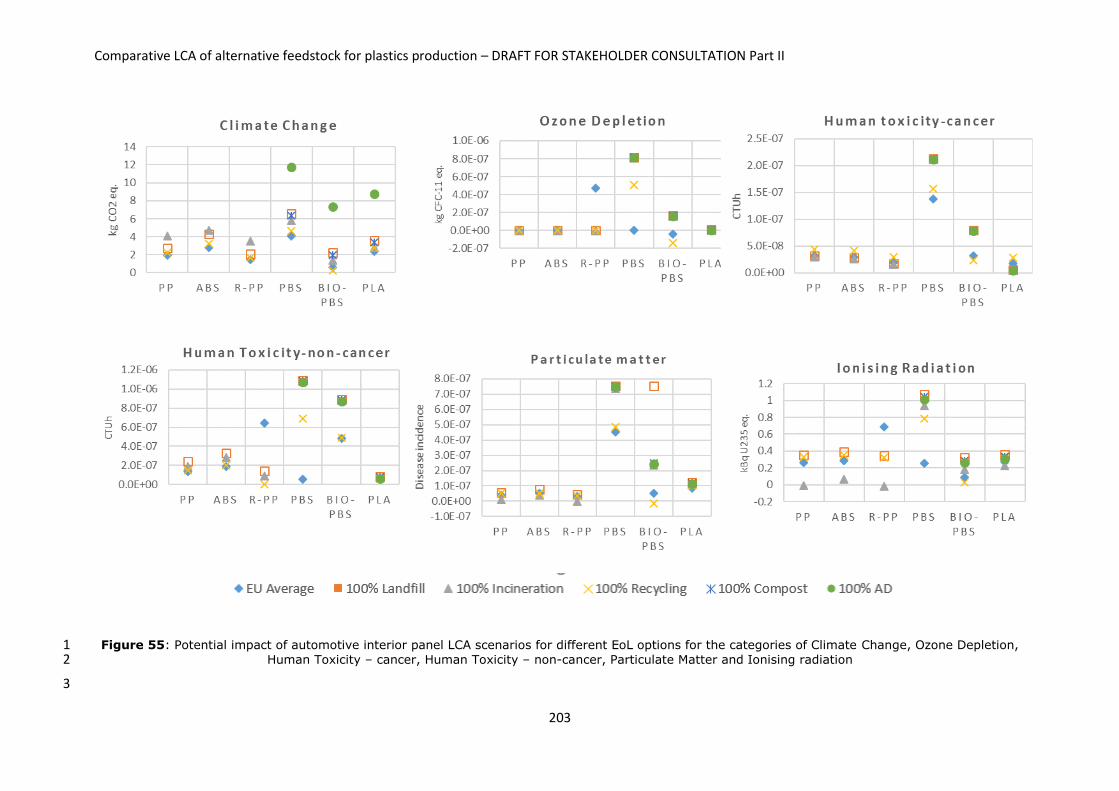
Comparative LCA of alternative feedstock for plastics production – DRAFT FOR STAKEHOLDER CONSULTATION Part II
203
Figure 55: Potential impact of automotive interior panel LCA scenarios for different EoL options for the categories of Climate Change, Ozone Depletion, 1 Human Toxicity – cancer, Human Toxicity – non-cancer, Particulate Matter and Ionising radiation 2
3

Comparative LCA of alternative feedstock for plastics production – DRAFT FOR STAKEHOLDER CONSULTATION Part II
204
Figure 56: Potential impact of automotive interior panel LCA scenarios for different EoL options, for the categories of Photochemical Ozone Formation, 1 acidification, Eutrophication Terrestrial, Eutrophication Freshwater, Eutrophication Marine and Ecotoxicity Freshwater. 2
3

Comparative LCA of alternative feedstock for plastics production – DRAFT FOR STAKEHOLDER CONSULTATION Part II
205
Figure 57: Potential impact of automotive interior panel LCA scenarios for different EoL options for the categories of Land Use, Water Use, Resource Use 1 - minerals and metals and Resource use - fossils2
Comparative LCA of alternative feedstock for plastics production – DRAFT FOR STAKEHOLDER CONSULTATION Part II
206
1
8.6 Interpretation 2
In the interpretation of case study results, scenario impacts calculated for both the EU-average EoL 3
scenario and the individual EoL options are firstly compared (8.6.1). Most relevant impact categories 4
and lifecycle stages are then identified (8.6.1.1 and 8.6.1.2, respectively). Finally, the main learnings 5
from applying the draft methodology are discussed (8.6.2). Identification of most relevant processes 6
was not undertaken at this stage, as in the majority of scenarios the whole, cradle-to-gate process-7
chain involved in polymer production was modelled through a single, vertically aggregated dataset, 8
already representing the corresponding lifecycle stage. Therefore, no additional insights would be 9
gained with this exercise for such stage, which is expected to include a number of relevant lifecycle 10
processes. 11
8.6.1 Case study results 12
Focusing on the three fossil based-reference scenarios (PP, ABS and PBS panel), PP results in lower 13
impacts for all categories except freshwater eutrophication, ozone depletion and human toxicity-14
cancer. For the last two categories the results are very similar between PP and ABS. PBS results in 15
higher impacts across all categories. The reason for the overall better performance of PP is its lower 16
impacts associated with the production of the polymer granulate itself. Due to the better 17
environmental performance of PP panels, they will be used as the reference benchmark that needs 18
to be outperformed by the alternative. Furthermore, such alternative materials will be intended as a 19
replacement for PP. 20
Replacing fossil-based PP with 100% recycled PP in automotive interior panel manufacturing results 21
in environmental benefits across all categories, if we exclude freshwater eutrophication. This 22
exception is due to the higher impact from PP granulate supply, i.e. manufacturing of PP granulates. 23
Replacing fossil-based PBS with 100% bio-based PBS results in lower impacts across all categories 24
due to lower burdens from polymer production. However, replacing fossil PP with Bio-PBS results in 25
higher impacts for all categories except climate change, use of fossil resources and ionising radiation. 26
The reasons of this performance are the high environmental burdens resulting from transporting 27
Bio-PBS granulates from Thailand to Europe as well as the generally higher impacts from Bio-PBS 28
polymer production. 29
From the three alternative polymers (R-PP, Bio-PBS and PLA), R-PP generally results in lower overall 30
impacts. This is true for five out of six most relevant categories, including climate change. 31
When the current EU-average EoL scenario is considered, PLA panels do not show an advantage 32
compared to virgin, fossil-based PP for nine out of fifteen categories. PLA panels have higher impacts 33
than PP panels in four out of six of the most relevant categories including climate change, according 34
to normalisation. This is mainly due to the higher production and/or transport impacts of PLA 35
compared to PP (which was assumed to be manufactured in Europe, in contrast to US for PLA). 36
Because of the generally low contribution of the EoL stage to the overall scenario impacts, the above 37
picture does not substantially change by considering 100% of a specific EoL option rather than the 38
EU-average EoL scenario considered as a baseline (Figures 55 to 57). Comparing different EoL 39
options for a single material reveals that 100% anaerobic digestion and 100% landfill are among the 40
worse-performing options, while 100% recycling is often the best option. 41
The impacts of 100% AD as the EoL option for PBS, Bio-PBS and PLA are particularly high, especially 42
when they are compared with other EoL options for which higher impacts are expected, e.g. 100% 43

Comparative LCA of alternative feedstock for plastics production – DRAFT FOR STAKEHOLDER CONSULTATION Part II
207
landfill. After careful analysis of this issue, it was revealed that largely different results were 1
obtained for the 100% AD case when using EF as the impact assessment method and other methods, 2
e.g ReCiPe and CML 2001. This may be a consequence of a partly inconsistent mapping of flows from 3
imported datasets and/or impact assessment methods. The issue will be further investigated and 4
solved accordingly. 5
8.6.1.1 Identification of most relevant impact categories 6
7

Comparative LCA of alternative feedstock for plastics production – DRAFT FOR STAKEHOLDER CONSULTATION Part II
208
Table 56 shows the most relevant impact categories identified for each scenario based on 1
normalised and weighted impacts, according to the approach outlined in the methodology 2
document (Report I). Relevant categories were thus identified as those that cumulatively contribute 3
to at least 80% of the total normalised and weighted impact of the 16 considered impact categories. 4
Results for Water Use were not considered to be reliable (see Section 4.5), and were excluded from 5
the calculation of the ranking (adjusting default weighting factors accordingly). Climate Change and 6
Resource Use – fossils were identified as the two most relevant categories for all scenarios, except 7
for Bio-PBS. In this case, Human Toxicity - non-cancer, Human Toxicity - cancer and Climate Change 8
are the most relevant categories. The high toxicity-related impacts of Bio-PBS can be partly 9
explained by the high diesel usage during the corn cultivation stage in Thailand. As reported in Table 10
47, corn is used as the raw material for the manufacturing of succinic acid, which is a precursor for 11
Bio-PBS. The other precursor for Bio-PBS is 1,4-butanediol, which is in turn also manufactured from 12
succinic acid. 13
14
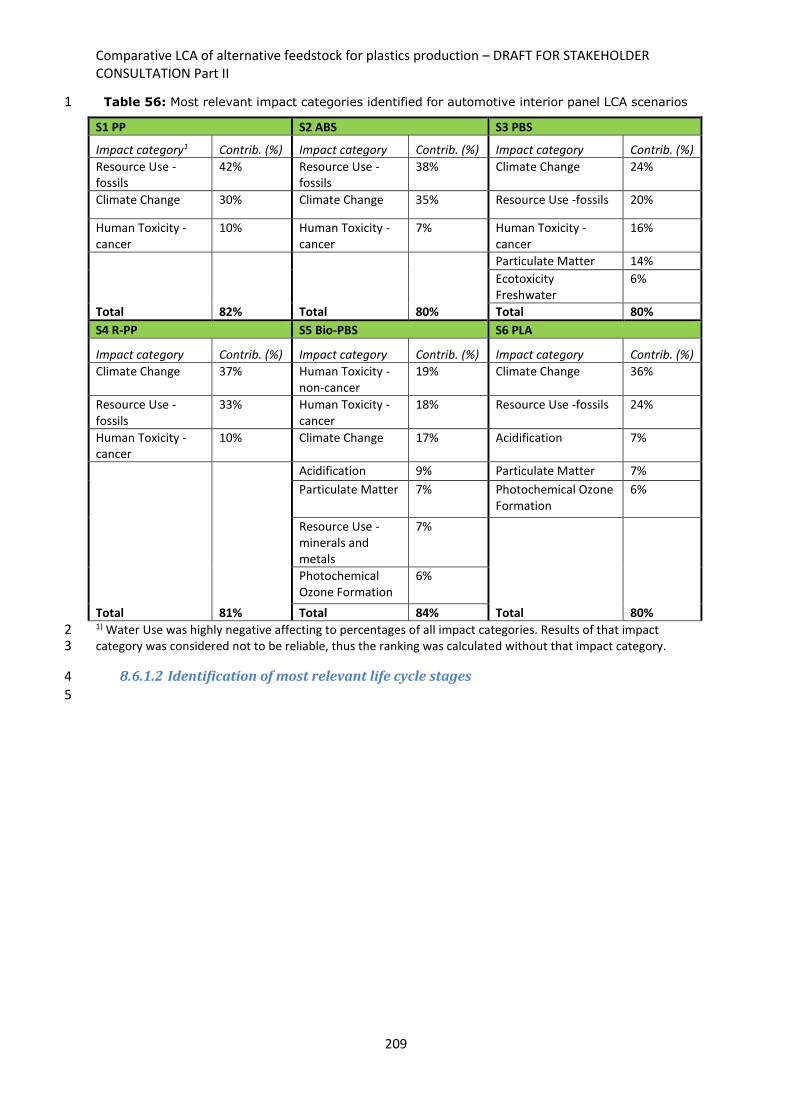
Comparative LCA of alternative feedstock for plastics production – DRAFT FOR STAKEHOLDER CONSULTATION Part II
209
Table 56: Most relevant impact categories identified for automotive interior panel LCA scenarios 1
S1 PP S2 ABS S3 PBS
Impact category1 Contrib. (%) Impact category Contrib. (%) Impact category Contrib. (%)
Resource Use - fossils
42% Resource Use -fossils
38% Climate Change 24%
Climate Change 30% Climate Change 35% Resource Use -fossils 20%
Human Toxicity -cancer
10% Human Toxicity -cancer
7% Human Toxicity -cancer
16%
Total 82% Total 80%
Particulate Matter 14%
Ecotoxicity Freshwater
6%
Total 80%
S4 R-PP S5 Bio-PBS S6 PLA
Impact category Contrib. (%) Impact category Contrib. (%) Impact category Contrib. (%)
Climate Change 37% Human Toxicity -non-cancer
19% Climate Change 36%
Resource Use - fossils
33% Human Toxicity -cancer
18% Resource Use -fossils 24%
Human Toxicity -cancer
10% Climate Change 17% Acidification 7%
Total 81%
Acidification 9% Particulate Matter 7%
Particulate Matter 7% Photochemical Ozone Formation
6%
Resource Use -minerals and metals
7%
Total 80%
Photochemical Ozone Formation
6%
Total 84% 1) Water Use was highly negative affecting to percentages of all impact categories. Results of that impact 2 category was considered not to be reliable, thus the ranking was calculated without that impact category. 3
8.6.1.2 Identification of most relevant life cycle stages 4
5
Comparative LCA of alternative feedstock for plastics production – DRAFT FOR STAKEHOLDER CONSULTATION Part II
210
Table 57 shows the most relevant lifecycle stages in the relevant impact categories, as already 1
identified in section 8.6.1.1). The associated contribution was calculated according to the approach 2
detailed in the methodology document (Report I). Across all the categories investigated, the major 3
contribution to the total impact was attributed to the life cycle stages "Polymer production" and 4
"End of Life", the latter as aggregation of burdens and credits. In most cases, these two stages 5
account for over 90% of the impact. Article production was generally the third most relevant life 6
cycle stage for all impact categories. The transport stage played a minor role in the scenarios of PP, 7
PBS and R-PP, with contributions 1-2%. For Bio-PBS and PLA, the contributions of transport are 8
higher due to the longer distances travelled by the polymer granulates (Thailand to Europe for Bio-9
PBS and USA to Europe for PLA). Transport can contribute as much as 35% and 32% to the total 10
impact in the case of Bio-PBS for the Acidification and Photochemical Ozone Formation categories, 11
respectively. 12
13
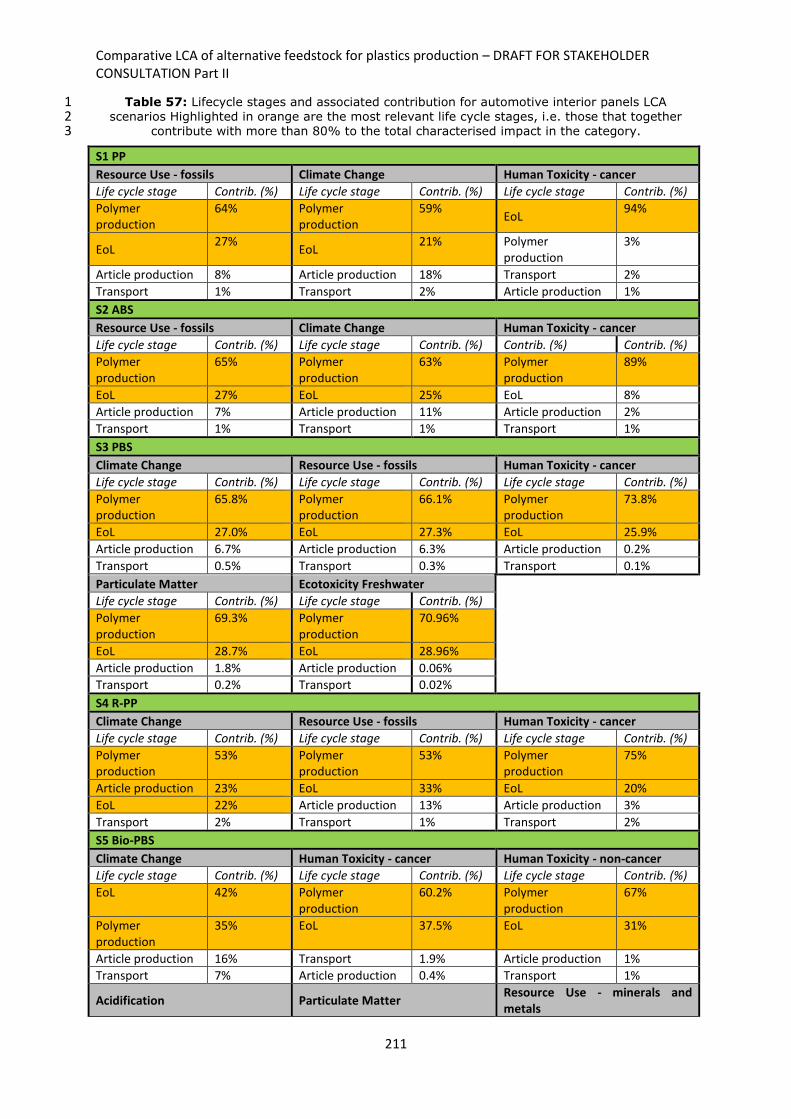
Comparative LCA of alternative feedstock for plastics production – DRAFT FOR STAKEHOLDER CONSULTATION Part II
211
Table 57: Lifecycle stages and associated contribution for automotive interior panels LCA 1 scenarios Highlighted in orange are the most relevant life cycle stages, i.e. those that together 2
contribute with more than 80% to the total characterised impact in the category. 3
S1 PP
Resource Use - fossils Climate Change Human Toxicity - cancer
Life cycle stage Contrib. (%) Life cycle stage Contrib. (%) Life cycle stage Contrib. (%)
Polymer production
64% Polymer production
59% EoL
94%
EoL 27%
EoL 21% Polymer
production 3%
Article production 8% Article production 18% Transport 2%
Transport 1% Transport 2% Article production 1%
S2 ABS
Resource Use - fossils Climate Change Human Toxicity - cancer
Life cycle stage Contrib. (%) Life cycle stage Contrib. (%) Contrib. (%) Contrib. (%)
Polymer production
65% Polymer production
63% Polymer production
89%
EoL 27% EoL 25% EoL 8%
Article production 7% Article production 11% Article production 2%
Transport 1% Transport 1% Transport 1%
S3 PBS
Climate Change Resource Use - fossils Human Toxicity - cancer
Life cycle stage Contrib. (%) Life cycle stage Contrib. (%) Life cycle stage Contrib. (%)
Polymer production
65.8% Polymer production
66.1% Polymer production
73.8%
EoL 27.0% EoL 27.3% EoL 25.9%
Article production 6.7% Article production 6.3% Article production 0.2%
Transport 0.5% Transport 0.3% Transport 0.1%
Particulate Matter Ecotoxicity Freshwater
Life cycle stage Contrib. (%) Life cycle stage Contrib. (%)
Polymer production
69.3% Polymer production
70.96%
EoL 28.7% EoL 28.96%
Article production 1.8% Article production 0.06%
Transport 0.2% Transport 0.02%
S4 R-PP
Climate Change Resource Use - fossils Human Toxicity - cancer
Life cycle stage Contrib. (%) Life cycle stage Contrib. (%) Life cycle stage Contrib. (%)
Polymer production
53% Polymer production
53% Polymer production
75%
Article production 23% EoL 33% EoL 20%
EoL 22% Article production 13% Article production 3%
Transport 2% Transport 1% Transport 2%
S5 Bio-PBS
Climate Change Human Toxicity - cancer Human Toxicity - non-cancer
Life cycle stage Contrib. (%) Life cycle stage Contrib. (%) Life cycle stage Contrib. (%)
EoL 42% Polymer production
60.2% Polymer production
67%
Polymer production
35% EoL 37.5% EoL 31%
Article production 16% Transport 1.9% Article production 1%
Transport 7% Article production 0.4% Transport 1%
Acidification Particulate Matter Resource Use - minerals and metals
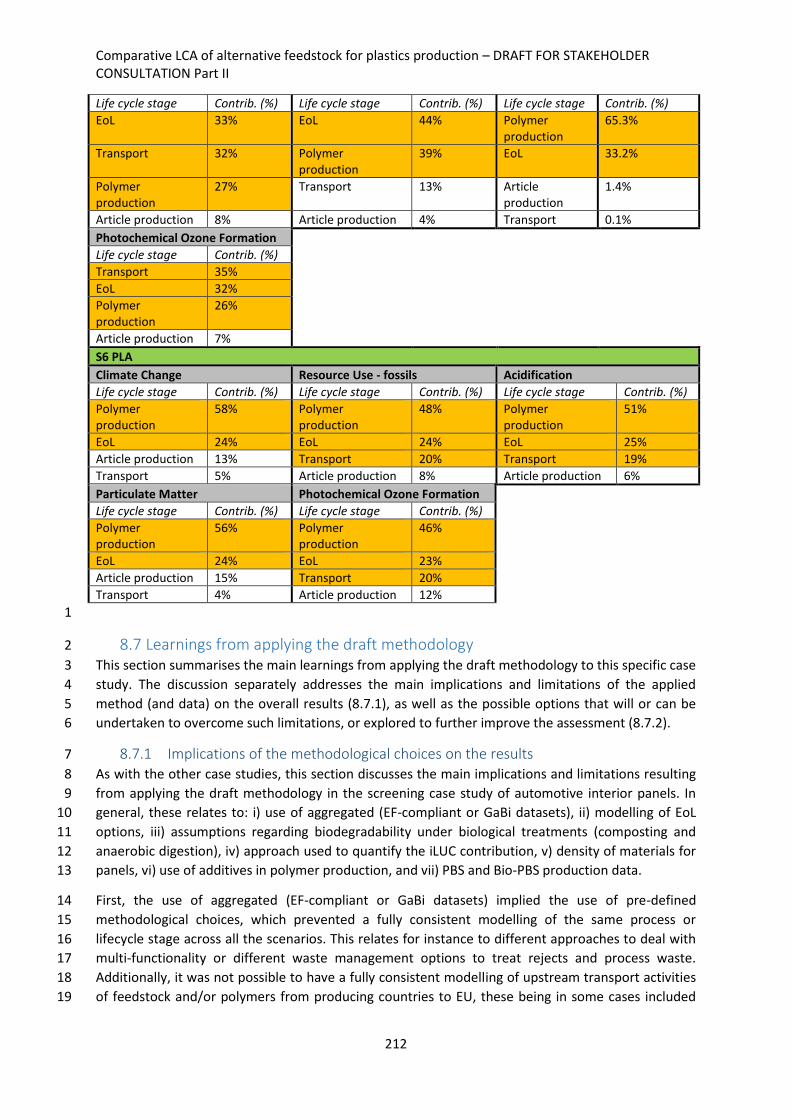
Comparative LCA of alternative feedstock for plastics production – DRAFT FOR STAKEHOLDER CONSULTATION Part II
212
Life cycle stage Contrib. (%) Life cycle stage Contrib. (%) Life cycle stage Contrib. (%)
EoL 33% EoL 44% Polymer production
65.3%
Transport 32% Polymer production
39% EoL 33.2%
Polymer production
27% Transport 13% Article production
1.4%
Article production 8% Article production 4% Transport 0.1%
Photochemical Ozone Formation
Life cycle stage Contrib. (%)
Transport 35%
EoL 32%
Polymer production
26%
Article production 7%
S6 PLA
Climate Change Resource Use - fossils Acidification
Life cycle stage Contrib. (%) Life cycle stage Contrib. (%) Life cycle stage Contrib. (%)
Polymer production
58% Polymer production
48% Polymer production
51%
EoL 24% EoL 24% EoL 25%
Article production 13% Transport 20% Transport 19%
Transport 5% Article production 8% Article production 6%
Particulate Matter Photochemical Ozone Formation
Life cycle stage Contrib. (%) Life cycle stage Contrib. (%)
Polymer production
56% Polymer production
46%
EoL 24% EoL 23%
Article production 15% Transport 20%
Transport 4% Article production 12%
1
8.7 Learnings from applying the draft methodology 2
This section summarises the main learnings from applying the draft methodology to this specific case 3
study. The discussion separately addresses the main implications and limitations of the applied 4
method (and data) on the overall results (8.7.1), as well as the possible options that will or can be 5
undertaken to overcome such limitations, or explored to further improve the assessment (8.7.2). 6
8.7.1 Implications of the methodological choices on the results 7
As with the other case studies, this section discusses the main implications and limitations resulting 8
from applying the draft methodology in the screening case study of automotive interior panels. In 9
general, these relates to: i) use of aggregated (EF-compliant or GaBi datasets), ii) modelling of EoL 10
options, iii) assumptions regarding biodegradability under biological treatments (composting and 11
anaerobic digestion), iv) approach used to quantify the iLUC contribution, v) density of materials for 12
panels, vi) use of additives in polymer production, and vii) PBS and Bio-PBS production data. 13
First, the use of aggregated (EF-compliant or GaBi datasets) implied the use of pre-defined 14
methodological choices, which prevented a fully consistent modelling of the same process or 15
lifecycle stage across all the scenarios. This relates for instance to different approaches to deal with 16
multi-functionality or different waste management options to treat rejects and process waste. 17
Additionally, it was not possible to have a fully consistent modelling of upstream transport activities 18
of feedstock and/or polymers from producing countries to EU, these being in some cases included 19

Comparative LCA of alternative feedstock for plastics production – DRAFT FOR STAKEHOLDER CONSULTATION Part II
213
into the aggregated polymer production datasets used in the model, and in other cases modelled 1
additionally in the system (consistently with the provisions in the methodology document -Report I-2
). Finally, on the interpretation side, the use of aggregated datasets affected the level of detail of the 3
analysis of contributions to scenario impacts, which in the case of, e.g., polymer production, could 4
be conducted only at the level of overall lifecycle stage. 5
Regarding the modelling of specific EoL options, and especially incineration and landfilling, it was not 6
possible to apply a completely consistent approach across all the assessed scenarios. This is because 7
waste-specific, EF-compliant or GaBi datasets (both developed according to the same modelling 8
approach) are not available for all the investigated plastic materials. Although a waste-specific model 9
(Doka, 2009a, Doka 2009b) was used to develop LCIs for any missing material, it may be based on a 10
different approach and assumptions (e.g. transfer coefficients, conversion efficiencies, etc.) 11
compared to those applied in the available datasets (which are not disclosed). A consistent 12
modelling across all EoL options and material scenarios will be considered in the full LCA study, as 13
better addressed in section 10. 14
Focusing more specifically on biological treatment options for biodegradable plastic materials (i.e. 15
composting and anaerobic digestion), the results are bound to the assumptions performed on 16
material degradability during treatment and subsequent land application of composted (or post-17
composted) material. As detailed in Sections 4.4.5.3 and 4.4.5.4, degradability during aerobic and 18
anaerobic treatment was defined according to minimum requirements in relevant EN standards (e.g. 19
EN 13432:2000) and was set to 90% for composting and 50% for anaerobic digestion. However, 20
these values refer to laboratory testing conditions, which may not fully reflect those of real 21
treatment plants. In the case of anaerobic digestion, the mentioned degradation rate was reduced 22
to 35%, according to the biogas yield typically considered for organic waste (70% of anaerobically 23
degradable carbon), which may not be identically applied to plastic materials. Overall, this 24
represents a source of uncertainty that ultimately affects the potential benefits from biological 25
treatments (i.e. carbon supply to soil with compost, and avoided energy generation from bio-gasified 26
carbon). 27
Finally, the iLUC effect on Climate Change impact calculated in this screening may be 28
underestimated. The GHG emission factors used for quantification purposes (derived from Directive 29
2015/1513 (EC, 2015)) were found to fall in the lower end of the range available in the recent 30
literature (see methodology document -Report I-). The reasons for this could be related to the 31
exclusion of intensification-related impacts (i.e. only expansion on nature is included), the 32
assumptions taken in the underlying economic models, and the approach used to handle carbon 33
emissions (i.e. amortisation), as highlighted in a recent review by (De Rosa et al., 2016). In addition, 34
it should be kept in mind that the iLUC contribution used in this screening only accounted for carbon 35
emissions, thus only impacts on the climate change category were addressed. A larger iLUC GHG 36
contribution and the inclusion of nutrients-related impacts (e.g. due to intensification) in the iLUC 37
inventory would increase the Climate change, Acidification, and Eutrophication impacts of the bio-38
based scenarios (PBS, PLA and bio-PBS). 39
The panel material densities included in Table 48 are averages of values reported by some 40
manufacturers and they usually vary significantly from manufacturer to manufacturer. As a result, 41
there is an inherent uncertainty on whether the reported averages represent current market reality. 42
As already discussed in the document, the additives used in the manufacturing of the polymer were 43
excluded from the screening exercise due to lack of (consistent) data and information on the use of 44
additives for the examined plastic materials. This is acknowledged as a limitation of this screening 45

Comparative LCA of alternative feedstock for plastics production – DRAFT FOR STAKEHOLDER CONSULTATION Part II
214
study, as additive production can account for a non-negligible portion of climate impact, bio-1
diversity impact, toxicity-related impacts, etc. 2
As reported in section 8.4.1, no “ready-to-use” LCI is currently available for PBS and Bio-PBS, due to 3
the relatively early stage of development of the related production technologies. As a result, the 4
laboratory-scale nature of the data used to model the LCI for these materials can affect negatively 5
the accuracy of the impact assessment results. This needs to be addressed in order to allow fair 6
comparison with other materials for which industrial-scale datasets were use. 7
8
8.7.2 Options to be explored for further improvement 9
Possible options to overcome the limitations i), ii), iii) and iv), discussed in the previous section will 10
be addressed in Section 10. 11
Regarding the different densities of the assessed panel materials, stakeholders are encouraged to 12
provide feedback and suggestions on this. The same would apply to the additives used in the 13
production of the different polymers. 14
As for limitation vii), it becomes clear that real data from manufacturing facilities of PBS and Bio-PBS 15
are needed, therefore stakeholders are kindly encouraged to provide comments on this. 16

Comparative LCA of alternative feedstock for plastics production – DRAFT FOR STAKEHOLDER CONSULTATION Part II
215
9. Common learnings from the screening studies 1
Common limitations or challenging issues that emerged across the five case studies were i) the 2
implications of working with (highly) aggregated EF-compliant (or GaBi) datasets, ii) the reliability of 3
some screening results for the Resource Use (mineral and metals) and Water Use categories, iii) the 4
approach used to quantify the dLUC and iLUC contributions, iv) the modelling of EoL options 5
(especially for biodegradable plastic articles), v) the handling of long-term carbon emissions (limited 6
to longer living articles), and vi) handling of recycled material input as feedstock for plastic 7
production. 8
9.1 Aggregated datasets 9
Using aggregated EF-compliant (or GaBi) datasets emerged as one of the most critical aspects of the 10
study, across all the five case studies. Aggregated datasets do not allow for control and possible 11
adjustment of the methodological choices taken upfront to derive the inventory. For instance, it is 12
not possible to change allocation criteria, remove allocation to obtain the full impact, etc. This 13
prevents a fully consistent modelling of compared alternatives with respect to, e.g. approach used to 14
handle multifunctionality, upstream transport activities, handling of waste and rejects from waste 15
treatments, etc. Moreover, the quite extensive documentation that normally complements the 16
datasets, lacked in some cases essential information, such as the allocation criteria used and related 17
reference sources, as well as the specific point in the process chain where they were applied. On top, 18
when one dataset aggregates a number of important sub-processes from feedstock to polymer 19
production (e.g. dLUC, cultivation, monomer/polymer production and associated transportation) the 20
contribution analysis (i.e. the breakdown of the most important impact contributions) similarly 21
becomes much aggregated and the identification of specific emission sources or hotspots in specific 22
processes is not possible. This ultimately limits an in-depth interpretation of the LCIA results, 23
especially with respect to the identification of improvement options on process level. 24
9.2 Reliability of some screening results for Resource Use (mineral and metals) 25
and Water Use 26
The results obtained for the category of Resource Use – minerals and metals were found to be 27
unreliable in some of the screening case studies (e.g. bottles), and in most of them the Water Use 28
results appeared to be unreliable as well. For instance, the overall Resource Use impact of bio-PET 29
and PLA bottles is negative, and that of HDPE bottles is two orders of magnitude lower than 30
remaining scenarios. This can be partly attributed to the inconsistent mapping of flows from 31
imported (EF-compliant) datasets and/or recommended impact assessment methods (see section 32
3.2). However, inconsistencies in the modelling or quantification of resource-related inventory flows 33
within polymer production datasets (which come from different sources), may also contribute to this 34
picture. In fact, it appears to be mostly a result of Antimony consumption in PET production, being 35
its use in this process four to seven orders of magnitude greater than the compared materials (bio-36
PET, PLA and HDPE). No further investigation could be made at this stage, due to the use of 37
aggregated datasets in the modelling of polymer production. 38
As for water Use, many scenarios across several case studies (e.g. bottles, packaging film and mulch 39
film) showed an overall negative impact. This is for instance the case of PET, HDPE and PEF bottles, 40
PP, LDPE, starch-based and CO2-based packaging film, as well as all mulch film scenarios. In most 41
cases, this result is mainly a consequence of the negative contribution from polymer production, 42
which appears driven by turbine water returned to the environment (and thus associated with a 43
negative characterisation factor). On the other hand, turbine water is excluded from production 44

Comparative LCA of alternative feedstock for plastics production – DRAFT FOR STAKEHOLDER CONSULTATION Part II
216
inventories of other polymers, such as PLA. Hence, factors that may all play a role in this overall 1
picture of Water Use results include: i) possible inconsistencies in the modelling of water flows 2
across (polymer production) datasets coming from different sources, ii) inconsistencies in the 3
mapping of water flows from imported (EF-compliant) datasets and/or impact assessment methods, 4
as well as iii) potentially flawed (incomplete) water balances in (polymer production) inventories. 5
9.3 Land Use Changes (dLUC/iLUC) 6
The dLUC guidelines from the PEFCR guidance document and PAS2050:2011 imply a crop-specific 7
reasoning for a given country, rather than an analysis of the “demand for cropland” in that country. 8
Looking at the example of sugarcane in a generic “country X”, a portion of the sugarcane farms in 9
“country X” may now supply sugarcane to the (new) market for bio-based articles, rather than to the 10
sugar market as earlier was the case. If these farms have been under sugarcane for at least 20 years 11
from the date the LCA is made, the PAS2050:2011 method imposes that dLUC is zero, even in the 12
case that it can be demonstrated that additional demands for cropland in “country X” occurs at the 13
frontier between nature and agriculture (e.g. for Brazil). On the same example, the methodology 14
proposed by the PEFCR guidance document (v.6.3) and by PAS2050:2011 also implies that while the 15
dLUC of sugarcane in “country X” is zero, the one of another crop with a shorter history in “country 16
X”, e.g. maize, may be very high, based on such 20 years arbitrary threshold. Further, it should also 17
be kept in mind that the PEFCR guidance (or PAS2050:2011) is only concerned with assessing the 18
GHG emissions (and removals) arising from direct land use changes, and these “shall be assessed on 19
the basis of the default land use change values provided in PAS 2050:2011 Annex C, unless better 20
data is available”. Yet, the dLUC methodology in PAS 2050:2011 (supplemented by the PAS2050-21
1:2012) is only accounting for carbon flows, and these are exclusively translated into CO2 emissions, 22
thus only the climate change impact is addressed. With respect to handling of iLUC impacts, strict 23
conformity to PEF-guidelines would lead to excluding such contribution as there is no agreed and 24
consistent approach available on how to include them. However, it was decided to include iLUC in 25
our screening LCAs for plastic as it could be of specific relevance for the comparison of bio-based 26
feedstock versus other feedstock for plastics. The GHG factors provided in EU 2015/1513 (EC, 2015) 27
were applied. Yet, upon consideration of the scientific literature, it appears that the iLUC factors in 28
EU 2015/1513 (EC, 2015) fall in the lower end of the wider range found in literature. The reasons for 29
this could be related to the exclusion of intensification-related impacts (i.e. only expansion on nature 30
is included), the assumptions taken in the economic models, and the approach used to handle 31
carbon emissions (known as "amortisation" over an arbitrary number of years, generally 20) as 32
highlighted in a recent review by De Rosa et al. (2016). In addition, it should be kept in mind that the 33
iLUC contribution used in this screening only accounted for CO2 emissions, thus only impacts on 34
Climate Change were addressed. A larger iLUC GHG contribution and the inclusion of nutrients-35
related impacts (e.g. due to intensification) in the iLUC inventory would in tendency increase the 36
Climate Change, Acidification, and Eutrophication related impacts of the bio-based scenarios. 37
9.4 Modelling of EoL options 38
Waste-specific inventories of different EoL options (incineration, landfilling, composting and 39
anaerobic digestion) had to be developed for those plastic materials which are not covered by 40
existing EF-compliant (or GaBi) EoL datasets. As the underlying modelling parameters and 41
assumptions used for the development of such datasets (e.g. transfer coefficients) are not (or only 42
partially) disclosed, a fully consistent modelling could not be performed at this stage across all the 43
assessed materials. In several impact categories, the contribution from the EoL of the investigated 44
plastic articles is moderate, so that this lack of consistency may be expected to only marginally affect 45
the results. On the other hand, there are assumptions that have a larger influence on specific impact 46
Comparative LCA of alternative feedstock for plastics production – DRAFT FOR STAKEHOLDER CONSULTATION Part II
217
categories (e.g. degradability of starch-based polymers in landfill on the respective climate change 1
impact). Moreover, assumptions related to biodegradability of suitable plastic materials during 2
biological treatments (composting and anaerobic digestion) and subsequent land application of 3
composted material, affect the potential benefits of these EoL routes (carbon supply to soil with 4
compost, and avoided energy generation from biogasified carbon in plastics). 5
9.5 Delayed carbon emissions of long-lived articles 6
A dynamic (i.e. time-dependent) assessment of carbon emissions was not performed as to conform 7
to the PEF-methodology. This means that no storage credits (delayed emissions) were attributed to 8
bio- or CO2-based plastic articles evaluated in the screenings. However, a consistent portion of the 9
literature has shown how this can be an important aspect in relation to the climate change impact of 10
bio-based products with a long lifetime, i.e. in the case of long-term carbon emissions and storage. 11
9.6 Handling of recycled material input 12
Finally, it should be noted that alternative approaches exist to handle the impact of the use of 13
secondary raw material (recycled-based scenarios), taking into account the "avoided treatment" of 14
the waste used as feedstock. This departs from the principle that waste is generated regardless of 15
the market demand for a specific product and, as such, cannot be supplied but only shifted from one 16
treatment option to another (assuming a constrained amount is generated, regardless of the 17
demand for the plastic-product under assessment). On this basis, the utilisation of waste as 18
secondary raw material would then avoid the conventional (prominently affected) treatment of such 19
waste, e.g. landfilling, incineration (or even other recycling routes) that would otherwise take place. 20
By doing so, the use of secondary raw material supplied is linked to savings and burdens from the 21
avoided treatments. 22
10. Options to be explored for further improvement 23
10.1 Aggregated datasets 24
While the use of disaggregated datasets would be preferable, technical challenges may hamper 25
further improvement in this sense as EF-compliant datasets come in aggregated form and 26
disaggregation does not seem possible at this stage. For the full LCA case studies, an attempt will be 27
made to explore options that may help overcoming the emerged limitations of working with 28
aggregated datasets. For instance, the use of more disaggregated (at level 1) EF-compliant datasets 29
will be explored, provided they are available or can be consistently implemented with reasonable 30
effort in the used LCA software by that time. However, this will only gradually improve the 31
possibilities of interpreting the results, as only foreground processes and emissions can be generally 32
disaggregated. Moreover, considering the availability of relevant and consistent LCI data in the area 33
of plastics (and especially bio-plastics), both in the set of EF-compliant datasets and in other 34
databases, it cannot be expected to resolve the problems related to consistency of data source and 35
modelling approach across the entire life cycle. In fact, not all required datasets will be available 36
from the same data source, and a mix among different sources will remain inevitable. 37
10.2 Reliability of LCIA results for Resource Use (minerals and metals) and 38
Water Use 39
Reliability of LCIA results for the categories of Resource Use – minerals and metals and Water Use, 40
are expected to be solved by carefully identifying and removing any error and inconsistency in the 41
implementation of EF-compliant datasets and of the recommended impact assessment methods in 42
the used LCA software. This is also expected to solve the issue of discrepancies of LCIA results with 43

Comparative LCA of alternative feedstock for plastics production – DRAFT FOR STAKEHOLDER CONSULTATION Part II
218
respect to the correct results for these and the other categories highlighted in section 3.2 (i.e. 1
toxicity-related categories and Photochemical Ozone Formation). On the other hand, issues may still 2
remain due to inconsistencies among the datasets used to model the production of the different 3
plastic materials (or other life cycle stages), when they come from different sources, as well as due 4
to potentially flawed water balances within specific datasets. In these cases, the validity of the 5
datasets will be checked (as far as permitted by the level of disaggregation of the dataset itself), and 6
the availability of alternative data sources will be explored. 7
10.3 Land Use Changes (dLUC/iLUC) 8
For iLUC, alternative pathways to EU 2015/1513 (EC, 2015) may be evaluated by applying causal 9
deterministic models (e.g. Schmidt et al., 2015; Tonini et al., 2016; BioSpri, 2018) or applying the 10
iLUC figures derived with economic equilibrium models, for example by Valin et al. (2015). Causal 11
deterministic models depart from the assumption of full-elasticity of supply, neglecting any 12
fluctuation in food prices following short-term market shocks and are mainly intended for 13
application in consequential (change-oriented; long-term) LCA. According to these models, reduced 14
consumption and constrained suppliers (i.e. geographic areas where expansion cannot be performed 15
and where further intensification is limited) should not be part of the consequences associated with 16
the demand for additional land that ultimately incurs only expansion and intensification in the long-17
term. In respect to dLUC, the relevance of addressing dLUC and iLUC separately rather than just 18
addressing the overall land use changes (LUC) has been questioned several times. In many studies 19
addressing the full land use changes impacts, the iLUC impact factors developed often include also 20
the dLUC one (e.g. Schmidt et al., 2015; Tonini et al., 2016). This is also the case in the study from 21
Valin et al. (2015). 22
10.4 Modelling of EoL options 23
The use of a partly inconsistent approach in the modelling of EoL options across the different 24
scenarios appeared to have no significant consequences on the overall results in most impact 25
categories. However, for the full LCA case studies, further attempt will be made to perform a fully 26
consistent modelling, e.g. by transversally applying the same waste LCA model (e.g. EASETECH) or 27
tool across all scenarios (plastic materials) and EoL options. Moreover, questionable degradability 28
rates of biodegradable plastics (e.g. starch-based polymers in landfill) will be further investigated, 29
seeking input from relevant stakeholders. On the other hand, an improvement in the modelling of 30
biodegradation of (post-)composted plastic materials on soil, as well as of in-situ degradation of 31
biodegradable agricultural plastic articles (e.g. mulch film) is bound to the availability of more 32
detailed composition data (especially including any metals and additives), as well as of 33
characterisation factors for all types of such substances. Input from relevant stakeholders is again 34
seen as essential to move in this direction, even if composition data alone may not be sufficient if 35
not complemented by characterisation factors for the corresponding substances. The availability of 36
relevant characterisation factors, or reasonable proxies, will be checked once composition data 37
specifying the types of substances involved is available. 38
10.5 Modelling of the EoL of conventional mulch film 39
Similar considerations apply to the modelling of the environmental consequences of non-40
biodegradable mulch film remaining uncollected and accumulating the soil, with potential 41
detrimental effects on its overall quality and contribution to microplastics formation. While an 42
improvement in the modelling of the potential toxicological effects of the latter is not seen as 43
feasible at this stage, a future full LCA case study may better explore the effects of a reduced soil 44
quality on crop yield and corresponding production. For instance, if robust evidence would be 45
available to confirm a yield decrease following the application of conventional mulch film in 46
Comparative LCA of alternative feedstock for plastics production – DRAFT FOR STAKEHOLDER CONSULTATION Part II
219
European countries, this decreased production per ha of mulched land could be factored in the LCA 1
model both in terms of increased need for agricultural inputs and of a possible additional land 2
demand to compensate for production loss. Moreover, an improved modelling of the EoL of non-3
biodegradable plastic films may account for the effects (burdens and benefits) of soil particles 4
remaining on the film after soil removal, potentially hampering recycling and also affecting other 5
treatment options such as landfilling and incineration. For instance, an increase of energy 6
consumption from recycling in proportion to the increased mass of treated material may be 7
considered, along with an increase of rejects from the process itself to also account for removed soil. 8
10.6 Littering 9
As highlighted in section 3.2, the potential environmental impacts of littering could not be 10
quantitatively assessed in this screening study due to the lack of data related to the share of littered 11
product and its subsequent fate, exposure and potential physical and toxicological effects on 12
ecosystems and humans. The meta-analysis performed as a first project step also revealed that 13
littering impacts have been very scarcely addressed in the available LCA literature on plastics, and 14
attempts in this sense have been mostly limited to semi-quantitative assessments of the visual 15
impacts of littering (see 2.3.2.10 of Report I for further details). Hence, this screening study does not 16
fully capture the implications of using a biodegradable material rather than a non-biodegradable 17
one, and a quantitative assessment of the potential environmental impacts of littering is not 18
anticipated to be feasible, due to the mentioned fundamental gap in underlying data. On the other 19
hand, the methodology developed in the context of this project (see section 5.5.8.8 of Report I), 20
includes a first proposal of framework to quantify marine litter generation associated with plastic 21
articles. Building upon this framework, the feasibility of quantitatively addressing littering through 22
the development of an inventory-level indicator will be explored. The latter is expected to describe 23
the likelihood of an article to be littered and could be included in the study as “additional 24
environmental information”. 25
10.7 Assessment of potential impacts on biodiversity 26
As for potential impacts on biodiversity, an established and consistent framework for quantitative 27
assessment within LCA is still lacking, and existing methods are seen as not sufficiently robust in the 28
Environmental Footprint context. Moreover, although possible approaches to quantitatively address 29
biodiversity impacts due to land use have recently been developed (e.g. Chaudary, 2017), these are 30
still not made operational for use within current LCA software, and in combination with common LCI 31
databases (including the set of EF-compliant datasets)16. An alternative option that can be explored 32
for some of the full LCAs is the calculation of an endpoint-level impact indicator (e.g. through the 33
ReCiPe 2016 LCIA method), depicting the potential lost of species associated with many of the 34
impact drivers addressed at the mid-point level (e.g. climate change, acidification, eutrophication, 35
etc.). This indicator could then be included in the study as “additional environmental information”. 36
However, it has to be noted that the calculation of such an indicator would be based on impact 37
assessment models for the single mid-point indicators which are only partially aligned with those 38
recommended in the EF context and in this methodological framework, thus introducing some new 39
inconsistencies. 40
16 This is partly due to the lack of (sufficiently) regionalised land-use-related inventory flows in such databases and datasets.

Comparative LCA of alternative feedstock for plastics production – DRAFT FOR STAKEHOLDER CONSULTATION Part II
220
10.8 Carbon storage and delayed carbon emissions (long-lived articles) 1
For dynamic assessment of emission and storage, advanced approaches for addressing the issue of 2
emission timing exist (Faraca et al., 2018, Levasseur et al., 2013, Guest et al., 2012, Cherubini et al., 3
2011) and may be applied in a full LCA to evaluate the importance of storage, especially for biogenic 4
carbon (affecting the partly soy-based bio-PUR) and for captured CO2 (affecting the CO2-based 5
scenario). These approaches consist in a dynamic assessment of the GHGs (mainly CO2, as this is 6
typically the most relevant GHG; see Faraca et al., 2018) using an advanced time-dependent 7
formulation of the GWP integer departing from the Bern's equation (see Cherubini et al., 2011). 8
10.9 Handling of recycled material input 9
Last, to quantify the provision burdens for secondary raw material, an alternative approach could be 10
to test recent literature approaches accounting for the avoided treatments (e.g. avoided 11
incineration, landfilling, or other treatments) by adjusting the Circular Footprint Formula (CFF) by 12
including such contribution in the equation. Notice that such contribution was originally present in 13
earlier formulations of the CFF and tested but deleted in the final version to keep the CFF more 14
manageable and consistent between the use of recycled material at the input side and recyclability 15
at EoL. 16
Comparative LCA of alternative feedstock for plastics production – DRAFT FOR STAKEHOLDER CONSULTATION Part II
221
11. References 1
Angelidaki, I., Batstone, D.J. (2010). Anaerobic Digestion: Process 583 in Christensen, T. (ed.) (2010). 2
Solid Waste Technology and Management, 2 Volume Set. Wiley. 3
BASF (2016). Biodegradation of ecovio® mulch film. Introduction to the LCA Mulch Film for Cotton 4
Cultivation in China. 5
Beck, T., Bos, U., Wittstock, B., Baitz, M., Fischer, M., Sedlbauer, K. (2010). LANCA Land Use Indicator 6
Value Calculation in Life Cycle Assessment – Method Report. Fraunhofer Institute for 7
Building Physics. 8
Benecke-Kaliko AG (2018). Door & side panel. [online] Available at: https://www.benecke-9
kaliko.com/produktinfo/Kfz-Interieurmaterial/Tur-und-Seitenverkleidung.html [Accessed 26 10
October 2018]. 11
BioSpri (2018). Study commissioned by DG RTD on Support to R&I Policy in the Area of Bio-based 12
Products and Services, Environmental impact assessments of innovative bio-based products 13
– confidential draft report, 2018. 14
Bos U., Horn R., Beck T., Lindner J.P., Fischer M. (2016). LANCA® - Characterisation Factors for Life 15
Cycle Impact Assessment, Version 2.0, 978-3-8396-0953-8Fraunhofer Verlag, Stuttgart. 16
BPF (2018). Recycling Plastic Packaging. British Plastics Federation. Available at: 17
http://www.bpf.co.uk/packaging/recycling.aspx 18
Broeren, M.L.M., Kuling, L., Worrell, E., Shen, L., 2017. Environmental impact assessment of six 19
starch plastics focusing on wastewater-derived starch and additives. Resources, 20
Conservation & Recycling, 127, pp. 246–255. 21
CEWEB (2012). Results of Specific Data for Energy, R1 Plant Efficiency Factor and NCV of 314 22
European Waste-to Energy (WtE) Plants. CEWEB Energy Report III. Available at: 23
http://www.cewep.eu/wp-24
content/uploads/2017/09/13_01_15_cewep_energy_report_iii.pdf 25
Chalker-Scott, L. (2007). Impact of mulches on landscape plants and the environment—a review. J. 26
Environ. Hortic., 25 (2007), p. 239. 27
Cheroennet, N., Pongpinyopap, S., Leejarkpai, T., Suwanmanee, U. (2017). A trade-off between 28
carbon and water impacts in bio-based box production chains in Thailand: A case study of 29
PS, PLAS, PLAS/starch, and PBS. Journal of Cleaner Production, 167, pp. 987-1001. 30
Cherubini, F., Peters, G.P., Berntsen, T., Strømman, A.H., Hertwich, E. (2011). CO2 emissions from 31
biomass combustion for bioenergy: atmospheric decay and contribution to global warming. 32
GCB Bioenergy 3, 413–426. https://doi.org/10.1111/j.1757-1707.2011.01102.x 33
Cimpan, C., Rothmann, M., Hamelin, L., Wenzel, H. (2015). Towards increased recycling of household 34
waste: Documenting cascading effects and material efficiency of commingled recyclables 35
and biowaste collection. Journal of environmental management 157, 69-83. 36
Couturier, C., Porhel, C., Aubertin, G., Levasseur, H. (2010). Waste Landfilling in Europe: Energy 37
Recovery and GHG Mitigation. Sustainable Landfill Foundation, Assendelft, The Netherlands. 38
Comparative LCA of alternative feedstock for plastics production – DRAFT FOR STAKEHOLDER CONSULTATION Part II
222
De Rosa, M., Knudsen, M. T., Hermansen, J. E. (2016). A comparison of Land Use Change models: 1
challenges and future developments. Journal of Cleaner Production, 113, pp. 183–193. doi: 2
10.1016/j.jclepro.2015.11.097. 3
Dreicer M., Tort V., Manen P. (1995). ExternE, Externalities of Energy, Vol. 5 Nuclear, Centre d'étude 4
sur l'Evaluation de la Protection dans le domaine nucléaire (CEPN), edited by the European 5
Commission DGXII, Science, Research and development JOULE, Luxembourg. 6
Doka G. (2009a) Life Cycle Inventories of Waste Treatment Services - Part II "Waste incineration". 7
ecoinvent report No. 13. Swiss Centre for Life Cycle Inventories, St. Gallen. 8
Doka G. (2009b) Life Cycle Inventories of Waste Treatment Services - Part III "Landfills - Underground 9
deposits - Landfarming". ecoinvent report No. 13. Swiss Centre for Life Cycle Inventories, St. 10
Gallen. 11
EC (2015). DIRECTIVE (EU) 2015/1513 OF THE EUROPEAN PARLIAMENT AND OF THE COUNCIL of 9 12
September 2015 amending Directive 98/70/EC relating to the quality of petrol and diesel 13
fuels and amending Directive 2009/28/EC on the promotion of the use of energy from 14
renewable sources. 15
EC (2018). A European Strategy for Plastics in a Circular Economy. Available at: http://eur-16
lex.europa.eu/resource.html?uri=cellar:2df5d1d2-fac7-11e7-17
b8f501aa75ed71a1.0001.02/DOC_1&format=PDF 18
ECN (2018). Treatment of bio-waste in Europe. European Compost Network. Available online: 19
https://www.compostnetwork.info/policy/biowaste-in-europe/treatment-bio-waste-20
europe/ 21
Eerhart, A. J. J. E., Faaij, A. P. C., Patel, M. K. (2012). Replacing fossil based PET with biobased PEF; 22
process analysis, energy and GHG balance. Energy & Environmental Science, 5(4), 6407. 23
http://doi.org/10.1039/c2ee02480b 24
Element Energy (2014). Demonstrating CO2 capture in the UK cement, chemicals, iron and steel and 25
oil refining sectors by 2025: A Techno-economic Study: Final report for DECC and BIS. 26
Cambridge: Element Energy Ltd.; Carbon Counts Ltd.; PSE Ltd.; Imperial College; University of 27
Sheffield. Available at: 28
www.gov.uk/government/uploads/system/uploads/attachment_data/file/311482/Elemen 29
t_Energy_DECC_BIS_Industrial_CCS_and_CCU_final_report_14052014.pdf. Accessed 20 30
January, 2016. 31
EN 13432:2000. Packaging – Requirements for packaging recoverable through composting and 32
biodegradation – Test scheme and evaluation criteria for the final acceptance of packaging. 33
European standards. 34
EN 13655:2018. Plastics – Plastics - Thermoplastic mulch films recoverable after use, for use in 35
agriculture and horticulture. European standards. 36
EPBP (2018). How to keep a sustainable PET recycling industry in Europe. The European PET Bottle 37
Platform. Available at: https://www.epbp.org/ 38
European Bioplastics (2018), The upcoming revision of the EU Fertilisers Regulation and the benefits 39
of biodegradable plastic mulch films. Available at: https://www.european-40

Comparative LCA of alternative feedstock for plastics production – DRAFT FOR STAKEHOLDER CONSULTATION Part II
223
bioplastics.org/the-upcoming-revision-of-the-eu-fertilisers-regulation-and-the-benefits-of-1
biodegradable-plastic-mulch-films/ 2
EUROSTAT (2018). Municipal waste by waste management operations (env_wasmun). Accessible at: 3
https://ec.europa.eu/eurostat/data/database 4
EUROSTAT (2018). End-of-life vehicles by waste management operations - detailed data. [online] 5
Available at: 6
http://appsso.eurostat.ec.europa.eu/nui/show.do?dataset=env_waselv&lang=en [Accessed 7
26 October 2018]. 8
Faraca, G., Tonini, D., Astrup, T.F. (2018). Dynamic accounting of greenhouse gas emissions from 9
cascading utilisation of wood waste. Science of the total environment, 651(2), 2689-2700. 10
Fernández-Dacosta, C., Van Der Spek, M., Hung, C. R., Oregionni, G. D., Skagestad, R., Parihar, P., 11
Ramirez, A. (2017). Prospective techno-economic and environmental assessment of carbon 12
capture at a refinery and CO2 utilisation in polyol synthesis. Journal of CO2 Utilization. 13
https://doi.org/10.1016/j.jcou.2017.08.005 14
Guest, G., Cherubini, F., Strømman, A.H. (2012). Global Warming Potential of Carbon Dioxide 15
Emissions from Biomass Stored in the Anthroposphere and Used for Bioenergy at End of Life 16
17. https://doi.org/10.1111/j.1530-9290.2012.00507.x 17
Guinée, J.B. (Ed.), Gorrée, M., Heijungs, R., Huppes, G., Kleijn, R., de Koning, A., Van Oers, L., 18
Wegener Sleeswijk, A., Suh, S.,. Udo de Haes, H.A, De Bruijn, J.A., Van Duin R., Huijbregts, 19
M.A.J. (2002). Handbook on Life Cycle Assessment: Operational Guide to the ISO Standards. 20
Series: Eco-efficiency in industry and science. Kluwer Academic Publishers. Dordrecht 21
(Hardbound, ISBN 1-4020-0228-9; Paperback, ISBN 1-4020-0557-1). 22
Guo, M., Stuckey, D. C., Murphy, R. J. (2013). End-of-life of starch-polyvinyl alcohol biopolymers. 23
Bioresource Technology. https://doi.org/10.1016/j.biortech.2012.09.093 24
Hoppe, W., Thonemann, N., Bringezu, S. (2017). Life Cycle Assessment of Carbon Dioxide-Based 25
Production of Methane and Methanol and Derived Polymers. Journal of Industrial Ecology, 26
22:2. 27
Hottle, T. A., Bilec, M. M., Landis, A. E. (2017). Biopolymer production and end of life comparisons 28
using life cycle assessment. Resources, Conservation and Recycling, 122, 295–306. 29
http://doi.org/10.1016/j.resconrec.2017.03.002 30
IPCC (2013). IPCC Climate Change Fifth Assessment Report: Climate Change 2013. Available at: 31
http://www.ipcc.ch/ipccreports/assessments-reports.htm 32
IPCC (2005). Bert Metz, Ogunlade Davidson, Heleen de Coninck, Manuela Loos and Leo Meyer (Eds.). 33
Cambridge University Press, UK. pp 431. Available from Cambridge University Press, The 34
Edinburgh Building Shaftesbury Road, Cambridge CB2 2RU ENGLAND. Available at: 35
https://www.ipcc.ch/report/srccs/ 36
Isola, C., Sieverding, H. L., Raghunathan, R., Sibi, M. P., Webster, D. C., Sivaguru, J., Stone, J. J. (2017). 37
Life cycle assessment of photodegradable polymeric material derived from renewable 38
bioresources. Journal of Cleaner Production. 39

Comparative LCA of alternative feedstock for plastics production – DRAFT FOR STAKEHOLDER CONSULTATION Part II
224
Jamshidian, M., Tehrany, E.A., Imran, M., Jacqot, M., Desobry, S. (2010). Poly-Lactic acid: production, 1
applications, nanocomposites and release studies. Comprehensive Reviews in Food Science 2
and Food Safety. doi 10.1111/j.1541-4337.2010.00126.x 3
Keim, W. (2006). Kunststoffe: Synthese, Herstellungsverfahren, Apparaturen [Plastics. Synthesis, 4
production process, equipment]. 1. Aufl. Weinheim: WILEY-VCH. 5
Kolstad, J.J., Vink, E.T.H., De Wilde, B.L., Debeer, L. (2012). Assessment of anaerobic degradation of 6
Ingeo (TM) polylactides under accelerated landfill conditions. Polymer Degradation and 7
Stability 97(7):1131-1141. 8
Lam, C-M., Yu, I.K.M., Hsu, S-C., Tsang, D.C.W. (2018). Life-cycle assessment on food waste 9
valorisation to value-added products. Journal of Cleaner Production 199, 840-848. 10
Levasseur, A., Lesage, P., Margni, M., Samson, R. (2013). Biogenic Carbon and Temporary Storage 11
Addressed with Dynamic Life Cycle Assessment. J. Ind. Ecol. 17, 117–128. 12
https://doi.org/10.1111/j.1530-9290.2012.00503.x. 13
Mallet B., Lamnawar K., Maazouz, A. (2013). Improvement of blown film extrusion of poly(lactic 14
acid): structure-processing-properties relationships. Polymer engineering and science. 15
https://doi.org/10.1002/pen.23610. 16
Markwardt, S., Wellenreuther, F., Drescher, A., Harth, J., Busch, M. (2017). Comparative Life Cycle 17
Assessment of Tetra Pak® carton packages and alternative packaging systems for liquid food 18
on the Nordic market. 19
McKenzie, C., Duncan, L.W. (2001). Landscape fabric as a physical barrier to neonate Diaprepes 20
abbreviatus (Coleoptera: Curculionidae). Fla. Entomol., 84 (2001), pp. 721-722. 21
NatureWorks (2018). Where it Goes. Available at: https://www.natureworksllc.com/What-is-22
Ingeo/Where-it-Goes 23
Omnitech International (2010). Life Cycle Impact of Soybean Production and Soy Industrial Products. 24
Available at: http://biodiesel.org/reports/20100201_gen-422.pdf. 25
OWS (2017). Expert statement on biodegradable mulching film. Organic Waste System. Available at 26
https://docs.european-27
bioplastics.org/publications/OWS_Expert_statement_mulching_films.pdf. 28
Packaging Europe (2017). PET plastic bottle consumption set to grow by 3.9% over the next five 29
years. 3 July 2017. Available at: https://packagingeurope.com/pet-plastic-bottle-30
consumption-set-to-grow/ 31
Pargana N.,Pinheiro M.D.,Silvestre J.D.,De Brito J. (2014). Comparative environmental life cycle 32
assessment of thermal insulation materials of buildings. Energy Build, 82, 466–81. 33
PAS 2050 (2011). Specifications for the assessment of the life cycle greenhouse gas emissions of 34
goods and services. Available at: http://www.bsigroup.com/en/Standards-and-35
Publications/How-we-can-help-you/Professional-Standards-Service/PAS-2050/ 36
PETRA (2015) Did You Know? Little-Known Facts about PET Plastic. Available at: 37
www.petresin.org/news_didyouknow.asp 38

Comparative LCA of alternative feedstock for plastics production – DRAFT FOR STAKEHOLDER CONSULTATION Part II
225
PlasticsEurope (2004). Eco-profiles of the European Plastics Industry. Polyurethane rigid foam. 1
Available at: http://highperformanceinsulation.eu/wp-2
content/uploads/2016/08/Eco_profile_PU.pdf. 3
PlasticsEurope (2018). Plastics – the Facts 2017. Available at: 4
https://www.plasticseurope.org/application/files/5715/1717/4180/Plastics_the_facts_20175
_FINAL_for_website_one_page.pdf. 6
Posch, M., Seppälä, J., Hettelingh, J.P., Johansson, M., Margni M., Jolliet, O. (2008). The role of 7
atmospheric dispersion models and ecosystem sensitivity in the determination of 8
characterisation factors for acidifying and eutrophying emissions in LCIA. International 9
Journal of Life Cycle Assessment (13) pp.477–486. 10
PTT MCC Biochem Co. (2014). WHAT ARE THE DIFFERENCES BETWEEN BIODEGRADABILITY & 11
COMPOSTABILITY? [online] Available at: 12
http://www.pttmcc.com/new/content.php?mid=W041 [Accessed 26 October 2018]. 13
PRE - Plastics Recyclers Europe (2017). AGRICULTURAL FILMS RECYCLING. Retrieved: 26.05.2018 14
from: https://www.plasteurope.com/news/AGRICULTURAL_FILMS_RECYCLING_t238095/ 15
Rigamonti, L., Grosso, M., Møller, J., Martinez Sanchez, J., Magnani, S., Christensen, T.H. (2014). 16
Environmental evaluation of plastic waste management scenarios. Resources, Conservation 17
and Recycling 85, 42-53. 18
Rihko-Struckmann, L.K., Peschel, A., Hanke-Rauschenbach, R., Sundmacher, K. (2010). Assessment of 19
methanol synthesis utilizing exhaust CO2 for chemical storage of electrical energy. Industrial 20
and Engineering Chemical Research 49:11073–11078. 21
Rosenbaum, R.K., Anton, A., Bengoa, X. et al. (2015). The Glasgow consensus on the delineation 22
between pesticide emission inventory and impact assessment for LCA. International Journal 23
of Life Cycle Assessment, 20:765. 24
Rossi, V., Cleeve-Edwards, N., Lundquist, L., Schenker, U., Dubois, C., Humbert, S., Jolliet, O. (2015). 25
Life cycle assessment of end-of-life options for two biodegradable packaging materials: 26
Sound application of the European waste hierarchy. Journal of Cleaner Production. 27
https://doi.org/10.1016/j.jclepro.2014.08.049. 28
Scarascia-Mugnozza, G., Sica, C., Russo, G. (2011). Plastic materials in European agriculture: actual 29
use and perspectives. J. Agric. Eng., 42 (2011), pp. 15-28, 10.4081/jae.2011.3.15. 30
Schiavoni, S., D'Alessandro, F., Bianchi, F. Asdrubali, F. (2016). Insulation materials for the building 31
sector: A review and comparative analysis, Renewable and Sustainable Energy Reviews 62, 32
988–1011. 33
Schmidt, J. H., Weidema, B. P., Brandao, M. (2015). A framework for modelling indirect land use 34
changes in Life Cycle Assessment. Journal of Cleaner Production. 35
Seppälä J., Posch M., Johansson M., Hettelingh J.P. (2006). Country-dependent Characterisation 36
Factors for Acidification and Terrestrial Eutrophication Based on Accumulated Exceedance as 37
an Impact Category Indicator. International Journal of Life Cycle Assessment 11(6): 403-416. 38
SOPA (2005). Factsheet, Recycling and Recovering Polyurethanes. Options in practice. Available at: 39
http://www.polyurethanes.org/uploads/documents/OptionsPractise.pdf. 40
Comparative LCA of alternative feedstock for plastics production – DRAFT FOR STAKEHOLDER CONSULTATION Part II
226
Steinmetz, Z., Wollmann, C., Schaefer, M., Buchmann, C., David, J., Tröger, J., Muñoz, K., Frör, O., 1
Schaumann,G E. (2016). Plastic mulching in agriculture. Trading short-term agronomic 2
benefits for long-term soil degradation? Science of The Total Environment, Vol. 550, Pages 3
690-705. https://doi.org/10.1016/j.scitotenv.2016.01.153. 4
Struijs J., Beusen A., van Jaarsveld H., Huijbregts M.A.J. (2009). Aquatic Eutrophication. Chapter 6 in: 5
Goedkoop M., Heijungs R., Huijbregts M.A.J., De Schryver A., Struijs J., Van Zelm R. (2009): 6
ReCiPe 2008 - A life cycle impact assessment method which comprises harmonised category 7
indicators at the midpoint and the endpoint level. Report I: Characterisation factors, first 8
edition. 9
Tarara, J.M. (2000). Microclimate modification with plastic mulch. Hortscience, 35 (2000), pp. 169-10
180. 11
Tonini, D., Hamelin, L., Astrup, T. F. (2016). Environmental implications of the use of agro-industrial 12
residues for biorefineries: application of a deterministic model for indirect land-use changes. 13
GCB Bioenergy, 8(4), pp. 690–706. doi: doi: 10.1111/gcbb.12290. 14
Tsiropoulos, I., Faaij, A.P.C., Seabra, J.E.A., Lundquist, L., Schenker, U., Briois, J-F., Patel, M.K. (2014). 15
Life cycle assessment of sugarcane ethanol production in India in comparison to Brazil. The 16
International Journal of Life Cycle Assessment 9(5), pp. 1049-1067. 17
Valin, H. et al. (2015). The land use change impact of biofuels in the EU: Quantification of area and 18
greenhouse gas impacts, Pp, p. 261. Available at: 19
https://ec.europa.eu/energy/sites/ener/files/documents/Final 20
Report_GLOBIOM_publication.pdf. 21
Van Oers L., de Koning A., Guinee J.B., Huppes G. (2002). Abiotic Resource Depletion in LCA. Road 22
and Hydraulic Engineering Institute, Ministry of Transport and Water, Amsterdam. 23
Van Zelm R., Huijbregts M.A.J., Den Hollander H.A., Van Jaarsveld H.A., Sauter F.J., Struijs J., Van 24
Wijnen H.J., Van de Meent D. (2008). European characterisation factors for human health 25
damage of PM10 and ozone in life cycle impact assessment. Atmospheric Environment 42, 26
441-453. 27
von der Assen, N. Bardow, A. (2014). Life cycle assessment of polyols for polyurethane production 28
using CO2 as feedstock: insights from an industrial case study. Green Chem. 29
https://doi.org/10.1039/C4GC00513A 30
WMO (1999). Scientific Assessment of Ozone Depletion: 1998. Global Ozone Research and 31
Monitoring Project - Report No. 44, ISBN 92-807-1722-7, Geneva. 32
Xiang, D., Yang, S., Liu, X., Mai, Z., Qian, Y. (2014). Techno-economic performance of the coal-to-33
olefins process with CCS. Chemical Engineering Journal 240: 45–54. 34
35
36

Comparative LCA of alternative feedstock for plastics production – DRAFT FOR STAKEHOLDER CONSULTATION Part II
227
Annex A. Selection criteria for and list of selected plastic articles 1
2
A.1 Introduction 3
4 Based on the overall project priorities and objectives of the "Comparative Life-Cycle Assessment alternative 5 feedstock for plastics production", including the policy relevance in the framework of the EU Plastic Strategy 6 (European Commission, 2018a), a set of criteria was defined for the selection of relevant plastic articles17 to be 7 investigated in this LCA project. One of these objectives is to compare, from an LCA perspective, different articles 8 made of different polymers obtained from either fossil-based polymers or alternatives feedstocks, i.e. recycled 9 plastic waste, biomass or CO2. The application of a selection methodology aimed at identifying five candidate 10 articles for the initial screening LCA and at proposing ten additional candidate articles to be considered for the 11 final LCA case studies, to be carried out after the stakeholder consultation. 12 13 In order to apply an appropriate methodology for the selection of relevant plastic articles, different aspects were 14 taken into account, such as: 15
the market potential of alternative feedstock plastic polymers or articles, including market trends and 16 criticality; 17
the different market sectors where polymers or articles are used; 18
the promise for deployment including technology readiness levels of plastic article manufacturing; 19
the availability and quality of techno-scientific data needed for the LCA analysis; 20
the relevance of End of Life (EoL) scenarios; 21
the article intended lifetime and durability; 22
the use of flexible vs rigid plastic articles; and 23
the recyclability of waste plastics. 24 25 The work focuses on alternative feedstock plastic articles, not on polymers, building blocks or products more 26 complex than plastic articles products. However, it has to be underlined that market data on alternative feedstock 27 plastic articles are not publicly available. Therefore, statistics on bio-based polymers, both at worldwide ((European 28 Bioplastics, 2017), (Aeschelmann & Carus, 2017) and EU level (Spekreijse, Lammens, Parisi, Ronzon, & Vis, 2018) (in 29 press), were used to understand the market of bio-based articles, while a French study on recycled plastic waste-30 based polymers (Deloitte & Touche, 2015) was referred to for understanding the market of recycled articles. No 31 data on the CO2-based polymers or articles were publicly available. 32 33 According to literature (European Bioplastics, 2017), (Aeschelmann & Carus, 2017), (Deloitte & Touche, 2015), 34 alternative feedstock plastic articles and polymers are reported in the following market sectors: 35
agriculture and horticulture; 36
automotive and transport; 37
building and construction; 38
consumer goods; 39
electrics and electronics; 40
flexible packaging; 41
rigid packaging; and 42
textiles. 43 44 Alternative feedstock plastic articles and polymers are mentioned and analysed in several scientific papers, studies, 45 reports and projects (see Table A.4), and particularly in the followings: 46
BIO-SPRI study (Bio-spri, 2018); 47
17 “article: means an object which during production is given a special shape, surface or design which determines its function to a greater degree than does its chemical composition” (Article 3(3) of REACH)

Comparative LCA of alternative feedstock for plastics production – DRAFT FOR STAKEHOLDER CONSULTATION Part II
228
Market studies, including (European Bioplastics, 2017), (Aeschelmann & Carus, 2017), (Molenveld, van den 1 Oever, & Bos, 2015), (Van Den Oever, Molenveld, Van Der Zee, & Bos, 2017), (Deloitte & Touche, 2015), 2 (OECD, 2017), (HCGA, 2009), (Kaeb, Aeschelmann, Dammer, & Carus, 2016), (Dommermuth & Raschka, 3 2015); 4
research projects and studies, including H2020 projects, such as (Spekreijse et al., 2018), (Open-Bio, 2018), 5 (STAR-ProBio, 2018), (BioMotive, 2018), (RefuCoat, 2018), (BARBARA, 2018), (Polybioskin, 2018), (BioBarr, 6 2018), (Embraced, 2018), (PEFerence, 2018); 7
the JRC - meta-analysis for this plastics LCA work. 8 9 The methodology developed in this study was partially based on the Bio-spri study, which was carried out for DG 10 RTD (Task 1 of contract "Support to R&l policy in the area of bio-based products and services") (Bio-spri, 2018). In 11 the Bio-spri study, a number of main criteria have been defined and further broken down into sub-criteria, as 12 summarised as follows: 13
Market potential: types of jobs created, number of jobs created, market size/volume in specific sectors in 14 terms of total amount of products and incomes, relative projected market growth. 15
Promise for deployment: projected availability of feedstock (in terms of volume required, length of supply 16 response and eventual technical/environmental/economic supply restrictions), possibility of exchanging 17 the feedstock with a residual feedstock, development status of technology, ensuring food security and 18 safety. 19
Available data: LCIA data on potential environmental impacts, Life cycle inventory data about feedstock, 20 Life cycle inventory data about conversion technology, Life cycle inventory data about EoL scenarios, 21 product with innovative functionalities, new collaborations to enhancing synergies and coherence as 22 compared to the production of the fossil based reference product. 23
Innovation: use of scarce resources. 24
Potential sustainability benefits: direct and indirect land use change, relevance for key policies. 25 26 In the Bio-spri study, the relevance and consequent prioritisation of the case studies were determined using a 27 scoring model where the individual sub-criteria of each potential case study were assigned a score varying from 0 28 (worst case, no data) to 3 (best case, well documented data and best performances). According to the Authors of 29 the Bio-spri study, most of the scores resulted from relevant EU projects on bio-products, EU frameworks and 30 regulations or from the authors' experience on the subject. Unfortunately, references on specific database used for 31 the case studies and criteria where not provided for all the set of considered products and criteria. 32 33 Nevertheless, the Bio-spri provided useful information on biomass feedstock based plastic articles to be included in 34 this study, namely: clips, binders and seeding pots; food rigid packaging – food containers; single-use carrier bags; 35 beverage (PET) bottles; carpet; food packaging film; single-use cups for cold drinks; agriculture mulching film; 36 lubricants; single-use cutlery. 37 38 In the Plastics LCA work, a scoring model similar to the one developed in the Bio-spri study was applied for the 39 selection of the relevant case studies (see Section A.2). However, it was also considered that the objectives are 40 different between the two studies. For example, alternative feedstocks other than biomass, such as recycled 41 plastics or CO2-based plastics, were included in the Plastics LCA work. Furthermore, documented thresholds were 42 used in the scoring system. 43 44 Therefore, compared to the Bio-spri study, the following actions are taken: 45
the criteria were consequently adapted and simplified, in order to build a reproducible selection 46 methodology based on different aspects, such as policy priority, market potential (for polymers), promise 47 for deployment, LCA studies and EoL scenarios; 48
the scoring system was also simplified by considering only two scores/options: 0=no priority, 1= priority; 49
some criteria were not retained, such as the ones more relevant for research and innovation studies (e.g. 50 the relative projected market growth or policy opportunity), the ones that were already covered under 51

Comparative LCA of alternative feedstock for plastics production – DRAFT FOR STAKEHOLDER CONSULTATION Part II
229
other criteria (such as the LCIA data on potential environmental impacts) or the ones that were already 1 covered in other part of the study (e.g. ensuring food security and safety). 2
3 Finally, additional criteria were applied to the entire set of articles to achieve a balanced group of case studies 4 allowing a good coverage of the relevant scenarios regarding aspects like coverage of single use items, and 5 biodegradable products, short lived articles vs long lived articles, etc. (see Section A.3). These additional criteria 6 were not used in the scoring, but used as a second-step checking exercise aiming at avoiding duplicates, selection 7 of i.e. similar articles, polymers and life-cycles, and thus promoting a more balanced group of case studies. 8 9 Based on the proposed criteria, a preselection of 15 articles was made, ranked in order of relevance for further 10 study. Five articles were selected for the initial screening LCAs, whereas a supplementary list of 10 articles was 11 suggested as candidate articles to be considered for the identification of the ten final LCA case studies. This list 12 may be subject to changes based on the input received during the stakeholders' consultation (see Section A.4) and 13 from a policy relevance perspective. 14 15 16
A.2 Criteria for the scoring of relevant plastic articles 17
18 The criteria and sub-criteria defined for the selection of relevant plastic articles and the scoring system are 19 described below. 20 21 a) Policy priority 22
Priority was given to articles other than the ones already covered by relevant existing EU legislation, such as 23 lightweight plastic carrier bags considered in Directive 2015/720 (European Parliament and Council of the 24 European Union, 2015), or by other initiatives, such as straws or tableware proposed for ban from the market 25 by the proposed Single Use Plastic Directive (European Commission, 2018b). 26
27 b) Market potential 28
29 b.1) Market size of bio-based polymers 30
Priority was given to the ten bio-based polymers with higher production capacities in the different market 31 sectors. Because the production capacities of bio-based polymers at European level were not available for 32 the entire set of the polymers considered in the analysis, global production data were taken into 33 consideration (European Bioplastics, 2017) (Aeschelmann & Carus, 2017). 34 35
b.2) Market size of recycled plastic waste-based polymers 36
Priority was given to the main recycled plastic waste-based polymers used in the different market sectors. 37 Because data at European level could not be found, statistics on recycled plastic waste-based polymers 38 provided by a French study was considered (Deloitte & Touche, 2015). 39 40
The market size of CO2-based polymers was not analysed, because statistics on these polymers were not 41 publicly available. 42 43 b.3) Identifying market trend 44
Priority was given to bio-based polymers with an expected positive trend from 2016 to 2021. Because the 45 production capacities of bio-based polymers at European level were not available for the entire set of 46 polymers considered in the analysis, global production data have been considered (Aeschelmann & Carus, 47 2017). Market trend data on recycled plastic waste-based polymers or CO2-based polymers were not 48 available. 49
50 b.4) Market criticality 51
Priority was given to critical alternative polymers that are mainly imported, i.e. a polymer was defined 52 critical when its import was at least equal to 50% w/w of its consumption. Market criticality of bio-based 53
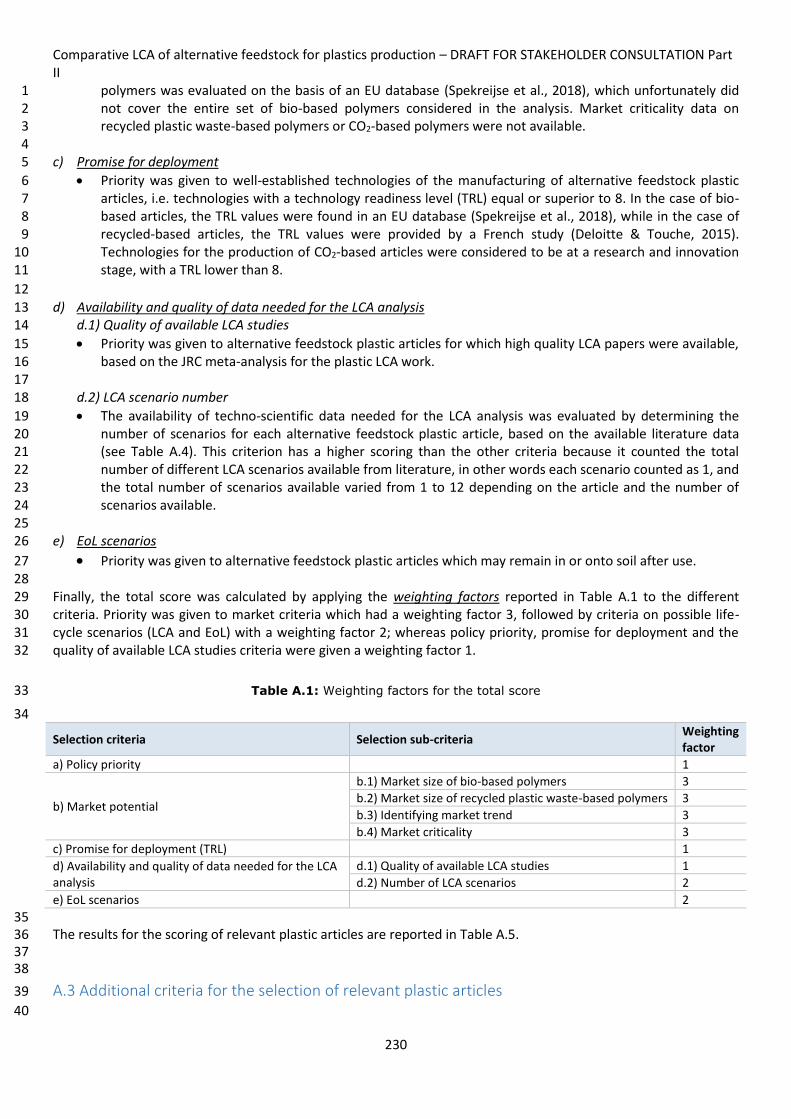
Comparative LCA of alternative feedstock for plastics production – DRAFT FOR STAKEHOLDER CONSULTATION Part II
230
polymers was evaluated on the basis of an EU database (Spekreijse et al., 2018), which unfortunately did 1 not cover the entire set of bio-based polymers considered in the analysis. Market criticality data on 2 recycled plastic waste-based polymers or CO2-based polymers were not available. 3
4 c) Promise for deployment 5
Priority was given to well-established technologies of the manufacturing of alternative feedstock plastic 6 articles, i.e. technologies with a technology readiness level (TRL) equal or superior to 8. In the case of bio-7 based articles, the TRL values were found in an EU database (Spekreijse et al., 2018), while in the case of 8 recycled-based articles, the TRL values were provided by a French study (Deloitte & Touche, 2015). 9 Technologies for the production of CO2-based articles were considered to be at a research and innovation 10 stage, with a TRL lower than 8. 11
12 d) Availability and quality of data needed for the LCA analysis 13
d.1) Quality of available LCA studies 14
Priority was given to alternative feedstock plastic articles for which high quality LCA papers were available, 15 based on the JRC meta-analysis for the plastic LCA work. 16
17 d.2) LCA scenario number 18
The availability of techno-scientific data needed for the LCA analysis was evaluated by determining the 19 number of scenarios for each alternative feedstock plastic article, based on the available literature data 20 (see Table A.4). This criterion has a higher scoring than the other criteria because it counted the total 21 number of different LCA scenarios available from literature, in other words each scenario counted as 1, and 22 the total number of scenarios available varied from 1 to 12 depending on the article and the number of 23 scenarios available. 24
25 e) EoL scenarios 26
Priority was given to alternative feedstock plastic articles which may remain in or onto soil after use. 27 28 Finally, the total score was calculated by applying the weighting factors reported in Table A.1 to the different 29 criteria. Priority was given to market criteria which had a weighting factor 3, followed by criteria on possible life-30 cycle scenarios (LCA and EoL) with a weighting factor 2; whereas policy priority, promise for deployment and the 31 quality of available LCA studies criteria were given a weighting factor 1. 32
Table A.1: Weighting factors for the total score 33
34
Selection criteria Selection sub-criteria Weighting factor
a) Policy priority 1
b) Market potential
b.1) Market size of bio-based polymers 3
b.2) Market size of recycled plastic waste-based polymers 3
b.3) Identifying market trend 3
b.4) Market criticality 3
c) Promise for deployment (TRL) 1
d) Availability and quality of data needed for the LCA analysis
d.1) Quality of available LCA studies 1
d.2) Number of LCA scenarios 2
e) EoL scenarios
2
35 The results for the scoring of relevant plastic articles are reported in Table A.5. 36 37 38
A.3 Additional criteria for the selection of relevant plastic articles 39
40

Comparative LCA of alternative feedstock for plastics production – DRAFT FOR STAKEHOLDER CONSULTATION Part II
231
In order to ensure a balanced coverage of the relevant scenarios, the criteria described in this Section were 1 additionally applied to the entire set of case studies. These additional criteria were not used in the scoring, but 2 rather as discriminatory criteria, applied in a second-step and aiming at avoiding duplicates, i.e. selection of similar 3 articles: similar polymers, markets, uses and life-cycle scenarios). 4 5 6 f) EoL aspects including littering 7
f.1) Littering (marine) 8
Priority was given to the ten single-use plastic items considered by the proposed Single Use Plastic 9 Directive (European Commission, 2018b). 10
The target was to have at least two, ideally three, candidate articles for the initial screening LCAs with a 11 marine littering potential. 12
13 f.2) Expected lifetime/durability 14
The objective was to have a balanced variety of expected lifetimes, in order to include both single use and 15 disposable articles (such as packaging), and durable articles used, for example, in the building and 16 construction or in the automotive sector. To this aim, the lifetime of the different articles was categorised 17 as follows: short if lower than one year, long if varying from one to ten years and very long if greater than 18 ten years. 19
The target was to have three candidate articles for the initial screening LCAs with short lifetime and two 20 with long, or very long, lifetime. 21
22 f.3) Recyclability 23
Priority was given to recyclable alternative feedstock plastic articles or polymers. 24
The target was to have at least two, ideally three, candidate articles for the initial screening LCAs with high 25 recyclability properties. 26
27 f.4) Bio-degradability 28
Priority was given to biodegradable alternative feedstock plastic articles or polymers. 29
The target was to have ideally two candidate articles for the initial screening LCAs with biodegradable 30 properties. It was not possible to differentiate between biodegradability in nature and biodegradability in 31 technical systems, due to the lack of data. 32
33 g) Uses 34
g.1) Single use vs multiples use 35
The objective was to have a balanced variety of single use and multiple use articles. To this aim, articles 36 were classified as single use articles when meeting the definition provided in the proposed Single Use 37 Plastic Directive (European Commission, 2018b). Other articles were classified as multiple use. 38
The target was to have at least three candidate articles for the initial screening LCAs categorised as single 39 use. 40
41 g.2) Rigid vs flexible options 42
The objective was to have a balanced variety of flexible and rigid options (such as flexible packaging versus 43 rigid packaging). 44
The target was to have at least one candidate article for the initial screening LCAs categorised as flexible. 45 46 h) Market coverage 47
h.1) Import dependency 48
The import dependency was already analysed under point b.4) market criticality (see Section A.2). 49
The target of the additional market coverage criteria was to have at least two candidate articles for the 50 initial screening LCAs with high import dependency. 51
52
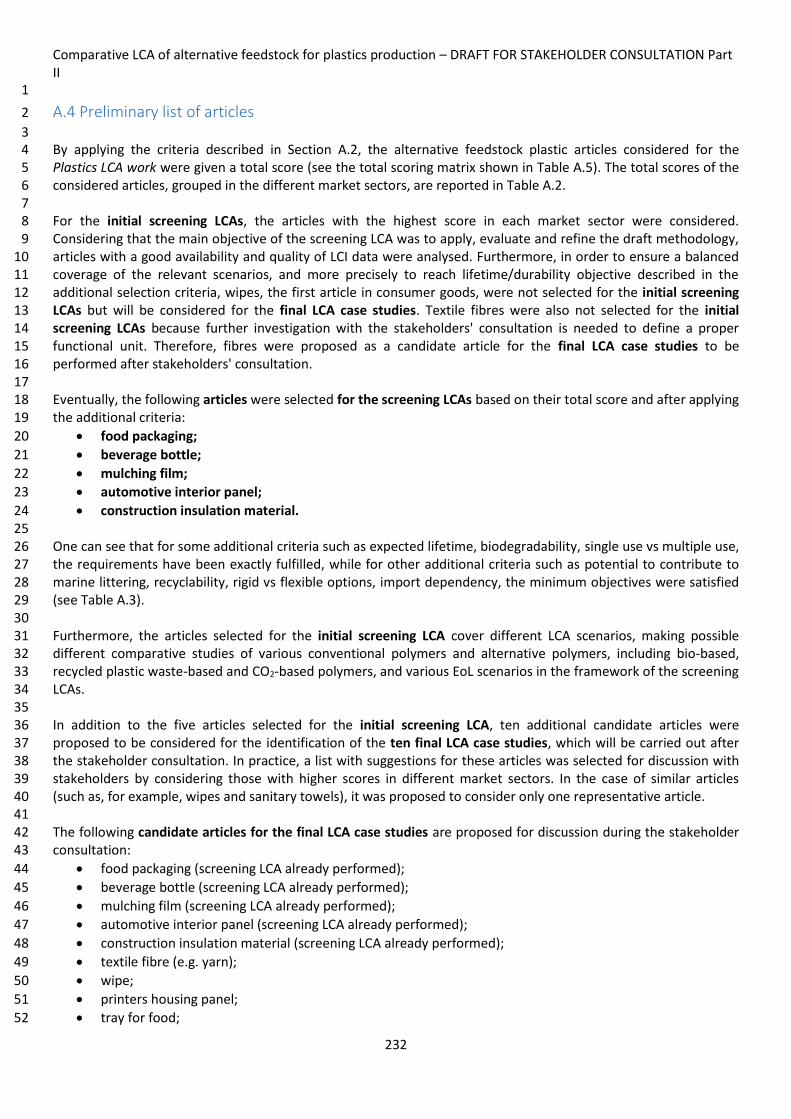
Comparative LCA of alternative feedstock for plastics production – DRAFT FOR STAKEHOLDER CONSULTATION Part II
232
1
A.4 Preliminary list of articles 2
3 By applying the criteria described in Section A.2, the alternative feedstock plastic articles considered for the 4 Plastics LCA work were given a total score (see the total scoring matrix shown in Table A.5). The total scores of the 5 considered articles, grouped in the different market sectors, are reported in Table A.2. 6 7 For the initial screening LCAs, the articles with the highest score in each market sector were considered. 8 Considering that the main objective of the screening LCA was to apply, evaluate and refine the draft methodology, 9 articles with a good availability and quality of LCI data were analysed. Furthermore, in order to ensure a balanced 10 coverage of the relevant scenarios, and more precisely to reach lifetime/durability objective described in the 11 additional selection criteria, wipes, the first article in consumer goods, were not selected for the initial screening 12 LCAs but will be considered for the final LCA case studies. Textile fibres were also not selected for the initial 13 screening LCAs because further investigation with the stakeholders' consultation is needed to define a proper 14 functional unit. Therefore, fibres were proposed as a candidate article for the final LCA case studies to be 15 performed after stakeholders' consultation. 16 17 Eventually, the following articles were selected for the screening LCAs based on their total score and after applying 18 the additional criteria: 19
food packaging; 20
beverage bottle; 21
mulching film; 22
automotive interior panel; 23
construction insulation material. 24 25 One can see that for some additional criteria such as expected lifetime, biodegradability, single use vs multiple use, 26 the requirements have been exactly fulfilled, while for other additional criteria such as potential to contribute to 27 marine littering, recyclability, rigid vs flexible options, import dependency, the minimum objectives were satisfied 28 (see Table A.3). 29 30 Furthermore, the articles selected for the initial screening LCA cover different LCA scenarios, making possible 31 different comparative studies of various conventional polymers and alternative polymers, including bio-based, 32 recycled plastic waste-based and CO2-based polymers, and various EoL scenarios in the framework of the screening 33 LCAs. 34 35 In addition to the five articles selected for the initial screening LCA, ten additional candidate articles were 36 proposed to be considered for the identification of the ten final LCA case studies, which will be carried out after 37 the stakeholder consultation. In practice, a list with suggestions for these articles was selected for discussion with 38 stakeholders by considering those with higher scores in different market sectors. In the case of similar articles 39 (such as, for example, wipes and sanitary towels), it was proposed to consider only one representative article. 40 41 The following candidate articles for the final LCA case studies are proposed for discussion during the stakeholder 42 consultation: 43
food packaging (screening LCA already performed); 44
beverage bottle (screening LCA already performed); 45
mulching film (screening LCA already performed); 46
automotive interior panel (screening LCA already performed); 47
construction insulation material (screening LCA already performed); 48
textile fibre (e.g. yarn); 49
wipe; 50
printers housing panel; 51
tray for food; 52
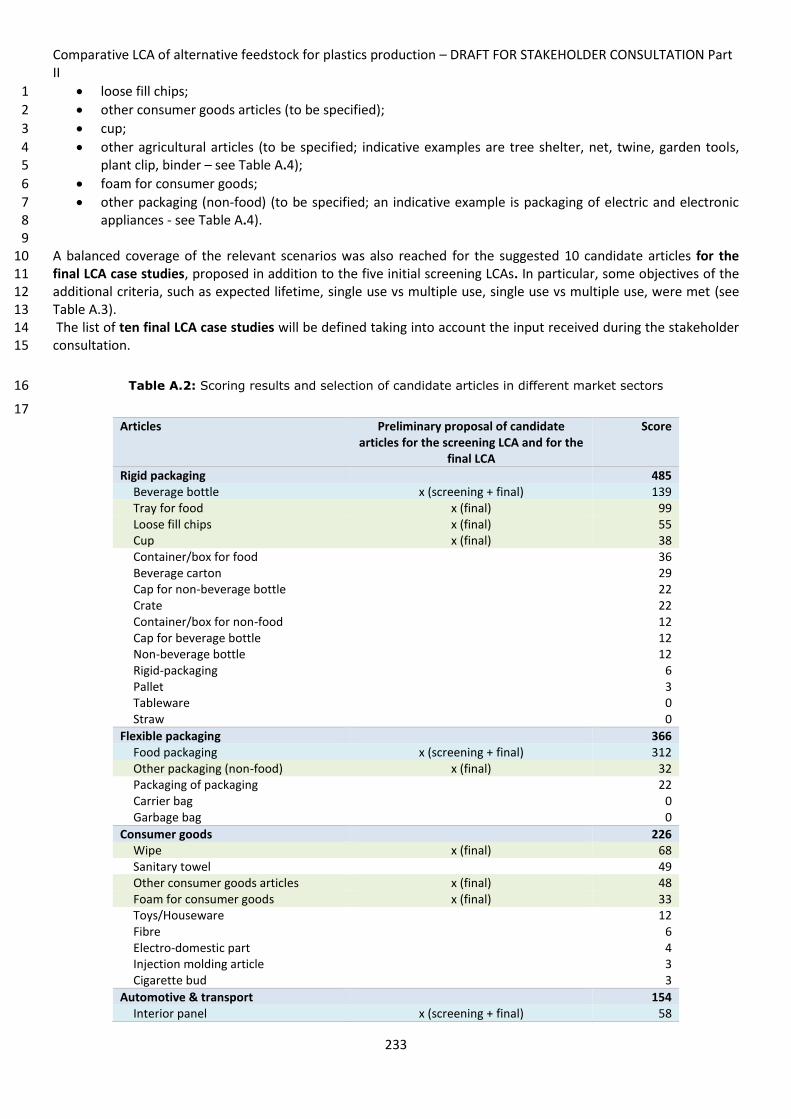
Comparative LCA of alternative feedstock for plastics production – DRAFT FOR STAKEHOLDER CONSULTATION Part II
233
loose fill chips; 1
other consumer goods articles (to be specified); 2
cup; 3
other agricultural articles (to be specified; indicative examples are tree shelter, net, twine, garden tools, 4 plant clip, binder – see Table A.4); 5
foam for consumer goods; 6
other packaging (non-food) (to be specified; an indicative example is packaging of electric and electronic 7 appliances - see Table A.4). 8
9 A balanced coverage of the relevant scenarios was also reached for the suggested 10 candidate articles for the 10 final LCA case studies, proposed in addition to the five initial screening LCAs. In particular, some objectives of the 11 additional criteria, such as expected lifetime, single use vs multiple use, single use vs multiple use, were met (see 12 Table A.3). 13 The list of ten final LCA case studies will be defined taking into account the input received during the stakeholder 14 consultation. 15
Table A.2: Scoring results and selection of candidate articles in different market sectors 16
17 Articles Preliminary proposal of candidate
articles for the screening LCA and for the final LCA
Score
Rigid packaging 485 Beverage bottle x (screening + final) 139 Tray for food x (final) 99 Loose fill chips x (final) 55 Cup x (final) 38 Container/box for food 36 Beverage carton 29 Cap for non-beverage bottle 22 Crate 22 Container/box for non-food 12 Cap for beverage bottle 12 Non-beverage bottle 12 Rigid-packaging 6 Pallet 3 Tableware 0 Straw 0
Flexible packaging 366 Food packaging x (screening + final) 312 Other packaging (non-food) x (final) 32 Packaging of packaging 22 Carrier bag 0 Garbage bag 0
Consumer goods 226 Wipe x (final) 68 Sanitary towel 49 Other consumer goods articles x (final) 48 Foam for consumer goods x (final) 33 Toys/Houseware 12 Fibre 6 Electro-domestic part 4 Injection molding article 3 Cigarette bud 3
Automotive & transport 154 Interior panel x (screening + final) 58
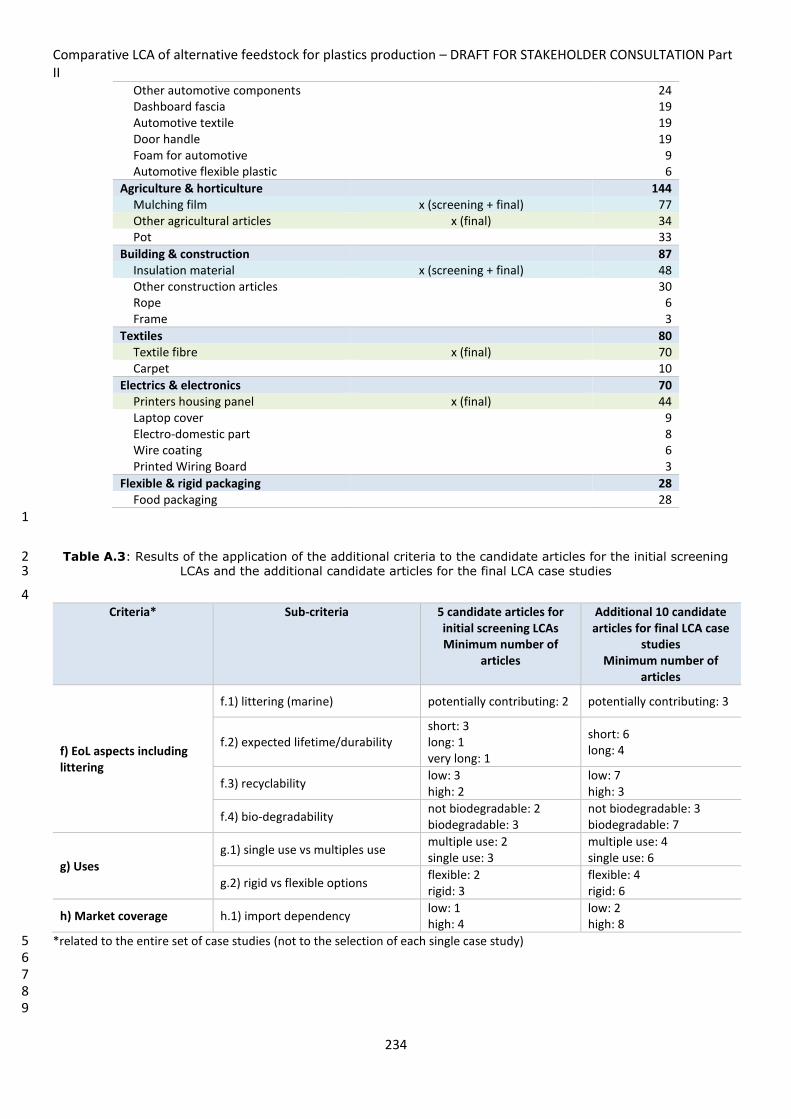
Comparative LCA of alternative feedstock for plastics production – DRAFT FOR STAKEHOLDER CONSULTATION Part II
234
Other automotive components 24 Dashboard fascia 19 Automotive textile 19 Door handle 19 Foam for automotive 9 Automotive flexible plastic 6
Agriculture & horticulture 144 Mulching film x (screening + final) 77 Other agricultural articles x (final) 34 Pot 33
Building & construction 87 Insulation material x (screening + final) 48 Other construction articles 30 Rope 6 Frame 3
Textiles 80 Textile fibre x (final) 70 Carpet 10
Electrics & electronics 70 Printers housing panel x (final) 44 Laptop cover 9 Electro-domestic part 8 Wire coating 6 Printed Wiring Board 3
Flexible & rigid packaging 28 Food packaging 28
1
Table A.3: Results of the application of the additional criteria to the candidate articles for the initial screening 2 LCAs and the additional candidate articles for the final LCA case studies 3
4 Criteria* Sub-criteria 5 candidate articles for
initial screening LCAs Minimum number of
articles
Additional 10 candidate articles for final LCA case
studies Minimum number of
articles
f) EoL aspects including littering
f.1) littering (marine) potentially contributing: 2 potentially contributing: 3
f.2) expected lifetime/durability short: 3 long: 1 very long: 1
short: 6 long: 4
f.3) recyclability low: 3 high: 2
low: 7 high: 3
f.4) bio-degradability not biodegradable: 2 biodegradable: 3
not biodegradable: 3 biodegradable: 7
g) Uses
g.1) single use vs multiples use multiple use: 2 single use: 3
multiple use: 4 single use: 6
g.2) rigid vs flexible options flexible: 2 rigid: 3
flexible: 4 rigid: 6
h) Market coverage h.1) import dependency low: 1 high: 4
low: 2 high: 8
*related to the entire set of case studies (not to the selection of each single case study) 5 6 7 8 9

Comparative LCA of alternative feedstock for plastics production – DRAFT FOR STAKEHOLDER CONSULTATION Part II
235
Table A.4: Alternative feedstock plastic articles available in different market sectors and considered in the 1 Plastics LCA work, including additional examples and references 2
Mar
ket
Sect
or
Article Alternative polymer
Additional examples References
Agr
icu
ltu
re &
ho
rtic
ult
ure
Mulching film
PLA (Open-Bio, 2018)
bio-PBAT (Aeschelmann & Carus, 2017), (Bilck, Grossmann, & Yamashita, 2010)
bio-PBS (Aeschelmann & Carus, 2017), (Succinity, 2013)
kenaf-based polymer (Wolfensberger & Dinkel, 1997)
Starch blends (Bio-spri, 2018), (Valpack Consulting Consortium, 2010), (Open-Bio, 2018), (STAR-ProBio, 2018)
Other agricultural articles
PLA Tree shelter (tubes used to protect young seedlings)
(Arnold & Alston, 2012)
r-PP Net, twine (Molenveld et al., 2015)
Starch blends Garden tool, plant clip, binder, plant protecting structure, terratube
(Bio-spri, 2018), (Spekreijse et al., 2018), (Biopolymers, 2018)
Pot
PLA (Molenveld et al., 2015)
PLA-E (Molenveld et al., 2015)
Starch blends (Bio-spri, 2018), (Spekreijse et al., 2018)
Au
tom
oti
ve &
tra
nsp
ort
Automotive flexible plastic
bio-PET Headliner, floor mat, sun visor (European Bioplastics, 2017)
bio-PUR Regenerated fibre for textile for covering vehicles seats
(BioMotive, 2018)
Automotive textile
bio-PE Interior fabrics (European Bioplastics, 2017)
Dashboard fascia bio-PUR (BioMotive, 2018)
bio-PA (BARBARA, 2018)
Door handle bio-PUR (BioMotive, 2018)
bio-PA (BARBARA, 2018)
Foam for automotive
bio-PUR Foam for seat (BioMotive, 2018)
Interior panel
PLA Panel for aircraft interiors (Vidal et al., 2018)
Hemp-based (66%v)+epoxy resin(34%v) + hardener
Interior side panel (Wötzel, Wirth, & Flake, 1999)
Linseedoil–based Panel for aircraft interiors (Vidal et al., 2018)
bio-PBS
(Aeschelmann & Carus, 2017), (Succinity, 2013)
bio-PP (flax reinforced) Under-floor panel (Diener & Siehler, 1999)
Other automotive components
PHA (Spekreijse et al., 2018), (bio-on, 2018)
PHB (Aeschelmann & Carus, 2017)
r-PP (Deloitte & Touche, 2015)
Bu
ildin
g &
co
nst
ruct
ion
Frame Starch blends
(STAR-ProBio, 2018)
Insulation material
bio-PUR Coating material (Gonzalez-Garay, Gonzalez-Miquel, & Guillen-Gosalbez, 2017)
PLA
(Aeschelmann & Carus, 2017)
bio-fibres Pre manufactured components/insulation: bio-fibre based insulation mats
(Open-Bio, 2018)
Miscanthus
(Uihlein, Ehrenberger, & Schebek, 2008)
Other construction articles
bio-PE Molds for resin transfer moulding, truss joint prototype
(BARBARA, 2018)
r-PE (HD-MD) (Deloitte & Touche, 2015)
r-PP (Deloitte & Touche, 2015)
Rope bio-PA (Aeschelmann & Carus, 2017)
Co
nsu
me
r go
od
s
Cigarette bud Starch blends (Aeschelmann & Carus, 2017), (HCGA, 2009)
Electro-domestic part
CO2-based PPC Part for a vacuum cleaner or a refrigerator (Dommermuth & Raschka, 2015)
Fibre bio-PA
Foam for consumer goods
PLA Particleboard (traditional and ultralight with an expanded foam core)
(Ganne-Chdeville & Diederichs, 2015)
bio-PUR
(Aeschelmann & Carus, 2017)
Starch blends Foam for washing machine port-hole spacer, foam display board
(Razza et al., 2015), (Guo, Stuckey, & Murphy, 2013; Guo, Trzcinski, Stuckey, & Murphy, 2011)
Injection molding article
bio-PBS Coffee capsule, tableware, cup (Aeschelmann & Carus, 2017), (MCPP, 2016)
Other consumer goods articles
r-PE (HD-MD) (Deloitte & Touche, 2015)
r-PE (LD-LLD) (Deloitte & Touche, 2015)

Comparative LCA of alternative feedstock for plastics production – DRAFT FOR STAKEHOLDER CONSULTATION Part II
236
r-PP (Deloitte & Touche, 2015)
r-PS (Deloitte & Touche, 2015)
Sanitary towel
PLA Sanitary towel, nappy, dressing, Absorbent Hygiene Products (AHP)
(Aeschelmann & Carus, 2017), (NatureWorks, 2018) , (Polybioskin, 2018), (Hakala Yrjö; Meinander, Kerstin; Tanner, Toini & (VTT), 1997), (Vink & Davies, 2015)
PHA Sanitary towel, nappy, dressing (Polybioskin, 2018)
PHB Absorbent Hygiene Products (AHP) (BioMotive, 2018)
Starch blends Super Adsorbent Polymer (SAP) for nappy (Aeschelmann & Carus, 2017), (McIntyre, 2017)
Toys/Houseware bio-PE
(Aeschelmann & Carus, 2017)
Wipe
PLA Wet wipe, flushable and dispersible wet baby wipe, dressings
(Aeschelmann & Carus, 2017), (Butschli, 2008), (Total-Corbion, 2018), (NatureWorks, 2018), (Polybioskin, 2018), (Vink & Davies, 2015)
PHA Wipe, dressings (Polybioskin, 2018)
PHB Absorbent Hygiene Products (AHP) (Embraced, 2018)
Chitosan Wipe, dressings (Polybioskin, 2018)
Starch blends Wipe, dressings (Polybioskin, 2018)
Ele
ctri
cs &
ele
ctro
nic
s
Electro-domestic part
PHA Electronic part (Spekreijse et al., 2018), (bio-on, 2018)
Laptop cover PLA
(Meyer & Katz, 2016), (Valpack Consulting Consortium, 2010)
Printed Wiring Board
lignin-epoxy blend PBW (Kosbar, Gelorme, Japp, & Fotorny, 2000)
PLA Electronic part (Broeren et al., 2016)
bio-PTT Electronic part (Broeren et al., 2016)
bio-PP/natural fibre Electronic part (Broeren et al., 2016)
r-PP (Deloitte & Touche, 2015)
Wire coating bio-PA (Aeschelmann & Carus, 2017)
Fle
xib
le &
rig
id
pac
kagi
ng
Food packaging PHA, PHA/PLA Barrier film and rigid packaging for food with enhanced barrier properties
(BioBarr, 2018)
Fle
xib
le p
acka
gin
g
Carrier bag
PLA
(Molenveld et al., 2015), (Mattila, Kujanpää, Dahlbo, Soukka, & Myllymaa, 2011), (F. Gironi & Piemonte, 2010), (BASF, 2014), (Mueller, Humbert, & Colin, 2017), (Chaffee & Yaros, 2007)
bio-PE (HD) (Parker & Edwards, 2012)
bio-PE (Molenveld et al., 2015), (Bio-spri, 2018)
r-PET (Bisinella, Albizzati, Astrup, & Damgaard, 2018)
PHA (Khoo, Tan, & Chng, 2010a, 2010b)
Starch blends (Molenveld et al., 2015), (Bio-spri, 2018), (Fausto Gironi & Piemonte, 2011a), (Piemonte & Gironi, 2011), (Bisinella et al., 2018)
r-PE (Mattila et al., 2011)
r-PE (HD) (Dilli, 2007)
r-PE (LD) (Bisinella et al., 2018)
r-PE (LD-LLD) (Molenveld et al., 2015), (Deloitte & Touche, 2015)
bio-PET (Bisinella et al., 2018)
Food packaging
PLA
Barrier film and covering film for fresh solid food (meat/fish/cheese), barrier film non-perishable solid food (crisp, coffee), covering film and packaging for fresh solid food (fruit & vegetables, butter, bread, frozen food), packaging film for non-perishable solid food (biscuits, confectionery & chocolate), teabag, multilayer film
(Molenveld et al., 2015), (BioMotive, 2018), (Open-Bio, 2018), (Hermann, Blok, & Patel, 2010), (Benetto et al., 2015), (Petrucci et al., 2017), (Vidal et al., 2007), (Deng, Achten, Van Acker, & Duflou, 2013), (Rossi, Cleeve-Edwards et al. 2015) (Rossi et al., 2015), (Piemonte, 2011), (Valpack Consulting Consortium, 2010)
bio-PE
Packaging film for fresh solid food (bread), high water and medium oxygen barrier film, barrier film for non-perishable solid food (snacks)
(Bio-spri, 2018), (Molenveld et al., 2015), (RefuCoat, 2018), (Hermann et al., 2010), (Detzel, Knauertz, & Derreza-Greeven, 2013)
bio-PE laminate Packaging film for non-perishable liquid (sauces)
(Molenveld et al., 2015)
PHA (Spekreijse et al., 2018), (bio-on, 2018)
PHA, PGA (RefuCoat, 2018)
Starch blends Coffee capsule, tea bag, covering film and (Kaeb et al., 2016), (Molenveld et al., 2015),

Comparative LCA of alternative feedstock for plastics production – DRAFT FOR STAKEHOLDER CONSULTATION Part II
237
packaging for fresh solid food (fruit & vegetables, meat/fish/cheese), barrier film non-perishable solid food (snacks)
(Spekreijse et al., 2018), (Biopolymers, 2018), (Open-Bio, 2018), (STAR-ProBio, 2018)
bio-PET High water and medium oxygen barrier film
(RefuCoat, 2018)
Cellulose (Valpack Consulting Consortium, 2010)
Chitosan (Leceta, Etxabide, & Cabezudo, 2014; Leceta, Guerrero, Cabezudo, & De La Caba, 2013)
Wheat gluten powder Wheat-gluten-based (plasticized by glycerine)
(Deng et al., 2013)
bio-PP Barrier film for non-perishable solid food (snacks)
(Hermann et al., 2010)
Garbage bag
PLA (BASF, 2014)
bio-PE (Saibuatrong, Cheroennet, & Suwanmanee, 2017)
bio-PBAT/Starch (Saibuatrong et al., 2017)
Starch blends
(Valpack Consulting Consortium, 2010), (Estermann, 1998), (Estermann & Schwarzwälder, 1998)
Other packaging (non-food)
bio-PE Packaging of electric and electronic appliances
(Molenveld et al., 2015)
Starch blends Packaging of electric and electronic appliances
(Molenveld et al., 2015)
CO2-based PPC
(Dommermuth & Raschka, 2015)
Packaging of packaging
bio-PE Shrink film, stretch film (Molenveld et al., 2015)
Starch blends Film bowling (Spekreijse et al., 2018), (Biopolymers, 2018)
Rig
id p
acka
gin
g
Beverage bottle
bio-PE Bottle for liquid fresh food (milk, juice) (Molenveld et al., 2015)
PLA Bottle for liquid non-perishable food (water, beer), bottle for liquid fresh food (milk, juice)
(Molenveld et al., 2015), (Fausto Gironi &
Piemonte, 2010, 2011a, 2011b), (Meyer & Katz,
2016), (Papong et al., 2014), (Shen, Worrell, & Patel, 2012)
bio-PET Bottle for liquid non-perishable food (water, soft drink carbonated, beer, sauces)
(Molenveld et al., 2015), (Bio-spri, 2018), (Chen, Pelton, & Smith, 2016), (Valpack Consulting Consortium, 2010), (Shen et al., 2012)
r-PET
(OECD, 2017), (Deloitte & Touche, 2015), (Grand, Roux, & ELSEA, 2014), (Shen et al., 2012), (Thoden van Velzen. E.U., Brouwer, & Molenveld, 2016)
PHA Bottle for liquid non-perishable food (water, soft drink carbonated, beer)
(Spekreijse et al., 2018), (bio-on, 2018)
bio-PEF Bottle for liquid non-perishable food (water, soft drink carbonated, beer)
(Molenveld et al., 2015), (Bio-spri, 2018)
r-(bio)PET (Shen et al., 2012)
Beverage carton r-PET
(Stefanie Markwardt, Frank Wellenreuther, Andrea Drescher, Jonas Harth, & Mirjam Busch, 2017)
bio-PE (Stefanie Markwardt et al., 2017)
Cap for beverage bottle
bio-PE Cap for bottle for liquid fresh food (milk, juice)
(Molenveld et al., 2015)
Cap for non-beverage bottle
bio-PE Cap for non-food bottle (detergents) (Molenveld et al., 2015)
PHA Cap for personal care bottle/cosmetics (Molenveld et al., 2015)
Container/box for food
PLA
Container/box for solid non-perishable food (biscuits, confectionery & chocolate), container/box for solid fresh food (fruit & vegetables, yogurt), container/box for take away, bowl with a hinged lid
(Molenveld et al., 2015), (Spekreijse et al., 2018), (Synbra, 2018), (Leejarkpai, Mungcharoen, & Suwanmanee, 2016), (Lorite et al., 2017), (Madival, Auras, Singh, & Narayan, 2009), (Bohlmann, 2004), (Suwanmanee et al., 2013), (Cheroennet, Pongpinyopap, Leejarkpai, & Suwanmanee, 2018), (Kuczenski, Geyer, Trujillo, Bren, & Mortensen, 2012), (Detzel et al., 2013)
bio-PBS
(Cheroennet et al., 2018)
Starch blends Container/box for solid non-perishable food (confectionery & chocolate)
(Molenveld et al., 2015)
Container/box for non-food
PLA Container/box for electric & electronic appliances
(Molenveld et al., 2015)
Crate bio-PE
(Molenveld et al., 2015)
Starch blends Crate, musslecrate, container (Molenveld et al., 2015), (Spekreijse et al., 2018)
Cup PLA Cup for liquid non-perishable food (coffee, cold drink, hot drink)
(Molenveld et al., 2015), (Bio-spri, 2018), (Potting & van der Harst, 2015), (Uihlein et al., 2008), (Van
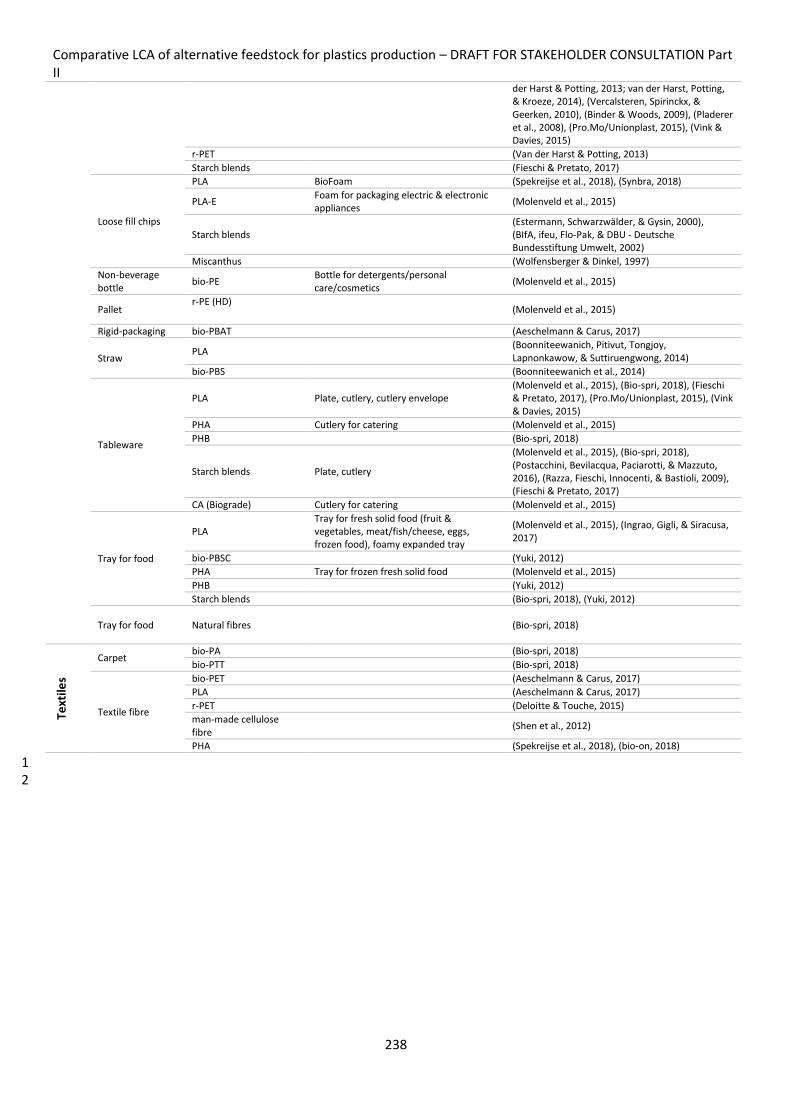
Comparative LCA of alternative feedstock for plastics production – DRAFT FOR STAKEHOLDER CONSULTATION Part II
238
der Harst & Potting, 2013; van der Harst, Potting, & Kroeze, 2014), (Vercalsteren, Spirinckx, & Geerken, 2010), (Binder & Woods, 2009), (Pladerer et al., 2008), (Pro.Mo/Unionplast, 2015), (Vink & Davies, 2015)
r-PET (Van der Harst & Potting, 2013)
Starch blends (Fieschi & Pretato, 2017)
Loose fill chips
PLA BioFoam (Spekreijse et al., 2018), (Synbra, 2018)
PLA-E Foam for packaging electric & electronic appliances
(Molenveld et al., 2015)
Starch blends (Estermann, Schwarzwälder, & Gysin, 2000), (BIfA, ifeu, Flo-Pak, & DBU - Deutsche Bundesstiftung Umwelt, 2002)
Miscanthus (Wolfensberger & Dinkel, 1997)
Non-beverage bottle
bio-PE Bottle for detergents/personal care/cosmetics
(Molenveld et al., 2015)
Pallet r-PE (HD)
(Molenveld et al., 2015)
Rigid-packaging bio-PBAT (Aeschelmann & Carus, 2017)
Straw PLA
(Boonniteewanich, Pitivut, Tongjoy, Lapnonkawow, & Suttiruengwong, 2014)
bio-PBS (Boonniteewanich et al., 2014)
Tableware
PLA Plate, cutlery, cutlery envelope (Molenveld et al., 2015), (Bio-spri, 2018), (Fieschi & Pretato, 2017), (Pro.Mo/Unionplast, 2015), (Vink & Davies, 2015)
PHA Cutlery for catering (Molenveld et al., 2015)
PHB
(Bio-spri, 2018)
Starch blends Plate, cutlery
(Molenveld et al., 2015), (Bio-spri, 2018), (Postacchini, Bevilacqua, Paciarotti, & Mazzuto, 2016), (Razza, Fieschi, Innocenti, & Bastioli, 2009), (Fieschi & Pretato, 2017)
CA (Biograde) Cutlery for catering (Molenveld et al., 2015)
Tray for food
PLA Tray for fresh solid food (fruit & vegetables, meat/fish/cheese, eggs, frozen food), foamy expanded tray
(Molenveld et al., 2015), (Ingrao, Gigli, & Siracusa, 2017)
bio-PBSC
(Yuki, 2012)
PHA Tray for frozen fresh solid food (Molenveld et al., 2015)
PHB (Yuki, 2012)
Starch blends (Bio-spri, 2018), (Yuki, 2012)
Tray for food Natural fibres (Bio-spri, 2018)
Text
iles
Carpet bio-PA (Bio-spri, 2018)
bio-PTT (Bio-spri, 2018)
Textile fibre
bio-PET
(Aeschelmann & Carus, 2017)
PLA
(Aeschelmann & Carus, 2017)
r-PET
(Deloitte & Touche, 2015)
man-made cellulose fibre
(Shen et al., 2012)
PHA
(Spekreijse et al., 2018), (bio-on, 2018)
1 2

Comparative LCA of alternative feedstock for plastics production – DRAFT FOR STAKEHOLDER CONSULTATION Part II
239
Table A.5: Scoring matrix of the alternative feedstock plastic articles 3
Article Feed-stock
Alternative polymer
Conventional polymer Market Sector a) b) c) d) e) Tot* Rank f) g)
b.1 b.2 b.3 b.4/ h.1
d.1 d.2 f.1 f.2 f.3 f.4 g.1 g.2
Food packaging Biomass PLA PE, PET, PP, PET/PE laminate, PP metallised
Flexible packaging 1 1 0 1 1 1 2 12 0 36 1 1 short 0 1 1 0
Food packaging Biomass bio-PE PE (LD), PP Flexible packaging 1 1 0 1 1 1 0 12 0 34 1 1 short 1 0 1 0
Food packaging Biomass bio-PE laminate
PE (HD) Flexible packaging 1 1 0 1 1 1 0 12 0 34 1 1 short 1 0 1 0
Food packaging Biomass PHA, PHA/PLA
PE (HD), PE (LD), PP Flexible & rigid packaging
1 0 0 1 0 1 0 12 0 28 1 1 short 0 1 1 0
Food packaging Biomass PHA PE (HD), PE (LD), PP Flexible packaging 1 0 0 1 0 1 0 12 0 28 1 1 short 0 1 1 0
Food packaging Biomass PHA, PGA PP, PET (metallised) Flexible packaging 1 0 0 1 0 1 0 12 0 28 1 1 short 0 1 1 0
Food packaging Biomass Starch blends
PE (LD), PET, PP, PE laminate
Flexible packaging 1 1 0 0 0 1 0 12 0 28 1 1 short 0 1 1 0
Food packaging Biomass bio-PET PET Flexible packaging 1 0 0 0 0 1 0 12 0 25 1 1 short 1 0 1 0
Food packaging Biomass Cellulose PP Flexible packaging 1 0 0 0 0 1 0 12 0 25 1 1 short 1 0 1 0
Food packaging Biomass Chitosan PP Flexible packaging 1 0 0 0 0 1 0 12 0 25 1 1 short 0 1 1 0
Food packaging Biomass Wheat gluten powder
PE (LD) Flexible packaging 1 0 0 0 0 0 1 12 0 25 1 1 short 0 1 1 0
Food packaging Biomass bio-PP PP Flexible packaging 1 0 0 0 0 0 0 12 0 24 1 1 short 1 0 1 0
Beverage bottle Biomass bio-PE PE (HD) Rigid packaging 1 1 0 1 1 1 0 7 0 24 2 1 short 1 0 1 1
Beverage bottle Biomass PLA PET, PE (HD) Rigid packaging 1 1 0 1 1 1 0 7 0 24 2 1 short 0 1 1 1
Beverage bottle Biomass bio-PET PET Rigid packaging 1 1 0 1 0 1 1 7 0 22 2 1 short 1 0 1 1
Beverage bottle R/Waste r-PET PET Rigid packaging 1 0 1 0 0 1 1 7 0 19 2 1 short 1 0 1 1
Beverage bottle Biomass PHA PET, PP Rigid packaging 1 0 0 1 0 1 0 7 0 18 2 1 short 0 1 1 1
Beverage bottle Biomass bio-PEF PET Rigid packaging 1 0 0 1 0 0 0 7 0 17 2 1 short 1 0 1 1
Beverage bottle R/Waste r-(bio)PET PET Rigid packaging 1 0 0 0 0 1 0 7 0 15 2 1 short 1 0 1 1
Mulching film Biomass PLA PE (LLD) Agriculture & horticulture
1 0 0 1 1 1 0 5 1 19 3 0 short 0 1 1 0
Mulching film Biomass bio-PBAT PBAT Agriculture & horticulture
1 0 0 1 0 1 0 5 1 16 3 0 short 0 1 1 0
Mulching film Biomass bio-PBS PBS Agriculture & horticulture
1 0 0 1 0 1 0 5 1 16 3 0 short 0 1 1 0
Mulching film Biomass kenaf-based polymer
PE Agriculture & horticulture
1 0 0 0 0 1 0 5 1 13 3 0 short 1 0 1 0
Mulching film Biomass Starch blends
PE (LD) Agriculture & horticulture
1 0 0 0 0 1 0 5 1 13 3 0 short 0 1 1 0
Textile fibre Biomass bio-PET PET Textiles 1 1 0 1 0 1 0 5 0 17 4 0 long 1 0 0 0
Textile fibre Biomass PLA PET, PP, PE (HD), PE (LD) Textiles 1 0 0 1 1 1 0 5 0 17 4 0 long 0 1 0 0
Textile fibre R/Waste r-PET PET Textiles 1 0 1 0 0 1 0 5 0 14 4 0 long 1 0 0 0

Comparative LCA of alternative feedstock for plastics production – DRAFT FOR STAKEHOLDER CONSULTATION Part II
240
Article Feed-stock
Alternative polymer
Conventional polymer Market Sector a) b) c) d) e) Tot* Rank f) g)
b.1 b.2 b.3 b.4/ h.1
d.1 d.2 f.1 f.2 f.3 f.4 g.1 g.2
Textile fibre Biomass man-made cellulose fiber
PET Textiles 1 0 0 0 0 1 0 5 0 11 4 0 long 0 1 0 0
Textile fibre Biomass PHA PET, PP, PE (HD), PE (LD) Textiles 1 0 0 0 0 1 0 5 0 11 4 0 long 0 1 0 0
Wipe Biomass PLA PE, PP Consumer goods 1 0 0 1 1 1 1 5 0 18 5 1 short 0 1 1 0
Wipe Biomass PHA PE, PP Consumer goods 1 0 0 1 0 1 0 5 0 14 5 1 short 0 1 1 0
Wipe Biomass PHB PE, PP Consumer goods 1 0 0 1 0 1 0 5 0 14 5 1 short 0 1 1 0
Wipe Biomass Chitosan PE, PP Consumer goods 1 0 0 0 0 1 0 5 0 11 5 1 short 0 1 1 0
Wipe Biomass Starch blends
PE, PP Consumer goods 1 0 0 0 0 1 0 5 0 11 5 1 short 0 1 1 0
Interior panel Biomass PLA PP Automotive & transport 1 0 0 0 1 1 0 5 0 14 6 0 long 0 1 0 1
Interior panel Biomass Hemp-based (66%v)+epoxy resin(34%v) + hardener
ABS Automotive & transport 1 0 0 0 0 1 1 5 0 12 6 0 long 1 0 0 1
Interior panel Biomass Linseedoil–based
PP Automotive & transport 1 0 0 0 0 1 0 5 0 11 6 0 long 1 0 0 1
Interior panel Biomass bio-PBS PBS Automotive & transport 1 0 0 0 0 1 0 5 0 11 6 0 long 0 1 0 1
Interior panel Biomass bio-PP (flax reinforced)
PP (fibreglass reinforced) Automotive & transport 1 0 0 0 0 0 0 5 0 10 6 0 long 1 0 0 1
Insulation material Biomass bio-PUR PUR, PS-E Building & construction 1 1 0 1 0 1 0 4 0 15 7 0 very long
1 0 0 1
Insulation material Biomass PLA PUR, PS-E Building & construction 1 0 0 1 1 1 0 4 0 15 7 0 very long
0 1 0 1
Insulation material Biomass bio-fibres PUR, PS-E Building & construction 1 0 0 0 0 1 0 4 0 9 7 0 very long
0 1 0 1
Insulation material Biomass Miscanthus PUR, PS-E Building & construction 1 0 0 0 0 1 0 4 0 9 7 0 very long
0 1 0 1
Printers housing panel
Biomass PLA ABS (pure), PC/ABS Electrics & electronics 1 0 0 1 1 1 0 4 0 15 8 0 long 0 1 0 1
Printers housing panel
Biomass bio-PTT ABS (pure), PC/ABS Electrics & electronics 1 0 0 0 0 1 0 4 0 9 8 0 long 1 0 0 1
Printers housing panel
Biomass bio-PP/natural fibre
ABS (pure), PC/ABS Electrics & electronics 1 0 0 0 0 0 0 4 0 8 8 0 long 1 0 0 1
Printers housing panel
R/Waste r-PP PP Electrics & electronics 1 0 1 0 0 1 0 4 0 12 8 0 long 1 0 0 1
Tray for food Biomass PLA PS, PET Rigid packaging 1 1 0 1 1 1 0 6 0 22 9 1 short 0 1 1 1
Tray for food Biomass bio-PBSC PS Rigid packaging 1 0 0 1 0 1 0 6 0 16 9 1 short 0 1 1 1
Tray for food Biomass PHA PP Rigid packaging 1 0 0 1 0 1 0 6 0 16 9 1 short 0 1 1 1
Tray for food Biomass PHB PS Rigid packaging 1 0 0 1 0 1 0 6 0 16 9 1 short 0 1 1 1

Comparative LCA of alternative feedstock for plastics production – DRAFT FOR STAKEHOLDER CONSULTATION Part II
241
Article Feed-stock
Alternative polymer
Conventional polymer Market Sector a) b) c) d) e) Tot* Rank f) g)
b.1 b.2 b.3 b.4/ h.1
d.1 d.2 f.1 f.2 f.3 f.4 g.1 g.2
Tray for food Biomass Starch blends
PS, PS-E Rigid packaging 1 0 0 1 0 1 0 6 0 16 9 1 short 0 1 1 1
Tray for food Biomass Natural fibers
PS-E Rigid packaging 1 0 0 0 0 1 0 6 0 13 9 1 short 0 1 1 1
Loose fill chips Biomass PLA PS-E Rigid packaging 1 1 0 1 1 1 0 4 0 18 10 0 short 0 1 1 1
Loose fill chips Biomass PLA-E PS-E Rigid packaging 1 0 0 1 1 1 0 4 0 15 10 0 short 0 1 1 1
Loose fill chips Biomass Starch blends
PS-E Rigid packaging 1 0 0 1 0 1 1 4 0 13 10 0 short 0 1 1 1
Loose fill chips Biomass Miscanthus PS-E Rigid packaging 1 0 0 0 0 1 0 4 0 9 10 0 short 0 1 1 1
Other consumer goods articles
R/Waste r-PE (HD-MD)
PE (HD-MD) Consumer goods 1 0 1 0 0 1 0 4 0 12 11 0 long 1 0 0 1
Other consumer goods articles
R/Waste r-PE (LD-LLD)
PE (LD-LLD) Consumer goods 1 0 1 0 0 1 0 4 0 12 11 0 long 1 0 0 1
Other consumer goods articles
R/Waste r-PP PP Consumer goods 1 0 1 0 0 1 0 4 0 12 11 0 long 1 0 0 1
Other consumer goods articles
R/Waste r-PS PS Consumer goods 1 0 1 0 0 1 0 4 0 12 11 0 long 1 0 0 1
Cup Biomass PLA PS,PS-E, PP (also reusable), PET, PE, PE-coated cardboard
Rigid packaging 1 1 0 1 1 1 2 3 0 18 12 1 short 0 1 1 1
Cup R/Waste r-PET PS,PS-E, PP, PET, PE Rigid packaging 1 0 1 0 0 1 0 3 0 10 12 1 short 1 0 1 1
Cup Biomass Starch blends
PS Rigid packaging 1 0 0 1 0 1 0 3 0 10 12 1 short 0 1 1 1
Other agricultural articles
Biomass PLA PP Agriculture & horticulture
1 0 0 1 1 1 1 3 1 16 13 0 short 0 1 1 0
Other agricultural articles
R/Waste r-PP PP Agriculture & horticulture
1 0 0 0 0 1 0 3 1 9 13 0 short 1 0 1 0
Other agricultural articles
Biomass Starch blends
PE (HD), PP Agriculture & horticulture
1 0 0 0 0 1 0 3 1 9 13 0 short 0 1 1 0
Foam for consumer goods
Biomass PLA PS-E core Consumer goods 1 0 0 1 1 1 1 3 0 14 14 0 long 0 1 0 1
Foam for consumer goods
Biomass bio-PUR PUR Consumer goods 1 0 0 1 0 1 0 3 0 10 14 0 long 1 0 0 1
Foam for consumer goods
Biomass Starch blends
PS-E Consumer goods 1 0 0 0 0 1 2 3 0 9 14 0 long 0 1 0 1
Other packaging (non-food)
Biomass bio-PE PE (LD) Flexible packaging 1 1 0 1 1 1 0 3 0 16 15 0 short 1 0 1 0
Other packaging (non-food)
Biomass Starch blends
PE (LD) Flexible packaging 1 1 0 0 0 1 0 3 0 10 15 0 short 0 1 1 0
Other packaging (non-food)
CO2 CO2-based PPC
PPC Flexible packaging 1 0 0 0 0 0 0 3 0 6 15 0 short 1 0 1 0
Fibre Biomass bio-PA PA/PTT Consumer goods 1 0 0 1 0 1 0 1 0 6 0 long 1 0 0 0
Sanitary towel Biomass PLA PE, PP Consumer goods 1 0 0 1 1 1 1 4 0 16 1 short 0 1 1 0

Comparative LCA of alternative feedstock for plastics production – DRAFT FOR STAKEHOLDER CONSULTATION Part II
242
Article Feed-stock
Alternative polymer
Conventional polymer Market Sector a) b) c) d) e) Tot* Rank f) g)
b.1 b.2 b.3 b.4/ h.1
d.1 d.2 f.1 f.2 f.3 f.4 g.1 g.2
Sanitary towel Biomass PHA PE, PP Consumer goods 1 0 0 1 0 1 0 4 0 12 1 short 0 1 1 0
Sanitary towel Biomass PHB PE, PP Consumer goods 1 0 0 1 0 1 0 4 0 12 1 short 0 1 1 0
Sanitary towel Biomass Starch blends
PE, PP Consumer goods 1 0 0 0 0 1 0 4 0 9 1 short 0 1 1 0
Other construction articles
Biomass bio-PE PE Building & construction 1 0 0 0 1 1 0 3 0 10 0 very long
1 0 0 1
Other construction articles
R/Waste r-PE (HD-MD)
PE (HD-MD) Building & construction 1 0 1 0 0 1 0 3 0 10 0 very long
1 0 0 1
Other construction articles
R/Waste r-PP PP Building & construction 1 0 1 0 0 1 0 3 0 10 0 very long
1 0 0 1
Injection molding article
Biomass bio-PBS PBS Consumer goods 1 0 0 0 0 1 0 1 0 3 0 long 0 1 0 1
Automotive flexible plastic
Biomass bio-PET PUR, PVC, PP Automotive & transport 1 0 0 1 0 1 0 1 0 6 0 long 1 0 0 1
Foam for automotive
Biomass bio-PUR PUR Automotive & transport 1 1 0 1 0 1 0 1 0 9 0 long 1 0 0 1
Automotive textile Biomass bio-PUR PUR Automotive & transport 1 1 0 1 0 1 0 2 0 11 0 long 1 0 0 0
Automotive textile Biomass bio-PE PBT Automotive & transport 1 0 0 0 1 1 0 2 0 8 0 long 1 0 0 0
Beverage carton R/Waste r-PET Tetra Pak, PET, PE (HD) Rigid packaging 1 0 1 0 0 1 1 7 0 19 1 short 1 0 1 1
Beverage carton Biomass bio-PE Tetra Pak, PET, PE (HD) Rigid packaging 1 1 0 0 1 1 1 1 0 10 1 short 1 0 1 1
Cap for beverage bottle
Biomass bio-PE PE (HD) Rigid packaging 1 1 0 1 1 1 0 1 0 12 1 short 1 0 1 1
Cap for non-beverage bottle
Biomass bio-PE PE (HD) Rigid packaging 1 1 0 1 1 1 0 2 0 14 0 short 1 0 1 1
Cap for non-beverage bottle
Biomass PHA PE (HD) Rigid packaging 1 0 0 1 0 1 0 2 0 8 0 short 0 1 1 1
Carpet Biomass bio-PA PA, PTT Textiles 1 0 0 0 0 1 0 2 0 5 0 long 1 0 0 1
Carpet Biomass bio-PTT PA, PTT Textiles 1 0 0 0 0 1 0 2 0 5 0 long 1 0 0 1
Carrier bag Biomass PLA PE, PET Flexible packaging 0 1 0 1 1 1 2 11 0 0 1 short 0 1 1 0
Carrier bag Biomass bio-PE (HD) PE (HD) Flexible packaging 0 1 0 1 1 1 1 11 0 0 1 short 1 0 1 0
Carrier bag Biomass bio-PE PE (LD) Flexible packaging 0 1 0 1 1 1 0 11 0 0 1 short 1 0 1 0
Carrier bag R/Waste r-PET PET Flexible packaging 0 0 1 0 0 1 0 11 0 0 1 short 1 0 1 0
Carrier bag Biomass PHA PP Flexible packaging 0 0 0 1 0 1 0 11 0 0 1 short 0 1 1 0
Carrier bag Biomass Starch blends
PE (LD) Flexible packaging 0 1 0 0 0 1 0 11 0 0 1 short 0 1 1 0
Carrier bag R/Waste r-PE PE Flexible packaging 0 0 0 0 0 1 0 11 0 0 1 short 1 0 1 0
Carrier bag R/Waste r-PE (HD) PE (HD) Flexible packaging 0 0 0 0 0 1 0 11 0 0 1 short 1 0 1 0
Carrier bag R/Waste r-PE (LD) PE (LD) Flexible packaging 0 0 0 0 0 1 0 11 0 0 1 short 1 0 1 0
Carrier bag R/Waste r-PE (LD-LLD)
PE (LD-LLD) Flexible packaging 0 0 0 0 0 1 0 11 0 0 1 short 1 0 1 0
Carrier bag Biomass bio-PET PE (LD), PP, PET Flexible packaging 0 0 0 0 0 1 0 11 0 0 1 short 1 0 1 0

Comparative LCA of alternative feedstock for plastics production – DRAFT FOR STAKEHOLDER CONSULTATION Part II
243
Article Feed-stock
Alternative polymer
Conventional polymer Market Sector a) b) c) d) e) Tot* Rank f) g)
b.1 b.2 b.3 b.4/ h.1
d.1 d.2 f.1 f.2 f.3 f.4 g.1 g.2
Cigarette bud Biomass Starch blends
CA (?) Consumer goods 1 0 0 0 0 1 0 1 0 3 1 short 0 1 1 0
Container/box for food
Biomass PLA PET, PS, PS-E, PP Rigid packaging 1 1 0 1 1 1 0 3 0 16 1 short 0 1 1 1
Container/box for food
Biomass bio-PBS PS Rigid packaging 1 0 0 1 0 1 0 3 0 10 1 short 0 1 1 1
Container/box for food
Biomass Starch blends
PS, PP Rigid packaging 1 0 0 1 0 1 0 3 0 10 1 short 0 1 1 1
Container/box for non-food
Biomass PLA PET, PS Rigid packaging 1 1 0 1 1 1 0 1 0 12 0 short 0 1 1 1
Crate Biomass bio-PE PE (HD) Rigid packaging 1 1 0 1 1 1 0 2 0 14 0 long 1 0 0 1
Crate Biomass Starch blends
PE (HD), PP Rigid packaging 1 0 0 1 0 1 0 2 0 8 0 long 0 1 0 1
Dashboard fascia Biomass bio-PUR ABS, PUR Automotive & transport 1 1 0 1 0 1 0 2 0 11 0 long 1 0 0 1
Dashboard fascia Biomass bio-PA ABS, PUR Automotive & transport 1 0 0 1 0 1 0 2 0 8 0 long 1 0 0 1
Door handle Biomass bio-PUR PBT Automotive & transport 1 1 0 1 0 1 0 2 0 11 0 long 1 0 0 1
Door handle Biomass bio-PA PBT Automotive & transport 1 0 0 1 0 1 0 2 0 8 0 long 1 0 0 1
Electro-domestic part
Biomass PHA PET, PP, PE(HD-MD), PE(LD-LLD)
Electrics & electronics 1 0 0 1 0 1 0 2 0 8 0 long 0 1 0 1
Electro-domestic part
CO2 CO2-based PPC
PPC Consumer goods 1 0 0 0 0 0 0 2 0 4 0 long 1 0 0 1
Frame Biomass Starch blends
PVC Building & construction 1 0 0 0 0 1 0 1 0 3 0 very long
0 1 0 1
Garbage bag Biomass PLA PE Flexible packaging 0 1 0 1 1 1 1 4 0 0 1 short 0 1 1 0
Garbage bag Biomass bio-PE PE Flexible packaging 0 1 0 1 1 1 0 4 0 0 1 short 1 0 1 0
Garbage bag Biomass bio-PBAT/Starch
PE Flexible packaging 0 0 0 1 0 1 0 4 0 0 1 short 0 1 1 0
Garbage bag Biomass Starch blends
PE (HD), PCL Flexible packaging 0 1 0 0 0 1 0 4 0 0 1 short 0 1 1 0
Laptop cover Biomass PLA PP, other ETP Electrics & electronics 1 0 0 1 1 1 0 1 0 9 0 long 0 1 0 1
Non-beverage bottle
Biomass bio-PE PE (HD) Rigid packaging 1 1 0 1 1 1 0 1 0 12 0 short 1 0 1 1
Other automotive components
Biomass PHA PP Automotive & transport 1 0 0 0 0 1 0 3 0 7 0 long 0 1 0 1
Other automotive components
Biomass PHB PP Automotive & transport 1 0 0 0 0 1 0 3 0 7 0 long 0 1 0 1
Other automotive components
R/Waste r-PP PP Automotive & transport 1 0 1 0 0 1 0 3 0 10 0 long 1 0 0 1
Packaging of packaging
Biomass bio-PE PE (LD-LLD), PP Flexible packaging 1 1 0 1 1 1 0 2 0 14 1 short 1 0 1 0
Packaging of packaging
Biomass Starch blends
PE (LD) Flexible packaging 1 1 0 0 0 1 0 2 0 8 1 short 0 1 1 0

Comparative LCA of alternative feedstock for plastics production – DRAFT FOR STAKEHOLDER CONSULTATION Part II
244
Article Feed-stock
Alternative polymer
Conventional polymer Market Sector a) b) c) d) e) Tot* Rank f) g)
b.1 b.2 b.3 b.4/ h.1
d.1 d.2 f.1 f.2 f.3 f.4 g.1 g.2
Pallet R/Waste r-PE (HD) PE (HD) Rigid packaging 1 0 0 0 0 1 0 1 0 3 0 long 1 0 0 1
Pot Biomass PLA PE (HD), PP Agriculture & horticulture
1 0 0 1 1 1 0 3 0 13 0 short 0 1 1 1
Pot Biomass PLA-E PE (HD), PP Agriculture & horticulture
1 0 0 1 1 1 0 3 0 13 0 short 0 1 1 1
Pot Biomass Starch blends
PE (HD), PP Agriculture & horticulture
1 0 0 0 0 1 0 3 0 7 0 short 0 1 1 1
Printed Wiring Board
Biomass lignin-epoxy blend
PWB epoxy resin Electrics & electronics 1 0 0 0 0 1 0 1 0 3 0 long 1 0 0 1
Rigid-packaging Biomass bio-PBAT PBAT Rigid packaging 1 0 0 1 0 1 0 1 0 6 0 short 0 1 1 1
Rope Biomass bio-PA PA Building & construction 1 0 0 1 0 1 0 1 0 6 0 long 1 0 0 0
Straw Biomass PLA PP Rigid packaging 0 1 0 1 1 1 0 2 0 0 1 short 0 1 1 1
Straw Biomass bio-PBS PP Rigid packaging 0 0 0 1 0 1 0 2 0 0 1 short 0 1 1 1
Tableware Biomass PLA PP, PS, PE Rigid packaging 0 1 0 1 1 1 0 5 0 0 1 short 0 1 1 1
Tableware Biomass PHA PP, PS Rigid packaging 0 0 0 1 0 1 0 5 0 0 1 short 0 1 1 1
Tableware Biomass PHB PP, PS Rigid packaging 0 0 0 1 0 1 0 5 0 0 1 short 0 1 1 1
Tableware Biomass Starch blends
PP, PS (GPPS) Rigid packaging 0 0 0 1 0 1 0 5 0 0 1 short 0 1 1 1
Tableware Biomass CA (Biograde)
PP, PS Rigid packaging 0 0 0 0 0 1 0 5 0 0 1 short 1 0 1 1
Toys/Houseware Biomass bio-PE PE (HD) Consumer goods 1 0 1 1 1 1 0 1 0 12 0 long 1 0 0 1
Wire coating Biomass bio-PA PA Electrics & electronics 1 0 0 1 0 1 0 1 0 6 0 long 1 0 0 1
Selection criteria a) Policy options b) Market potential b.1) market size bio-based polymers b.2) market size recycled plastic waste-based polymers b.3) identifying market trend b.4) market criticality c) Promise for deployment d) Availability and quality of data needed for the LCA analysis d.1) quality of available LCA studies d.2) LCA scenario number e) EoL scenarios * after weighting
Additional criteria f) EoL aspects including littering f.1) littering (marine) f.2) expected lifetime/durability f.3) recyclability f.4) bio-degradability (industrial bio-degradation) g) Uses g.1) single use vs multiples use g.2) rigid vs flexible options h) Market coverage h.1) import dependency
Comparative LCA of alternative feedstock for plastics production – DRAFT FOR STAKEHOLDER CONSULTATION Part II
245
References 4
5 Aeschelmann, F., & Carus, M. (2017). Bio-based Building Blocks and Polymers – Global Capacities and 6
Trends 2016 – 2021 (2017th-03 ed.). nova-Institute. Retrieved from http://bio-7 based.eu/media/edd/2017/03/17-02-Bio-based-Building-Blocks-and-Polymers-short-8 version.pdf 9
Arnold, J. C., & Alston, S. M. (2012). Life cycle assessment of the production and use of 10 polypropylene tree shelters. Journal of Environmental Management. 11 https://doi.org/10.1016/j.jenvman.2011.09.005 12
BARBARA. (2018). Biopolymers with advanced functionalities for building and automotive parts 13 processed through additive manufacturing. Retrieved October 5, 2018, from 14 http://www.barbaraproject.eu/ 15
BASF. (2014). Environmental Evaluation – Comparative Study of Bags verified by the Critical Review 16 Panel. 17
Benetto, E., Jury, C., Igos, E., Carton, J., Hild, P., Vergne, C., & Di Martino, J. (2015). Using 18 atmospheric plasma to design multilayer film from polylactic acid and thermoplastic starch: A 19 screening life cycle assessment. Journal of Cleaner Production, 87(1), 953–960. 20 https://doi.org/10.1016/j.jclepro.2014.10.056 21
BIfA, ifeu, Flo-Pak, & DBU - Deutsche Bundesstiftung Umwelt. (2002). Kunststoffe aus 22 nachwachsenden Rohstoffen: Vergleichende Ökobilanz für Loose-fill-Packmittel aus Stärke bzw. 23 Polystyrol. BIfA - Bayerisches Institut für Angewandte Umweltforschung und –technik 24 GmbH,ifeu - Institut für Energie- und Umweltforschung Heidelberg GmbH,Flo-Pak GmbH,. 25 Retrieved from https://www.ifeu.de/projekt/loosefill-de/ 26
Bilck, A. P., Grossmann, M. V. E., & Yamashita, F. (2010). Biodegradable mulch films for strawberry 27 production. Polymer Testing, 29(4), 471–476. 28 https://doi.org/https://doi.org/10.1016/j.polymertesting.2010.02.007 29
Binder, M., & Woods, L. (2009). Comparative Life Cycle Assessment IngeoTM biopolymer, PET, and PP 30 Drinking Cups. 31
bio-on. (2018). Bio-on: i.e., turn on BIO! “turn OFF pollution”! Retrieved October 18, 2018, from 32 http://www.bio-on.it/ 33
BioBarr. (2018). New Bio-based Food Packaging Materials with Enhanced Barrier Properties. 34 Retrieved October 5, 2018, from http://www.biobarr.eu/ 35
BioMotive. (2018). Maybe with time we will see things, which so far, we cannot imagine. Retrieved 36 October 5, 2018, from https://biomotive.info/ 37
Biopolymers. (2018). Rodenburg Biopolymers. Retrieved October 18, 2018, from 38 http://biopolymers.nl/ 39
BioSpri (2018). Study commisioned by DG RTD on Support to R&I Policy in the Area of Bio-based 40 Products and Services, Environmental impact assessments of innovative bio-based products – 41 confidential draft report, 2018. 42
Bisinella, V., Albizzati, P. F., Astrup, T. F., & Damgaard, A. (2018). Life Cycle Assessment of grocery 43 carrier bags. The Danish Environmental Protection Agency. Retrieved from 44 https://www2.mst.dk/Udgiv/publications/2018/02/978-87-93614-73-4.pdf 45
Bohlmann, G. M. (2004). Biodegradable packaging life-cycle assessment. Environmental Progress. 46 https://doi.org/10.1002/ep.10053 47
Boonniteewanich, J., Pitivut, S., Tongjoy, S., Lapnonkawow, S., & Suttiruengwong, S. (2014). 48 Evaluation of carbon footprint of bioplastic straw compared to petroleum based straw 49 products. Energy Procedia, 56(C), 518–524. https://doi.org/10.1016/j.egypro.2014.07.187 50
Broeren, M. L. M., Molenveld, K., van den Oever, M. J. A., Patel, M. K., Worrell, E., & Shen, L. (2016). 51 Early-stage sustainability assessment to assist with material selection: a case study for biobased 52 printer panels. Journal of Cleaner Production. https://doi.org/10.1016/j.jclepro.2016.05.159 53
Butschli, J. (2008). Wet wipe maker pioneers ‘Eco-Choice’ sustainability platform. Greener Package - 54

Comparative LCA of alternative feedstock for plastics production – DRAFT FOR STAKEHOLDER CONSULTATION Part II
246
Knowledge Exchange for Sustainable Packaging. Retrieved from 55 https://www.greenerpackage.com/source_reduction/wet_wipe_maker_pioneers_‘eco-56 choice’_sustainability_platform 57
Chaffee, C., & Yaros, B. R. (2007). Life Cycle Assessment for Three Types of Grocery Bags -Recyclable 58 Plastic; Compostable, Biodegradable Plastic; and Recycled, Recyclable Paper Prepared for the 59 Progressive Bag Alliance. 60
Chen, L., Pelton, R. E. O., & Smith, T. M. (2016). Comparative life cycle assessment of fossil and bio-61 based polyethylene terephthalate (PET) bottles. Journal of Cleaner Production. 62 https://doi.org/10.1016/j.jclepro.2016.07.094 63
Cheroennet, N., Pongpinyopap, S., Leejarkpai, T., & Suwanmanee, U. (2018). A trade-off between 64 carbon and water impacts in bio-based box production chains in Thailand: A case study of PS, 65 PLAS, PLAS/starch, and PBS. Journal of Cleaner Production. 66 https://doi.org/10.1016/j.jclepro.2016.11.152 67
Deloitte & Touche. (2015). Analyse de la chaîne de valeur du recyclage des plastiques en France. 68 (ADEME) Agence de l’Environnement et de la Maîtrise de L’Énergie. Retrieved from 69 https://www.ademe.fr/sites/default/files/assets/documents/analyse-chaine-de-valeur-70 recyclage-plastiques-en-france-201412-synthese.pdf 71
Deng, Y., Achten, W. M. J., Van Acker, K., & Duflou, J. R. (2013). Life cycle assessment of wheat 72 gluten powder and derived packaging film. Biofuels, Bioproducts and Biorefining. 73 https://doi.org/10.1002/bbb.1406 74
Detzel, Knauertz, & Derreza-Greeven. (2013). Study of the Environmental Impacts of Packagings 75 Made of Biodegradable Plastics. 76
Diener, J., & Siehler, U. (1999). Ökologischer Vergleich von NMT- und GMT-Bauteilen, 272(1), 1–4. 77 https://doi.org/doi:10.1002/(SICI)1522-9505(19991201)272:1<1::AID-APMC1>3.0.CO;2-4 78
Dilli, R. (2007). Comparison of existing life cycle analysis of shopping bag alternatives Final Report. 79 Dommermuth, B., & Raschka, A. (2015). Plastics made from CO2. BioPlastics Magazine - Basics, 80
10(06), 4. Retrieved from https://www.bioplasticsmagazine.com/en/online-archive/2015.php 81 Embraced. (2018). Closing the loop for Absorbent Hygiene Products waste. Retrieved October 5, 82
2018, from https://www.embraced.eu/ 83 Estermann, R. (1998). Test von Säcken aus biologisch abbaubaren Werkstoffen für die 84
Grünabfallsammlung. Study prepared by COMPOSTO for the Kompostforum Schweiz. Olten 85 Switzerland,, Uerikon. 86
Estermann, R., & Schwarzwälder, B. (1998). Life cycle assessment of Mater-Bi bags for the collection 87 of compostable waste. COMPOSTO for Novamont Italy, Novara. 88
Estermann, R., Schwarzwälder, B., & Gysin, B. (2000). Life cycle assessment of Mater-Bi and EPS 89 loose fills. Study prepared by COMPOSTO for Novamont Italy, Novara. 90
European Bioplastics. (2017). Bioplastics market data 2017. European Bioplastics. Retrieved from 91 http://docs.european-92 bioplastics.org/publications/market_data/2017/Report_Bioplastics_Market_Data_2017.pdf 93
European Commission. (2018a). A European Strategy for Plastics in a Circular Economy. (European 94 Commission), COM/2018/028 Final. EUR-Lex. Retrieved from https://eur-lex.europa.eu/legal-95 content/EN/TXT/?qid=1539859145625&uri=CELEX:52018DC0028 96
European Commission. (2018b). Proposal for a directive of the European parliament and of the 97 council on the reduction of the impact of certain plastic products on the environment. 98 (European Commission), COM/2018/340 Final. EUR-Lex. Retrieved from https://eur-99 lex.europa.eu/legal-content/EN/TXT/?qid=1539857847488&uri=CELEX:52018PC0340 100
European Parliament and Council of the European Union. (2015). Directive (EU) 2015/720 of the 101 European Parliament and of the Council of 29 April 2015 amending Directive 94/62/EC as 102 regards reducing the consumption of lightweight plastic carrier bags. (European Parliament and 103 Council of the European Union, Ed.), OJ L 115. Official Journal of the European Union. Retrieved 104 from https://eur-lex.europa.eu/legal-105

Comparative LCA of alternative feedstock for plastics production – DRAFT FOR STAKEHOLDER CONSULTATION Part II
247
content/EN/TXT/?qid=1540278334367&uri=CELEX:32015L0720 106 Fieschi, M., & Pretato, U. (2017). Role of compostable tableware in food service and waste 107
management. A life cycle assessment study. https://doi.org/10.1016/j.wasman.2017.11.036 108 Ganne-Chdeville, C., & Diederichs, S. (2015). Potential environmental benefits of ultralight 109
particleboards with biobased foam cores. International Journal of Polymer Science. 110 https://doi.org/10.1155/2015/383279 111
Gironi, F., & Piemonte, V. (2010). Bioplastics disposal: How to manage it. WIT Transactions on 112 Ecology and the Environment. https://doi.org/10.2495/WM100241 113
Gironi, F., & Piemonte, V. (2010). Bioplastics disposal: How to manage it. WIT Transactions on 114 Ecology and the Environment. https://doi.org/10.2495/WM100241 115
Gironi, F., & Piemonte, V. (2011a). Bioplastics and petroleum-based plastics: Strengths and 116 weaknesses. Energy Sources, Part A: Recovery, Utilization and Environmental Effects, 33(21), 117 1949–1959. https://doi.org/10.1080/15567030903436830 118
Gironi, F., & Piemonte, V. (2011b). Life cycle assessment of polylactic acid and polyethylene 119 terephthalate bottles for drinking water. Environmental Progress & Sustainable Energy. 120 https://doi.org/10.1002/ep.10490 121
Gonzalez-Garay, A., Gonzalez-Miquel, M., & Guillen-Gosalbez, G. (2017). High-Value Propylene 122 Glycol from Low-Value Biodiesel Glycerol: A Techno-Economic and Environmental Assessment 123 under Uncertainty. ACS Sustainable Chemistry and Engineering, 5(7), 5723–5732. 124 https://doi.org/10.1021/acssuschemeng.7b00286 125
Grand, Y., Roux, P., & ELSEA, E. L. and S. A. (2014). Comparative Life Cycle Assessment of the 126 Novinpak PET/RPET bottle and traditional glass bottle including vine growing and winemaking. 127 Irstea. https://doi.org/https://doi.org/10.13140/rg.2.1.3148.9129 128
Guo, M., Stuckey, D. C., & Murphy, R. J. (2013). End-of-life of starch-polyvinyl alcohol biopolymers. 129 Bioresource Technology. https://doi.org/10.1016/j.biortech.2012.09.093 130
Guo, M., Trzcinski, A. P., Stuckey, D. C., & Murphy, R. J. (2011). Anaerobic digestion of starch-131 polyvinyl alcohol biopolymer packaging: Biodegradability and environmental impact 132 assessment. Bioresource Technology. https://doi.org/10.1016/j.biortech.2011.09.061 133
Hakala Yrjö; Meinander, Kerstin; Tanner, Toini, S. V., & (VTT), T. R. C. of F. (1997). Life-cycle 134 assessment, comparison of biopolymer and traditional diaper systems. Finland: VTT Chemical 135 Technology,Neste Corporation,. Retrieved from 136 http://www.vtt.fi/inf/pdf/tiedotteet/1997/T1876.pdf 137
HCGA. (2009). Industrial uses for crops: Bioplastics. Agriculture and Horticulture Development Board. 138 Retrieved from http://www.appg-agscience.org.uk/linkedfiles/HGCABioplastics_web28409.pdf 139
Hermann, B. G., Blok, K., & Patel, M. K. (2010). Twisting biomaterials around your little finger: 140 Environmental impacts of bio-based wrappings. International Journal of Life Cycle Assessment. 141 https://doi.org/10.1007/s11367-010-0155-8 142
Ingrao, C., Gigli, M., & Siracusa, V. (2017). An attributional Life Cycle Assessment application 143 experience to highlight environmental hotspots in the production of foamy polylactic acid trays 144 for fresh-food packaging usage. Journal of Cleaner Production. 145 https://doi.org/10.1016/j.jclepro.2017.03.007 146
Kaeb, H., Aeschelmann, F., Dammer, L., & Carus, M. (2016). Market study on the consumption of 147 biodegradable and compostable plastic products in Europe 2015 and 2020 (6th ed.). nova-148 Institute. Retrieved from http://www.bio-149 based.eu/biodegradable_market_study/media/biodegradable market study/16-04-150 Biodegradable-and-compostable-plastic-products-in-EU-short-version.pdf 151
Khoo, H. H., Tan, R. B. H., & Chng, K. W. L. (2010a). Environmental impacts of conventional plastic 152 and bio-Based carrier bags: Part 2: End-of-life options. International Journal of Life Cycle 153 Assessment. International Journal of Life Cycle Assessment, 15(3), 284–293. 154 https://doi.org/https://doi.org/10.1007/s11367-010-0163-8 155
Khoo, H. H., Tan, R. B. H., & Chng, K. W. L. (2010b). Environmental impacts of conventional plastic 156
Comparative LCA of alternative feedstock for plastics production – DRAFT FOR STAKEHOLDER CONSULTATION Part II
248
and bio-Based carrier bags. Part 1: Life cycle production. International Journal of Life Cycle 157 Assessment, 15(3), 284–293. https://doi.org/10.1007/s11367-010-0162-9 158
Kosbar, L. L., Gelorme, J. D., Japp, R. M., & Fotorny, W. T. (2000). Introducing Biobased Materials into 159 the Electronics Industry, 4(3), 93–105. https://doi.org/doi:10.1162/108819800300106401 160
Kuczenski, B., Geyer, R., Trujillo, M., Bren, D., & Mortensen, C. (2012). Plastic Clamshell Container 161 Case Study The Potential Impacts of Extended Producer Responsibility (EPR) in California on 162 Global Greenhouse Gas (GHG) Emissions DEPARTMENT OF RESOURCES RECYCLING AND 163 RECOVERY. Retrieved from www.calrecycle.ca.gov/Publications/ 164
Leceta, I., Etxabide, A., & Cabezudo, S. and. (2014). Bio-based films prepared with by-products and 165 wastes: Environmental assessment. Journal of Cleaner Production. 166 https://doi.org/10.1016/j.jclepro.2013.07.054 167
Leceta, I., Guerrero, P., Cabezudo, S., & De La Caba, K. (2013). Environmental assessment of 168 chitosan-based films. Journal of Cleaner Production. 169 https://doi.org/10.1016/j.jclepro.2012.09.049 170
Leejarkpai, T., Mungcharoen, T., & Suwanmanee, U. (2016). Comparative assessment of global 171 warming impact and eco-efficiency of PS (polystyrene), PET (polyethylene terephthalate) and 172 PLA (polylactic acid) boxes. Journal of Cleaner Production. 173 https://doi.org/10.1016/j.jclepro.2016.03.029 174
Lorite, G. S., Rocha, J. M., Miilumäki, N., Saavalainen, P., Selkälä, T., Morales-Cid, G., … Toth, G. 175 (2017). Evaluation of physicochemical/microbial properties and life cycle assessment (LCA) of 176 PLA-based nanocomposite active packaging. LWT - Food Science and Technology. 177 https://doi.org/10.1016/j.lwt.2016.09.004 178
Madival, S., Auras, R., Singh, S. P., & Narayan, R. (2009). Assessment of the environmental profile of 179 PLA, PET and PS clamshell containers using LCA methodology. Journal of Cleaner Production. 180 https://doi.org/10.1016/j.jclepro.2009.03.015 181
Mattila, T., Kujanpää, M., Dahlbo, H., Soukka, R., & Myllymaa, T. (2011). Uncertainty and Sensitivity 182 in the Carbon Footprint of Shopping Bags. Journal of Industrial Ecology, 15(2), 217–227. 183 https://doi.org/10.1111/j.1530-9290.2010.00326.x 184
McIntyre, K. (2017). Corn Starch Based SAP Could Find Home in Diapers. Retrieved from 185 https://www.nonwovens-industry.com/contents/view_online-exclusives/2017-02-09/corn-186 starch-based-sap-could-find-home-in-diapers 187
MCPP. (2016). BioPBS product range. 188 Meyer, D. E., & Katz, J. P. (2016). Analyzing the environmental impacts of laptop enclosures using 189
screening-level life cycle assessment to support sustainable consumer electronics. Journal of 190 Cleaner Production. https://doi.org/10.1016/j.jclepro.2015.05.143 191
Molenveld, K., van den Oever, M., & Bos, H. L. (2015). Biobased Packaging Catalogue. Wageningen 192 UR Food & Biobased Research. Retrieved from https://www.wur.nl/web/file?uuid=29797d43-193 e17f-49b8-b846-b06ca7a48940&owner=7becf622-1bf2-4a53-a2a0-efe955992367 194
Mueller, B., Humbert, S., & Colin, T. (2017). Critical Review statement for the study " Comparative 195 Life Cycle Assessment for Fruit and Vegetable Bags in France ". 196
NatureWorks. (2018). Medical and Hygiene. Retrieved October 18, 2018, from 197 https://www.natureworksllc.com/Ingeo-in-Use/Medical-and-Hygiene 198
OECD. (2017). Review of Secondary Plastics Markets (ENV/EPOC/W). Organisation for Economic Co-199 operation and Development,. 200
Open-Bio. (2018). Opening bio-based markets via standards, labelling and procurement. Retrieved 201 October 5, 2018, from http://www.biobasedeconomy.eu/projects/open-bio/ 202
Papong, S., Malakul, P., Trungkavashirakun, R., Wenunun, P., Chom-In, T., Nithitanakul, M., & 203 Sarobol, E. (2014). Comparative assessment of the environmental profile of PLA and PET 204 drinking water bottles from a life cycle perspective. Journal of Cleaner Production. 205 https://doi.org/10.1016/j.jclepro.2013.09.030 206
Parker, G., & Edwards, C. (2012). A Life Cycle Assessment of Oxo-biodegradable, Compostable and 207
Comparative LCA of alternative feedstock for plastics production – DRAFT FOR STAKEHOLDER CONSULTATION Part II
249
Conventional Bags Executive Summary. 208 PEFerence. (2018). The Renewable Innovation. Retrieved October 5, 2018, from 209
http://peference.eu/ 210 Petrucci, R., Fortunati, · E, Puglia, · D, Luzi, · F, Kenny, · J M, & Torre, · L. (2017). Life Cycle Analysis of 211
Extruded Films Based on Poly(lactic acid)/Cellulose Nanocrystal/Limonene: A Comparative 212 Study with ATBC Plasticized PLA/OMMT Systems. Journal of Polymers and the Environment, 0. 213 https://doi.org/10.1007/s10924-017-1085-3 214
Piemonte, V. (2011). Bioplastic Wastes: The Best Final Disposition for Energy Saving. Journal of 215 Polymers and the Environment. https://doi.org/10.1007/s10924-011-0343-z 216
Piemonte, V., & Gironi, F. (2011). Land-use change emissions: How green are the bioplastics? 217 Environmental Progress and Sustainable Energy, 30(4), 685–691. 218 https://doi.org/10.1002/ep.10518 219
Pladerer, C., Meissner, M., Dinkel, F., Zschokke, M., Dehoust, G., & Schuler, D. (2008). Comparative 220 Life Cycle Assessment of various Cup Systems for the Selling of Drinks at Events. BMLFUW 221 (Austrian Federal Ministry of Agriculture and Forestry, Environment and Water Management) 222 and BAFU (Swiss Federal Environment Authority). 223
Polybioskin. (2018). High performance functional bio-based polymers for skin-contact products in 224 the biomedical, cosmetic and sanitary industries. Retrieved October 5, 2018, from 225 http://polybioskin.eu/ 226
Postacchini, L., Bevilacqua, M., Paciarotti, C., & Mazzuto, G. (2016). LCA methodology applied to the 227 realisation of a domestic plate: confrontation among the use of three different raw materials. 228 International Journal of Productivity and Quality Management. 229 https://doi.org/10.1504/IJPQM.2016.076713 230
Potting, J., & van der Harst, E. (2015). Facility arrangements and the environmental performance of 231 disposable and reusable cups. International Journal of Life Cycle Assessment. 232 https://doi.org/10.1007/s11367-015-0914-7 233
Pro.Mo/Unionplast. (2015). Comparative Life Cycle Assessment (LCA) study of tableware for 234 alimentary use Disposable dishes in PP, PS, PLA, cellulose pulp and reusable ceramic dishes 235 Disposable glasses in PP, PS, PLA, PE coated cups and reusable glass cups. 236
Razza, F., Fieschi, M., Innocenti, F. D., & Bastioli, C. (2009). Compostable cutlery and waste 237 management: An LCA approach. Waste Management. 238 https://doi.org/10.1016/j.wasman.2008.08.021 239
Razza, F., Innocenti, F. D., Dobon, A., Aliaga, C., Sanchez, C., & Hortal, M. (2015). Environmental 240 profile of a bio-based and biodegradable foamed packaging prototype in comparison with the 241 current benchmark. Journal of Cleaner Production. 242 https://doi.org/10.1016/j.jclepro.2015.04.033 243
RefuCoat. (2018). Developing fully-recyclable food packaging with enhanced gas barrier properties 244 and new functionalities using high performance coatings. Retrieved October 5, 2018, from 245 https://www.refucoat.eu/ 246
Rossi, V., Cleeve-Edwards, N., Lundquist, L., Schenker, U., Dubois, C., Humbert, S., & Jolliet, O. 247 (2015). Life cycle assessment of end-of-life options for two biodegradable packaging materials: 248 Sound application of the European waste hierarchy. Journal of Cleaner Production. 249 https://doi.org/10.1016/j.jclepro.2014.08.049 250
Saibuatrong, W., Cheroennet, N., & Suwanmanee, U. (2017). Life cycle assessment focusing on the 251 waste management of conventional and bio-based garbage bags. Journal of Cleaner 252 Production. https://doi.org/10.1016/j.jclepro.2017.05.006 253
Shen, L., Worrell, E., & Patel, M. K. (2012). Comparing life cycle energy and GHG emissions of bio-254 based PET, recycled PET, PLA, and man-made cellulosics. Biofuels, Bioproducts and Biorefining, 255 6(6), 625–639. https://doi.org/10.1002/bbb.1368 256
Spekreijse, J., Lammens, T., Parisi, C., Ronzon, T., & Vis, M. (2018). Insights into the European market 257 of bio-based chemicals. Analysis based on ten key product categories (in press). European 258

Comparative LCA of alternative feedstock for plastics production – DRAFT FOR STAKEHOLDER CONSULTATION Part II
250
Commission, Directorate-General for the Joint Research Centre. 259 STAR-ProBio. (2018). Sustainability Transition Assessment and Research of Bio-based Products. 260
Retrieved October 5, 2018, from http://www.star-probio.eu/ 261 Stefanie Markwardt, Frank Wellenreuther, Andrea Drescher, Jonas Harth, & Mirjam Busch. (2017). 262
Comparative Life Cycle Assessment of Tetra Pak® carton packages and alternative packaging 263 systems for liquid food on the Nordic market. 264
Succinity. (2013). Biobased Polybutylene Succinate (PBS) – An attractive polymer for biopolymer 265 compounds. Succinity GmbH,. Retrieved from 266 http://www.succinity.com/images/succinity_Broschure_A5_WEB.compressed.pdf 267
Suwanmanee, U., Varabuntoonvit, V., Chaiwutthinan, P., Tajan, M., Mungcharoen, T., & Leejarkpai, 268 T. (2013). Life cycle assessment of single use thermoform boxes made from polystyrene (PS), 269 polylactic acid, (PLA), and PLA/starch: Cradle to consumer gate. International Journal of Life 270 Cycle Assessment. https://doi.org/10.1007/s11367-012-0479-7 271
Synbra. (2018). Synbra Technology bv. Retrieved October 18, 2018, from 272 https://www.synbratechnology.com/ 273
Thoden van Velzen. E.U., U., Brouwer, M. T., & Molenveld, K. (2016). Technical quality of rPET : 274 technical quality of rPET that can be obtained from Dutch PET bottles that have been collected, 275 sorted and mechanically recycled in different manners (Rapport / Wageningen UR Food & 276 Biobased Research : 1661). 943, , : Wageningen UR - Food & Biobased Research. Retrieved 277 from http://edepot.wur.nl/392306 278
Total-Corbion. (2018). Fibers & non-wovens - Waking up to the value of bioplastics. Retrieved 279 October 18, 2018, from https://www.total-corbion.com/markets/fibers-non-wovens/ 280
Uihlein, A., Ehrenberger, S., & Schebek, L. (2008). Utilisation options of renewable resources: a life 281 cycle assessment of selected products. Journal of Cleaner Production. 282 https://doi.org/10.1016/j.jclepro.2007.06.009 283
Valpack Consulting Consortium. (2010). Bioplastics: Assessing their environmental effects, barriers & 284 opportunities. 285
Van Den Oever, M., Molenveld, K., Van Der Zee, M., & Bos, H. (2017). Bio-based and biodegradable 286 plastics – Facts and Figures Focus on food packaging in the Netherlands, 67. 287
Van der Harst, E., & Potting, J. (2013). A critical comparison of ten disposable cup LCAs. 288 Environmental Impact Assessment Review. https://doi.org/10.1016/j.eiar.2013.06.006 289
van der Harst, E., Potting, J., & Kroeze, C. (2014). Multiple data sets and modelling choices in a 290 comparative LCA of disposable beverage cups. Science of the Total Environment. 291 https://doi.org/10.1016/j.scitotenv.2014.06.084 292
Vercalsteren, A., Spirinckx, C., & Geerken, T. (2010). Life cycle assessment and eco-efficiency analysis 293 of drinking cups used at public events. International Journal of Life Cycle Assessment. 294 https://doi.org/10.1007/s11367-009-0143-z 295
Vidal, R., Martínez, P., Mulet, E., González, R., López-Mesa, B., Fowler, P., & Fang, J. M. (2007). 296 Environmental assessment of biodegradable multilayer film derived from carbohydrate 297 polymers. Journal of Polymers and the Environment. https://doi.org/10.1007/s10924-007-298 0056-5 299
Vidal, R., Moliner, E., Martin, P. P., Fita, S., Wonneberger, M., Verdejo, E., … Gonzlez, A. (2018). Life 300 Cycle Assessment of Novel Aircraft Interior Panels Made from Renewable or Recyclable 301 Polymers with Natural Fiber Reinforcements and Non-Halogenated Flame Retardants. Journal 302 of Industrial Ecology, 22(1), 132–144. https://doi.org/10.1111/jiec.12544 303
Vink, E. T. H., & Davies, S. (2015). Life Cycle Inventory and Impact Assessment Data for 2014 Ingeo 304 \textless sup \textgreater TM \textless /sup \textgreater Polylactide Production. Industrial 305 Biotechnology, 11(3), 167–180. https://doi.org/10.1089/ind.2015.0003 306
Wolfensberger, U., & Dinkel, F. (1997). Beurteilung nachwachsender Rohstoffe in der Schweiz in den 307 Jahren 1993-1996 : vergleichende Betrachtung von Produkten aus ausgewahlten NWR und 308 entsprechenden konventionellen Produkten bezuglich Umweltwirkungen und 309

Comparative LCA of alternative feedstock for plastics production – DRAFT FOR STAKEHOLDER CONSULTATION Part II
251
Wirtschaftlichkeit(Comparative assessm. Bern, Switzerland: Eidgenössische Forschungsanstalt 310 für Agrarwirtschaft und Landtechnik (FAT) and CARBOTECH for the Federal Office of 311 Agriculture,. 312
Wötzel, K., Wirth, R., & Flake, M. (1999). Life cycle studies on hemp fibre reinforced components and 313 ABS for automotive parts, 272(1), 121–127. https://doi.org/doi:10.1002/(SICI)1522-314 9505(19991201)272:1<121::AID-APMC121>3.0.CO;2-T 315
Yuki, S. (2012). Life Cycle Assessment of Biodegradable Plastics. Journal of Shanghai Jiaotong 316 University, 17(3), 327–329. https://doi.org/10.1007/s12204-012-1279-8 317
318

Comparative LCA of alternative feedstock for plastics production – DRAFT FOR STAKEHOLDER CONSULTATION Part II
252
Annex B. Additional LCIA results of the screening case studies 319
B.1 Beverage bottle LCA scenarios 320
Table B.1.1: Characterised LCIA results for the beverage bottle screening case study 321
322
Table B.1.2: Normalised LCIA results (person-equivalent PE) for the beverage bottle screening 323 case study 324
Impact Category
Scenario
PET HDPE R-PET Bio-PET PLA PEF
Climate Change [kg CO2 eq.] 5.94E+01 1.36E+02 4.66E+01 7.69E+01 5.95E+01 4.15E+03
Ozone Depletion [kg CFC-11 eq.] 2.96E-09 8.86E-09 1.20E-08 2.28E-09 1.46E-08 1.83E-05
Human Toxicity - cancer [CTUh] 8.22E-07 2.58E-06 7.90E-07 1.03E-06 3.39E-07 7.82E-06
Human Toxicity – non-cancer [CTUh] 3.11E-06 7.82E-06 1.67E-06 4.21E-06 1.41E-06 1.27E-04
Particulate Matter [Disease incidence] 1.64E-06 2.79E-06 1.06E-06 1.80E-05 2.12E-06 1.37E-04
Ionising Radiation [kBq U235 eq.] 4.22E+00 7.72E+00 4.55E+00 4.67E+00 3.87E+00 1.71E+03
Photochemical Ozone Formation [kg NMVOC eq.] 1.14E-01 3.32E-01 7.95E-02 2.11E-01 2.45E-01 6.89E+00
Acidification [mol H+ eq.] 1.39E-01 3.72E-01 1.06E-01 2.31E-01 3.14E-01 1.29E+01
Eutrophication Terrestrial [mol N eq.] 4.47E-01 1.14E+00 3.48E-01 7.87E-01 1.05E+00 2.67E+01
Eutrophication Freshwater [kg P eq.] 4.41E-04 2.57E-03 6.04E-04 8.97E-04 4.05E-04 3.23E-02
Eutrophication Marine [kg N eq.] 4.09E-02 1.10E-01 3.18E-02 1.97E-01 1.04E-01 2.67E+00
Ecotoxicity Freshwater [CTUe] 1.68E+01 4.91E+01 1.96E+01 1.64E+01 6.77E+00 9.53E+02
Land Use [Pt] 1.58E+02 3.50E+02 1.40E+02 7.64E+02 4.84E+03 3.27E+04
Water Use [m³ world eq.] -4.34E+01 -1.44E+02 1.11E+01 2.82E+01 3.87E+01 -1.37E+04
Resource Use - minerals and metals [kg Sb eq.] 6.94E-03 7.26E-05 2.42E-03 -2.10E-03 -1.03E-03 1.60E-04
Resource Use - fossils [MJ] 1.13E+03 3.40E+03 6.19E+02 1.22E+03 7.72E+02 7.06E+04
Impact Category
Scenario
PET HDPE R-PET Bio-PET PLA PEF
Climate Change 7.66E-03 1.75E-02 6.01E-03 9.91E-03 7.67E-03 5.35E-01
Ozone Depletion 1.27E-07 3.79E-07 5.14E-07 9.76E-08 6.25E-07 7.84E-04
Human Toxicity - cancer 2.13E-02 6.70E-02 2.05E-02 2.67E-02 8.80E-03 2.03E-01
Human Toxicity – non-cancer 6.55E-03 1.65E-02 3.52E-03 8.87E-03 2.97E-03 2.67E-01
Particulate Matter 2.58E-03 4.38E-03 1.66E-03 2.83E-02 3.33E-03 2.15E-01
Ionising Radiation 1.00E-03 1.83E-03 1.08E-03 1.11E-03 9.17E-04 4.05E-01
Photochemical Ozone Formation 2.81E-03 8.18E-03 1.96E-03 5.20E-03 6.03E-03 1.70E-01
Acidification 2.50E-03 6.70E-03 1.91E-03 4.16E-03 5.65E-03 2.32E-01
Eutrophication Terrestrial 2.53E-03 6.44E-03 1.97E-03 4.45E-03 5.93E-03 1.51E-01
Eutrophication Freshwater 1.73E-04 1.01E-03 2.37E-04 3.51E-04 1.59E-04 1.27E-02
Eutrophication Marine 1.45E-03 3.89E-03 1.12E-03 6.97E-03 3.68E-03 9.44E-02
Ecotoxicity Freshwater 1.42E-03 4.16E-03 1.66E-03 1.39E-03 5.73E-04 8.07E-02
Land Use 1.18E-04 2.62E-04 1.05E-04 5.73E-04 3.63E-03 2.45E-02
Water Use -3.78E-03 -1.26E-02 9.68E-04 2.46E-03 3.37E-03 -1.19E+00
Resource Use - minerals and metals 1.20E-01 1.25E-03 4.18E-02 -3.63E-02 -1.78E-02 2.77E-03
Resource Use - fossils 1.73E-02 5.21E-02 9.49E-03 1.87E-02 1.18E-02 1.08E+00

Comparative LCA of alternative feedstock for plastics production – DRAFT FOR STAKEHOLDER CONSULTATION Part II
253
325
Table B.1.3: Weighted LCIA results for the beverage bottle screening case study 326
327
328
329
Impact Category
Scenario
PET HDPE R-PET Bio-PET PLA PEF
Climate Change 1.74E-01 4.04E-01 1.37E-01 2.26E-01 1.75E-01 1.23E+01
Ozone Depletion 8.66E-07 2.62E-06 3.51E-06 6.67E-07 4.27E-06 5.41E-03
Human Toxicity - cancer 4.91E-02 1.56E-01 4.72E-02 6.15E-02 2.02E-02 4.73E-01
Human Toxicity – non-cancer 1.30E-02 3.31E-02 7.00E-03 1.76E-02 5.91E-03 5.38E-01
Particulate Matter 2.50E-02 4.29E-02 1.61E-02 2.74E-01 3.23E-02 2.11E+00
Ionising Radiation 5.42E-03 1.00E-02 5.84E-03 6.00E-03 4.97E-03 2.22E+00
Photochemical Ozone Formation 1.45E-02 4.27E-02 1.01E-02 2.69E-02 3.12E-02 8.86E-01
Acidification 1.68E-02 4.54E-02 1.28E-02 2.79E-02 3.79E-02 1.57E+00
Eutrophication Terrestrial 1.01E-02 2.62E-02 7.89E-03 1.78E-02 2.38E-02 6.13E-01
Eutrophication Freshwater 5.24E-04 3.08E-03 7.17E-04 1.06E-03 4.81E-04 3.87E-02
Eutrophication Marine 4.63E-03 1.26E-02 3.60E-03 2.23E-02 1.18E-02 3.06E-01
Ecotoxicity Freshwater 2.96E-03 8.73E-03 3.45E-03 2.89E-03 1.19E-03 1.69E-01
Land Use 1.02E-03 2.28E-03 9.01E-04 4.92E-03 3.12E-02 2.13E-01
Water Use -3.48E-02 0.00E+00 8.90E-03 2.26E-02 3.10E-02 0.00E+00
Resource Use - minerals and metals 0.00E+00 1.04E-02 0.00E+00 0.00E+00 0.00E+00 2.28E-02
Resource Use - fossils 1.56E-1 4.74E-01 8.54E-02 1.68E-01 1.06E-01 9.83E+00
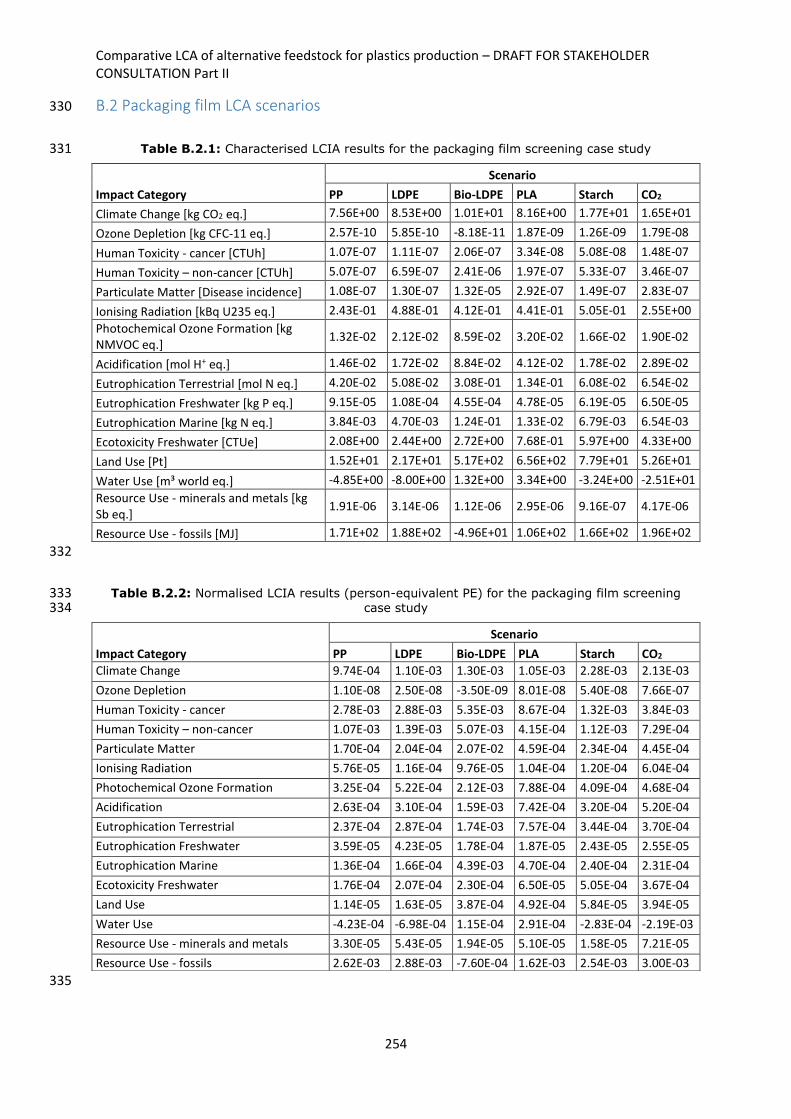
Comparative LCA of alternative feedstock for plastics production – DRAFT FOR STAKEHOLDER CONSULTATION Part II
254
B.2 Packaging film LCA scenarios 330
Table B.2.1: Characterised LCIA results for the packaging film screening case study 331
332
Table B.2.2: Normalised LCIA results (person-equivalent PE) for the packaging film screening 333 case study 334
335
Impact Category
Scenario
PP LDPE Bio-LDPE PLA Starch CO2
Climate Change [kg CO2 eq.] 7.56E+00 8.53E+00 1.01E+01 8.16E+00 1.77E+01 1.65E+01
Ozone Depletion [kg CFC-11 eq.] 2.57E-10 5.85E-10 -8.18E-11 1.87E-09 1.26E-09 1.79E-08
Human Toxicity - cancer [CTUh] 1.07E-07 1.11E-07 2.06E-07 3.34E-08 5.08E-08 1.48E-07
Human Toxicity – non-cancer [CTUh] 5.07E-07 6.59E-07 2.41E-06 1.97E-07 5.33E-07 3.46E-07
Particulate Matter [Disease incidence] 1.08E-07 1.30E-07 1.32E-05 2.92E-07 1.49E-07 2.83E-07
Ionising Radiation [kBq U235 eq.] 2.43E-01 4.88E-01 4.12E-01 4.41E-01 5.05E-01 2.55E+00
Photochemical Ozone Formation [kg NMVOC eq.]
1.32E-02 2.12E-02 8.59E-02 3.20E-02 1.66E-02 1.90E-02
Acidification [mol H+ eq.] 1.46E-02 1.72E-02 8.84E-02 4.12E-02 1.78E-02 2.89E-02
Eutrophication Terrestrial [mol N eq.] 4.20E-02 5.08E-02 3.08E-01 1.34E-01 6.08E-02 6.54E-02
Eutrophication Freshwater [kg P eq.] 9.15E-05 1.08E-04 4.55E-04 4.78E-05 6.19E-05 6.50E-05
Eutrophication Marine [kg N eq.] 3.84E-03 4.70E-03 1.24E-01 1.33E-02 6.79E-03 6.54E-03
Ecotoxicity Freshwater [CTUe] 2.08E+00 2.44E+00 2.72E+00 7.68E-01 5.97E+00 4.33E+00
Land Use [Pt] 1.52E+01 2.17E+01 5.17E+02 6.56E+02 7.79E+01 5.26E+01
Water Use [m³ world eq.] -4.85E+00 -8.00E+00 1.32E+00 3.34E+00 -3.24E+00 -2.51E+01
Resource Use - minerals and metals [kg Sb eq.]
1.91E-06 3.14E-06 1.12E-06 2.95E-06 9.16E-07 4.17E-06
Resource Use - fossils [MJ] 1.71E+02 1.88E+02 -4.96E+01 1.06E+02 1.66E+02 1.96E+02
Impact Category
Scenario
PP LDPE Bio-LDPE PLA Starch CO2
Climate Change 9.74E-04 1.10E-03 1.30E-03 1.05E-03 2.28E-03 2.13E-03
Ozone Depletion 1.10E-08 2.50E-08 -3.50E-09 8.01E-08 5.40E-08 7.66E-07
Human Toxicity - cancer 2.78E-03 2.88E-03 5.35E-03 8.67E-04 1.32E-03 3.84E-03
Human Toxicity – non-cancer 1.07E-03 1.39E-03 5.07E-03 4.15E-04 1.12E-03 7.29E-04
Particulate Matter 1.70E-04 2.04E-04 2.07E-02 4.59E-04 2.34E-04 4.45E-04
Ionising Radiation 5.76E-05 1.16E-04 9.76E-05 1.04E-04 1.20E-04 6.04E-04
Photochemical Ozone Formation 3.25E-04 5.22E-04 2.12E-03 7.88E-04 4.09E-04 4.68E-04
Acidification 2.63E-04 3.10E-04 1.59E-03 7.42E-04 3.20E-04 5.20E-04
Eutrophication Terrestrial 2.37E-04 2.87E-04 1.74E-03 7.57E-04 3.44E-04 3.70E-04
Eutrophication Freshwater 3.59E-05 4.23E-05 1.78E-04 1.87E-05 2.43E-05 2.55E-05
Eutrophication Marine 1.36E-04 1.66E-04 4.39E-03 4.70E-04 2.40E-04 2.31E-04
Ecotoxicity Freshwater 1.76E-04 2.07E-04 2.30E-04 6.50E-05 5.05E-04 3.67E-04
Land Use 1.14E-05 1.63E-05 3.87E-04 4.92E-04 5.84E-05 3.94E-05
Water Use -4.23E-04 -6.98E-04 1.15E-04 2.91E-04 -2.83E-04 -2.19E-03
Resource Use - minerals and metals 3.30E-05 5.43E-05 1.94E-05 5.10E-05 1.58E-05 7.21E-05
Resource Use - fossils 2.62E-03 2.88E-03 -7.60E-04 1.62E-03 2.54E-03 3.00E-03

Comparative LCA of alternative feedstock for plastics production – DRAFT FOR STAKEHOLDER CONSULTATION Part II
255
Table B.2.3: Weighted LCIA results for the packaging film screening case study 336
337
338
339
Impact Category
Scenario
PP LDPE Bio-LDPE PLA Starch CO2
Climate Change 2.05E-02 2.32E-02 2.74E-02 2.22E-02 4.80E-02 4.48E-02
Ozone Depletion 6.94E-08 1.58E-07 -2.21E-08 5.05E-07 3.40E-07 4.84E-06
Human Toxicity - cancer 5.92E-03 6.14E-03 1.14E-02 1.85E-03 2.81E-03 8.19E-03
Human Toxicity – non-cancer 1.96E-03 2.55E-03 9.34E-03 7.63E-04 2.07E-03 1.34E-03
Particulate Matter 1.52E-03 1.83E-03 1.86E-01 4.11E-03 2.10E-03 3.98E-03
Ionising Radiation 2.88E-04 5.79E-04 4.89E-04 5.24E-04 6.00E-04 3.03E-03
Photochemical Ozone Formation 1.55E-03 2.50E-03 1.01E-02 3.77E-03 1.95E-03 2.24E-03
Acidification 1.63E-03 1.92E-03 9.87E-03 4.60E-03 1.99E-03 3.23E-03
Eutrophication Terrestrial 8.81E-04 1.07E-03 6.46E-03 2.81E-03 1.27E-03 1.37E-03
Eutrophication Freshwater 1.00E-04 1.18E-04 4.99E-04 5.24E-05 6.79E-05 7.13E-05
Eutrophication Marine 4.02E-04 4.92E-04 1.30E-02 1.39E-03 7.11E-04 6.85E-04
Ecotoxicity Freshwater 3.38E-04 3.97E-04 4.42E-04 1.25E-04 9.70E-04 7.04E-04
Land Use 9.04E-05 1.29E-04 3.08E-03 3.90E-03 4.64E-04 3.13E-04
Water Use -3.60E-03 -5.94E-03 9.79E-04 2.48E-03 -2.40E-03 -1.86E-02
Resource Use - minerals and metals 2.49E-04 4.10E-04 1.46E-04 3.85E-04 1.20E-04 5.44E-04
Resource Use - fossils 2.18E-02 2.40E-02 -6.32E-03 1.35E-02 2.12E-02 2.50E-02
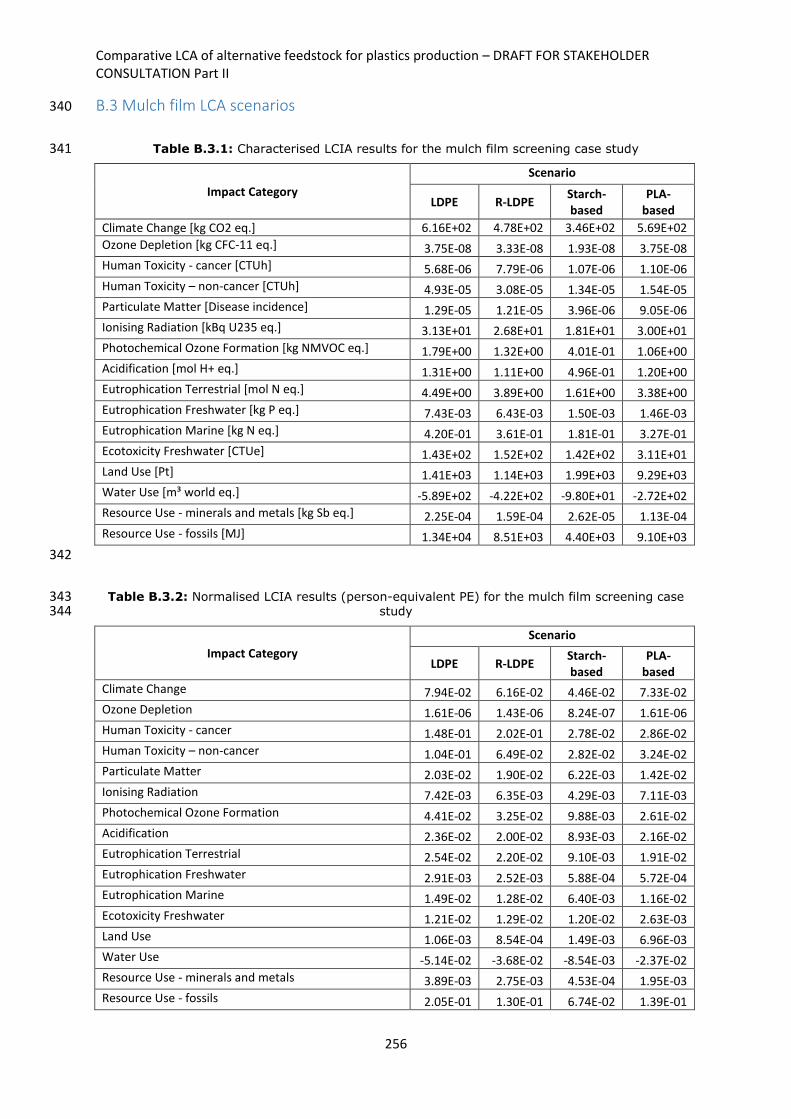
Comparative LCA of alternative feedstock for plastics production – DRAFT FOR STAKEHOLDER CONSULTATION Part II
256
B.3 Mulch film LCA scenarios 340
Table B.3.1: Characterised LCIA results for the mulch film screening case study 341
Impact Category
Scenario
LDPE R-LDPE Starch-based
PLA-based
Climate Change [kg CO2 eq.] 6.16E+02 4.78E+02 3.46E+02 5.69E+02
Ozone Depletion [kg CFC-11 eq.] 3.75E-08 3.33E-08 1.93E-08 3.75E-08
Human Toxicity - cancer [CTUh] 5.68E-06 7.79E-06 1.07E-06 1.10E-06
Human Toxicity – non-cancer [CTUh] 4.93E-05 3.08E-05 1.34E-05 1.54E-05
Particulate Matter [Disease incidence] 1.29E-05 1.21E-05 3.96E-06 9.05E-06
Ionising Radiation [kBq U235 eq.] 3.13E+01 2.68E+01 1.81E+01 3.00E+01
Photochemical Ozone Formation [kg NMVOC eq.] 1.79E+00 1.32E+00 4.01E-01 1.06E+00
Acidification [mol H+ eq.] 1.31E+00 1.11E+00 4.96E-01 1.20E+00
Eutrophication Terrestrial [mol N eq.] 4.49E+00 3.89E+00 1.61E+00 3.38E+00
Eutrophication Freshwater [kg P eq.] 7.43E-03 6.43E-03 1.50E-03 1.46E-03
Eutrophication Marine [kg N eq.] 4.20E-01 3.61E-01 1.81E-01 3.27E-01
Ecotoxicity Freshwater [CTUe] 1.43E+02 1.52E+02 1.42E+02 3.11E+01
Land Use [Pt] 1.41E+03 1.14E+03 1.99E+03 9.29E+03
Water Use [m³ world eq.] -5.89E+02 -4.22E+02 -9.80E+01 -2.72E+02
Resource Use - minerals and metals [kg Sb eq.] 2.25E-04 1.59E-04 2.62E-05 1.13E-04
Resource Use - fossils [MJ] 1.34E+04 8.51E+03 4.40E+03 9.10E+03
342
Table B.3.2: Normalised LCIA results (person-equivalent PE) for the mulch film screening case 343 study 344
Impact Category
Scenario
LDPE R-LDPE Starch-based
PLA-based
Climate Change 7.94E-02 6.16E-02 4.46E-02 7.33E-02
Ozone Depletion 1.61E-06 1.43E-06 8.24E-07 1.61E-06
Human Toxicity - cancer 1.48E-01 2.02E-01 2.78E-02 2.86E-02
Human Toxicity – non-cancer 1.04E-01 6.49E-02 2.82E-02 3.24E-02
Particulate Matter 2.03E-02 1.90E-02 6.22E-03 1.42E-02
Ionising Radiation 7.42E-03 6.35E-03 4.29E-03 7.11E-03
Photochemical Ozone Formation 4.41E-02 3.25E-02 9.88E-03 2.61E-02
Acidification 2.36E-02 2.00E-02 8.93E-03 2.16E-02
Eutrophication Terrestrial 2.54E-02 2.20E-02 9.10E-03 1.91E-02
Eutrophication Freshwater 2.91E-03 2.52E-03 5.88E-04 5.72E-04
Eutrophication Marine 1.49E-02 1.28E-02 6.40E-03 1.16E-02
Ecotoxicity Freshwater 1.21E-02 1.29E-02 1.20E-02 2.63E-03
Land Use 1.06E-03 8.54E-04 1.49E-03 6.96E-03
Water Use -5.14E-02 -3.68E-02 -8.54E-03 -2.37E-02
Resource Use - minerals and metals 3.89E-03 2.75E-03 4.53E-04 1.95E-03
Resource Use - fossils 2.05E-01 1.30E-01 6.74E-02 1.39E-01
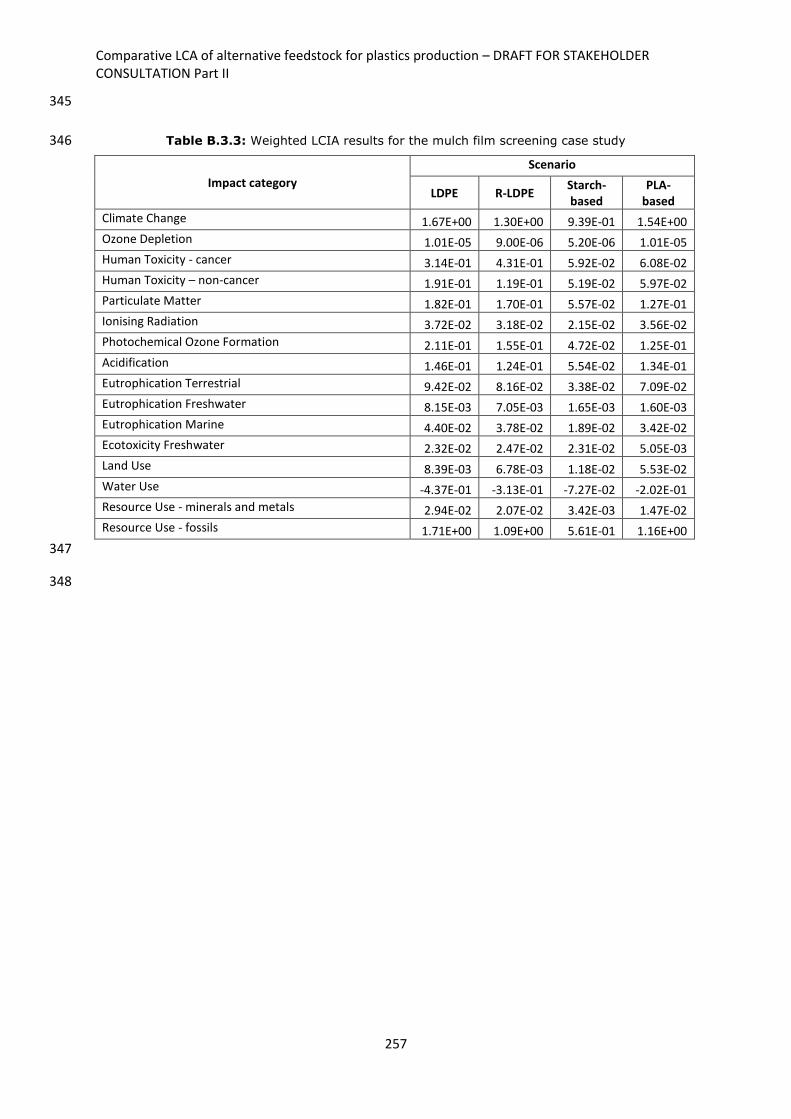
Comparative LCA of alternative feedstock for plastics production – DRAFT FOR STAKEHOLDER CONSULTATION Part II
257
345
Table B.3.3: Weighted LCIA results for the mulch film screening case study 346
Impact category
Scenario
LDPE R-LDPE Starch-based
PLA-based
Climate Change 1.67E+00 1.30E+00 9.39E-01 1.54E+00
Ozone Depletion 1.01E-05 9.00E-06 5.20E-06 1.01E-05
Human Toxicity - cancer 3.14E-01 4.31E-01 5.92E-02 6.08E-02
Human Toxicity – non-cancer 1.91E-01 1.19E-01 5.19E-02 5.97E-02
Particulate Matter 1.82E-01 1.70E-01 5.57E-02 1.27E-01
Ionising Radiation 3.72E-02 3.18E-02 2.15E-02 3.56E-02
Photochemical Ozone Formation 2.11E-01 1.55E-01 4.72E-02 1.25E-01
Acidification 1.46E-01 1.24E-01 5.54E-02 1.34E-01
Eutrophication Terrestrial 9.42E-02 8.16E-02 3.38E-02 7.09E-02
Eutrophication Freshwater 8.15E-03 7.05E-03 1.65E-03 1.60E-03
Eutrophication Marine 4.40E-02 3.78E-02 1.89E-02 3.42E-02
Ecotoxicity Freshwater 2.32E-02 2.47E-02 2.31E-02 5.05E-03
Land Use 8.39E-03 6.78E-03 1.18E-02 5.53E-02
Water Use -4.37E-01 -3.13E-01 -7.27E-02 -2.02E-01
Resource Use - minerals and metals 2.94E-02 2.07E-02 3.42E-03 1.47E-02
Resource Use - fossils 1.71E+00 1.09E+00 5.61E-01 1.16E+00
347
348

Comparative LCA of alternative feedstock for plastics production – DRAFT FOR STAKEHOLDER CONSULTATION Part II
258
B.4 Insulation board LCA scenarios 349
Table B.4.1: Characterised LCIA results for the insulation board screening case study 350
351
Table B.4.2: Normalised LCIA results (person-equivalent PE) for the insulation board screening 352 case study 353
354
Impact Category
Scenario
PUR EPS R-PET CO2-PUR Bio-PUR
Climate Change [kg CO2 eq.] 3.2E+00 4.1E+00 3.2E+00 3.9E+00 5.0E+00
Ozone Depletion [kg CFC-11 eq.] 4.0E-06 8.7E-09 2.4E-06 4.0E-06 4.0E-06
Human Toxicity - cancer [CTUh] 1.4E-08 1.5E-08 1.4E-08 1.8E-08 5.4E-08
Human Toxicity – non-cancer [CTUh] 4.2E-07 1.1E-07 2.6E-07 5.3E-08 1.8E-06
Particulate Matter [Disease incidence] 5.1E-08 5.0E-08 4.5E-08 8.5E-08 8.4E-08
Ionising Radiation [kBq U235 eq.] 8.8E-02 -5.0E-03 2.0E-01 5.0E-01 1.1E-01
Photochemical Ozone Formation [kg NMVOC eq.]
7.0E-03 5.5E-03 5.5E-03 9.6E-03 8.1E-03
Acidification [mol H+ eq.] 6.6E-03 7.3E-03 5.7E-03 8.7E-03 1.0E-02
Eutrophication Terrestrial [mol N eq.] 2.2E-02 1.8E-02 1.9E-02 2.6E-02 3.8E-02
Eutrophication Freshwater [kg P eq.] 2.5E-05 1.3E-05 2.4E-05 2.4E-05 3.7E-04
Eutrophication Marine [kg N eq.] 1.9E-03 1.6E-03 1.7E-03 2.4E-03 7.3E-03
Ecotoxicity Freshwater [CTUe] 9.2E-01 3.2E-01 6.5E-01 1.2E+00 9.6E+00
Land Use [Pt] 2.0E+01 1.3E+00 1.5E+01 5.7E+00 3.4E+02
Water Use [m³ world eq.] 1.4E+00 5.5E-01 -1.1E+00 1.4E+00 7.7E-01
Resource Use - minerals and metals [kg Sb eq.]
5.7E+01 7.9E+01 4.0E+01 6.4E+01 3.9E+01
Resource Use - fossils [MJ] 5.0E-06 1.0E-06 3.2E-06 1.5E-05 3.6E-06
Impact Category
Scenario
PUR EPS R-PET CO2-PUR Bio-PUR
Climate Change 4.2E-04 5.3E-04 4.1E-04 5.1E-04 6.4E-04
Ozone Depletion 1.7E-04 3.7E-07 1.0E-04 1.7E-04 1.7E-04
Human Toxicity - cancer 3.5E-04 4.0E-04 3.7E-04 4.6E-04 1.4E-03
Human Toxicity – non-cancer 8.8E-04 2.4E-04 5.4E-04 1.1E-04 3.9E-03
Particulate Matter 8.0E-05 7.9E-05 7.1E-05 1.3E-04 1.3E-04
Ionising Radiation 2.1E-05 -1.2E-06 4.7E-05 1.2E-04 2.7E-05
Photochemical Ozone Formation 1.7E-04 1.3E-04 1.4E-04 2.4E-04 2.0E-04
Acidification 1.2E-04 1.3E-04 1.0E-04 1.6E-04 1.8E-04
Eutrophication Terrestrial 1.2E-04 1.0E-04 1.1E-04 1.4E-04 2.2E-04
Eutrophication Freshwater 9.7E-06 5.1E-06 9.5E-06 9.3E-06 1.4E-04
Eutrophication Marine 6.8E-05 5.7E-05 6.1E-05 8.5E-05 2.6E-04
Ecotoxicity Freshwater 7.8E-05 2.7E-05 5.5E-05 1.0E-04 8.2E-04
Land Use 1.5E-05 9.9E-07 1.1E-05 4.3E-06 2.6E-04
Water Use 1.2E-04 4.8E-05 -9.7E-05 1.2E-04 6.7E-05
Resource Use - minerals and metals 8.7E-05 1.8E-05 5.6E-05 2.6E-04 6.3E-05
Resource Use - fossils 8.8E-04 1.2E-03 6.2E-04 9.8E-04 5.9E-04
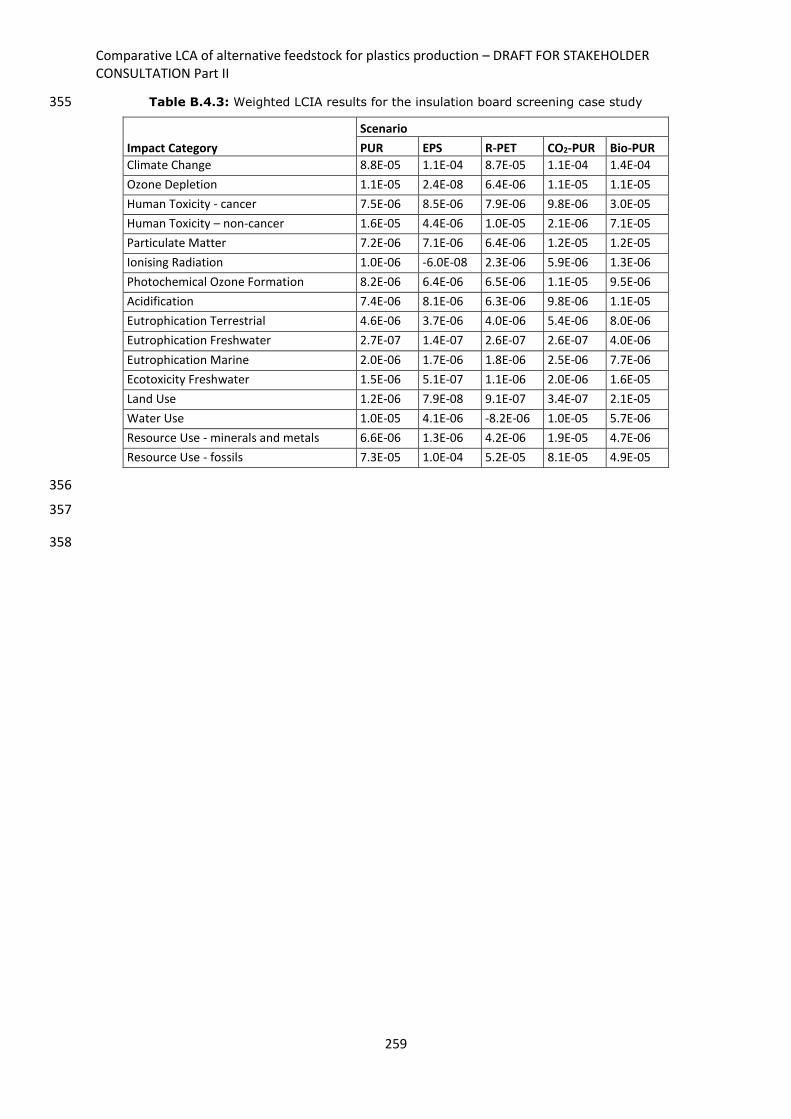
Comparative LCA of alternative feedstock for plastics production – DRAFT FOR STAKEHOLDER CONSULTATION Part II
259
Table B.4.3: Weighted LCIA results for the insulation board screening case study 355
356
357
358
Impact Category
Scenario
PUR EPS R-PET CO2-PUR Bio-PUR
Climate Change 8.8E-05 1.1E-04 8.7E-05 1.1E-04 1.4E-04
Ozone Depletion 1.1E-05 2.4E-08 6.4E-06 1.1E-05 1.1E-05
Human Toxicity - cancer 7.5E-06 8.5E-06 7.9E-06 9.8E-06 3.0E-05
Human Toxicity – non-cancer 1.6E-05 4.4E-06 1.0E-05 2.1E-06 7.1E-05
Particulate Matter 7.2E-06 7.1E-06 6.4E-06 1.2E-05 1.2E-05
Ionising Radiation 1.0E-06 -6.0E-08 2.3E-06 5.9E-06 1.3E-06
Photochemical Ozone Formation 8.2E-06 6.4E-06 6.5E-06 1.1E-05 9.5E-06
Acidification 7.4E-06 8.1E-06 6.3E-06 9.8E-06 1.1E-05
Eutrophication Terrestrial 4.6E-06 3.7E-06 4.0E-06 5.4E-06 8.0E-06
Eutrophication Freshwater 2.7E-07 1.4E-07 2.6E-07 2.6E-07 4.0E-06
Eutrophication Marine 2.0E-06 1.7E-06 1.8E-06 2.5E-06 7.7E-06
Ecotoxicity Freshwater 1.5E-06 5.1E-07 1.1E-06 2.0E-06 1.6E-05
Land Use 1.2E-06 7.9E-08 9.1E-07 3.4E-07 2.1E-05
Water Use 1.0E-05 4.1E-06 -8.2E-06 1.0E-05 5.7E-06
Resource Use - minerals and metals 6.6E-06 1.3E-06 4.2E-06 1.9E-05 4.7E-06
Resource Use - fossils 7.3E-05 1.0E-04 5.2E-05 8.1E-05 4.9E-05
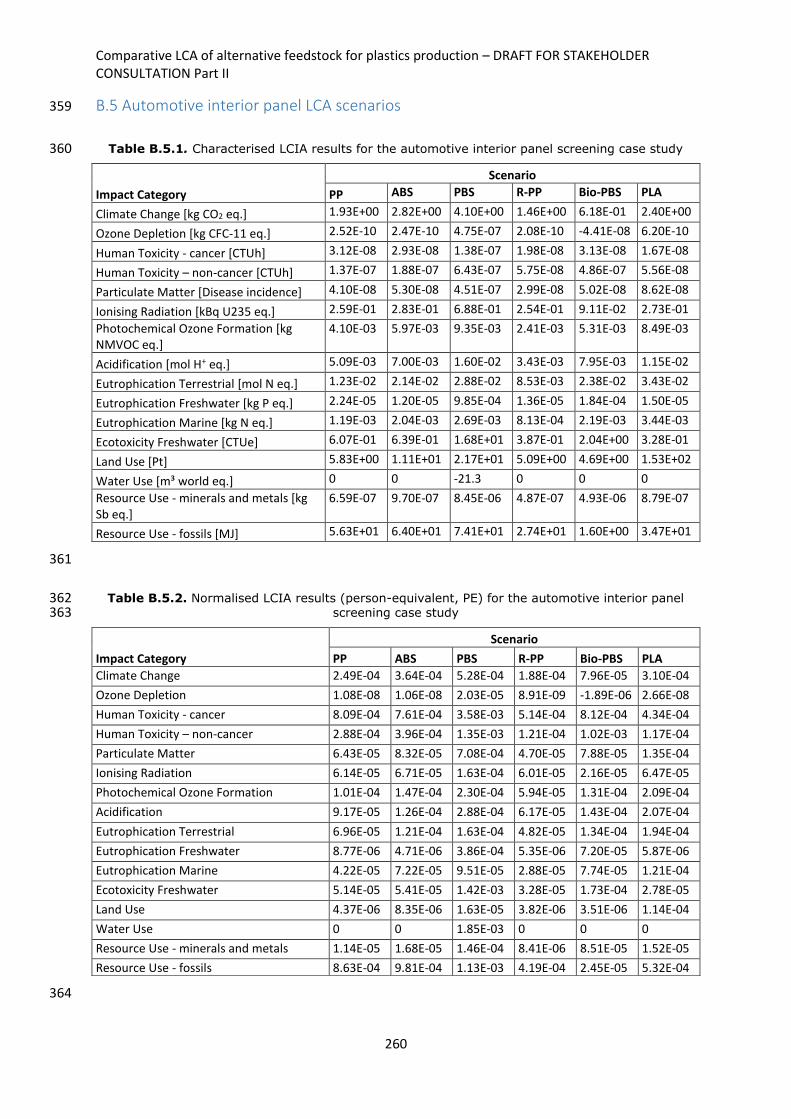
Comparative LCA of alternative feedstock for plastics production – DRAFT FOR STAKEHOLDER CONSULTATION Part II
260
B.5 Automotive interior panel LCA scenarios 359
Table B.5.1. Characterised LCIA results for the automotive interior panel screening case study 360
361
Table B.5.2. Normalised LCIA results (person-equivalent, PE) for the automotive interior panel 362 screening case study 363
364
Impact Category
Scenario
PP ABS PBS R-PP Bio-PBS PLA
Climate Change [kg CO2 eq.] 1.93E+00 2.82E+00 4.10E+00 1.46E+00 6.18E-01 2.40E+00
Ozone Depletion [kg CFC-11 eq.] 2.52E-10 2.47E-10 4.75E-07 2.08E-10 -4.41E-08 6.20E-10
Human Toxicity - cancer [CTUh] 3.12E-08 2.93E-08 1.38E-07 1.98E-08 3.13E-08 1.67E-08
Human Toxicity – non-cancer [CTUh] 1.37E-07 1.88E-07 6.43E-07 5.75E-08 4.86E-07 5.56E-08
Particulate Matter [Disease incidence] 4.10E-08 5.30E-08 4.51E-07 2.99E-08 5.02E-08 8.62E-08
Ionising Radiation [kBq U235 eq.] 2.59E-01 2.83E-01 6.88E-01 2.54E-01 9.11E-02 2.73E-01
Photochemical Ozone Formation [kg NMVOC eq.]
4.10E-03 5.97E-03 9.35E-03 2.41E-03 5.31E-03 8.49E-03
Acidification [mol H+ eq.] 5.09E-03 7.00E-03 1.60E-02 3.43E-03 7.95E-03 1.15E-02
Eutrophication Terrestrial [mol N eq.] 1.23E-02 2.14E-02 2.88E-02 8.53E-03 2.38E-02 3.43E-02
Eutrophication Freshwater [kg P eq.] 2.24E-05 1.20E-05 9.85E-04 1.36E-05 1.84E-04 1.50E-05
Eutrophication Marine [kg N eq.] 1.19E-03 2.04E-03 2.69E-03 8.13E-04 2.19E-03 3.44E-03
Ecotoxicity Freshwater [CTUe] 6.07E-01 6.39E-01 1.68E+01 3.87E-01 2.04E+00 3.28E-01
Land Use [Pt] 5.83E+00 1.11E+01 2.17E+01 5.09E+00 4.69E+00 1.53E+02
Water Use [m³ world eq.] 0 0 -21.3 0 0 0
Resource Use - minerals and metals [kg Sb eq.]
6.59E-07 9.70E-07 8.45E-06 4.87E-07 4.93E-06 8.79E-07
Resource Use - fossils [MJ] 5.63E+01 6.40E+01 7.41E+01 2.74E+01 1.60E+00 3.47E+01
Impact Category
Scenario
PP ABS PBS R-PP Bio-PBS PLA
Climate Change 2.49E-04 3.64E-04 5.28E-04 1.88E-04 7.96E-05 3.10E-04
Ozone Depletion 1.08E-08 1.06E-08 2.03E-05 8.91E-09 -1.89E-06 2.66E-08
Human Toxicity - cancer 8.09E-04 7.61E-04 3.58E-03 5.14E-04 8.12E-04 4.34E-04
Human Toxicity – non-cancer 2.88E-04 3.96E-04 1.35E-03 1.21E-04 1.02E-03 1.17E-04
Particulate Matter 6.43E-05 8.32E-05 7.08E-04 4.70E-05 7.88E-05 1.35E-04
Ionising Radiation 6.14E-05 6.71E-05 1.63E-04 6.01E-05 2.16E-05 6.47E-05
Photochemical Ozone Formation 1.01E-04 1.47E-04 2.30E-04 5.94E-05 1.31E-04 2.09E-04
Acidification 9.17E-05 1.26E-04 2.88E-04 6.17E-05 1.43E-04 2.07E-04
Eutrophication Terrestrial 6.96E-05 1.21E-04 1.63E-04 4.82E-05 1.34E-04 1.94E-04
Eutrophication Freshwater 8.77E-06 4.71E-06 3.86E-04 5.35E-06 7.20E-05 5.87E-06
Eutrophication Marine 4.22E-05 7.22E-05 9.51E-05 2.88E-05 7.74E-05 1.21E-04
Ecotoxicity Freshwater 5.14E-05 5.41E-05 1.42E-03 3.28E-05 1.73E-04 2.78E-05
Land Use 4.37E-06 8.35E-06 1.63E-05 3.82E-06 3.51E-06 1.14E-04
Water Use 0 0 1.85E-03 0 0 0
Resource Use - minerals and metals 1.14E-05 1.68E-05 1.46E-04 8.41E-06 8.51E-05 1.52E-05
Resource Use - fossils 8.63E-04 9.81E-04 1.13E-03 4.19E-04 2.45E-05 5.32E-04
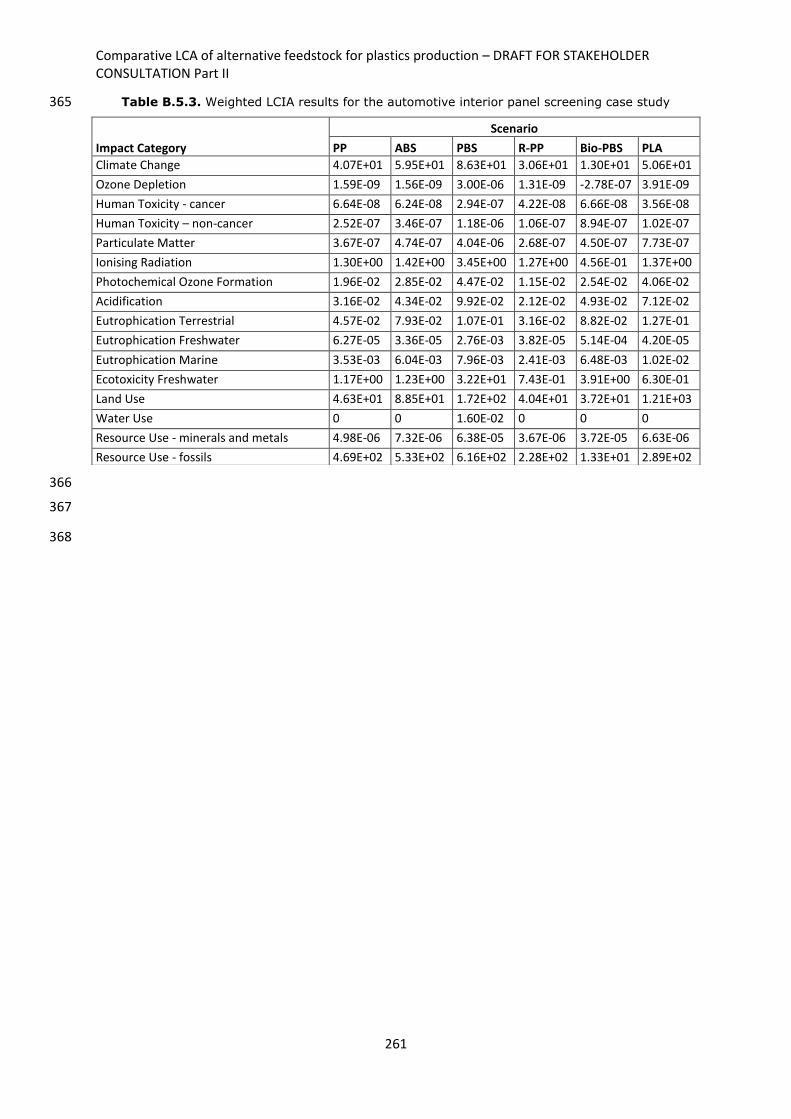
Comparative LCA of alternative feedstock for plastics production – DRAFT FOR STAKEHOLDER CONSULTATION Part II
261
Table B.5.3. Weighted LCIA results for the automotive interior panel screening case study 365
366
367
368
Impact Category
Scenario
PP ABS PBS R-PP Bio-PBS PLA
Climate Change 4.07E+01 5.95E+01 8.63E+01 3.06E+01 1.30E+01 5.06E+01
Ozone Depletion 1.59E-09 1.56E-09 3.00E-06 1.31E-09 -2.78E-07 3.91E-09
Human Toxicity - cancer 6.64E-08 6.24E-08 2.94E-07 4.22E-08 6.66E-08 3.56E-08
Human Toxicity – non-cancer 2.52E-07 3.46E-07 1.18E-06 1.06E-07 8.94E-07 1.02E-07
Particulate Matter 3.67E-07 4.74E-07 4.04E-06 2.68E-07 4.50E-07 7.73E-07
Ionising Radiation 1.30E+00 1.42E+00 3.45E+00 1.27E+00 4.56E-01 1.37E+00
Photochemical Ozone Formation 1.96E-02 2.85E-02 4.47E-02 1.15E-02 2.54E-02 4.06E-02
Acidification 3.16E-02 4.34E-02 9.92E-02 2.12E-02 4.93E-02 7.12E-02
Eutrophication Terrestrial 4.57E-02 7.93E-02 1.07E-01 3.16E-02 8.82E-02 1.27E-01
Eutrophication Freshwater 6.27E-05 3.36E-05 2.76E-03 3.82E-05 5.14E-04 4.20E-05
Eutrophication Marine 3.53E-03 6.04E-03 7.96E-03 2.41E-03 6.48E-03 1.02E-02
Ecotoxicity Freshwater 1.17E+00 1.23E+00 3.22E+01 7.43E-01 3.91E+00 6.30E-01
Land Use 4.63E+01 8.85E+01 1.72E+02 4.04E+01 3.72E+01 1.21E+03
Water Use 0 0 1.60E-02 0 0 0
Resource Use - minerals and metals 4.98E-06 7.32E-06 6.38E-05 3.67E-06 3.72E-05 6.63E-06
Resource Use - fossils 4.69E+02 5.33E+02 6.16E+02 2.28E+02 1.33E+01 2.89E+02

GETTING IN TOUCH WITH THE EU
In person
All over the European Union there are hundreds of Europe Direct information centres. You can find the address of the centre
nearest you at: https://europa.eu/european-union/contact_en
On the phone or by email
Europe Direct is a service that answers your questions about the European Union. You can contact this service:
- by freephone: 00 800 6 7 8 9 10 11 (certain operators may charge for these calls),
- at the following standard number: +32 22999696, or
- by electronic mail via: https://europa.eu/european-union/contact_en
FINDING INFORMATION ABOUT THE EU
Online
Information about the European Union in all the official languages of the EU is available on the Europa website at:
https://europa.eu/european-union/index_en
EU publications
You can download or order free and priced EU publications from EU Bookshop at: https://publications.europa.eu/en/publications. Multiple copies of free publications may be obtained by contacting Europe Direct or your local information centre (see
https://europa.eu/european-union/contact_en).

XX
-NA
-XX
XX
X-EN
-N
doi:XX.XXXX/XXXXXX
ISBN XXX-XX-XX-XXXXX-X
The European Commission’s science and knowledge service
Joint Research Centre
JRC Mission
As the science and knowledge service
of the European Commission, the Joint
Research Centre’s mission is to support
EU policies with independent evidence
throughout the whole policy cycle.