environmentally conscious design & manufacturingpages.mtu.edu/~jwsuther/env/notes/lect8.pdf ·...
TRANSCRIPT

Design & Manufacturing
ciousuring
odeling
it
Environmentally Conscious Date: 3/22/00 1
Environmentally ConsDesign & Manufact
Class 8: Cutting Fluid M
Prof. S. M. Pand

Design & Manufacturing
nerating hugeery significant the earth;
e Great Lakesits ecosystemg raw sewage
f problems likerain, reduced
g., ore, mineral
Environmentally Conscious Date: 3/22/00 2
Motivation
• Manufacturing processes are geamount of waste that has a vinfluence on the living conditions on
• Intense industrial development of thregion has wrought vast changes toby contamination through dischargininto the Lakes [EPA, 1994];
• Thirty years ago scientists aware oglobal warming issues, acidavailability of natural resources (e.oil, drinking water).

Design & Manufacturing
ere consumedas not treatedthe use stage
ing the cuttingto develop a
its life.
ting fluid itse lessen byed.
Environmentally Conscious Date: 3/22/00 3
Objectives
• 92 Million Gallons of cutting fluids win 1990, and almost 50% of it wproperly after reaching the end of[EPA, 1991].
• This work is focused on investigatfluid system dynamics in ordermaintenance policy that will extend
• By extending the life of cutenvironmental impact would breducing the amount of fluid dispos
Design & Manufacturing
only used for
uid involved inrameters.
t can maintainsed limits andiendly.
Environmentally Conscious Date: 3/22/00 4
Approaches
Two approaches are most commreducing the cutting fluid usage:
• Decreasing the amount of cutting flthe process by changing process pa
• Investigating different additives thafluid properties between the propomake them more environmentally fr

Design & Manufacturing
achining
gion, wearl face).
id:
n,
Environmentally Conscious Date: 3/22/00 5
Cutting Fluids Role in the MProcesses
• Primary functions of a cutting fluid:
-- Heat conduction from the cutting re-- Lubrication (reduction of friction and
between machine chips and the too
• Secondary functions of a cutting flu
-- Chip removal from the cutting regio-- Corrosion protection,-- Cleaning.

Design & Manufacturing
tion
Environmentally Conscious Date: 3/22/00 6
Cutting Fluid Classifica
• Synthetic cutting fluids,
• Soluble oils,
• Semi-synthetic fluids, and
• Straight cutting and grinding oils.

Design & Manufacturing
Cutting
n,
Environmentally Conscious Date: 3/22/00 7
Desired Characteristics ofFluids
• Corrosion Prevention,
• Foam Resistance,
• Extreme Pressure Characteristics,
• Resistance to Microbial Degradatio
• Health and Safety,
• Recyclability and Disposability.

Design & Manufacturing
nce
systems and
t are monitoredto perform its
tion,
Environmentally Conscious Date: 3/22/00 8
Cutting Fluid Maintena
• Characteristics of metal cutting fluidchange over time due to their usageenvironment.
• The most important parameters thain order to preserve the fluid’s abilityrole in machining are:
- Oil Concentration,- pH Level,- Microbial Contamina- Corrosion Inhibition.

Design & Manufacturing
thodology
ntal
odels
ntial equation
s & Interpretationterizationechanism
Design, etc.ability
Environmentally Conscious Date: 3/22/00 9
Data Dependent Systems Me
DataOperational or experime
Determination ofStatistically adequate m
Difference equation
SystemPrediction & Control
Differe
System Analysi Charac Basic M
Improved St

Design & Manufacturing
(DDS):
at
1at 1–
Environmentally Conscious Date: 3/22/00 10
Data Dependent Systems(ME4660/5660)
AR(1) Model
AR(2) Model
ARMA(2,1) Model
Xt φ1Xt 1– at+=
Xt φ1Xt 1– φ2Xt 2–– +=
Xt φ1Xt 1– φ2Xt 2–– a+t
θ–=

Design & Manufacturing
r
t j–
t
1B)at
Environmentally Conscious Date: 3/22/00 11
Backshift Operato, or
AR(1) Model:
AR(2) Model:
ARMA(2,1) Model:
BXt Xt 1–= BjXt X=
1 φ1B–( )Xt at=
1 φ1B– φ2B2
– Xt a=
1 φ1B– φ2B2
– Xt 1 θ–(=

Design & Manufacturing
c polynomial
depends on itsefficients:
1– gnλnj+
)… 1 λnB–( ) 0=
θm)
1)… λi λn–( )--------------------------------
Environmentally Conscious Date: 3/22/00 12
Green’s Function• Green’s function:
• λ’s are the roots of the characteristi
• Dominance of a root in the systempower that is defined by the g i co
Xt Gjat j–j 0=
t∑=
Gj g1λ1j g2λ2
j … gn 1– λnj+ + +=
1 Φ1B– Φ2B2
– …– ΦnBn
– 1 λ1B–( ) 1 λ2B–(=
gi
λin 1– θiλi
n 2–– …– –(λi λ1–( )… λi λi 1––( ) λi λi +–(
-------------------------------------------------------------------------------=

Design & Manufacturing
rkRMA (n,m):
troducing the
t n–
t m–
1nBn
22nBn--------------X1t
θ22mBm–
φ22nBn–----------------------a2t
+
Environmentally Conscious Date: 3/22/00 13
Modeling Framewo• Auto Regressive Moving Average A
• Transfer function form by inbackshift operator:
Xt φ1Xt 1– φ2Xt 2– … φnXat θ1at 1–– θ2at 2–– …– θma–
+ + +
+
=
BXt Xt 1–=
X2t
φ211B φ212B2 … φ2+ + +
1 φ221B– φ222B2– … φ––
------------------------------------------------------------------
1 θ221B θ222B2 …–––
1 φ221B– φ222B2– …–
------------------------------------------------------------+
=

Design & Manufacturing
ling
the output X 2:
cripts - φabc:eledses, and
utput X2
φ22nX2t n–φ21nX1t n–
m
++
Environmentally Conscious Date: 3/22/00 14
Multiple Series Mode
• General EARMA(n,n,n-1) model for
• All parameters now have three subsa: Series which is being modb: Series on which φ regresc: Time lag of series b.
Input X1 OTRANSFERFUNCTION
X2t φ221X2t 1– φ222X2t 2– …φ211X1t 1– φ212X1t 2– …a2t θ221a2t 1–– … θ22ma2t –––
+ + ++ + +
=

Design & Manufacturing
Diagram
θ22n 1– Bn 1–
–
… φ22nBn
–------------------------------------
t
X2t
n-
Environmentally Conscious Date: 3/22/00 15
Feed-Forward Model Block
φ211B φ212B2 … φ21nB
n+ + +
1 φ221B– φ222B2
– … φ22nBn
––--------------------------------------------------------------------------------
1 θ221B θ222B2 …–––
1 φ221B– φ222B2
– –----------------------------------------------------------
a2
X1tφ121B φ122B
2 … φ12nBn
+ + +
1 φ111B– φ112B2
– … φ11nB––-------------------------------------------------------------------------------
1 θ111B θ112B2 … θ11n 1– B
n 1–––––
1 φ111B– φ112B2
– … φ11nBn
––----------------------------------------------------------------------------------------------
a2t

Design & Manufacturing
ng Fluid
asurements, Oil Conc.,...)
Environmentally Conscious Date: 3/22/00 16
Block Diagram of the CuttiSystem
SystemDynamics
ManualFeedback
Additives(Caustic, Oil Additions,...)
Me(pH

Design & Manufacturing
s
cutting fluid tominum turbine
cutting fluid tobodies,
cutting fluid toanel, and
cutting fluid to support.
Environmentally Conscious Date: 3/22/00 17
Analyzed System
• system “A” - 2,040 gal, suppliesmachine tools manufacturing alushafts,
• system “B” - 5,060 gal, suppliesmachine tools manufacturing valve
• system “C” - 20,000 gal, suppliesmachine tools manufacturing front p
• system “D” - 24,000 gal, suppliesmachine tools manufacturing stator

Design & Manufacturing
: Added(2)
(X 2)=5.249gal
100 150 200 250
f Added Oil to the cutting fluid system (real values)
DaysDays
Environmentally Conscious Date: 3/22/00 18
Cutting Fluid System InputsCaustic (1) and Oil
(real values)mean(X1)=0.0892gal mean
0 50 100 150 200 2500
0.2
0.4
0.6
0.8
1
Simulation of Added Caustic to the cutting fluid system (real values)
Days
Add
ed C
aust
ic
0 500
10
20
30
40
50
60
Simulation o
Add
ed O
il
Cau
stic
Add
ition
s (g
al)
Days
Oil
Add
ition
s (g
al)

Design & Manufacturing
rements:tion (2)
4)=3.86%
100 150 200 250
il Concentration of the cutting fluid system (real values)
DaysDays
Environmentally Conscious Date: 3/22/00 19
Cutting Fluid System MeasupH (1) and Oil Concentra
(real values)mean(X3)=8.8846 mean(X
0 50 100 150 200 2508
8.2
8.4
8.6
8.8
9
9.2
9.4
9.6
9.8
10Simulation of pH value of the cutting fluid system (real values)
Days
pH
0 50
1
2
3
4
5
6
Simulation of O
Oil
Con
cent
ratio
n (%
)
Days
pH
Oil
Con
cent
ratio
n (%
)

Design & Manufacturing
ults
Environmentally Conscious Date: 3/22/00 20
Notation Used in ResRepresentation
• X1 - caustic added,
• X2 - soluble oil added,
• X3 - pH measured, and
• X4 - measured oil concentration.

Design & Manufacturing
Addedonl for pH - Added
odel for Addedack)
Model:
DampingRatio
0.9023
-
Environmentally Conscious Date: 3/22/00 21
Adequate Models for theCaustic - pH Relati
• EARMA(3,3,2) is an adequate modeCaustic relation (system dynamics)
• EARMA(4,4,3) is an adequate mCaustic - pH relation (system feedb
Auto-regressive Roots of the
Discrete Roots NaturalFrequencyReal Imaginary
0.1447 0.1394 0.2831
0.9737 -

Design & Manufacturing
ic - pH
25B3 0.064784B4+
0.0070485B4–------------------------------------------------
.81121B 0.0177B2+
0.32206B2 0.039298B3+ +-------------------------------------------------------------------
a3t
X3t
Environmentally Conscious Date: 3/22/00 22
Block Diagram for CaustTransfer Function
0.49099– 0.35309B 0.45234B2– 0.177+ +
1 0.93744B– 1.1084B2 0.60779B3–+
-----------------------------------------------------------------------------------------------------------
1 0.55015B– 1.0992B2 0.19358B3+ +
1 0.93744B– 1.1084B2 0.6078B3– 0.0070485B4
–+----------------------------------------------------------------------------------------------------------------------------------
a1t
X1t - Caustic added to the cutting fluid systemX3t - pH value of the cutting fluid system
a3t - Noise incorporated in system pH measurementsa1t - Noise incorporated in added caustic measurements
0.26915B 0.43019B2– 0.19714B3+
1 1.263B– 0.32206B2 0.039298B3+ +-----------------------------------------------------------------------------------------------
1 0–
1 1.263B–----------------------------
X1t

Design & Manufacturing
ration
el for Oilsystem
l for Added Oil -eedback)Model:
DampingRatio
-
0.03495
-
Environmentally Conscious Date: 3/22/00 23
Added Oil - Oil ConcentRelation
• EARMA(4,4,3) is an adequate modConcentration - Added Oil relation (dynamics)
• EARMA(2,2,1) is an adequate modeOil Concentration relation (system f
Auto-regressive Roots of the
Discrete Roots NaturalFrequencyReal Imaginary
0.2301 -
0.3661 0.8870 0.1878
0.9923 -

Design & Manufacturing
Oil - Oilunction
2
--
1.4445B2 0.55097B3–
42B2 1.2928B3– 0.21023B4+
---------------------------------------------------------------------------
a4t
X4t
Environmentally Conscious Date: 3/22/00 24
Block Diagram for Added Concentration Transfer F
5.9598– 3.9815B 0.3437B+ +
1 0.25183B– 0.086716B2+----------------------------------------------------------------------------
1 0.1847B–
1 0.25183B– 0.086716B2+--------------------------------------------------------------------
a2t
X2t - Oil added to the cutting fluid systemX4t - Oil concentration of the cutting fluid system
a4t - Noise incorporated in oil concentration
0.044183B 0.045193B2– 0.047433B3 0.012994B4
–+
1 1.9546B– 2.0442B2 1.2928B3– 0.21023B4+ +
-------------------------------------------------------------------------------------------------------------------------------------
1 1.311B +–
1 1.9546B– 2.04+-----------------------------------------------
X2t
a2t - Noise incorporated in added oil meas.
measurements
Design & Manufacturing
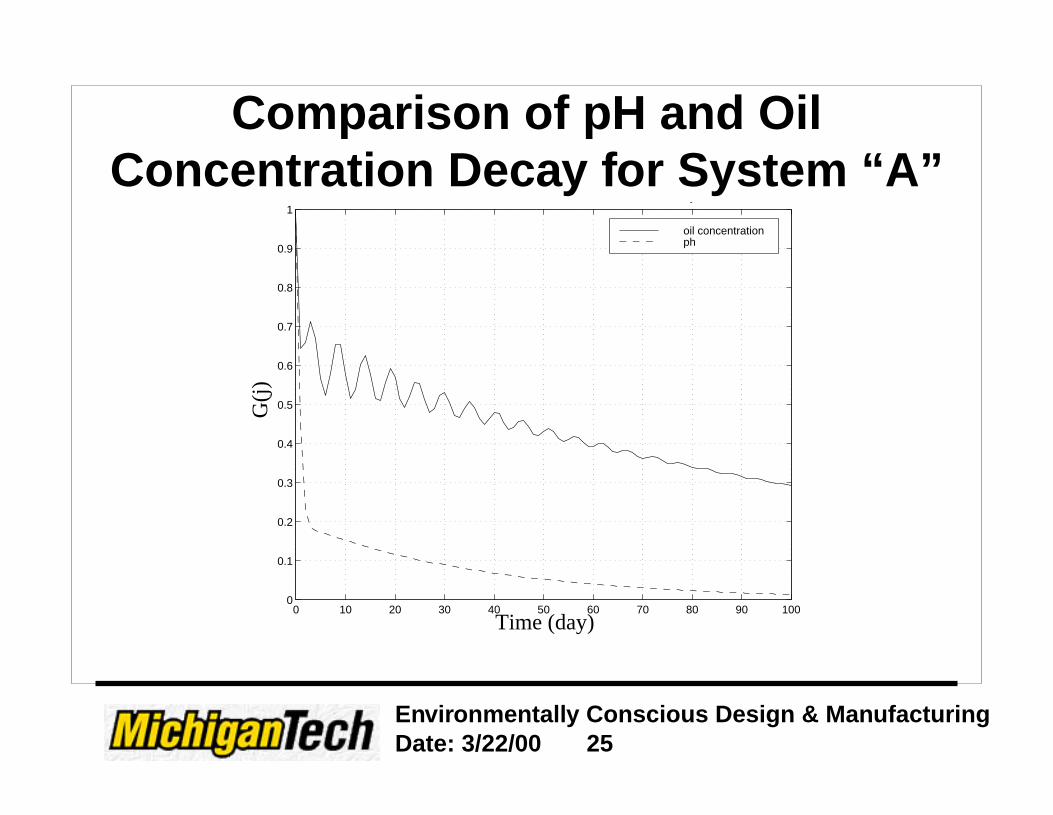
d Oilstem “A”
80 90 100
y
il concentrationh
Environmentally Conscious Date: 3/22/00 25
Comparison of pH anConcentration Decay for Sy
0 10 20 30 40 50 60 700
0.1
0.2
0.3
0.4
0.5
0.6
0.7
0.8
0.9
1
j
G(j)
op
Time (day)
G(j)

Design & Manufacturing
ation andting Fluid
0 2 4 6 8 10 12 14 16 18 20−0.2
0
0.2
0.4
0.6
0.8
Comparison plot for ph and oil concentration for sys352
ph oil concentration
(system D)
Time (day)
Environmentally Conscious Date: 3/22/00 26
Comparison of Oil ConcentrpH Decay for Additional Cut
Systems
0 2 4 6 8 10 12 14 16 18 20−0.2
0
0.2
0.4
0.6
0.8
1
Comparison plot for ph and oil concentration for sys21
pH oil concentration
0 2 4 6 8 10 12 14 16 18 20−0.2
0
0.2
0.4
0.6
0.8
Comparison plot for ph and oil concentration for sys102
ph oil concentration
(system B) (system C)
Time (day) Time (day)
G (
j)
G (
j)
G (
j)

Design & Manufacturing
Rate forstems
40 45 50
sys (A)sys (B)sys (C)sys (D)
Environmentally Conscious Date: 3/22/00 27
Comparison of pH Decay Different Cutting Fluid Sy
0 5 10 15 20 25 30 35−0.2
0
0.2
0.4
0.6
0.8
1
1.2g y
G (
j)
Time (day)

Design & Manufacturing
ntrationystems
40 45 50
sys (A)sys (B)sys (C)sys (D)
Environmentally Conscious Date: 3/22/00 28
Comparison of Oil ConceDecay Rate for Different S
0 5 10 15 20 25 30 350
0.1
0.2
0.3
0.4
0.5
0.6
0.7
0.8
0.9
1
Time (day)
G (
j)

Design & Manufacturing
ions
odels and twohe cutting fluid
ated systemwell as decaycteristics in a
Environmentally Conscious Date: 3/22/00 29
Summary and Conclus
• One input - one output EARMA minput - two output ARV models for tsystem dynamics were developed
• Decay rates for investigcharacteristics in one system asrates of the same system charadifferent systems were compared