environmentally sustainable construction products and ... · environmentally sustainable...
TRANSCRIPT
NORDIC INNOVATION REPORT 2014:03 // MARCH 2014
Environmentally Sustainable Construction Products and Materials – Assessment of release

Authors: Margareta Wahlström, Jutta Laine-Ylijoki, Helena Järnström, Tommi Kaartinen, Martin
Erlandsson, Anna Palm Cousins, Ola Wik, Pascal Suer, Anke Oberender, Ole Hjelmar, Harpa
Birgisdottir, Stefania Butera, Thomas Fruergaard Astrup & Andreas Jørgensen.
March 2014
Nordic Innovation Publication 2014:3
Environmentally Sustainable Construction Products and Materials – Assessment of release and emissions
Copyright Nordic Innovation 2014. All rights reserved.This publication includes material protected under copyright law, the copyright for which is held by Nordic Innovation or a third party. Material contained here may not be used for commercial purposes. The contents are the opinion of the writers concerned and do not represent the official Nordic Innovation position. Nordic Innovation bears no responsibility for any possible damage arising from the use of this material. The original source must be mentioned when quoting from this publication.
Environmentally Sustainable Construction Products and Materials – Assessment of release and emissions
Nordic Innovation Publication 2014:03©
Nordic Innovation, Oslo 2014
ISBN 978-82-8277-059-0 (Print)
ISBN 978-82-8277-060-6 (URL: www.
nordicinnovation.org/publications)
Authors:Margareta Wahlström, Jutta Laine-Ylijoki,
Helena Järnström, Tommi Kaartinen, Martin
Erlandsson, Anna Palm Cousins, Ola Wik,
Pascal Suer, Anke Oberender, Ole Hjelmar,
Harpa Birgisdottir, Stefania Butera, Thomas
Fruergaard Astrup & Andreas Jørgensen
PublisherNordic Innovation, Stensberggata 25,
NO-0170 Oslo, Norway
Phone: (+47) 22 61 44 00.
E-mail: [email protected]
www.nordicinnovation.org
All Nordic Innovation publications can be
downloaded free of charge as pdf files from
www.nordicinnovation.org/publications
Cover photo: VTT Research Centre of Finland
Nordic InnovationNordic InnovationStensberggata 25, NO-0170 Oslo, NorwayPhone: +47 47 61 44 [email protected]
VTT Research Centre of FinlandMargareta WahlströmSenior ScientistVTT Technical Research Centre of Finland P.O. Box 1000, [email protected]
6
PARTICIPANTS
The project has been carried out by a project group with representatives from six Nordic research institutes. The project group included the following persons:
Margareta Wahlström, VTT, Finland (project manager) Jutta Laine-Ylijoki , VTT
Helena Järnström, VTT Tommi Kaartinen, VTT
Martin Erlandsson, IVL Sweden Anna Palm Cousins, IVL Sweden
Ola Wik, SGI, Sweden
Pascal Suer, SGI, Sweden
Anke Oberender, DHI, Denmark
Ole Hjelmar, DHI, Denmark Harpa Birgisdottir, SBi, Denmark Stefania, Butera DTU, Denmark
Thomas Fruergaard Astrup, DTU , Denmark Andreas Jørgensen, DTU, Denmark
The project was financial supported by the participating research institutes, Tekes (Finland), Formas (Sweden), Nordic Innovation, Finnish Road Administration, Saint Gobain Weber Oy Ab, Ruukki Metals Ltd, the Swedish Transport Administration, Swedish National Board of Housing, Building and Planning, Svenska Energiaskor (Swedish Energy Ashes), Boliden AB.
7
CONTENT
Participants ............................................................................................................................ 6
Executive summary ................................................................................................................ 9
Preface ................................................................................................................................. 13
Terms and abbreviations ...................................................................................................... 15
Introduction .......................................................................................................................... 17
1 Environmental issues and sustainability of construction products in EU legislation ......... 21
1.1 Construction Products Regulation (CPR) ................................................................ 21
1.2 Dangerous substances and future aspects ............................................................. 25
1.3 Reuse and recycling of C&D waste from renovation ............................................... 27
2 Determining emission and release from construction products ....................................... 29
2.1 Standardised determination methods for BWR3 ..................................................... 29
2.1.1 Emissions to indoor air ................................................................................ 31
2.1.2 Release to soil and water ............................................................................ 34
2.2 Assessment with BWR3 results .............................................................................. 35
2.2.1 Comparison to notified national limit values ................................................ 36
2.2.2 Declaration classes for dangerous substances in CE-marking .................... 38
2.3 Using leaching data in LCA ..................................................................................... 40
2.4 Evaluation of conformity .......................................................................................... 44
3 Environmental Product Declaration (EPD) ...................................................................... 46
3.1 EPD in brief ............................................................................................................ 46
3.2 LCA information in EPD .......................................................................................... 47
3.3 Development need for addressing recycling in EPD ............................................... 49
3.4 Proposal for addressing recycling in EPD ............................................................... 49
4 Life Cycle Assessment (LCA) ......................................................................................... 52
4.1 Life cycle assessment (LCA) in brief ....................................................................... 52
4.1.1 LCA standards for construction works ......................................................... 53
4.1.2 LCA tools and databases ............................................................................ 54
4.1.3 Calculation of environmental impacts in LCA .............................................. 55
4.1.4 Calculation of toxicity in LCA ....................................................................... 57
4.2 Case studies: LCA of selected renovation scenarios .............................................. 59
8
4.2.1 LCA-study for building renovation ............................................................... 59
4.2.2 LCA-study of civil engineering works........................................................... 64
4.2.3 Lessons learned in case studies ................................................................. 67
5 Conclusions and recommendations ................................................................................ 69
3.2.1 Freshwater XF .......................................................................................... 117
3.2.2 Humans .................................................................................................... 117
3.3.1 EF for freshwater toxicity ........................................................................... 118
3.3.2 Human effect factors ................................................................................. 119
5.5.1 Specific problems in relation to spatial and temporal variability and the toxicity of metals ....................................................................................... 124
6.2.1 Goal and scope definition .......................................................................... 127
6.2.2 Inventory analysis ..................................................................................... 128
6.2.3 Impact assessment ................................................................................... 128
2.1.1 Concrete ................................................................................................... 137
2.1.2 Bricks ........................................................................................................ 138
4.1.1 Results of recycling process ..................................................................... 144
4.1.2 Results compared to production of concrete ............................................. 147
4.1.3 Results compared to reuse ....................................................................... 147
4.2.1 Results of recycling process ..................................................................... 148
4.2.2 Results compared to production of bricks ................................................. 150
4.2.3 Results compared to reuse ....................................................................... 151
9
EXECUTIVE SUMMARY
The main objectives of sustainable construction activities are to avoid resource depletion of energy, water, and raw materials and to prevent environmental degradation caused by facilities and infrastructure throughout their life cycle. The construction sector consumes yearly about half of all natural resources extracted in Europe and their transformation into building products has huge energy demands. Therefore the focus of today’s environmental policy is to be on the building end-of-life scenarios and material efficiency. Here waste prevention and recycling /reuse play a key role by providing huge energy, water and material savings. These issues are also specifically addressed in the Construction Products Regulation1 (CPR 2011), where health and safety aspects related to use of construction products cover of the entire lifecycle. Meanwhile the building sector is moving from new buildings towards maintenance and renovation. This trend will probably further increase by the energy conservation activities that will be required to achieve the 20-20-20 goals 2 outlined by EC resulting in a need of renovation of a huge amount of buildings. Until today hardly any construction product is designed keeping recycling/reuse in mind, the “Design for the Environment” -concept is one of the key steps towards increased recycling and reuse and thereby towards minimal environmental impacts of construction and operations.
Life cycle assessment (LCA) is the main tool for assessing environmental performance and thus achieving sustainable development. This project addresses methods for assessment of environmental properties that influence environmental sustainability of construction products. It deals with the harmonised standard methods for the measurement of emission and release and how data from these tests can be included in a broader assessment of environmental sustainability e.g. LCA and environmental product declarations (EPD). This report includes two case studies, where the use of leaching data in LCA and also inclusion of recycling aspects in EPD are illustrated.
This project was carried out by VTT with cooperation with the Danish partners SBi, DTU and DHI and the Swedish partners SGI and IVL.
The purpose of the project was:
To give tools for the assessment of environmental sustainability of construction products
To identify current and future substances of concern with regard to recycling and reuse of construction products and renovation wastes
To demonstrate possibilities to use release data defined in CPR in LCA. To propose possible approaches for inclusion of recycling in environmental product
declarations
The study has achieved this aim by:
Reviewing current situation and future legislation concerning dangerous substances Mapping of key renovation waste streams
1 CPR: Regulation no 305/2011 of the European parliament and of the council of 9 march 2011 laying down harmonized conditions for the marketing of construction products and repealing Council directive 89/106/EEC
2 three key objectives for 2020: 1) A 20% reduction in EU greenhouse gas emissions from 1990 levels; 2) Raising the share of EU energy consumption produced from renewable resources to 20%; 3) A 20% improvement in the EU's energy efficiency.
10
Participating in standardisation working groups under CEN/TS 351 “Construction products” – Assessment of release of dangerous substances” and CEN/TS 350 “Sustainability of construction works”
Developing a methodology for inclusion of a recycling in the environmental product declarations
Demonstrating the applicability of recently developed test methods for Nordic construction products
Carrying out LCA case studies using release data provided with standardised methods
Method
This project evaluated methods for assessment of environmental properties that influence environmental sustainability of construction products. It evaluated the applicability of the harmonised standard methods for the measurement of emission and release and demonstrated how data from these tests can be included in a broader assessment of environmental sustainability e.g. life cycle assessment (LCA) and environmental product declarations (EPD).
This project included two case studies, where LCA was used as a tool for assessing environmental performance of construction products. In the first one the release results from standardised leaching tests were evaluated by means of LCA to get information on toxicity of dangerous substances. The second LCA study aimed to develop possible approaches for inclusion of recycling in environmental product declarations.
Along the project altogether four desk studies and reviews, also found as appendices in the project report, were carried out:
A review on current and future legislation influencing the construction products, especially on aspects related to recycling and requirements for environmental safety
A literature study of potential high volume renovation wastes complemented with contacts to key stakeholders in the area of construction products’ recycling
A literature review on characterization factors for calculation of toxicity in LCA A review study on the emission scenarios used in development of limit values for
outdoor applications in different countries.
The project arranged two international workshops. The first one named “Construction products – Environmental safety and future challenges” held on November 8, 2011 in Espoo, Finland and the second one named “Sustainable construction products and materials – Life cycle perspective and release data on March 15, 2012 in Copenhagen, Denmark. The workshops with several invited key lecturers from Germany, Belgium, Sweden and Finland were well-attended by over 50 participants from six countries. The workshops not only gave valuable input to project, but also served as an important communication channel to different stakeholders.
Main results achieved in the project:
Reviews on current construction product legislation, potential high volume renovation wastes, characterization factors for toxicity and release scenarios in different countries.
Input to on-going standardisation work under CEN/TC 351. Guidance on use of release data in LCA A proposal for approaches to include recycling in EPD
11
A proposal for generic scenarios for granular materials in civil engineering works.
The following conclusions can be drawn
Sustainable construction activities are targeted at minimising resource depletion of energy, water, and raw materials. This requires building end-of-life scenarios and material efficiency, where waste prevention and recycling / reuse play a key role by providing huge energy, water and material savings. These issues are also addressed in the Construction Products Regulation3 (CPR 2011).
The environmental sustainability evaluation should always start with complete data and knowledge on content and emissions of dangerous substances. They may or may not as such be dangerous, but if released or emitted from a construction product they may present a danger for man or the environment during normal use of the construction products when installed in construction works. Information about toxicity and dangerous properties of different substances is, however, constantly updated and revised. Therefore the list of dangerous substances will hardly ever be complete requiring constant follow up from construction producers and other shareholders.
Horizontal standardised assessment procedures developed by CEN/TC 351 both for the measurement of indoor air emissions and the release of substances (e.g. to soil and groundwater) are the basic methods for assessing Basic Work Requirement 3 properties, i.e. emission and release of dangerous substances from construction products related to the CE marking. The standardised tests provide numerical data for the description of the release/emission behaviour of substances from construction products under laboratory conditions. The purpose of the tests is not the simulation specific situations, but to describe the release/emission under standardised conditions. The obtained test results can generally be used as such in comparisons to national or case-specific limit values or used in product labelling according to emission classes.
The benefit from a sustainable use of natural resources is not fully addressed in LCA. The current impact assessment on resource depletion is based on extraction and consumption of scarce elements and use of fossil energy. The current indicator on ADP (Abiotic Depletion Potential) in LCA (according to EN 15804) focuses on fossil fuel use or extraction of scarce elements, but not adequately taking into account the saving of other natural resources like renewables.
Environmental information presented in an EPD based on EN 15804 consists of five information modules (A-D: production stage - recycling) for which all LCAs are to be performed. However, currently only the production stage covering cradle-to-gate is mandatory, because it is based on existing or historical data and can therefore demonstrate verifiable impacts. Impacts from other stages downstream are then scenario (i.e. application) based lacking currently harmonised common LCA methodology. This leads to case–specific assessments, carried out usually also independently from construction product producers.
The use of “Design for the Environment” -concept is a powerful tool also for construction product producers when heading towards increased recycling and reuse and thereby towards minimal end-of-life environmental impacts. Design for the environment (DfE) means that the product is designed with consideration of reduction
3 CPR: Regulation no 305/2011 of the European parliament and of the council of 9 march 2011 laying down harmonized conditions for the marketing of construction products and repealing Council directive 89/106/EEC
12
of environmental impacts and optimisation of environmental performance in the building or construction. A perquisite is a high technical quality and durability of the construction and in this context building products should be evaluated and interpreted also in LCA.
Recommendations for continued studies:
In LCA there is yet no scientifically agreed calculation method for some environmentally important indicators (e.g. toxicity and savings of natural resources) and those indicators are therefore not included in the European standards dealing with LCA in the context of CPR, e.g. EN 15804 and EN 15978. These are, however, extremely important in the evaluation of sustainably and reuse/recycling of different high volume construction and demolition wastes. It is therefore very important to work further on the development of the methodology for eco-toxicity and human toxicity in LCA and to reach agreement that can lead to inclusion of those impact categories.
Material use should be in the focus in the LCA, highlighting the avoided use of natural materials. The current indicator ADP (Abiotic Depletion Potential) is not taking into account the saving of all natural resources. Here further development of indicators are needed in order to better address benefits of save of natural resources.
For a real and fair assessment of environmental impacts of building products a common LCA methodology and a harmonised inventory methodology are needed. Parallel to this work, development of uniform rules (requirements) for product category rules (PCR) and environmental product declarations (EPD) are crucial.
The EPDs need to be developed to cover all cradle-to-grave stages also recycling stage. Common rules make decision easier in selection of construction materials and products with low environmental impact. The results can be used for design for the environmental recommendations for safe product use and sustainable recycling/reuse solutions.
13
PREFACE
This is the final report for the project: “Sustainable construction products and materials for renovation” under the EU Eracobuild programme “Sustainable Renovation”. The project was initiated in September 2010 and finished in April 2013.
This report addresses methods for assessment of environmental properties that influence environmental sustainability of construction products. It deals with the harmonised standard methods for the measurement of emission and release and how data from these tests can be included in a broader assessment of environmental sustainability e.g. life cycle assessment (LCA) and environmental product declarations (EPD). This report includes two case studies, where the use of leaching data in LCA and also inclusion of recycling aspects in EPD are illustrated.
The project arranged also two international workshops. The first one named “Construction products – Environmental safety and future challenges” held on November 8, 2011 in Espoo, Finland and the second one named “Sustainable construction products and materials – Life cycle perspective and release data on March 15, 2012 in Copenhagen, Denmark. The workshops with several invited key lecturers from Germany, Belgium, Sweden and Finland were well-attended by over 50 participants from six countries.
This project is a direct continuation to the NICe Handbook “Environmental assessment of construction products – an introduction to test methods and other procedures related to CE-marking”, Report NT TR 618 (Wahlström et al. 2009). The background is the test methods developed under CEN/TC 351 “Construction products: Assessment of release of dangerous substances” with special focus on release to soil and water and the Environmental Product Declaration (EPD) format standardised in CEN/TC 350 “Sustainability of construction works”.
The project has been carried out by a project group with representatives from six Nordic research institutes. The project group included the following persons:
Margareta Wahlström, VTT, Finland (project manager) Jutta Laine-Ylijoki , VTT
Helena Järnström, VTT Tommi Kaartinen, VTT
Martin Erlandsson, IVL Sweden Anna Palm Cousins, IVL Sweden
Ola Wik, SGI, Sweden
Pascal Suer, SGI, Sweden
Anke Oberender, DHI, Denmark
Ole Hjelmar, DHI, Denmark Harpa Birgisdottir, SBi, Denmark Stefania, Butera DTU, Denmark
Thomas Fruergaard Astrup, DTU , Denmark Andreas Jørgensen, DTU, Denmark
The project was financial supported by the participating research institutes, Tekes (Finland), Formas (Sweden), Nordic Innovation, Finnish Road Administration, Saint Gobain Weber,

14
Ruukki Metals Ltd, the Swedish Transport Administration, Swedish National Board of Housing, Building and Planning, Svenska Energiaskor (Swedish Energy Ashes), Boliden Ab.
Espoo 29.5.2013
Authors
15
TERMS AND ABBREVIATIONS
BWR Basic requirement for construction works; referred to as basic works requirement
CE-marking The CE marking indicates a product’s compliance with EU legislation and so enables the free movement of products within the European market. However, not all products must bear the CE marking, only product categories mentioned in specific EU directives on the CE marking. [adapted from European Commission, Directorate-General for Enterprise and Industry]
Constituent Ingredient used to manufacture a construction product
Construction product
means any product or kit which is produced and placed on the market for incorporation in a permanent manner in construction works or parts thereof and the performance of which has an effect on the performance of the construction works with respect to the basic requirements for construction works
Construction works
Means buildings and civil engineering works
CPD Construction Products Directive (EU) No 89/106/EEC
CPR Construction Products Regulation (EU) No 305/2011
Dangerous substances
Substances, preparations and radioactive substances, present (either by deliberate use in manufacture or adventitiously) in construction products and possibly released from those products, that may present a danger for man or the environment during normal use of the construction products when installed in construction works (CEN/TR 15858:2009)
EN European standard
EPD Environmental product declaration
European Technical Assessment
Means the documented assessment of the performance of a construction product, in relation to its essential characteristic, in accordance with the respective European Assessment Document
EGDS Expert group on dangerous substances
Hazardous substance
substances defined as hazardous according to regulation (EC) No 1272/2008
hEN Harmonised European standard (hEN)
LCA Life cycle assessment
PCR Product category rules
POP Persistent Organic Pollutants
REACH European Community Regulation on chemicals and their safe use (EC 1907/2006). It deals with the Registration, Evaluation, Authorisation and Restriction of Chemical substances

16
Regulated dangerous substance
Substances, preparations and radioactive substances that may present a danger for man or the environment during normal use of the construction products when installed in construction works and that are regulated in European union regulations or national regulations (CEN/TR 15858:2009)
SVHC Substances of very high concern (relates to REACH)
Source term Describes the flux of substances as a function of time based on leaching data and a defined hydraulic scenario. The leaching can be described as en exponentially decreasing function over time.
17
INTRODUCTION
Building construction and operations have significant direct and indirect impacts on the environment. Buildings use resources such as energy, water and raw materials, generate waste (occupant, construction and demolition), and emit potentially harmful atmospheric emissions. Building owners, designers, and builders face a unique challenge to meet demands for new and renovated facilities that are accessible, secure, healthy, and productive while minimizing their impact on the environment. This requires new practices of creating structures and using processes that are environmentally responsible and resource-efficient throughout a building's life-cycle from siting to design, construction, operation, maintenance, renovation and deconstruction.
The main objectives of sustainable construction activities are to avoid resource depletion of energy, water, and raw materials and prevent environmental degradation caused by facilities and infrastructure throughout their life cycle. Construction sector consumes yearly about half of all natural resources extracted in Europe and their transformation into building products has significant energy demands. Therefore the focus of today’s environmental policy is on the building end-of-life scenarios and material efficiency. Here waste prevention and recycling / reuse play a key role by providing huge energy, water and material savings. These issues are also specifically addressed in the Construction Products Regulation4 (CPR 2011), where health and safety aspects related to use of construction products cover the entire lifecycle, i.e. from manufacturing to construction with a safe use and sustainable handling and recycling of waste arising from renovation, maintenance and final demolition.
Meanwhile the building sector is moving from new buildings towards maintenance and renovation. Today 40% of construction activities in Finland, respective 60% in Sweden, relates to renovation. This trend will probably further increase by the energy conservation activities that will be required to achieve the 20-20-20 goals outlined by EC resulting in a need of renovation of a huge amount of buildings. Until today hardly any construction product is designed keeping recycling/reuse in mind, but transparent and uniform data on environmental performance of construction products and sustainable design are the first steps towards increased recycling and reuse and thereby towards minimal environmental impacts.
Design for the environment (DfE) means that the product is designed with consideration of reduction of environmental impacts and optimisation of environmental performance in the building or construction. It is important to evaluate the building and the construction products for the whole life cycle of the building. A perquisite is a high technical quality and durability of the construction. Life cycle assessment (LCA) is an important tool for evaluating environmental performance and thus achieving sustainable development. In this context building products should be evaluated and interpreted in LCA for:
Efficient on-site use or recycling of materials (e.g. removed from roadbed and construction)
Minimisation of the excavation of natural resources
4 CPR: Regulation no 305/2011 of the European parliament and of the council of 9 march 2011 laying down harmonized conditions for the marketing of construction products and repealing Council directive 89/106/EEC
18
Minimisation of transport works Minimisation of energy use Minimisation of releases and emissions from materials to the environment
This report addresses methods for assessment of environmental properties that influence environmental sustainability of construction products. It deals with methods for the measurement of emission and release and how data from these tests can be included in a broader assessment of environmental sustainability e.g. LCA and environmental product declarations (EPD). The project will thereby support the knowledge on the use of sustainable construction products and materials both in use and especially in renovation. The focus is mainly on high volume construction materials in both civil engineering works and buildings that also appear as high volume fractions of renovation wastes, meaning that the method for the recovery is also important.
This report is also a direct continuation to the NICe handbook “Environmental assessment of construction products – An introduction to test methods and other procedures related to CE-marking“ 5 (Wahlström et al. 2009). The information presented is still valid even if the handbook was written before the Construction Product Regulation was coming in force. The main content of the new regulation was known at the reporting time and was taken into account. Furthermore, the change in the regulation did not affect the implementation of basic requirements BWR 3 (formerly essential requirement ER3) in CE marking of construction products.
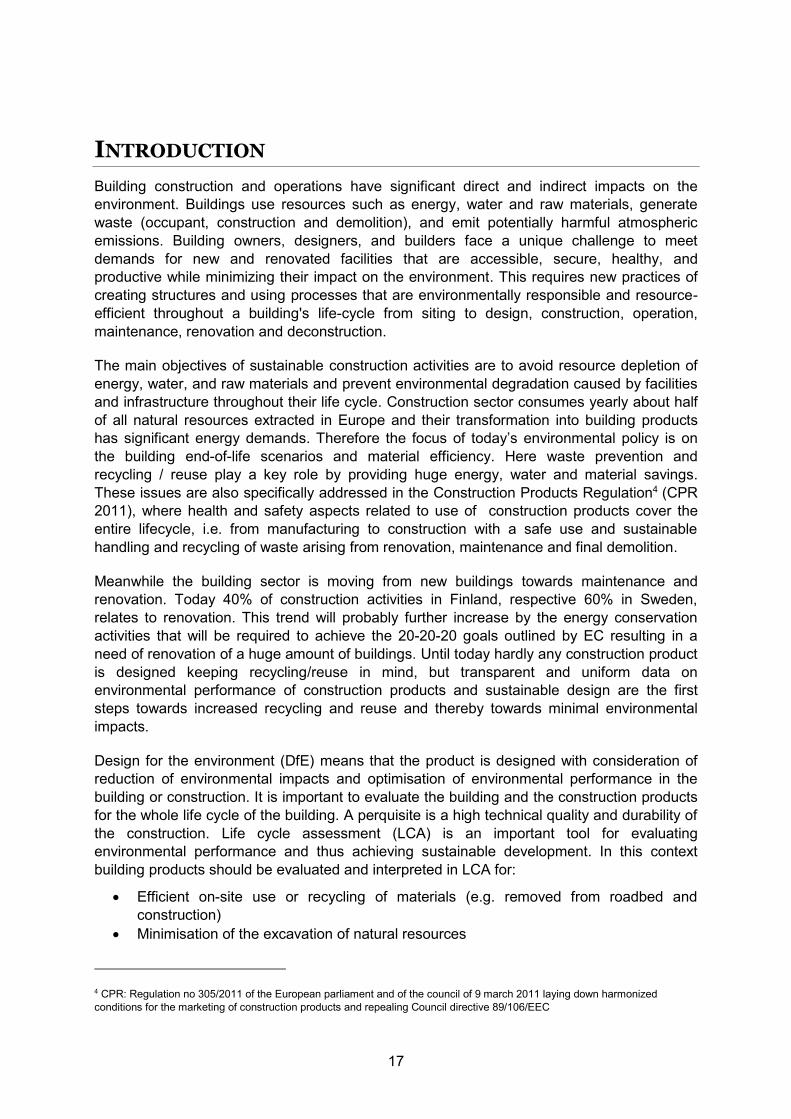
Figure 1. Construction works as a whole and their separate parts must be fit for their intended use throughout their life cycle, taking into account in particular the health and safety of workers, occupants or neighbours.
5 http://www.nordtest.info/index.php/technical-reports/item/handbook-environmental-assessment-of-construction-products-an-introduction-to-test-methods-and-other-procedures-related-to-ce-marking-nt-tr-618.html.
19
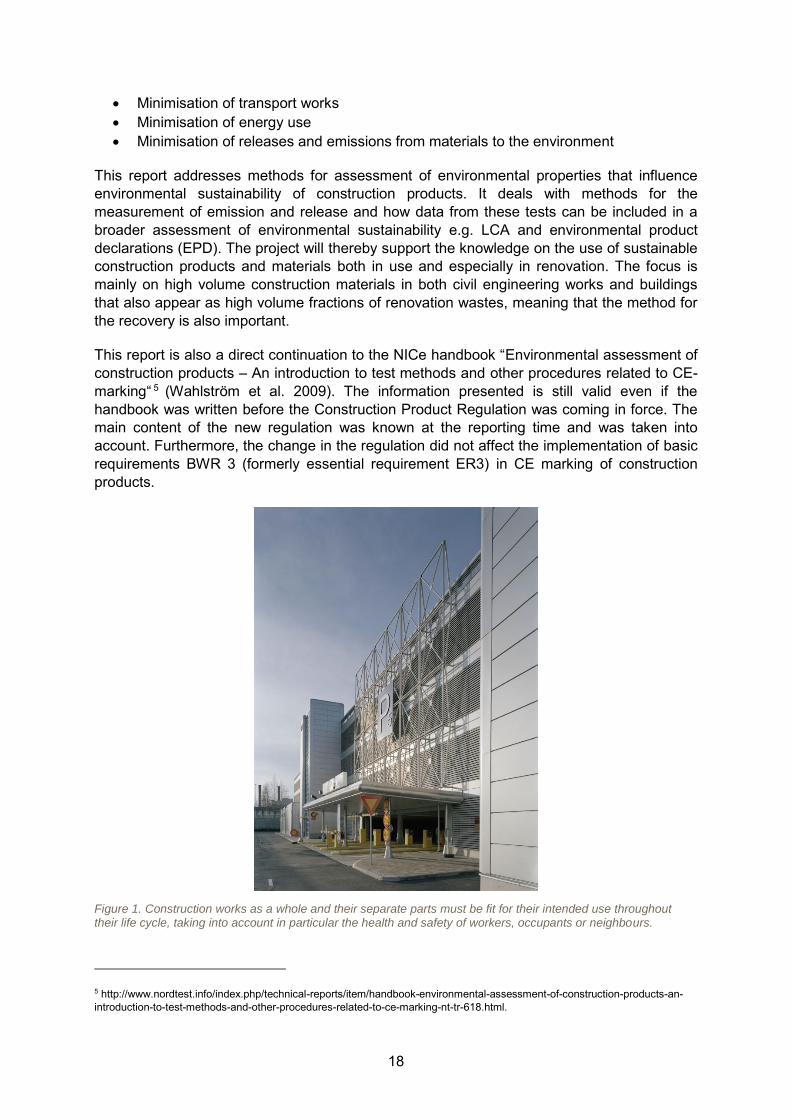
Figure 2. NICe Handbook gives guidance on the selection of correct test methods for the determination of release of “dangerous” substances from construction products in contact with water under various conditions.
This report consists of 6 chapters:
Chapter 2 of this report presents the background of the report with respect to the assessment of environmental properties of construction products. Furthermore, it gives a short summary of the new regulation for construction products that sets requirements for a life cycle perspective in the environmental assessment. Dangerous substances regulated both at EU and national level are addressed. Also harmful substances potentially present in recycled waste are evaluated.
Chapter 3 discusses the use of test results in the environmental assessments of the construction products. The current status of the on-going standardization work in relation to the implementation of the requirements in CPR is presented. For further information on the principle and selection of test methods the reader is referred to the NICe handbook. The chapter also includes a proposal for a generic scenario for granular materials in civil engineering to be used in development of limit values.
Chapter 4 presents a proposal for how recycling can be included in environmental product declarations (EPD) and thus be used for benchmarking of construction products.
Chapter 5 shortly describes how toxicity and results of leaching tests can be used in life cycle assessment (LCA). LCA is the most common method for assessing the environmental sustainability. LCA gives a rough estimate of potential impacts during the whole lifecycle of a product and can be used to compare environmental impacts of construction with the same function based on the same methodology settings.
Chapter 6 presents conclusions and recommendations.
The following desk and case studies carried out along the project can be found in the Appendices:
Appendix A A review on current and future legislation influencing the construction products, especially on aspects related to recycling and requirements for environmental safety
20
Appendix B Dangerous substances in construction products
Appendix C A literature study of potential high volume renovation wastes complemented with contacts to key stakeholders in the area of construction products’ recycling
Appendix D A review study on the emission scenarios used in development of limit values for outdoor applications in different countries.
Appendix E A literature review on characterization factors for calculation of toxicity in LCA
Appendix F Case study: LCA for building renovation
Appendix G Case study LCA study of civil engineering works
21
1 ENVIRONMENTAL ISSUES AND SUSTAINABILITY OF
CONSTRUCTION PRODUCTS IN EU LEGISLATION
This chapter gives an update to the legislative status and other background information presented in the NICe handbook.
1.1 CONSTRUCTION PRODUCTS REGULATION (CPR) The Construction Products Directive has been replaced by the Construction Products Regulation. The main aim of the Construction Products Regulation is to remove barriers to trade of construction products between member states in the European Economic Area. It makes CE-marking mandatory for most construction products sold in EU countries.
The CPR contains seven so called basic requirements for construction works (BWRs). Two of which are related to environmental issues and sustainability and the focus of this report: BWR3 “Hygiene, health and environment” and on BWR7 “Sustainable use of natural resources”. A short summary of the CPR is compiled in Box 2.1.
The CPR introduces the life cycle perspective when assessing the performance of a construction product. The “life cycle” is defined “as the consecutive and interlinked stages of a construction product’s life, from raw material acquisition or generation from natural resources to final disposal” (thus meaning “from cradle to grave”).
BWR3 specifies that construction works must be designed and built in such a way that they will, throughout their life cycle not be a threat to hygiene, health and the environment. Not only the health and safety of occupants and neighbours but now also health and safety of workers shall be considered (see Box 2.2). Furthermore, construction works shall not have an exceedingly high impact on environment and climate. This means that the scope of BWR 3 has been significantly increased as compared to the scope in the CPD. Some particular threats/actions that may have an impact have been clarified and specified in the CPR as compared to the CPD. Environment in the CPD referred to the immediate environment only (European commission 2002). Greenhouse gases, marine water seem to indicate that CPR may apply to a wider environment. The wider environment concept is further discussed in Chapter 5.
22
Box 2.1. Elements of the Construction Products Regulation (CPR)
The Construction Products Regulation concerns “any product or kit which is produced and placed on the market for incorporation in a permanent manner in construction works or parts thereof and the performance of which has an effect on the performance of the construction works with respect to the basic requirements for construction works."
Construction works as a whole and in their separate parts must be fit for their intended use, taking into account in particular the health and safety of persons involved throughout the life cycle of the works. Subject to normal maintenance, construction works must satisfy the following basic work requirements for construction (BWR, formerly essential requirements ER) for an economically reasonable working life. The basic requirements in CPR are listed in Table 2.1.
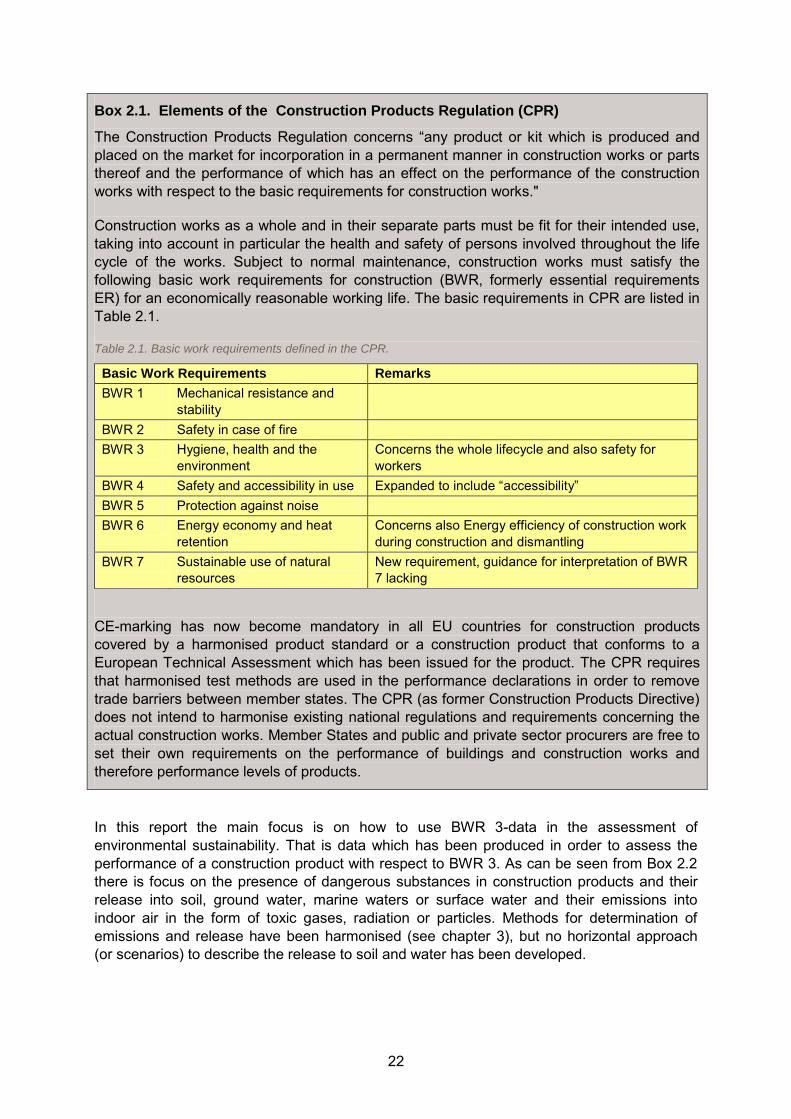
Table 2.1. Basic work requirements defined in the CPR.
Basic Work Requirements Remarks
BWR 1 Mechanical resistance and stability
BWR 2 Safety in case of fire BWR 3 Hygiene, health and the
environment Concerns the whole lifecycle and also safety for workers
BWR 4 Safety and accessibility in use Expanded to include “accessibility” BWR 5 Protection against noise BWR 6 Energy economy and heat
retention Concerns also Energy efficiency of construction work during construction and dismantling
BWR 7 Sustainable use of natural resources
New requirement, guidance for interpretation of BWR 7 lacking
CE-marking has now become mandatory in all EU countries for construction products covered by a harmonised product standard or a construction product that conforms to a European Technical Assessment which has been issued for the product. The CPR requires that harmonised test methods are used in the performance declarations in order to remove trade barriers between member states. The CPR (as former Construction Products Directive) does not intend to harmonise existing national regulations and requirements concerning the actual construction works. Member States and public and private sector procurers are free to set their own requirements on the performance of buildings and construction works and therefore performance levels of products.
In this report the main focus is on how to use BWR 3-data in the assessment of environmental sustainability. That is data which has been produced in order to assess the performance of a construction product with respect to BWR 3. As can be seen from Box 2.2 there is focus on the presence of dangerous substances in construction products and their release into soil, ground water, marine waters or surface water and their emissions into indoor air in the form of toxic gases, radiation or particles. Methods for determination of emissions and release have been harmonised (see chapter 3), but no horizontal approach (or scenarios) to describe the release to soil and water has been developed.
23
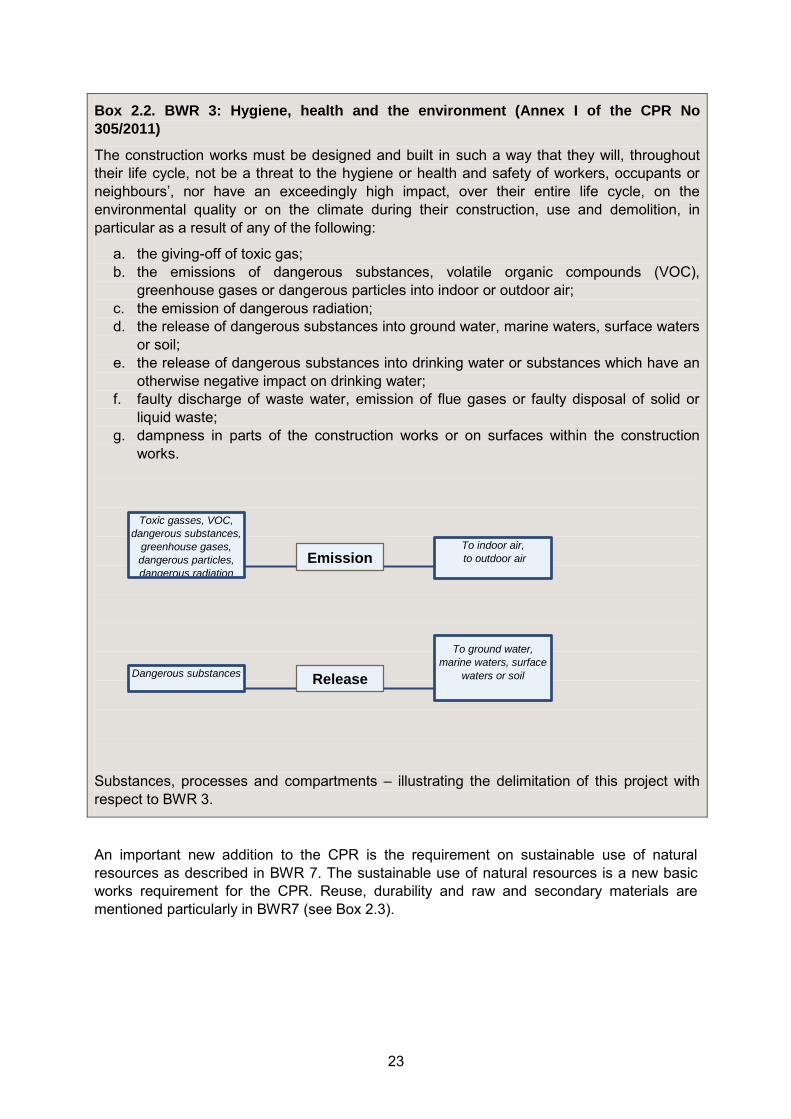
Box 2.2. BWR 3: Hygiene, health and the environment (Annex I of the CPR No
305/2011)
The construction works must be designed and built in such a way that they will, throughout their life cycle, not be a threat to the hygiene or health and safety of workers, occupants or neighbours’, nor have an exceedingly high impact, over their entire life cycle, on the environmental quality or on the climate during their construction, use and demolition, in particular as a result of any of the following:
a. the giving-off of toxic gas; b. the emissions of dangerous substances, volatile organic compounds (VOC),
greenhouse gases or dangerous particles into indoor or outdoor air; c. the emission of dangerous radiation; d. the release of dangerous substances into ground water, marine waters, surface waters
or soil; e. the release of dangerous substances into drinking water or substances which have an
otherwise negative impact on drinking water; f. faulty discharge of waste water, emission of flue gases or faulty disposal of solid or
liquid waste; g. dampness in parts of the construction works or on surfaces within the construction
works.
Substances, processes and compartments – illustrating the delimitation of this project with respect to BWR 3.
An important new addition to the CPR is the requirement on sustainable use of natural resources as described in BWR 7. The sustainable use of natural resources is a new basic works requirement for the CPR. Reuse, durability and raw and secondary materials are mentioned particularly in BWR7 (see Box 2.3).
Emission
Release
Toxic gasses, VOC,
dangerous substances,
greenhouse gases,
dangerous particles,
dangerous radiation
Dangerous substances
To indoor air,
to outdoor air
To ground water,
marine waters, surface
waters or soil
24
Box 2.3. BWR 7: Sustainable use of natural resources (Annex I of the CPR No
305/2011)
The construction works must be designed, built and demolished in such a way that the use of natural resources is sustainable and in particular ensure the following:
a. reuse or recyclability of the construction works, their materials and parts after demolition;
b. durability of the construction works; c. use of environmentally compatible raw and secondary materials in the construction
works.
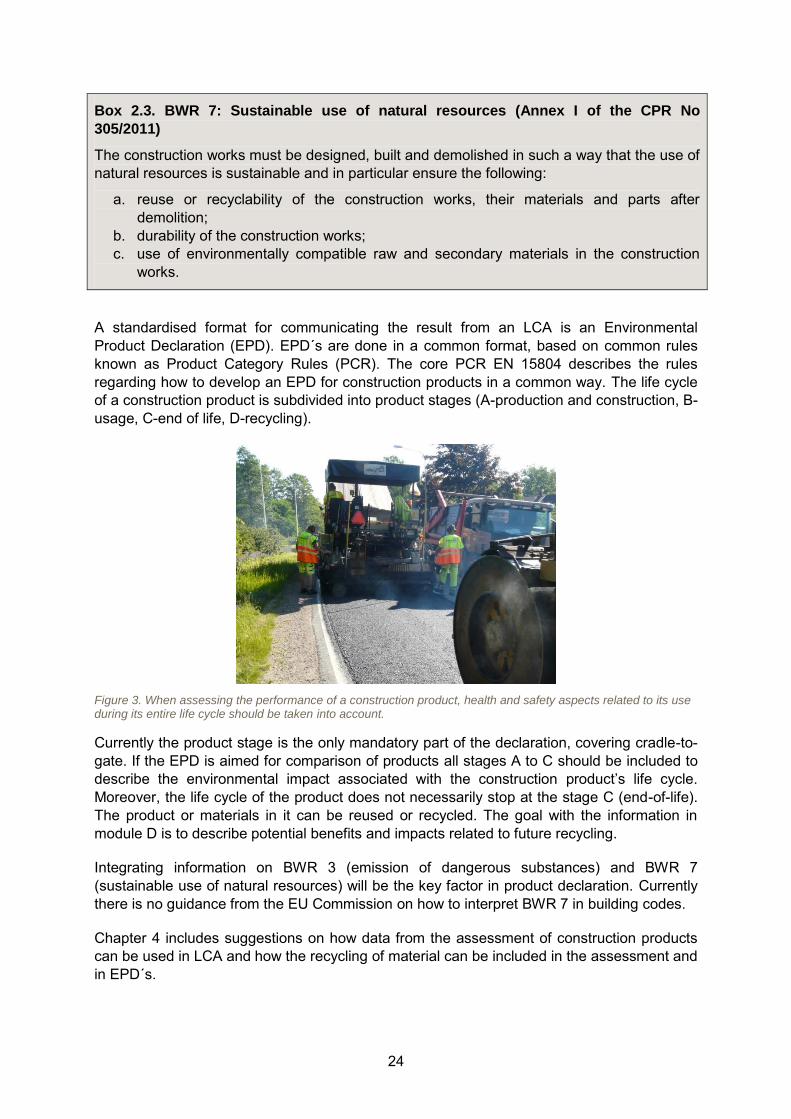
A standardised format for communicating the result from an LCA is an Environmental Product Declaration (EPD). EPD´s are done in a common format, based on common rules known as Product Category Rules (PCR). The core PCR EN 15804 describes the rules regarding how to develop an EPD for construction products in a common way. The life cycle of a construction product is subdivided into product stages (A-production and construction, B-usage, C-end of life, D-recycling).
Figure 3. When assessing the performance of a construction product, health and safety aspects related to its use during its entire life cycle should be taken into account.
Currently the product stage is the only mandatory part of the declaration, covering cradle-to-gate. If the EPD is aimed for comparison of products all stages A to C should be included to describe the environmental impact associated with the construction product’s life cycle. Moreover, the life cycle of the product does not necessarily stop at the stage C (end-of-life). The product or materials in it can be reused or recycled. The goal with the information in module D is to describe potential benefits and impacts related to future recycling.
Integrating information on BWR 3 (emission of dangerous substances) and BWR 7 (sustainable use of natural resources) will be the key factor in product declaration. Currently there is no guidance from the EU Commission on how to interpret BWR 7 in building codes.
Chapter 4 includes suggestions on how data from the assessment of construction products can be used in LCA and how the recycling of material can be included in the assessment and in EPD´s.
25
1.2 DANGEROUS SUBSTANCES AND FUTURE ASPECTS CPR focuses on dangerous substances, but in the other hand CPR notices only on current regulated substances for compliance with EU and national legislation.
CPR focuses on currently dangerous substances. This means substances, preparations and radioactive substances that are present in construction products and may be released from those products. They may or may not as such be dangerous, but if released or emitted from a construction product they may present a danger for man or the environment during normal use of the construction products when installed in construction works. Information about toxicity and dangerous properties of different substances is however constantly updated and revised. Therefore the list of dangerous substances will hardly ever be complete requiring constant follow up from construction producers and other shareholders.
Generally, substances that are of concern within the built environment can be defined as substances that have a negative impact on human health or the environment. For many compounds, the scientific evidence for such impact has been considered adequate and measures like international treaties / guidelines to restrict the use of them have been established on a broad level (United Nations, UN or World Health Organization, WHO). Such compounds are usually persistent and bio-accumulative (like persistent organic pollutants, POPs) or regarded as hazardous for human health (like indoor air pollutants). The European Union (EU) directives regulate the use or give limit values for many of these substances. The Biocide directive, for example, provides a framework of rules that apply to the marketing of biocides, whereas the Water framework directive gives limit values for a number of substances to avoid both short- and long-term pollution problems.
Within the Construction Product Directive/Regulation (CPD 89/106/EC, CPR 305/2011/EU) and CE marking of construction products, the following substance categories can be identified:
Group 1: Substances that are regulated through EU legislation. This group includes substances that are regulated through EU directives and therefore are restricted on a legislative base throughout the EU.
Group 2: Substances that are regulated on national levels in member states and where the national legislation is notified within EU. These substances have a priority status within the assessment of substances for the CE mark. – Note! Substances that are regulated through national regulation and that has not been notified within EU have a lower priority within the CE marking although national requirements within the member states exist.
Group 3: Potentially problematic substances (e.g. nanoparticles, anti-microbial agents)
In recent years, several efforts have been made by the European Commission for the assessment of dangerous substances within the European building product / construction industry under the Basic work requirement 3 – “Hygiene, health and the environment” (BWR3) of the Construction Products Regulations. The Expert Group on Dangerous Substances (EGDS) was established and has prepared an “Indicative list on dangerous substances” and a database on national regulations in terms of dangerous substances. The database can be found at: http://ec.europa.eu/enterprise/sectors/construction/cp-ds/index_en.htm and it can be browsed in terms of substance name, CAS number, legislation, country, product family, and material or release environment.
The CPR also specifically mentions that, where applicable the declaration of performance should be accompanied by information on the content of hazardous substances in the
26
construction product in order to improve the possibilities for sustainable construction and to facilitate the development of environmentally friendly products. This requirement concerns especially the content of Substance of very high concern (SVHC) defined in REACH.
Although the present legislation restricts the use of many dangerous substances in new building products, there is a considerable concern for compounds present in old construction products, since their presence in construction and demolition waste may limit the recyclability of the material and potentially cause disposal problems. One group of substances that receives attention is PCB´s (polychlorinated biphenyls).
In addition, there are a number of substances that – as more scientific evidence on potential impacts on health and the environment emerges – may be regulated in the future, i.e. nanoparticles, fine particles, odorous compounds, soluble compounds, to name a few. Therefore, construction product producers should reconsider the use of substances that are suspected to cause health/ environmental hazards.
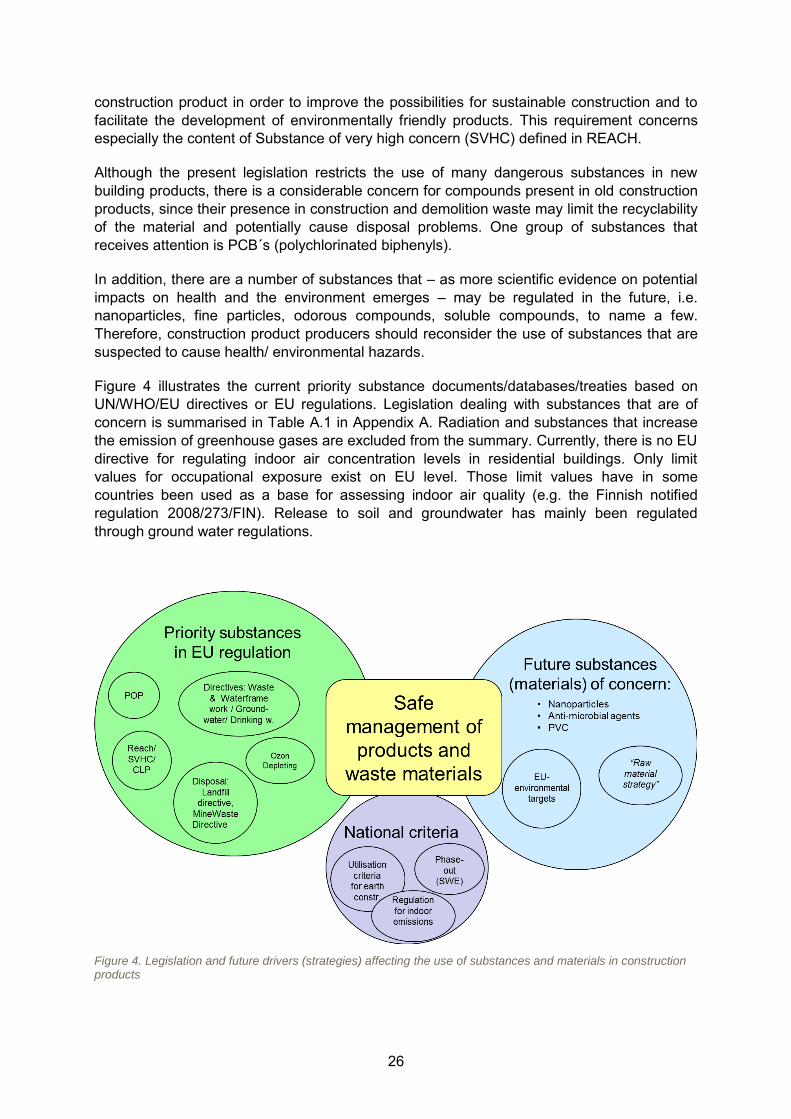
Figure 4 illustrates the current priority substance documents/databases/treaties based on UN/WHO/EU directives or EU regulations. Legislation dealing with substances that are of concern is summarised in Table A.1 in Appendix A. Radiation and substances that increase the emission of greenhouse gases are excluded from the summary. Currently, there is no EU directive for regulating indoor air concentration levels in residential buildings. Only limit values for occupational exposure exist on EU level. Those limit values have in some countries been used as a base for assessing indoor air quality (e.g. the Finnish notified regulation 2008/273/FIN). Release to soil and groundwater has mainly been regulated through ground water regulations.
Figure 4. Legislation and future drivers (strategies) affecting the use of substances and materials in construction products
27
1.3 REUSE AND RECYCLING OF C&D WASTE FROM RENOVATION The reuse and recycling of construction and demolition (C&D) waste has long been recognized to have a huge potential for conserving natural resources. In the future ever-increasing costs and new restrictions for landfilling (e.g. ban of biodegradable fractions) create needs for sustainable reuse and recycling solutions of different C&D waste fractions. EU addresses in its current and future strategies and targets both the safe material use of building materials and the reduction in C&D waste amounts for landfilling.
The EU Waste Framework Directive (Directive 2008/98/EC) requires the 70% re-use and recycling target for 2020 for C&D waste management. However, the EU-27 have to integrate the directives target into national legislation and this can be done in different ways. Apparently, some of the member states (MS) have legislation in place that already ensures high re-use and recycling rates for C&D waste, e.g. Denmark and the Netherlands. Other countries, on the other hand, have legislation in place, that needs to be revised to develop more effective measures and to set intermediate targets in order to be able to achieve the 2020 target. A review of the C&D waste related legislation for the EU-27 (see Appendix B) showed that most of the countries have legislation in place that encourages the recycling of C&D waste. However, whilst the legislation is of very general character in most countries (i.e. which C&D waste fractions should be sorted), in some countries it contains requirements for the characterization/testing by means of leaching test of C&D waste before the recycled products can be re-used.
Because of the large amounts of waste generated, C&D waste has been identified as a priority waste stream for reuse and recycling. Since the production of construction materials to a large extend relies on natural resources improved management of C&D waste would contribute to the effective and efficient use of natural resources. For this reason, the Waste Framework Directive (WFD) requires the Member States of the European Union to take the necessary measures to achieve a minimum of 70% (by weight) re-use, recycling and other material recovery (including backfilling) of non-hazardous construction and demolition waste by 2020.
The EU-27 MS generate an estimated 530 million tonnes C&D waste per year, of which about 46% are re-used or recycled. It can be assumed that around 60% of the C&D waste arises from renovation, 25% from demolition and 15% from construction (Monier et al. 2011). Monier et al. (2011) summarized data from two recent sources where waste generation data for individual MS had been collected (Excavation material, e.g. soil and stones, is excluded). The data shows large variation between countries and is according to Monier et al. (2011) a result of unequal levels of control and reporting for C&D waste in MS, as well as differences in waste definitions and reporting mechanisms. A summary of the estimated amounts for C&D waste (construction and demolition waste) generation and re-use/recycling rates for EU-27 MS as well as the recycling potential has been collated in Appendix C.
The data indicates that there is a potential for increase in re-use and recycling in EU-27. Even though 6 countries report recycling rates that already fulfil the requirements of the WFD, the majority of countries has still lot to do in improving their recycling rates, in order to meet the 2020 target.
28
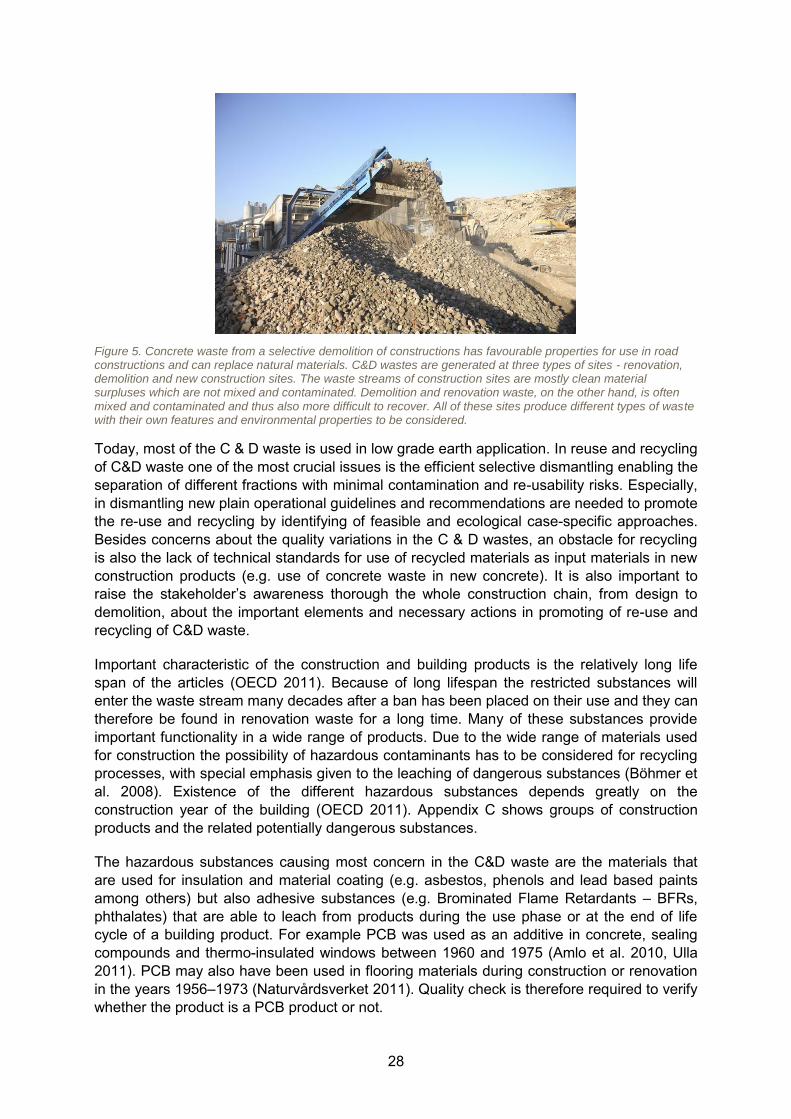
Figure 5. Concrete waste from a selective demolition of constructions has favourable properties for use in road constructions and can replace natural materials. C&D wastes are generated at three types of sites - renovation, demolition and new construction sites. The waste streams of construction sites are mostly clean material surpluses which are not mixed and contaminated. Demolition and renovation waste, on the other hand, is often mixed and contaminated and thus also more difficult to recover. All of these sites produce different types of waste with their own features and environmental properties to be considered.
Today, most of the C & D waste is used in low grade earth application. In reuse and recycling of C&D waste one of the most crucial issues is the efficient selective dismantling enabling the separation of different fractions with minimal contamination and re-usability risks. Especially, in dismantling new plain operational guidelines and recommendations are needed to promote the re-use and recycling by identifying of feasible and ecological case-specific approaches. Besides concerns about the quality variations in the C & D wastes, an obstacle for recycling is also the lack of technical standards for use of recycled materials as input materials in new construction products (e.g. use of concrete waste in new concrete). It is also important to raise the stakeholder’s awareness thorough the whole construction chain, from design to demolition, about the important elements and necessary actions in promoting of re-use and recycling of C&D waste.
Important characteristic of the construction and building products is the relatively long life span of the articles (OECD 2011). Because of long lifespan the restricted substances will enter the waste stream many decades after a ban has been placed on their use and they can therefore be found in renovation waste for a long time. Many of these substances provide important functionality in a wide range of products. Due to the wide range of materials used for construction the possibility of hazardous contaminants has to be considered for recycling processes, with special emphasis given to the leaching of dangerous substances (Böhmer et al. 2008). Existence of the different hazardous substances depends greatly on the construction year of the building (OECD 2011). Appendix C shows groups of construction products and the related potentially dangerous substances.
The hazardous substances causing most concern in the C&D waste are the materials that are used for insulation and material coating (e.g. asbestos, phenols and lead based paints among others) but also adhesive substances (e.g. Brominated Flame Retardants – BFRs, phthalates) that are able to leach from products during the use phase or at the end of life cycle of a building product. For example PCB was used as an additive in concrete, sealing compounds and thermo-insulated windows between 1960 and 1975 (Amlo et al. 2010, Ulla 2011). PCB may also have been used in flooring materials during construction or renovation in the years 1956–1973 (Naturvårdsverket 2011). Quality check is therefore required to verify whether the product is a PCB product or not.
29
2 DETERMINING EMISSION AND RELEASE FROM
CONSTRUCTION PRODUCTS
Horizontal standardised assessment procedures are been developed by CEN/TC 351 both for the measurement of emissions to indoor air emissions and the release of substances to soil and groundwater. These are the basic methods to be used in harmonised product standards (hENs) for assessing BWR 3 properties, i.e. emission and release of dangerous substances from construction products related to the CE marking. Currently, the harmonised product standards (hENs) are now under revision for the inclusion of BWR 3 properties.
There is another on-going standardisation activity that deals with radiation. In addition, technical reports on the appropriate standard test methods for the determination of the content of regulated dangerous substances in construction products as well as on a horizontal approach to assess the possible release of dangerous substances have been prepared.
2.1 STANDARDISED DETERMINATION METHODS FOR BWR3 Table 2 summarises the documents and test methods related to the harmonisation work done in the technical committee TC 351.
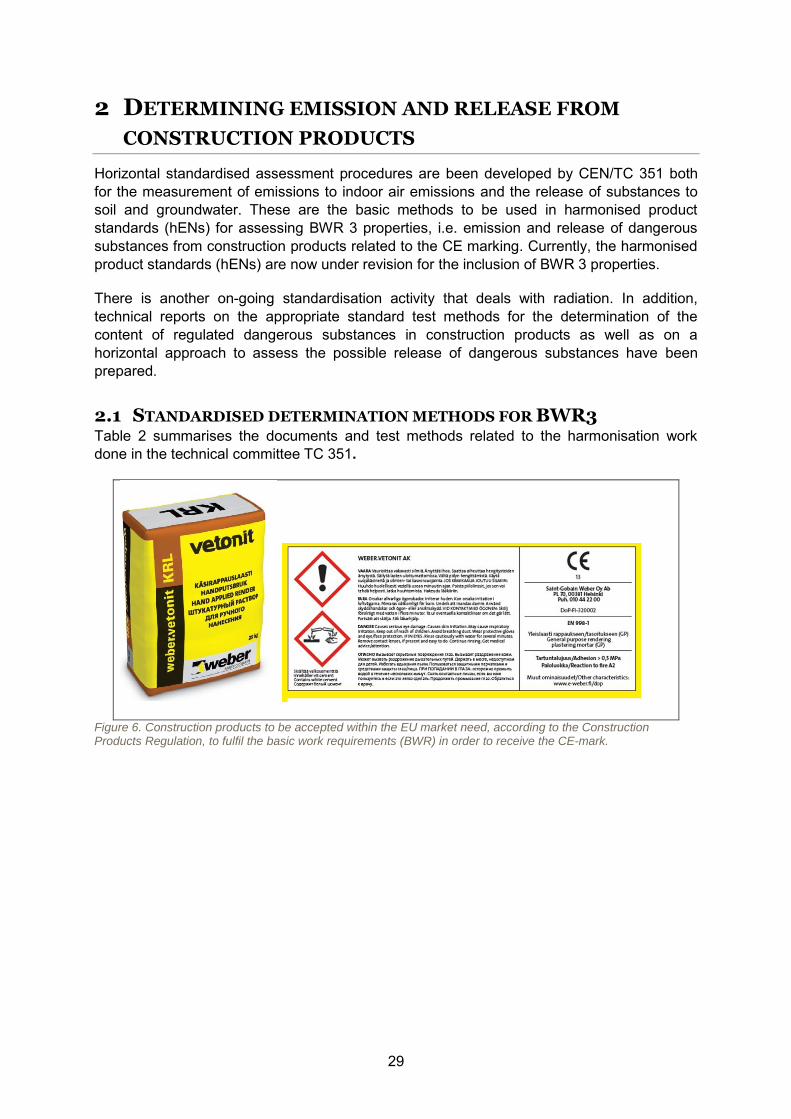
Figure 6. Construction products to be accepted within the EU market need, according to the Construction Products Regulation, to fulfil the basic work requirements (BWR) in order to receive the CE-mark.
30
Table 2. Overview of standardised methods and tools for use of BWR-results in CE-marking.
Document/
reference
Document title Key content & remarks
FprCEN/TS 16516
Construction products - Assessment of emissions of regulated dangerous substances from construction products - Determination of emissions into indoor air
Draft method based on ISO 16000-9, test method aimed to be published as EN.
FprCEN/TS 16637-1
Construction products – Assessment of release of dangerous substances – Part 1: Guidance for the determination of leaching tests and additional testing steps
Guidance for identification of appropriate leaching test method for determination of release of regulated dangerous substances from construction products into soil, surface water and ground water
FprCEN/TS 16637-2
Construction products – Assessment of release of dangerous substances – Horizontal dynamic surface leaching test
Test method based on CEN/TS 15863 for determination of surface dependent release of substances from monolithic or plate-like or sheet-like construction products. Test method aimed to be published as EN after validation.
WI 00351010
Construction products – Assessment of release of dangerous substances – Horizontal up-flow percolation test
Technical specification probably available in 2014/2015
WI 00351013
Construction products – Assessment of release of dangerous substances – Guidance on assessment and verification of consistency of performance
Gives a concept for sampling frequency for evaluation of conformity with regulative values
CEN/TR 15858:2009
Construction products – Assessment of the release of regulated dangerous substances from construction products based on the WT, WFT/FT procedures
Describes a procedure for assessing construction products with regards to their release/emission of regulated dangerous substances (RDS) into the environment in accordance with BWR 3 of the Construction Products Directive (CPD), as far as these construction products fall under the responsibility of CEN.
CEN/TR 16098:2010
Construction products: Assessment of release of dangerous substances - Concept of horizontal testing procedures in support of requirements under the CPD
Provides recommendations for complete testing procedures in the overall framework of the CPD according to the methods for the Attestation of Conformity (AoC). Evaluation of a horizontal approach to assess the possible release of dangerous substances from construction products in support of requirements from the construction products directive.
CEN/TR 16045:2010
Construction Products – Assessment of release of dangerous substances – Content of regulated dangerous substances – Selection of analytical methods
Describes appropriate standard test methods for the determination of the content of regulated dangerous substances in construction products
CEN/TR 16220:2011
Construction products – Assessment of release of dangerous substances – Complement to sampling
Covers the specific requirements for sampling construction products to determine the release or emission of dangerous substances in their intended use. It is
31
Document/
reference
Document title Key content & remarks
complementary to existing sampling standards and sampling instruction in product standards or test methods for construction products. Based on EN 14889 developed for waste sampling
CEN/TR 16496:2012
Construction Products – Assessment of release of dangerous substances – Use of harmonised horizontal assessment methods
Gives guidance for Product TCs on how to include horizontal test standards in harmonised technical specifications (hEN)
2.1.1 Emissions to indoor air
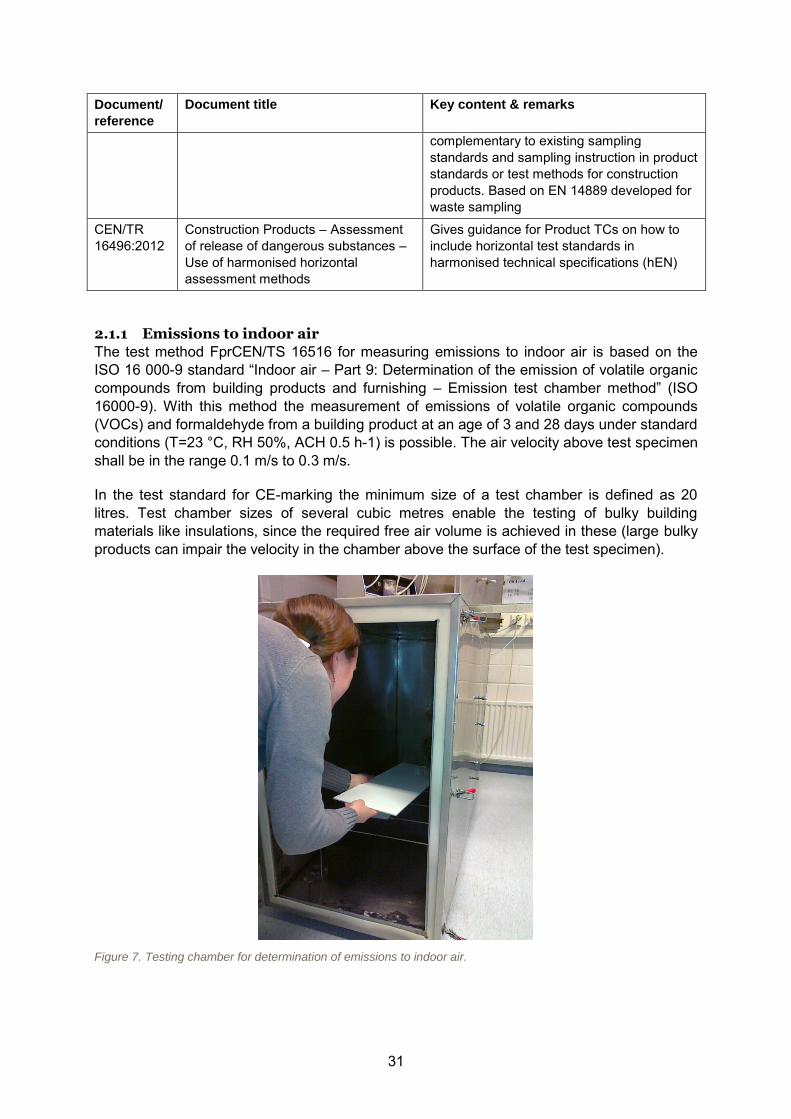
The test method FprCEN/TS 16516 for measuring emissions to indoor air is based on the ISO 16 000-9 standard “Indoor air – Part 9: Determination of the emission of volatile organic compounds from building products and furnishing – Emission test chamber method” (ISO 16000-9). With this method the measurement of emissions of volatile organic compounds (VOCs) and formaldehyde from a building product at an age of 3 and 28 days under standard conditions (T=23 °C, RH 50%, ACH 0.5 h-1) is possible. The air velocity above test specimen shall be in the range 0.1 m/s to 0.3 m/s.
In the test standard for CE-marking the minimum size of a test chamber is defined as 20 litres. Test chamber sizes of several cubic metres enable the testing of bulky building materials like insulations, since the required free air volume is achieved in these (large bulky products can impair the velocity in the chamber above the surface of the test specimen).
Figure 7. Testing chamber for determination of emissions to indoor air.
32
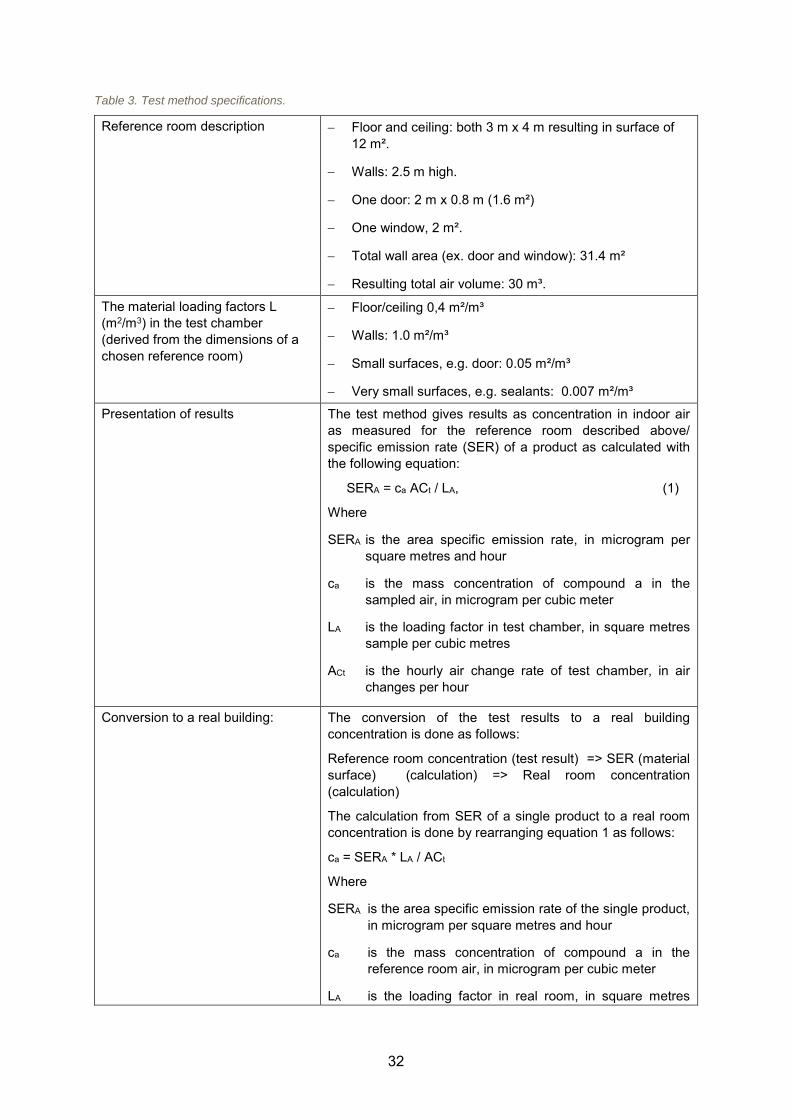
Table 3. Test method specifications.
Reference room description Floor and ceiling: both 3 m x 4 m resulting in surface of 12 m².
Walls: 2.5 m high.
One door: 2 m x 0.8 m (1.6 m²)
One window, 2 m².
Total wall area (ex. door and window): 31.4 m²
Resulting total air volume: 30 m³.
The material loading factors L (m2/m3) in the test chamber (derived from the dimensions of a chosen reference room)
Floor/ceiling 0,4 m²/m³
Walls: 1.0 m²/m³
Small surfaces, e.g. door: 0.05 m²/m³
Very small surfaces, e.g. sealants: 0.007 m²/m³
Presentation of results The test method gives results as concentration in indoor air as measured for the reference room described above/ specific emission rate (SER) of a product as calculated with the following equation:
SERA = ca ACt / LA, (1)
Where
SERA is the area specific emission rate, in microgram per square metres and hour
ca is the mass concentration of compound a in the sampled air, in microgram per cubic meter
LA is the loading factor in test chamber, in square metres sample per cubic metres
ACt is the hourly air change rate of test chamber, in air changes per hour
Conversion to a real building: The conversion of the test results to a real building concentration is done as follows:
Reference room concentration (test result) => SER (material surface) (calculation) => Real room concentration (calculation)
The calculation from SER of a single product to a real room concentration is done by rearranging equation 1 as follows:
ca = SERA * LA / ACt
Where
SERA is the area specific emission rate of the single product, in microgram per square metres and hour
ca is the mass concentration of compound a in the reference room air, in microgram per cubic meter
LA is the loading factor in real room, in square metres
33
sample per cubic metres
ACt is the hourly air change rate of real room, in air changes per hour
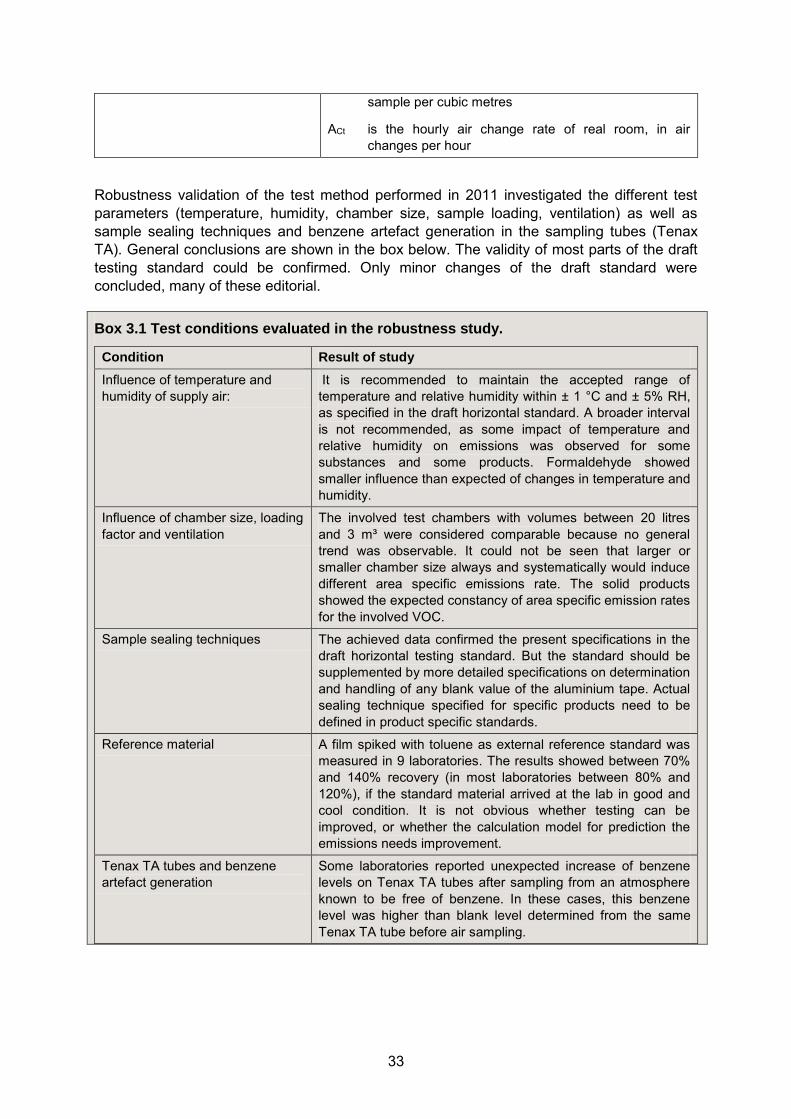
Robustness validation of the test method performed in 2011 investigated the different test parameters (temperature, humidity, chamber size, sample loading, ventilation) as well as sample sealing techniques and benzene artefact generation in the sampling tubes (Tenax TA). General conclusions are shown in the box below. The validity of most parts of the draft testing standard could be confirmed. Only minor changes of the draft standard were concluded, many of these editorial.
Box 3.1 Test conditions evaluated in the robustness study.
Condition Result of study
Influence of temperature and humidity of supply air:
It is recommended to maintain the accepted range of temperature and relative humidity within ± 1 °C and ± 5% RH, as specified in the draft horizontal standard. A broader interval is not recommended, as some impact of temperature and relative humidity on emissions was observed for some substances and some products. Formaldehyde showed smaller influence than expected of changes in temperature and humidity.
Influence of chamber size, loading factor and ventilation
The involved test chambers with volumes between 20 litres and 3 m³ were considered comparable because no general trend was observable. It could not be seen that larger or smaller chamber size always and systematically would induce different area specific emissions rate. The solid products showed the expected constancy of area specific emission rates for the involved VOC.
Sample sealing techniques The achieved data confirmed the present specifications in the draft horizontal testing standard. But the standard should be supplemented by more detailed specifications on determination and handling of any blank value of the aluminium tape. Actual sealing technique specified for specific products need to be defined in product specific standards.
Reference material A film spiked with toluene as external reference standard was measured in 9 laboratories. The results showed between 70% and 140% recovery (in most laboratories between 80% and 120%), if the standard material arrived at the lab in good and cool condition. It is not obvious whether testing can be improved, or whether the calculation model for prediction the emissions needs improvement.
Tenax TA tubes and benzene artefact generation
Some laboratories reported unexpected increase of benzene levels on Tenax TA tubes after sampling from an atmosphere known to be free of benzene. In these cases, this benzene level was higher than blank level determined from the same Tenax TA tube before air sampling.
34
2.1.2 Release to soil and water
For the release of outdoor emission of dangerous substances to ground water, marine waters, surface waters or soil two basic test concepts have been developed. A range of different construction products can be tested by both methods. The material properties and the intended use of a given construction product will define which method is most appropriate. The two methods are:
a generic horizontal dynamic surface leaching test for determination of surface dependent release of substances from monolithic or plate-like or sheet-like construction products” (including the compacted granular leaching test)
a generic horizontal up-flow percolation test for determination of the release of substances from granular construction products.
These two options therefore set needs for clarification of the borderline between the two test methods by experimental data on a range of different materials which can be tested by both methods. For this purpose a stepwise procedure has been developed for the determination of appropriate release tests, including sampling aspects and guidance for choice of test methods using specific product properties.
Different intended use scenarios can be defined based on how a construction product is going to be in contact with water e.g. (i) water is flowing over the surface of the product or (ii) water infiltrates into the product matrix driven by gravity. The choice of a specific test method will depend on the specific use of the construction product to be tested as well as the product´s physical properties.
Apart from the dynamic surface leaching test and the up-flow percolation test produced by CEN/TC 351, other basic leaching tests exist and may be carried out as complementary tests to address specific aspects relating to the scenario and possible external influences (that may e.g. cause changes in pH over a shorter or longer period of time). In cases where relevant leaching methods for a specific construction product or specific intended use scenario are not available to determine the release of certain substances from this product, the determination of total content may substitute released amounts as an (in lack of better) conservative estimate.
35
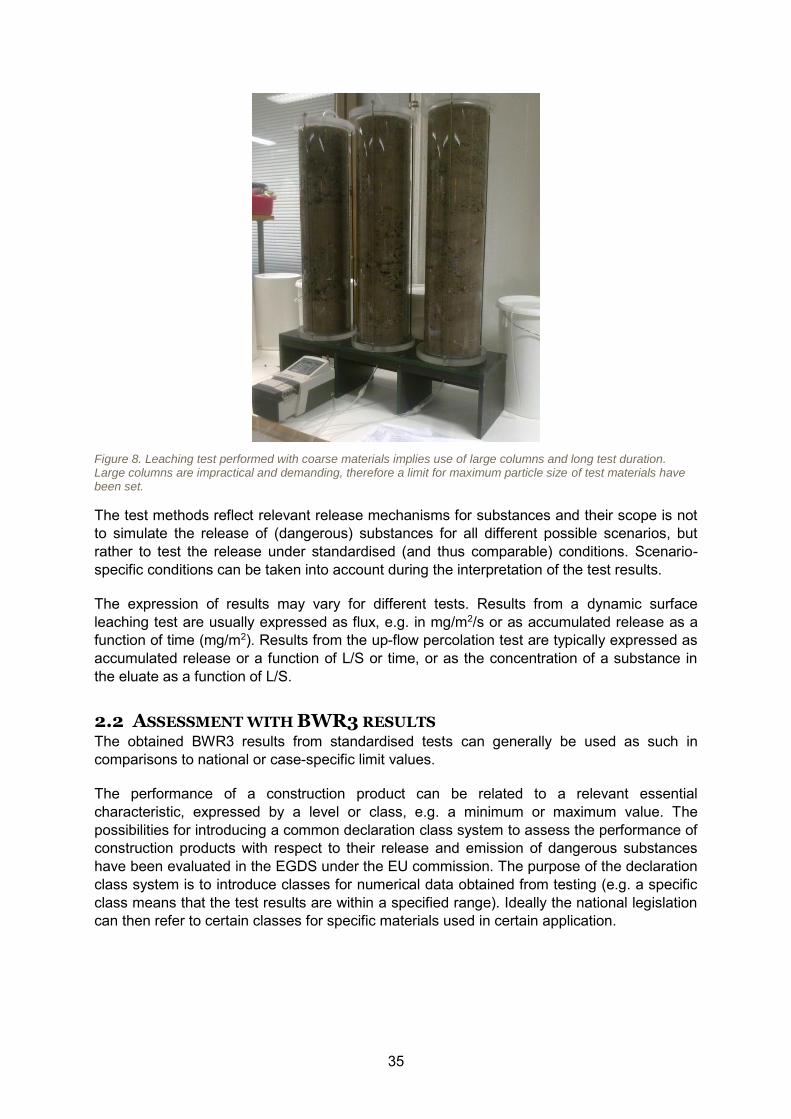
Figure 8. Leaching test performed with coarse materials implies use of large columns and long test duration. Large columns are impractical and demanding, therefore a limit for maximum particle size of test materials have been set.
The test methods reflect relevant release mechanisms for substances and their scope is not to simulate the release of (dangerous) substances for all different possible scenarios, but rather to test the release under standardised (and thus comparable) conditions. Scenario-specific conditions can be taken into account during the interpretation of the test results.
The expression of results may vary for different tests. Results from a dynamic surface leaching test are usually expressed as flux, e.g. in mg/m2/s or as accumulated release as a function of time (mg/m2). Results from the up-flow percolation test are typically expressed as accumulated release or a function of L/S or time, or as the concentration of a substance in the eluate as a function of L/S.
2.2 ASSESSMENT WITH BWR3 RESULTS The obtained BWR3 results from standardised tests can generally be used as such in comparisons to national or case-specific limit values.
The performance of a construction product can be related to a relevant essential characteristic, expressed by a level or class, e.g. a minimum or maximum value. The possibilities for introducing a common declaration class system to assess the performance of construction products with respect to their release and emission of dangerous substances have been evaluated in the EGDS under the EU commission. The purpose of the declaration class system is to introduce classes for numerical data obtained from testing (e.g. a specific class means that the test results are within a specified range). Ideally the national legislation can then refer to certain classes for specific materials used in certain application.
36
2.2.1 Comparison to notified national limit values
Release to soil
The results of standardized release tests can be directly compared to limit values stated in some countries (e.g. Austria, the Flanders region of Belgium, Denmark, Finland, France, the Netherlands, and soon also Germany). These limit values are mostly for granular mineral products in civil engineering works. Some apply to all construction materials, (the Netherlands), while others stipulate limit values for certain materials in specific constructions (Germany, Denmark and Finland).
Appendix A includes a table that summarizes which parameters are included in the testing of C&W waste and secondary raw materials in Belgium, the Netherlands, Austria, Denmark, Germany and Finland. Testing includes analysis of total content, leaching tests and evaluation of immission. The table contains a complete list of all the parameters covered and does not distinguish between different testing requirements for different fractions of C&D waste/ secondary raw materials covered by the countries legislation. Sweden has guidelines for the use of waste in constructions, but no legislative limit values.
Box 3.1 Examples of limit values for release in EU
The Netherlands: The Dutch “Soil Quality Decree” sets limit values for all stony construction materials, granular or monolithic, and for contaminated soil. Metals and salts have limit values for their leaching from construction materials, organic pollutants have limit values for total content (Regeling Bodemkwaliteit 2007). The Dutch Decree does not separate between products and secondary raw materials. Furthermore, the regulation includes an obligation to remove the material after its service lift has ended.
Germany: The Bauregelliste – BRL ('Building Regulation List') of the Deutsches Institut für Bautechnik – DIBt ('German Institute for Building Technology') regulates the use of individual construction products in detail by publishing valid technical rules. The product is labelled with the attestation of conformity mark (Ü-Zeichen). Assessment concepts have been developed for particular construction products: Concrete components (cement, aggregates, admixtures, additives), repair systems for sewage systems, injections in masonry. Germany has “a case-by-case approval system (DIBt)”. Germany is at this time of writing working on a Recycling Decree. This will set limit values for the use of several by-products and wastes, including construction and demolition waste, and contaminated soils (ErsatzbaustoffV 2011).
France: France has general guidelines for the use of alternative materials in constructions since 2011 (Sétra 2011), and these are being specified in legislation for specific materials. Bottom ash from incineration of non-hazardous waste is the subject of (Arrêté du 18/11/11 2011), and legislation for iron and steel slags is forthcoming. Finland has notified regulation for use of reclaimed concrete and certain ashes in earth works.
Finland has notified regulation for use of reclaimed concrete and certain ashes in earth works.
37
Indoor emissions
For indoor emissions national limit values exist in France, Germany and Belgium.
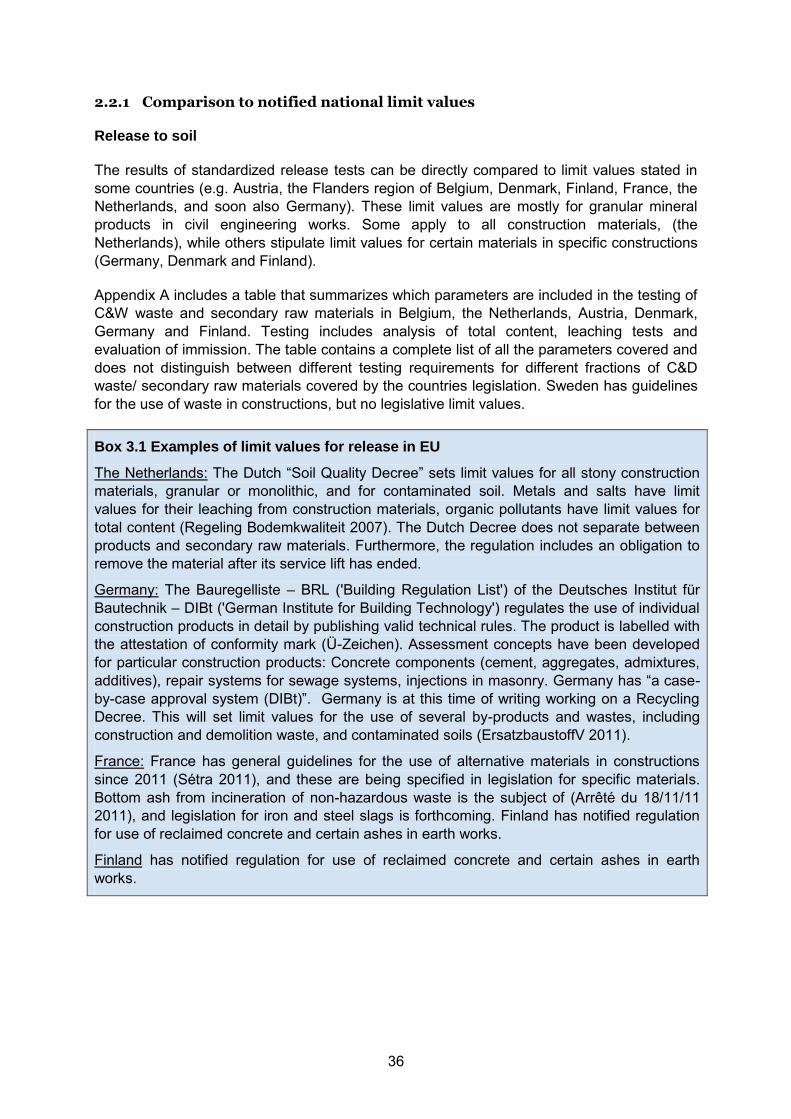
In France construction products may only be sold if they show that the 28 days emission of CMR substances trichloroethylene, benzene, di(2-ethylhexyl) phthalate (DEHP) and dibutylphthalate (DBP) is below 1 µg/m³ each, tested according to ISO 16000 and calculated for European reference room. The French regulation includes the mandatory labelling of construction products installed indoors. The products included are as follows:
Walls, ceiling, floor coverings and coatings, Panels for rooms partition and suspended ceiling Insulation products, Doors and windows, All products used for the installation of the products listed above.
Figure 9. Example of a construction product used in indoor applications. If testing is required, the amount of material (e.g. loading) in the chamber test depends on the use of the material as flooring material, on walls or smaller areas like sealing, respectively. Typically the emission properties of construction products are tested for single construction products and not as a composite.
The regulation does not cover untreated metal or glass, lockers, iron, screws etc., products used only outside. The regulation states that from 2012 on, any product covered by the regulation and placed on the market has to be labelled with emission classes based on their emissions after 28 days, as tested according to ISO 16000 and calculated for European reference room. The regulation gives limit values for VOC emissions classes, which are shown in Table 4 (ISL list).
In order to be approved by Deutsches Institut für Bautechnik (DIBt) for installation in German buildings, flooring materials have to fulfilling the requirements on emissions. Similar regulation exists for some other products, such as resin floorings and wall coverings. Since 2011 this regulation has also been valid for parquet floorings (EN 14342) and parquet coatings. Since 2012 flooring adhesives are covered as well.
The requirements comprise limitations to emissions for 3 and 28 days. The 3 days test is representative of a building renovation case with early re-occupancy and prohibits excessively high initial VOC emissions and the presence of carcinogens. The 28 days test is representative of long-term emissions. This approach, based on the AgBB (Ausschuss zur gesundheitlichen Bewertung von Bauprodukten) scheme, sets limits for:
38
Carcinogens after 3 and 28 days Total VOC after 3 and 28 days Total SVOC after 28 days Single VOC compounds with “LCl” limit values after 28 days. Single VOC compounds without such limit values after 28 days.
At this date, a new draft Belgian regulation on VOC emissions has been notified to the European Commission. The Royal Decree establishes threshold levels for the emissions to the indoor environment from construction products for certain intended uses. The regulation intends to define maximum emissions for VOCs (and SVOCs, carcinogens, formaldehyde and acetaldehyde) at 28 days. The limits are similar to the German regulation, but with some differences in detail. There will be no approval bureaucracy and no labelling requirements; instead there will be market surveillance.
2.2.2 Declaration classes for dangerous substances in CE-marking
Due to challenges in handling huge amounts of existing regulated substances and limit values, it has been discussed to introduce a European system of technical classes for release of dangerous substances to indoor air, soil and ground water following a similar approach for the classification of products with regard to energy efficiency labelling colour schemes.
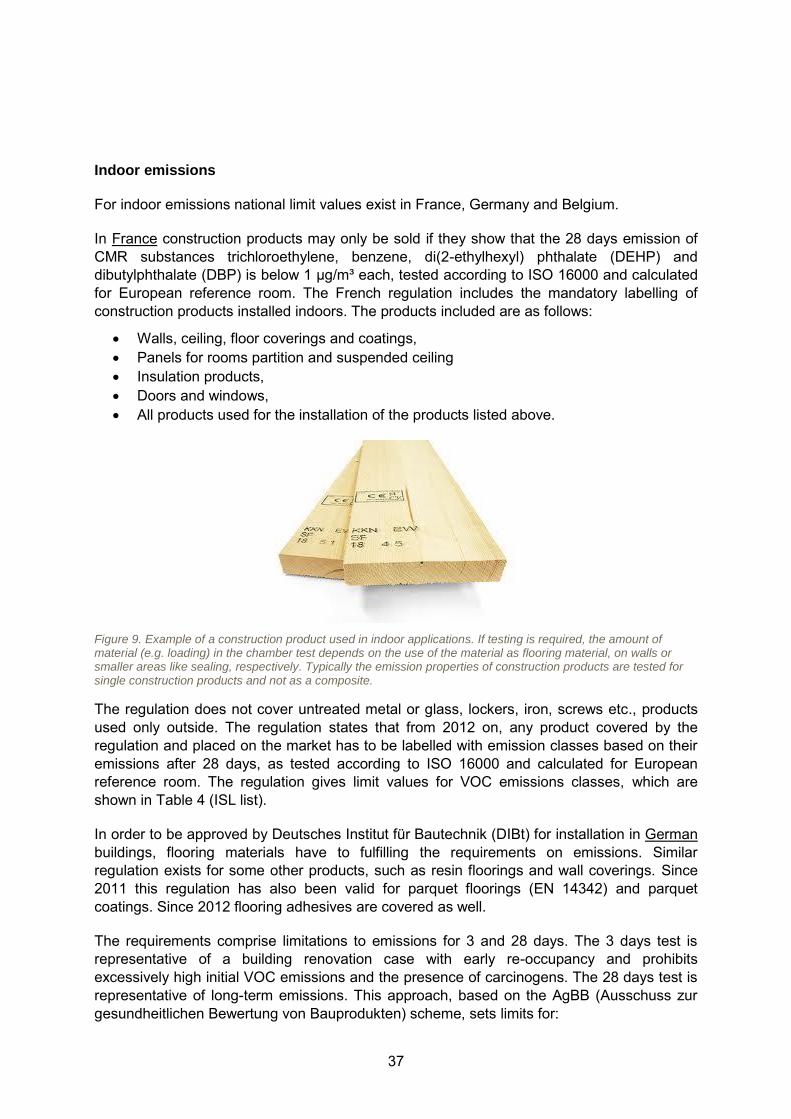
Release to soil/water
As mentioned earlier there are only a few Member States with regulatory requirements for the release of substances from construction products to soil and (ground) water: the Netherlands, Belgium, Denmark, Germany and Finland. These countries have created a pass-fail scheme for assessing and allowing the use of products in certain construction works based on the fulfilment of defined leaching based limit values. The given limit values are typically linked to 2 scenarios (un-paved and paved construction). There is no class for waste derived construction products failing the given limit values, because the use of the material in these cases is only acceptable through e.g. environmental permits.
The Figure 10 shows a comparison of limit values for leaching from construction products (mainly given for waste derived construction products) in Europe. It illustrates very well the lack of harmonisation in the existing limit values. It should, however, be noted that the limit values are not fully comparable, because for some countries (e.g. France) the values are limited to specific materials and applications. Also for free use there are different limit values probably depending on the acceptable risk at the defined point of compliance (POC) and the expected exposure after the constructions service life.
Besides the selected scenarios (e.g. in terms of height, length, width), also geographical differences (climate, soil, groundwater conditions) and national waste strategy affect the choices in the modelling to derive limit values.
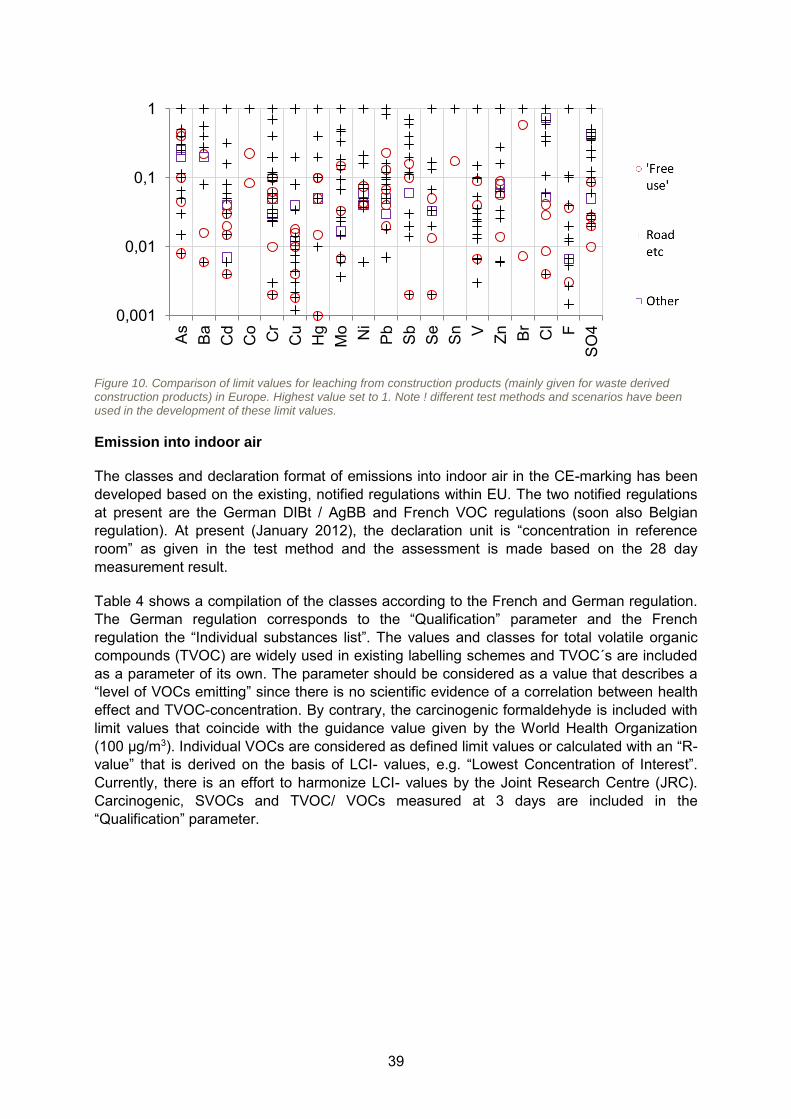
39
Figure 10. Comparison of limit values for leaching from construction products (mainly given for waste derived construction products) in Europe. Highest value set to 1. Note ! different test methods and scenarios have been used in the development of these limit values.
Emission into indoor air
The classes and declaration format of emissions into indoor air in the CE-marking has been developed based on the existing, notified regulations within EU. The two notified regulations at present are the German DIBt / AgBB and French VOC regulations (soon also Belgian regulation). At present (January 2012), the declaration unit is “concentration in reference room” as given in the test method and the assessment is made based on the 28 day measurement result.
Table 4 shows a compilation of the classes according to the French and German regulation. The German regulation corresponds to the “Qualification” parameter and the French regulation the “Individual substances list”. The values and classes for total volatile organic compounds (TVOC) are widely used in existing labelling schemes and TVOC´s are included as a parameter of its own. The parameter should be considered as a value that describes a “level of VOCs emitting” since there is no scientific evidence of a correlation between health effect and TVOC-concentration. By contrary, the carcinogenic formaldehyde is included with limit values that coincide with the guidance value given by the World Health Organization (100 µg/m3). Individual VOCs are considered as defined limit values or calculated with an “R-value” that is derived on the basis of LCI- values, e.g. “Lowest Concentration of Interest”. Currently, there is an effort to harmonize LCI- values by the Joint Research Centre (JRC). Carcinogenic, SVOCs and TVOC/ VOCs measured at 3 days are included in the “Qualification” parameter.
0,001
0,01
0,1
1
As
Ba
Cd
Co Cr
Cu
Hg
Mo Ni
Pb
Sb
Se
Sn V Zn Br Cl F
SO
4
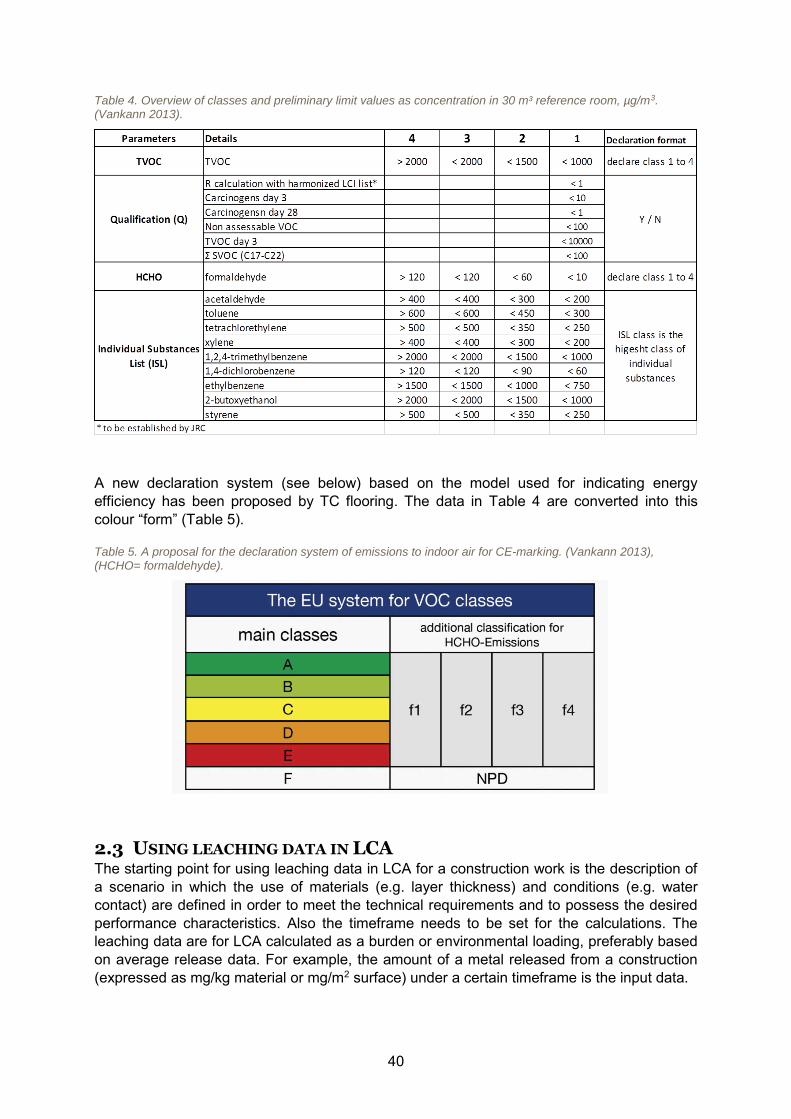
40
Table 4. Overview of classes and preliminary limit values as concentration in 30 m³ reference room, µg/m3. (Vankann 2013).
A new declaration system (see below) based on the model used for indicating energy efficiency has been proposed by TC flooring. The data in Table 4 are converted into this colour “form” (Table 5).
Table 5. A proposal for the declaration system of emissions to indoor air for CE-marking. (Vankann 2013), (HCHO= formaldehyde).
2.3 USING LEACHING DATA IN LCA The starting point for using leaching data in LCA for a construction work is the description of a scenario in which the use of materials (e.g. layer thickness) and conditions (e.g. water contact) are defined in order to meet the technical requirements and to possess the desired performance characteristics. Also the timeframe needs to be set for the calculations. The leaching data are for LCA calculated as a burden or environmental loading, preferably based on average release data. For example, the amount of a metal released from a construction (expressed as mg/kg material or mg/m2 surface) under a certain timeframe is the input data.
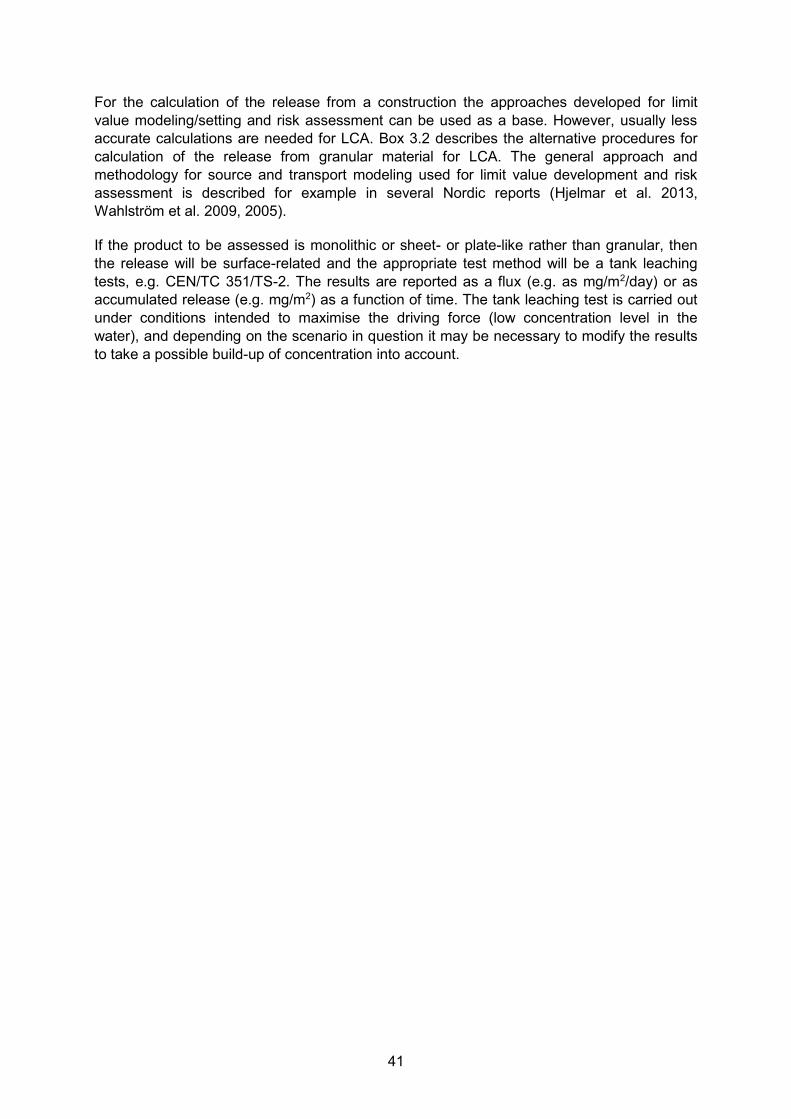
41
For the calculation of the release from a construction the approaches developed for limit value modeling/setting and risk assessment can be used as a base. However, usually less accurate calculations are needed for LCA. Box 3.2 describes the alternative procedures for calculation of the release from granular material for LCA. The general approach and methodology for source and transport modeling used for limit value development and risk assessment is described for example in several Nordic reports (Hjelmar et al. 2013, Wahlström et al. 2009, 2005).
If the product to be assessed is monolithic or sheet- or plate-like rather than granular, then the release will be surface-related and the appropriate test method will be a tank leaching tests, e.g. CEN/TC 351/TS-2. The results are reported as a flux (e.g. as mg/m2/day) or as accumulated release (e.g. mg/m2) as a function of time. The tank leaching test is carried out under conditions intended to maximise the driving force (low concentration level in the water), and depending on the scenario in question it may be necessary to modify the results to take a possible build-up of concentration into account.
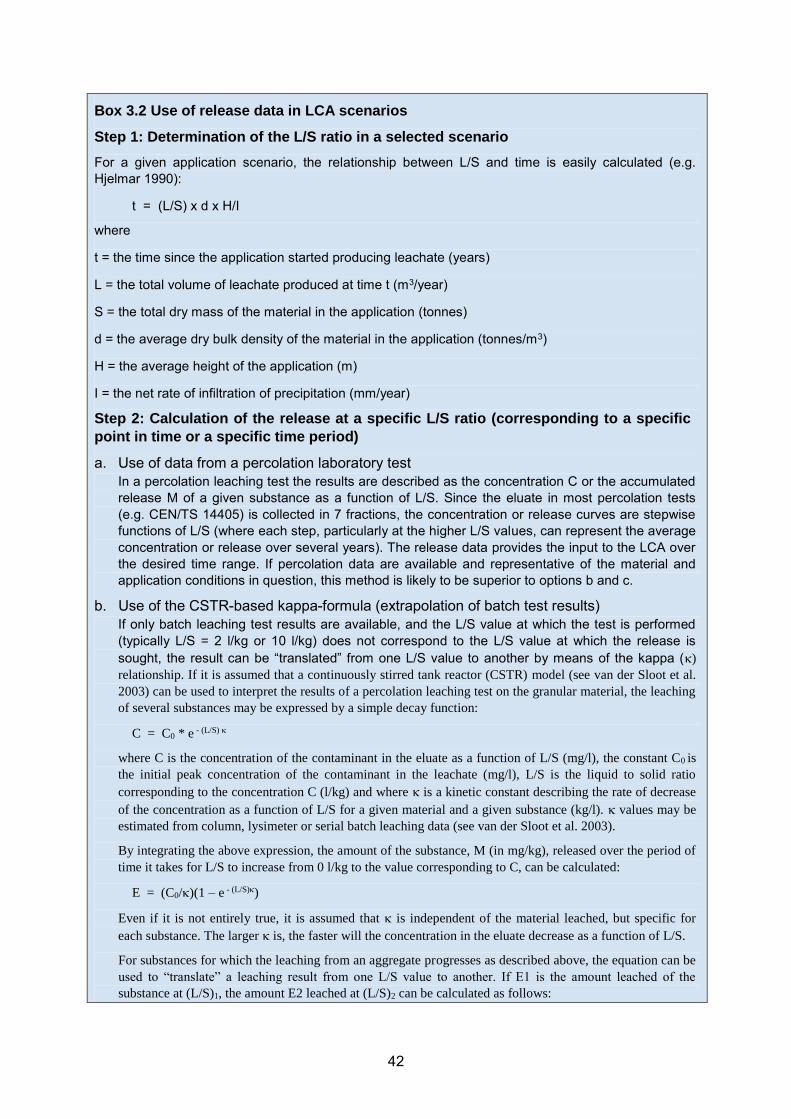
42
Box 3.2 Use of release data in LCA scenarios
Step 1: Determination of the L/S ratio in a selected scenario
For a given application scenario, the relationship between L/S and time is easily calculated (e.g. Hjelmar 1990):
t = (L/S) x d x H/I
where
t = the time since the application started producing leachate (years)
L = the total volume of leachate produced at time t (m3/year)
S = the total dry mass of the material in the application (tonnes)
d = the average dry bulk density of the material in the application (tonnes/m3)
H = the average height of the application (m)
I = the net rate of infiltration of precipitation (mm/year)
Step 2: Calculation of the release at a specific L/S ratio (corresponding to a specific
point in time or a specific time period)
a. Use of data from a percolation laboratory test In a percolation leaching test the results are described as the concentration C or the accumulated release M of a given substance as a function of L/S. Since the eluate in most percolation tests (e.g. CEN/TS 14405) is collected in 7 fractions, the concentration or release curves are stepwise functions of L/S (where each step, particularly at the higher L/S values, can represent the average concentration or release over several years). The release data provides the input to the LCA over the desired time range. If percolation data are available and representative of the material and application conditions in question, this method is likely to be superior to options b and c.
b. Use of the CSTR-based kappa-formula (extrapolation of batch test results) If only batch leaching test results are available, and the L/S value at which the test is performed (typically L/S = 2 l/kg or 10 l/kg) does not correspond to the L/S value at which the release is sought, the result can be “translated” from one L/S value to another by means of the kappa ()
relationship. If it is assumed that a continuously stirred tank reactor (CSTR) model (see van der Sloot et al.
2003) can be used to interpret the results of a percolation leaching test on the granular material, the leaching
of several substances may be expressed by a simple decay function:
C = C0 * e - (L/S)
where C is the concentration of the contaminant in the eluate as a function of L/S (mg/l), the constant C0 is
the initial peak concentration of the contaminant in the leachate (mg/l), L/S is the liquid to solid ratio
corresponding to the concentration C (l/kg) and where is a kinetic constant describing the rate of decrease
of the concentration as a function of L/S for a given material and a given substance (kg/l). values may be
estimated from column, lysimeter or serial batch leaching data (see van der Sloot et al. 2003).
By integrating the above expression, the amount of the substance, M (in mg/kg), released over the period of
time it takes for L/S to increase from 0 l/kg to the value corresponding to C, can be calculated:
E = (C0/)(1 – e - (L/S))
Even if it is not entirely true, it is assumed that is independent of the material leached, but specific for
each substance. The larger is, the faster will the concentration in the eluate decrease as a function of L/S.
For substances for which the leaching from an aggregate progresses as described above, the equation can be
used to “translate” a leaching result from one L/S value to another. If E1 is the amount leached of the
substance at (L/S)1, the amount E2 leached at (L/S)2 can be calculated as follows:
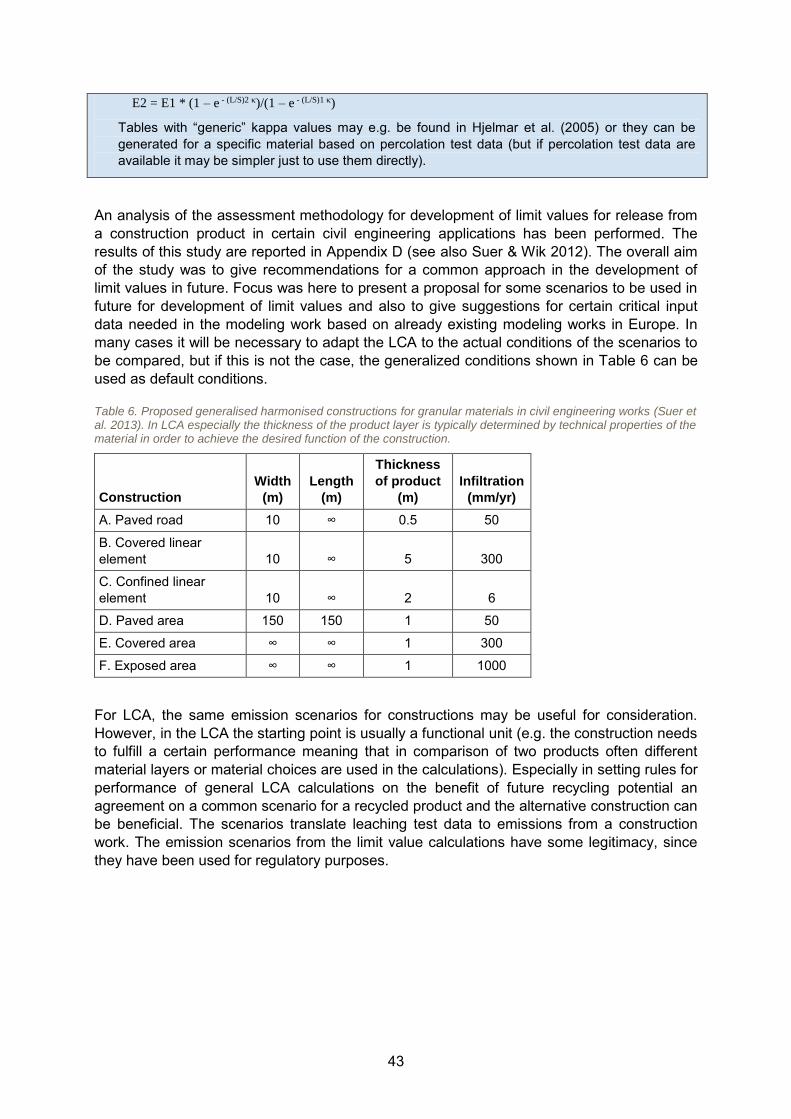
43
E2 = E1 * (1 – e - (L/S)2 )/(1 – e - (L/S)1 )
Tables with “generic” kappa values may e.g. be found in Hjelmar et al. (2005) or they can be generated for a specific material based on percolation test data (but if percolation test data are available it may be simpler just to use them directly).
An analysis of the assessment methodology for development of limit values for release from a construction product in certain civil engineering applications has been performed. The results of this study are reported in Appendix D (see also Suer & Wik 2012). The overall aim of the study was to give recommendations for a common approach in the development of limit values in future. Focus was here to present a proposal for some scenarios to be used in future for development of limit values and also to give suggestions for certain critical input data needed in the modeling work based on already existing modeling works in Europe. In many cases it will be necessary to adapt the LCA to the actual conditions of the scenarios to be compared, but if this is not the case, the generalized conditions shown in Table 6 can be used as default conditions.
Table 6. Proposed generalised harmonised constructions for granular materials in civil engineering works (Suer et al. 2013). In LCA especially the thickness of the product layer is typically determined by technical properties of the material in order to achieve the desired function of the construction.
Construction
Width
(m)
Length
(m)
Thickness
of product
(m)
Infiltration
(mm/yr)
A. Paved road 10 ∞ 0.5 50
B. Covered linear element 10 ∞ 5 300
C. Confined linear element 10 ∞ 2 6
D. Paved area 150 150 1 50
E. Covered area ∞ ∞ 1 300
F. Exposed area ∞ ∞ 1 1000
For LCA, the same emission scenarios for constructions may be useful for consideration. However, in the LCA the starting point is usually a functional unit (e.g. the construction needs to fulfill a certain performance meaning that in comparison of two products often different material layers or material choices are used in the calculations). Especially in setting rules for performance of general LCA calculations on the benefit of future recycling potential an agreement on a common scenario for a recycled product and the alternative construction can be beneficial. The scenarios translate leaching test data to emissions from a construction work. The emission scenarios from the limit value calculations have some legitimacy, since they have been used for regulatory purposes.
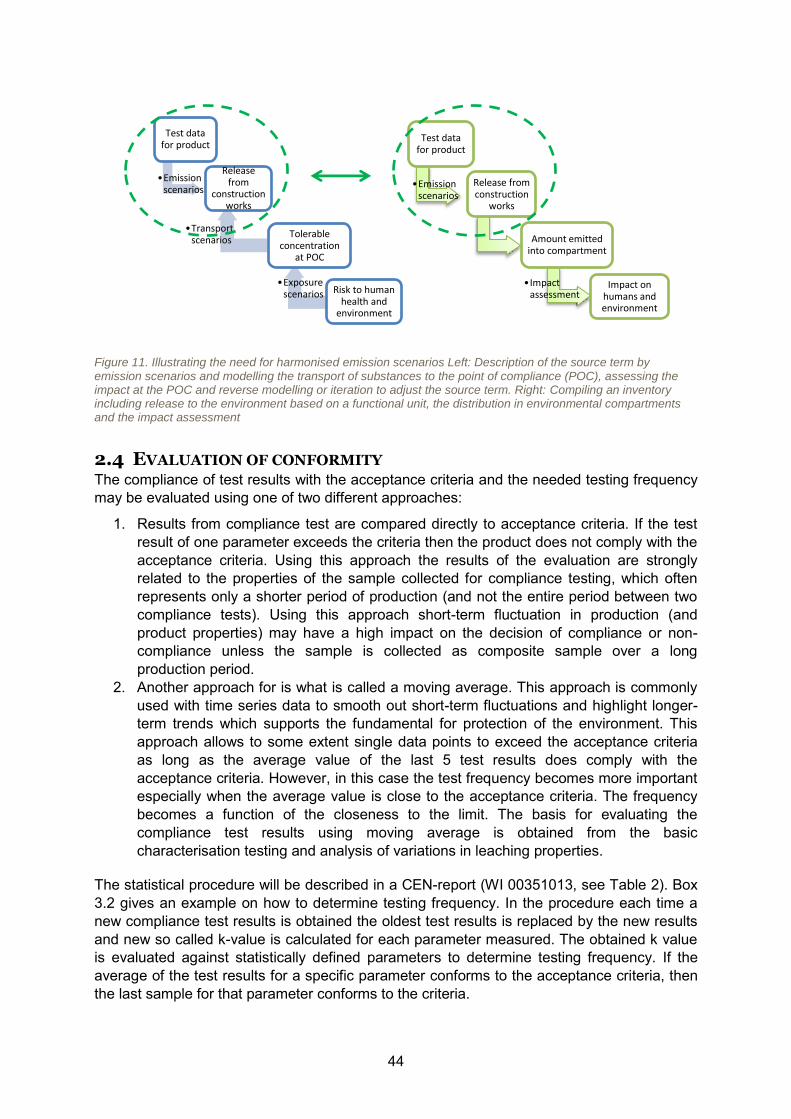
44
Figure 11. Illustrating the need for harmonised emission scenarios Left: Description of the source term by emission scenarios and modelling the transport of substances to the point of compliance (POC), assessing the impact at the POC and reverse modelling or iteration to adjust the source term. Right: Compiling an inventory including release to the environment based on a functional unit, the distribution in environmental compartments and the impact assessment
2.4 EVALUATION OF CONFORMITY The compliance of test results with the acceptance criteria and the needed testing frequency may be evaluated using one of two different approaches:
1. Results from compliance test are compared directly to acceptance criteria. If the test result of one parameter exceeds the criteria then the product does not comply with the acceptance criteria. Using this approach the results of the evaluation are strongly related to the properties of the sample collected for compliance testing, which often represents only a shorter period of production (and not the entire period between two compliance tests). Using this approach short-term fluctuation in production (and product properties) may have a high impact on the decision of compliance or non-compliance unless the sample is collected as composite sample over a long production period.
2. Another approach for is what is called a moving average. This approach is commonly used with time series data to smooth out short-term fluctuations and highlight longer-term trends which supports the fundamental for protection of the environment. This approach allows to some extent single data points to exceed the acceptance criteria as long as the average value of the last 5 test results does comply with the acceptance criteria. However, in this case the test frequency becomes more important especially when the average value is close to the acceptance criteria. The frequency becomes a function of the closeness to the limit. The basis for evaluating the compliance test results using moving average is obtained from the basic characterisation testing and analysis of variations in leaching properties.
The statistical procedure will be described in a CEN-report (WI 00351013, see Table 2). Box 3.2 gives an example on how to determine testing frequency. In the procedure each time a new compliance test results is obtained the oldest test results is replaced by the new results and new so called k-value is calculated for each parameter measured. The obtained k value is evaluated against statistically defined parameters to determine testing frequency. If the average of the test results for a specific parameter conforms to the acceptance criteria, then the last sample for that parameter conforms to the criteria.
Test data for product
•Emission scenarios
Release from
construction works
•Transport scenarios
Tolerable concentration
at POC
•Exposure scenarios Risk to human
health and environment
Test data for product
•Emission scenarios
Release from construction
works
Amount emitted into compartment
•Impact assessment
Impact on humans and environment
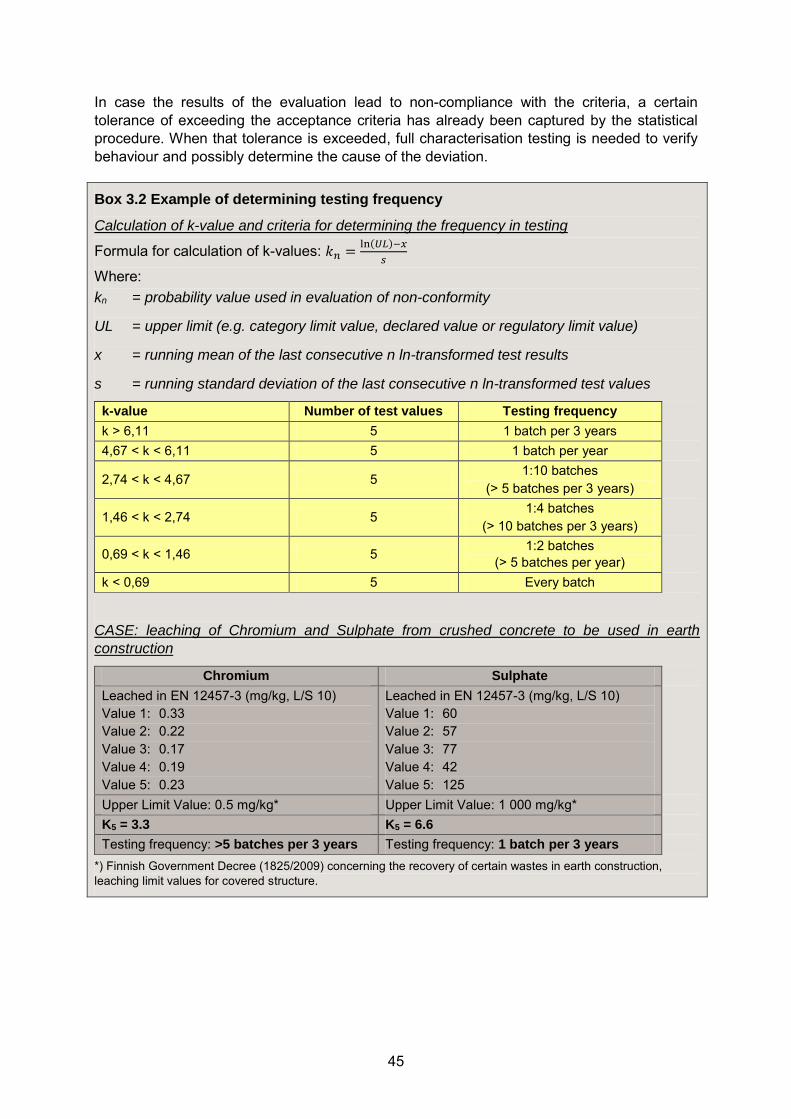
45
In case the results of the evaluation lead to non-compliance with the criteria, a certain tolerance of exceeding the acceptance criteria has already been captured by the statistical procedure. When that tolerance is exceeded, full characterisation testing is needed to verify behaviour and possibly determine the cause of the deviation.
Box 3.2 Example of determining testing frequency
Calculation of k-value and criteria for determining the frequency in testing
Formula for calculation of k-values: 𝑘𝑛 =ln(𝑈𝐿)−𝑥
𝑠
Where: kn = probability value used in evaluation of non-conformity
UL = upper limit (e.g. category limit value, declared value or regulatory limit value)
x = running mean of the last consecutive n ln-transformed test results
s = running standard deviation of the last consecutive n ln-transformed test values
k-value Number of test values Testing frequency k > 6,11 5 1 batch per 3 years 4,67 < k < 6,11 5 1 batch per year
2,74 < k < 4,67 5 1:10 batches
(> 5 batches per 3 years)
1,46 < k < 2,74 5 1:4 batches
(> 10 batches per 3 years)
0,69 < k < 1,46 5 1:2 batches (> 5 batches per year)
k < 0,69 5 Every batch
CASE: leaching of Chromium and Sulphate from crushed concrete to be used in earth
construction
Chromium Sulphate
Leached in EN 12457-3 (mg/kg, L/S 10) Value 1: 0.33 Value 2: 0.22 Value 3: 0.17 Value 4: 0.19 Value 5: 0.23
Leached in EN 12457-3 (mg/kg, L/S 10) Value 1: 60 Value 2: 57 Value 3: 77 Value 4: 42 Value 5: 125
Upper Limit Value: 0.5 mg/kg* Upper Limit Value: 1 000 mg/kg* K5 = 3.3 K5 = 6.6
Testing frequency: >5 batches per 3 years Testing frequency: 1 batch per 3 years *) Finnish Government Decree (1825/2009) concerning the recovery of certain wastes in earth construction, leaching limit values for covered structure.
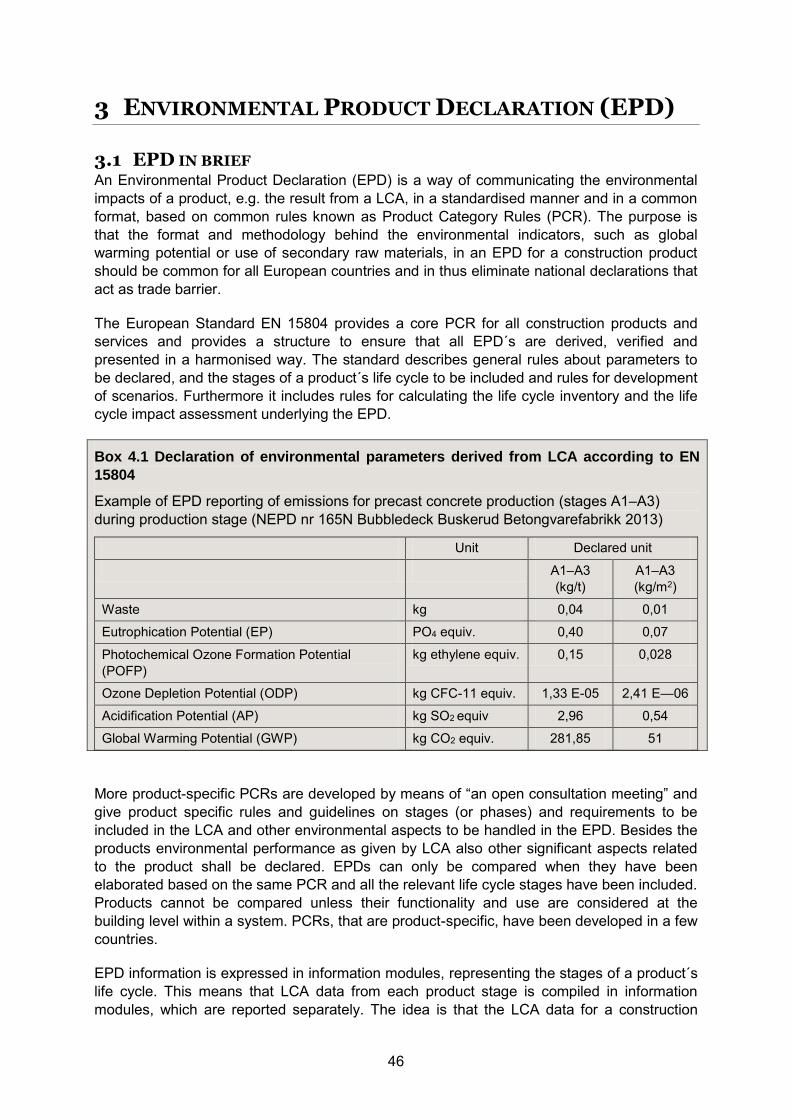
46
3 ENVIRONMENTAL PRODUCT DECLARATION (EPD)
3.1 EPD IN BRIEF An Environmental Product Declaration (EPD) is a way of communicating the environmental impacts of a product, e.g. the result from a LCA, in a standardised manner and in a common format, based on common rules known as Product Category Rules (PCR). The purpose is that the format and methodology behind the environmental indicators, such as global warming potential or use of secondary raw materials, in an EPD for a construction product should be common for all European countries and in thus eliminate national declarations that act as trade barrier.
The European Standard EN 15804 provides a core PCR for all construction products and services and provides a structure to ensure that all EPD´s are derived, verified and presented in a harmonised way. The standard describes general rules about parameters to be declared, and the stages of a product´s life cycle to be included and rules for development of scenarios. Furthermore it includes rules for calculating the life cycle inventory and the life cycle impact assessment underlying the EPD.
Box 4.1 Declaration of environmental parameters derived from LCA according to EN
15804
Example of EPD reporting of emissions for precast concrete production (stages A1–A3) during production stage (NEPD nr 165N Bubbledeck Buskerud Betongvarefabrikk 2013)
Unit Declared unit
A1–A3 (kg/t)
A1–A3 (kg/m2)
Waste kg 0,04 0,01
Eutrophication Potential (EP) PO4 equiv. 0,40 0,07
Photochemical Ozone Formation Potential (POFP)
kg ethylene equiv. 0,15 0,028
Ozone Depletion Potential (ODP) kg CFC-11 equiv. 1,33 E-05 2,41 E—06
Acidification Potential (AP) kg SO2 equiv 2,96 0,54
Global Warming Potential (GWP) kg CO2 equiv. 281,85 51
More product-specific PCRs are developed by means of “an open consultation meeting” and give product specific rules and guidelines on stages (or phases) and requirements to be included in the LCA and other environmental aspects to be handled in the EPD. Besides the products environmental performance as given by LCA also other significant aspects related to the product shall be declared. EPDs can only be compared when they have been elaborated based on the same PCR and all the relevant life cycle stages have been included. Products cannot be compared unless their functionality and use are considered at the building level within a system. PCRs, that are product-specific, have been developed in a few countries.
EPD information is expressed in information modules, representing the stages of a product´s life cycle. This means that LCA data from each product stage is compiled in information modules, which are reported separately. The idea is that the LCA data for a construction
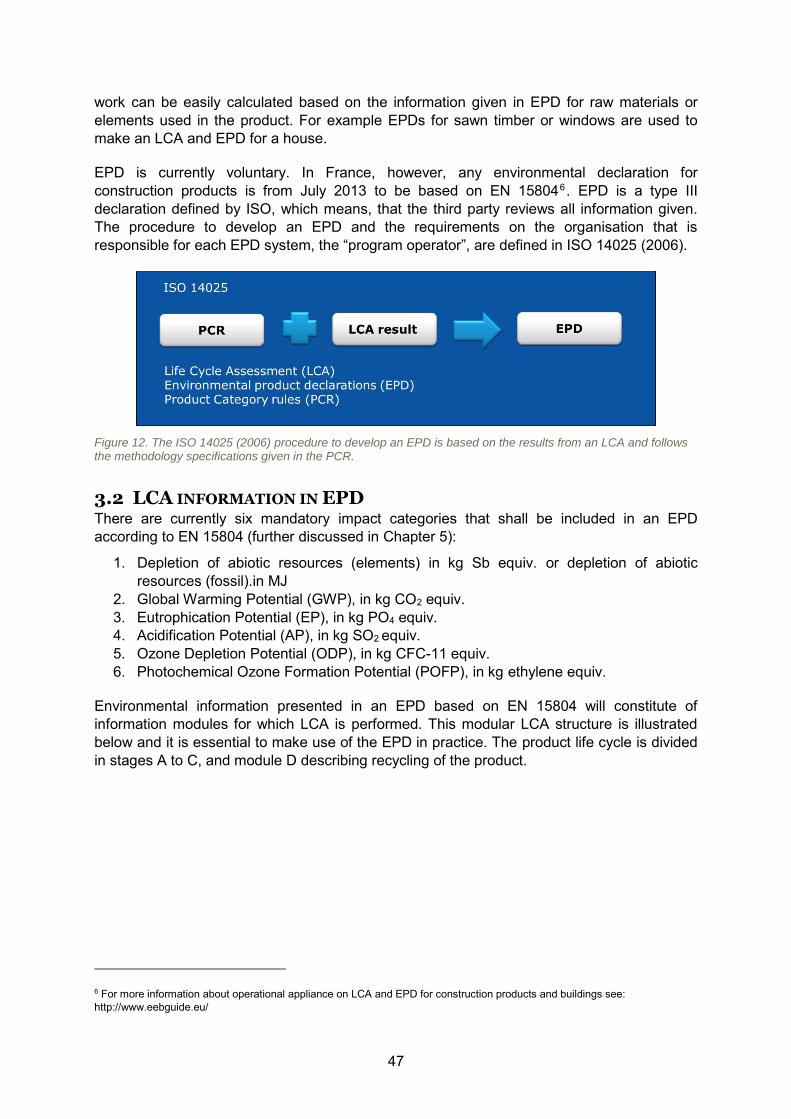
47
work can be easily calculated based on the information given in EPD for raw materials or elements used in the product. For example EPDs for sawn timber or windows are used to make an LCA and EPD for a house.
EPD is currently voluntary. In France, however, any environmental declaration for construction products is from July 2013 to be based on EN 158046 . EPD is a type III declaration defined by ISO, which means, that the third party reviews all information given. The procedure to develop an EPD and the requirements on the organisation that is responsible for each EPD system, the “program operator”, are defined in ISO 14025 (2006).
Figure 12. The ISO 14025 (2006) procedure to develop an EPD is based on the results from an LCA and follows the methodology specifications given in the PCR.
3.2 LCA INFORMATION IN EPD There are currently six mandatory impact categories that shall be included in an EPD according to EN 15804 (further discussed in Chapter 5):
1. Depletion of abiotic resources (elements) in kg Sb equiv. or depletion of abiotic resources (fossil).in MJ
2. Global Warming Potential (GWP), in kg CO2 equiv. 3. Eutrophication Potential (EP), in kg PO4 equiv. 4. Acidification Potential (AP), in kg SO2 equiv. 5. Ozone Depletion Potential (ODP), in kg CFC-11 equiv. 6. Photochemical Ozone Formation Potential (POFP), in kg ethylene equiv.
Environmental information presented in an EPD based on EN 15804 will constitute of information modules for which LCA is performed. This modular LCA structure is illustrated below and it is essential to make use of the EPD in practice. The product life cycle is divided in stages A to C, and module D describing recycling of the product.
6 For more information about operational appliance on LCA and EPD for construction products and buildings see: http://www.eebguide.eu/
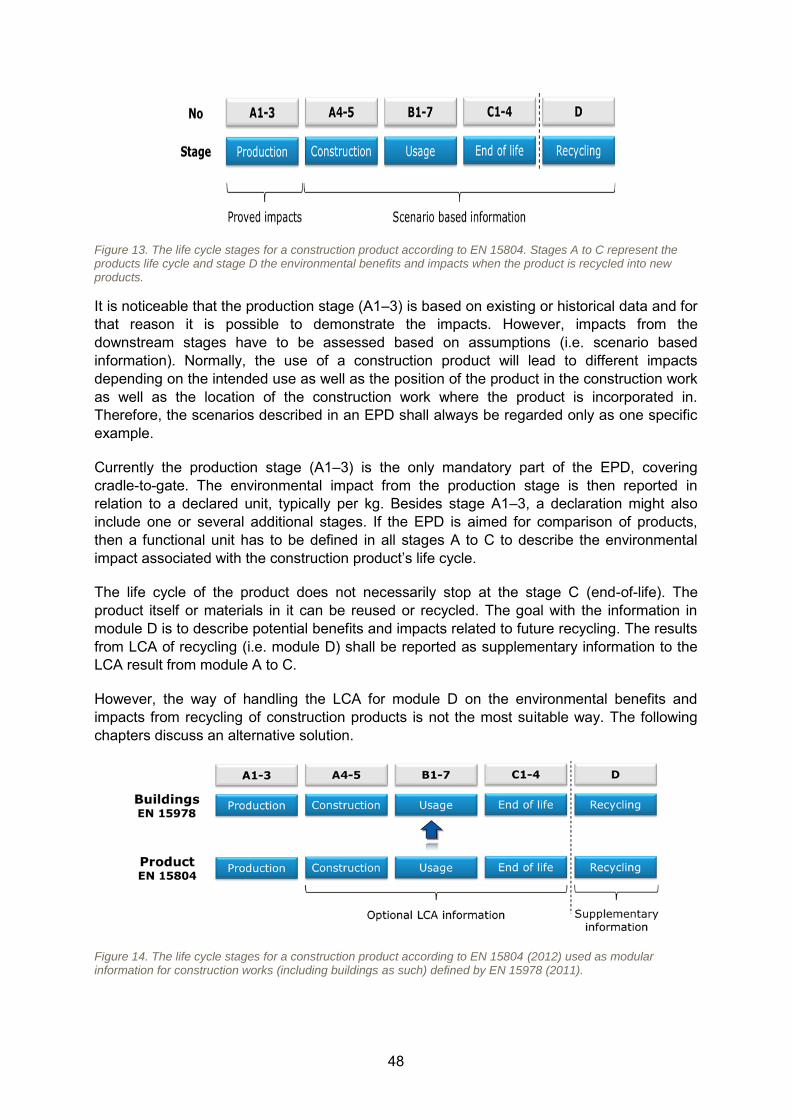
48
Figure 13. The life cycle stages for a construction product according to EN 15804. Stages A to C represent the products life cycle and stage D the environmental benefits and impacts when the product is recycled into new products.
It is noticeable that the production stage (A1–3) is based on existing or historical data and for that reason it is possible to demonstrate the impacts. However, impacts from the downstream stages have to be assessed based on assumptions (i.e. scenario based information). Normally, the use of a construction product will lead to different impacts depending on the intended use as well as the position of the product in the construction work as well as the location of the construction work where the product is incorporated in. Therefore, the scenarios described in an EPD shall always be regarded only as one specific example.
Currently the production stage (A1–3) is the only mandatory part of the EPD, covering cradle-to-gate. The environmental impact from the production stage is then reported in relation to a declared unit, typically per kg. Besides stage A1–3, a declaration might also include one or several additional stages. If the EPD is aimed for comparison of products, then a functional unit has to be defined in all stages A to C to describe the environmental impact associated with the construction product’s life cycle.
The life cycle of the product does not necessarily stop at the stage C (end-of-life). The product itself or materials in it can be reused or recycled. The goal with the information in module D is to describe potential benefits and impacts related to future recycling. The results from LCA of recycling (i.e. module D) shall be reported as supplementary information to the LCA result from module A to C.
However, the way of handling the LCA for module D on the environmental benefits and impacts from recycling of construction products is not the most suitable way. The following chapters discuss an alternative solution.
Figure 14. The life cycle stages for a construction product according to EN 15804 (2012) used as modular information for construction works (including buildings as such) defined by EN 15978 (2011).
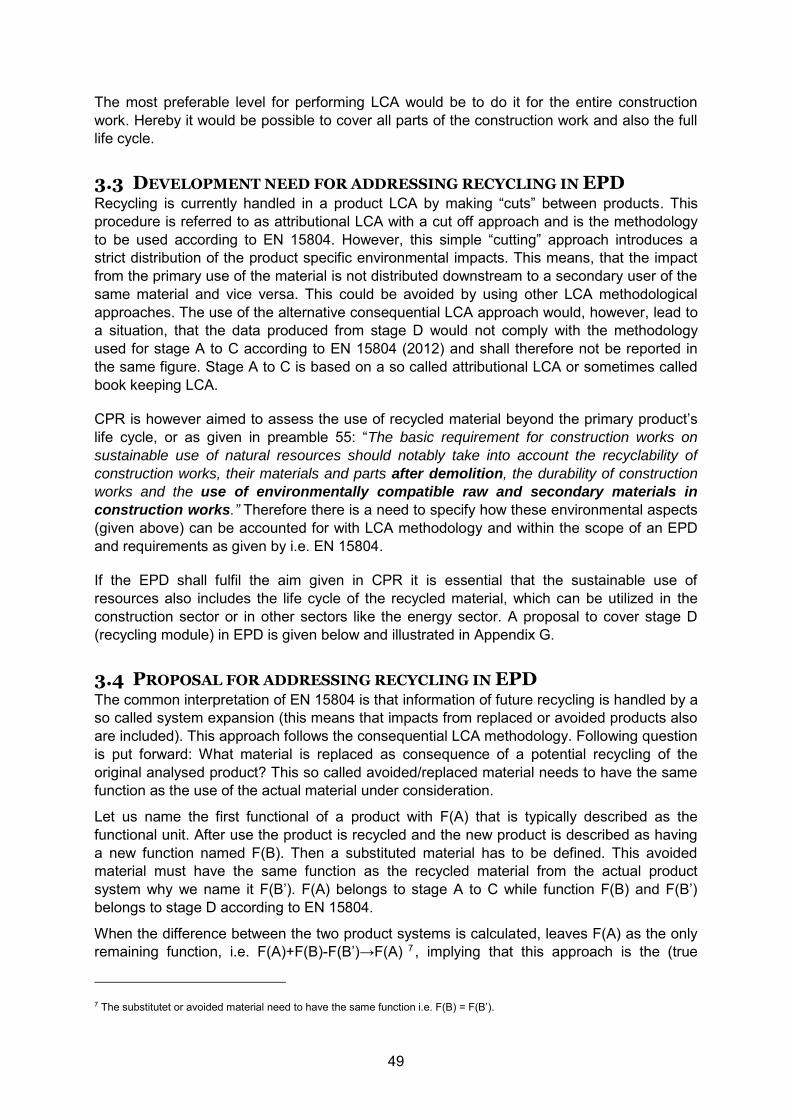
49
The most preferable level for performing LCA would be to do it for the entire construction work. Hereby it would be possible to cover all parts of the construction work and also the full life cycle.
3.3 DEVELOPMENT NEED FOR ADDRESSING RECYCLING IN EPD Recycling is currently handled in a product LCA by making “cuts” between products. This procedure is referred to as attributional LCA with a cut off approach and is the methodology to be used according to EN 15804. However, this simple “cutting” approach introduces a strict distribution of the product specific environmental impacts. This means, that the impact from the primary use of the material is not distributed downstream to a secondary user of the same material and vice versa. This could be avoided by using other LCA methodological approaches. The use of the alternative consequential LCA approach would, however, lead to a situation, that the data produced from stage D would not comply with the methodology used for stage A to C according to EN 15804 (2012) and shall therefore not be reported in the same figure. Stage A to C is based on a so called attributional LCA or sometimes called book keeping LCA.
CPR is however aimed to assess the use of recycled material beyond the primary product’s life cycle, or as given in preamble 55: “The basic requirement for construction works on
sustainable use of natural resources should notably take into account the recyclability of
construction works, their materials and parts after demolition, the durability of construction
works and the use of environmentally compatible raw and secondary materials in
construction works.” Therefore there is a need to specify how these environmental aspects (given above) can be accounted for with LCA methodology and within the scope of an EPD and requirements as given by i.e. EN 15804.
If the EPD shall fulfil the aim given in CPR it is essential that the sustainable use of resources also includes the life cycle of the recycled material, which can be utilized in the construction sector or in other sectors like the energy sector. A proposal to cover stage D (recycling module) in EPD is given below and illustrated in Appendix G.
3.4 PROPOSAL FOR ADDRESSING RECYCLING IN EPD The common interpretation of EN 15804 is that information of future recycling is handled by a so called system expansion (this means that impacts from replaced or avoided products also are included). This approach follows the consequential LCA methodology. Following question is put forward: What material is replaced as consequence of a potential recycling of the original analysed product? This so called avoided/replaced material needs to have the same function as the use of the actual material under consideration.
Let us name the first functional of a product with F(A) that is typically described as the functional unit. After use the product is recycled and the new product is described as having a new function named F(B). Then a substituted material has to be defined. This avoided material must have the same function as the recycled material from the actual product system why we name it F(B’). F(A) belongs to stage A to C while function F(B) and F(B’) belongs to stage D according to EN 15804.
When the difference between the two product systems is calculated, leaves F(A) as the only remaining function, i.e. F(A)+F(B)-F(B’)→F(A) 7 , implying that this approach is the (true
7 The substitutet or avoided material need to have the same function i.e. F(B) = F(B’).
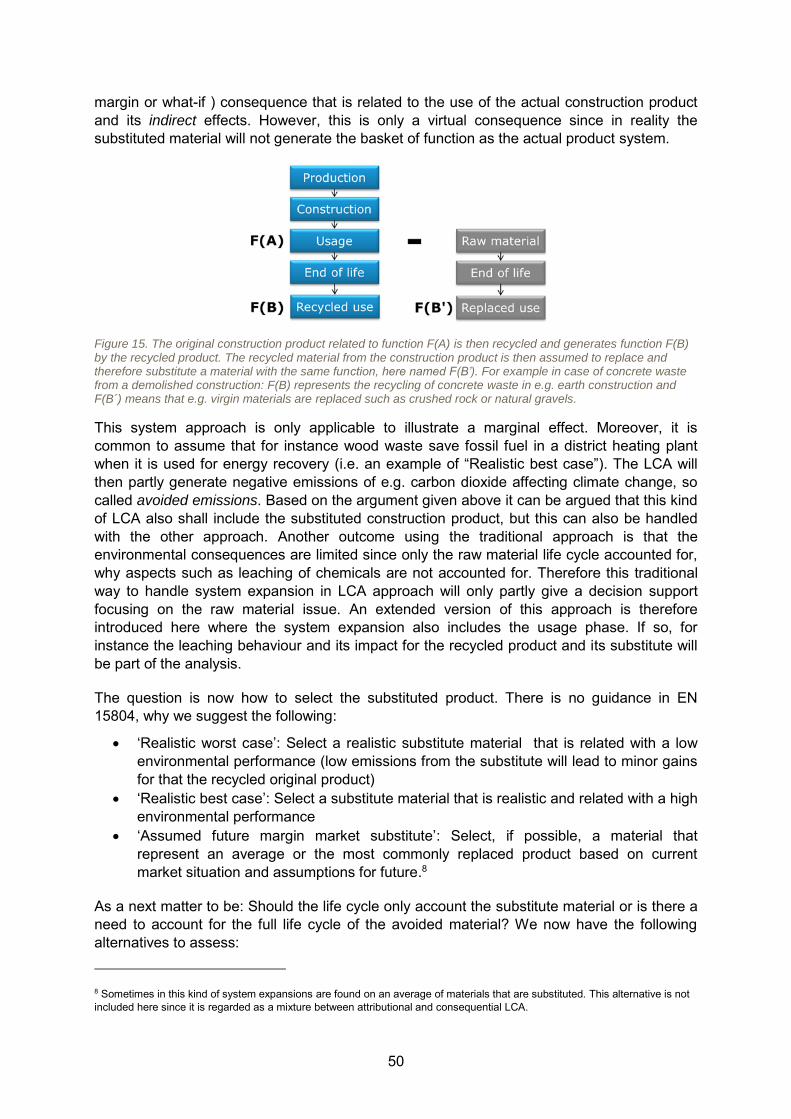
50
margin or what-if ) consequence that is related to the use of the actual construction product and its indirect effects. However, this is only a virtual consequence since in reality the substituted material will not generate the basket of function as the actual product system.
Figure 15. The original construction product related to function F(A) is then recycled and generates function F(B) by the recycled product. The recycled material from the construction product is then assumed to replace and therefore substitute a material with the same function, here named F(B’). For example in case of concrete waste from a demolished construction: F(B) represents the recycling of concrete waste in e.g. earth construction and F(B´) means that e.g. virgin materials are replaced such as crushed rock or natural gravels.
This system approach is only applicable to illustrate a marginal effect. Moreover, it is common to assume that for instance wood waste save fossil fuel in a district heating plant when it is used for energy recovery (i.e. an example of “Realistic best case”). The LCA will then partly generate negative emissions of e.g. carbon dioxide affecting climate change, so called avoided emissions. Based on the argument given above it can be argued that this kind of LCA also shall include the substituted construction product, but this can also be handled with the other approach. Another outcome using the traditional approach is that the environmental consequences are limited since only the raw material life cycle accounted for, why aspects such as leaching of chemicals are not accounted for. Therefore this traditional way to handle system expansion in LCA approach will only partly give a decision support focusing on the raw material issue. An extended version of this approach is therefore introduced here where the system expansion also includes the usage phase. If so, for instance the leaching behaviour and its impact for the recycled product and its substitute will be part of the analysis.
The question is now how to select the substituted product. There is no guidance in EN 15804, why we suggest the following:
‘Realistic worst case’: Select a realistic substitute material that is related with a low environmental performance (low emissions from the substitute will lead to minor gains for that the recycled original product)
‘Realistic best case’: Select a substitute material that is realistic and related with a high environmental performance
‘Assumed future margin market substitute’: Select, if possible, a material that represent an average or the most commonly replaced product based on current market situation and assumptions for future.8
As a next matter to be: Should the life cycle only account the substitute material or is there a need to account for the full life cycle of the avoided material? We now have the following alternatives to assess:
8 Sometimes in this kind of system expansions are found on an average of materials that are substituted. This alternative is not included here since it is regarded as a mixture between attributional and consequential LCA.
51
1. The material perspective accounts for; t the recycled material and its potential to replace virgin raw material or other materials. This system expansion only includes the manufacturing of the substituted (or replaced) material. The system expansion includes the production stage and - suggested here - the usage as an addition to e.g. include the future leaching9.
2. The product responsible perspective accounts for; the recycled material and its potential to replaced material including a full lifecycle that also include the usage. This addition makes it possible to e.g. account for e.g. future leaching depended on one or different intended use.
When a full product lifecycle is accounted for in Module D, it will be possible to evaluate different competing products made of primary and secondary materials as well as different environmental scenarios taking a ‘full life cycle’ into account as outlined in CPR as a goal. This will be true if the same modular structure is kept, where all data are given for each individual module. An example of the two approaches is presented further in chapter 5.2.
The problem with this approach is that a full LC scenario for the primary and secondary material has to be defined that requires more information compared to the ‘Material perspective’ that only account for the environmental impact for manufacturing of the substituted material. For EPDs given for more basic building material, a number of generic application scenarios have to be defined. This would then make it possible to actually give this supplementary information on e.g. leaching of chemicals also for such products. However, this would require a common set of generic application scenarios. Since these kinds of generic application scenarios already exist in countries like Germany, Belgium, Holland and Denmark, these systems can be used as starting point for such work.
9 This concept is also known as avoided emission typically used for waste LCA. An alternative is a system expansion that will make the different complex product systems equal.
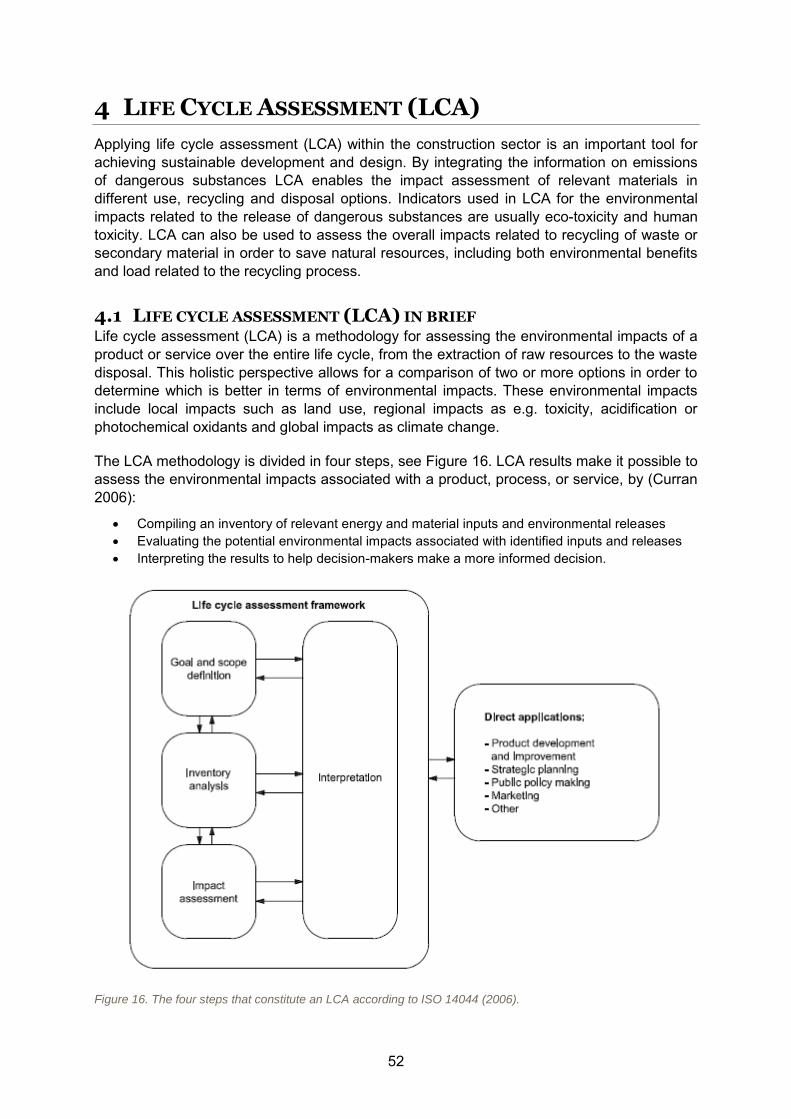
52
4 LIFE CYCLE ASSESSMENT (LCA)
Applying life cycle assessment (LCA) within the construction sector is an important tool for achieving sustainable development and design. By integrating the information on emissions of dangerous substances LCA enables the impact assessment of relevant materials in different use, recycling and disposal options. Indicators used in LCA for the environmental impacts related to the release of dangerous substances are usually eco-toxicity and human toxicity. LCA can also be used to assess the overall impacts related to recycling of waste or secondary material in order to save natural resources, including both environmental benefits and load related to the recycling process.
4.1 LIFE CYCLE ASSESSMENT (LCA) IN BRIEF Life cycle assessment (LCA) is a methodology for assessing the environmental impacts of a product or service over the entire life cycle, from the extraction of raw resources to the waste disposal. This holistic perspective allows for a comparison of two or more options in order to determine which is better in terms of environmental impacts. These environmental impacts include local impacts such as land use, regional impacts as e.g. toxicity, acidification or photochemical oxidants and global impacts as climate change.
The LCA methodology is divided in four steps, see Figure 16. LCA results make it possible to assess the environmental impacts associated with a product, process, or service, by (Curran 2006):
Compiling an inventory of relevant energy and material inputs and environmental releases Evaluating the potential environmental impacts associated with identified inputs and releases Interpreting the results to help decision-makers make a more informed decision.
Figure 16. The four steps that constitute an LCA according to ISO 14044 (2006).
53
An ideal LCA shall account for substances that leach or evaporate from products during the use phase. In practice this possibility is limited due to lack of data. Test methods are defined (by CEN TC 351) that make it possible to describe essential properties in order to estimate the emission from building products. The life cycle inventory (LCI) step of LCA consists of listing all emissions to air, water and soil arising from resource extraction, manufacturing processes, assembly processes etc. as well as all emissions from the use phase and end-of-life stage until the product is treated as waste or recycled. This inventory also includes emission from e.g. use of the product and landfill.
In LCA the total release emitted to the environmental compartments is the input data for the life cycle inventory. This implies that the result from the source model, i.e. the release (in e.g. mg/l), needs to be integrated over time in order to achieve the total emitted amount (in g) to a certain recipient (calculation of “the total environmental burden”) for a defined period of time. This kind of emission data is required for the life cycle inventory step in an LCA in order to account for e.g. leaching.
The environmental consequences related to the emissions in an LCA are then evaluated in the so called life cycle impact assessment (LCIA) step. In order to assess toxicity aspects in LCA, LCIA models include the transport of the emitted substances to different receiving compartments. The LCIA models utilized here are CML, UseTox and USES-LCA and are explained below. More information can be found in Appendix E. Eco-toxicity and human toxicity are, however, not included as environmental indicators in the European standards for Sustainability of construction work (CEN/TC 350).
When a product is recycled (including utilization for energy recovery), it is important to define in LCA when the initial product´s life cycle ends, and the new one’s starts, in order to distribute (allocate) the environmental burden. From the point when the recycled material meets its lowest economic value, the first product life cycle stops and the forthcoming life cycle based on the recycled material starts. The environmental burden in this so called open loop recycling is typically, in product LCA, handled with such simple cut-off rule as described above. Therefore, in typical product LCA the environmental burden including leaching from recycled material is not allocated to the first product-system responsible for setting this material on the market. However, in LCA methodology, different approaches exist concerning how to handle open loop recycling. In this report a methodology is suggested for how recycling of construction could be handled in an Environmental Product Declaration, see Chapter 4.3.
4.1.1 LCA standards for construction works
LCA is the core of the environmental sustainability according to the European standards for Sustainability of construction works under CEN/TC 350. The most important standards for LCA with relevance for construction works are:
EN 15643-2:2011 Sustainability of construction works. Assessment of buildings. Framework for the assessment of environmental performance which gives the overall framework of how to evaluate the environmental performance. Among others, the standard explains which stages of the building life cycle should be included, which environmental indicators are to be used to describe the environmental performance of buildings over their life cycle and which indicators are not yet included in the European standard10.
10 Eco-toxicity, human toxicity, depletion of resources, biodiversity, land use are among those
54
EN 15978:2011 Sustainability of construction works. Assessment of environmental performance of buildings. Calculation method which explains in details what should be included in LCA of buildings.
EN 15804:2012 Sustainability of construction works. Environmental product declarations. Core rules for the product category of construction products which gives the overall framework for EPDs for construction products.
In addition to the European standards, LCA of buildings and building materials is an important part of the voluntary certification schemes developed for the European building sector. However, for some environmental indicators (see footnote 7 according to the standard), according to the standard, there is no scientifically agreed calculation method yet and those indicators are therefore not included in the European standards, e.g. EN 15643-2. The release of dangerous substances is particularly important in the evaluation of reuse and recycling of different high volume C&D waste fractions. It is therefore very important to work further on the development of the methodology for eco-toxicity and human toxicity in LCA and to reach agreement that can lead to inclusion of those impact categories.
4.1.2 LCA tools and databases
A number of commercial LCA tools are available, both general and specific LCA tools. The general LCA tools can be used to perform LCA on all kind of products and services. There is a number of specific building and civil engineering LCA tools developed, where several have national focus or specifications. Likewise, a number of waste management LCA tools are developed, that can be used to evaluate handling of waste, including construction waste and reuse or recycling of construction waste in civil engineering works, also often including national focus or specifications. Modelling technology is constantly improving and results in more flexibility of the tools recently developed. This means that specific LCA tools that previously were only valid for use in specific countries (typically the country where developed) can now be used to perform LCA in different countries.
It is not common practise that the leaching emissions related to BWR 3 are included in the building specific LCA tools (or the data used in those tools). Leaching of copper from a copper façade is one example of emissions that relate to BWR 3. However, an example of the inclusion of the emissions of copper to the surroundings in building specific LCA tools is not known. It could probably be included in some building specific models, and it can certainly be included when LCA of buildings are performed in general LCA tools. Waste management tools can usually also handle the BWR 3 related emissions, for example EASEWASTE (Kirkeby et al. 2006), when evaluating recycling of residues in roads compared to landfilling the residues.
Several tools for performing LCA in civil engineering works have been developed with focus on using residues and/or secondary materials, example ROAD-RES (Birgisdottir 2005) and MELI (Mroueh et al 2001). Here the leaching of substances (BWR 3) from residues/secondary materials is evaluated and associated environmental impacts are assessed.
Besides the LCA tools a number of databases are available, both general and specific. The general databases include a wide range of data that is necessary to perform an LCA. Data used in LCA can be either generic data or product specific data. Data for production of average European steel provided by the European steel industry is an example of generic data, while data from one specific steel producer is an example of product specific data. The product specific data can moreover be given as Environmental Product Declaration, which
55
means that the data follows the standards for performing an EPD and the data is third party reviewed.
Several national databases for construction materials have been developed recently including both generic and product specific data for building materials. These databases can have different focus and methods for how to present the results. In Sweden IVL provide the market with an LCA database for about 500 construction products called ‘IVL Environmental Database Construction’. This LCA database is used by the two largest construction companies to calculate LCA based on cost calculations (Heikkilä and Erlandsson 2011). In Norway the national database (www.klimagassregnskap.no) includes only construction material data with relevance for climate change. In England environmental profiles of building materials in relation to the use of LCA in the certification method BREEAM are gathered in www.greenbooklive.com that may be used if not specific LCA calculations following EN 15804 are used. Here the building materials are assessed for the whole life cycle of the product for 60 years (cradle to grave) and the results are given for 13 impact categories. In Germany a national database (Ökobau.dat) of construction materials in relation to the use of LCA in the certification systems BNB and DGNB has been developed. Data are given for the production of materials and end of life treatment of materials. Together with the national list of service life of building materials, the environmental impacts for the use of the materials in a building can be evaluated for the total life cycle of the building, which is defined as 50 years. The results in the Ökobau.dat are given as 2 resource categories and 5 environmental impacts. From the three examples given above, it is clear that results cannot be directly compared from one national database with another.
4.1.3 Calculation of environmental impacts in LCA
To assess the environmental impacts of a product over its entire life cycle, the LCA includes an inventory step where all substances entering or leaving processes in the product life cycle (known as flows) are collected. In many cases, these inventories may contain from several hundred to thousands of different flows. Both because of the number of flows and because of the difficulties in assessing the importance of these flows for laymen, this information may be difficult to use directly in a decision making context. Therefore, the LCA also includes a life cycle impact assessment (LCIA) step, where flows are ‘translated’ into the environmental impacts that they cause.
Depending on LCIA method, the number of impact categories typically vary around 10–15, including local impacts such as land use, regional impacts as e.g. toxic substances, acidification or photochemical oxidants and global impacts as climate change. The LCIA step thus significantly reduces the complexity of the inventoried flows. The ‘translation’ is performed through giving each flow a characterization factor (CF) for the environmental impacts that the flow contributes to. The CF indicates the potency of the flow compared to a reference substance. For example, in relation to global warming, CO2 is the reference substance, which is given the CF of 1, and methane, which is equally a greenhouse gas, but much more potent is given a CF of 25 (g CO2 equivalents/g methane). Having assigned the relevant CFs the environmental impacts in each of the impact categories can then be calculated:
𝐼𝑆 = ∑ ∑ 𝐶𝐹𝑥,𝑖 × 𝑀𝑥,𝑖
𝑥𝑖
where IS is the impact score for each impact category; CFx,i the CF of substance x released to compartment i and Mx,i the emission of x to compartment i.
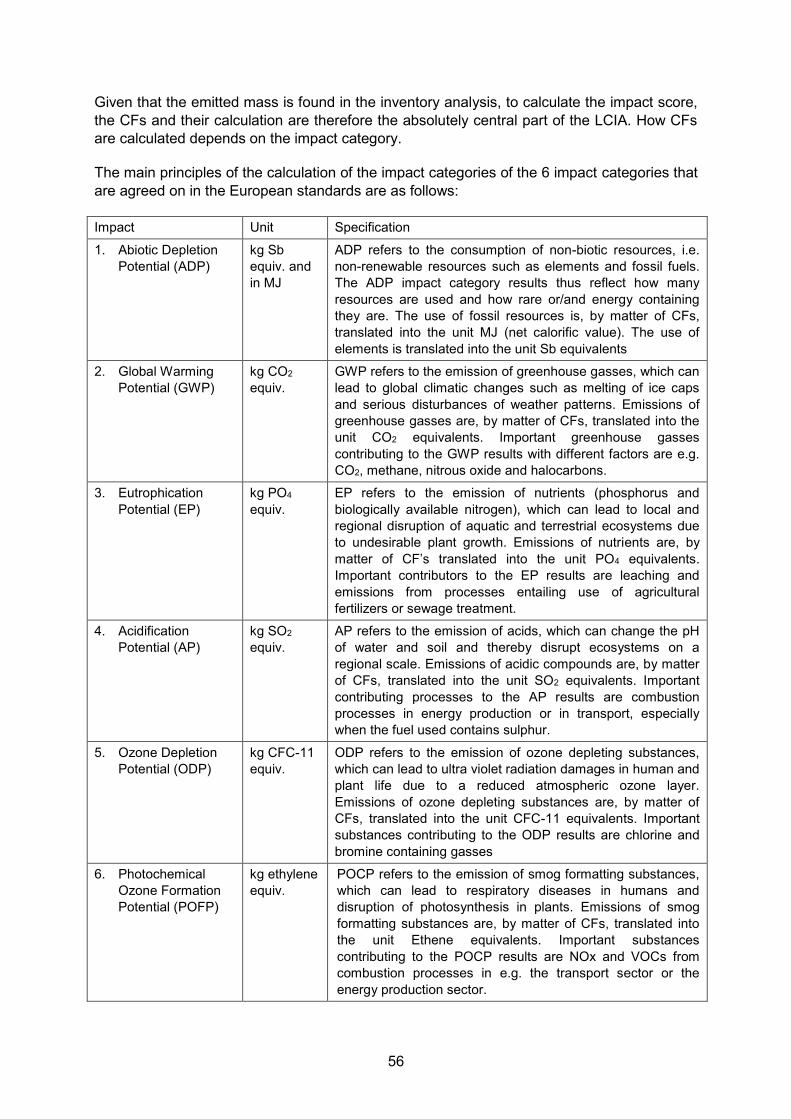
56
Given that the emitted mass is found in the inventory analysis, to calculate the impact score, the CFs and their calculation are therefore the absolutely central part of the LCIA. How CFs are calculated depends on the impact category.
The main principles of the calculation of the impact categories of the 6 impact categories that are agreed on in the European standards are as follows:
Impact Unit Specification
1. Abiotic Depletion Potential (ADP)
kg Sb equiv. and in MJ
ADP refers to the consumption of non-biotic resources, i.e. non-renewable resources such as elements and fossil fuels. The ADP impact category results thus reflect how many resources are used and how rare or/and energy containing they are. The use of fossil resources is, by matter of CFs, translated into the unit MJ (net calorific value). The use of elements is translated into the unit Sb equivalents
2. Global Warming Potential (GWP)
kg CO2 equiv.
GWP refers to the emission of greenhouse gasses, which can lead to global climatic changes such as melting of ice caps and serious disturbances of weather patterns. Emissions of greenhouse gasses are, by matter of CFs, translated into the unit CO2 equivalents. Important greenhouse gasses contributing to the GWP results with different factors are e.g. CO2, methane, nitrous oxide and halocarbons.
3. Eutrophication Potential (EP)
kg PO4 equiv.
EP refers to the emission of nutrients (phosphorus and biologically available nitrogen), which can lead to local and regional disruption of aquatic and terrestrial ecosystems due to undesirable plant growth. Emissions of nutrients are, by matter of CF’s translated into the unit PO4 equivalents. Important contributors to the EP results are leaching and emissions from processes entailing use of agricultural fertilizers or sewage treatment.
4. Acidification Potential (AP)
kg SO2
equiv. AP refers to the emission of acids, which can change the pH of water and soil and thereby disrupt ecosystems on a regional scale. Emissions of acidic compounds are, by matter of CFs, translated into the unit SO2 equivalents. Important contributing processes to the AP results are combustion processes in energy production or in transport, especially when the fuel used contains sulphur.
5. Ozone Depletion Potential (ODP)
kg CFC-11 equiv.
ODP refers to the emission of ozone depleting substances, which can lead to ultra violet radiation damages in human and plant life due to a reduced atmospheric ozone layer. Emissions of ozone depleting substances are, by matter of CFs, translated into the unit CFC-11 equivalents. Important substances contributing to the ODP results are chlorine and bromine containing gasses
6. Photochemical Ozone Formation Potential (POFP)
kg ethylene equiv.
POCP refers to the emission of smog formatting substances, which can lead to respiratory diseases in humans and disruption of photosynthesis in plants. Emissions of smog formatting substances are, by matter of CFs, translated into the unit Ethene equivalents. Important substances contributing to the POCP results are NOx and VOCs from combustion processes in e.g. the transport sector or the energy production sector.
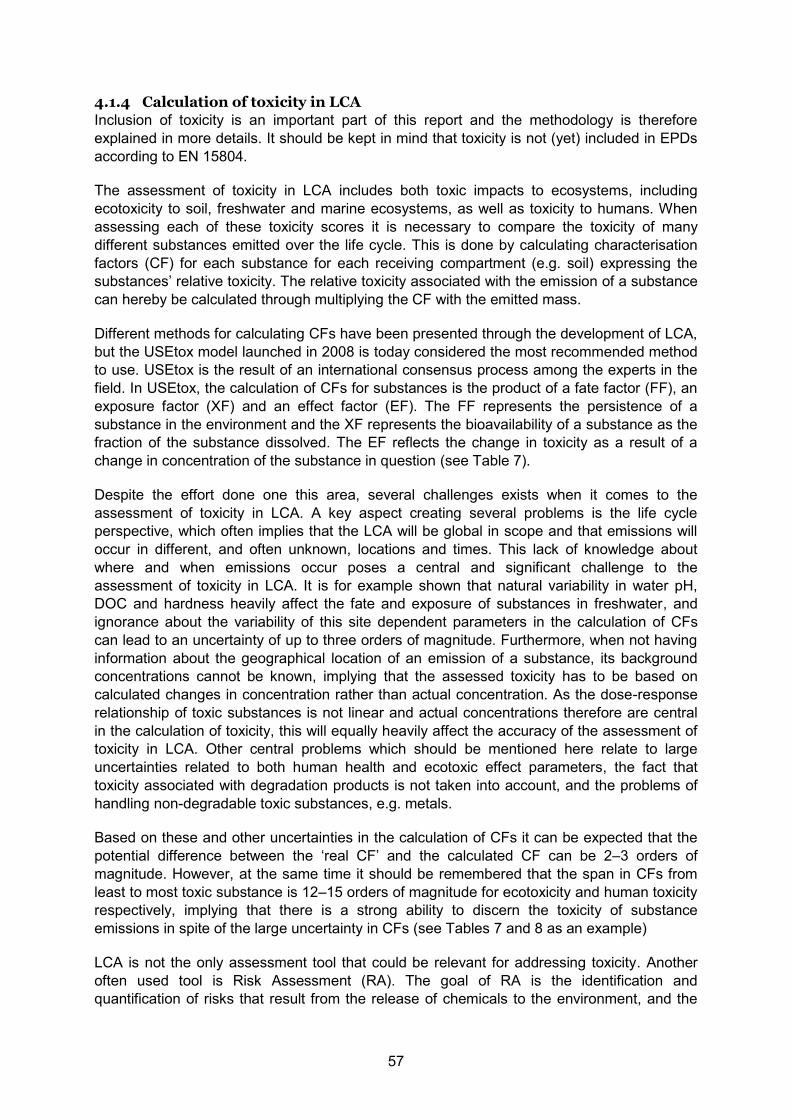
57
4.1.4 Calculation of toxicity in LCA
Inclusion of toxicity is an important part of this report and the methodology is therefore explained in more details. It should be kept in mind that toxicity is not (yet) included in EPDs according to EN 15804.
The assessment of toxicity in LCA includes both toxic impacts to ecosystems, including ecotoxicity to soil, freshwater and marine ecosystems, as well as toxicity to humans. When assessing each of these toxicity scores it is necessary to compare the toxicity of many different substances emitted over the life cycle. This is done by calculating characterisation factors (CF) for each substance for each receiving compartment (e.g. soil) expressing the substances’ relative toxicity. The relative toxicity associated with the emission of a substance can hereby be calculated through multiplying the CF with the emitted mass.
Different methods for calculating CFs have been presented through the development of LCA, but the USEtox model launched in 2008 is today considered the most recommended method to use. USEtox is the result of an international consensus process among the experts in the field. In USEtox, the calculation of CFs for substances is the product of a fate factor (FF), an exposure factor (XF) and an effect factor (EF). The FF represents the persistence of a substance in the environment and the XF represents the bioavailability of a substance as the fraction of the substance dissolved. The EF reflects the change in toxicity as a result of a change in concentration of the substance in question (see Table 7).
Despite the effort done one this area, several challenges exists when it comes to the assessment of toxicity in LCA. A key aspect creating several problems is the life cycle perspective, which often implies that the LCA will be global in scope and that emissions will occur in different, and often unknown, locations and times. This lack of knowledge about where and when emissions occur poses a central and significant challenge to the assessment of toxicity in LCA. It is for example shown that natural variability in water pH, DOC and hardness heavily affect the fate and exposure of substances in freshwater, and ignorance about the variability of this site dependent parameters in the calculation of CFs can lead to an uncertainty of up to three orders of magnitude. Furthermore, when not having information about the geographical location of an emission of a substance, its background concentrations cannot be known, implying that the assessed toxicity has to be based on calculated changes in concentration rather than actual concentration. As the dose-response relationship of toxic substances is not linear and actual concentrations therefore are central in the calculation of toxicity, this will equally heavily affect the accuracy of the assessment of toxicity in LCA. Other central problems which should be mentioned here relate to large uncertainties related to both human health and ecotoxic effect parameters, the fact that toxicity associated with degradation products is not taken into account, and the problems of handling non-degradable toxic substances, e.g. metals.
Based on these and other uncertainties in the calculation of CFs it can be expected that the potential difference between the ‘real CF’ and the calculated CF can be 2–3 orders of magnitude. However, at the same time it should be remembered that the span in CFs from least to most toxic substance is 12–15 orders of magnitude for ecotoxicity and human toxicity respectively, implying that there is a strong ability to discern the toxicity of substance emissions in spite of the large uncertainty in CFs (see Tables 7 and 8 as an example)
LCA is not the only assessment tool that could be relevant for addressing toxicity. Another often used tool is Risk Assessment (RA). The goal of RA is the identification and quantification of risks that result from the release of chemicals to the environment, and the
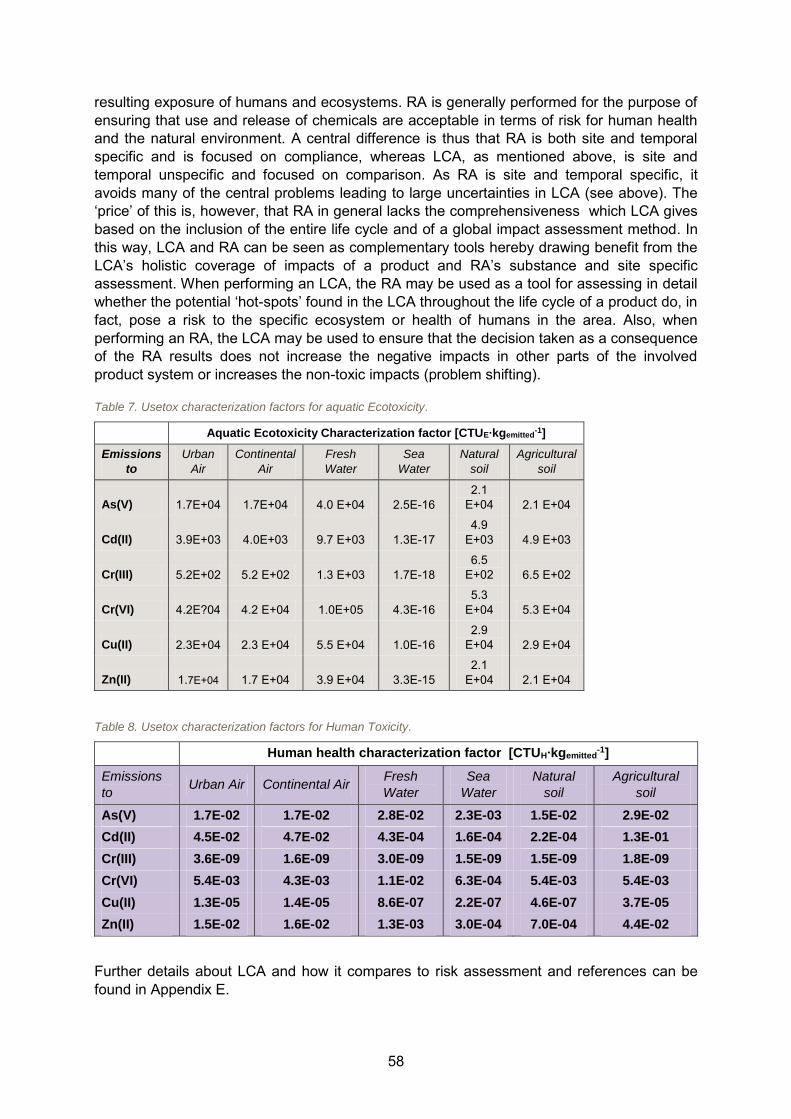
58
resulting exposure of humans and ecosystems. RA is generally performed for the purpose of ensuring that use and release of chemicals are acceptable in terms of risk for human health and the natural environment. A central difference is thus that RA is both site and temporal specific and is focused on compliance, whereas LCA, as mentioned above, is site and temporal unspecific and focused on comparison. As RA is site and temporal specific, it avoids many of the central problems leading to large uncertainties in LCA (see above). The ‘price’ of this is, however, that RA in general lacks the comprehensiveness which LCA gives based on the inclusion of the entire life cycle and of a global impact assessment method. In this way, LCA and RA can be seen as complementary tools hereby drawing benefit from the LCA’s holistic coverage of impacts of a product and RA’s substance and site specific assessment. When performing an LCA, the RA may be used as a tool for assessing in detail whether the potential ‘hot-spots’ found in the LCA throughout the life cycle of a product do, in fact, pose a risk to the specific ecosystem or health of humans in the area. Also, when performing an RA, the LCA may be used to ensure that the decision taken as a consequence of the RA results does not increase the negative impacts in other parts of the involved product system or increases the non-toxic impacts (problem shifting).
Table 7. Usetox characterization factors for aquatic Ecotoxicity.
Aquatic Ecotoxicity Characterization factor [CTUE∙kgemitted-1]
Emissions
to
Urban
Air
Continental
Air
Fresh
Water
Sea
Water
Natural
soil
Agricultural
soil
As(V) 1.7E+04 1.7E+04 4.0 E+04 2.5E-16 2.1
E+04 2.1 E+04
Cd(II) 3.9E+03 4.0E+03 9.7 E+03 1.3E-17 4.9
E+03 4.9 E+03
Cr(III) 5.2E+02 5.2 E+02 1.3 E+03 1.7E-18 6.5
E+02 6.5 E+02
Cr(VI) 4.2E?04 4.2 E+04 1.0E+05 4.3E-16 5.3
E+04 5.3 E+04
Cu(II) 2.3E+04 2.3 E+04 5.5 E+04 1.0E-16 2.9
E+04 2.9 E+04
Zn(II) 1.7E+04 1.7 E+04 3.9 E+04 3.3E-15 2.1
E+04 2.1 E+04
Table 8. Usetox characterization factors for Human Toxicity.
Human health characterization factor [CTUH∙kgemitted-1]
Emissions
to Urban Air Continental Air Fresh
Water Sea
Water Natural
soil Agricultural
soil
As(V) 1.7E-02 1.7E-02 2.8E-02 2.3E-03 1.5E-02 2.9E-02
Cd(II) 4.5E-02 4.7E-02 4.3E-04 1.6E-04 2.2E-04 1.3E-01
Cr(III) 3.6E-09 1.6E-09 3.0E-09 1.5E-09 1.5E-09 1.8E-09
Cr(VI) 5.4E-03 4.3E-03 1.1E-02 6.3E-04 5.4E-03 5.4E-03
Cu(II) 1.3E-05 1.4E-05 8.6E-07 2.2E-07 4.6E-07 3.7E-05
Zn(II) 1.5E-02 1.6E-02 1.3E-03 3.0E-04 7.0E-04 4.4E-02
Further details about LCA and how it compares to risk assessment and references can be found in Appendix E.
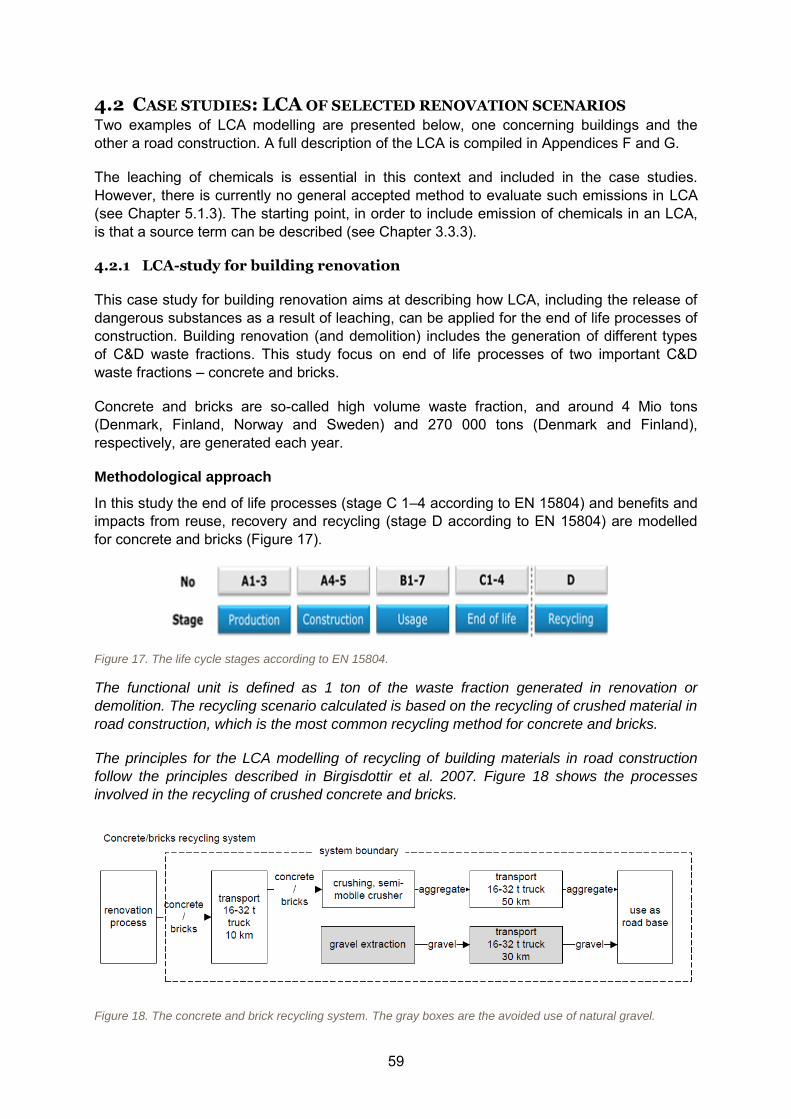
59
4.2 CASE STUDIES: LCA OF SELECTED RENOVATION SCENARIOS Two examples of LCA modelling are presented below, one concerning buildings and the other a road construction. A full description of the LCA is compiled in Appendices F and G.
The leaching of chemicals is essential in this context and included in the case studies. However, there is currently no general accepted method to evaluate such emissions in LCA (see Chapter 5.1.3). The starting point, in order to include emission of chemicals in an LCA, is that a source term can be described (see Chapter 3.3.3).
4.2.1 LCA-study for building renovation
This case study for building renovation aims at describing how LCA, including the release of dangerous substances as a result of leaching, can be applied for the end of life processes of construction. Building renovation (and demolition) includes the generation of different types of C&D waste fractions. This study focus on end of life processes of two important C&D waste fractions – concrete and bricks.
Concrete and bricks are so-called high volume waste fraction, and around 4 Mio tons (Denmark, Finland, Norway and Sweden) and 270 000 tons (Denmark and Finland), respectively, are generated each year.
Methodological approach
In this study the end of life processes (stage C 1–4 according to EN 15804) and benefits and impacts from reuse, recovery and recycling (stage D according to EN 15804) are modelled for concrete and bricks (Figure 17).
Figure 17. The life cycle stages according to EN 15804.
The functional unit is defined as 1 ton of the waste fraction generated in renovation or
demolition. The recycling scenario calculated is based on the recycling of crushed material in
road construction, which is the most common recycling method for concrete and bricks.
The principles for the LCA modelling of recycling of building materials in road construction
follow the principles described in Birgisdottir et al. 2007. Figure 18 shows the processes
involved in the recycling of crushed concrete and bricks.
Figure 18. The concrete and brick recycling system. The gray boxes are the avoided use of natural gravel.
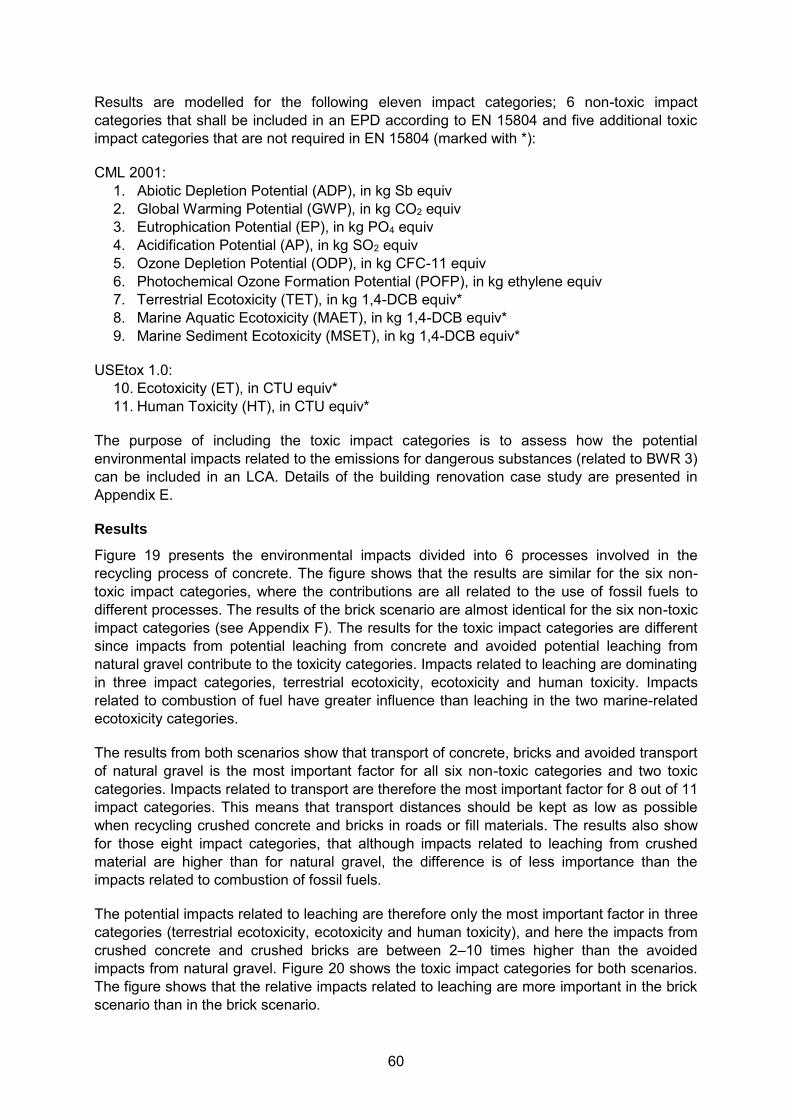
60
Results are modelled for the following eleven impact categories; 6 non-toxic impact categories that shall be included in an EPD according to EN 15804 and five additional toxic impact categories that are not required in EN 15804 (marked with *):
CML 2001: 1. Abiotic Depletion Potential (ADP), in kg Sb equiv 2. Global Warming Potential (GWP), in kg CO2 equiv 3. Eutrophication Potential (EP), in kg PO4 equiv 4. Acidification Potential (AP), in kg SO2 equiv 5. Ozone Depletion Potential (ODP), in kg CFC-11 equiv 6. Photochemical Ozone Formation Potential (POFP), in kg ethylene equiv 7. Terrestrial Ecotoxicity (TET), in kg 1,4-DCB equiv* 8. Marine Aquatic Ecotoxicity (MAET), in kg 1,4-DCB equiv* 9. Marine Sediment Ecotoxicity (MSET), in kg 1,4-DCB equiv*
USEtox 1.0: 10. Ecotoxicity (ET), in CTU equiv* 11. Human Toxicity (HT), in CTU equiv*
The purpose of including the toxic impact categories is to assess how the potential environmental impacts related to the emissions for dangerous substances (related to BWR 3) can be included in an LCA. Details of the building renovation case study are presented in Appendix E.
Results
Figure 19 presents the environmental impacts divided into 6 processes involved in the recycling process of concrete. The figure shows that the results are similar for the six non-toxic impact categories, where the contributions are all related to the use of fossil fuels to different processes. The results of the brick scenario are almost identical for the six non-toxic impact categories (see Appendix F). The results for the toxic impact categories are different since impacts from potential leaching from concrete and avoided potential leaching from natural gravel contribute to the toxicity categories. Impacts related to leaching are dominating in three impact categories, terrestrial ecotoxicity, ecotoxicity and human toxicity. Impacts related to combustion of fuel have greater influence than leaching in the two marine-related ecotoxicity categories.
The results from both scenarios show that transport of concrete, bricks and avoided transport of natural gravel is the most important factor for all six non-toxic categories and two toxic categories. Impacts related to transport are therefore the most important factor for 8 out of 11 impact categories. This means that transport distances should be kept as low as possible when recycling crushed concrete and bricks in roads or fill materials. The results also show for those eight impact categories, that although impacts related to leaching from crushed material are higher than for natural gravel, the difference is of less importance than the impacts related to combustion of fossil fuels.
The potential impacts related to leaching are therefore only the most important factor in three categories (terrestrial ecotoxicity, ecotoxicity and human toxicity), and here the impacts from crushed concrete and crushed bricks are between 2–10 times higher than the avoided impacts from natural gravel. Figure 20 shows the toxic impact categories for both scenarios. The figure shows that the relative impacts related to leaching are more important in the brick scenario than in the brick scenario.
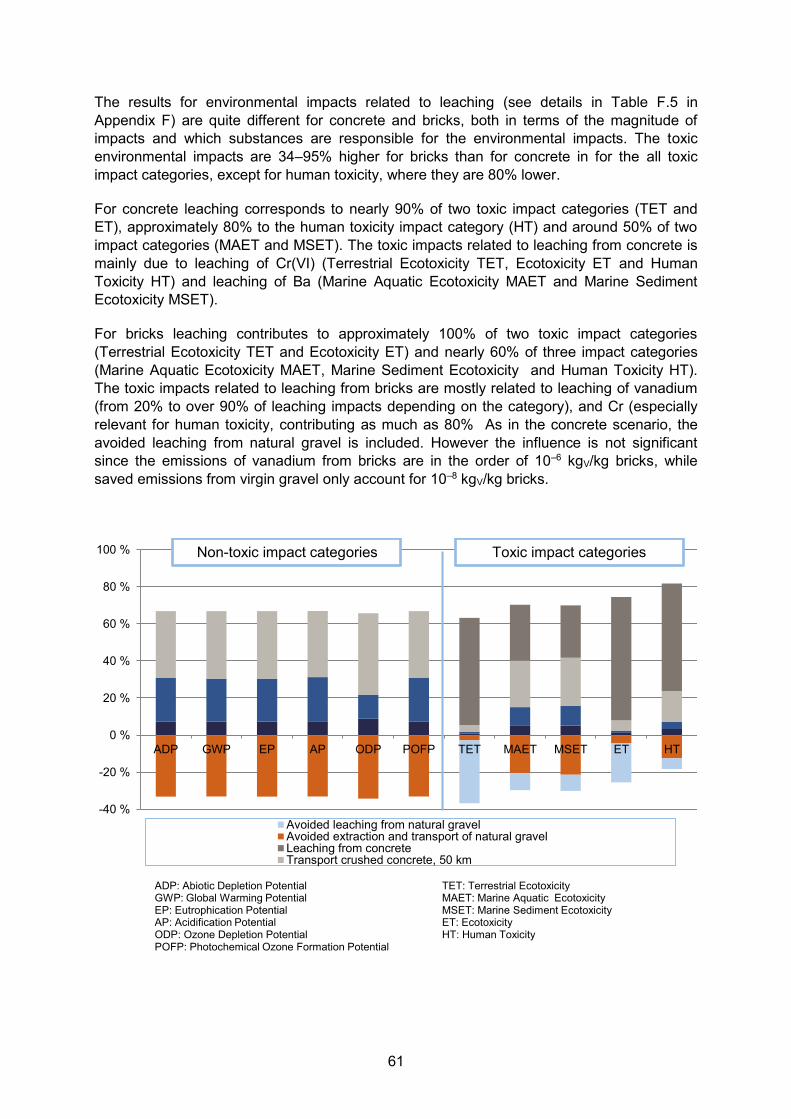
61
The results for environmental impacts related to leaching (see details in Table F.5 in Appendix F) are quite different for concrete and bricks, both in terms of the magnitude of impacts and which substances are responsible for the environmental impacts. The toxic environmental impacts are 34–95% higher for bricks than for concrete in for the all toxic impact categories, except for human toxicity, where they are 80% lower.
For concrete leaching corresponds to nearly 90% of two toxic impact categories (TET and ET), approximately 80% to the human toxicity impact category (HT) and around 50% of two impact categories (MAET and MSET). The toxic impacts related to leaching from concrete is mainly due to leaching of Cr(VI) (Terrestrial Ecotoxicity TET, Ecotoxicity ET and Human Toxicity HT) and leaching of Ba (Marine Aquatic Ecotoxicity MAET and Marine Sediment Ecotoxicity MSET).
For bricks leaching contributes to approximately 100% of two toxic impact categories (Terrestrial Ecotoxicity TET and Ecotoxicity ET) and nearly 60% of three impact categories (Marine Aquatic Ecotoxicity MAET, Marine Sediment Ecotoxicity and Human Toxicity HT). The toxic impacts related to leaching from bricks are mostly related to leaching of vanadium (from 20% to over 90% of leaching impacts depending on the category), and Cr (especially relevant for human toxicity, contributing as much as 80% As in the concrete scenario, the avoided leaching from natural gravel is included. However the influence is not significant since the emissions of vanadium from bricks are in the order of 10–6 kgV/kg bricks, while saved emissions from virgin gravel only account for 10–8 kgV/kg bricks.
-40 %
-20 %
0 %
20 %
40 %
60 %
80 %
100 %
ADP GWP EP AP ODP POFP TET MAET MSET ET HT
Avoided leaching from natural gravelAvoided extraction and transport of natural gravelLeaching from concreteTransport crushed concrete, 50 km
ADP: Abiotic Depletion Potential TET: Terrestrial Ecotoxicity GWP: Global Warming Potential MAET: Marine Aquatic EcotoxicityEP: Eutrophication Potential MSET: Marine Sediment EcotoxicityAP: Acidification Potential ET: EcotoxicityODP: Ozone Depletion Potential HT: Human ToxicityPOFP: Photochemical Ozone Formation Potential
Non-toxic impact categories Toxic impact categories
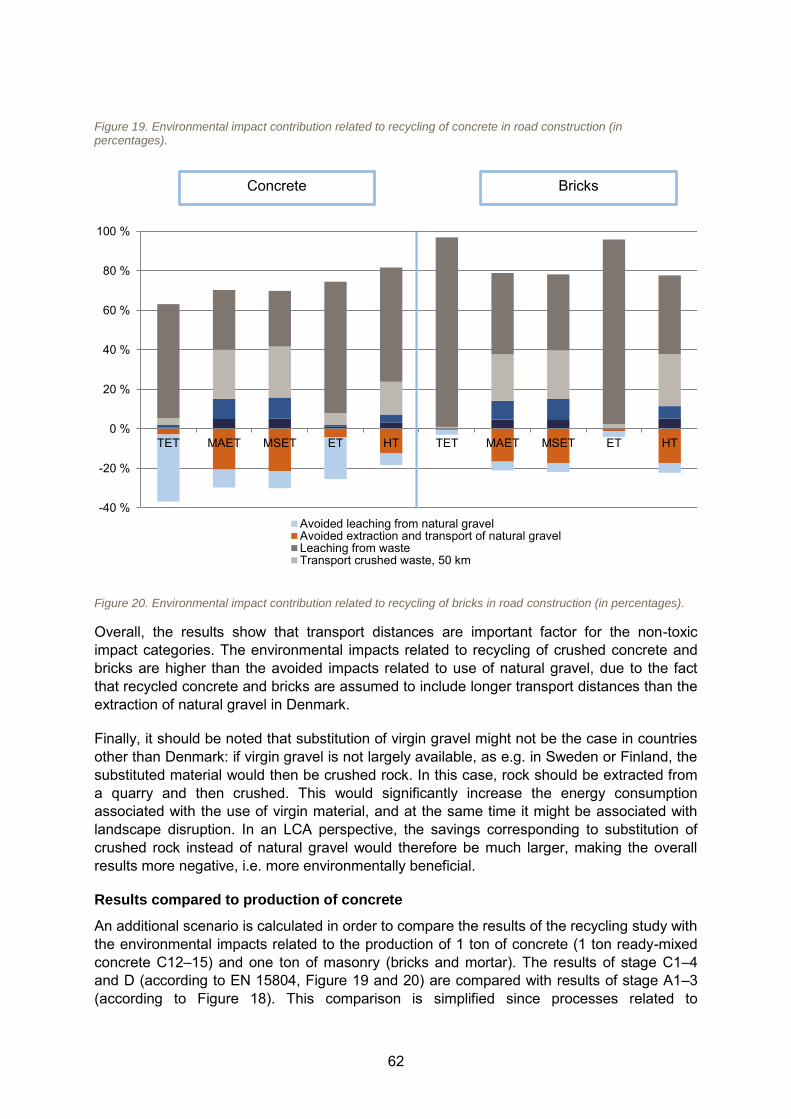
62
Figure 19. Environmental impact contribution related to recycling of concrete in road construction (in percentages).
Figure 20. Environmental impact contribution related to recycling of bricks in road construction (in percentages).
Overall, the results show that transport distances are important factor for the non-toxic impact categories. The environmental impacts related to recycling of crushed concrete and bricks are higher than the avoided impacts related to use of natural gravel, due to the fact that recycled concrete and bricks are assumed to include longer transport distances than the extraction of natural gravel in Denmark.
Finally, it should be noted that substitution of virgin gravel might not be the case in countries other than Denmark: if virgin gravel is not largely available, as e.g. in Sweden or Finland, the substituted material would then be crushed rock. In this case, rock should be extracted from a quarry and then crushed. This would significantly increase the energy consumption associated with the use of virgin material, and at the same time it might be associated with landscape disruption. In an LCA perspective, the savings corresponding to substitution of crushed rock instead of natural gravel would therefore be much larger, making the overall results more negative, i.e. more environmentally beneficial.
Results compared to production of concrete
An additional scenario is calculated in order to compare the results of the recycling study with the environmental impacts related to the production of 1 ton of concrete (1 ton ready-mixed concrete C12–15) and one ton of masonry (bricks and mortar). The results of stage C1–4 and D (according to EN 15804, Figure 19 and 20) are compared with results of stage A1–3 (according to Figure 18). This comparison is simplified since processes related to
-40 %
-20 %
0 %
20 %
40 %
60 %
80 %
100 %
TET MAET MSET ET HT TET MAET MSET ET HT
Avoided leaching from natural gravelAvoided extraction and transport of natural gravelLeaching from wasteTransport crushed waste, 50 km
Concrete Bricks
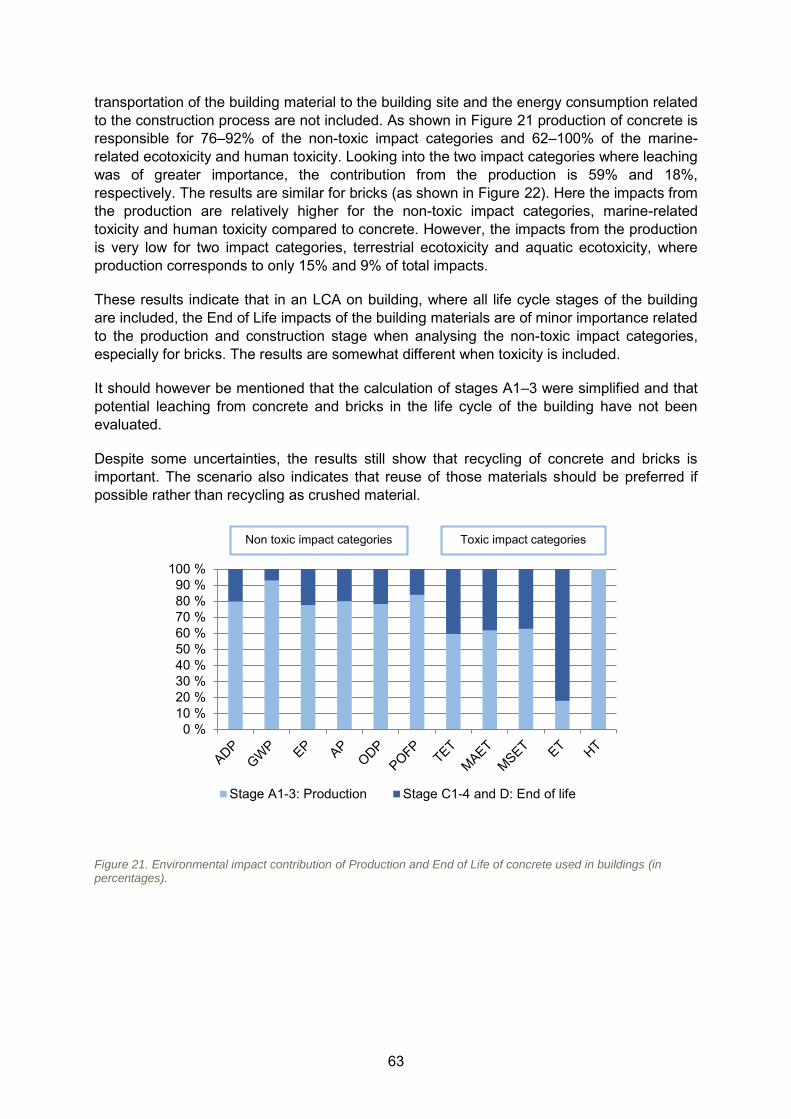
63
transportation of the building material to the building site and the energy consumption related to the construction process are not included. As shown in Figure 21 production of concrete is responsible for 76–92% of the non-toxic impact categories and 62–100% of the marine-related ecotoxicity and human toxicity. Looking into the two impact categories where leaching was of greater importance, the contribution from the production is 59% and 18%, respectively. The results are similar for bricks (as shown in Figure 22). Here the impacts from the production are relatively higher for the non-toxic impact categories, marine-related toxicity and human toxicity compared to concrete. However, the impacts from the production is very low for two impact categories, terrestrial ecotoxicity and aquatic ecotoxicity, where production corresponds to only 15% and 9% of total impacts.
These results indicate that in an LCA on building, where all life cycle stages of the building are included, the End of Life impacts of the building materials are of minor importance related to the production and construction stage when analysing the non-toxic impact categories, especially for bricks. The results are somewhat different when toxicity is included.
It should however be mentioned that the calculation of stages A1–3 were simplified and that potential leaching from concrete and bricks in the life cycle of the building have not been evaluated.
Despite some uncertainties, the results still show that recycling of concrete and bricks is important. The scenario also indicates that reuse of those materials should be preferred if possible rather than recycling as crushed material.
Figure 21. Environmental impact contribution of Production and End of Life of concrete used in buildings (in percentages).
0 %10 %20 %30 %40 %50 %60 %70 %80 %90 %
100 %
Stage A1-3: Production Stage C1-4 and D: End of life
Non toxic impact categories Toxic impact categories
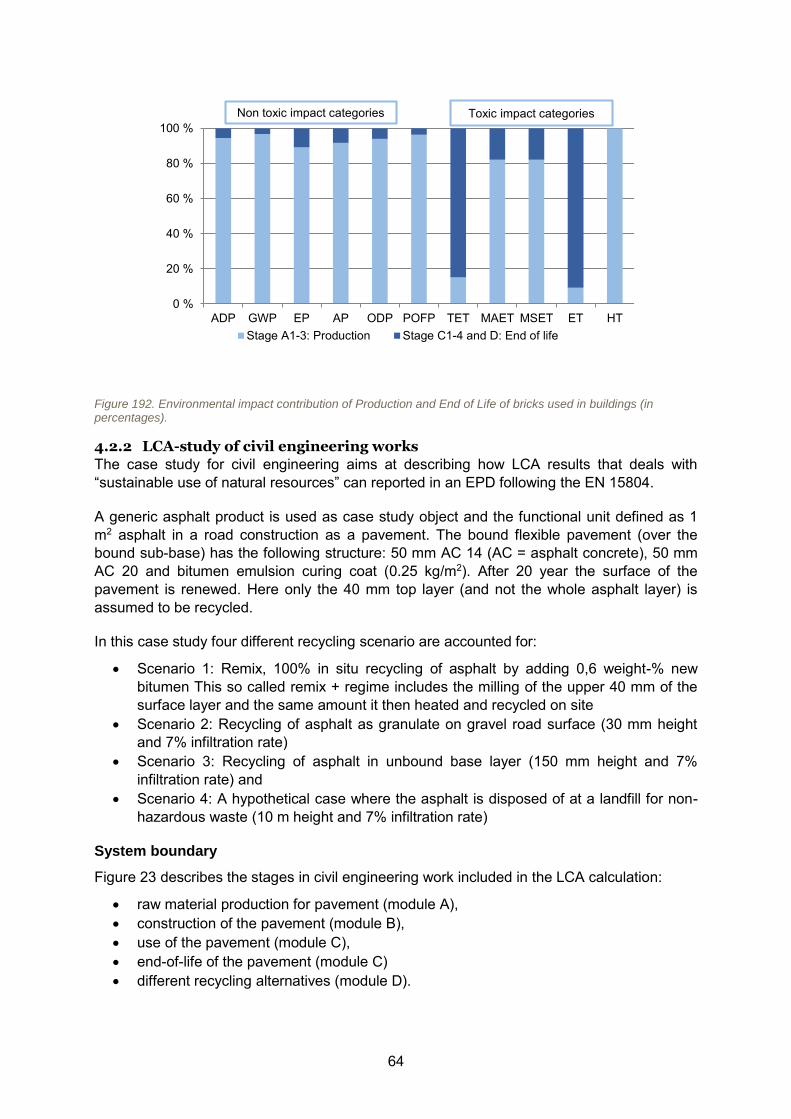
64
Figure 192. Environmental impact contribution of Production and End of Life of bricks used in buildings (in percentages).
4.2.2 LCA-study of civil engineering works
The case study for civil engineering aims at describing how LCA results that deals with “sustainable use of natural resources” can reported in an EPD following the EN 15804.
A generic asphalt product is used as case study object and the functional unit defined as 1 m2 asphalt in a road construction as a pavement. The bound flexible pavement (over the bound sub-base) has the following structure: 50 mm AC 14 (AC = asphalt concrete), 50 mm AC 20 and bitumen emulsion curing coat (0.25 kg/m2). After 20 year the surface of the pavement is renewed. Here only the 40 mm top layer (and not the whole asphalt layer) is assumed to be recycled.
In this case study four different recycling scenario are accounted for:
Scenario 1: Remix, 100% in situ recycling of asphalt by adding 0,6 weight-% new bitumen This so called remix + regime includes the milling of the upper 40 mm of the surface layer and the same amount it then heated and recycled on site
Scenario 2: Recycling of asphalt as granulate on gravel road surface (30 mm height and 7% infiltration rate)
Scenario 3: Recycling of asphalt in unbound base layer (150 mm height and 7% infiltration rate) and
Scenario 4: A hypothetical case where the asphalt is disposed of at a landfill for non-hazardous waste (10 m height and 7% infiltration rate)
System boundary
Figure 23 describes the stages in civil engineering work included in the LCA calculation:
raw material production for pavement (module A), construction of the pavement (module B), use of the pavement (module C), end-of-life of the pavement (module C) different recycling alternatives (module D).
0 %
20 %
40 %
60 %
80 %
100 %
ADP GWP EP AP ODP POFP TET MAET MSET ET HTStage A1-3: Production Stage C1-4 and D: End of life
Non toxic impact categories Toxic impact categories
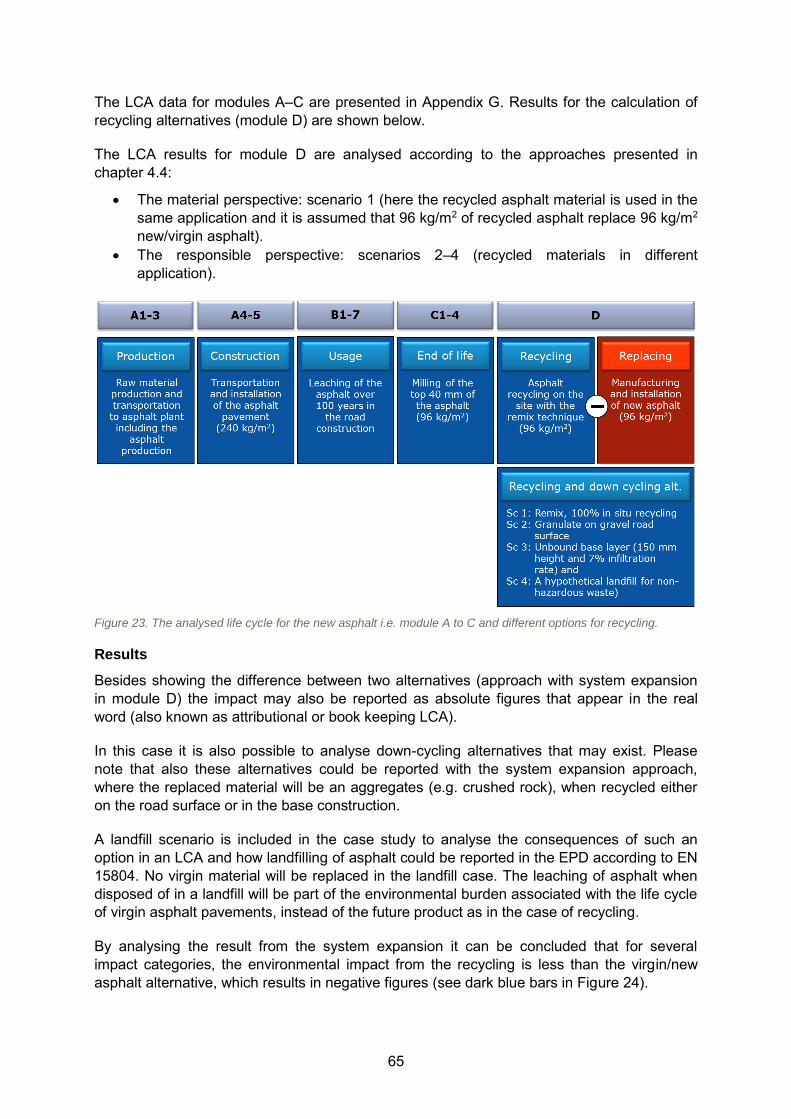
65
The LCA data for modules A–C are presented in Appendix G. Results for the calculation of recycling alternatives (module D) are shown below.
The LCA results for module D are analysed according to the approaches presented in chapter 4.4:
The material perspective: scenario 1 (here the recycled asphalt material is used in the same application and it is assumed that 96 kg/m2 of recycled asphalt replace 96 kg/m2 new/virgin asphalt).
The responsible perspective: scenarios 2–4 (recycled materials in different application).
Figure 23. The analysed life cycle for the new asphalt i.e. module A to C and different options for recycling.
Results
Besides showing the difference between two alternatives (approach with system expansion in module D) the impact may also be reported as absolute figures that appear in the real word (also known as attributional or book keeping LCA).
In this case it is also possible to analyse down-cycling alternatives that may exist. Please note that also these alternatives could be reported with the system expansion approach, where the replaced material will be an aggregates (e.g. crushed rock), when recycled either on the road surface or in the base construction.
A landfill scenario is included in the case study to analyse the consequences of such an option in an LCA and how landfilling of asphalt could be reported in the EPD according to EN 15804. No virgin material will be replaced in the landfill case. The leaching of asphalt when disposed of in a landfill will be part of the environmental burden associated with the life cycle of virgin asphalt pavements, instead of the future product as in the case of recycling.
By analysing the result from the system expansion it can be concluded that for several impact categories, the environmental impact from the recycling is less than the virgin/new asphalt alternative, which results in negative figures (see dark blue bars in Figure 24).
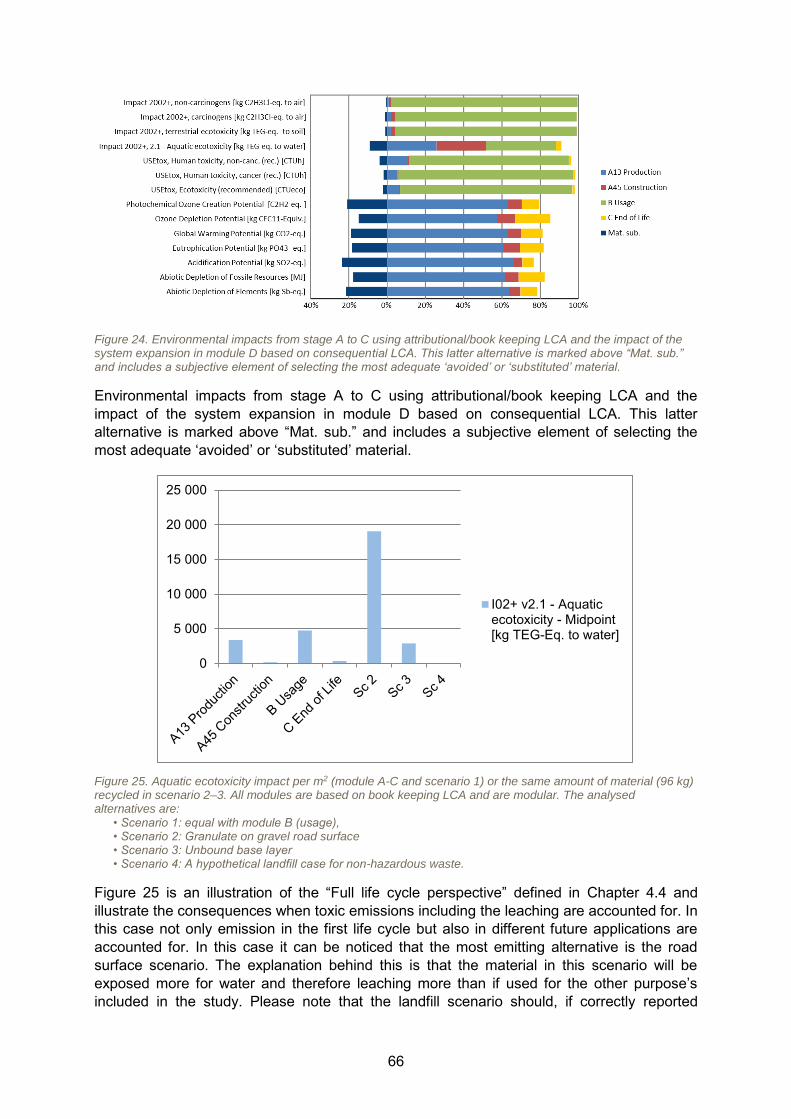
66
Figure 24. Environmental impacts from stage A to C using attributional/book keeping LCA and the impact of the system expansion in module D based on consequential LCA. This latter alternative is marked above “Mat. sub.” and includes a subjective element of selecting the most adequate ‘avoided’ or ‘substituted’ material.
Environmental impacts from stage A to C using attributional/book keeping LCA and the impact of the system expansion in module D based on consequential LCA. This latter alternative is marked above “Mat. sub.” and includes a subjective element of selecting the most adequate ‘avoided’ or ‘substituted’ material.
Figure 25. Aquatic ecotoxicity impact per m2 (module A-C and scenario 1) or the same amount of material (96 kg) recycled in scenario 2–3. All modules are based on book keeping LCA and are modular. The analysed alternatives are:
• Scenario 1: equal with module B (usage), • Scenario 2: Granulate on gravel road surface • Scenario 3: Unbound base layer • Scenario 4: A hypothetical landfill case for non-hazardous waste.
Figure 25 is an illustration of the “Full life cycle perspective” defined in Chapter 4.4 and illustrate the consequences when toxic emissions including the leaching are accounted for. In this case not only emission in the first life cycle but also in different future applications are accounted for. In this case it can be noticed that the most emitting alternative is the road surface scenario. The explanation behind this is that the material in this scenario will be exposed more for water and therefore leaching more than if used for the other purpose’s included in the study. Please note that the landfill scenario should, if correctly reported
0
5 000
10 000
15 000
20 000
25 000
I02+ v2.1 - Aquaticecotoxicity - Midpoint[kg TEG-Eq. to water]
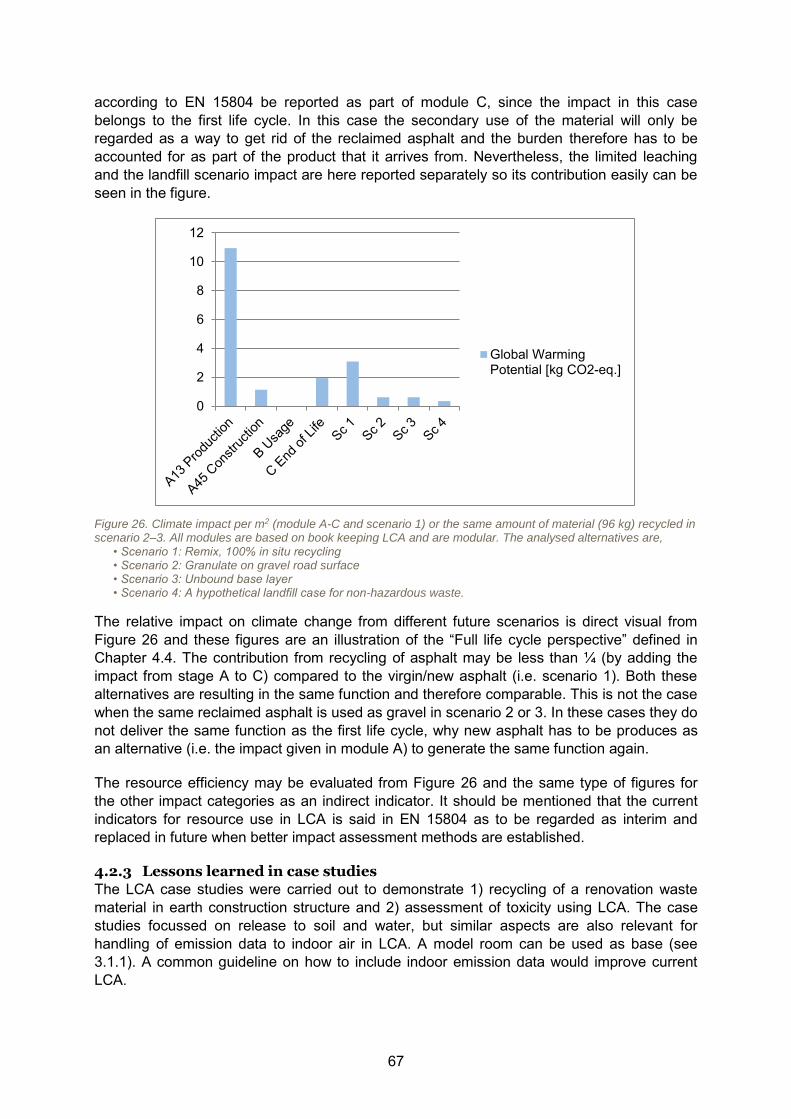
67
according to EN 15804 be reported as part of module C, since the impact in this case belongs to the first life cycle. In this case the secondary use of the material will only be regarded as a way to get rid of the reclaimed asphalt and the burden therefore has to be accounted for as part of the product that it arrives from. Nevertheless, the limited leaching and the landfill scenario impact are here reported separately so its contribution easily can be seen in the figure.
Figure 26. Climate impact per m2 (module A-C and scenario 1) or the same amount of material (96 kg) recycled in scenario 2–3. All modules are based on book keeping LCA and are modular. The analysed alternatives are,
• Scenario 1: Remix, 100% in situ recycling • Scenario 2: Granulate on gravel road surface • Scenario 3: Unbound base layer • Scenario 4: A hypothetical landfill case for non-hazardous waste.
The relative impact on climate change from different future scenarios is direct visual from Figure 26 and these figures are an illustration of the “Full life cycle perspective” defined in Chapter 4.4. The contribution from recycling of asphalt may be less than ¼ (by adding the impact from stage A to C) compared to the virgin/new asphalt (i.e. scenario 1). Both these alternatives are resulting in the same function and therefore comparable. This is not the case when the same reclaimed asphalt is used as gravel in scenario 2 or 3. In these cases they do not deliver the same function as the first life cycle, why new asphalt has to be produces as an alternative (i.e. the impact given in module A) to generate the same function again.
The resource efficiency may be evaluated from Figure 26 and the same type of figures for the other impact categories as an indirect indicator. It should be mentioned that the current indicators for resource use in LCA is said in EN 15804 as to be regarded as interim and replaced in future when better impact assessment methods are established.
4.2.3 Lessons learned in case studies
The LCA case studies were carried out to demonstrate 1) recycling of a renovation waste material in earth construction structure and 2) assessment of toxicity using LCA. The case studies focussed on release to soil and water, but similar aspects are also relevant for handling of emission data to indoor air in LCA. A model room can be used as base (see 3.1.1). A common guideline on how to include indoor emission data would improve current LCA.
0
2
4
6
8
10
12
Global WarmingPotential [kg CO2-eq.]
68
In the LCA based toxicity calculations the limited availability of suitable leaching data (e.g. from literature) and the lack of publically available databases, even for commonly used construction products, was identified as a problem. Besides release data also the total content of a substance in a construction product should be included in order to be able to perform a mass balance. In the estimation of leaching for e.g. 50 years, it is important to check that the release is not overestimated (e.g. maximum release over time can at most be equal to total content).
The latest developed impact assessment models to handle toxicity in LCA include an assessment that integrates the consequences over infinite time, why these kinds of methods can be said to reflect potential risk for future generation (infinite time is used instead of an exposure over e.g. 70 years). A practical consequence of integration over infinite time is, that substances, that do not degrade, such as metals, will weigh more in the overall assessment of impacts as compared to degradable substances, e.g. total hydrocarbons. Moreover, the toxicity of metals is also highly influenced by the speciation and availability. The spatial and temporal variability in the geochemistry of the receiving environment will to a larger extent than for the other substances affect their toxicity, and this is not considered in present state-of-the art LCIA methods. Future work on characterization factors for metals is needed to amend what may be an overestimation of metal toxicity, particularly in marine environment and soil (see Appendix E).
For LCA, the tests results from the harmonised percolation test need to be further calculated for the use scenario. Several approaches are available (see 3.3) depending on the time frame for the evaluation. Development of a common harmonised way of describing the source term for LCA is recommended as a future task. In the scenario description there are also similarities to the work done for development of limit values for acceptance of products in contacts with soil and water. A proposal for a common scenario for granular material in earth construction is suggested in Appendix D for development of limit values. The same scenario can be used as base in LCA for description of use of granular material in civil engineering.
In case of waste recycling, the material use needed to be addressed in the LCA, highlighting the avoided use of natural materials. The current indicator ADP (Abiotic Depletion Potential) in LCA mainly focuses on fossil fuel use and extraction of scarce elements, not adequately taking into account the saving of natural resources. Also the indicator describing depleting of abiotic resource-elements (ADP-elements) in EPD do not address properly the save of all natural resources and need to be further developed. Currently the EPD does not also include toxicity as mandatory.
69
5 CONCLUSIONS AND RECOMMENDATIONS
The main objectives of sustainable construction activities are to minimise resource depletion of energy, water, and raw materials and to prevent environmental degradation caused by facilities and infrastructure throughout their life cycle. The construction sector consumes yearly about half of all natural resources extracted in Europe and their transformation into building products has huge energy demands. Therefore the focus of today is to be on the building end-of-life scenarios and material efficiency. Here waste prevention and recycling / reuse play a key role by providing huge energy, water and material savings. These issues are also specifically addressed in the Construction Products Regulation11 (CPR 2011), where environmental aspects related to construction products consists of the entire lifecycle. The use of “Design for the Environment” -concept is a powerful tool when heading towards increased recycling and reuse and thereby towards minimal environmental impacts.
The environmental sustainability evaluation should always start with complete data on content and emission of dangerous substances. Special attention should be paid to those substances that might pose a risk to human health or the environment, e.g. heavy metals, persistent, bio-accumulative or toxic substances, as well as chemicals that are carcinogenic or mutagenic. CPR focuses on dangerous substances. This means substances, preparations and radioactive substances that are present in construction products and may be released from those products. They may or may not as such be dangerous, but if released or emitted from a construction product they may present a danger for man or the environment during normal use of the construction products when installed in construction works. Information about toxicity and dangerous properties of different substances is, however, constantly updated and revised. Therefore the list of dangerous substances will hardly ever be complete requiring constant follow up from construction producers and other shareholders.
Horizontal standardised assessment procedures developed by CEN/TC 351 both for the measurement of emissions to indoor air emissions and the release of substances to the outdoor environment are the basic methods for assessing BWR 3 properties, i.e. emission and release of dangerous substances from construction products related to the CE marking. The standardised tests provide numerical data for the description of the release/emission behaviour of substances from construction products under laboratory conditions. The purpose of the tests is not the simulation of specific situations, but to describe the release/emission under standardised conditions. The obtained test tests can generally be used as such in comparisons to notified national or case-specific limit values.
If scenario related limit values are not available, scenario-specific conditions can be taken into account during the subsequent interpretation of the test results for development of case-specific limit values. A scenario description is also needed for use of release data in LCA. In both cases the assessment rely on the description of substance release via a source term model, for which, however, no harmonised source term model exists so far leading to a real challenge in the evaluation of the substance effect and long-term risks in a broader scale. There is also no scientifically agreed calculation method yet for some environmentally important indicators and those indicators are therefore not included in the European standards, e.g. EN 15643-2. The release of dangerous substances is particularly important in the evaluation of reuse and recycling of different high volume construction waste fractions. It
11 CPR: Regulation no 305/2011 of the European parliament and of the council of 9 march 2011 laying down harmonized conditions for the marketing of construction products and repealing Council directive 89/106/EEC
70
is therefore very important to work further on the development of the methodology for eco-toxicity and human toxicity in LCA and to reach agreement that can lead to inclusion of those impact categories.
Furthermore, the benefit from a sustainable use of natural resources is not fully addressed in LCA and therefore harmonised procedures for handling recycling in EPD are also lacking. The current impact assessment on resource depletion is based on extraction and consumption of scarce elements and use of fossil energy. Also the current indicator ADP (Abiotic Depletion Potential) in LCA mainly focuses on fossil fuel use, not taking into account the saving of natural resources. Here further development of indicators is needed in order to better address benefits of savings of natural resources.
Environmental information presented in an EPD based on EN 15804 constitutes of five information modules (A-D: production stage – recycling). However, currently only the production stage covering cradle-to-gate is mandatory, because it is based on existing or historical data and can therefore demonstrate verifiable impacts. Impacts from other stages downstream are then scenario (i.e. application) based currently lacking harmonised common LCA methodology. This leads to case–specific assessments, carried out usually also independently from construction product producers.
For a real and fair assessment of environmental impacts of building products a common LCA methodology and a harmonised inventory methodology are needed. In the context of CPR this is taken care of with EN 15804 by development of uniform rules for core-PCR (Product Category Rules) and EPDs (Environmental Product Declaration). The EPDs need to be further developed to cover the recycling stage and such methods have been suggested in this report. Common rules make decisions easier in the selection of construction products with low environmental impact.
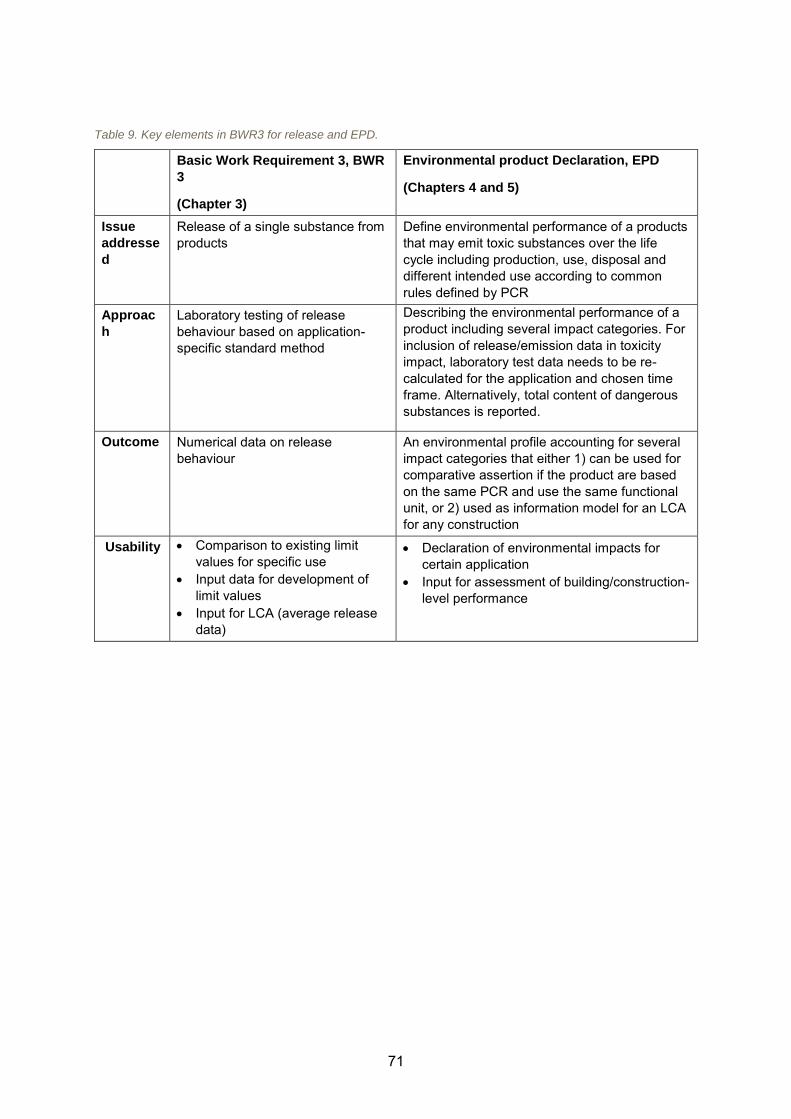
71
Table 9. Key elements in BWR3 for release and EPD.
Basic Work Requirement 3, BWR
3
(Chapter 3)
Environmental product Declaration, EPD
(Chapters 4 and 5)
Issue
addresse
d
Release of a single substance from products
Define environmental performance of a products that may emit toxic substances over the life cycle including production, use, disposal and different intended use according to common rules defined by PCR
Approac
h
Laboratory testing of release behaviour based on application-specific standard method
Describing the environmental performance of a product including several impact categories. For inclusion of release/emission data in toxicity impact, laboratory test data needs to be re-calculated for the application and chosen time frame. Alternatively, total content of dangerous substances is reported.
Outcome Numerical data on release behaviour
An environmental profile accounting for several impact categories that either 1) can be used for comparative assertion if the product are based on the same PCR and use the same functional unit, or 2) used as information model for an LCA for any construction
Usability Comparison to existing limit values for specific use
Input data for development of limit values
Input for LCA (average release data)
Declaration of environmental impacts for certain application
Input for assessment of building/construction-level performance
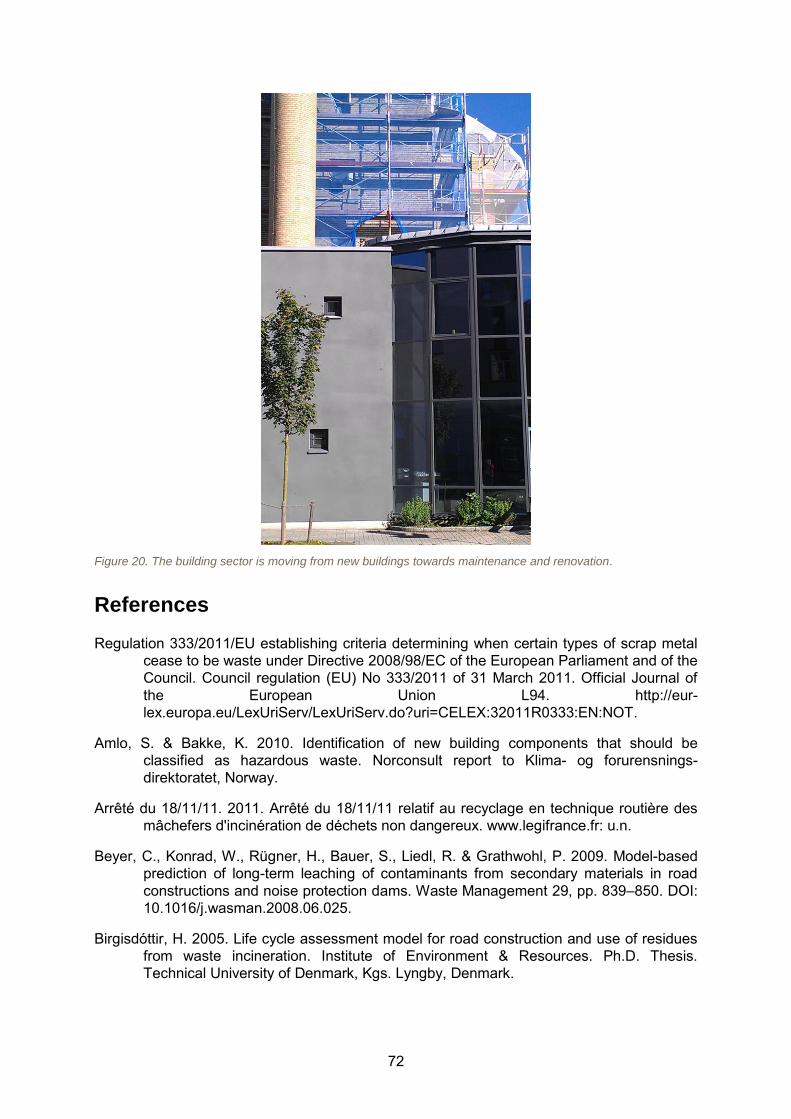
72
Figure 20. The building sector is moving from new buildings towards maintenance and renovation.
References
Regulation 333/2011/EU establishing criteria determining when certain types of scrap metal cease to be waste under Directive 2008/98/EC of the European Parliament and of the Council. Council regulation (EU) No 333/2011 of 31 March 2011. Official Journal of the European Union L94. http://eur-lex.europa.eu/LexUriServ/LexUriServ.do?uri=CELEX:32011R0333:EN:NOT.
Amlo, S. & Bakke, K. 2010. Identification of new building components that should be classified as hazardous waste. Norconsult report to Klima- og forurensnings-direktoratet, Norway.
Arrêté du 18/11/11. 2011. Arrêté du 18/11/11 relatif au recyclage en technique routière des mâchefers d'incinération de déchets non dangereux. www.legifrance.fr: u.n.
Beyer, C., Konrad, W., Rügner, H., Bauer, S., Liedl, R. & Grathwohl, P. 2009. Model-based prediction of long-term leaching of contaminants from secondary materials in road constructions and noise protection dams. Waste Management 29, pp. 839–850. DOI: 10.1016/j.wasman.2008.06.025.
Birgisdóttir, H. 2005. Life cycle assessment model for road construction and use of residues from waste incineration. Institute of Environment & Resources. Ph.D. Thesis. Technical University of Denmark, Kgs. Lyngby, Denmark.
73
Birgisdóttir, H., Bhander, G.l., Hauschild, M.Z. & Christensen, T.H. 2007. Life cycle assessment of disposal of residues from municipal solid waste incineration: Recycling of bottom ash in road construction or landfilling in Denmark evaluated in the ROAD-RES model. Waste Management 27(8), pp. S75–S84.
Carlon, C. 2007. Derivation methods of soil screening values in Europe. A review and evaluation of national procedures towards harmonization. European Commission, Joint Research Centre. http://eusoils.jrc.ec.europa.eu/esdb_archive/eusoils_docs/other/EUR22805.pdf.
CPD 89/106/EEC. 1989. Construction Products Directive: The Council Directive 89/106/EEC of 21 December 1988 on the approximation of laws, regulations and administrative provisions of the Member States relating to construction products. Official Journal of the European Union L40, pp. 12–26. http://eur-lex.europa.eu/LexUriServ/ LexUriServ.do?uri=CELEX:31989L0106:en:HTML.
CPR 305/2011/EU. 2011. Construction Products Regulation: Regulation (EU) No 305/2011 of the European parliament and of the council of 9 March 2011 laying down harmonised conditions for the marketing of construction products and repealing Council Directive 89/106/EEC. Official Journal of the European Union L88, pp. 5–43.
Curran, M. 2006. Life Cycle Assessment: Principles and practice. EPA/600/R-06/060, May 2006. By Scientific Applications International Corporation (SAIC), VA, USA. National Risk Management Research Laboratory, U.S. Enviromental Protection Agency, Ohio, USA. 88 p.
Deutsches Institut für Bautechnik. 2008. Entwurf. Grundsätze zur gesundheitlichen Bewertung von Bauprodukten in Innenräumen*. Stand Oktober 2008.
Directive 2008/98/EC on waste and repealing certain Directives. Directive 2008/98/EC of the European parliament and of the the council of 19 November 2008. Official Journal of the European Union L312. (Waste Framework Directive (WFD)).
Directive 98/83/EC on the quality of water intended for human consumption. Council directive 98/83/EC of 3 November 1998. Official Journal of the European Communities L330.
EN 14342:2005(+A1:2008). Wood flooring – Product characteristics, evaluation of conformity and marking. European Committee for Standardization.
EN 15978:2011. Sustainability of construction works – Assessment of environmental performance of buildings – Calculation method. European Committee for Standardization.
ErsatzbaustoffV. 2011. Verordnung der Bundesregierung. Verordnung zur Festlegung von Anforderungen für das Einbringen und das Einleiten von Stoffen in das Grundwasser,an den Einbau von Ersatzbaustoffen und für die Verwendung von Boden und bodenähnlichem Material. http://www.bmu.de/files/pdfs/allgemein/application/pdf/entw_mantelverordnung.pdf. Arbeitsentwurf stand 06.01.2011.
European Collaborative Action Urban Air, Indoor Environment and Human Exposure, Environment and Quality of Life. 2005. Harmonisation of indoor material, emissions labelling systems in the EU, Inventory of existing schemes. prepared by Stylianos Kephalopoulos (Chairman), Kimmo Koistinen, and Dimitrios Kotzias. Report No 24, EC Joint Research Centre, Institute for Health & Consumer Protection, Ispra, Italy.
74
Luxembourg: Office for Official Publications of the European Communities. ISBN: 92-79-01043-3.
European Commission. 2002. Guidance paper H – A harmonised approach relating to dangerous substances under the construction products directive. European commision, enterprise and industry directorate-general. http://ec.europa.eu/enterprise/sectors/construction/files/guidance-papers/gp-h_en.pdf.
FOCUS. 2011. Generic Guidance for Tier 1 FOCUS Ground Water Assessments, http://viso.ei.jrc.it/focus/gw: Forum for Co-ordination of pesticide fate models and their USe.
FprCEN/TS 16516. Construction products – Assessment of release of dangerous substances – Determination of emissions into indoor air. Directive 2006/118/EC on the protection of groundwater against pollution and deterioration. Directive of the European parliament and of the Council of 12 December 2006.
Heikkilä, K. & Erlandsson, M. 2011. Climate declarations in the building sector: lessons learned. Proceedings from World Sustainable Building Conference, 18–21 October, 2011 Helsinki, Finland.
hEN 15804:2011. (Draft). Sustainability of construction works – Environmental product declarations – Core rules for the product category of construction products. Draft FprEN 15804, 2011-05-16.
Hjelmar, O., Holm, J., Hansen, J.G. & Dahlstrøm, K. 2005. Implementation of the EU waste acceptance criteria for landfilling in Denmark. In: Proceedings of 10th International Waste Management and Landfill Symposium, October 3–7, Cagliari, Sardinia, 2005.
Hjelmar, O. 1990. Leachate from land disposal of coal fly ash. Waste Management & Research, 8, 429–449.
EN 15804:2012. Sustainability of construction works – Environmental product declarations – Core rules for the product category of construction products. European Committee for Standardization.
ISO 14025:2006. Environmental labels and declarations – Type III environmental declarations – Principles and procedures. International Organization for Standardization.
ISO 14044:2006. Environmental management – Life cycle assessment – Requirements and guidelines. International Organization for Standardization.
ISO 16000-9:2006. Indoor air. Part 9: Determination of the emission of volatile organic compounds from building products and furnishing. Emission test chamber method. International Organization for Standardization.
Kirkeby, J.T., Birgisdottir, H., Lund Hansen, T., Christensen, T.H., Singh Bhander G. & Hauschild, M. 2006. Environmental assessment of solid waste systems and technologies: EASEWASTE. Waste Manage Res 24, pp. 3–15.
Le ministre d'Etat, ministre de l'écologie, de l'énergie, du développement durable et de l'aménagement du territoire, le ministre du travail, des relations sociales, de la famille, de la solidarité et de la ville et la ministre de la santé et des sports. Arrêté du 30 avril 2009 relatif aux conditions de mise sur le marché des produits de construction et de
75
décoration contenant des substances cancérigènes, mutagènes ou reprotoxiques de catégorie 1 ou 2, NOR: DEVP0908633A. Fait à Paris, le 30 avril 2009.
Le ministre d'Etat, ministre de l'écologie, de l'énergie, du développement durable et de l'aménagement du territoire, le ministre du travail, des relations sociales, de la famille, de la solidarité et de la ville et la ministre de la santé et des sports. Arrêté du 28 mai 2009 modifiant l'arrêté du 30 avril 2009 relatif aux conditions de mise sur le marché des produits de construction et de décoration contenant des substances cancérigènes, mutagènes ou reprotoxiques de catégorie 1 ou 2, NOR: DEVP0910046A.
Ministère de L’écologie, du Développement Durable, des Transports dt du Logement. Décret no 2011-321 du 23 mars 2011 relatif à l’étiquetage des produits de construction ou de revêtement de mur ou de sol et des peintures et vernis sur leurs émissions de polluants volatils. Journal Officiel de la République Française. 25 mars 2011.
Mroueh, U.-M., Eskola, P. & Laine-Ylijoki, J. 2001. Life-cycle impacts of the use of industrial by-products in road and earth constructions. Waste Management 21, pp. 271–277.
Monier, V., Hestin, M., Trarieux, M., Mimid, S., Domröse, L., Van Acoleyen, M., Hjerp, P. & Mudgal, S. 2011. Study in the management of construction and demolition waste in the EU, contract 07.0307/2009/540863/SER/G2, Final report for the European Commission (DG Environment).
Naturvårdsverket. 2011. PCB i byggnader och utrustning. http://www.naturvardsverket.se/Stod-i-miljoarbetet/Vagledning-amnesvis/PCB/.
NEP nr: 165N Bubbledeck Buskerud Betongfabrikk, Approved 20.2.1013 according to EN ISO 14025, 8.1.4.
Outcome of the EU Workshop on “Harmonisation of the health based evaluation of emissions from building products in the EU using the LCI-concept”, 13–14 September 2010, Ispra (Italy). Joint Research Centre, www.jrc.ec.europa.eu.
Regeling Bodemkwaliteit. 2007. Regeling van 13 december 2007, nr. DJZ2007124397, houdende regels voor de uitvoering van de kwaliteit van de bodem. Wetten.overheid.nl.
Sétra. 2011. Guide méthodologique – Acceptabilité de matériaux alternatifs en technique routière – Evaluation environnementale.
Suer, P. & Wik, O. 2013. Limit values for construction products – Part II – Review of transport models (Prel. title). Manuscript.
Suer, P., Wik, O. & Erlandsson, M. 2012. CPR: from material emission data to a life cycle perspective. In: Arm, M., Vandecasteele, C., Heynen, J., Suer, P. & Lind, B. (Eds.). WASCON 2012 – towards effective, durable and sustainable production and use of alternative materials in construction. 8th International conference on sustainable management of waste and recycled materials in construction. Göteborg, Sweden. www.swedgeo.se.
Suer, P., Wik, O. & Erlandsson, M. 2013. Reuse and recycle - Considering the soil below constructions. AquaConSoil 2013 (Topic E.1, ID 2035). http://www.aquaconsoil.org/AquaConSoil2013/Procs_Theme_E_files/ThS_E1_1_Oral.pdf.
76
Susset, B. & Grathwohl, P. 2011. Leaching standards for mineral recycling materials – A harmonized regulatory concept for the upcoming German Recycling Decree. Waste Management 31(2), pp. 201–214.
TEEB 2010. The Economics of Ecosystems and Biodiversity Ecological and Economic Foundations. Edited by Pushpam Kumar. Earthscan, London and Washington Toelichting Besluit Bodemkwaliteit, 2007. Nota van Toelichting bij Besluit van 22 november 2007, houdende regels inzake de kwaliteit van de bodem. https://zoek.officielebekendmakingen.nl/stb-2007-469.html#IDA1RFS: u.n.
Ulla, K. & Nost-Hegge, M. 2011. Kartlegging av disponering av forurenset betong. Norconsult report to Klima- og forurensnings-direktoratet, Norway.
Van der Sloot, H.A., Seignette, P., Comans, R.N.J., van Zomeren, A., Dijkstra, J.J., Meeussen, H., Kosson, D.S. & Hjelmar, O. 2003. Environmental performance of waste materials. In Dhir, R.K, Newlands, M.D. & Halliday, J.E. (eds.): Recycling and Reuse of Waste Materials. Proceedings of the International Symposium held at University of Dundee, Scotland, UK on 9-11 September 2003, Thomas Thelford, London, pp. 769-789.
Verschoor, A., Lijzen, J., van den Broek, H., Clecen, R., Comans, R & Dijkstra, J. 2008. Revision of the Dutch Building Materials Decree: Alternative emission limit values for inorganic components in granular building materials. 9th International Symposium on Environmental Geotechnology and Global Sustainable Development.
Wahlström, M., Laine-Ylijoki, J., Kaartinen, T., Rautiainen, L., Hjelmar, O., Oberender, A., Benz, D., Wik, O., Gustafsson, H., Engelsen, C.J. & Birgisdottir, H. 2009. Handbook: Environmental assessment of construction products – An introduction to test methods and other procedures related to CE-marking. NT Techn Report 618. Nordtest. Nordic Innovation Centre, Norway. http://www.nordtest.info/images/documents/nt-technical-reports/NT%20TR%20618_HANDBOOK%20-%20Environmental%20Assessment %20of%20Construction%20Products%20-%20An%20introduction%20to%20test %20methods%20and%20other%20procedures%20related%20to%20CE-marking_Nordtest%20Technical%20Report.pdf.
Wahlström, M., Laine-Ylijoki, J., Hjelmar, O., Bendz, D. & Rosqvist , H. 2005. Models for impact evaluation on landfills – Aspects for proper modelling. Nordic Innovation Centre. Oslo. Norway, Report NT TR 601, 48 p + App.
Van der Sloot, H.A., Seignette, P., Comans, R.N.J., van Zomeren, A., Dijkstra, J.J., Meeussen, H., Kosson, D.S. & Hjelmar, O. 2003. Environmental performance of waste materials. In Dhir, R.K, Newlands, M.D. & Halliday, J.E. (eds.). Recycling and Reuse of Waste Materials. Proceedings of the International Symposium held at University of Dundee, Scotland, UK on 9–11 September 2003, Thomas Thelford, London, pp. 769–789.
77
Appendices
Appendix A: Regulated substances
Appendix B: Dangerous substances in construction products
Appendix C: Recycling potential of high volume wastes from renovation
Appendix D: Emission scenarios for outdoor release from constructions
Appendix E: The assessment of toxicity in LCA
Appendix F: Case study: LCA study for building renovation
Appendix G: Case study: LCA study of civil engineering works
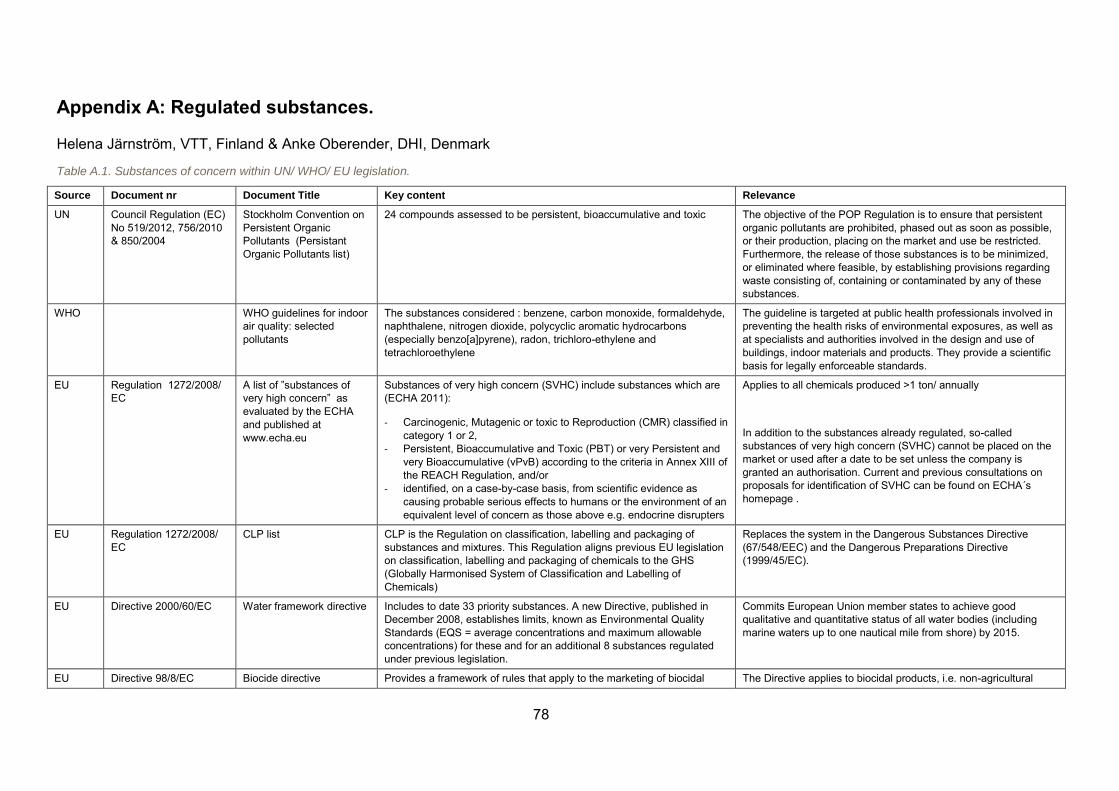
78
Appendix A: Regulated substances.
Helena Järnström, VTT, Finland & Anke Oberender, DHI, Denmark
Table A.1. Substances of concern within UN/ WHO/ EU legislation.
Source Document nr Document Title Key content Relevance
UN Council Regulation (EC) No 519/2012, 756/2010 & 850/2004
Stockholm Convention on Persistent Organic Pollutants (Persistant Organic Pollutants list)
24 compounds assessed to be persistent, bioaccumulative and toxic The objective of the POP Regulation is to ensure that persistent organic pollutants are prohibited, phased out as soon as possible, or their production, placing on the market and use be restricted. Furthermore, the release of those substances is to be minimized, or eliminated where feasible, by establishing provisions regarding waste consisting of, containing or contaminated by any of these substances.
WHO WHO guidelines for indoor air quality: selected pollutants
The substances considered : benzene, carbon monoxide, formaldehyde, naphthalene, nitrogen dioxide, polycyclic aromatic hydrocarbons (especially benzo[a]pyrene), radon, trichloro-ethylene and tetrachloroethylene
The guideline is targeted at public health professionals involved in preventing the health risks of environmental exposures, as well as at specialists and authorities involved in the design and use of buildings, indoor materials and products. They provide a scientific basis for legally enforceable standards.
EU Regulation 1272/2008/ EC
A list of ”substances of very high concern” as evaluated by the ECHA and published at www.echa.eu
Substances of very high concern (SVHC) include substances which are (ECHA 2011):
- Carcinogenic, Mutagenic or toxic to Reproduction (CMR) classified in category 1 or 2,
- Persistent, Bioaccumulative and Toxic (PBT) or very Persistent and very Bioaccumulative (vPvB) according to the criteria in Annex XIII of the REACH Regulation, and/or
- identified, on a case-by-case basis, from scientific evidence as causing probable serious effects to humans or the environment of an equivalent level of concern as those above e.g. endocrine disrupters
Applies to all chemicals produced >1 ton/ annually
In addition to the substances already regulated, so-called substances of very high concern (SVHC) cannot be placed on the market or used after a date to be set unless the company is granted an authorisation. Current and previous consultations on proposals for identification of SVHC can be found on ECHA´s homepage .
EU Regulation 1272/2008/ EC
CLP list CLP is the Regulation on classification, labelling and packaging of substances and mixtures. This Regulation aligns previous EU legislation on classification, labelling and packaging of chemicals to the GHS (Globally Harmonised System of Classification and Labelling of Chemicals)
Replaces the system in the Dangerous Substances Directive (67/548/EEC) and the Dangerous Preparations Directive (1999/45/EC).
EU Directive 2000/60/EC Water framework directive Includes to date 33 priority substances. A new Directive, published in December 2008, establishes limits, known as Environmental Quality Standards (EQS = average concentrations and maximum allowable concentrations) for these and for an additional 8 substances regulated under previous legislation.
Commits European Union member states to achieve good qualitative and quantitative status of all water bodies (including marine waters up to one nautical mile from shore) by 2015.
EU Directive 98/8/EC Biocide directive Provides a framework of rules that apply to the marketing of biocidal The Directive applies to biocidal products, i.e. non-agricultural
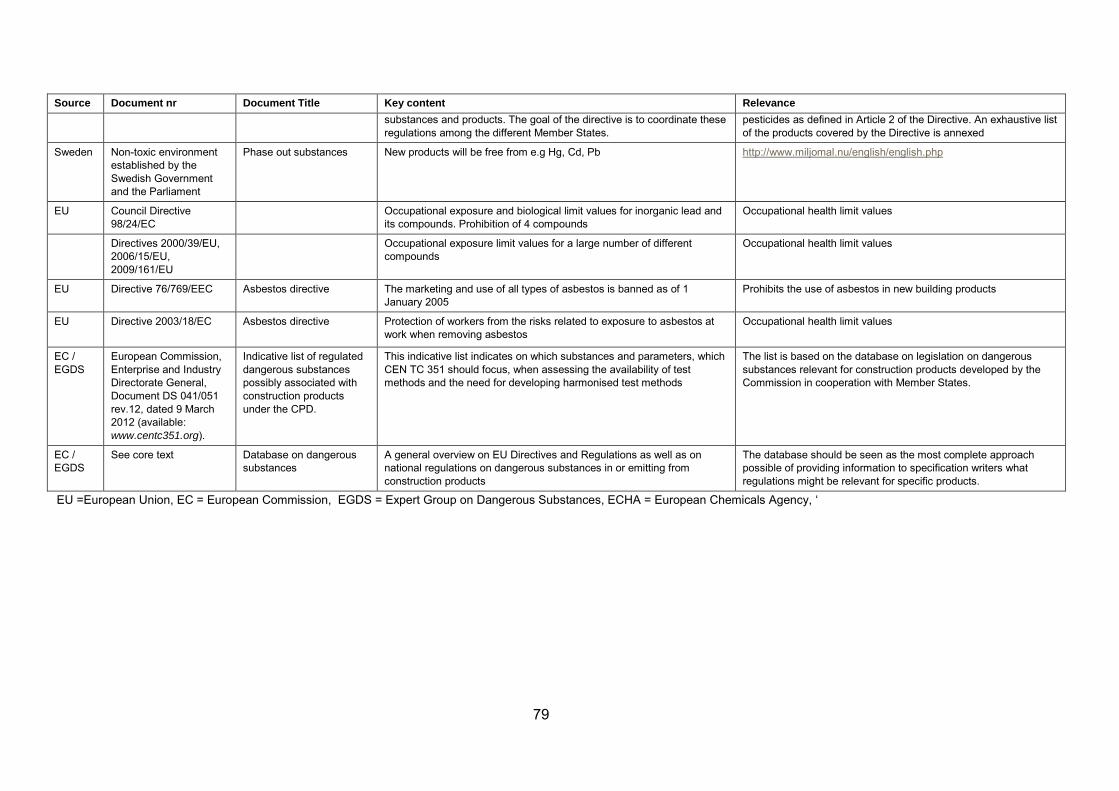
79
Source Document nr Document Title Key content Relevance
substances and products. The goal of the directive is to coordinate these regulations among the different Member States.
pesticides as defined in Article 2 of the Directive. An exhaustive list of the products covered by the Directive is annexed
Sweden Non-toxic environment established by the Swedish Government and the Parliament
Phase out substances
New products will be free from e.g Hg, Cd, Pb http://www.miljomal.nu/english/english.php
EU Council Directive 98/24/EC
Occupational exposure and biological limit values for inorganic lead and its compounds. Prohibition of 4 compounds
Occupational health limit values
Directives 2000/39/EU, 2006/15/EU, 2009/161/EU
Occupational exposure limit values for a large number of different compounds
Occupational health limit values
EU Directive 76/769/EEC Asbestos directive The marketing and use of all types of asbestos is banned as of 1 January 2005
Prohibits the use of asbestos in new building products
EU Directive 2003/18/EC
Asbestos directive Protection of workers from the risks related to exposure to asbestos at work when removing asbestos
Occupational health limit values
EC / EGDS
European Commission, Enterprise and Industry Directorate General, Document DS 041/051 rev.12, dated 9 March 2012 (available: www.centc351.org).
Indicative list of regulated dangerous substances possibly associated with construction products under the CPD.
This indicative list indicates on which substances and parameters, which CEN TC 351 should focus, when assessing the availability of test methods and the need for developing harmonised test methods
The list is based on the database on legislation on dangerous substances relevant for construction products developed by the Commission in cooperation with Member States.
EC / EGDS
See core text Database on dangerous substances
A general overview on EU Directives and Regulations as well as on national regulations on dangerous substances in or emitting from construction products
The database should be seen as the most complete approach possible of providing information to specification writers what regulations might be relevant for specific products.
EU =European Union, EC = European Commission, EGDS = Expert Group on Dangerous Substances, ECHA = European Chemicals Agency, ‘
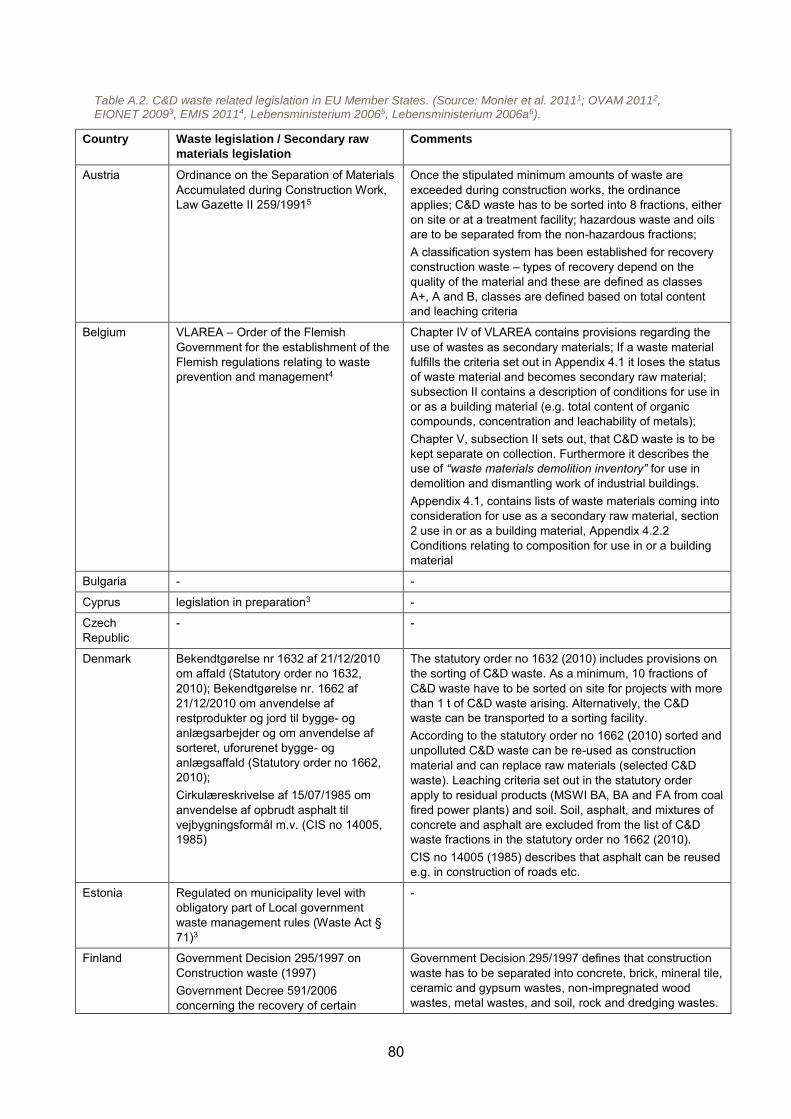
80
Table A.2. C&D waste related legislation in EU Member States. (Source: Monier et al. 20111; OVAM 20112, EIONET 20093, EMIS 20114, Lebensministerium 20065, Lebensministerium 2006a6).
Country Waste legislation / Secondary raw
materials legislation
Comments
Austria Ordinance on the Separation of Materials Accumulated during Construction Work, Law Gazette II 259/19915
Once the stipulated minimum amounts of waste are exceeded during construction works, the ordinance applies; C&D waste has to be sorted into 8 fractions, either on site or at a treatment facility; hazardous waste and oils are to be separated from the non-hazardous fractions; A classification system has been established for recovery construction waste – types of recovery depend on the quality of the material and these are defined as classes A+, A and B, classes are defined based on total content and leaching criteria
Belgium VLAREA – Order of the Flemish Government for the establishment of the Flemish regulations relating to waste prevention and management4
Chapter IV of VLAREA contains provisions regarding the use of wastes as secondary materials; If a waste material fulfills the criteria set out in Appendix 4.1 it loses the status of waste material and becomes secondary raw material; subsection II contains a description of conditions for use in or as a building material (e.g. total content of organic compounds, concentration and leachability of metals); Chapter V, subsection II sets out, that C&D waste is to be kept separate on collection. Furthermore it describes the use of “waste materials demolition inventory” for use in demolition and dismantling work of industrial buildings. Appendix 4.1, contains lists of waste materials coming into consideration for use as a secondary raw material, section 2 use in or as a building material, Appendix 4.2.2 Conditions relating to composition for use in or a building material
Bulgaria - -
Cyprus legislation in preparation3 -
Czech Republic
- -
Denmark Bekendtgørelse nr 1632 af 21/12/2010 om affald (Statutory order no 1632, 2010); Bekendtgørelse nr. 1662 af 21/12/2010 om anvendelse af restprodukter og jord til bygge- og anlægsarbejder og om anvendelse af sorteret, uforurenet bygge- og anlægsaffald (Statutory order no 1662, 2010); Cirkulæreskrivelse af 15/07/1985 om anvendelse af opbrudt asphalt til vejbygningsformål m.v. (CIS no 14005, 1985)
The statutory order no 1632 (2010) includes provisions on the sorting of C&D waste. As a minimum, 10 fractions of C&D waste have to be sorted on site for projects with more than 1 t of C&D waste arising. Alternatively, the C&D waste can be transported to a sorting facility. According to the statutory order no 1662 (2010) sorted and unpolluted C&D waste can be re-used as construction material and can replace raw materials (selected C&D waste). Leaching criteria set out in the statutory order apply to residual products (MSWI BA, BA and FA from coal fired power plants) and soil. Soil, asphalt, and mixtures of concrete and asphalt are excluded from the list of C&D waste fractions in the statutory order no 1662 (2010). CIS no 14005 (1985) describes that asphalt can be reused e.g. in construction of roads etc.
Estonia Regulated on municipality level with obligatory part of Local government waste management rules (Waste Act § 71)3
-
Finland Government Decision 295/1997 on Construction waste (1997)
Government Decree 591/2006 concerning the recovery of certain
Government Decision 295/1997 defines that construction waste has to be separated into concrete, brick, mineral tile, ceramic and gypsum wastes, non-impregnated wood wastes, metal wastes, and soil, rock and dredging wastes.
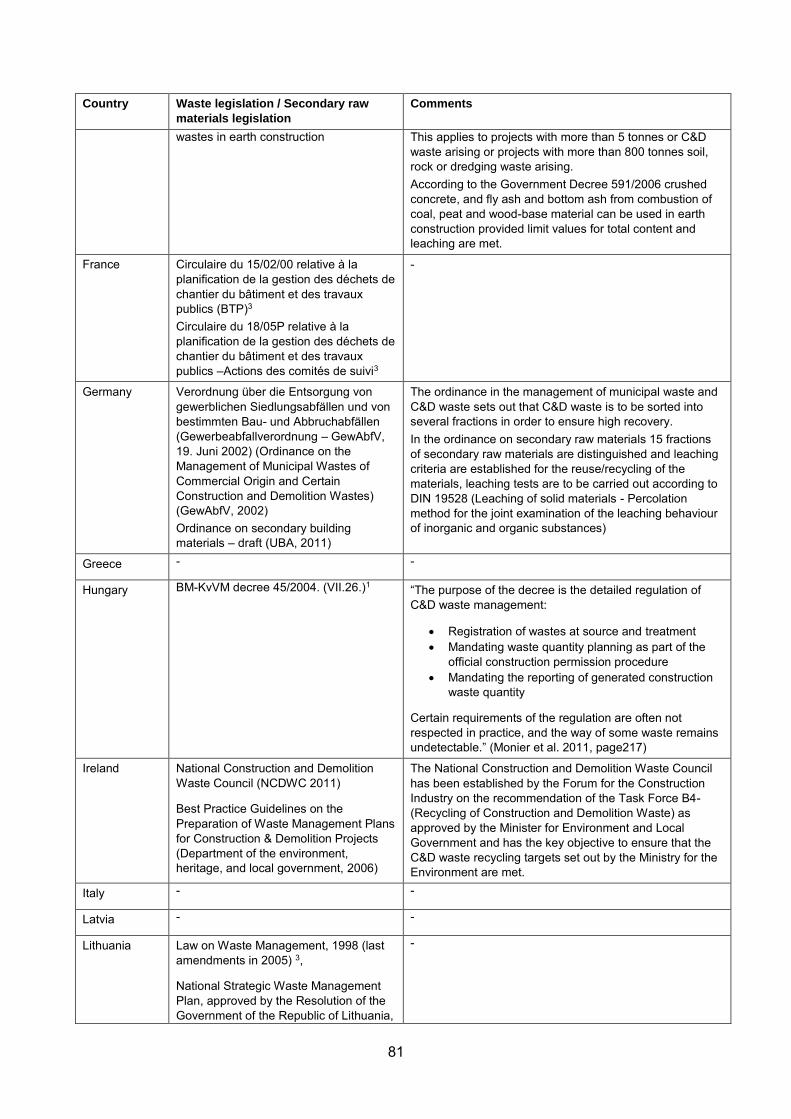
81
Country Waste legislation / Secondary raw
materials legislation
Comments
wastes in earth construction This applies to projects with more than 5 tonnes or C&D waste arising or projects with more than 800 tonnes soil, rock or dredging waste arising. According to the Government Decree 591/2006 crushed concrete, and fly ash and bottom ash from combustion of coal, peat and wood-base material can be used in earth construction provided limit values for total content and leaching are met.
France Circulaire du 15/02/00 relative à la planification de la gestion des déchets de chantier du bâtiment et des travaux publics (BTP)3 Circulaire du 18/05P relative à la planification de la gestion des déchets de chantier du bâtiment et des travaux publics –Actions des comités de suivi3
-
Germany Verordnung über die Entsorgung von gewerblichen Siedlungsabfällen und von bestimmten Bau- und Abbruchabfällen (Gewerbeabfallverordnung – GewAbfV, 19. Juni 2002) (Ordinance on the Management of Municipal Wastes of Commercial Origin and Certain Construction and Demolition Wastes) (GewAbfV, 2002) Ordinance on secondary building materials – draft (UBA, 2011)
The ordinance in the management of municipal waste and C&D waste sets out that C&D waste is to be sorted into several fractions in order to ensure high recovery. In the ordinance on secondary raw materials 15 fractions of secondary raw materials are distinguished and leaching criteria are established for the reuse/recycling of the materials, leaching tests are to be carried out according to DIN 19528 (Leaching of solid materials - Percolation method for the joint examination of the leaching behaviour of inorganic and organic substances)
Greece - -
Hungary BM-KvVM decree 45/2004. (VII.26.)1 “The purpose of the decree is the detailed regulation of C&D waste management:
Registration of wastes at source and treatment Mandating waste quantity planning as part of the
official construction permission procedure Mandating the reporting of generated construction
waste quantity
Certain requirements of the regulation are often not respected in practice, and the way of some waste remains undetectable.” (Monier et al. 2011, page217)
Ireland National Construction and Demolition Waste Council (NCDWC 2011)
Best Practice Guidelines on the Preparation of Waste Management Plans for Construction & Demolition Projects (Department of the environment, heritage, and local government, 2006)
The National Construction and Demolition Waste Council has been established by the Forum for the Construction Industry on the recommendation of the Task Force B4-(Recycling of Construction and Demolition Waste) as approved by the Minister for Environment and Local Government and has the key objective to ensure that the C&D waste recycling targets set out by the Ministry for the Environment are met.
Italy - -
Latvia - -
Lithuania Law on Waste Management, 1998 (last amendments in 2005) 3,
National Strategic Waste Management Plan, approved by the Resolution of the Government of the Republic of Lithuania,
-
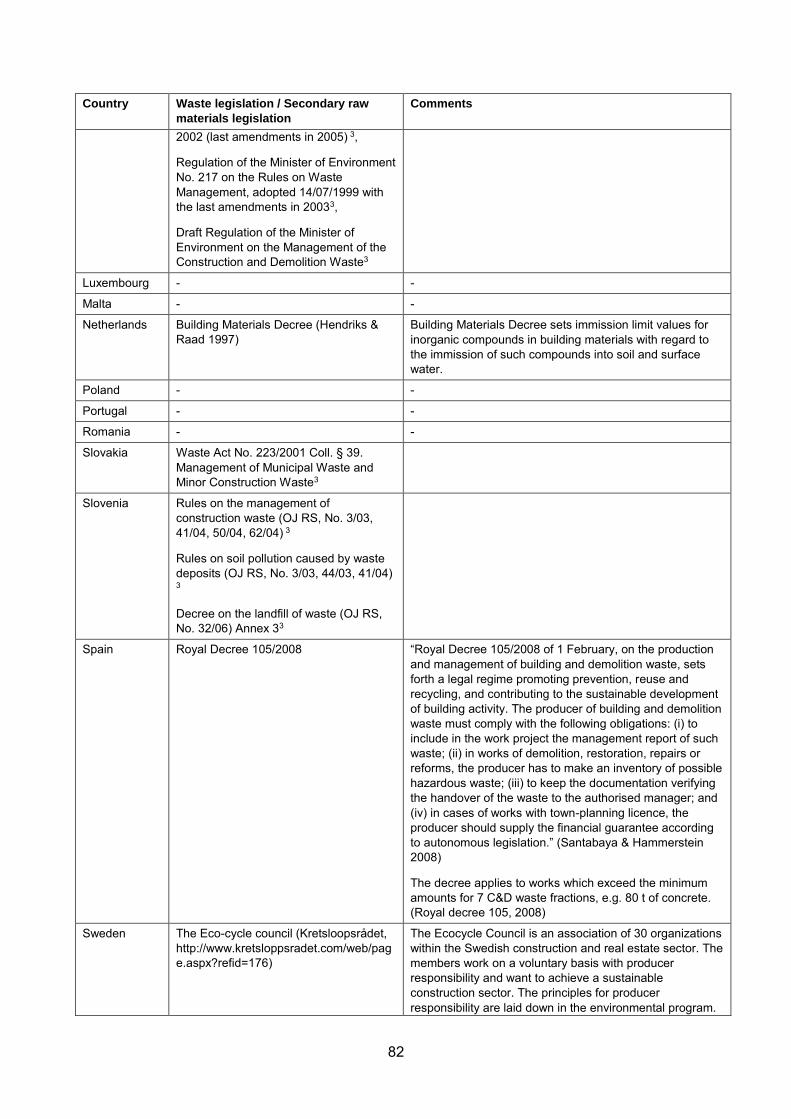
82
Country Waste legislation / Secondary raw
materials legislation
Comments
2002 (last amendments in 2005) 3,
Regulation of the Minister of Environment No. 217 on the Rules on Waste Management, adopted 14/07/1999 with the last amendments in 20033,
Draft Regulation of the Minister of Environment on the Management of the Construction and Demolition Waste3
Luxembourg - -
Malta - -
Netherlands Building Materials Decree (Hendriks & Raad 1997)
Building Materials Decree sets immission limit values for inorganic compounds in building materials with regard to the immission of such compounds into soil and surface water.
Poland - -
Portugal - -
Romania - -
Slovakia Waste Act No. 223/2001 Coll. § 39. Management of Municipal Waste and Minor Construction Waste3
Slovenia Rules on the management of construction waste (OJ RS, No. 3/03, 41/04, 50/04, 62/04) 3
Rules on soil pollution caused by waste deposits (OJ RS, No. 3/03, 44/03, 41/04)
3
Decree on the landfill of waste (OJ RS, No. 32/06) Annex 33
Spain Royal Decree 105/2008 “Royal Decree 105/2008 of 1 February, on the production and management of building and demolition waste, sets forth a legal regime promoting prevention, reuse and recycling, and contributing to the sustainable development of building activity. The producer of building and demolition waste must comply with the following obligations: (i) to include in the work project the management report of such waste; (ii) in works of demolition, restoration, repairs or reforms, the producer has to make an inventory of possible hazardous waste; (iii) to keep the documentation verifying the handover of the waste to the authorised manager; and (iv) in cases of works with town-planning licence, the producer should supply the financial guarantee according to autonomous legislation.” (Santabaya & Hammerstein 2008)
The decree applies to works which exceed the minimum amounts for 7 C&D waste fractions, e.g. 80 t of concrete. (Royal decree 105, 2008)
Sweden The Eco-cycle council (Kretsloopsrådet, http://www.kretsloppsradet.com/web/page.aspx?refid=176)
The Ecocycle Council is an association of 30 organizations within the Swedish construction and real estate sector. The members work on a voluntary basis with producer responsibility and want to achieve a sustainable construction sector. The principles for producer responsibility are laid down in the environmental program.
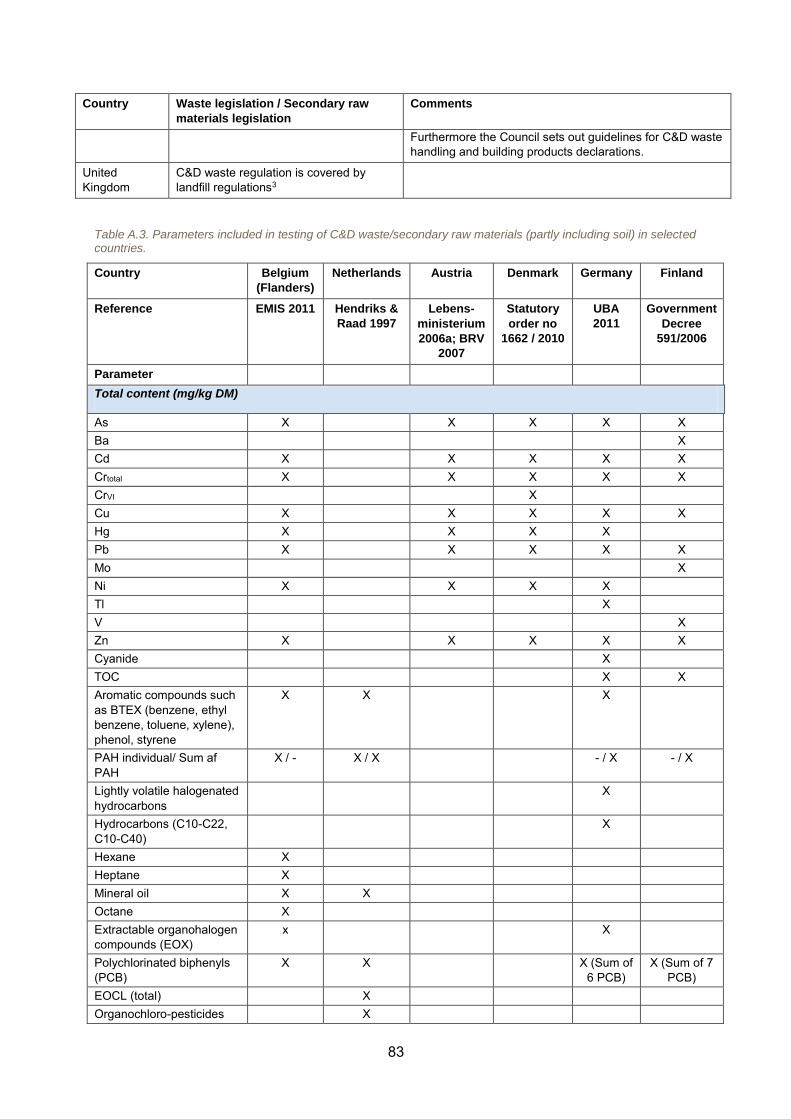
83
Country Waste legislation / Secondary raw
materials legislation
Comments
Furthermore the Council sets out guidelines for C&D waste handling and building products declarations.
United Kingdom
C&D waste regulation is covered by landfill regulations3
Table A.3. Parameters included in testing of C&D waste/secondary raw materials (partly including soil) in selected countries.
Country Belgium
(Flanders)
Netherlands Austria Denmark Germany Finland
Reference EMIS 2011 Hendriks &
Raad 1997
Lebens-
ministerium
2006a; BRV
2007
Statutory
order no
1662 / 2010
UBA
2011
Government
Decree
591/2006
Parameter
Total content (mg/kg DM)
As X X X X X Ba X Cd X X X X X Crtotal X X X X X CrVI X Cu X X X X X Hg X X X X Pb X X X X X Mo X Ni X X X X Tl X V X Zn X X X X X Cyanide X TOC X X Aromatic compounds such as BTEX (benzene, ethyl benzene, toluene, xylene), phenol, styrene
X X X
PAH individual/ Sum af PAH
X / - X / X - / X - / X
Lightly volatile halogenated hydrocarbons
X
Hydrocarbons (C10-C22, C10-C40)
X
Hexane X Heptane X Mineral oil X X Octane X Extractable organohalogen compounds (EOX)
x X
Polychlorinated biphenyls (PCB)
X X X (Sum of 6 PCB)
X (Sum of 7 PCB)
EOCL (total) X Organochloro-pesticides X
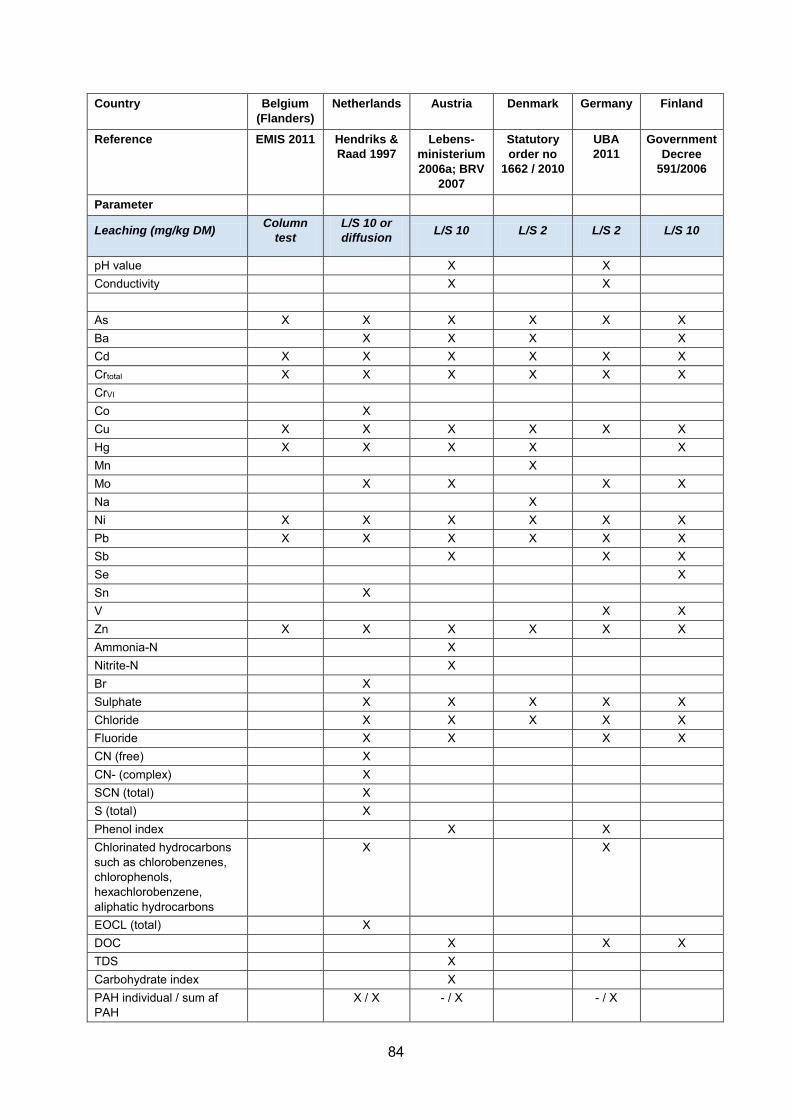
84
Country Belgium
(Flanders)
Netherlands Austria Denmark Germany Finland
Reference EMIS 2011 Hendriks &
Raad 1997
Lebens-
ministerium
2006a; BRV
2007
Statutory
order no
1662 / 2010
UBA
2011
Government
Decree
591/2006
Parameter
Leaching (mg/kg DM) Column
test
L/S 10 or
diffusion L/S 10 L/S 2 L/S 2 L/S 10
pH value X X Conductivity X X As X X X X X X Ba X X X X Cd X X X X X X Crtotal X X X X X X CrVI Co X Cu X X X X X X Hg X X X X X Mn X Mo X X X X Na X Ni X X X X X X Pb X X X X X X Sb X X X Se X Sn X V X X Zn X X X X X X Ammonia-N X Nitrite-N X Br X Sulphate X X X X X Chloride X X X X X Fluoride X X X X CN (free) X CN- (complex) X SCN (total) X S (total) X Phenol index X X Chlorinated hydrocarbons such as chlorobenzenes, chlorophenols, hexachlorobenzene, aliphatic hydrocarbons
X X
EOCL (total) X DOC X X X TDS X Carbohydrate index X PAH individual / sum af PAH
X / X - / X - / X
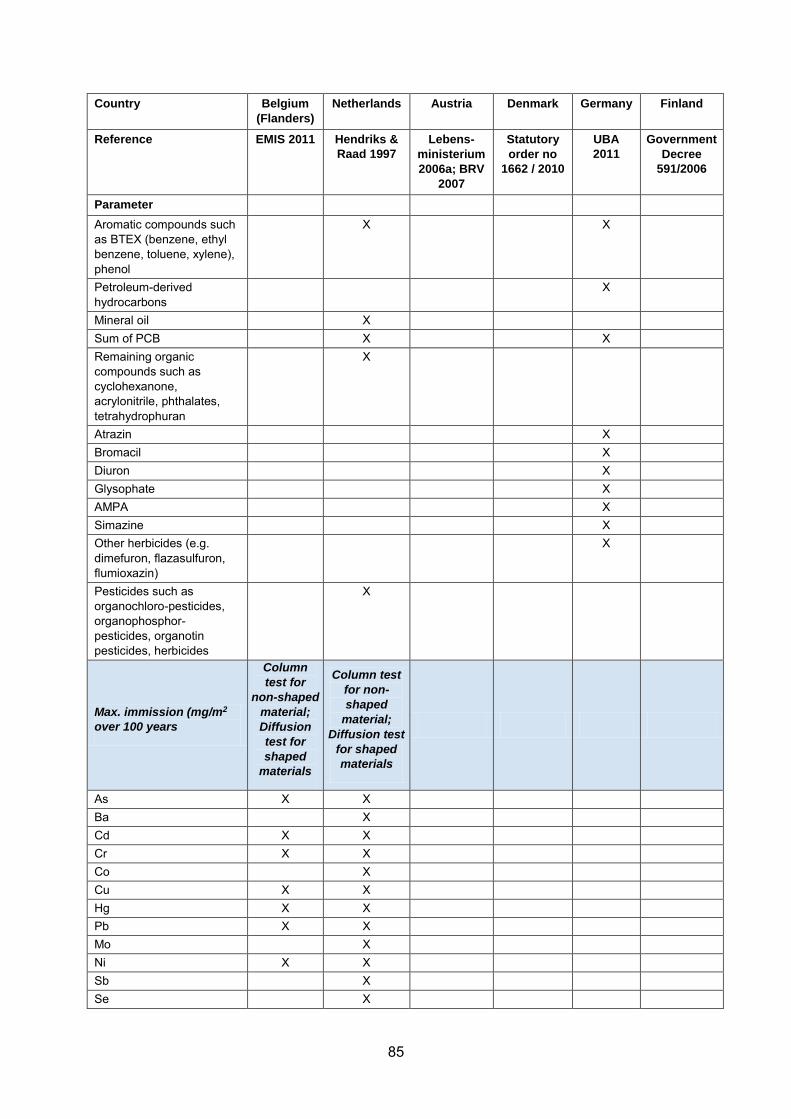
85
Country Belgium
(Flanders)
Netherlands Austria Denmark Germany Finland
Reference EMIS 2011 Hendriks &
Raad 1997
Lebens-
ministerium
2006a; BRV
2007
Statutory
order no
1662 / 2010
UBA
2011
Government
Decree
591/2006
Parameter
Aromatic compounds such as BTEX (benzene, ethyl benzene, toluene, xylene), phenol
X X
Petroleum-derived hydrocarbons
X
Mineral oil X Sum of PCB X X Remaining organic compounds such as cyclohexanone, acrylonitrile, phthalates, tetrahydrophuran
X
Atrazin X Bromacil X Diuron X Glysophate X AMPA X Simazine X Other herbicides (e.g. dimefuron, flazasulfuron, flumioxazin)
X
Pesticides such as organochloro-pesticides, organophosphor-pesticides, organotin pesticides, herbicides
X
Max. immission (mg/m2
over 100 years
Column
test for
non-shaped
material;
Diffusion
test for
shaped
materials
Column test
for non-
shaped
material;
Diffusion test
for shaped
materials
As X X Ba X Cd X X Cr X X Co X Cu X X Hg X X Pb X X Mo X Ni X X Sb X Se X
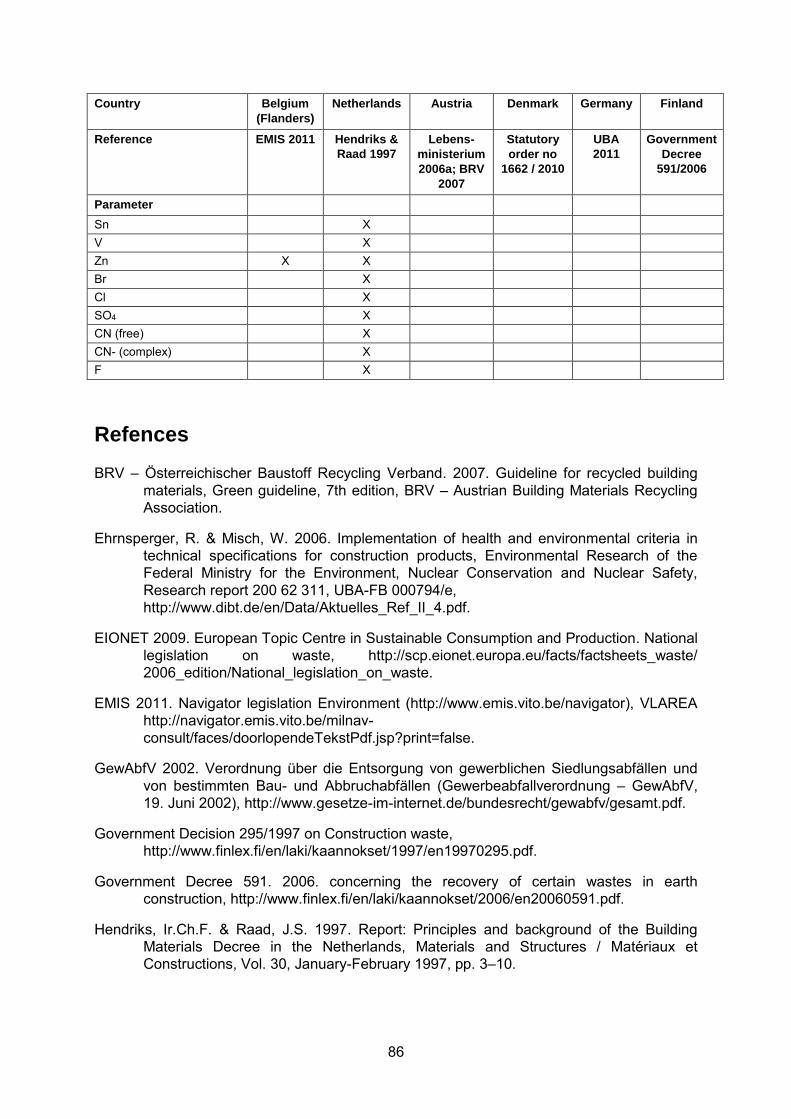
86
Country Belgium
(Flanders)
Netherlands Austria Denmark Germany Finland
Reference EMIS 2011 Hendriks &
Raad 1997
Lebens-
ministerium
2006a; BRV
2007
Statutory
order no
1662 / 2010
UBA
2011
Government
Decree
591/2006
Parameter
Sn X V X Zn X X Br X Cl X SO4 X CN (free) X CN- (complex) X F X
Refences
BRV – Österreichischer Baustoff Recycling Verband. 2007. Guideline for recycled building materials, Green guideline, 7th edition, BRV – Austrian Building Materials Recycling Association.
Ehrnsperger, R. & Misch, W. 2006. Implementation of health and environmental criteria in technical specifications for construction products, Environmental Research of the Federal Ministry for the Environment, Nuclear Conservation and Nuclear Safety, Research report 200 62 311, UBA-FB 000794/e, http://www.dibt.de/en/Data/Aktuelles_Ref_II_4.pdf.
EIONET 2009. European Topic Centre in Sustainable Consumption and Production. National legislation on waste, http://scp.eionet.europa.eu/facts/factsheets_waste/ 2006_edition/National_legislation_on_waste.
EMIS 2011. Navigator legislation Environment (http://www.emis.vito.be/navigator), VLAREA http://navigator.emis.vito.be/milnav-consult/faces/doorlopendeTekstPdf.jsp?print=false.
GewAbfV 2002. Verordnung über die Entsorgung von gewerblichen Siedlungsabfällen und von bestimmten Bau- und Abbruchabfällen (Gewerbeabfallverordnung – GewAbfV, 19. Juni 2002), http://www.gesetze-im-internet.de/bundesrecht/gewabfv/gesamt.pdf.
Government Decision 295/1997 on Construction waste, http://www.finlex.fi/en/laki/kaannokset/1997/en19970295.pdf.
Government Decree 591. 2006. concerning the recovery of certain wastes in earth construction, http://www.finlex.fi/en/laki/kaannokset/2006/en20060591.pdf.
Hendriks, Ir.Ch.F. & Raad, J.S. 1997. Report: Principles and background of the Building Materials Decree in the Netherlands, Materials and Structures / Matériaux et Constructions, Vol. 30, January-February 1997, pp. 3–10.
87
Lebensministerium. 2006. Verordnung des Bundesministers for Umwelt, Jugend und Familie über die Trennung von bei Bautätigkeiten anfallenden Materialien BGBl. Nr. 259, 1991, http://www.genuss-region.at/article/archive/12401/
Lebensministerium. 2006a. Demolition and construction waste – general, http://www.bundesabfallwirtschaftsplan.at/article/archive/16626.
Monier, V., Hestin, M., Trarieux, M., Mimid, S., Domröse, L., Van Acoleyen, M., Hjerp, P. & Mudgal, S. 2011. Study on the management of construction and demolition waste in the EU, contract 07.0307/2009/540863/SER/G2, Final report for the European Commission (DG Environment), http://www.eu-smr.eu/cdw/docs/BIO_Construction%20and%20Demolition%20Waste_Final%20report_09022011.pdf.
NCDWC 2011. National Construction and Demolition Waste Council, http://www.ncdwc.ie/index.html.
OVAM 2011. Public Waste Agency of Flanders (Belgium). Implementation plans, OVAM, http://www.ovam.be/jahia/Jahia/pid/977?lang=null.
Royal decree 105. 2008. REAL DECRETO 105/2008, de 1 de febrero, por el que se regula la producción y gestión de los residuos de construcción y demolición., http://noticias.juridicas.com/base_datos/Admin/rd105-2008.html.
Santabaya, I. & Hammerstein, C.C. 2008. The International comparative legal guide to: Environmental law 2008, a practical insight to cross-border environmental law, chapter 53, Spain, http://www.freshfields.com/publications/pdfs/2008/may08/ ENV08_Chapter_53_Spain.pdf.
Statutory order no 1632. 2010. Bekendtgørelse nr 1632 af 21/12/2010 om affald (Statutory order on waste), https://www.retsinformation.dk/Forms/R0710.aspx?id=135276.
Statutory order no 1662. 2010. Bekendtgørelse nr 1662 af 21/12/2010 om anvendelse af restprodukter og jord til bygge- og anlægsarbejder og om anvendelse af sorteret, uforurenet bygge- og anlægsaffald, https://www.retsinformation.dk/Forms/R0710.aspx?id=134831.
UBA – Umweltbundesamt. 2011. Verordnung zur Festlegung von Anforderungen für das Einbringen und das Einleiten von Stoffen in das Grundwasser, an den Einbau von Ersatzbaustoffen und für die Verwendung von Boden und bodenähnlichem Material, Arbeitsentwurf, Stand: 06.01.2011, draft version, http://www.bmu.de/files/pdfs/allgemein/application/pdf/entw_mantelverordnung.pdf.
.
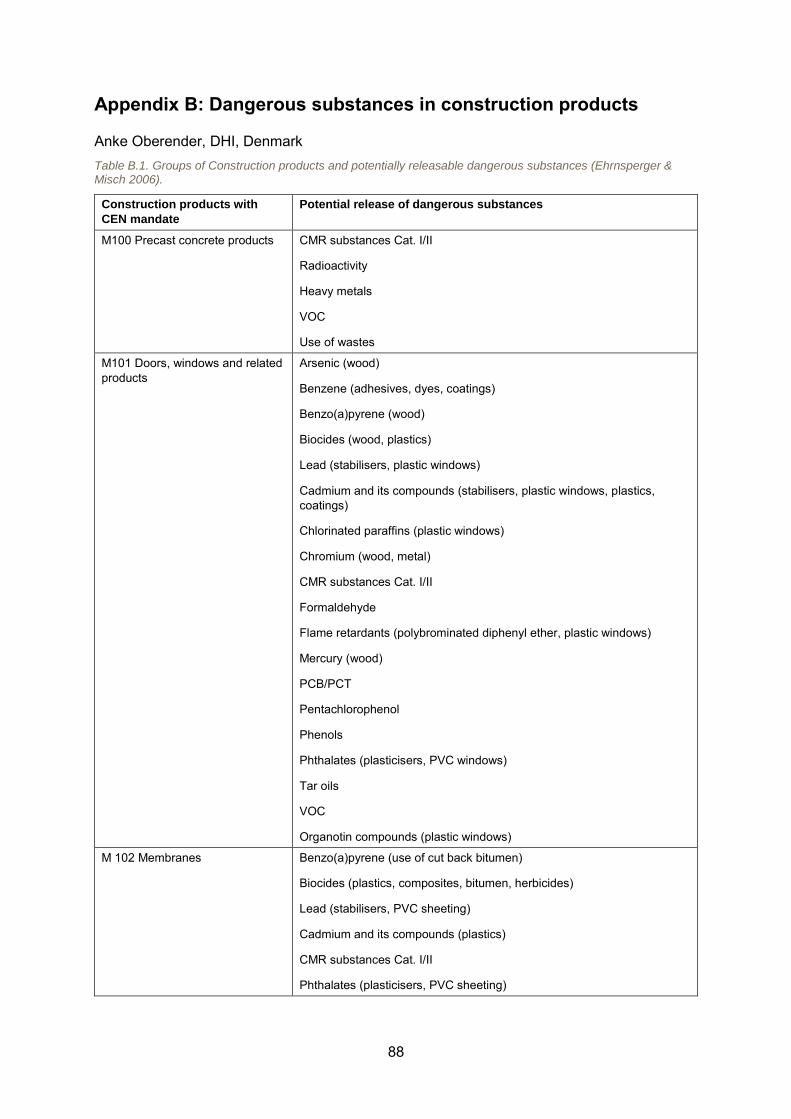
88
Appendix B: Dangerous substances in construction products
Anke Oberender, DHI, Denmark Table B.1. Groups of Construction products and potentially releasable dangerous substances (Ehrnsperger & Misch 2006).
Construction products with
CEN mandate
Potential release of dangerous substances
M100 Precast concrete products CMR substances Cat. I/II
Radioactivity
Heavy metals
VOC
Use of wastes
M101 Doors, windows and related products
Arsenic (wood)
Benzene (adhesives, dyes, coatings)
Benzo(a)pyrene (wood)
Biocides (wood, plastics)
Lead (stabilisers, plastic windows)
Cadmium and its compounds (stabilisers, plastic windows, plastics, coatings)
Chlorinated paraffins (plastic windows)
Chromium (wood, metal)
CMR substances Cat. I/II
Formaldehyde
Flame retardants (polybrominated diphenyl ether, plastic windows)
Mercury (wood)
PCB/PCT
Pentachlorophenol
Phenols
Phthalates (plasticisers, PVC windows)
Tar oils
VOC
Organotin compounds (plastic windows)
M 102 Membranes Benzo(a)pyrene (use of cut back bitumen)
Biocides (plastics, composites, bitumen, herbicides)
Lead (stabilisers, PVC sheeting)
Cadmium and its compounds (plastics)
CMR substances Cat. I/II
Phthalates (plasticisers, PVC sheeting)
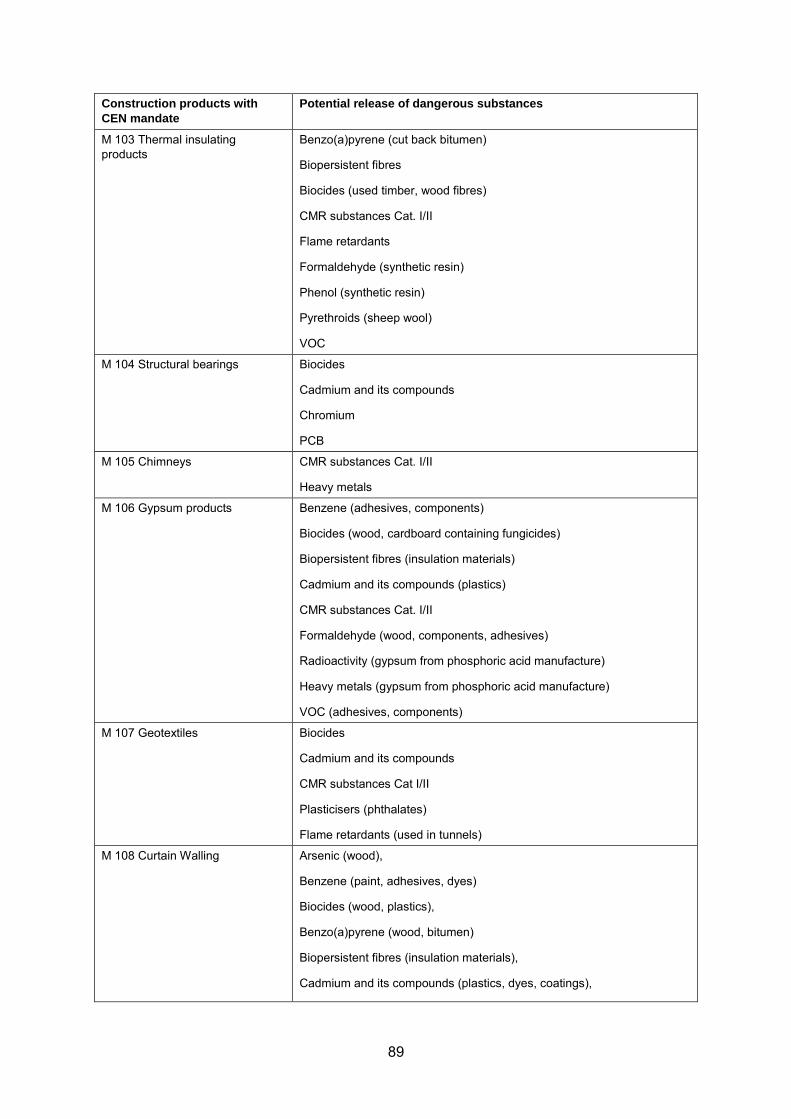
89
Construction products with
CEN mandate
Potential release of dangerous substances
M 103 Thermal insulating products
Benzo(a)pyrene (cut back bitumen)
Biopersistent fibres
Biocides (used timber, wood fibres)
CMR substances Cat. I/II
Flame retardants
Formaldehyde (synthetic resin)
Phenol (synthetic resin)
Pyrethroids (sheep wool)
VOC
M 104 Structural bearings Biocides
Cadmium and its compounds
Chromium
PCB
M 105 Chimneys CMR substances Cat. I/II
Heavy metals
M 106 Gypsum products Benzene (adhesives, components)
Biocides (wood, cardboard containing fungicides)
Biopersistent fibres (insulation materials)
Cadmium and its compounds (plastics)
CMR substances Cat. I/II
Formaldehyde (wood, components, adhesives)
Radioactivity (gypsum from phosphoric acid manufacture)
Heavy metals (gypsum from phosphoric acid manufacture)
VOC (adhesives, components)
M 107 Geotextiles Biocides
Cadmium and its compounds
CMR substances Cat I/II
Plasticisers (phthalates)
Flame retardants (used in tunnels)
M 108 Curtain Walling Arsenic (wood),
Benzene (paint, adhesives, dyes)
Biocides (wood, plastics),
Benzo(a)pyrene (wood, bitumen)
Biopersistent fibres (insulation materials),
Cadmium and its compounds (plastics, dyes, coatings),
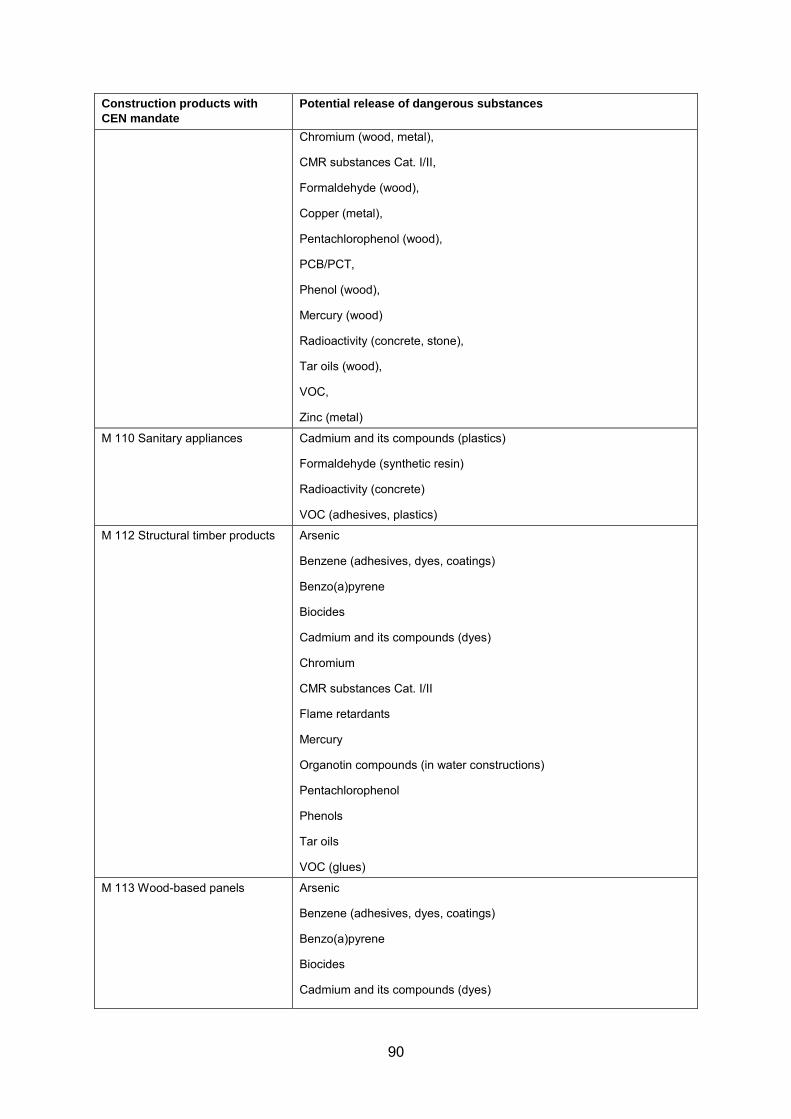
90
Construction products with
CEN mandate
Potential release of dangerous substances
Chromium (wood, metal),
CMR substances Cat. I/II,
Formaldehyde (wood),
Copper (metal),
Pentachlorophenol (wood),
PCB/PCT,
Phenol (wood),
Mercury (wood)
Radioactivity (concrete, stone),
Tar oils (wood),
VOC,
Zinc (metal)
M 110 Sanitary appliances Cadmium and its compounds (plastics)
Formaldehyde (synthetic resin)
Radioactivity (concrete)
VOC (adhesives, plastics)
M 112 Structural timber products Arsenic
Benzene (adhesives, dyes, coatings)
Benzo(a)pyrene
Biocides
Cadmium and its compounds (dyes)
Chromium
CMR substances Cat. I/II
Flame retardants
Mercury
Organotin compounds (in water constructions)
Pentachlorophenol
Phenols
Tar oils
VOC (glues)
M 113 Wood-based panels Arsenic
Benzene (adhesives, dyes, coatings)
Benzo(a)pyrene
Biocides
Cadmium and its compounds (dyes)
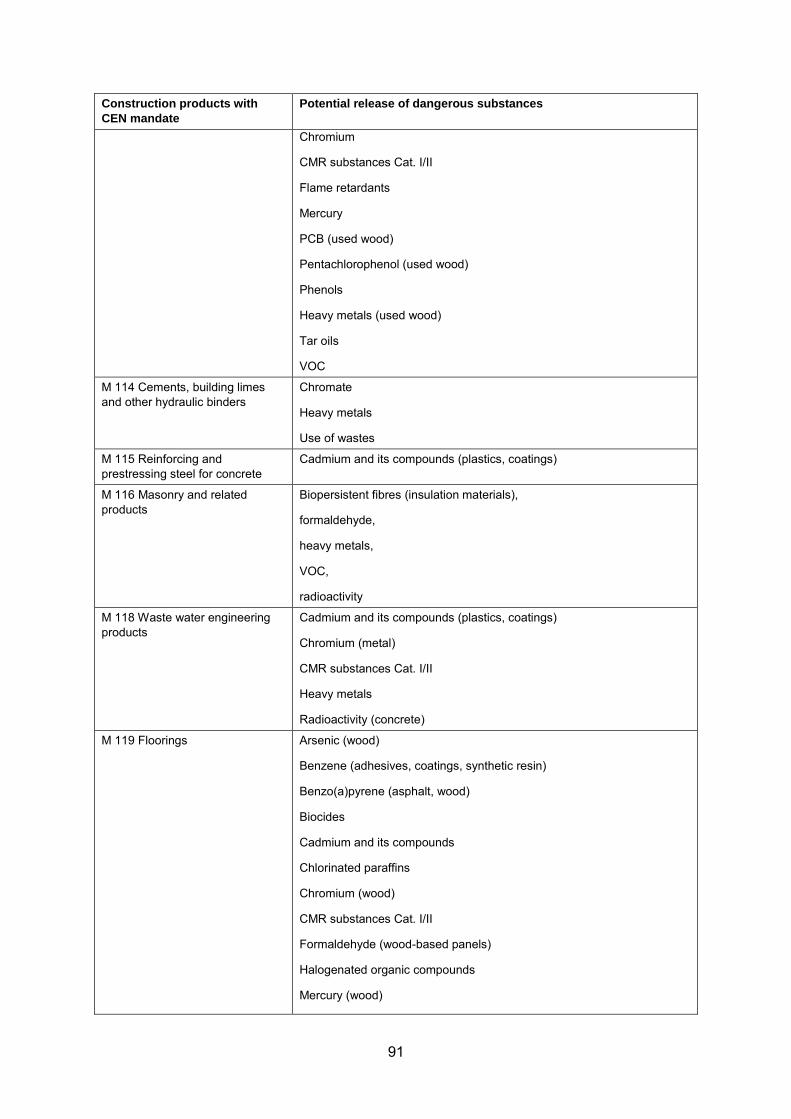
91
Construction products with
CEN mandate
Potential release of dangerous substances
Chromium
CMR substances Cat. I/II
Flame retardants
Mercury
PCB (used wood)
Pentachlorophenol (used wood)
Phenols
Heavy metals (used wood)
Tar oils
VOC
M 114 Cements, building limes and other hydraulic binders
Chromate
Heavy metals
Use of wastes
M 115 Reinforcing and prestressing steel for concrete
Cadmium and its compounds (plastics, coatings)
M 116 Masonry and related products
Biopersistent fibres (insulation materials),
formaldehyde,
heavy metals,
VOC,
radioactivity
M 118 Waste water engineering products
Cadmium and its compounds (plastics, coatings)
Chromium (metal)
CMR substances Cat. I/II
Heavy metals
Radioactivity (concrete)
M 119 Floorings Arsenic (wood)
Benzene (adhesives, coatings, synthetic resin)
Benzo(a)pyrene (asphalt, wood)
Biocides
Cadmium and its compounds
Chlorinated paraffins
Chromium (wood)
CMR substances Cat. I/II
Formaldehyde (wood-based panels)
Halogenated organic compounds
Mercury (wood)
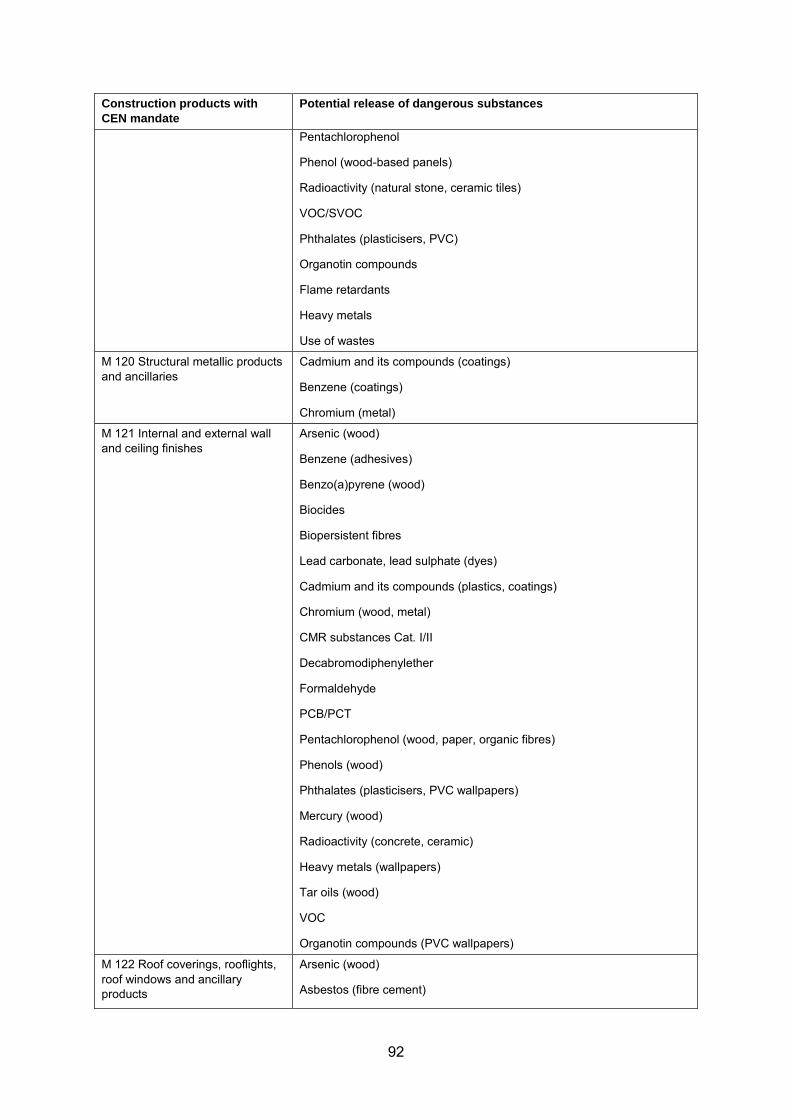
92
Construction products with
CEN mandate
Potential release of dangerous substances
Pentachlorophenol
Phenol (wood-based panels)
Radioactivity (natural stone, ceramic tiles)
VOC/SVOC
Phthalates (plasticisers, PVC)
Organotin compounds
Flame retardants
Heavy metals
Use of wastes
M 120 Structural metallic products and ancillaries
Cadmium and its compounds (coatings)
Benzene (coatings)
Chromium (metal)
M 121 Internal and external wall and ceiling finishes
Arsenic (wood)
Benzene (adhesives)
Benzo(a)pyrene (wood)
Biocides
Biopersistent fibres
Lead carbonate, lead sulphate (dyes)
Cadmium and its compounds (plastics, coatings)
Chromium (wood, metal)
CMR substances Cat. I/II
Decabromodiphenylether
Formaldehyde
PCB/PCT
Pentachlorophenol (wood, paper, organic fibres)
Phenols (wood)
Phthalates (plasticisers, PVC wallpapers)
Mercury (wood)
Radioactivity (concrete, ceramic)
Heavy metals (wallpapers)
Tar oils (wood)
VOC
Organotin compounds (PVC wallpapers)
M 122 Roof coverings, rooflights, roof windows and ancillary products
Arsenic (wood)
Asbestos (fibre cement)
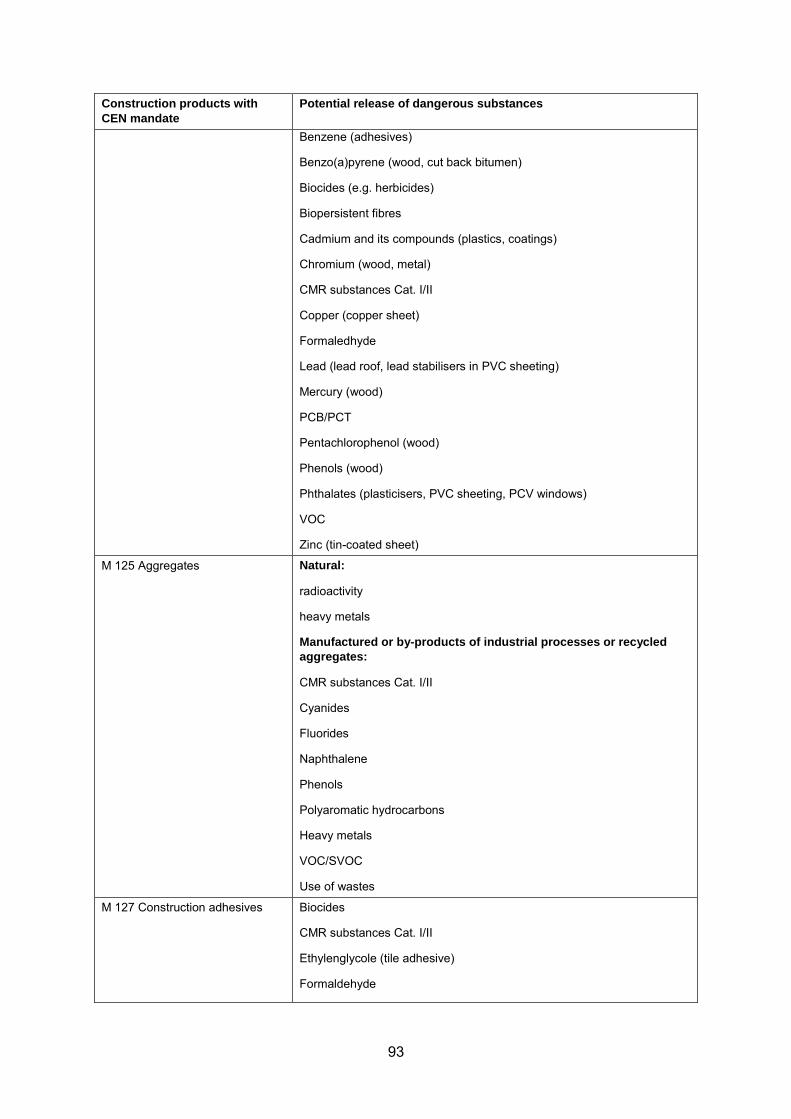
93
Construction products with
CEN mandate
Potential release of dangerous substances
Benzene (adhesives)
Benzo(a)pyrene (wood, cut back bitumen)
Biocides (e.g. herbicides)
Biopersistent fibres
Cadmium and its compounds (plastics, coatings)
Chromium (wood, metal)
CMR substances Cat. I/II
Copper (copper sheet)
Formaledhyde
Lead (lead roof, lead stabilisers in PVC sheeting)
Mercury (wood)
PCB/PCT
Pentachlorophenol (wood)
Phenols (wood)
Phthalates (plasticisers, PVC sheeting, PCV windows)
VOC
Zinc (tin-coated sheet)
M 125 Aggregates Natural:
radioactivity
heavy metals
Manufactured or by-products of industrial processes or recycled
aggregates:
CMR substances Cat. I/II
Cyanides
Fluorides
Naphthalene
Phenols
Polyaromatic hydrocarbons
Heavy metals
VOC/SVOC
Use of wastes
M 127 Construction adhesives Biocides
CMR substances Cat. I/II
Ethylenglycole (tile adhesive)
Formaldehyde
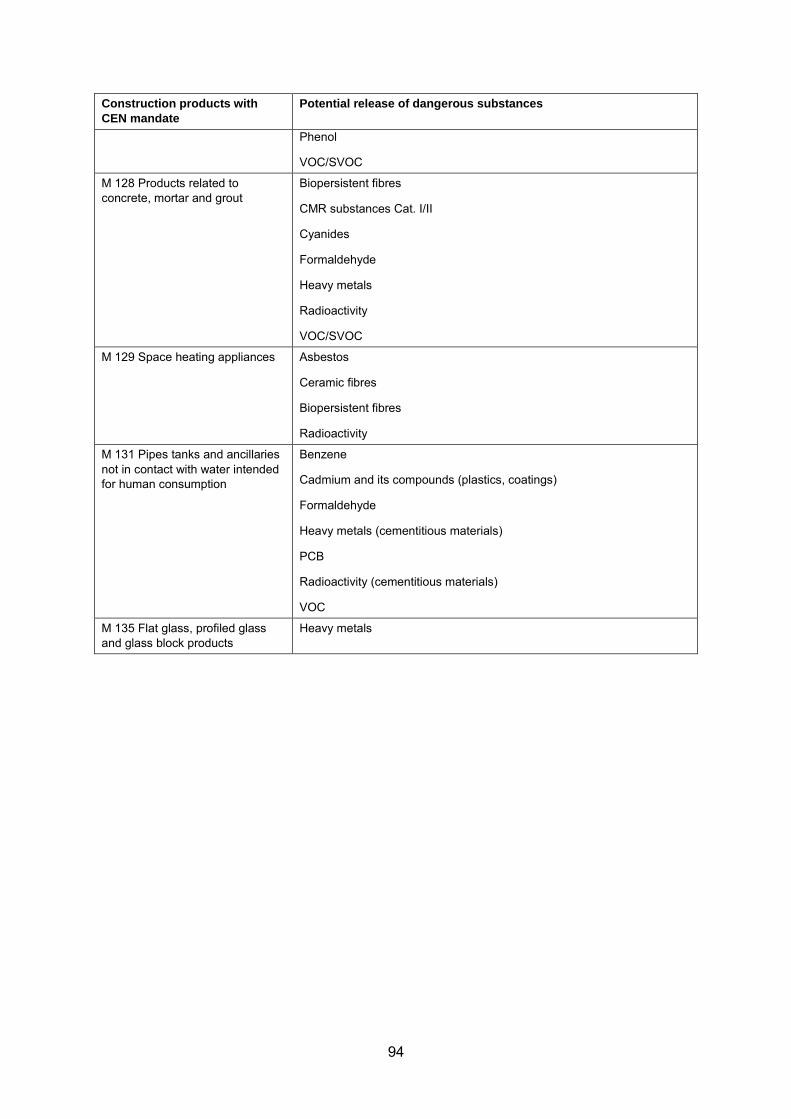
94
Construction products with
CEN mandate
Potential release of dangerous substances
Phenol
VOC/SVOC
M 128 Products related to concrete, mortar and grout
Biopersistent fibres
CMR substances Cat. I/II
Cyanides
Formaldehyde
Heavy metals
Radioactivity
VOC/SVOC
M 129 Space heating appliances Asbestos
Ceramic fibres
Biopersistent fibres
Radioactivity
M 131 Pipes tanks and ancillaries not in contact with water intended for human consumption
Benzene
Cadmium and its compounds (plastics, coatings)
Formaldehyde
Heavy metals (cementitious materials)
PCB
Radioactivity (cementitious materials)
VOC
M 135 Flat glass, profiled glass and glass block products
Heavy metals
95
Refences
Ehrnsperger, R. & Misch, W. 2006. Implementation of Health and Environmental Criteria in Technical Specifications for Construction Products, Research Report 200 62 311, UBA-FB 000794/e, Deutsches Institut für Bautechnik (DIBt). www.dibt.de/en/Data/Aktuelles_Ref_II_4.pdf, accessed March 2008.
Decision 2000/532/EC. Commission Decision of 3 May 2000 replacing Decision 94/3/EC establishing a list of wastes pursuant to Article 1(a) of Council Directive 75/442/EEC on waste and Council Decision 94/904/EC establishing a list of hazardous waste pursuant to Article 1(4) of Council Directive 91/689/EEC on hazardous waste (notified under document number C (2000).
Monier, V. et al. 2011. Study on the management of construction and demolition waste in the EU. Final report for the European Commission (DG Environment).
96
Appendix C: Recycling potential of high volume wastes from
renovation
Anke Oberender, DHI, Denmark
Waste from renovation would usually be referred to as construction and demolition waste (C&D waste). EU has set targets for reuse of C&D waste, 70% of C&D waste should be reused in the member states. In several countries (e.g. the Netherlands) more than 95% of C&D waste is reused in constructions, while others are only at the beginning of the process. Recycling of C&D waste is important to the CPR: the life cycle perspective that is introduced and to support BWR7 (see Chapter 2.1)
Quantities of C&D waste arising in the EU
Table 1 shows estimated amounts for C&D waste (construction and demolition waste) generation and re-use/recycling rates for EU-27 MS (Member States). The EU-27 MS generate an estimated 530 million tonnes C&D waste per year, of which about 46% are re-used or recycled. It can be assumed that around 60% of the C&D waste arises from renovation, 25% from demolition and 15% from construction (Monier et al. 2011). Monier et al. (2011) summarized data from two recent sources where waste generation data for individual MS had been collected (Excavation material (e.g. soil and stones) is excluded). The data shows large variation between countries and is – according to Monier et al. (2011) – a result of unequal levels of control and reporting for C&D waste in MS, as well as differences in waste definitions and reporting mechanisms.
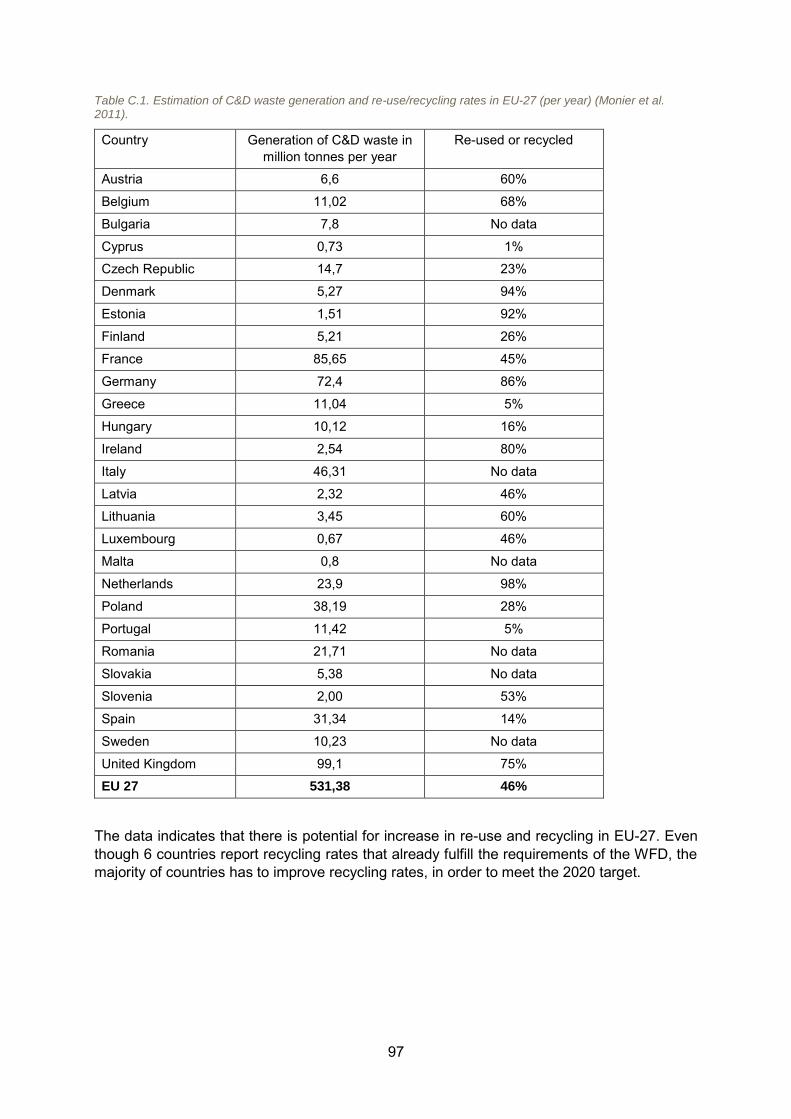
97
Table C.1. Estimation of C&D waste generation and re-use/recycling rates in EU-27 (per year) (Monier et al. 2011).
Country Generation of C&D waste in million tonnes per year
Re-used or recycled
Austria 6,6 60%
Belgium 11,02 68%
Bulgaria 7,8 No data
Cyprus 0,73 1%
Czech Republic 14,7 23%
Denmark 5,27 94%
Estonia 1,51 92%
Finland 5,21 26%
France 85,65 45%
Germany 72,4 86%
Greece 11,04 5%
Hungary 10,12 16%
Ireland 2,54 80%
Italy 46,31 No data
Latvia 2,32 46%
Lithuania 3,45 60%
Luxembourg 0,67 46%
Malta 0,8 No data
Netherlands 23,9 98%
Poland 38,19 28%
Portugal 11,42 5%
Romania 21,71 No data
Slovakia 5,38 No data
Slovenia 2,00 53%
Spain 31,34 14%
Sweden 10,23 No data
United Kingdom 99,1 75%
EU 27 531,38 46%
The data indicates that there is potential for increase in re-use and recycling in EU-27. Even though 6 countries report recycling rates that already fulfill the requirements of the WFD, the majority of countries has to improve recycling rates, in order to meet the 2020 target.
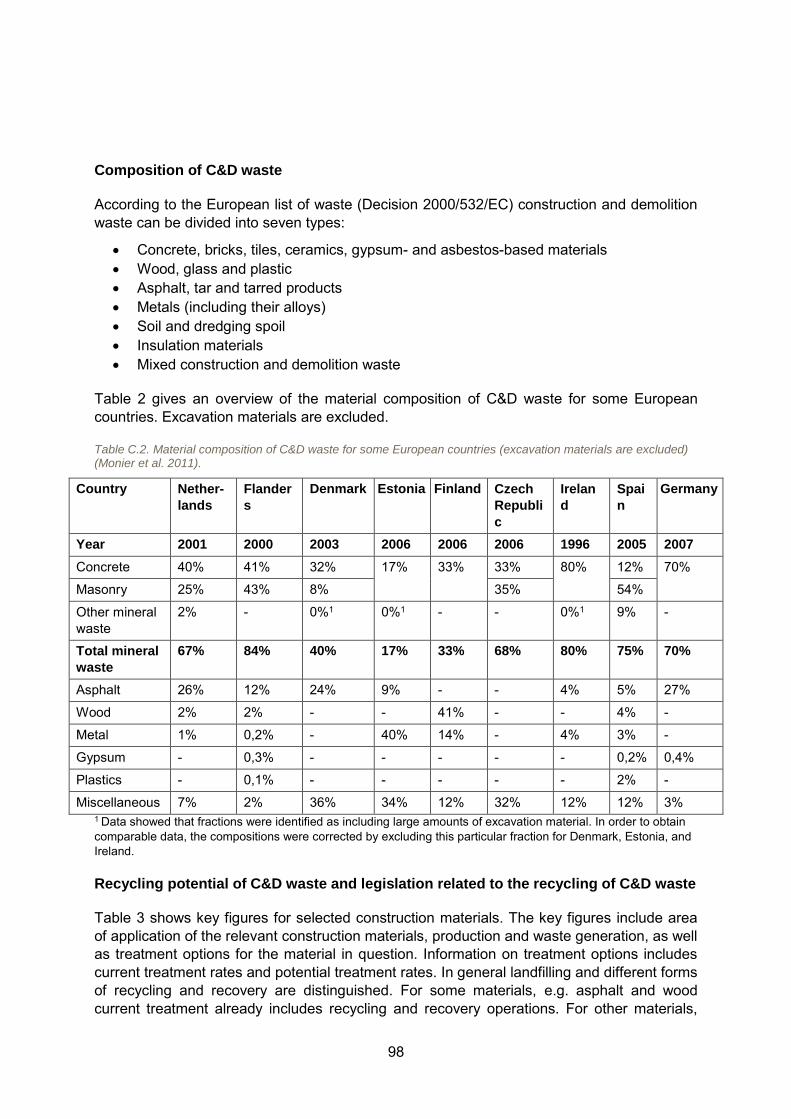
98
Composition of C&D waste
According to the European list of waste (Decision 2000/532/EC) construction and demolition waste can be divided into seven types:
Concrete, bricks, tiles, ceramics, gypsum- and asbestos-based materials Wood, glass and plastic Asphalt, tar and tarred products Metals (including their alloys) Soil and dredging spoil Insulation materials Mixed construction and demolition waste
Table 2 gives an overview of the material composition of C&D waste for some European countries. Excavation materials are excluded.
Table C.2. Material composition of C&D waste for some European countries (excavation materials are excluded) (Monier et al. 2011).
Country Nether-
lands
Flander
s
Denmark Estonia Finland Czech
Republi
c
Irelan
d
Spai
n
Germany
Year 2001 2000 2003 2006 2006 2006 1996 2005 2007
Concrete 40% 41% 32% 17% 33% 33% 80% 12% 70%
Masonry 25% 43% 8% 35% 54%
Other mineral waste
2% - 0%1 0%1 - - 0%1 9% -
Total mineral
waste
67% 84% 40% 17% 33% 68% 80% 75% 70%
Asphalt 26% 12% 24% 9% - - 4% 5% 27%
Wood 2% 2% - - 41% - - 4% -
Metal 1% 0,2% - 40% 14% - 4% 3% -
Gypsum - 0,3% - - - - - 0,2% 0,4%
Plastics - 0,1% - - - - - 2% -
Miscellaneous 7% 2% 36% 34% 12% 32% 12% 12% 3% 1 Data showed that fractions were identified as including large amounts of excavation material. In order to obtain comparable data, the compositions were corrected by excluding this particular fraction for Denmark, Estonia, and Ireland.
Recycling potential of C&D waste and legislation related to the recycling of C&D waste
Table 3 shows key figures for selected construction materials. The key figures include area of application of the relevant construction materials, production and waste generation, as well as treatment options for the material in question. Information on treatment options includes current treatment rates and potential treatment rates. In general landfilling and different forms of recycling and recovery are distinguished. For some materials, e.g. asphalt and wood current treatment already includes recycling and recovery operations. For other materials,
99
such as concrete, there is potential for diverting the waste from landfilling and increasing recycling rates.
However, the availability of raw/virgin materials at low costs and low landfilling taxes in many cases discourages recycling (Table 4). In some cases there is also a misconception of the quality of recycled products compared to new materials, which will make it difficult to market the recycled products.
In order to ensure the quality of recycled materials and to reduce their market price there is a need for deconstruction (instead of demolition) and sorting at source. Furthermore, landfill bans or an increase in landfill taxes would create an incentive to re-use/recover and recycle more. Combined with quality certification and specifications for the recycled products this would create drivers for the application of recycled products.
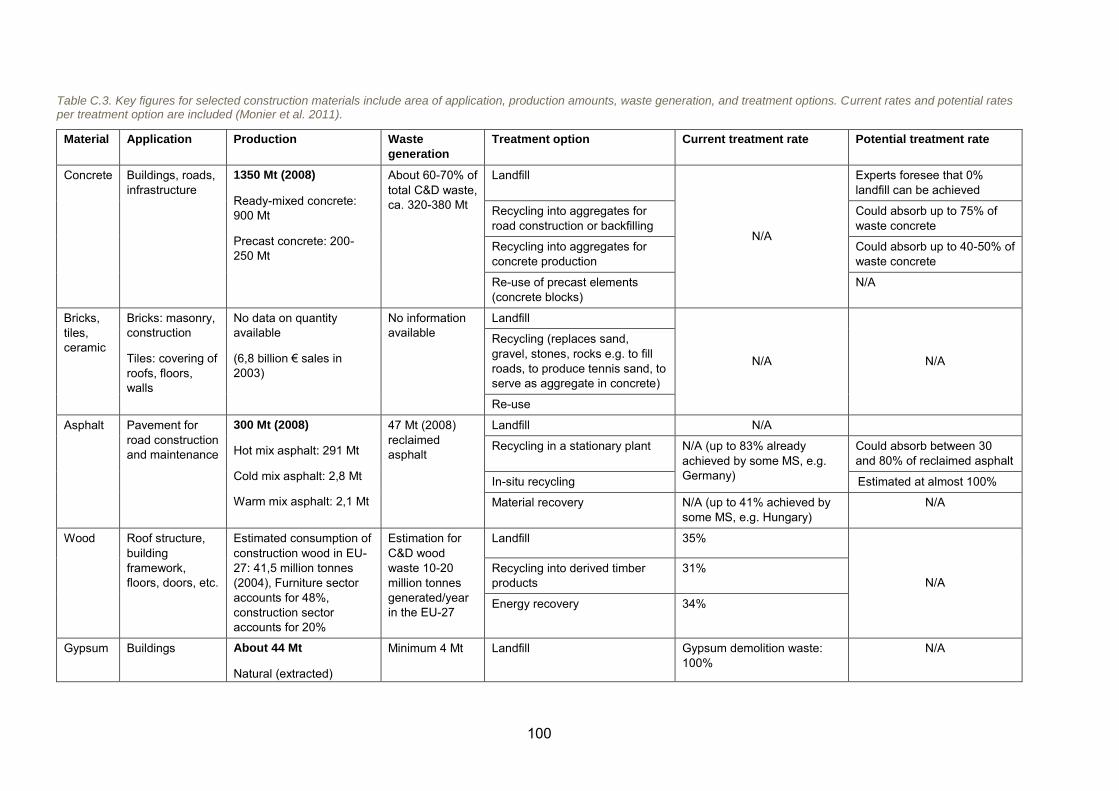
100
Table C.3. Key figures for selected construction materials include area of application, production amounts, waste generation, and treatment options. Current rates and potential rates per treatment option are included (Monier et al. 2011).
Material Application Production Waste
generation
Treatment option Current treatment rate Potential treatment rate
Concrete Buildings, roads, infrastructure
1350 Mt (2008)
Ready-mixed concrete: 900 Mt
Precast concrete: 200-250 Mt
About 60-70% of total C&D waste, ca. 320-380 Mt
Landfill
N/A
Experts foresee that 0% landfill can be achieved
Recycling into aggregates for road construction or backfilling
Could absorb up to 75% of waste concrete
Recycling into aggregates for concrete production
Could absorb up to 40-50% of waste concrete
Re-use of precast elements (concrete blocks)
N/A
Bricks, tiles, ceramic
Bricks: masonry, construction
Tiles: covering of roofs, floors, walls
No data on quantity available
(6,8 billion € sales in 2003)
No information available
Landfill
N/A N/A
Recycling (replaces sand, gravel, stones, rocks e.g. to fill roads, to produce tennis sand, to serve as aggregate in concrete)
Re-use
Asphalt Pavement for road construction and maintenance
300 Mt (2008)
Hot mix asphalt: 291 Mt
Cold mix asphalt: 2,8 Mt
Warm mix asphalt: 2,1 Mt
47 Mt (2008) reclaimed asphalt
Landfill N/A
Recycling in a stationary plant N/A (up to 83% already achieved by some MS, e.g. Germany)
Could absorb between 30 and 80% of reclaimed asphalt
In-situ recycling Estimated at almost 100%
Material recovery N/A (up to 41% achieved by some MS, e.g. Hungary)
N/A
Wood Roof structure, building framework, floors, doors, etc.
Estimated consumption of construction wood in EU-27: 41,5 million tonnes (2004), Furniture sector accounts for 48%, construction sector accounts for 20%
Estimation for C&D wood waste 10-20 million tonnes generated/year in the EU-27
Landfill 35%
N/A Recycling into derived timber products
31%
Energy recovery 34%
Gypsum Buildings About 44 Mt
Natural (extracted)
Minimum 4 Mt Landfill Gypsum demolition waste: 100%
N/A
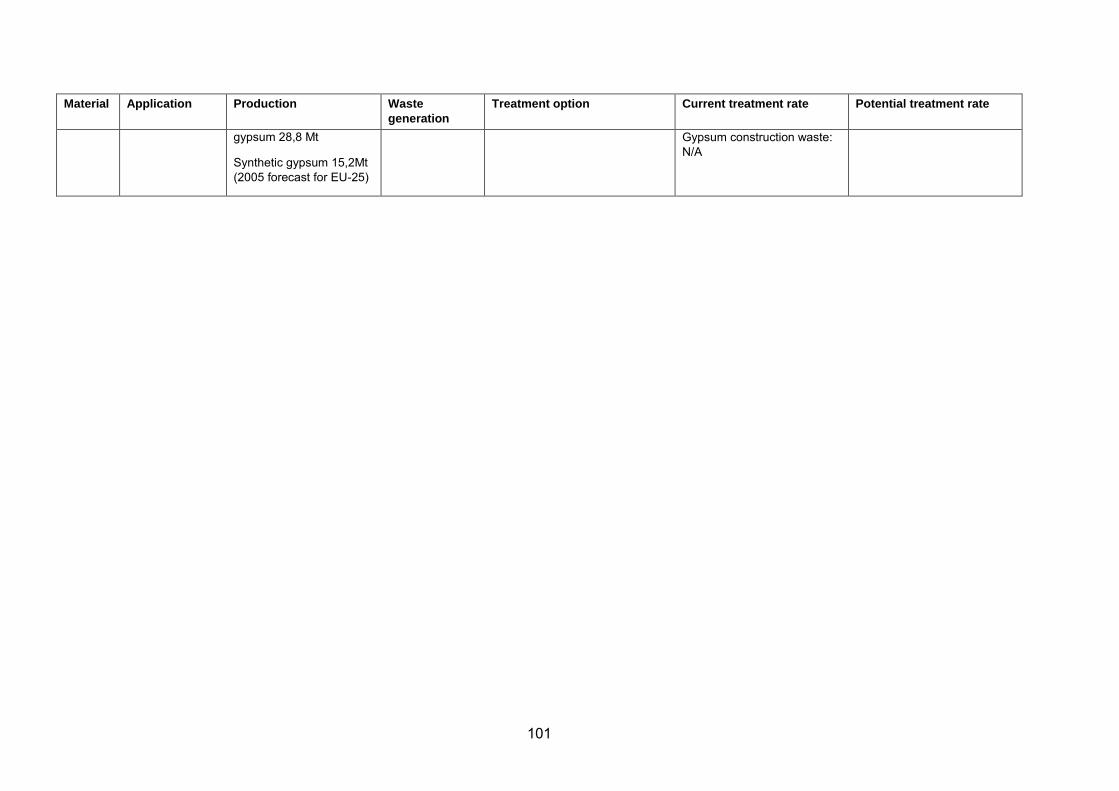
101
Material Application Production Waste
generation
Treatment option Current treatment rate Potential treatment rate
gypsum 28,8 Mt
Synthetic gypsum 15,2Mt (2005 forecast for EU-25)
Gypsum construction waste: N/A
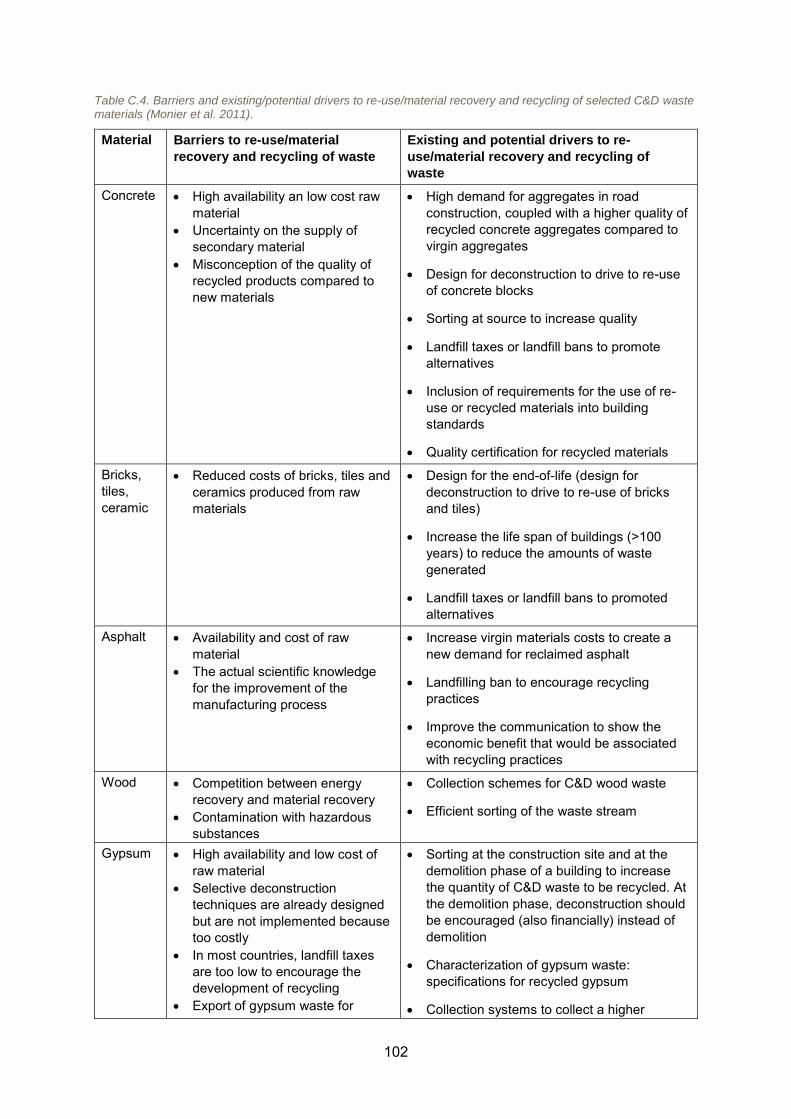
102
Table C.4. Barriers and existing/potential drivers to re-use/material recovery and recycling of selected C&D waste materials (Monier et al. 2011).
Material Barriers to re-use/material
recovery and recycling of waste
Existing and potential drivers to re-
use/material recovery and recycling of
waste
Concrete High availability an low cost raw material
Uncertainty on the supply of secondary material
Misconception of the quality of recycled products compared to new materials
High demand for aggregates in road construction, coupled with a higher quality of recycled concrete aggregates compared to virgin aggregates
Design for deconstruction to drive to re-use of concrete blocks
Sorting at source to increase quality
Landfill taxes or landfill bans to promote alternatives
Inclusion of requirements for the use of re-use or recycled materials into building standards
Quality certification for recycled materials
Bricks, tiles, ceramic
Reduced costs of bricks, tiles and ceramics produced from raw materials
Design for the end-of-life (design for deconstruction to drive to re-use of bricks and tiles)
Increase the life span of buildings (>100 years) to reduce the amounts of waste generated
Landfill taxes or landfill bans to promoted alternatives
Asphalt Availability and cost of raw material
The actual scientific knowledge for the improvement of the manufacturing process
Increase virgin materials costs to create a new demand for reclaimed asphalt
Landfilling ban to encourage recycling practices
Improve the communication to show the economic benefit that would be associated with recycling practices
Wood Competition between energy recovery and material recovery
Contamination with hazardous substances
Collection schemes for C&D wood waste
Efficient sorting of the waste stream
Gypsum High availability and low cost of raw material
Selective deconstruction techniques are already designed but are not implemented because too costly
In most countries, landfill taxes are too low to encourage the development of recycling
Export of gypsum waste for
Sorting at the construction site and at the demolition phase of a building to increase the quantity of C&D waste to be recycled. At the demolition phase, deconstruction should be encouraged (also financially) instead of demolition
Characterization of gypsum waste: specifications for recycled gypsum
Collection systems to collect a higher

103
backfilling (e.g. former salt mines in Germany)
The manufacturing processes currently do not allow the re-introduction of a higher recycled gypsum powder content
amount of gypsum waste
R&D to adapt the manufacturing processes in order to allow the re-introduction of a higher recycled gypsum powder content
Higher and harmonized landfill taxes across the EU to push for other alternatives
Availability of public amenity sites/public waste recycling centers
104
References
Decision 2000/532/EC. Commission Decision of 3 May 2000 replacing Decision 94/3/EC establishing a list of wastes pursuant to Article 1(a) of Council Directive 75/442/EEC on waste and Council Decision 94/904/EC establishing a list of hazardous waste pursuant to Article 1(4) of Council Directive 91/689/EEC on hazardous waste, http://eur-lex.europa.eu/LexUriServ/LexUriServ.do?uri=OJ:L:2000:226:0003:0024:EN:PDF
Monier, V. et al. 2011. Study on the management of construction and demolition waste in the EU. Final report for the European Commission (DG Environment).
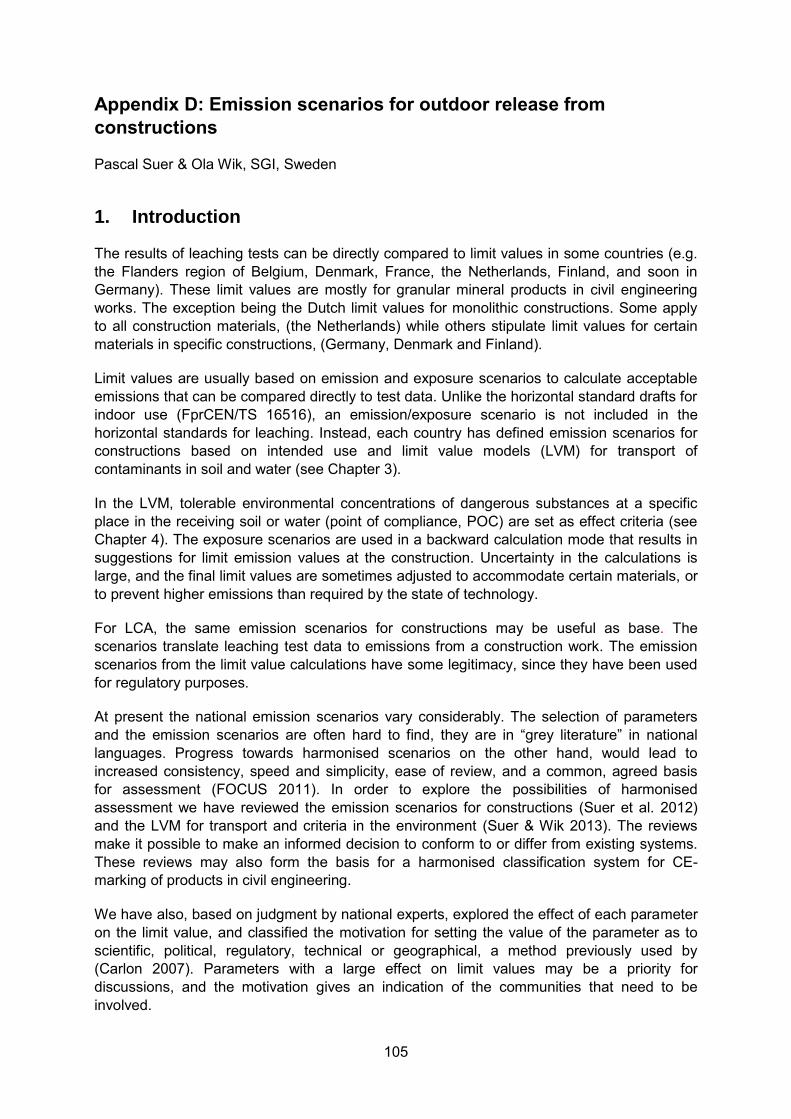
105
Appendix D: Emission scenarios for outdoor release from
constructions
Pascal Suer & Ola Wik, SGI, Sweden
1. Introduction
The results of leaching tests can be directly compared to limit values in some countries (e.g. the Flanders region of Belgium, Denmark, France, the Netherlands, Finland, and soon in Germany). These limit values are mostly for granular mineral products in civil engineering works. The exception being the Dutch limit values for monolithic constructions. Some apply to all construction materials, (the Netherlands) while others stipulate limit values for certain materials in specific constructions, (Germany, Denmark and Finland).
Limit values are usually based on emission and exposure scenarios to calculate acceptable emissions that can be compared directly to test data. Unlike the horizontal standard drafts for indoor use (FprCEN/TS 16516), an emission/exposure scenario is not included in the horizontal standards for leaching. Instead, each country has defined emission scenarios for constructions based on intended use and limit value models (LVM) for transport of contaminants in soil and water (see Chapter 3).
In the LVM, tolerable environmental concentrations of dangerous substances at a specific place in the receiving soil or water (point of compliance, POC) are set as effect criteria (see Chapter 4). The exposure scenarios are used in a backward calculation mode that results in suggestions for limit emission values at the construction. Uncertainty in the calculations is large, and the final limit values are sometimes adjusted to accommodate certain materials, or to prevent higher emissions than required by the state of technology.
For LCA, the same emission scenarios for constructions may be useful as base. The scenarios translate leaching test data to emissions from a construction work. The emission scenarios from the limit value calculations have some legitimacy, since they have been used for regulatory purposes.
At present the national emission scenarios vary considerably. The selection of parameters and the emission scenarios are often hard to find, they are in “grey literature” in national languages. Progress towards harmonised scenarios on the other hand, would lead to increased consistency, speed and simplicity, ease of review, and a common, agreed basis for assessment (FOCUS 2011). In order to explore the possibilities of harmonised assessment we have reviewed the emission scenarios for constructions (Suer et al. 2012) and the LVM for transport and criteria in the environment (Suer & Wik 2013). The reviews make it possible to make an informed decision to conform to or differ from existing systems. These reviews may also form the basis for a harmonised classification system for CE-marking of products in civil engineering.
We have also, based on judgment by national experts, explored the effect of each parameter on the limit value, and classified the motivation for setting the value of the parameter as to scientific, political, regulatory, technical or geographical, a method previously used by (Carlon 2007). Parameters with a large effect on limit values may be a priority for discussions, and the motivation gives an indication of the communities that need to be involved.
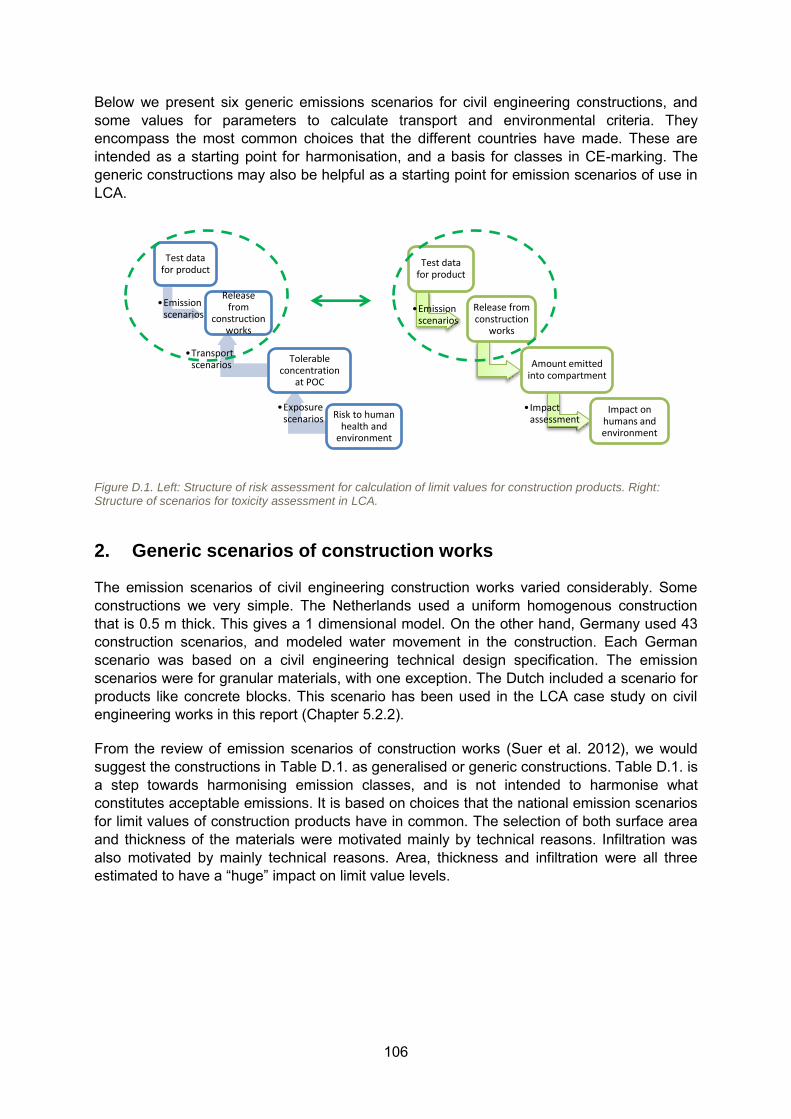
106
Below we present six generic emissions scenarios for civil engineering constructions, and some values for parameters to calculate transport and environmental criteria. They encompass the most common choices that the different countries have made. These are intended as a starting point for harmonisation, and a basis for classes in CE-marking. The generic constructions may also be helpful as a starting point for emission scenarios of use in LCA.
Figure D.1. Left: Structure of risk assessment for calculation of limit values for construction products. Right: Structure of scenarios for toxicity assessment in LCA.
2. Generic scenarios of construction works
The emission scenarios of civil engineering construction works varied considerably. Some constructions we very simple. The Netherlands used a uniform homogenous construction that is 0.5 m thick. This gives a 1 dimensional model. On the other hand, Germany used 43 construction scenarios, and modeled water movement in the construction. Each German scenario was based on a civil engineering technical design specification. The emission scenarios were for granular materials, with one exception. The Dutch included a scenario for products like concrete blocks. This scenario has been used in the LCA case study on civil engineering works in this report (Chapter 5.2.2).
From the review of emission scenarios of construction works (Suer et al. 2012), we would suggest the constructions in Table D.1. as generalised or generic constructions. Table D.1. is a step towards harmonising emission classes, and is not intended to harmonise what constitutes acceptable emissions. It is based on choices that the national emission scenarios for limit values of construction products have in common. The selection of both surface area and thickness of the materials were motivated mainly by technical reasons. Infiltration was also motivated by mainly technical reasons. Area, thickness and infiltration were all three estimated to have a “huge” impact on limit value levels.
Test data for product
•Emission scenarios
Release from
construction works
•Transport scenarios
Tolerable concentration
at POC
•Exposure scenarios Risk to human
health and environment
Test data for product
•Emission scenarios
Release from construction
works
Amount emitted into compartment
•Impact assessment
Impact on humans and environment
107
Table D.1. Proposed generalised harmonised constructions for granular materials in civil engineering works (Suer et al. 2013).
Construction
Width
(m)
Length
(m)
Thickness
of product
(m)
Infiltration
(mm/yr)
A. Paved road 10 ∞ 0.5 50
B. Covered linear element 10 ∞ 5 300
C. Confined linear element 10 ∞ 2 6
D. Paved area 150 150 1 50
E. Covered area ∞ ∞ 1 300
F. Exposed area ∞ ∞ 1 1000
A width of 10 m for a road or linear element corresponds to the French model. It is also within the range of widths for German constructions. The combination of a fixed width with an infinite length simplifies the calculations of the LVM to a 2-D model. The finite paved area, 150 × 150 m2, is according to the waste acceptance criteria (WAC, 2003/33/EC) and French models. The Swedish model had a slightly larger area. A finite area requires 3-D modelling if the POC is situated far from the edge of the construction while an infinite area simplifies the calculations of the LVM to a 1-D model.
The thickness of product layers for roads varied much between the LVMs, between 0.03 and 6 m. A 0.5 m thick product layer (as suggested for a harmonised road in Table D.1. corresponds to the Dutch model for granular materials. The 5 m thick covered linear element, e.g. a sound barrier, is used in the French guidelines and the Dutch application for soil. Germany and Denmark used similar constructions of up to 4 m thickness. If, like in the Dutch confined application, a confined application is used in order to allow the use of materials with high leaching, the product layer will likely be thicker than in a normal road, since resources are used to confine the application. 2 m was taken from such a confined construction in the review. A confined application for other purposes, such as foundations of buildings, would normally be thinner. Finally, for infinite areas, we suggest 1 m thickness, equivalent with the paved area.
Net infiltration of 300 mm/yr was widespread among the models (French, Dutch, Swedish, WAC, and the lower limit for the German models). We suggest it as the infiltration for materials that are not used at the surface of a construction but are covered with other materials. Pavement such as asphalt or concrete reduces infiltration. For paved constructions we suggest 50 mm/yr, as selected in the French model. The confined linear element corresponds to the Dutch application where granular materials are sealed and isolated inside a construction, with infiltration 6 mm/yr. This leads to high limit values and the Dutch combine this with a management system. A fourth option for infiltration, 1000 mm/yr, was added. This is an approximation of rainfall, without evapotranspiration, and close to the German road shoulder emission scenario.
For more information on the detailed scenarios for the constructions, how they relate to the CPR and life cycle stages, and references to relevant literature, see (Suer et al. 2012).
108
3. Transport of dangerous substances in limit value models and
suggestions for harmonisation work
LVMs simulate the transport of the emissions from the constructions (see Chapter 2) to a point of compliance (POC). The models usually include transport, time, retention and dilution. The POCs are shown in Figure D.3, which also indicates the transport distance in the soil. The criteria that are used in the POC are discussed in Section D.4. Dangerous substances interact with the soil and water underway. They can be retained by the soil, clean groundwater can dilute the emissions from the construction, and organic substances can be degraded. Most LVMs have been calculated for inorganic substances (metals and salts), where degradation is irrelevant.
The highest impact on the limit values has been linked to parameters for retention in the soil, dilution in the groundwater, thickness of the aquifer, and the timeframe of the assessment (Suer et al 2013).
A distribution coefficient (Kd) is often used to calculate how substances are retained by soil. Variation of distribution coefficients between the national LVMs was up to 4 orders of magnitude (Figure D.2). Motivation to set the Kd was mainly scientific, with a geographical component. Geographical variation of the retention properties is large, however the variation of Kd within a country is likely as large as the variation between countries, since soil type determines the Kd.
The Netherlands tested geochemical modelling in parallel with Kd modelling in their LVM. The models agreed for very mobile and very immobile substances, but not for substances of intermediate mobility (Verschoor et al. 2008). Retention in the soil is described through organic content, clay content, and content of iron oxides (together with standard database data for each substance). This focusses harmonisation attempts on the soil type, a more appropriate approach than on the geographical variation e.g. the nth percentile of national measured Kd-values.
Dilution of leachate with clean groundwater reduces the concentration of dangerous substances. The dilution is dependent on the size of the aquifer. Some LVMs simulated a fixed flow of groundwater from upstream the construction. Others simulated a catchment area with precipitation. A construction with an infinite surface has no dilution. This is the case for the unrestricted area scenarios in Table D.1., and the Dutch and Flemish LVMs.
Duration of the emissions will influence peak concentrations in the groundwater, but even more so the concentrations in the soil. Metals generally accumulate in the soil as long as a construction is present on top of the soil. Emissions from a construction usually decrease with time, but since metals accumulate in the soil it takes a very long time before a peak concentration is reached. Those that consider the soil as a POC used 100 or 200 years for emissions. The product category rules for EPD, EN 15804, set the time for consideration of impacts to 100 years. We would suggest harmonisation with the EPD standard and use a duration of emissions of 100 years.
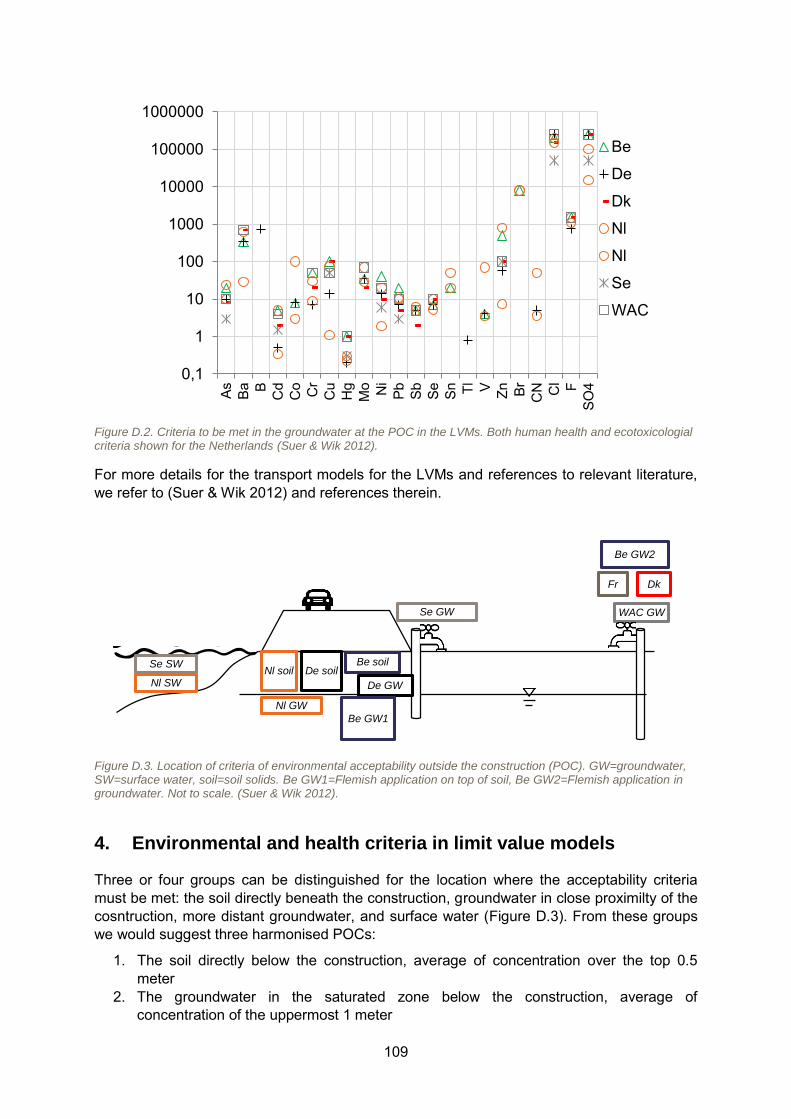
109
Figure D.2. Criteria to be met in the groundwater at the POC in the LVMs. Both human health and ecotoxicologial criteria shown for the Netherlands (Suer & Wik 2012).
For more details for the transport models for the LVMs and references to relevant literature, we refer to (Suer & Wik 2012) and references therein.
Figure D.3. Location of criteria of environmental acceptability outside the construction (POC). GW=groundwater, SW=surface water, soil=soil solids. Be GW1=Flemish application on top of soil, Be GW2=Flemish application in groundwater. Not to scale. (Suer & Wik 2012).
4. Environmental and health criteria in limit value models
Three or four groups can be distinguished for the location where the acceptability criteria must be met: the soil directly beneath the construction, groundwater in close proximilty of the cosntruction, more distant groundwater, and surface water (Figure D.3). From these groups we would suggest three harmonised POCs:
1. The soil directly below the construction, average of concentration over the top 0.5 meter
2. The groundwater in the saturated zone below the construction, average of concentration of the uppermost 1 meter
0,1
1
10
100
1000
10000
100000
1000000
As Ba B Cd
Co Cr
Cu
Hg
Mo Ni
Pb Sb Se Sn Tl V Zn Br CN Cl F
SO4
Be
De
Dk
Nl
Nl
Se
WAC
Nl soil
Se GW
Dk
Se SW
WAC GW
Fr
Nl GW
De soil Nl SW De GW
Be soil
Be GW1
Be GW2
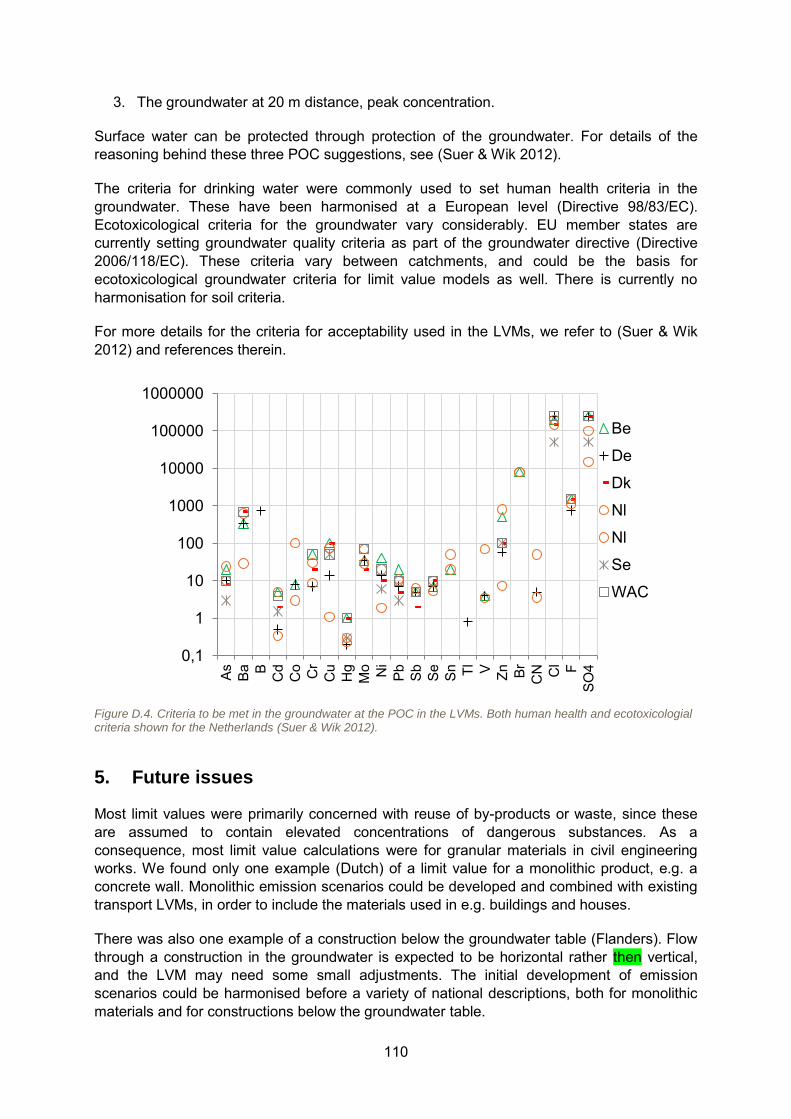
110
3. The groundwater at 20 m distance, peak concentration.
Surface water can be protected through protection of the groundwater. For details of the reasoning behind these three POC suggestions, see (Suer & Wik 2012).
The criteria for drinking water were commonly used to set human health criteria in the groundwater. These have been harmonised at a European level (Directive 98/83/EC). Ecotoxicological criteria for the groundwater vary considerably. EU member states are currently setting groundwater quality criteria as part of the groundwater directive (Directive 2006/118/EC). These criteria vary between catchments, and could be the basis for ecotoxicological groundwater criteria for limit value models as well. There is currently no harmonisation for soil criteria.
For more details for the criteria for acceptability used in the LVMs, we refer to (Suer & Wik 2012) and references therein.
Figure D.4. Criteria to be met in the groundwater at the POC in the LVMs. Both human health and ecotoxicologial criteria shown for the Netherlands (Suer & Wik 2012).
5. Future issues
Most limit values were primarily concerned with reuse of by-products or waste, since these are assumed to contain elevated concentrations of dangerous substances. As a consequence, most limit value calculations were for granular materials in civil engineering works. We found only one example (Dutch) of a limit value for a monolithic product, e.g. a concrete wall. Monolithic emission scenarios could be developed and combined with existing transport LVMs, in order to include the materials used in e.g. buildings and houses.
There was also one example of a construction below the groundwater table (Flanders). Flow through a construction in the groundwater is expected to be horizontal rather then vertical, and the LVM may need some small adjustments. The initial development of emission scenarios could be harmonised before a variety of national descriptions, both for monolithic materials and for constructions below the groundwater table.
0,1
1
10
100
1000
10000
100000
1000000
As Ba B Cd
Co Cr
Cu
Hg
Mo Ni
Pb Sb Se Sn Tl V Zn Br CN Cl F
SO4
Be
De
Dk
Nl
Nl
Se
WAC
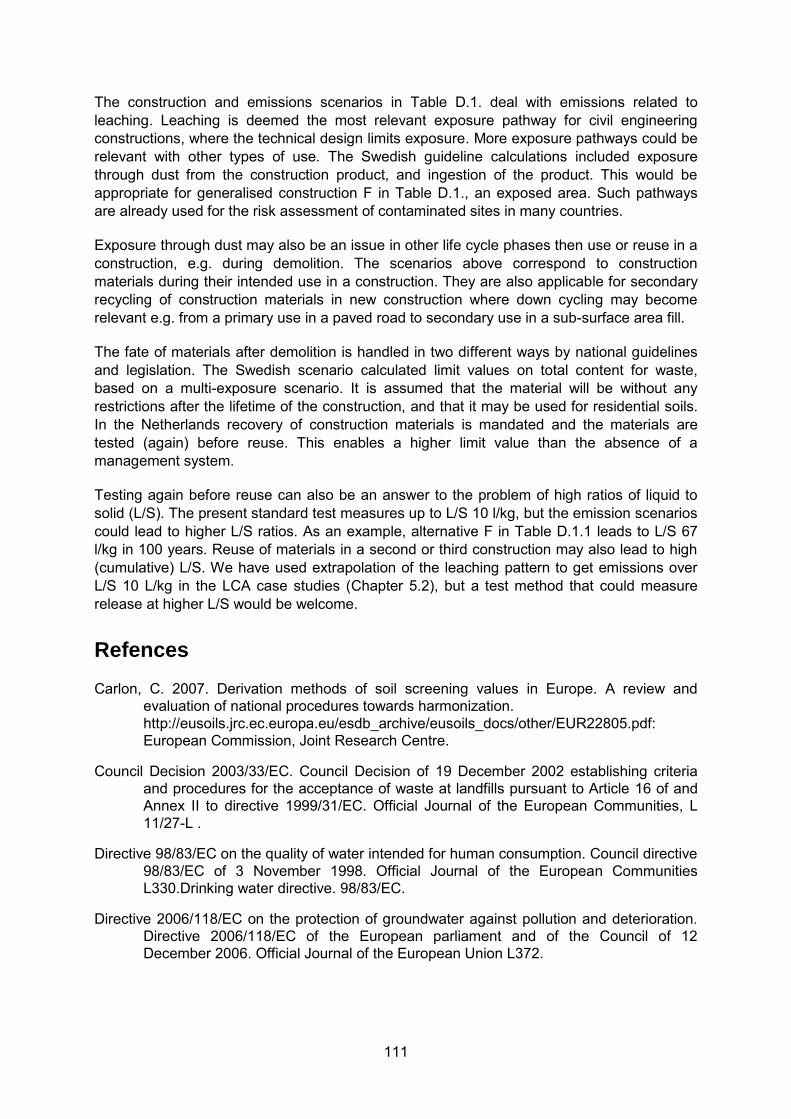
111
The construction and emissions scenarios in Table D.1. deal with emissions related to leaching. Leaching is deemed the most relevant exposure pathway for civil engineering constructions, where the technical design limits exposure. More exposure pathways could be relevant with other types of use. The Swedish guideline calculations included exposure through dust from the construction product, and ingestion of the product. This would be appropriate for generalised construction F in Table D.1., an exposed area. Such pathways are already used for the risk assessment of contaminated sites in many countries.
Exposure through dust may also be an issue in other life cycle phases then use or reuse in a construction, e.g. during demolition. The scenarios above correspond to construction materials during their intended use in a construction. They are also applicable for secondary recycling of construction materials in new construction where down cycling may become relevant e.g. from a primary use in a paved road to secondary use in a sub-surface area fill.
The fate of materials after demolition is handled in two different ways by national guidelines and legislation. The Swedish scenario calculated limit values on total content for waste, based on a multi-exposure scenario. It is assumed that the material will be without any restrictions after the lifetime of the construction, and that it may be used for residential soils. In the Netherlands recovery of construction materials is mandated and the materials are tested (again) before reuse. This enables a higher limit value than the absence of a management system.
Testing again before reuse can also be an answer to the problem of high ratios of liquid to solid (L/S). The present standard test measures up to L/S 10 l/kg, but the emission scenarios could lead to higher L/S ratios. As an example, alternative F in Table D.1.1 leads to L/S 67 l/kg in 100 years. Reuse of materials in a second or third construction may also lead to high (cumulative) L/S. We have used extrapolation of the leaching pattern to get emissions over L/S 10 L/kg in the LCA case studies (Chapter 5.2), but a test method that could measure release at higher L/S would be welcome.
Refences
Carlon, C. 2007. Derivation methods of soil screening values in Europe. A review and evaluation of national procedures towards harmonization. http://eusoils.jrc.ec.europa.eu/esdb_archive/eusoils_docs/other/EUR22805.pdf: European Commission, Joint Research Centre.
Council Decision 2003/33/EC. Council Decision of 19 December 2002 establishing criteria and procedures for the acceptance of waste at landfills pursuant to Article 16 of and Annex II to directive 1999/31/EC. Official Journal of the European Communities, L 11/27-L .
Directive 98/83/EC on the quality of water intended for human consumption. Council directive 98/83/EC of 3 November 1998. Official Journal of the European Communities L330.Drinking water directive. 98/83/EC.
Directive 2006/118/EC on the protection of groundwater against pollution and deterioration. Directive 2006/118/EC of the European parliament and of the Council of 12 December 2006. Official Journal of the European Union L372.
112
FOCUS. 2011. Generic Guidance for Tier 1 FOCUS Ground Water Assessments. http://viso.ei.jrc.it/focus/gw: Forum for Co-ordination of pesticide fate models and their USe.
Suer, P. & Wik, O. 2013. Prel. title: Limit values for construction products - Part II - Review of transport models. Manuscript.
113
Appendix E: The assessment of toxicity in LCA
Andreas Jørgensen
Department of Management Engineering, Technical University of Denmark, Produktionstorvet 426, DK-2800 Kgs. Lyngby, Denmark
1. LCA and LCIA
Life cycle assessment (LCA) is a methodology for assessing the environmental impacts of a product or service over the entire life cycle, from the extraction of raw resources to the waste disposal. The methodology has been standardized in ISO standard 14044 (2006). The benefit from including the entire life cycle in the assessment is that the LCA creates a holistic picture of the entire environmental impact that a product causes. Having this overview enables an environmental comparison of products and the possibility for identifying whether changes in the product life cycle will lead to overall environmental benefits or whether these changes will simply lead to improvements in one part of the life cycle but at the same time imposing new environmental impacts in other parts of the life cycle.
To assess the environmental impacts of a product over its entire life cycle, the LCA includes an inventory step where all substances entering or leaving processes in the product life cycle (known as flows) are inventoried. In many cases, these inventories may contain from several hundred to thousands of different flows. Both because of the number of flows and because of the difficulties in assessing the importance of these flows for laymen, this information may be difficult to use directly in a decision making context. Therefore, the LCA also includes a life cycle impact assessment (LCIA) step, where flows are ‘translated’ into the environmental impacts that they cause. Depending on LCIA method, the number of impact categories typically vary around 10–15, including local impacts such as land use, regional impacts as e.g. toxic substances, acidification or photochemical oxidants and global impacts as climate change. The LCIA step thus significantly reduces the complexity of the inventoried flows. The ‘translation’ is performed through giving each flow a characterization factor (CF) for the environmental impacts that the flow contributes to. The CF indicates the potency of the flow compared to a reference substance. For example, in relation to global warming, CO2 is the reference substance, which is given the CF of 1, and methane, which is equally a greenhouse gas, but much more potent is given a CF of 25 (g CO2 equivalents/g methane). Having assigned the relevant CFs the environmental impacts in each of the impact categories can then be calculated:
𝐼𝑆 = ∑ ∑ 𝐶𝐹𝑥,𝑖 × 𝑀𝑥,𝑖
𝑥𝑖
where IS is the impact score for each impact category; CFx,i the CF of substance x released to compartment i and Mx,i the emission of x to compartment i.
Given that the emitted mass is found in the inventory analysis, to calculate the impact score, the CFs and their calculation are therefore the absolutely central part of the LCIA. How CFs are calculated depends on the impact category.
The purpose of this appendix is to outline how state-of-the-art CFs are calculated for the human and ecotoxicity impact categories, including discussions about central assumptions in these calculations. Furthermore, as LCA is only one methodology for assessing the toxicity
114
aspects related to products, the chapter will also give a comparison of LCA and environmental risk assessment (RA), which can equally be used to assess toxic impacts from an emission.
2. A short overview of assessment of toxicity in LCA
The assessment of toxicity in LCA relates both to human as well as ecosystem toxicity. The assessment of toxicity in LCA has for many years been hampered by disagreement in the scientific community about how to model toxic impacts in LCA, resulting in a large number of methods for calculating CFs (Guinée & Hauschild 2005) yielding very different CF results, and each model only providing CFs for a limited number of substances. Because of this, many LCA users have chosen to exclude toxicity related impact categories from their assessment.
As a response to this plurality in how to assess toxicity in LCA, and based on the assumption that the field was mature for development of joint recommendations, in 2003, an international consensus process was initiated under the United Nations Environment Program (UNEP) and the Society of Environmental Toxicology and Chemistry (SETAC).The process involved a group of internationally recognized method developers responsible for the most commonly used methods worldwide, including experts in fate and transport of chemicals, exposure assessment, health risk assessment, and ecotoxicology. During the consensus process a model comparison was performed and it was analysed which method elements contribute most to the relative magnitude of toxicity related CFs for the different existing human and ecotoxicity characterization models. The consensus process was successful in harmonizing these elements into an entirely new model which not only narrowed the possible variability of CFs but also led to a more transparent and parsimonious, well documented method. The method was named USEtox in recognition of the UNEP-SETAC Life Cycle Initiative under which it was developed. The model is supported by all participating model teams as a basis for future global recommendations of LCIA characterization factors (Rosenbaum et al. 2008).
The USEtox model covers the assessment of toxicity to humans and freshwater. Toxicity to marine and terrestrial systems is not included in USEtox but handled by other characterization methods such as CML and ReCiPe that are based on the USES-LCA model. With regards to toxicity to humans and freshwater, USEtox is considered the state-of-the-art method for calculating CFs. For the calculation of toxicity to terrestrial and marine systems, the USES-LCA model is considered state-of-the-art.
Below, we will outline how CFs are calculated for human and freshwater toxicity in USEtox and supplement these discussions with how terrestrial and marine toxicity is calculated in USES-LCA. This outline will serve as a basis for the discussion in section 5 about the problems and limitations in LCA to assess toxicity.
3. Calculation of CFs in USEtox
In USEtox, the calculation of CFs for substances is the product of a fate factor (FF), an exposure factor (XF) and an effect factor (EF):
𝐶𝐹 = 𝐹𝐹 ∙ 𝑋𝐹 ∙ 𝐸𝐹
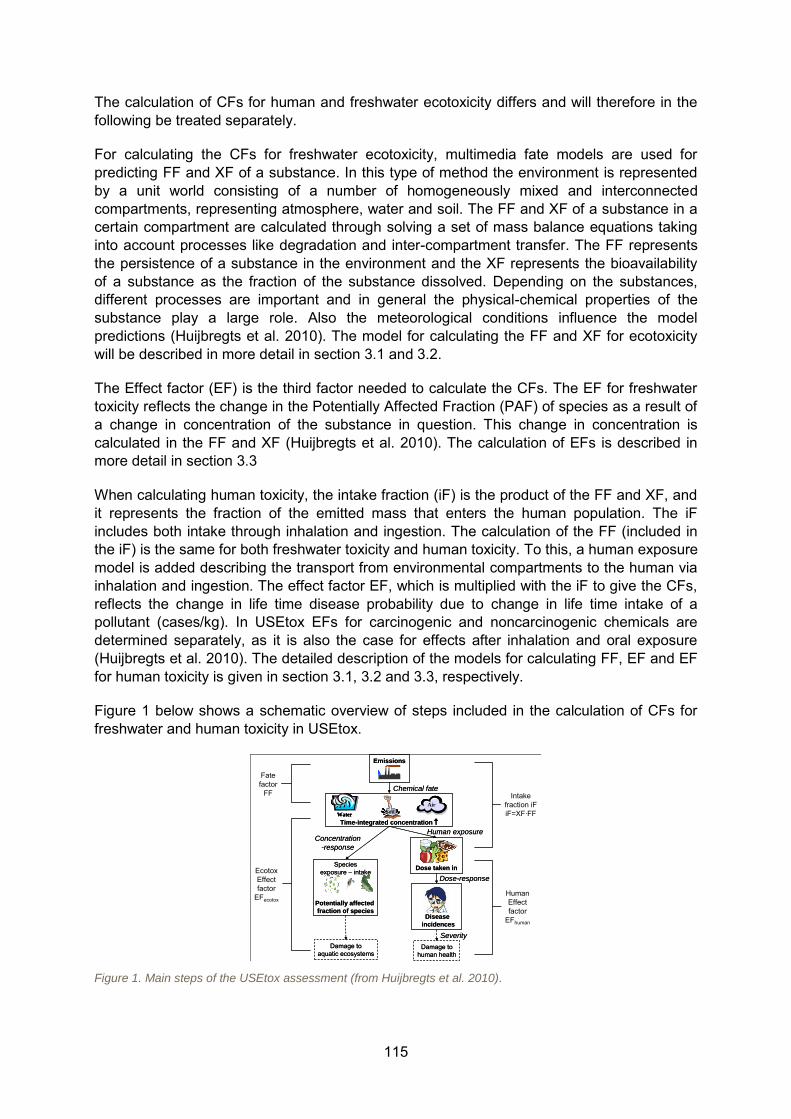
115
The calculation of CFs for human and freshwater ecotoxicity differs and will therefore in the following be treated separately.
For calculating the CFs for freshwater ecotoxicity, multimedia fate models are used for predicting FF and XF of a substance. In this type of method the environment is represented by a unit world consisting of a number of homogeneously mixed and interconnected compartments, representing atmosphere, water and soil. The FF and XF of a substance in a certain compartment are calculated through solving a set of mass balance equations taking into account processes like degradation and inter-compartment transfer. The FF represents the persistence of a substance in the environment and the XF represents the bioavailability of a substance as the fraction of the substance dissolved. Depending on the substances, different processes are important and in general the physical-chemical properties of the substance play a large role. Also the meteorological conditions influence the model predictions (Huijbregts et al. 2010). The model for calculating the FF and XF for ecotoxicity will be described in more detail in section 3.1 and 3.2.
The Effect factor (EF) is the third factor needed to calculate the CFs. The EF for freshwater toxicity reflects the change in the Potentially Affected Fraction (PAF) of species as a result of a change in concentration of the substance in question. This change in concentration is calculated in the FF and XF (Huijbregts et al. 2010). The calculation of EFs is described in more detail in section 3.3
When calculating human toxicity, the intake fraction (iF) is the product of the FF and XF, and it represents the fraction of the emitted mass that enters the human population. The iF includes both intake through inhalation and ingestion. The calculation of the FF (included in the iF) is the same for both freshwater toxicity and human toxicity. To this, a human exposure model is added describing the transport from environmental compartments to the human via inhalation and ingestion. The effect factor EF, which is multiplied with the iF to give the CFs, reflects the change in life time disease probability due to change in life time intake of a pollutant (cases/kg). In USEtox EFs for carcinogenic and noncarcinogenic chemicals are determined separately, as it is also the case for effects after inhalation and oral exposure (Huijbregts et al. 2010). The detailed description of the models for calculating FF, EF and EF for human toxicity is given in section 3.1, 3.2 and 3.3, respectively.
Figure 1 below shows a schematic overview of steps included in the calculation of CFs for freshwater and human toxicity in USEtox.
Figure 1. Main steps of the USEtox assessment (from Huijbregts et al. 2010).
Speciesexposure – intake
Potentially affected
fraction of species
Soil
Emissions
Time-integrated concentration
Dose taken in
Damage tohuman health
Chemical fate
Human exposure
Dose-response
Concentration
-response
Severity
Damage toaquatic ecosystems
Air
Water
Disease
incidences
Intakefraction iFiF=XF·FF
Human Effect factor
EFhuman
Fate factor
FF
EcotoxEffectfactor
EFecotox
Speciesexposure – intake
Potentially affected
fraction of species
SoilSoil
Emissions
Time-integrated concentration
Dose taken in
Damage tohuman health
Chemical fate
Human exposure
Dose-response
Concentration
-response
Severity
Damage toaquatic ecosystems
AirAir
WaterWater
Disease
incidences
Intakefraction iFiF=XF·FF
Human Effect factor
EFhuman
Fate factor
FF
EcotoxEffectfactor
EFecotox
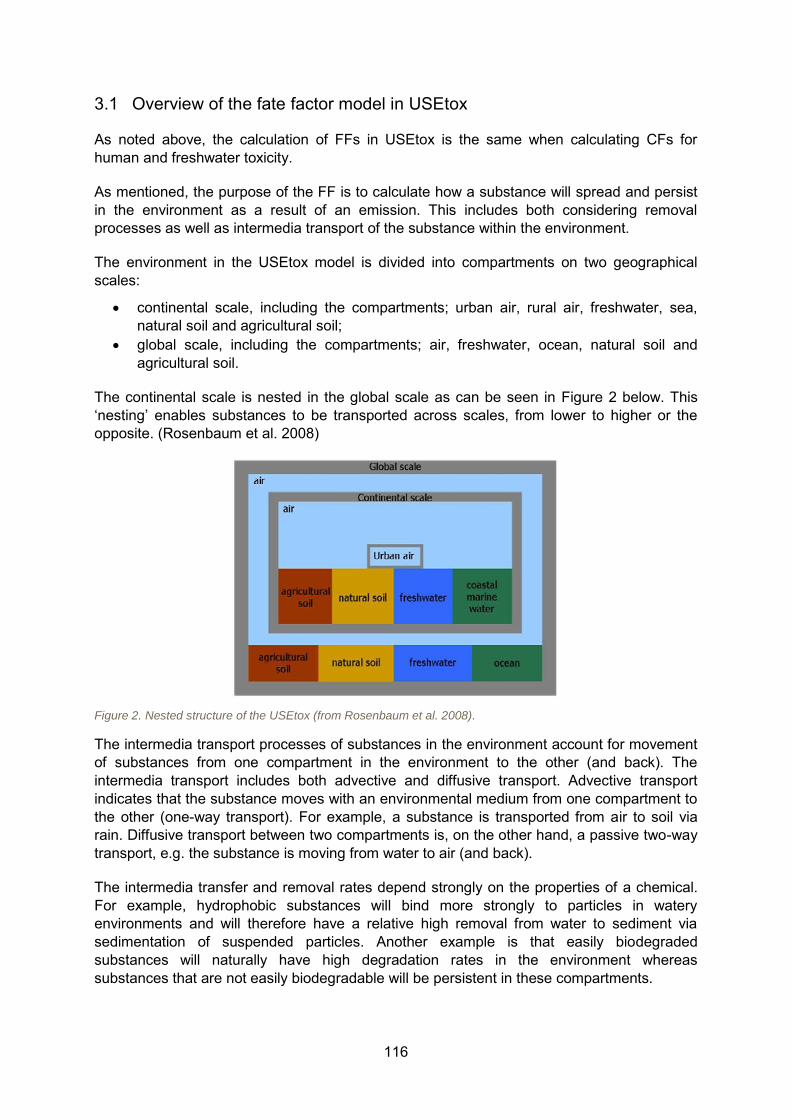
116
3.1 Overview of the fate factor model in USEtox
As noted above, the calculation of FFs in USEtox is the same when calculating CFs for human and freshwater toxicity.
As mentioned, the purpose of the FF is to calculate how a substance will spread and persist in the environment as a result of an emission. This includes both considering removal processes as well as intermedia transport of the substance within the environment.
The environment in the USEtox model is divided into compartments on two geographical scales:
continental scale, including the compartments; urban air, rural air, freshwater, sea, natural soil and agricultural soil;
global scale, including the compartments; air, freshwater, ocean, natural soil and agricultural soil.
The continental scale is nested in the global scale as can be seen in Figure 2 below. This ‘nesting’ enables substances to be transported across scales, from lower to higher or the opposite. (Rosenbaum et al. 2008)
Figure 2. Nested structure of the USEtox (from Rosenbaum et al. 2008).
The intermedia transport processes of substances in the environment account for movement of substances from one compartment in the environment to the other (and back). The intermedia transport includes both advective and diffusive transport. Advective transport indicates that the substance moves with an environmental medium from one compartment to the other (one-way transport). For example, a substance is transported from air to soil via rain. Diffusive transport between two compartments is, on the other hand, a passive two-way transport, e.g. the substance is moving from water to air (and back).
The intermedia transfer and removal rates depend strongly on the properties of a chemical. For example, hydrophobic substances will bind more strongly to particles in watery environments and will therefore have a relative high removal from water to sediment via sedimentation of suspended particles. Another example is that easily biodegraded substances will naturally have high degradation rates in the environment whereas substances that are not easily biodegradable will be persistent in these compartments.
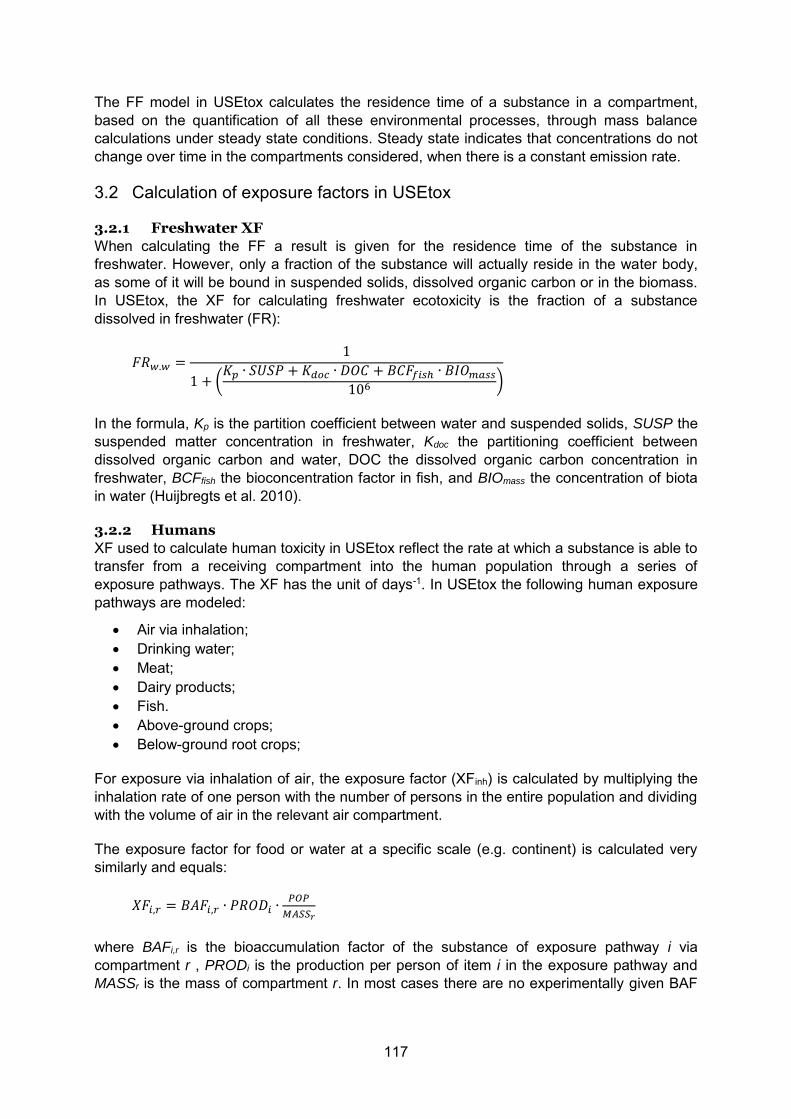
117
The FF model in USEtox calculates the residence time of a substance in a compartment, based on the quantification of all these environmental processes, through mass balance calculations under steady state conditions. Steady state indicates that concentrations do not change over time in the compartments considered, when there is a constant emission rate.
3.2 Calculation of exposure factors in USEtox
3.2.1 Freshwater XF
When calculating the FF a result is given for the residence time of the substance in freshwater. However, only a fraction of the substance will actually reside in the water body, as some of it will be bound in suspended solids, dissolved organic carbon or in the biomass. In USEtox, the XF for calculating freshwater ecotoxicity is the fraction of a substance dissolved in freshwater (FR):
𝐹𝑅𝑤.𝑤 =1
1 + (𝐾𝑝 ∙ 𝑆𝑈𝑆𝑃 + 𝐾𝑑𝑜𝑐 ∙ 𝐷𝑂𝐶 + 𝐵𝐶𝐹𝑓𝑖𝑠ℎ ∙ 𝐵𝐼𝑂𝑚𝑎𝑠𝑠
106 )
In the formula, Kp is the partition coefficient between water and suspended solids, SUSP the suspended matter concentration in freshwater, Kdoc the partitioning coefficient between dissolved organic carbon and water, DOC the dissolved organic carbon concentration in freshwater, BCFfish the bioconcentration factor in fish, and BIOmass the concentration of biota in water (Huijbregts et al. 2010).
3.2.2 Humans
XF used to calculate human toxicity in USEtox reflect the rate at which a substance is able to transfer from a receiving compartment into the human population through a series of exposure pathways. The XF has the unit of days-1. In USEtox the following human exposure pathways are modeled:
Air via inhalation; Drinking water; Meat; Dairy products; Fish. Above-ground crops; Below-ground root crops;
For exposure via inhalation of air, the exposure factor (XFinh) is calculated by multiplying the inhalation rate of one person with the number of persons in the entire population and dividing with the volume of air in the relevant air compartment.
The exposure factor for food or water at a specific scale (e.g. continent) is calculated very similarly and equals:
𝑋𝐹𝑖,𝑟 = 𝐵𝐴𝐹𝑖,𝑟 ∙ 𝑃𝑅𝑂𝐷𝑖 ∙𝑃𝑂𝑃
𝑀𝐴𝑆𝑆𝑟
where BAFi,r is the bioaccumulation factor of the substance of exposure pathway i via compartment r , PRODi is the production per person of item i in the exposure pathway and MASSr is the mass of compartment r. In most cases there are no experimentally given BAF
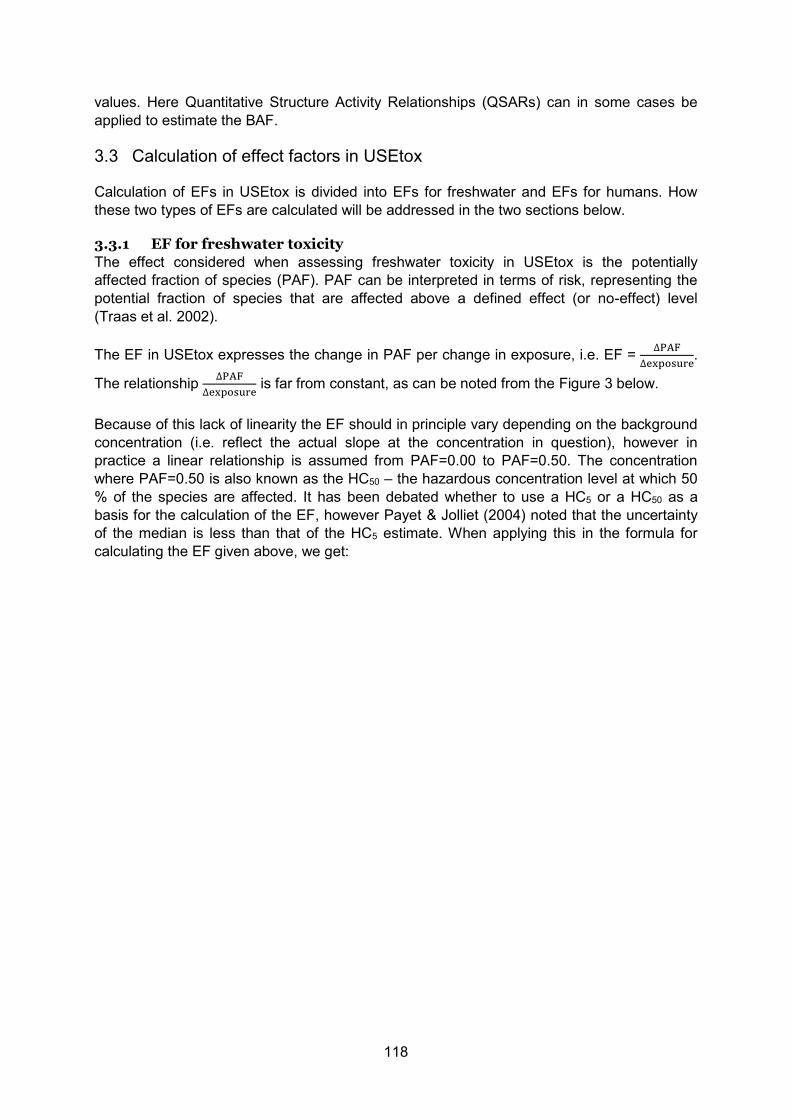
118
values. Here Quantitative Structure Activity Relationships (QSARs) can in some cases be applied to estimate the BAF.
3.3 Calculation of effect factors in USEtox
Calculation of EFs in USEtox is divided into EFs for freshwater and EFs for humans. How these two types of EFs are calculated will be addressed in the two sections below.
3.3.1 EF for freshwater toxicity
The effect considered when assessing freshwater toxicity in USEtox is the potentially affected fraction of species (PAF). PAF can be interpreted in terms of risk, representing the potential fraction of species that are affected above a defined effect (or no-effect) level (Traas et al. 2002).
The EF in USEtox expresses the change in PAF per change in exposure, i.e. EF = ∆PAF
∆exposure.
The relationship ∆PAF
∆exposure is far from constant, as can be noted from the Figure 3 below.
Because of this lack of linearity the EF should in principle vary depending on the background concentration (i.e. reflect the actual slope at the concentration in question), however in practice a linear relationship is assumed from PAF=0.00 to PAF=0.50. The concentration where PAF=0.50 is also known as the HC50 – the hazardous concentration level at which 50 % of the species are affected. It has been debated whether to use a HC5 or a HC50 as a basis for the calculation of the EF, however Payet & Jolliet (2004) noted that the uncertainty of the median is less than that of the HC5 estimate. When applying this in the formula for calculating the EF given above, we get:
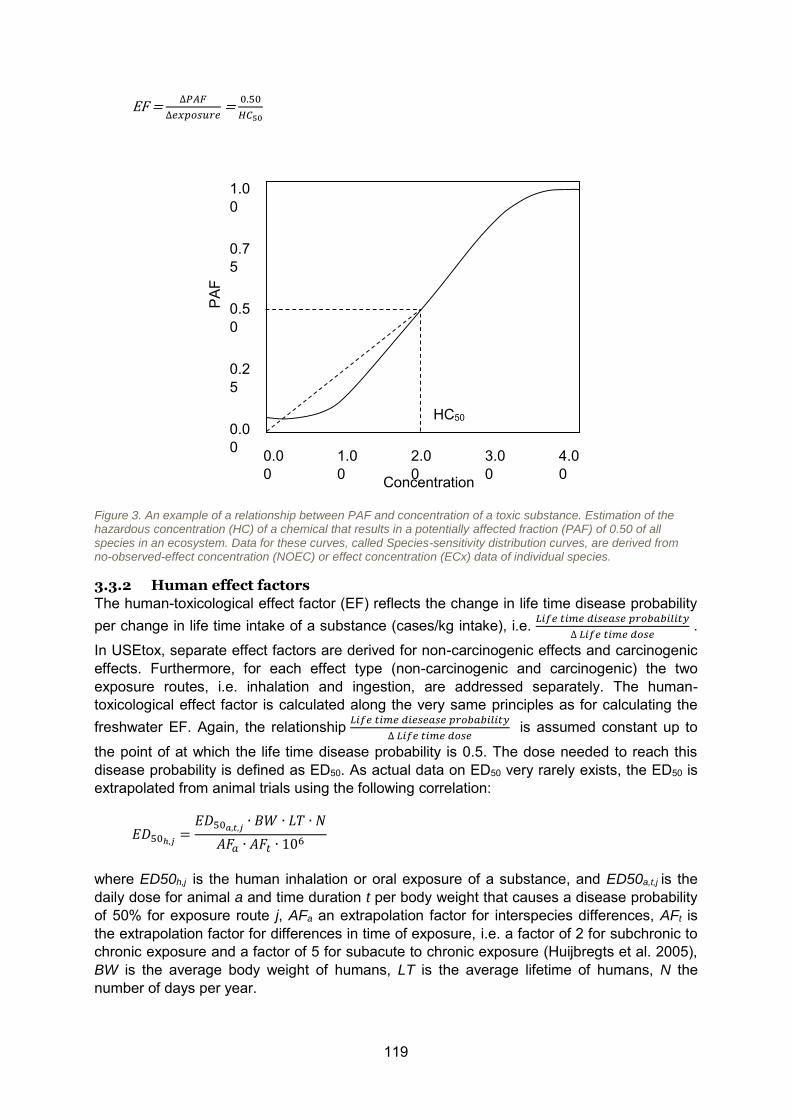
119
EF = ∆𝑃𝐴𝐹
∆𝑒𝑥𝑝𝑜𝑠𝑢𝑟𝑒 =
0.50
𝐻𝐶50
Figure 3. An example of a relationship between PAF and concentration of a toxic substance. Estimation of the hazardous concentration (HC) of a chemical that results in a potentially affected fraction (PAF) of 0.50 of all species in an ecosystem. Data for these curves, called Species-sensitivity distribution curves, are derived from no-observed-effect concentration (NOEC) or effect concentration (ECx) data of individual species.
3.3.2 Human effect factors
The human-toxicological effect factor (EF) reflects the change in life time disease probability per change in life time intake of a substance (cases/kg intake), i.e. 𝐿𝑖𝑓𝑒 𝑡𝑖𝑚𝑒 𝑑𝑖𝑠𝑒𝑎𝑠𝑒 𝑝𝑟𝑜𝑏𝑎𝑏𝑖𝑙𝑖𝑡𝑦
∆ 𝐿𝑖𝑓𝑒 𝑡𝑖𝑚𝑒 𝑑𝑜𝑠𝑒 .
In USEtox, separate effect factors are derived for non-carcinogenic effects and carcinogenic effects. Furthermore, for each effect type (non-carcinogenic and carcinogenic) the two exposure routes, i.e. inhalation and ingestion, are addressed separately. The human-toxicological effect factor is calculated along the very same principles as for calculating the freshwater EF. Again, the relationship 𝐿𝑖𝑓𝑒 𝑡𝑖𝑚𝑒 𝑑𝑖𝑒𝑠𝑒𝑎𝑠𝑒 𝑝𝑟𝑜𝑏𝑎𝑏𝑖𝑙𝑖𝑡𝑦
∆ 𝐿𝑖𝑓𝑒 𝑡𝑖𝑚𝑒 𝑑𝑜𝑠𝑒 is assumed constant up to
the point of at which the life time disease probability is 0.5. The dose needed to reach this disease probability is defined as ED50. As actual data on ED50 very rarely exists, the ED50 is extrapolated from animal trials using the following correlation:
𝐸𝐷50ℎ,𝑗=
𝐸𝐷50𝑎,𝑡,𝑗∙ 𝐵𝑊 ∙ 𝐿𝑇 ∙ 𝑁
𝐴𝐹𝑎 ∙ 𝐴𝐹𝑡 ∙ 106
where ED50h,j is the human inhalation or oral exposure of a substance, and ED50a,t,j is the daily dose for animal a and time duration t per body weight that causes a disease probability of 50% for exposure route j, AFa an extrapolation factor for interspecies differences, AFt is the extrapolation factor for differences in time of exposure, i.e. a factor of 2 for subchronic to chronic exposure and a factor of 5 for subacute to chronic exposure (Huijbregts et al. 2005), BW is the average body weight of humans, LT is the average lifetime of humans, N the number of days per year.
1.00
0.75
0.50
0.00
0.25
0.00
1.00
2.00
3.00
4.00
PAF
Concentration
HC50
120
The ED50h,j can also be estimated in other ways. See Huijbregts et al. (2010) for details.
4. Calculation of CFs for marine and terrestrial ecotoxicity in
USES-LCA
USES-LCA was in 2008 updated to a version 2.0. The following description relates to this version. USES-LCA is used as a basis for calculating toxicity related CFs in the LCIA methods ReCiPe and CML, and in contrast to USEtox includes the calculation of toxicity potentials for not only human toxicity and freshwater ecotoxicity, but also marine aquatic ecotoxicity and terrestrial ecotoxicity. As USEtox is seen as state-of-the-art when it comes to the assessment of freshwater and human toxicity, the following description only addresses how USES-LCA calculates marine and terrestrial ecotoxicity.
According to the developers of USES-LCA the main differences to USEtox apart from the inclusion of marine and terrestrial toxicity are; the calculation of both midpoint and endpoint CFs; and the possibility to test various scenario assumptions (van Zelm et al. 2009).
The concentration of the available fraction of a substance in the compartments (FF and XF) are calculated through the use of a ‘nested’ multi-media fate model, called Simplebox 3.0 which in many ways resembles the FF and XF models used in USEtox. Equally, the calculation of midpoint EFs are based on estimates of HC50, like in USEtox. In order to calculate marine and terrestrial CFs HC50-values relating to terrestrial and marine species are needed. Current literature, however, mainly reports on freshwater HC50-values and estimations are therefore often necessary, typically based on extrapolation from freshwater toxicity data, which is also the main reason why USEtox does not include terrestrial and marine CFs.
For more information about USES-LCA, the reader may refer to Goedkoop et al. (2012).
5. Assumptions and limitations in the calculations of CFs in LCIA
and their importance
As can easily be seen from the sections above, significant simplifications are made in the USEtox and USES-LCA methods. These simplifications are necessary for the methods to be workable, but will obviously have the drawback that they in many cases will create some uncertainty in the CFs. The purpose of this chapter is to outline the most important assumptions and simplifications made in the calculation of CFs.
Having outlined these most significant shortcomings, we will to the extent possible give an overview of the significance of the shortcomings in terms of the estimated uncertainty related to the calculated CFs.
Huijbregts (1998) developed a general framework to account for uncertainty and variability in LCA. To categorise different types of uncertainty and variability we have applied this framework in a slightly modified version for the following discussion. Variability is understood here as stemming from inherent variations in the real world, while uncertainty comes from inaccurate measurements, lack of data, model assumptions, etc. that are used to ‘convert’ the real world into LCA outcomes. The framework distinguishes the following types of uncertainty and variability:
121
1. Scenario uncertainty, arising due to the use of an incorrect or incomplete model, not including all relevant issues.
2. Parameter uncertainty, such as a lack of knowledge about environmental degradation rates;
3. Model uncertainty; where a correct model is used which includes the all relevant issues, but where there is uncertainty regarding gaps in scientific theory required to make predictions on the basis of causal inferences included in the model;
4. Uncertainty due to choices, relating to when value choices are made in LCIA; 5. Spatial and temporal variability, such as regional differences in emission estimates or
the organic carbon content of the soil; 6. Variability between subjects, such as different characteristics of humans.
In the following, we will go through each of these 6 sources of uncertainty and variability, addressing USEtox and USES-LCA together, as many of the same issues will apply. As few studies address the quantitative importance of various sources of uncertainty and variability, we will in the following simply highlight the issues which experts in the field report as being the most influential and only in a few cases address the magnitude of the uncertainty that the particular issue may lead to.
5.1 Scenario uncertainty
Scenario uncertainty relates to uncertainty arising from the application of an incorrect or incomplete model. An important omission in the USES-LCA and USEtox models which should be mentioned here relate to the lack of inclusion of transformation products: When compounds are degraded in the environment, it is degraded into transformation products. Many of these products will still have a toxic effect, and therefore needs to be degraded themselves before the toxic effect is eliminated. Even though models exist for considering transformation products (Van Zelm et al. 2010), these have not been included, because of the high uncertainty related to parameters and model. Whether to include it or not is therefore a question of balancing scenario uncertainty on one hand, and parameter and model uncertainty on the other.
5.2 Parameter uncertainty
A very important source of uncertainty in both USEtox and USES-LCA relates to parameter uncertainty. While many of the parameters included in the models have no or very limited uncertainty, such as the molar weight or Kow values, other parameters are highly uncertain.
One of these is the estimation of the dose-response curves used in the calculation of effect factors (Fantke et al. 2012). One problem here relates to the calculation of CFs for human toxicity: Since there is little empirical data on e.g. the carcinogenic effect of various substances, this information is extrapolated from animal tests. For example, Price et al. (2008) concludes that the constant extrapolation factors used to extrapolate from animals to humans vary depending on substance, implying that the basic assumptions about a certain relationship is only valid for some substances.
However, it is far from only the extrapolation from animal to human dose-response relationship which gives rise to parameter uncertainty in toxicity assessment, Rosenbaum et al. (2008) for example conclude that following issues are also important for the parameter uncertainty in toxicity assessments in USEtox, and because of their similarities, the same will be the case for USES-LCA:
122
the lack of accurate substance properties like carryover rates to meat and milk and limited data on bioconcentration factors for fish,
the lack of data on chemical degradation rates and large uncertainties related to both human health and ecotoxic effect data. The latter comprise issues such as the use of chronic and acute data, animal-to-human extrapolations and oral intake-to-inhalation extrapolations.
5.3 Model uncertainty
Where parameter uncertainty relates to the uncertainty of each of the included parameters, model uncertainty relates to the uncertainty created by the way that these parameters are connected in the models. To illustrate this difference, a common approach for decreasing model uncertainty will in most cases be the implementation of more parameters in the computation of characterization factors, thereby increasing the parameter uncertainty.
As noted in section 3.1 and 4 above, both the USEtox and USES-LCA fate model include a relatively limited set of environmental compartments. Despite of the actual size of these compartments, the model assumes that the compartments are completely homogenous and any substance entering these compartments is immediately diluted perfectly within the volume. In reality, there may be very large differences in the concentration of a substance within one compartment. For example, emissions to soil may be extremely localized – so much than the emitted substance in some cases can be excavated or in order ways in situ remediated in its pure form (Lemming et al. 2010). To this, it should be noted that in both USES-LCA and USEtox, it is assumed that there is a linear dose-response relationship. If this was actually the case, this assumption about homogeneity in concentration of a substance within a compartment would be irrelevant for the result (assuming homogeneity of living species throughout the compartment), as a large concentration in a small confined area would have the same toxicity as a low concentration over a larger area, as long as the total amounts would be the same. However, in reality, the dose-response relationship is not linear, as shown in Figure 3, and the inhomogeneity of substance concentration within compartments will therefore be important for assessing the actual toxic impacts of emission of substances. However, as long as the assumption about a linear dose-response relationship is included in the assessment of toxicity in LCIA, refining the fate models to consider smaller compartments than in existing models will not decrease the uncertainty of the result.
This assumption of a linear dose-response relationship is another central uncertainty in the calculation of both the human and eco ecotoxicity effect factors. An effect of this linear relationship is that it is assumed in USEtox and USES-LCA that a toxic substance will always have a toxic effect regardless of its concentration, i.e. that no threshold levels exist. When not including these thresholds and concentrations are low, USEtox and USES-LCA will therefore tend to overestimate the effect factors. Under high concentrations, where the actual dose-response curve is leveling out (see Figure 3), USEtox and USEs-LCA assuming a linear dose-response relationship will also tend to overestimate the toxicity.
5.4 Uncertainty due to choices
In a few cases, choices are made in LCIA which are based on value driven choices rather than on empirically established correlations or models. This may be a problem in terms of uncertainty when the LCIA developer or assessor and the decision maker is not the same and therefore do not necessarily share values. If the LCIA developer’s/assessor’s value
123
choices are ‘incorporated’ in the assessment without this being transparent for the decision maker, the decision maker may take his or her decision on the basis of an assessment which he or she thinks shows something which it does not. Uncertainty due to choices is therefore only occurring when there is a potential difference or ignorance between the choices of the method developer/assessor and the decision maker.
One example of such value choice in toxicity assessment in LCA is the choice of time horizon: In some cases, only toxicity impacts arising within the first 100 years are considered, whereas in other cases an infinite time horizon is chosen. For many substances this will not make a difference because the environmental half life of a substance will in most cases be significantly shorter and the remaining toxicity after a 100 year time span will therefore be very limited. However, some persistent substances may still not have degraded after 100 years, and there are no clear reasons in LCA for either excluding or including these. The choice of time horizon is therefore what can be characterized as a value choice, and depending on this the final result of the assessment will vary. However, compared to the other sources of uncertainty considered here, this issue may be of less significance.
5.5 Spatial and temporal variability
In the text above, we have addressed uncertainty arising from inaccurate data and models. Here we will address how variability in the real world will cause the actual toxicity of emitted substances to vary, limiting the ability of the calculated CFs to represent the actual contribution to toxicity for nature or humans.
An absolutely central issue relating to the spatial and temporal variability of the USEtox and USES-LCA models arise from the life cycle perspective of LCA described in Section 1. The life cycle perspective often implies that the LCA will be global in scope and that emissions will occur in different times: The production will be before the use, which again will be before the disposal. The life cycle will by other words be distributed over time and place. In most cases, the geographical and temporal location of some parts of the life cycle will be known, whereas the only knowledge about large parts of the life cycle will relate to the functionality of this particular part of the life cycle: For example, in many cases it will be known that a certain amount of oil is needed as an input, but where and when the oil is produced will not be known. This lack of knowledge about where and when production of e.g. inputs take place and thereby also where the toxic emissions from this production will take place poses a central and significant challenge to the assessment of toxicity in LCA.
As an illustration of this, Ghandi et al. (2011) investigate the effect of the natural variability of the freshwater chemistry in a range of lakes in Canada, in particular variability in water pH, DOC and hardness, on the freshwater ecotoxicity of metals. Ghandi et al. (2011) show that natural variability in these factors heavily affects the fate and exposure (bioavailability) factor and conclude on this basis that when including this variation in the USEtox model the resulting CFs for emission of selected metals to freshwater would vary up to an extreme of three orders of magnitude depending on the characteristics of the lake to which it is emitted.
With regards to the temporal variability, issues like rainfall and wind are central: For example, Jolliet & Hauschild (2005) show how the assumption of whether rainfall occurs as a continuous flow, which were considered in the earlier toxicity assessment models in LCIA (as well as in risk assessment models like EUSES or CalTOX) or is modeled as a more realistic intermittent rain pattern can affect the deposition velocity by up to 4 order of magnitude for certain substances. As the fate of a substance may change significantly depending on the
124
compartment in which it is located, such change from being an airborne substance to being in soil will significantly affect the following fate of the substance.
A response to this has been to change the initial assumptions in the model about continuous rainfall to and intermittent rainfall model approximated by a simple formula which Jolliet and Hauschild (2005) show fit well with the actual deposition of substances with very diverse chemical behavior. With this improvement of USEtox and USES-LCA, the temporal variation in precipitation therefore plays a less significant role in these models. However, other issues like temperature, wind velocities, and background concentrations are also used in the calculation of characterisation factors, and no attempts to incorporate the temporal variability of these have yet been commenced. How the natural variability of these factors affects the accuracy of the CFs is unknown. On the other hand, it should be remembered that the time of the day or year when an emission occurs is normally not known in an LCA and many activities go on through the year so emissions can occur at any time. This means that the time independency of the CFs is a wanted feature.
5.5.1 Specific problems in relation to spatial and temporal variability and the
toxicity of metals
The assessment of toxicity of metals in LCA have caused significant difficulties, as the LCIA models assessing toxicity of substances have mainly been developed to handle non-metals. When it comes to the spatial and temporal variability of the toxicity of metals, important issues relate to:
Speciation. Models, like USES-LCA and USEtox have been developed for assessing non-ionizing organic compounds, which only exist as single chemical species. Metals, on the other hand exist in multiple inter-converting species (Ghandi et al. 2011). How a metal speciates depends highly on pH and concentration of dissolved organic carbon and of competing cations and thus on the characteristics of the receiving environment. The speciation of metals will highly affect their bioavailability and toxicity. For example, Morel et al. (1993) find that the toxicity of a metal complex bound by natural complexing agents, such as carbonates, can be one tenth the toxicity of 'free' or inorganic metal.
Bioavailability. Bioavailability of a metal refers to the fraction of the metal that is available for the biota. In relation to this, as already indicated above, Ghandi et al. (2011) find that the bioavailability of metals in freshwater bodies to a large extend depend on dissolved organic carbon, pH and hardness and the residence time of the water in the lake.
Persistence. Contrary to organic compounds, metals are not degraded in the environment over time. Metals persist forever and may remain in an ecosystem for a long time, but they will usually not be present in their bioavailable form. Rather, they are converted to other species and/or adsorbed to particulate matter (e.g., soils, sediments, suspended matter). However, as outlined above, this process of change in speciation or precipitation or adsorption will highly depend on the characteristics of the receiving environment.
Thus, as can be seen from this small overview, in relation to the assessment of toxicity of metals, the spatial and temporal variability in the geochemistry of the receiving environment will to a larger extent than the for other substances affect their toxicity, and this is not considered in present state-of-the art LCIA methods.
125
5.6 Variability between individuals
As a category of variability closely related to the spatial and temporal variability is the variability between individuals relating to the differences in characteristics of the affected individual. As can be noted in Section 3.2.2, the calculation of XFs for human toxicity depend on issues such as consumption of various food products, and inhalation rates, and the calculation of EFs depends among others on body weight, life time, and tolerance to toxic substances. Obviously, all of these parameters will vary in the real world, and considering that the XFs and EFs are multiplied in order to calculate the CFs, the variability will multiply over the model. Without going to the extremes a variability of a factor 2 can easily be found within each of these parameters, meaning that a variability of an order of magnitude due to the variability between individuals can easily be expected.
5.7 Discussion about uncertainty and variability
In the discussions above, we have highlighted various sources of uncertainty and variability. A central question in this regard is what the overall expected uncertainty of the calculated CFs in USEtox and USES-LCA is, or in other words what the expected difference between the calculated and the ‘real CFs’ is?
Unfortunately, giving a covering answer to this question is not possible with the current knowledge. The fate model can be compared with actual concentrations in nature, and here we see a reasonable degree of correspondence, however, when it comes to exposure and effect models, these estimates have not been possible to evaluate. The only indication therefore about the models’ accuracy lies in the fact that for example the USEtox model is a result of a consensus process, where experts within toxicity assessments in LCIA have scrutinized each part of the model to ensure that it reflects current state of the art. The validation thus lies in the check against other scientifically recognized models like EUSES and CalTOX.
However, still something can be said about the uncertainty of the CFs based on the variability of parameters, and models included in the USEtox and USES-LCA: Rosenbaum et al. (2008) shows that in a comparison of calculated CFs from a 5 different LCIA toxicity assessment models the CFs vary up to 3 orders of magnitude for individual substances. In this comparison, each model had been ‘harmonized’ to remove unintentional differences between the models (e.g. in the parameterization of the modeled unit world). With the knowledge at that time there was no way of telling which of the models was most correct. Furthermore, the models used the same parameter inputs and settings, implying that the variability in the results only related to model uncertainty. Assuming that USEtox and USES-LCA are no more accurate than the other included models in the assessment, this implies that a difference between the calculated and ‘real’ CF stemming from only model uncertainties can be expected to be up to 3 orders of magnitude. On top of this comes the scenario and parameter uncertainty, where especially the magnitude of scenario uncertainty due to its nature, is very difficult/impossible to quantify. This uncertainty should be viewed on the background of a variation in the calculated CFs (more than 2000 substances covered) of 12–15 orders of magnitude. There is thus a strong ability to discern the toxicity of substance emissions in spite of the large uncertainty in CFs. In fact the relative strength of differentiation is higher than for an impact category like global warming where the uncertainty of the CFs is much lower (typically 30%) but where the range of the CFs is only three orders of magnitude.
126
Nevertheless, it can be expected that the difference between the true and calculated CF is large, but it is important to remember that CFs for toxicity are relative and not absolute, i.e. the toxicity of a substance is calculated in comparison to a reference substance (see section 1). If, therefore, the calculated CFs are consistently biased, the uncertainty will be of less importance for the accuracy of the assessment, as the CFs will still reflect the true situation in terms of which emission is causing the most/least toxic impacts. On the other hand, if the calculated CFs are randomly scattered around the true CFs the uncertainty in the calculation of the CFs will create an equal uncertainty in the results. Which situation is the actual case is unfortunately not possible to say.
6. Comparison of LCA and ERA
In the sections above, we have discussed the possibilities and problems relating to assessing toxicity of products in LCA. However, LCA is not the only assessment tool addressing toxicity related to products. Another often used tool is Risk Assessment (RA), which has other goals as well as other advantages and disadvantages than LCA. The two tools are relevant to use as complementary in some applications, and we will in the following sections give an overview of; what RA is and how it is applied (in rough terms); and based on this what the overall differences between LCA and RA are. Finally, we will conclude with a discussion about the appropriate uses of LCA and RA and their relative strengths and weaknesses including a discussion of how they complement each other.
6.1 RA – goal and procedure
The main goal of RA has been stated as the identification and quantification of risks that result from the release of chemicals to the environment, and the resulting exposure of humans and ecosystems (Sleeswijk et al. 2003).
Based on this, RA is generally performed for the purpose of ensuring that use and release of chemicals are acceptable in terms of risk for human health and the natural environment, i.e. can be considered as ‘safe’. This can be used in the establishment of standards for environmental quality, occupational exposure or product safety, stating the amount of a chemical which can be emitted without leading to ‘unacceptable’ risks. An unacceptable risk is generally considered to be one that requires regulatory action. Actual levels of acceptability are determined by numerous cultural and socioeconomic variables (Sleeswijk et al. 2003).
RA is generally performed through a four-step procedure and consists of a hazard identification, dose–response assessment, exposure assessment and risk characterisation.
In the hazard identification, the capacity of a chemical to cause harm is identified through mapping the chemical’s inherent physico-chemical and biological properties.
The dose–response assessment addresses the adverse effects of a substance on ecosystems of human health considering the doses or exposure levels. Here the determination of species-specific threshold values is of key importance. In order to establish thresholds for ecosystems NOECs (No Observed Effect Concentrations) for all tested species are translated to one ‘predicted no effect concentration’ (PNEC) for each environmental compartment. To set thresholds for humans acceptable daily intakes (ADIs) are normally used, typically based on extrapolation from observations of NOAELS (No Observed Adverse Effect Levels) on exposed test animals. The third step is the exposure
127
assessment. In this step ‘predicted environmental concentrations’ (PECs) are estimated from the emission of the substance in question. In relation to ecosystems, PECs are usually related directly to ecosystem exposure within each environmental compartment. For human health, models including various direct and indirect exposure routes are used to translate PECs to ‘total daily intakes’. The final step of the assessment, risk characterisation, is where predicted exposures are translated into risks. The ratio between the calculated exposure or environmental concentration (PECs or ‘total daily intakes’) and the threshold value (PNEC or ADI) is used as an indicator of the extent to which this threshold value is approached or exceeded for each individual substance.
The RA is commonly performed following a ‘worst case’ approach. ‘Worst case’ relate to several stages of the assessment, for example when considering the release of substances, resulting environmental concentrations, establishing dose–response curves and when considering interspecies variations. (Sleeswijk et al. 2003)
6.2 RA and LCA – differences and similarities
From a first glance several differences and similarities between RA and LCA appear. To structure the following discussion, we have chosen to divide it according to the steps of the LCA procedure, as the structure of RA can well be covered by the steps in LCA. The steps in LCA are the goal and scope definition, inventory analysis, impact assessment and interpretation. We assume that the reader is familiar with the overall structure of the LCA and will therefore not discuss the purpose of these here. For more information of these steps the reader may refer to EC (2010).
6.2.1 Goal and scope definition
LCA is a tool which is most often used on corporate contexts. RA on the other hand much more finds its use in environmental policy making to set legal thresholds, as noted above (Lim et al. 2011). In relation to the goal of the assessment, this implies that RA as noted is to protect the environment and human health against unacceptable risks from emission of chemicals. Focus is in general to ensure that politically set limits are not exceeded by exposures at any location or point in time. The purpose of LCA, on the other hand is to compare two or more options in order to determine which is more environmentally friendly. Based on this, when performing an RA it is common practice to follow a conservative (‘worst case’) approach, whereas LCA will try to represent more the most likely impact on society.
Another central difference is that the LCA is focused on the assessment of how the production of products leads to the emission of chemicals. In RA on the other hand, the focus is on the chemical. This focus may relate to a specific use/emission of the chemical, but may in some cases also be broadened to include the production and end of life of the chemical (Christensen & Olsen 2004). If this is the case, then an LCA where the product in focus is itself a chemical may have the same boundaries for the assessment as a RA, as noted by Sleeswijk et al. (2003). However, normally the focus of the assessment differs, considering also that in an LCA, it is not only the production and disposal routes that are included in the assessment, but also the upstream processes and the infrastructure used in the production, and it therefore seems fair to state that the LCA in general has a much broader life cycle perspective than RA.
Finally, LCA includes not only a toxicity assessment as RA, but also assessment of contributions to a broad range of other impacts arising from the product system on human health and the quality of the natural environment, such as resource depletion, global
128
warming, ozone depletion, etc. (according to the ISO 14044 (2006) standard for LCA, all environmental impacts that are relevant for the product that is studied must be considered in the LCA).
6.2.2 Inventory analysis
As noted above, LCA includes the entire life cycle of a product in the assessment whereas RA normally is focused on a specific release of a chemical, or perhaps the total annual emission of the chemical within a geographic region. When collecting data about emission of chemicals in LCA, the collection focuses on the processes included in the product life cycle (including the product use), since it is through the various industrial processes that emissions occur. In many cases a product system may include several hundred of these processes when considering the full extent of the product life cycle, and the collection of site specific data for all processes would be an immense task. To support this task process related databases have been created with average emissions from processes expressed per functional output to be used in the modeling of product life cycles (e.g. Ecoinvent 2007). This, however, poses several challenges in terms of the accuracy of the data: First of all, the processes included in the assessed process life cycle may not fully resemble the emissions of the processes in question. In fact, especially when it comes to the emission of chemicals, there may be a large variety on how different companies conduct their businesses and the resulting emissions, and often, the inventory of specific chemical emissions is rather deficient.
Another problem is that when chemicals are used in a process, not all of the chemical may be emitted to nature: For example, pesticides emitted to a field may be degraded or retained on the field (which in LCA is not considered part of the environment but rather the technosphere) and thereby not be emitted to nature. In many cases, due to lack of so-called inventory models LCA does not consider the potential difference between what is used and what is emitted and enters into the environment.
In RA, on the other hand due to the much narrower boundaries in the assessment, it is often possible to collect site specific emission data and the two problems mentioned above can thereby be avoided. This also implies that whereas LCA inventorizes the total amounts emitted over the life cycle and then in the LCIA translates to concentration increases, RA can calculate in actual concentrations.
6.2.3 Impact assessment
At the impact assessment level, the RA and LCA differ at two important points:
First of all and again due to the often lack of place and time specificity in LCA, it is often not possible to consider how the fate of the emission of a chemical is influenced by specific environmental, geographical or meteorological conditions. Equally when considering the exposure and effect of an emission, knowledge about the specific ecosystem receiving the chemical will often be lacking, including the specific sensitivity of the specific species living in the ecosystem, background concentrations of other chemicals or, as noted in section 5.5, information about e.g. pH of receiving water bodies. As was also pointed out in section 5.5, this leads to large potential differences between the generic toxicity which is modeled in LCA and the actually occurring toxicity.
Some of this uncertainty may be avoided in RA where specific information about species living in an ecosystem may be available, together with specific knowledge about the characteristics of the receiving environment. This enables for example the use of ecosystem specific ‘predicted no effect concentrations’ (PNEC), and local specific background
129
concentrations, meteorological conditions, etc. However, in some cases where a chemical is emitted to air and spread over e.g. continental areas, the same uncertainties relating to calculating the toxic effect of this will prevail in RA as it does in LCA, and the characteristics of the results generated by the RA will approach those of the LCIA.
The other important difference in the impact assessment arises from focus on compliance in RA and on comparison in LCA, as mentioned in section 6.2.1. Because of this, the assessment of risk in RA is performed through dividing the predicted environmental concentration (PEC) of the chemical in question with the PNEC. The ratio is used as an indicator of risk to the ecosystem and the modeling of PEC and PNEC is set up to ensure a conservative assessment of the risk. LCA on the other hand focuses on comparison, and as such the goal is not to ensure that there are no risks related to an emission, but rather assess as realistically as possible the impacts caused by an emission. State of the art LCIA toxicity assessment therefore does not relate to whether the PEC/PNEC ratios are acceptable but on quantifying the most realistic impact of an emission based on the models described in sections 3.3.2. The quest of LCIA to model the ‘best estimate’ of the toxic impact is inspired by the fact that toxicity-related impacts are just some of the many environmental impacts that are modeled in LCIA, and if a conservative approach is followed here, it will bias the impact assessment towards toxicity at the expense of e.g. global warming, which is unwanted.
A third difference also relating to the differences in the goal of the two assessment is that even through the same fate models can theoretically be used in LCA and RA, the needs can still differ in scope and parameterisation. In RA, the concentration of a chemical is typically estimated in the region of an emission in order to compare with the policy limits. For this, multimedia model including, for example, 200 × 200 km2 with compartments for air, water, soil, and so on, can be sufficient. However, as many substances are likely to travel farther than this, larger fate models are needed in LCA, where the perspective is global (Pennington et al. 2006).
6.3 Discussion of differences
As can be seen in the above discussions the central difference between RA and LCA is that they aim at answering different questions: Whereas RA aim to assess to what extent a chemical is exceeding or approaching acceptable threshold levels in the environment, LCA focuses on comparing the toxic impacts of products/technologies. This difference gives rise to the difference in scope of the two assessments; RA often being very site specific in order to address whether a specific chemical is exceeding the limits within a given area and emission situation; and LCA often being very spatially and temporally unspecific aiming at getting an overview of the toxic impacts arising from the emission of all the various substances in all the various places throughout the life cycle.
The difference in the question that the two assessment tools address can thus be seen as the source of these differences and the many drawbacks of LCA in terms of assessment uncertainties should therefore be seen not simply as a failure to use the well-developed assessment tools of RA, but rather as an inherent property of LCA due to its goal. It is therefore not simply a question of a further development of LCA which will then at some point reach the same accuracy as RA.
However, despite the differences in goal of the two assessments, or perhaps because of this difference, they can very well be used in combination, hereby drawing benefit from the LCA’s
130
holistic coverage of impacts of a product and RA’s substance and site specific assessment: When performing an LCA, the RA may be used as a tool for assessing in detail whether the potential ‘hot-spots’ found in the LCA throughout the life cycle of a product do, in fact, pose a risk to the specific ecosystem or health of humans in the area. Also, when performing an RA, the LCA may be used to ensure that the advice given in the RA does not increase the negative impacts in other parts of the involved product system or increases the non-toxic impacts. Or as Bare (2006) elegantly states it: “Given these differing perspectives, it is easy
to see why both tools are valuable to see the complete environmental picture. Without RA,
LCA cannot assure that all locations of release will be appropriately protective of the local
populations. Without LCIA, a decision-maker may choose an option that may look better for
the local populations, but may negatively impact other locations and/or other populations.”
7. Summary and outlook
In this appendix we have seen that LCA can be used to assess products over their entire life cycle in terms of their toxicity to humans as well as their toxicity to ecosystems, comprising freshwater, marine and terrestrial systems. We have seen how the approaches for assessing toxicity in LCA has been improved, most notably through the USEtox consensus process which has lead to the situation today where the assessments are done on the basis of rather robust models and state-of-the-art eco-toxicological research. Some research is still needed to further improve the accuracy of the models, especially when it comes to the uncertainties arising from the lack of site specific modeling in LCA but also on issues like the assessment of toxicity of metals in LCA. On both areas significant research efforts are on-going, and the perspective is therefore that the current models will be improved within a very foreseeable timeframe on these areas. However, at the same time it should be noted, as also mentioned above, that product life cycles in their fullest extent are extremely complex, and due to this complexity the LCA user will very often only have knowledge about where a very limited number of the included processes in the life cycle will occur. When this is the case, there is a limit to how much these models can be improved – as we have seen above, when not knowing the place and time a process is occurring the unknown characteristics of the receiving environment accuracy cannot be improved beyond a certain point. If more detailed knowledge about place and time of the assessment can be provided to the LCA user, these problems may therefore be improved, however presently, no convincing initiatives have been taken in the LCA community to close this gap. Therefore, as discussed above in the section 6.3, LCA will most likely never be as accurate as RA – not because the same maturity of models are not applied in LCA, but simply because of the lack of knowledge about place and time of significant parts of the life cycle. Thus, LCA should be considered for its holistic coverage. The price of this holistic approach is, and will continue to be, that toxicity is assessed as generic impact indicator which is neither able, nor intended to predict actually occurring toxic effects along product life cycles.
131
References
Bare, J.C. 2006. Risk Assessment and Life-Cycle Impact Assessment (LCIA) for Human Health Cancerous and Noncancerous Emissions: Integrated and Complementary with Consistency within the USEPA. Human and Ecological Risk Assessment 12, pp. 493–509.
Brandes, L.J., den Hollander, H. & van de Meent, D. 1996. Simplebox 2.0: a nested multimedia fate model for evaluating the environmental fate of chemicals. RIVM report no. 719101029, RIVM, Bilthoven, The Netherlands.
Christensen, F.M. & Olsen, S.I. 2004. The Potential Role of Life Cycle Assessment in Regulation of Chemicals in the European Union. International Journal of Life Cycle Assessment 9(5), pp. 327–332.
Den Hollander, H.A., Van Eijkeren, J. & van de Meent, D. 2004. SimpleBox 3.0. Report 422517 00x. RIVM, Bilthoven, The Netherlands.
EC – Joint Research Centre – Institute for Environment and Sustainability. 2010. International Reference Life Cycle Data System (ILCD) Handbook – General guide for Life Cycle Assessment – Detailed guidance. First edition. EUR 24708 EN. Luxembourg. Publications Office of the European Union.
Gandhi, N., Huijbregts, M.A.J., van de Meent, D., Peijnenburg, W.J.G.M., Guinée, J. & Diamond, M.L. 2011. Implications of geographic variability on Comparative Toxicity Potentials of Cu, Ni and Zn in freshwaters of Canadian ecoregions. Chemosphere 82, pp. 268–277.
Gloria, T.P., Russell, A.J., Atherton, J., Baker, S.R. & Cook, M. 2006. Ecological Toxicity Methods and Metals An examination of two case studies. Int J LCA 11(1), pp. 26–33.
Goedkoop, M., Heijungs, R., Huijbregts, M.A.J., Schryver, A.D., Struijs, J. & van Zelm, R. 2012. ReCiPe 2008 – A life cycle impact assessment method which comprises harmonised category indicators at the midpoint and the endpoint level. First edition (revised). Report I: Characterisation. http://www.lcia-recipe.net.
Guinée, J. & Hauschild, M. 2005. UNEP/SETAC TF3 on Toxic Impacts State of the art description of characterisation models for assessing human and ecotoxicological impacts in LCA.
Huijbregts, M.A.J. 1998. Application of uncertainty and variability in LCA Part I: a general framework for the analysis of uncertainty and variability in life-cycle assessment. International Journal of Life Cycle Assessment 4, pp. 273–280.
Huijbregts, M.A.J. 1999. Priority assessment of toxic substances in LCA. Development and application of the multi-media fate, exposure and effect model USES-LCA. IVAM environmental research, University of Amsterdam, Amsterdam.
Huijbregts, M.A.J., Thissen, U., Guinée, J., Jager, T., Kalf, D., van de Meent, D., Ragas, A.M.J., Wegener Sleeswijk, A. & Reijnders, L. 2000. Priority assessment of toxic substances in life cycle assessment. Part I: Calculation of toxicity potentials for 181 substances with the nested multi-media fate, exposure and effects model USES-LCA. Chemosphere 41, pp. 541–573.
Huijbregts, M.A.J., Rombouts, L.J.A., Ragas, A.M.J. & van de Meent, D. 2005. Human-toxicological effect and damage factors of carcinogenic and non-carcinogenic
132
chemicals for life cycle impact assessment. Integrated Environmental Assessment and Management 1(3), pp. 181–244.
Huijbregts, M.A.J., Hauschild, M., Jolliet, O., Margni, M., McKone, T., Rosenbaum, R.K. & van de Meent, D. 2010. USEtox™ – User manual. http://www.google.com/url?sa=t&rct=j&q=&esrc=s&frm=1&source=web&cd=1&cad=rja&ved=0CDYQFjAA&url=http%3A%2F%2Fwww.pre-sustainability.com%2Fdownload%2Fmanuals%2FUserManualUSEtox.pdf&ei=w0XQUNzBMOr-4QS1q4C4Bw&usg=AFQjCNE5QPSstlUVaB3ZW7i3bkMrUcqy5g&sig2=XBswFsiAjVVzXYlE7m6RRg&bvm=bv.1355534169,d.bGE".
ISO 14044:2006. Environmental management – Life cycle assessment – Requirements and guidelines. International Standard Organisation, Geneva, Switzerland.
Jolliet, O. & Hauschild, M. 2005. Modeling the Influence of Intermittent Rain Events on Long-Term Fate and Transport of Organic Air Pollutants. Environmental Science and Technology 39, pp. 4513–4522.
Klepper, O. & van de Meent, D. 1997. Mapping the Potentially Affected Fraction (PAF) of species as an indicator of generic toxic stress. Report 607504001. National Institute of Public Health and the Environment, Bilthoven, The Netherlands.
Lemming, G., Hauschild, M., Chambon, J., Binning, P.J., Bulle, C., Margni, M. & Bjerg, P. 2010. Environmental Impacts of Remediation of a Trichloroethene- Contaminated Site: Life Cycle Assessment of Remediation Alternatives. Environmental Science and Technology 44, pp. 9163–9169.
Ligthart, T., Aboussouan, L., Adams, W., Atherton, J., Baukloh, A., Chapman, P., Delbeke, K., Dubreuil, A., Eikelboom, R., Hauschild, M., Heijungs, R., Jolliet, O., Karman, C., de Koning, A., Korenromp, R., Kuyper, J., van der Loos, R., van de Meent, D., Russel,l A., Jan Saft, R., Sap, G., Schönnenbeck, M., Struijs, J., van Tilborg, W., Udo de Haes, H. & Verdonck, F. 2004. Declaration of Apeldoorn on LCIA of Non-Ferro Metals. Apeldoorn, The Netherlands.
Lim, S.R., Lam, C.W. & Schoenung, J.M. 2011. Priority screening of toxic chemicals and industry sectors in the U.S. toxics release inventory: A comparison of the life cycle impact-based and risk-based assessment tools developed by U.S. EPA. Journal of Environmental Management 92, pp. 2235–2240.
Morel, F. & Hering, J. 1993. Principles and Applications of Aquatic Chemistry, Wiley, New York.
Payet, J. & Jolliet, O. 2004. Comparative Assessment of the Toxic Impact of Metals on Aquatic Ecosystems: The Ami Method. In: Life Cycle Assessment of Metals: Issues
and Research Directions. Dubreuil, A. (Ed.). SETAC, Pensacola, FL, USA.
Pennington, D.W., Margni, M., Payet, J. & Jolliet, O. 2006 Risk and Regulatory Hazard-Based Toxicological Effect Indicators in Life-Cycle Assessment (LCA). Human and Ecological Risk Assessmen 12 (3), pp. 450–475.
Pettersen, J. & Hertwich, E. 2008. Critical Review: Life-Cycle Inventory Procedures for Long-Term Release of Metals 42(13), pp. 4639–4647.
133
Pizzol, M., Christensen, P., Schmidt, J. & Thomsen, M. 2011. Impacts of “metals” on human health: a comparison between nine different methodologies for Life Cycle Impact Assessment (LCIA). Journal of Cleaner Production 19, pp. 646–656.
Price, P.S., Keenan, R.E. & Swartout, J.C. 2008. Characterizing interspecies uncertainty using data from studies of anti-neoplastic agents in animals and humans. Toxicology and Applied Pharmacology 233, pp. 64–70.
RIVM, VROM, VWS. 1998. Uniform System for the Evaluation of Substances 2.0 (USES 2.0). RIVM report no. 679102044, National Institute of Public Health and the Environment (RIVM), Ministry of Housing, Spatial Planning and the Environment (VROM), Ministry of Health, Welfare and Sport (VWS).
Sleeswijk, A.W., Heijungs, R. & Erler, S.T. 2003. Risk Assessment and Life-cycle Assessment. Fundamentally Different yet Reconcilable. Greener Management International 41. pp. 77–87.
Traas, T.P., van de Meent, D., Posthuma, L., Hamers, T., Kater, B.J., de Zwart, D. & Aldenberg, T. 2002. The potentially affected fraction as a measure of ecological risk. In: Posthuma, L., Suter, G.W., Traas, T.P. (eds.). The Use of Species Sensitivity Distributions (SSD) in Ecotoxicology. CRC Press, Boca Raton, pp. 315–344.
van Zelm, R., Huijbregts, M.A.J. & van de Meent, D. 2010. Transformation products in the life cycle impact assessment of pesticides. Environmental Science and Technology 44, pp. 1004–1009.
van Zelm, R., Huijbregts, M.A.J. & van de Meent, D. 2009. USES-LCA 2.0 – a global nested multi-media fate, exposure, and effects model. International Journal of Life Cycle Assessment 14, pp. 282–284.
134
Appendix F: LCA on selected renovation scenarios (Denmark)
Harpa Birgisdottir (SBi) & Stefania Butera & Thomas Astrup (DTU)
1. Introduction
1.1 Building sector
The building sector is today an important contributor to the environmental sustainability challenges of the society. Buildings account for 20–40% of the energy consumption in developed countries, 50% of the world’s resource consumption and 20–35% of the world population’s contribution to most environmental impact categories such as global warming, acidification, smog formation, eutrophication, water consumption and waste generation. There is an intensive focus on how to lower the environmental impacts of the building industry.
Life Cycle Assessment (LCA) is becoming an important tool in the environmental sustainability assessment for buildings. LCA is included both in the Construction Product Regulation (CPR) and the European CEN/TC 350 Sustainability of Construction Works. In building LCA the environmental impacts are evaluated for all life cycle stages of the building: production stage, construction stage, use stage and end of life stage. The aim of using LCA for buildings is to get knowledge of the environmental impacts related to each stage of the building life cycle and try to lower them as much as possible. Access to data and data quality of the environmental impacts related to each stage of the building life cycle is therefore very important.
1.2 Waste sector
Waste generation is also an important contributor to the environmental sustainability challenges of the society today. The waste sector accounts for approximately 5% of total GHGs emissions, mainly attributed to CH4 emissions from landfills (IPCC 2007). According to IPCC estimates, the total energy content of waste generated worldwide in 2002 amounts to 8 EJ, which represents approximately 2% of worldwide total energy requirements in 2002, and around 8% of coal-based energy production (EIA 2005). European waste generation amounts to 2,50∙109 t in 2010 (Eurostat 2010), corresponding to almost 5 t/person/year. The construction sector is the sector generally generating the largest amounts of waste. In 2009, the construction sector in Denmark generated 5 million tons, out of a total of 13,9 million tons of waste. The largest defined fractions were: soil and stone (1,4 million tons), concrete (1,3 million tons), asphalt (0,9 million tons) and bricks (0,2 million tons). On the other hand, recycling rate is very high in the construction sector, where 96% of the total amount was recycled, 3% landfilled and 1% incinerated.
LCA is also becoming an important tool in the evaluation of the environmental impacts related to different solutions of waste treatment. The European Waste Framework directive (2008/98/EC) introduced the waste hierarchy, which establishes a legally binding ranking for waste management options prioritization (in order of preference: prevention, minimization, reuse, recycling, energy recovery, and finally disposal). At the same time, the concept of life cycle thinking was also introduced, to support and possibly improve the choice of waste strategies towards more sustainable solutions. Due to the large amounts produced and the characteristics of this type of waste, construction and demolition waste (C&DW) has a large
135
potential for recycling. This is also recognized at an EU level, with a guidance document focusing on C&DW, providing insights on how to integrate LCA and C&DW management strategies (JRC 2011). As for the building sector, the same applies for the waste sector: access to data, and data quality of the environmental impacts related to different waste treatment methods for different waste fractions is very important.
1.3 Purpose of the study
The purpose of the study is to evaluate the environmental impacts related to recycling of two important construction waste fractions, concrete and bricks, from renovation or building demolition projects. The aim is to generate LCA data that can benefit the data accessibility for both the building sector and the waste sector.
The amounts generated in renovation or building demolition varies between building projects and is related to type and age of the building, and in renovation projects depending on what is being renovated within the building. The focus is on recycling of the construction waste fractions as crushed material in road construction or as filling material, which has been the most common treatment method of those construction waste fractions in Denmark. The focus of the LCA is to model the environmental impacts, including the ones associated with potential leaching from the material when used as secondary material in road construction.
Reuse of bricks and concrete is an alternative to recycling as crushed material in road construction. The life cycle impact related to reuse is qualitatively evaluated, but full LCA is not performed. Landfilling of the two selected waste fractions is not a common solution in Denmark, unless the waste fractions are too polluted. Landfilling is therefore not evaluated.
2. Renovation scenarios
Renovation of buildings includes flows of different types of materials, both as output of construction waste and input of new material (see Figure F1). Inputs of construction materials are, throughout the service life of the building, assumed to be the same types as the originally installed materials. This means that the renovated building components have the same environmental impacts as the originally installed components. The end of life scenarios for the output of waste materials can, however, follow different paths leading to different environmental loads and gains. This study focuses on exploring the environmental impacts from different waste treatment possibilities for selected renovated components. The building components selected for the life cycle investigation are concrete and bricks.
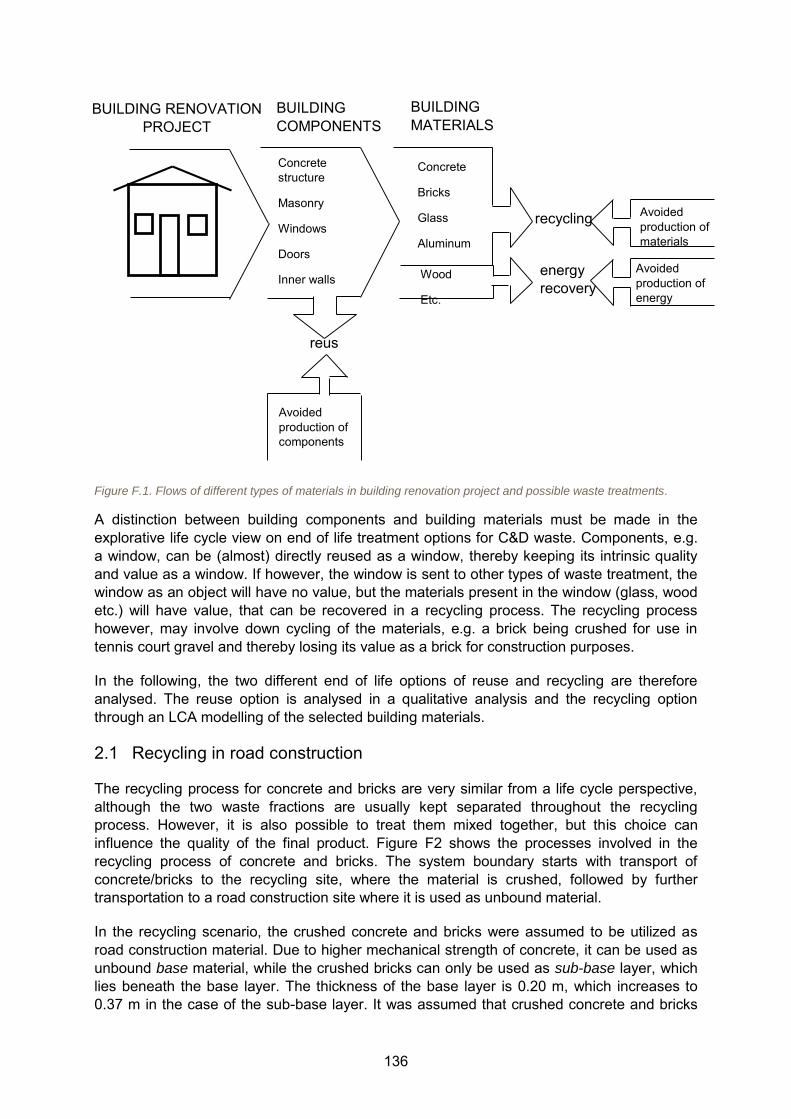
136
Figure F.1. Flows of different types of materials in building renovation project and possible waste treatments.
A distinction between building components and building materials must be made in the explorative life cycle view on end of life treatment options for C&D waste. Components, e.g. a window, can be (almost) directly reused as a window, thereby keeping its intrinsic quality and value as a window. If however, the window is sent to other types of waste treatment, the window as an object will have no value, but the materials present in the window (glass, wood etc.) will have value, that can be recovered in a recycling process. The recycling process however, may involve down cycling of the materials, e.g. a brick being crushed for use in tennis court gravel and thereby losing its value as a brick for construction purposes.
In the following, the two different end of life options of reuse and recycling are therefore analysed. The reuse option is analysed in a qualitative analysis and the recycling option through an LCA modelling of the selected building materials.
2.1 Recycling in road construction
The recycling process for concrete and bricks are very similar from a life cycle perspective, although the two waste fractions are usually kept separated throughout the recycling process. However, it is also possible to treat them mixed together, but this choice can influence the quality of the final product. Figure F2 shows the processes involved in the recycling process of concrete and bricks. The system boundary starts with transport of concrete/bricks to the recycling site, where the material is crushed, followed by further transportation to a road construction site where it is used as unbound material.
In the recycling scenario, the crushed concrete and bricks were assumed to be utilized as road construction material. Due to higher mechanical strength of concrete, it can be used as unbound base material, while the crushed bricks can only be used as sub-base layer, which lies beneath the base layer. The thickness of the base layer is 0.20 m, which increases to 0.37 m in the case of the sub-base layer. It was assumed that crushed concrete and bricks
BUILDING COMPONENTS
BUILDING RENOVATION PROJECT
BUILDING MATERIALS
Avoided production of materials
Avoided production of energy
Concrete structure
Masonry
Windows
Doors
Inner walls Wood
Etc.
Concrete
Bricks
Glass
Aluminum
Gypsum
recycling
reuse
energy recovery
Avoided production of components
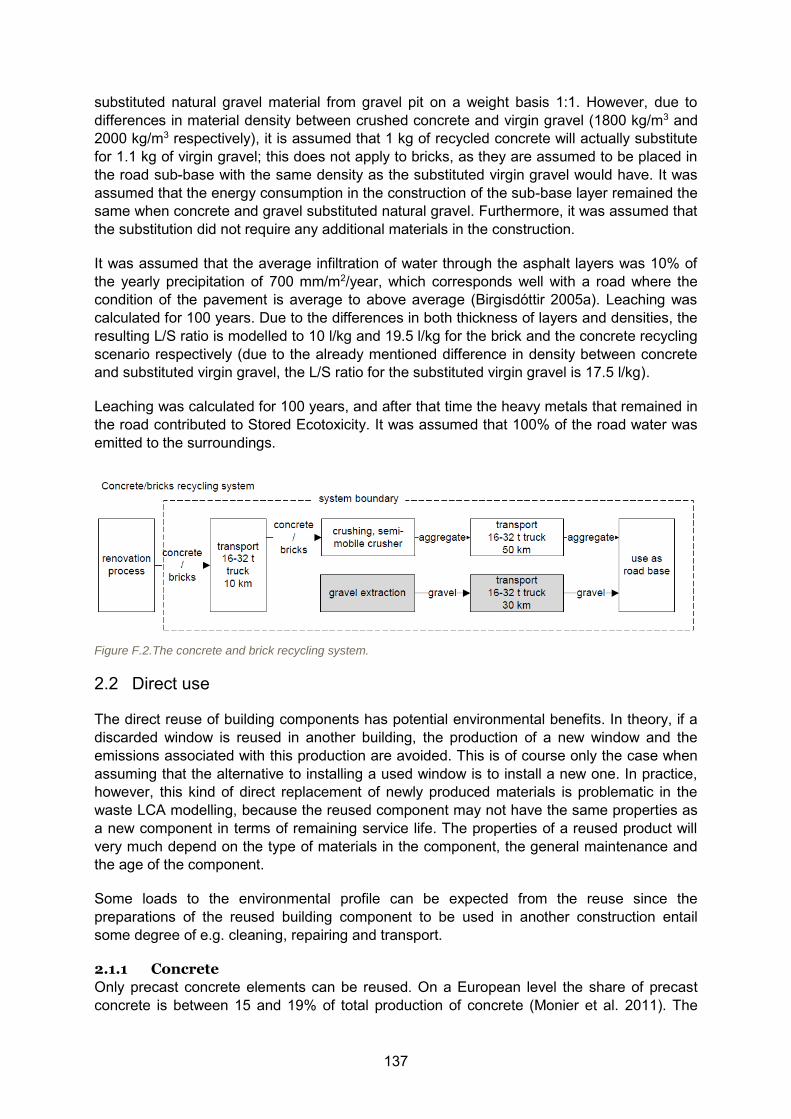
137
substituted natural gravel material from gravel pit on a weight basis 1:1. However, due to differences in material density between crushed concrete and virgin gravel (1800 kg/m3 and 2000 kg/m3 respectively), it is assumed that 1 kg of recycled concrete will actually substitute for 1.1 kg of virgin gravel; this does not apply to bricks, as they are assumed to be placed in the road sub-base with the same density as the substituted virgin gravel would have. It was assumed that the energy consumption in the construction of the sub-base layer remained the same when concrete and gravel substituted natural gravel. Furthermore, it was assumed that the substitution did not require any additional materials in the construction.
It was assumed that the average infiltration of water through the asphalt layers was 10% of the yearly precipitation of 700 mm/m2/year, which corresponds well with a road where the condition of the pavement is average to above average (Birgisdóttir 2005a). Leaching was calculated for 100 years. Due to the differences in both thickness of layers and densities, the resulting L/S ratio is modelled to 10 l/kg and 19.5 l/kg for the brick and the concrete recycling scenario respectively (due to the already mentioned difference in density between concrete and substituted virgin gravel, the L/S ratio for the substituted virgin gravel is 17.5 l/kg).
Leaching was calculated for 100 years, and after that time the heavy metals that remained in the road contributed to Stored Ecotoxicity. It was assumed that 100% of the road water was emitted to the surroundings.
Figure F.2.The concrete and brick recycling system.
2.2 Direct use
The direct reuse of building components has potential environmental benefits. In theory, if a discarded window is reused in another building, the production of a new window and the emissions associated with this production are avoided. This is of course only the case when assuming that the alternative to installing a used window is to install a new one. In practice, however, this kind of direct replacement of newly produced materials is problematic in the waste LCA modelling, because the reused component may not have the same properties as a new component in terms of remaining service life. The properties of a reused product will very much depend on the type of materials in the component, the general maintenance and the age of the component.
Some loads to the environmental profile can be expected from the reuse since the preparations of the reused building component to be used in another construction entail some degree of e.g. cleaning, repairing and transport.
2.1.1 Concrete
Only precast concrete elements can be reused. On a European level the share of precast concrete is between 15 and 19% of total production of concrete (Monier et al. 2011). The
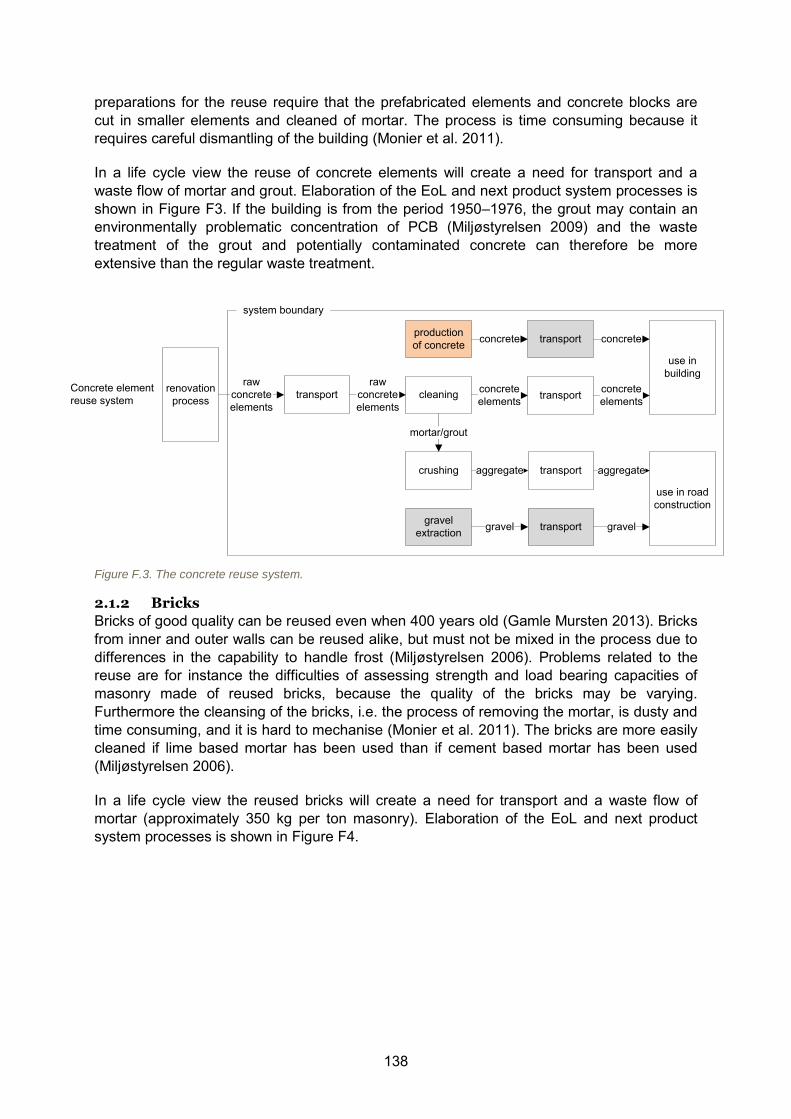
138
preparations for the reuse require that the prefabricated elements and concrete blocks are cut in smaller elements and cleaned of mortar. The process is time consuming because it requires careful dismantling of the building (Monier et al. 2011).
In a life cycle view the reuse of concrete elements will create a need for transport and a waste flow of mortar and grout. Elaboration of the EoL and next product system processes is shown in Figure F3. If the building is from the period 1950–1976, the grout may contain an environmentally problematic concentration of PCB (Miljøstyrelsen 2009) and the waste treatment of the grout and potentially contaminated concrete can therefore be more extensive than the regular waste treatment.
renovation process transport
rawconcreteelements
transport
use in building
cleaningraw
concreteelements
concreteelements
concreteelements
crushing
mortar/grout
production of concrete
transport
use in road construction
gravel extraction
transportconcrete concrete
aggregate
transportgravel gravel
aggregate
Concrete elementreuse system
system boundary
Figure F.3. The concrete reuse system.
2.1.2 Bricks
Bricks of good quality can be reused even when 400 years old (Gamle Mursten 2013). Bricks from inner and outer walls can be reused alike, but must not be mixed in the process due to differences in the capability to handle frost (Miljøstyrelsen 2006). Problems related to the reuse are for instance the difficulties of assessing strength and load bearing capacities of masonry made of reused bricks, because the quality of the bricks may be varying. Furthermore the cleansing of the bricks, i.e. the process of removing the mortar, is dusty and time consuming, and it is hard to mechanise (Monier et al. 2011). The bricks are more easily cleaned if lime based mortar has been used than if cement based mortar has been used (Miljøstyrelsen 2006).
In a life cycle view the reused bricks will create a need for transport and a waste flow of mortar (approximately 350 kg per ton masonry). Elaboration of the EoL and next product system processes is shown in Figure F4.
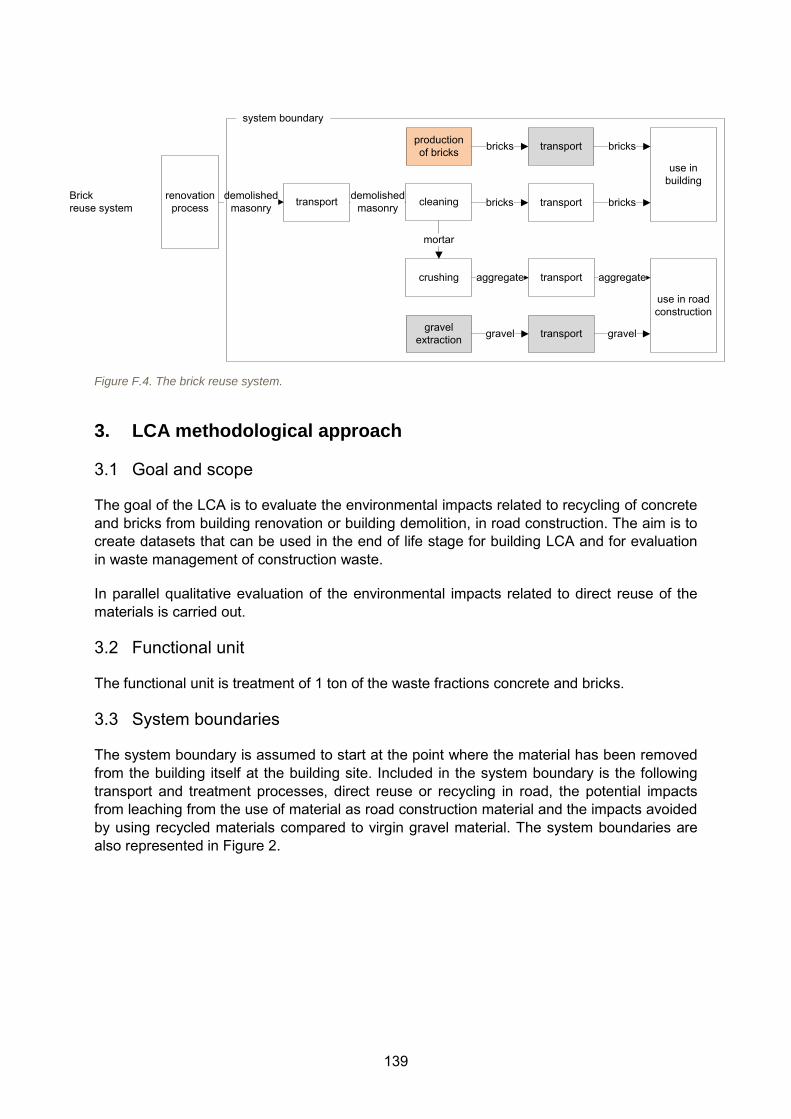
139
renovation process transportdemolished
masonry transport
use in building
cleaningdemolishedmasonry bricks bricks
crushing
mortar
production of bricks
transport
use in road construction
gravel extraction
transportbricks bricks
aggregate
transportgravel gravel
aggregate
Brick reuse system
system boundary
Figure F.4. The brick reuse system.
3. LCA methodological approach
3.1 Goal and scope
The goal of the LCA is to evaluate the environmental impacts related to recycling of concrete and bricks from building renovation or building demolition, in road construction. The aim is to create datasets that can be used in the end of life stage for building LCA and for evaluation in waste management of construction waste.
In parallel qualitative evaluation of the environmental impacts related to direct reuse of the materials is carried out.
3.2 Functional unit
The functional unit is treatment of 1 ton of the waste fractions concrete and bricks.
3.3 System boundaries
The system boundary is assumed to start at the point where the material has been removed from the building itself at the building site. Included in the system boundary is the following transport and treatment processes, direct reuse or recycling in road, the potential impacts from leaching from the use of material as road construction material and the impacts avoided by using recycled materials compared to virgin gravel material. The system boundaries are also represented in Figure 2.
140
3.4 Impact categories
The modelling of the recycling scenarios of concrete and bricks is carried out in the EASETECH model. The following eleven impact categories are evaluated:
CML:
1. Abiotic Depletion Potential (ADP), in kg Sb equiv 2. Global Warming Potential (GWP), in kg CO2 equiv 3. Eutrophication Potential (EP), in kg PO4 equiv 4. Acidification Potential (AP), in kg SO2 equiv 5. Ozone Depletion Potential (ODP), in kg CFC-11 equiv 6. Photochemical Ozone Formation Potential (POFP), in kg ethylene equiv 7. Terrestrial Ecotoxicity (TET), in kg 1,4-DCB equiv 8. Marine Aquatic Ecotoxicity (MAET), in kg 1,4-DCB equiv 9. Marine Sediment Ecotoxicity (MSET), in kg 1,4-DCB equiv
USEtox:
10. Ecotoxicity (ET), in CTUE equiv 11. Human Toxicity (HT), in CTUH equiv
The impact categories no. 1–6 are included as they are mandatory to be included in an EPD, according to EN 15804, and in an LCA of buildings according to EN15978. The impact categories no. 7–11 are all environmental impact categories describing toxicity related to materials. Those are included in order to evaluate the potential impacts related to leaching of dangerous substances from recycling of concrete and bricks in road construction.
An extra category was also evaluated in parallel, i.e. the Stored Ecotoxicity [CTUE equiv]. This category includes the un-emitted amounts of pollutants that are still retained within the road base after the 100 y period, and that could potentially be released afterwards, either in low concentration or all of a sudden, as a consequence of an abrupt event (an earthquake, for instance). It is important to include this category, as what is left after the 100y period might still cause impacts, and therefore should not be forgotten. On the other hand, as the leached amounts during the first 100 years only represent 0.01%-3.5% of the total content, it is also important to keep these potential later emissions separate, to avoid the impacts being completely dominated by them. Because this category is not included in the UseTox impact assessment method, it has been created on purpose, using the UseTox characterization factors, but following the same approach of the method where it originally belonged to: EDIP 97. According to this method, the substances contributing to Stored Ecotoxicity are As , Cd , Cr , Cu, PCDD/F, Pb, Hg, Ni and PAH, and they are assigned the same characterization factors as the traditional ecotoxicity category of EDIP 97; the un-emitted amounts are assumed to be equally split between emissions to soil and to surface water. In the present case, the characterization factors assigned to the Stored Ecotoxicity category were copied from the respective UseTox Ecotoxicity characterization factors.
3.5 Data
Data were collected from different sources: direct measurements were always preferred, but literature publications or life cycle inventories from commercial or public databases were often used instead. Transportation was assumed to take place on a 16–32 ton Euro 3 truck for both concrete and bricks, and for both transportation from the demolition site to the
141
crushing facility (10 km), and from the crushing facility to the final utilization site (50 km). Furthermore, also avoided transportation of the substituted virgin gravel is assumed to take place on the same truck type (30 km). The dataset used was an Ecoinvent truck (transport, lorry 16–32t, EURO3, RER).
Energy requirements for crushing of recycled materials were taken from Mercante et al. 2011 and refer to a recycling facility treating only concrete. Thus, energy requirements for crushing of bricks have been approximated with values relative to concrete (1.02 LDIESEL/tCONCRETE, 2.59 kWhELECTRICITY/tCONCRETE, 1LWATER/tCONCRETE).
Natural gravel extraction has been modelled using data from Birgisdóttir (2005b), where the data are based on estimations from 5 gravel pits in Denmark (4.2, 16.9 and 0.5 MJ/m3
SUBBASE
MATERIAL for electricity, diesel and fuel oil respectively, and 7, 28.2 and 0.9 MJ/m3BASE MATERIAL
for electricity, diesel and fuel oil respectively).
Leaching data have been elaborated based on direct laboratory measurements, and are explained in details in the following. Data are reported in Table F1.
Concrete:
Leaching data from 3 samples subjected to standard column percolation test (CEN 14405) up to L/S 10 L/kg and 17 samples subjected to batch test (EN 12457-3) at L/S 2 and L/S 10. Data were measured from VTT Finland and refer mainly to Finnish concrete.
Data were extrapolated to L/S 19.5 L/kg, which represent 100y time horizon in a road base scenario with the following characteristics:
thickness= 0.20 m density= 1.8 t/m3 precipitation= 700 mm/y infiltration rate= 10%
The extrapolation of the release to L/S 19.5 was carried according to Birgisdóttir (2005), by making use of the "a" and "b" parameters (see Birgisdóttir 2005b)
C(L/S)=a*(L/S)^b.
Emissions are supposed to be distributed as follows (Birgisdóttir 2005a):
85% to unspecified soil and 15% to freshwater concerning metals (Al, As, Cd, Co, Cr, Cu, Fe, Hg, Pb, Mg, Mn, Mo, Ni, Sb, Se, Si, Sn, Sr, V, Zn)
100% to groundwater for salts (Ba, Br, Ca, Cl, DOC, F, K, Na, P, SO4)
Bricks:
Leaching data from 3 samples subjected to standard column percolation test (CEN 14405) up to L/S 10 L/kg and 9 samples subjected to batch test (EN 12457-3) at L/S 2 and L/S 10. Data were measured from VTT Finland and refer mainly to Finnish bricks.
Data correspond to L/S 10 L/kg, which represent 100y time horizon in a road sub-base scenario with the following characteristics:
thickness= 0.37 m density= 1.9 t/m3
142
precipitation= 700mm/y infiltration rate= 10%
Emissions are supposed to be distributed as follows (Birgisdóttir 2005a):
85% to unspecified soil and 15% to freshwater concerning metals (Al, As, Cd, Co, Cr, Cu, Fe, Hg, Pb, Mg, Mn, Mo, Ni, Sb, Se, Si, Sn, Sr, V, Zn)
100% to groundwater for salts (Ba, Br, Ca, Cl, DOC, F, K, Na, P, SO4)
Speciation of As, Sb and V is assumed as follows: As(V), Sb(V), V(V) based on Cornelis et al. 2008.
Natural gravel:
Leaching from Danish natural gravel as calculated in the ROAD-RES model (Birgisdóttir 2005a), based on direct measurements carried out in 2005 in DTU Environment by Gry Sander Janniche on 4 gravel samples (Birgisdóttir 2005b, page 49, 4.4 Grusgravsmateriale). Data for Vanadium from Ole Hjelmar (data from 1999).
Data were taken at the relevant L/S ratio (L/S 10 or 17.5 L/kg), depending on the substituting material (bricks in sub-base or concrete in road base respectively):
Bricks: Data correspond to L/S 10 L/kg, which represent 100y time horizon in a road sub-base scenario with the following characteristics:
thickness= 0.37 m density= 1.9 t/m3 precipitation= 700 mm/y iinfiltration rate= 10%
Concrete: data were extrapolated to L/S 17.5 L/kg, which represent 100y time horizon in a road base scenario with the following characteristics:
thickness= 0.20 m density= 2 t/m3 precipitation= 700 mm/y infiltration rate= 10%
The extrapolation of the release to L/S 17.5 was carried according to Birgisdóttir (2005), by making use of the "a" and "b" parameters (see ROAD-RES Datakatalog)
C(L/S)=a*(L/S)^b.
Emissions are supposed to be distributed as follows (Birgisdóttir 2005a):
85% to unspecified soil and 15% to freshwater concerning metals (Al, As, Cd, Co, Cr, Cu, Fe, Hg, Pb, Mg, Mn, Mo, Ni, Sb, Se, Si, Sn, Sr, V, Zn)
100% to groundwater for salts (Ba, Br, Ca, Cl, DOC, F, K, Na, P, SO4)
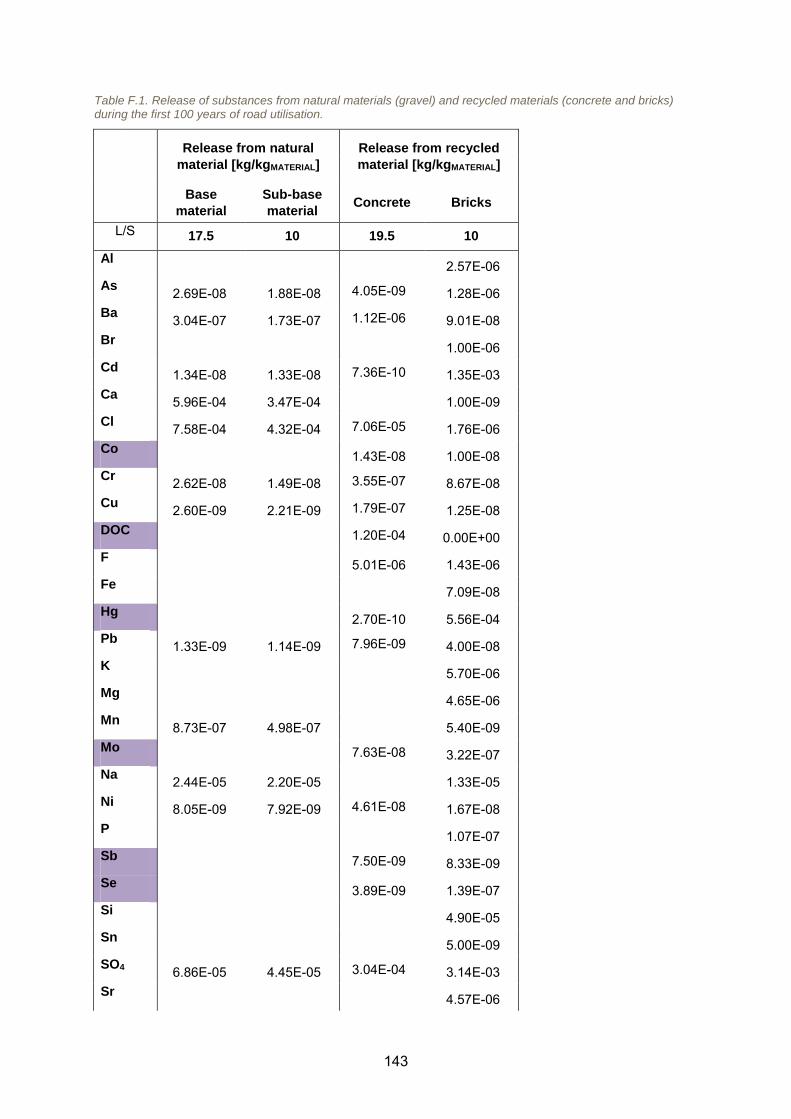
143
Table F.1. Release of substances from natural materials (gravel) and recycled materials (concrete and bricks) during the first 100 years of road utilisation.
Release from natural
material [kg/kgMATERIAL]
Release from recycled
material [kg/kgMATERIAL]
Base
material
Sub-base
material Concrete Bricks
L/S 17.5 10 19.5 10
Al 2.57E-06
As 2.69E-08 1.88E-08 4.05E-09 1.28E-06 Ba 3.04E-07 1.73E-07 1.12E-06 9.01E-08 Br 1.00E-06 Cd 1.34E-08 1.33E-08 7.36E-10 1.35E-03 Ca 5.96E-04 3.47E-04 1.00E-09 Cl 7.58E-04 4.32E-04 7.06E-05 1.76E-06 Co 1.43E-08 1.00E-08 Cr 2.62E-08 1.49E-08 3.55E-07 8.67E-08 Cu 2.60E-09 2.21E-09 1.79E-07 1.25E-08 DOC 1.20E-04 0.00E+00 F 5.01E-06 1.43E-06 Fe 7.09E-08 Hg 2.70E-10 5.56E-04 Pb 1.33E-09 1.14E-09 7.96E-09 4.00E-08 K 5.70E-06 Mg 4.65E-06 Mn 8.73E-07 4.98E-07 5.40E-09 Mo 7.63E-08 3.22E-07 Na 2.44E-05 2.20E-05 1.33E-05 Ni 8.05E-09 7.92E-09 4.61E-08 1.67E-08 P 1.07E-07 Sb 7.50E-09 8.33E-09 Se 3.89E-09 1.39E-07 Si 4.90E-05 Sn 5.00E-09 SO4 6.86E-05 4.45E-05 3.04E-04 3.14E-03 Sr 4.57E-06
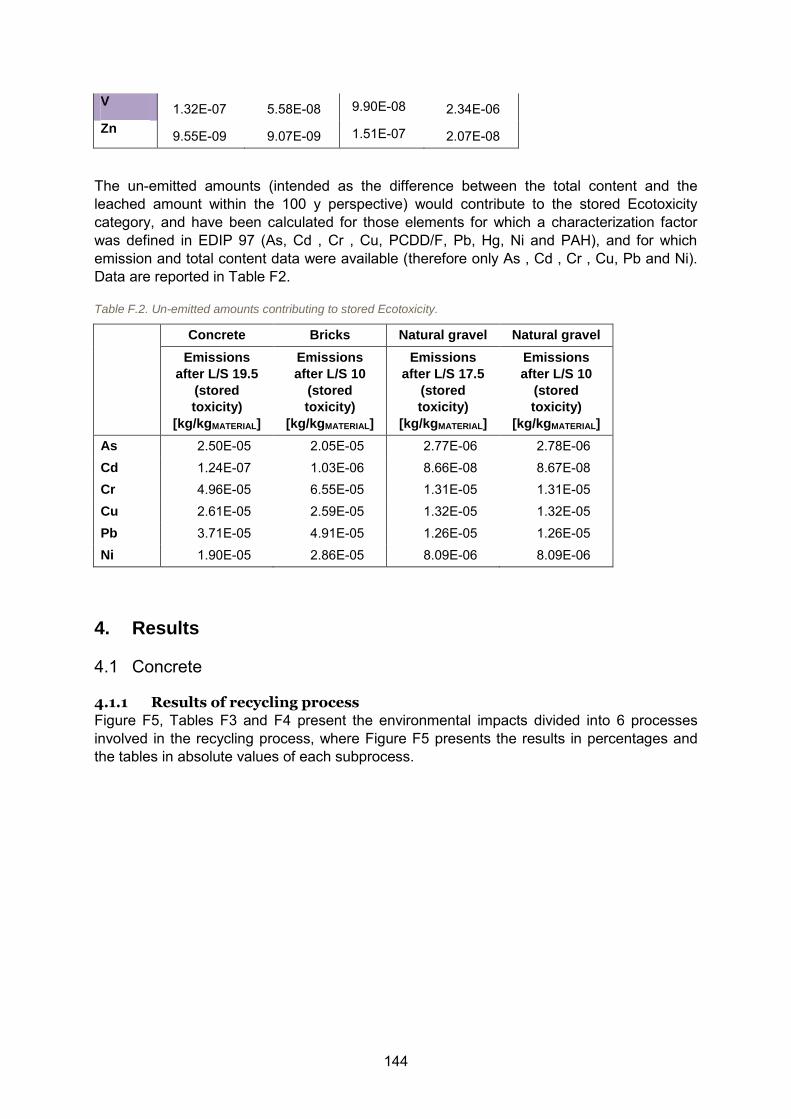
144
V 1.32E-07 5.58E-08 9.90E-08 2.34E-06 Zn 9.55E-09 9.07E-09 1.51E-07 2.07E-08
The un-emitted amounts (intended as the difference between the total content and the leached amount within the 100 y perspective) would contribute to the stored Ecotoxicity category, and have been calculated for those elements for which a characterization factor was defined in EDIP 97 (As, Cd , Cr , Cu, PCDD/F, Pb, Hg, Ni and PAH), and for which emission and total content data were available (therefore only As , Cd , Cr , Cu, Pb and Ni). Data are reported in Table F2.
Table F.2. Un-emitted amounts contributing to stored Ecotoxicity.
Concrete Bricks Natural gravel Natural gravel
Emissions
after L/S 19.5
(stored
toxicity)
[kg/kgMATERIAL]
Emissions
after L/S 10
(stored
toxicity)
[kg/kgMATERIAL]
Emissions
after L/S 17.5
(stored
toxicity)
[kg/kgMATERIAL]
Emissions
after L/S 10
(stored
toxicity)
[kg/kgMATERIAL]
As 2.50E-05 2.05E-05 2.77E-06 2.78E-06 Cd 1.24E-07 1.03E-06 8.66E-08 8.67E-08 Cr 4.96E-05 6.55E-05 1.31E-05 1.31E-05 Cu 2.61E-05 2.59E-05 1.32E-05 1.32E-05 Pb 3.71E-05 4.91E-05 1.26E-05 1.26E-05 Ni 1.90E-05 2.86E-05 8.09E-06 8.09E-06
4. Results
4.1 Concrete
4.1.1 Results of recycling process
Figure F5, Tables F3 and F4 present the environmental impacts divided into 6 processes involved in the recycling process, where Figure F5 presents the results in percentages and the tables in absolute values of each subprocess.
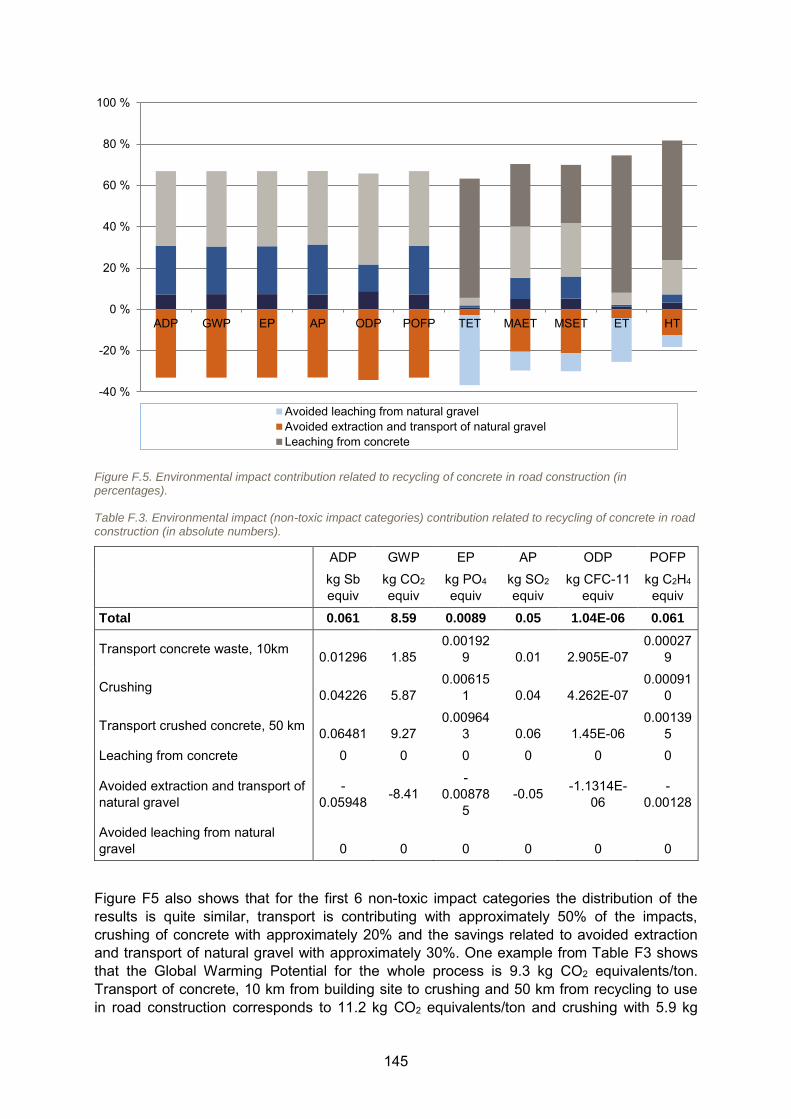
145
Figure F.5. Environmental impact contribution related to recycling of concrete in road construction (in percentages).
Table F.3. Environmental impact (non-toxic impact categories) contribution related to recycling of concrete in road construction (in absolute numbers).
ADP GWP EP AP ODP POFP
kg Sb equiv
kg CO2 equiv
kg PO4 equiv
kg SO2 equiv
kg CFC-11 equiv
kg C2H4 equiv
Total 0.061 8.59 0.0089 0.05 1.04E-06 0.061
Transport concrete waste, 10km 0.01296 1.85 0.00192
9 0.01 2.905E-07 0.00027
9
Crushing 0.04226 5.87 0.00615
1 0.04 4.262E-07 0.00091
0
Transport crushed concrete, 50 km 0.06481 9.27 0.00964
3 0.06 1.45E-06 0.00139
5 Leaching from concrete 0 0 0 0 0 0
Avoided extraction and transport of natural gravel
-0.05948 -8.41
-0.00878
5 -0.05 -1.1314E-
06 -
0.00128
Avoided leaching from natural gravel 0 0 0 0 0 0
Figure F5 also shows that for the first 6 non-toxic impact categories the distribution of the results is quite similar, transport is contributing with approximately 50% of the impacts, crushing of concrete with approximately 20% and the savings related to avoided extraction and transport of natural gravel with approximately 30%. One example from Table F3 shows that the Global Warming Potential for the whole process is 9.3 kg CO2 equivalents/ton. Transport of concrete, 10 km from building site to crushing and 50 km from recycling to use in road construction corresponds to 11.2 kg CO2 equivalents/ton and crushing with 5.9 kg
-40 %
-20 %
0 %
20 %
40 %
60 %
80 %
100 %
ADP GWP EP AP ODP POFP TET MAET MSET ET HT
Avoided leaching from natural gravelAvoided extraction and transport of natural gravelLeaching from concrete
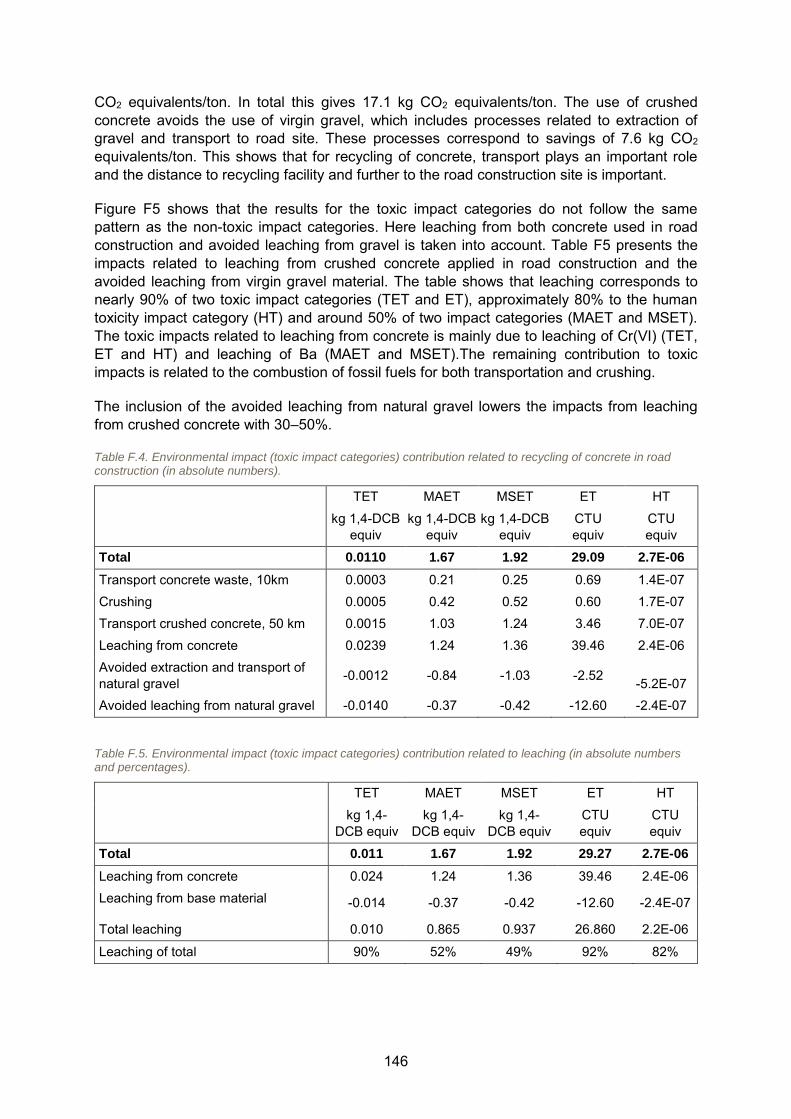
146
CO2 equivalents/ton. In total this gives 17.1 kg CO2 equivalents/ton. The use of crushed concrete avoids the use of virgin gravel, which includes processes related to extraction of gravel and transport to road site. These processes correspond to savings of 7.6 kg CO2 equivalents/ton. This shows that for recycling of concrete, transport plays an important role and the distance to recycling facility and further to the road construction site is important.
Figure F5 shows that the results for the toxic impact categories do not follow the same pattern as the non-toxic impact categories. Here leaching from both concrete used in road construction and avoided leaching from gravel is taken into account. Table F5 presents the impacts related to leaching from crushed concrete applied in road construction and the avoided leaching from virgin gravel material. The table shows that leaching corresponds to nearly 90% of two toxic impact categories (TET and ET), approximately 80% to the human toxicity impact category (HT) and around 50% of two impact categories (MAET and MSET). The toxic impacts related to leaching from concrete is mainly due to leaching of Cr(VI) (TET, ET and HT) and leaching of Ba (MAET and MSET).The remaining contribution to toxic impacts is related to the combustion of fossil fuels for both transportation and crushing.
The inclusion of the avoided leaching from natural gravel lowers the impacts from leaching from crushed concrete with 30–50%.
Table F.4. Environmental impact (toxic impact categories) contribution related to recycling of concrete in road construction (in absolute numbers).
TET MAET MSET ET HT
kg 1,4-DCB equiv
kg 1,4-DCB equiv
kg 1,4-DCB equiv
CTU equiv
CTU equiv
Total 0.0110 1.67 1.92 29.09 2.7E-06
Transport concrete waste, 10km 0.0003 0.21 0.25 0.69 1.4E-07 Crushing 0.0005 0.42 0.52 0.60 1.7E-07 Transport crushed concrete, 50 km 0.0015 1.03 1.24 3.46 7.0E-07 Leaching from concrete 0.0239 1.24 1.36 39.46 2.4E-06 Avoided extraction and transport of natural gravel -0.0012 -0.84 -1.03 -2.52 -5.2E-07 Avoided leaching from natural gravel -0.0140 -0.37 -0.42 -12.60 -2.4E-07
Table F.5. Environmental impact (toxic impact categories) contribution related to leaching (in absolute numbers and percentages).
TET MAET MSET ET HT
kg 1,4-DCB equiv
kg 1,4-DCB equiv
kg 1,4-DCB equiv
CTU equiv
CTU equiv
Total 0.011 1.67 1.92 29.27 2.7E-06
Leaching from concrete 0.024 1.24 1.36 39.46 2.4E-06 Leaching from base material -0.014 -0.37 -0.42 -12.60 -2.4E-07
Total leaching 0.010 0.865 0.937 26.860 2.2E-06
Leaching of total 90% 52% 49% 92% 82%
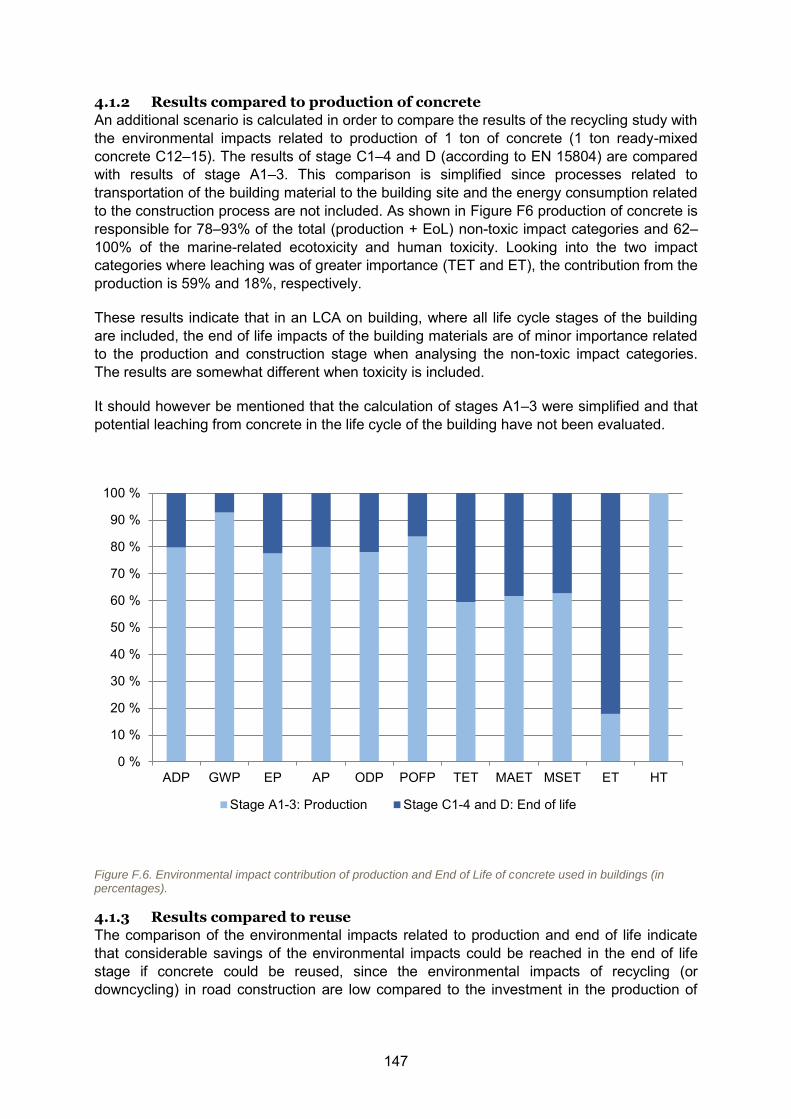
147
4.1.2 Results compared to production of concrete
An additional scenario is calculated in order to compare the results of the recycling study with the environmental impacts related to production of 1 ton of concrete (1 ton ready-mixed concrete C12–15). The results of stage C1–4 and D (according to EN 15804) are compared with results of stage A1–3. This comparison is simplified since processes related to transportation of the building material to the building site and the energy consumption related to the construction process are not included. As shown in Figure F6 production of concrete is responsible for 78–93% of the total (production + EoL) non-toxic impact categories and 62–100% of the marine-related ecotoxicity and human toxicity. Looking into the two impact categories where leaching was of greater importance (TET and ET), the contribution from the production is 59% and 18%, respectively.
These results indicate that in an LCA on building, where all life cycle stages of the building are included, the end of life impacts of the building materials are of minor importance related to the production and construction stage when analysing the non-toxic impact categories. The results are somewhat different when toxicity is included.
It should however be mentioned that the calculation of stages A1–3 were simplified and that potential leaching from concrete in the life cycle of the building have not been evaluated.
Figure F.6. Environmental impact contribution of production and End of Life of concrete used in buildings (in percentages).
4.1.3 Results compared to reuse
The comparison of the environmental impacts related to production and end of life indicate that considerable savings of the environmental impacts could be reached in the end of life stage if concrete could be reused, since the environmental impacts of recycling (or downcycling) in road construction are low compared to the investment in the production of
0 %
10 %
20 %
30 %
40 %
50 %
60 %
70 %
80 %
90 %
100 %
ADP GWP EP AP ODP POFP TET MAET MSET ET HT
Stage A1-3: Production Stage C1-4 and D: End of life
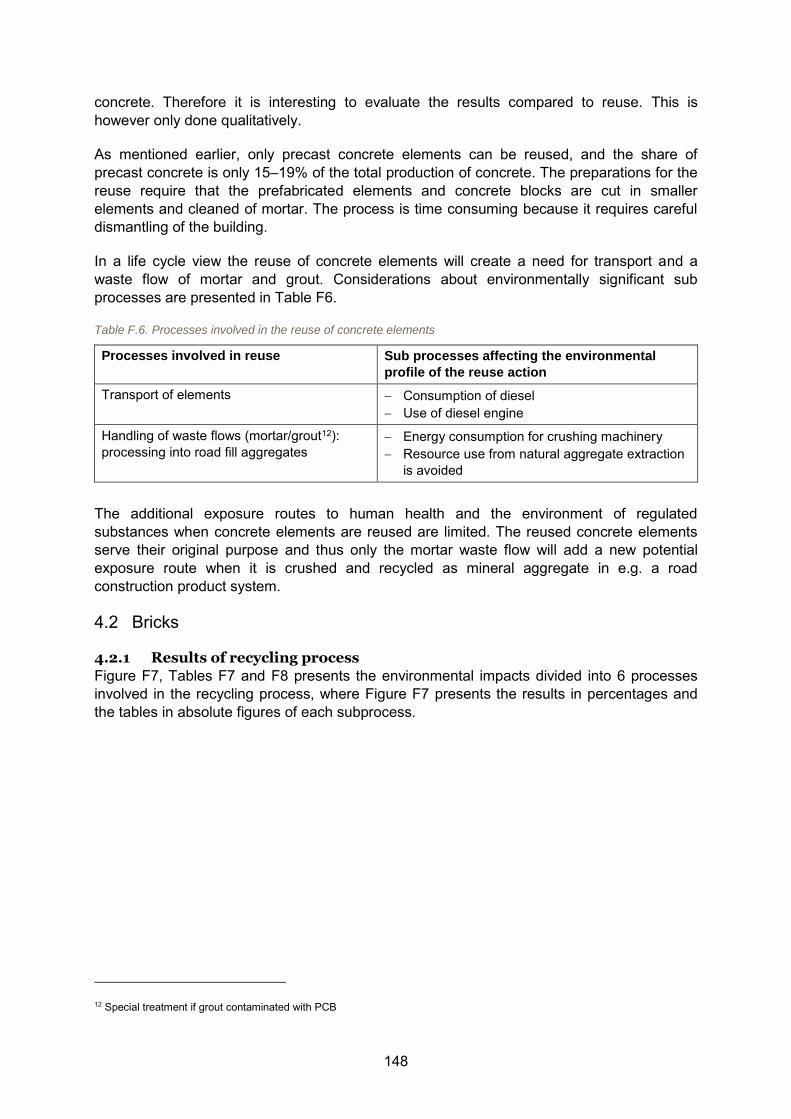
148
concrete. Therefore it is interesting to evaluate the results compared to reuse. This is however only done qualitatively.
As mentioned earlier, only precast concrete elements can be reused, and the share of precast concrete is only 15–19% of the total production of concrete. The preparations for the reuse require that the prefabricated elements and concrete blocks are cut in smaller elements and cleaned of mortar. The process is time consuming because it requires careful dismantling of the building.
In a life cycle view the reuse of concrete elements will create a need for transport and a waste flow of mortar and grout. Considerations about environmentally significant sub processes are presented in Table F6.
Table F.6. Processes involved in the reuse of concrete elements
Processes involved in reuse Sub processes affecting the environmental
profile of the reuse action
Transport of elements Consumption of diesel Use of diesel engine
Handling of waste flows (mortar/grout12): processing into road fill aggregates
Energy consumption for crushing machinery Resource use from natural aggregate extraction
is avoided
The additional exposure routes to human health and the environment of regulated substances when concrete elements are reused are limited. The reused concrete elements serve their original purpose and thus only the mortar waste flow will add a new potential exposure route when it is crushed and recycled as mineral aggregate in e.g. a road construction product system.
4.2 Bricks
4.2.1 Results of recycling process
Figure F7, Tables F7 and F8 presents the environmental impacts divided into 6 processes involved in the recycling process, where Figure F7 presents the results in percentages and the tables in absolute figures of each subprocess.
12 Special treatment if grout contaminated with PCB
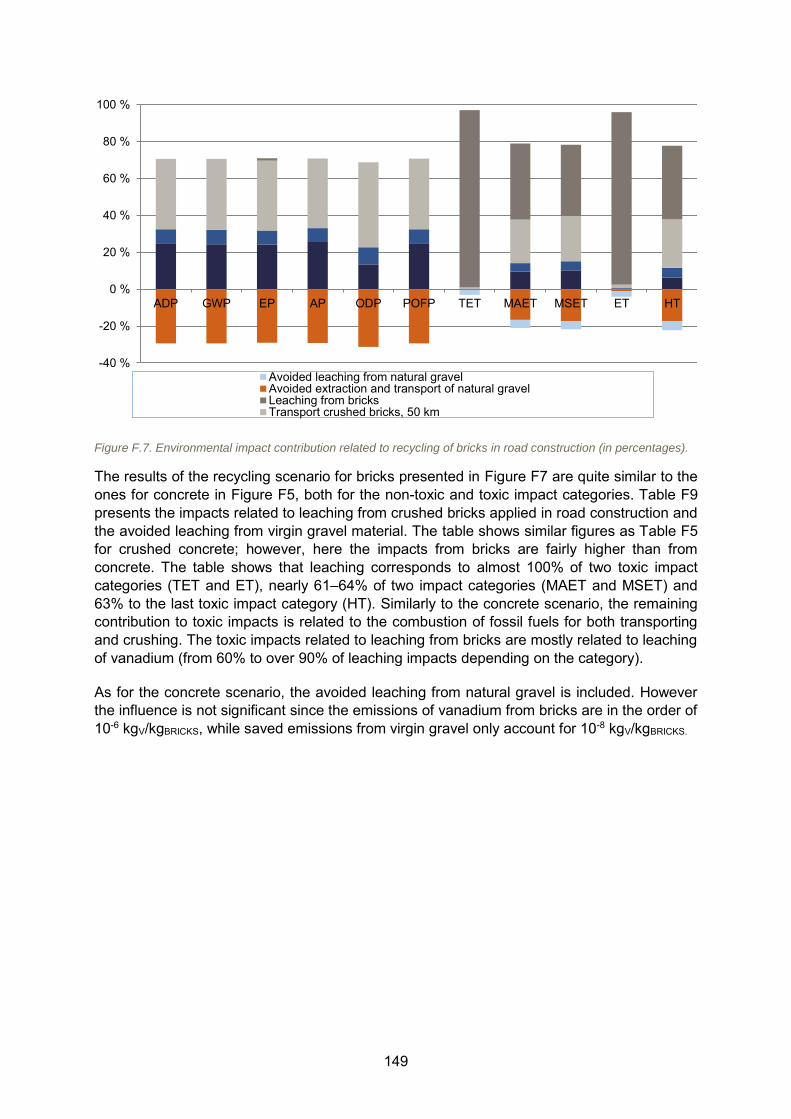
149
Figure F.7. Environmental impact contribution related to recycling of bricks in road construction (in percentages).
The results of the recycling scenario for bricks presented in Figure F7 are quite similar to the ones for concrete in Figure F5, both for the non-toxic and toxic impact categories. Table F9 presents the impacts related to leaching from crushed bricks applied in road construction and the avoided leaching from virgin gravel material. The table shows similar figures as Table F5 for crushed concrete; however, here the impacts from bricks are fairly higher than from concrete. The table shows that leaching corresponds to almost 100% of two toxic impact categories (TET and ET), nearly 61–64% of two impact categories (MAET and MSET) and 63% to the last toxic impact category (HT). Similarly to the concrete scenario, the remaining contribution to toxic impacts is related to the combustion of fossil fuels for both transporting and crushing. The toxic impacts related to leaching from bricks are mostly related to leaching of vanadium (from 60% to over 90% of leaching impacts depending on the category).
As for the concrete scenario, the avoided leaching from natural gravel is included. However the influence is not significant since the emissions of vanadium from bricks are in the order of 10-6 kgV/kgBRICKS, while saved emissions from virgin gravel only account for 10-8 kgV/kgBRICKS.
-40 %
-20 %
0 %
20 %
40 %
60 %
80 %
100 %
ADP GWP EP AP ODP POFP TET MAET MSET ET HT
Avoided leaching from natural gravelAvoided extraction and transport of natural gravelLeaching from bricksTransport crushed bricks, 50 km
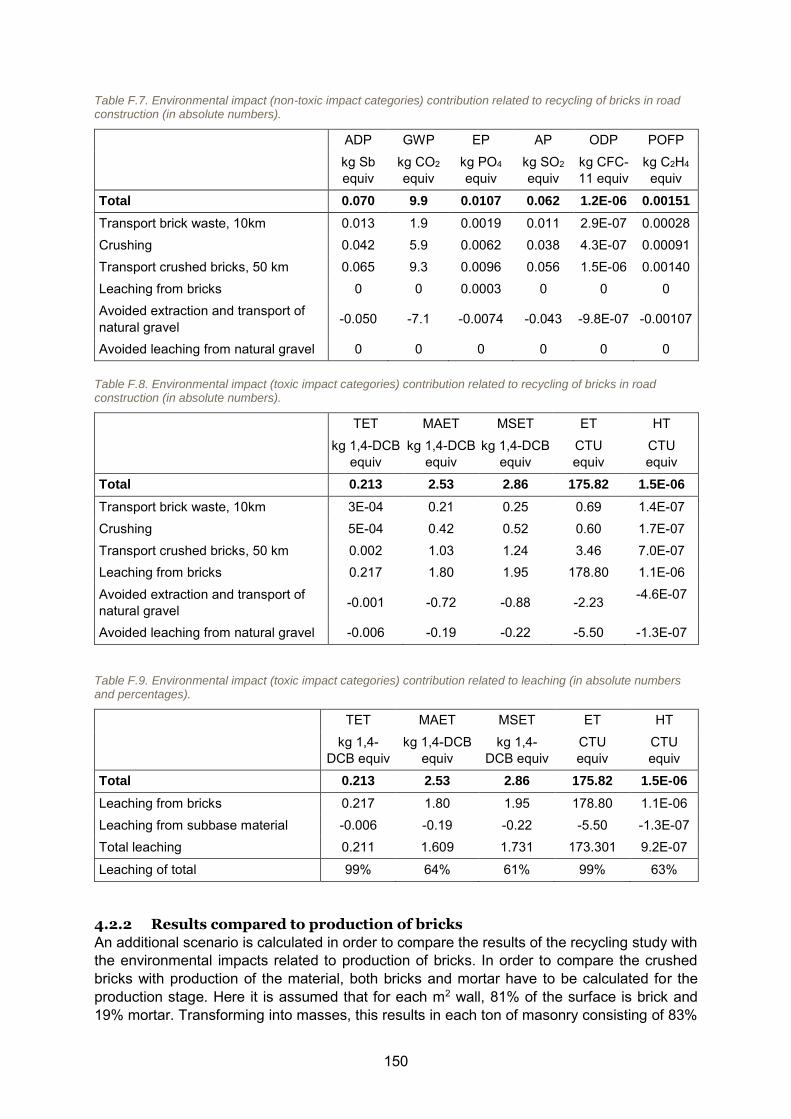
150
Table F.7. Environmental impact (non-toxic impact categories) contribution related to recycling of bricks in road construction (in absolute numbers).
ADP GWP EP AP ODP POFP
kg Sb equiv
kg CO2 equiv
kg PO4 equiv
kg SO2 equiv
kg CFC-11 equiv
kg C2H4
equiv
Total 0.070 9.9 0.0107 0.062 1.2E-06 0.00151
Transport brick waste, 10km 0.013 1.9 0.0019 0.011 2.9E-07 0.00028 Crushing 0.042 5.9 0.0062 0.038 4.3E-07 0.00091 Transport crushed bricks, 50 km 0.065 9.3 0.0096 0.056 1.5E-06 0.00140 Leaching from bricks 0 0 0.0003 0 0 0 Avoided extraction and transport of natural gravel -0.050 -7.1 -0.0074 -0.043 -9.8E-07 -0.00107
Avoided leaching from natural gravel 0 0 0 0 0 0
Table F.8. Environmental impact (toxic impact categories) contribution related to recycling of bricks in road construction (in absolute numbers).
TET MAET MSET ET HT
kg 1,4-DCB equiv
kg 1,4-DCB equiv
kg 1,4-DCB equiv
CTU equiv
CTU equiv
Total 0.213 2.53 2.86 175.82 1.5E-06
Transport brick waste, 10km 3E-04 0.21 0.25 0.69 1.4E-07 Crushing 5E-04 0.42 0.52 0.60 1.7E-07 Transport crushed bricks, 50 km 0.002 1.03 1.24 3.46 7.0E-07 Leaching from bricks 0.217 1.80 1.95 178.80 1.1E-06 Avoided extraction and transport of natural gravel -0.001 -0.72 -0.88 -2.23 -4.6E-07
Avoided leaching from natural gravel -0.006 -0.19 -0.22 -5.50 -1.3E-07
Table F.9. Environmental impact (toxic impact categories) contribution related to leaching (in absolute numbers and percentages).
TET MAET MSET ET HT
kg 1,4-DCB equiv
kg 1,4-DCB equiv
kg 1,4-DCB equiv
CTU equiv
CTU equiv
Total 0.213 2.53 2.86 175.82 1.5E-06
Leaching from bricks 0.217 1.80 1.95 178.80 1.1E-06 Leaching from subbase material -0.006 -0.19 -0.22 -5.50 -1.3E-07 Total leaching 0.211 1.609 1.731 173.301 9.2E-07
Leaching of total 99% 64% 61% 99% 63%
4.2.2 Results compared to production of bricks
An additional scenario is calculated in order to compare the results of the recycling study with the environmental impacts related to production of bricks. In order to compare the crushed bricks with production of the material, both bricks and mortar have to be calculated for the production stage. Here it is assumed that for each m2 wall, 81% of the surface is brick and 19% mortar. Transforming into masses, this results in each ton of masonry consisting of 83%
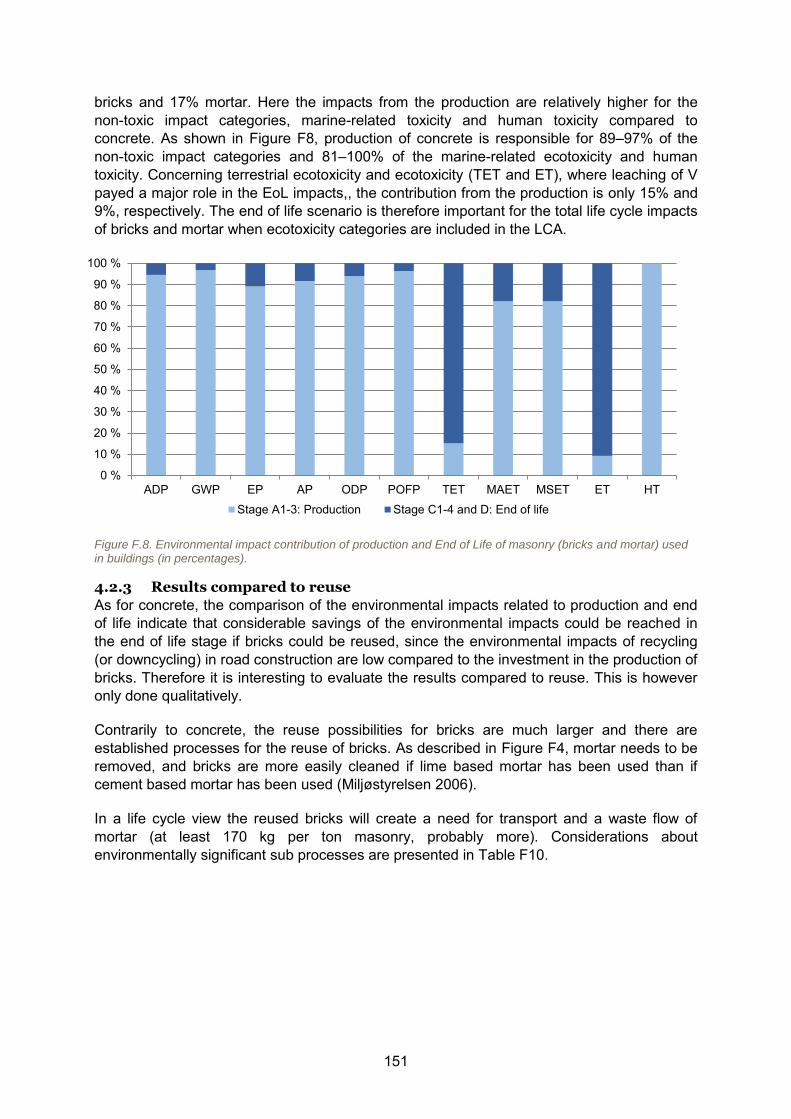
151
bricks and 17% mortar. Here the impacts from the production are relatively higher for the non-toxic impact categories, marine-related toxicity and human toxicity compared to concrete. As shown in Figure F8, production of concrete is responsible for 89–97% of the non-toxic impact categories and 81–100% of the marine-related ecotoxicity and human toxicity. Concerning terrestrial ecotoxicity and ecotoxicity (TET and ET), where leaching of V payed a major role in the EoL impacts,, the contribution from the production is only 15% and 9%, respectively. The end of life scenario is therefore important for the total life cycle impacts of bricks and mortar when ecotoxicity categories are included in the LCA.
Figure F.8. Environmental impact contribution of production and End of Life of masonry (bricks and mortar) used in buildings (in percentages).
4.2.3 Results compared to reuse
As for concrete, the comparison of the environmental impacts related to production and end of life indicate that considerable savings of the environmental impacts could be reached in the end of life stage if bricks could be reused, since the environmental impacts of recycling (or downcycling) in road construction are low compared to the investment in the production of bricks. Therefore it is interesting to evaluate the results compared to reuse. This is however only done qualitatively.
Contrarily to concrete, the reuse possibilities for bricks are much larger and there are established processes for the reuse of bricks. As described in Figure F4, mortar needs to be removed, and bricks are more easily cleaned if lime based mortar has been used than if cement based mortar has been used (Miljøstyrelsen 2006).
In a life cycle view the reused bricks will create a need for transport and a waste flow of mortar (at least 170 kg per ton masonry, probably more). Considerations about environmentally significant sub processes are presented in Table F10.
0 %
10 %
20 %
30 %
40 %
50 %
60 %
70 %
80 %
90 %
100 %
ADP GWP EP AP ODP POFP TET MAET MSET ET HTStage A1-3: Production Stage C1-4 and D: End of life
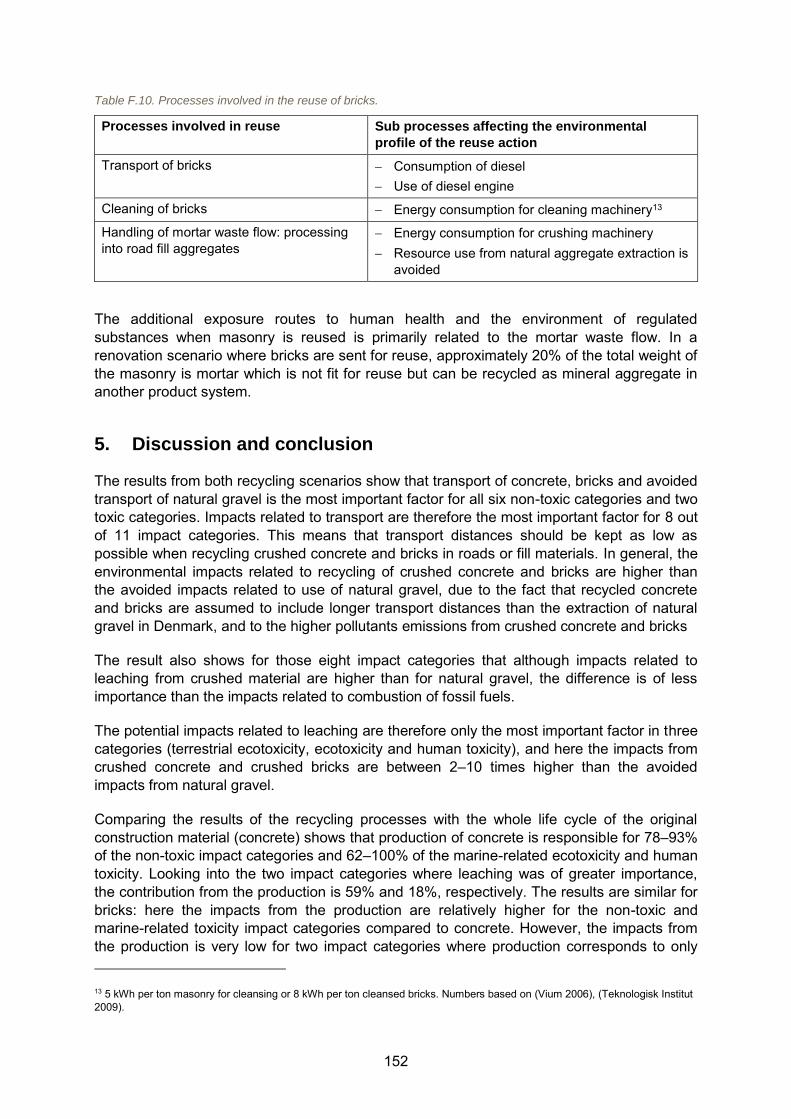
152
Table F.10. Processes involved in the reuse of bricks.
Processes involved in reuse Sub processes affecting the environmental
profile of the reuse action
Transport of bricks Consumption of diesel Use of diesel engine
Cleaning of bricks Energy consumption for cleaning machinery13
Handling of mortar waste flow: processing into road fill aggregates
Energy consumption for crushing machinery Resource use from natural aggregate extraction is
avoided
The additional exposure routes to human health and the environment of regulated substances when masonry is reused is primarily related to the mortar waste flow. In a renovation scenario where bricks are sent for reuse, approximately 20% of the total weight of the masonry is mortar which is not fit for reuse but can be recycled as mineral aggregate in another product system.
5. Discussion and conclusion
The results from both recycling scenarios show that transport of concrete, bricks and avoided transport of natural gravel is the most important factor for all six non-toxic categories and two toxic categories. Impacts related to transport are therefore the most important factor for 8 out of 11 impact categories. This means that transport distances should be kept as low as possible when recycling crushed concrete and bricks in roads or fill materials. In general, the environmental impacts related to recycling of crushed concrete and bricks are higher than the avoided impacts related to use of natural gravel, due to the fact that recycled concrete and bricks are assumed to include longer transport distances than the extraction of natural gravel in Denmark, and to the higher pollutants emissions from crushed concrete and bricks
The result also shows for those eight impact categories that although impacts related to leaching from crushed material are higher than for natural gravel, the difference is of less importance than the impacts related to combustion of fossil fuels.
The potential impacts related to leaching are therefore only the most important factor in three categories (terrestrial ecotoxicity, ecotoxicity and human toxicity), and here the impacts from crushed concrete and crushed bricks are between 2–10 times higher than the avoided impacts from natural gravel.
Comparing the results of the recycling processes with the whole life cycle of the original construction material (concrete) shows that production of concrete is responsible for 78–93% of the non-toxic impact categories and 62–100% of the marine-related ecotoxicity and human toxicity. Looking into the two impact categories where leaching was of greater importance, the contribution from the production is 59% and 18%, respectively. The results are similar for bricks: here the impacts from the production are relatively higher for the non-toxic and marine-related toxicity impact categories compared to concrete. However, the impacts from the production is very low for two impact categories where production corresponds to only 13 5 kWh per ton masonry for cleansing or 8 kWh per ton cleansed bricks. Numbers based on (Vium 2006), (Teknologisk Institut 2009).
153
15% and 9% of terrestrial ecotoxicity and aquatic ecotoxicity. These results indicate that in an LCA on building, where all life cycle stages of the building are included, the End of Life impacts of the building materials are of minor importance related to the production and construction stage when analysing the non-toxic impact categories, especially for bricks. The results are somewhat different when toxicity is included. Despite some uncertainties, the results still show that recycling of concrete and bricks is important. Due to the higher environmental impacts related to the production of the materials, the scenario also indicates that reuse of those materials (upcycling) should be preferred if possible rather than recycling as crushed material (downcycling).
References
Birgisdóttir, H. 2005a. Life cycle assessment model for road construction and use of residues from waste incineration. Institute of Environment & Resources. Ph.D. Thesis. Technical University of Denmark, Kgs. Lyngby, Denmark.
Birgisdóttir, H. 2005b. Roadres Datakatalog (Et baggrundsmateriale til udvikling af et livscyklusvurderingsværktøj for vejbygning og disponering af restprodukter fra affaldsforbrænding på Miljø & Ressourcer DTU i samarbejde med IPU DTU, Vejdirektoratet, Amagerforbrænding I/S, Vestforbrænding I/S og Ålborg Portland A/S). Institut for Miljø & Ressourcer DTU, Danmarks Tekniske Universitet, Lyngby.
EN 15804:2012. Sustainability of construction works – Environmental product declarations – Core rules for the product category of construction products. European Committee for Standardization, Bruxelles.
EIA. 2005. Energy Information Administration, U.S. Department of Energy. International Energy Outlook 2005. July 2005. http://www.eia.gov/forecasts/archive/ieo05/pdf/0484%282005%29.pdf.
Eurostat. 2010. Environmental Data Centre on Waste. Retrieved at: http://epp.eurostat.ec.europa.eu/portal/page/portal/waste/waste_generation_management/generation on March 2013.
GI. 2006. Bedre vinduer – en vejledning for bygningsejere. Grundejernes Investeringsfond.
IPCC. 2007. Jean Bogner, Mohammed Abdelrafie Ahmed, Cristobal Diaz, Andre Faaij, Qingxian Gao,Seiji Hashimoto, Katarina Mareckova, Riitta Pipatti, Tianzhu Zhang, Luis Diaz, Peter Kjeldsen, Suvi Monni, Robert Gregory, R.T.M. Sutamihardja. Contribution of Working Group III to the Fourth Assessment Report of the Intergovernmental Panel on Climate Change, 2007. Cambridge University Press, Cambridge, United Kingdom and New York, NY, USA.
JRC. 2011. European Commission. Supporting Environmentally Sound Decisions for Construction and Demolition (C&D) Waste Management.
Mercante, I.T., Bovea, M.D., Ibáñez-Forés, V. & Arena, A.P. 2011. Life cycle assessment of construction and demolition waste management systems: a Spanish case study. The International Journal of Life Cycle Assessment 17(2), pp. 232–241.
Miljøstyrelsen. 2006. Affaldsforebyggelse ved renovering. Arbejdsrapport fra Miljøstyrelsen nr 42.
154
Gamle Mursten, 2013. Retrieved from: http://gamlemursten.dk/images/stories/produktblade/20110708%20handrensede%20mursten.pdf March 2013.
Gunnarsen, L., Larsen, J.C., Mayer, P. & Sebastian, W. 2009. Sundhedsmæssig vurdering af PCB-holdige bygningsfuger. Orientering fra Miljøstyrelsen nr 1. Miljøstyrelsen.
Monier, V. et al. 2011. Study on the management of construction and demolition waste in the EU. Final report for the European Commission (DG Environment).
Teknologisk Institut. 2009. Murerhåndbogen 2010. Murerfagets Oplysningsråd.
155
Appendix G: LCA on civil engineering works
Martin Erlandsson, IVL
1. Aim of the study
The case study for civil engineering works aims at describing how the LCA can be developed and interpreted for recycling of construction products (here asphalt) in same road construction or in a new application (the same intended use or other potential uses after recycling). The LCA developed here follows and describes the implementation of the so call core PCR for construction product (EN 15804). A specific focus is on release of harmful compounds. Two systems for characterization of toxicity are compared.
2. Materials and alternative uses
A generic asphalt product is used as a case study object and the functional unit is defined as 1 m2 asphalt in a road construction as a pavement. The bound flexible pavement (over the bound sub-base) has the following structure: 50 mm AC 14, 50 mm AC 20 and a bitumen emulsion curing coat (0.25 kg/m2). The use of virgin asphalt corresponds to current practise in Sweden. After a use of 20 years following alternatives for the pavements are evaluated:
Scenario 1: Remix, 100% in situ recycling by adding 0.6 weight-% new bitumen. The process includes a milling of the upper 40 mm of the surface layer and the same amount it then heated and recycled on site. Therefore, only the 40 mm top layer (and not the whole asphalt layer) amount is assumed to be saved by this recycling process (i.e. 96 of 240 kg per m2).
Scenario 2: Granulate on gravel road surface (30 mm height and 7% infiltration rate) Scenario 3: Unbound base layer (150 mm height and 7% infiltration rate) and Scenario 4: A hypothetical case where the asphalt is dumped at a landfill for non-
hazardous waste (10 m height and 7% infiltration rate)
System boundary
In the EPD it is optional to give information on future recycling (in the so called module D). In the Remix regime the recycling is assumed to ’save’ or ‘replace’ virgin asphalt (see in Figure G1).
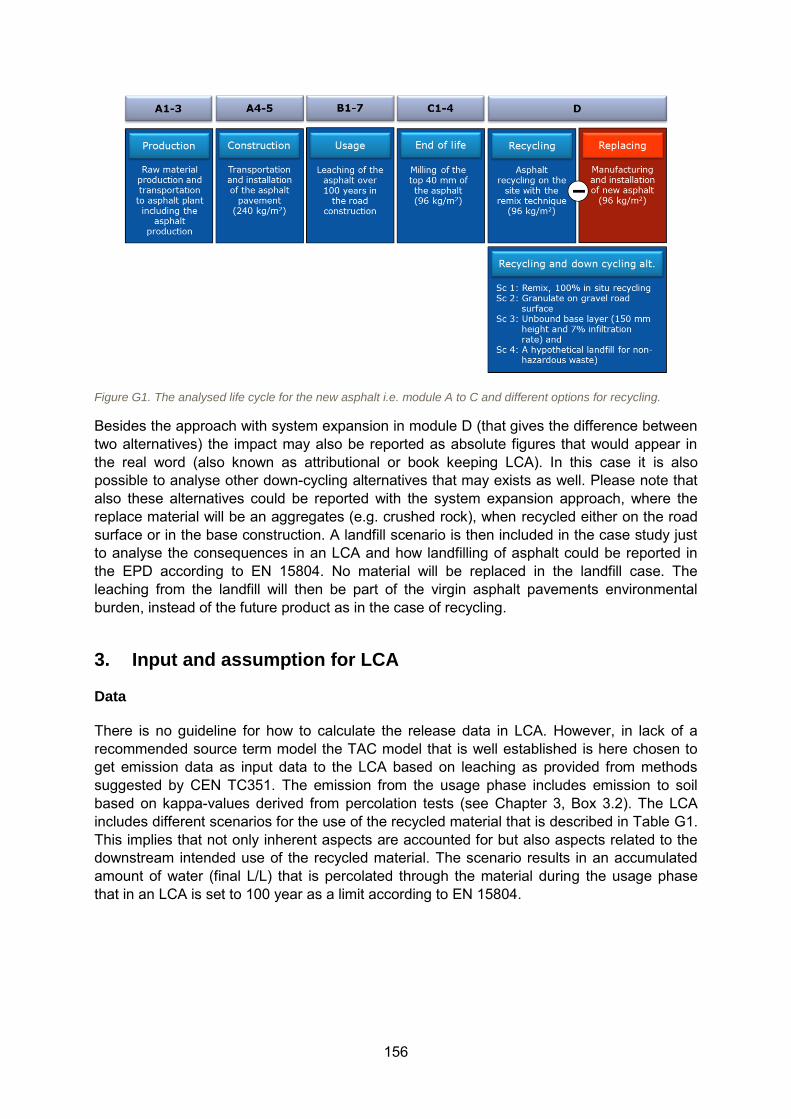
156
Figure G1. The analysed life cycle for the new asphalt i.e. module A to C and different options for recycling.
Besides the approach with system expansion in module D (that gives the difference between two alternatives) the impact may also be reported as absolute figures that would appear in the real word (also known as attributional or book keeping LCA). In this case it is also possible to analyse other down-cycling alternatives that may exists as well. Please note that also these alternatives could be reported with the system expansion approach, where the replace material will be an aggregates (e.g. crushed rock), when recycled either on the road surface or in the base construction. A landfill scenario is then included in the case study just to analyse the consequences in an LCA and how landfilling of asphalt could be reported in the EPD according to EN 15804. No material will be replaced in the landfill case. The leaching from the landfill will then be part of the virgin asphalt pavements environmental burden, instead of the future product as in the case of recycling.
3. Input and assumption for LCA
Data
There is no guideline for how to calculate the release data in LCA. However, in lack of a recommended source term model the TAC model that is well established is here chosen to get emission data as input data to the LCA based on leaching as provided from methods suggested by CEN TC351. The emission from the usage phase includes emission to soil based on kappa-values derived from percolation tests (see Chapter 3, Box 3.2). The LCA includes different scenarios for the use of the recycled material that is described in Table G1. This implies that not only inherent aspects are accounted for but also aspects related to the downstream intended use of the recycled material. The scenario results in an accumulated amount of water (final L/L) that is percolated through the material during the usage phase that in an LCA is set to 100 year as a limit according to EN 15804.
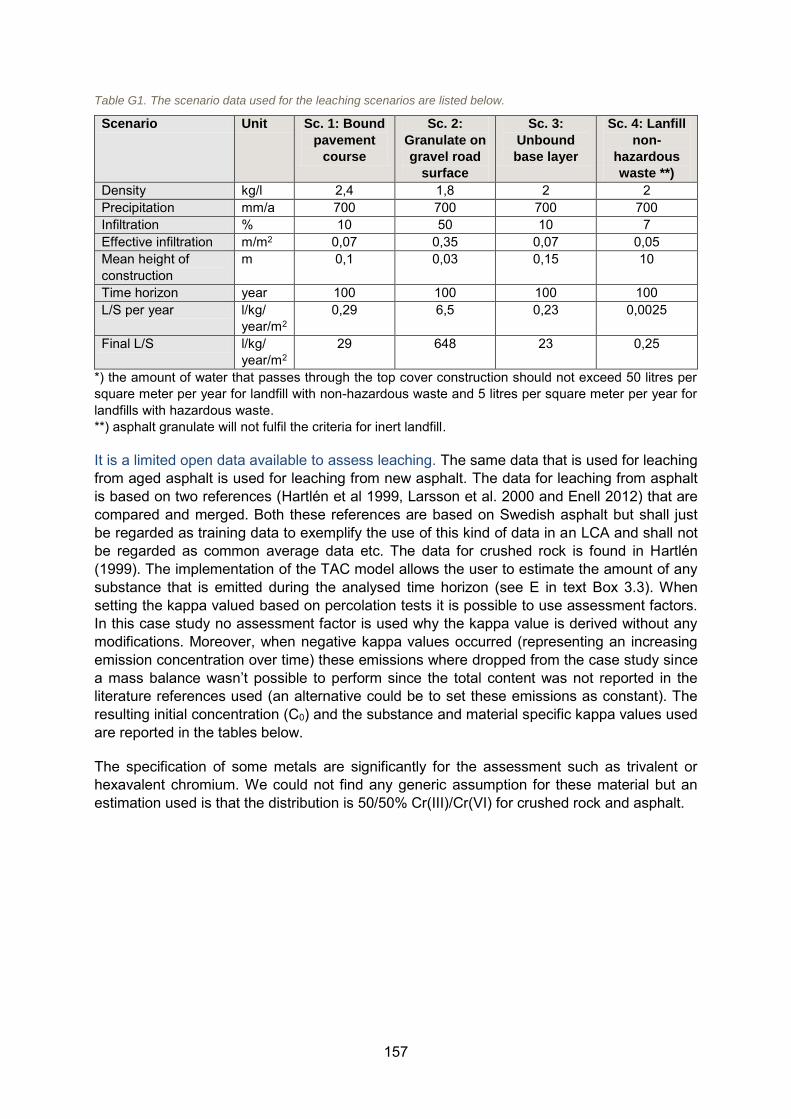
157
Table G1. The scenario data used for the leaching scenarios are listed below.
Scenario Unit Sc. 1: Bound
pavement
course
Sc. 2:
Granulate on
gravel road
surface
Sc. 3:
Unbound
base layer
Sc. 4: Lanfill
non-
hazardous
waste **)
Density kg/l 2,4 1,8 2 2 Precipitation mm/a 700 700 700 700 Infiltration % 10 50 10 7 Effective infiltration m/m2 0,07 0,35 0,07 0,05 Mean height of construction
m 0,1 0,03 0,15 10
Time horizon year 100 100 100 100 L/S per year l/kg/
year/m2 0,29 6,5 0,23 0,0025
Final L/S l/kg/ year/m2
29 648 23 0,25
*) the amount of water that passes through the top cover construction should not exceed 50 litres per square meter per year for landfill with non-hazardous waste and 5 litres per square meter per year for landfills with hazardous waste. **) asphalt granulate will not fulfil the criteria for inert landfill.
It is a limited open data available to assess leaching. The same data that is used for leaching from aged asphalt is used for leaching from new asphalt. The data for leaching from asphalt is based on two references (Hartlén et al 1999, Larsson et al. 2000 and Enell 2012) that are compared and merged. Both these references are based on Swedish asphalt but shall just be regarded as training data to exemplify the use of this kind of data in an LCA and shall not be regarded as common average data etc. The data for crushed rock is found in Hartlén (1999). The implementation of the TAC model allows the user to estimate the amount of any substance that is emitted during the analysed time horizon (see E in text Box 3.3). When setting the kappa valued based on percolation tests it is possible to use assessment factors. In this case study no assessment factor is used why the kappa value is derived without any modifications. Moreover, when negative kappa values occurred (representing an increasing emission concentration over time) these emissions where dropped from the case study since a mass balance wasn’t possible to perform since the total content was not reported in the literature references used (an alternative could be to set these emissions as constant). The resulting initial concentration (C0) and the substance and material specific kappa values used are reported in the tables below.
The specification of some metals are significantly for the assessment such as trivalent or hexavalent chromium. We could not find any generic assumption for these material but an estimation used is that the distribution is 50/50% Cr(III)/Cr(VI) for crushed rock and asphalt.
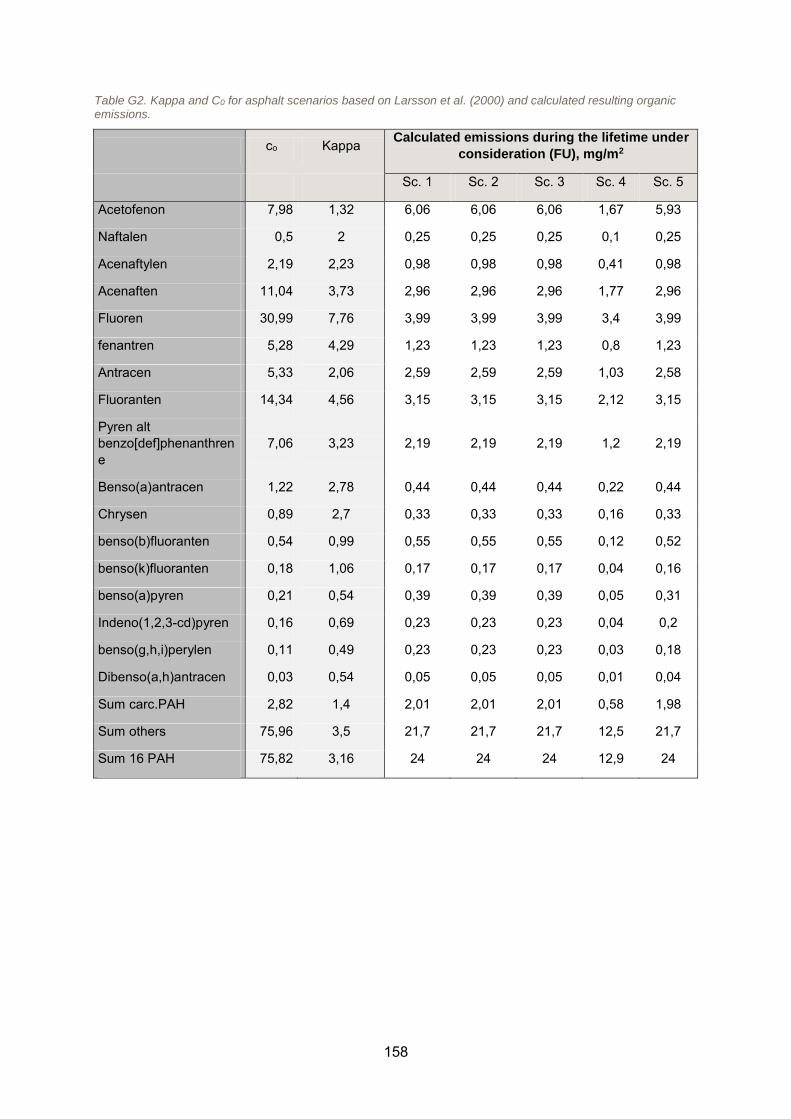
158
Table G2. Kappa and C0 for asphalt scenarios based on Larsson et al. (2000) and calculated resulting organic emissions.
co Kappa Calculated emissions during the lifetime under
consideration (FU), mg/m2
Sc. 1 Sc. 2 Sc. 3 Sc. 4 Sc. 5
Acetofenon 7,98 1,32 6,06 6,06 6,06 1,67 5,93
Naftalen 0,5 2 0,25 0,25 0,25 0,1 0,25
Acenaftylen 2,19 2,23 0,98 0,98 0,98 0,41 0,98
Acenaften 11,04 3,73 2,96 2,96 2,96 1,77 2,96
Fluoren 30,99 7,76 3,99 3,99 3,99 3,4 3,99
fenantren 5,28 4,29 1,23 1,23 1,23 0,8 1,23
Antracen 5,33 2,06 2,59 2,59 2,59 1,03 2,58
Fluoranten 14,34 4,56 3,15 3,15 3,15 2,12 3,15
Pyren alt benzo[def]phenanthrene
7,06 3,23 2,19 2,19 2,19 1,2 2,19
Benso(a)antracen 1,22 2,78 0,44 0,44 0,44 0,22 0,44
Chrysen 0,89 2,7 0,33 0,33 0,33 0,16 0,33
benso(b)fluoranten 0,54 0,99 0,55 0,55 0,55 0,12 0,52
benso(k)fluoranten 0,18 1,06 0,17 0,17 0,17 0,04 0,16
benso(a)pyren 0,21 0,54 0,39 0,39 0,39 0,05 0,31
Indeno(1,2,3-cd)pyren 0,16 0,69 0,23 0,23 0,23 0,04 0,2
benso(g,h,i)perylen 0,11 0,49 0,23 0,23 0,23 0,03 0,18
Dibenso(a,h)antracen 0,03 0,54 0,05 0,05 0,05 0,01 0,04
Sum carc.PAH 2,82 1,4 2,01 2,01 2,01 0,58 1,98
Sum others 75,96 3,5 21,7 21,7 21,7 12,5 21,7
Sum 16 PAH 75,82 3,16 24 24 24 12,9 24
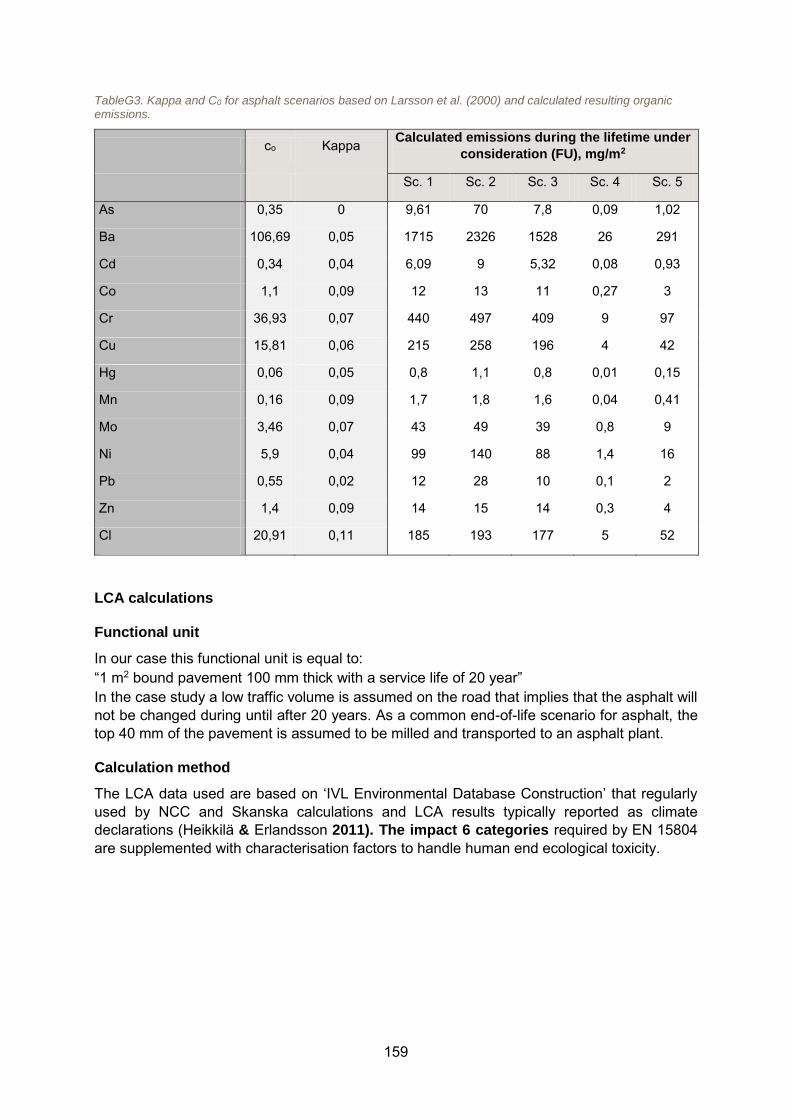
159
TableG3. Kappa and C0 for asphalt scenarios based on Larsson et al. (2000) and calculated resulting organic emissions.
co Kappa Calculated emissions during the lifetime under
consideration (FU), mg/m2
Sc. 1 Sc. 2 Sc. 3 Sc. 4 Sc. 5
As 0,35 0 9,61 70 7,8 0,09 1,02
Ba 106,69 0,05 1715 2326 1528 26 291
Cd 0,34 0,04 6,09 9 5,32 0,08 0,93
Co 1,1 0,09 12 13 11 0,27 3
Cr 36,93 0,07 440 497 409 9 97
Cu 15,81 0,06 215 258 196 4 42
Hg 0,06 0,05 0,8 1,1 0,8 0,01 0,15
Mn 0,16 0,09 1,7 1,8 1,6 0,04 0,41
Mo 3,46 0,07 43 49 39 0,8 9
Ni 5,9 0,04 99 140 88 1,4 16
Pb 0,55 0,02 12 28 10 0,1 2
Zn 1,4 0,09 14 15 14 0,3 4
Cl 20,91 0,11 185 193 177 5 52
LCA calculations
Functional unit
In our case this functional unit is equal to: “1 m2 bound pavement 100 mm thick with a service life of 20 year” In the case study a low traffic volume is assumed on the road that implies that the asphalt will not be changed during until after 20 years. As a common end-of-life scenario for asphalt, the top 40 mm of the pavement is assumed to be milled and transported to an asphalt plant.
Calculation method
The LCA data used are based on ‘IVL Environmental Database Construction’ that regularly used by NCC and Skanska calculations and LCA results typically reported as climate declarations (Heikkilä & Erlandsson 2011). The impact 6 categories required by EN 15804 are supplemented with characterisation factors to handle human end ecological toxicity.
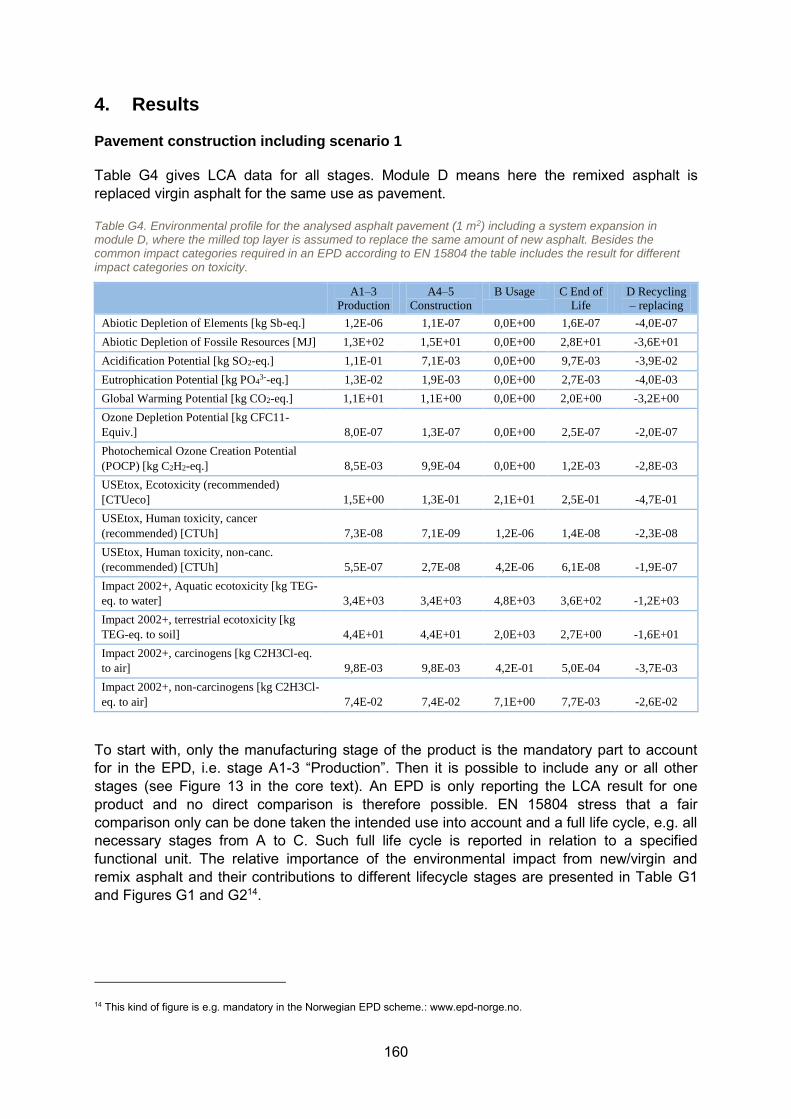
160
4. Results
Pavement construction including scenario 1
Table G4 gives LCA data for all stages. Module D means here the remixed asphalt is replaced virgin asphalt for the same use as pavement.
Table G4. Environmental profile for the analysed asphalt pavement (1 m2) including a system expansion in module D, where the milled top layer is assumed to replace the same amount of new asphalt. Besides the common impact categories required in an EPD according to EN 15804 the table includes the result for different impact categories on toxicity.
A1–3
Production
A4–5
Construction
B Usage C End of
Life
D Recycling
– replacing
Abiotic Depletion of Elements [kg Sb-eq.] 1,2E-06 1,1E-07 0,0E+00 1,6E-07 -4,0E-07
Abiotic Depletion of Fossile Resources [MJ] 1,3E+02 1,5E+01 0,0E+00 2,8E+01 -3,6E+01
Acidification Potential [kg SO2-eq.] 1,1E-01 7,1E-03 0,0E+00 9,7E-03 -3,9E-02
Eutrophication Potential [kg PO43--eq.] 1,3E-02 1,9E-03 0,0E+00 2,7E-03 -4,0E-03
Global Warming Potential [kg CO2-eq.] 1,1E+01 1,1E+00 0,0E+00 2,0E+00 -3,2E+00
Ozone Depletion Potential [kg CFC11-
Equiv.] 8,0E-07 1,3E-07 0,0E+00 2,5E-07 -2,0E-07
Photochemical Ozone Creation Potential
(POCP) [kg C2H2-eq.] 8,5E-03 9,9E-04 0,0E+00 1,2E-03 -2,8E-03
USEtox, Ecotoxicity (recommended)
[CTUeco] 1,5E+00 1,3E-01 2,1E+01 2,5E-01 -4,7E-01
USEtox, Human toxicity, cancer
(recommended) [CTUh] 7,3E-08 7,1E-09 1,2E-06 1,4E-08 -2,3E-08
USEtox, Human toxicity, non-canc.
(recommended) [CTUh] 5,5E-07 2,7E-08 4,2E-06 6,1E-08 -1,9E-07
Impact 2002+, Aquatic ecotoxicity [kg TEG-
eq. to water] 3,4E+03 3,4E+03 4,8E+03 3,6E+02 -1,2E+03
Impact 2002+, terrestrial ecotoxicity [kg
TEG-eq. to soil] 4,4E+01 4,4E+01 2,0E+03 2,7E+00 -1,6E+01
Impact 2002+, carcinogens [kg C2H3Cl-eq.
to air] 9,8E-03 9,8E-03 4,2E-01 5,0E-04 -3,7E-03
Impact 2002+, non-carcinogens [kg C2H3Cl-
eq. to air] 7,4E-02 7,4E-02 7,1E+00 7,7E-03 -2,6E-02
To start with, only the manufacturing stage of the product is the mandatory part to account for in the EPD, i.e. stage A1-3 “Production”. Then it is possible to include any or all other stages (see Figure 13 in the core text). An EPD is only reporting the LCA result for one product and no direct comparison is therefore possible. EN 15804 stress that a fair comparison only can be done taken the intended use into account and a full life cycle, e.g. all necessary stages from A to C. Such full life cycle is reported in relation to a specified functional unit. The relative importance of the environmental impact from new/virgin and remix asphalt and their contributions to different lifecycle stages are presented in Table G1 and Figures G1 and G214.
14 This kind of figure is e.g. mandatory in the Norwegian EPD scheme.: www.epd-norge.no.
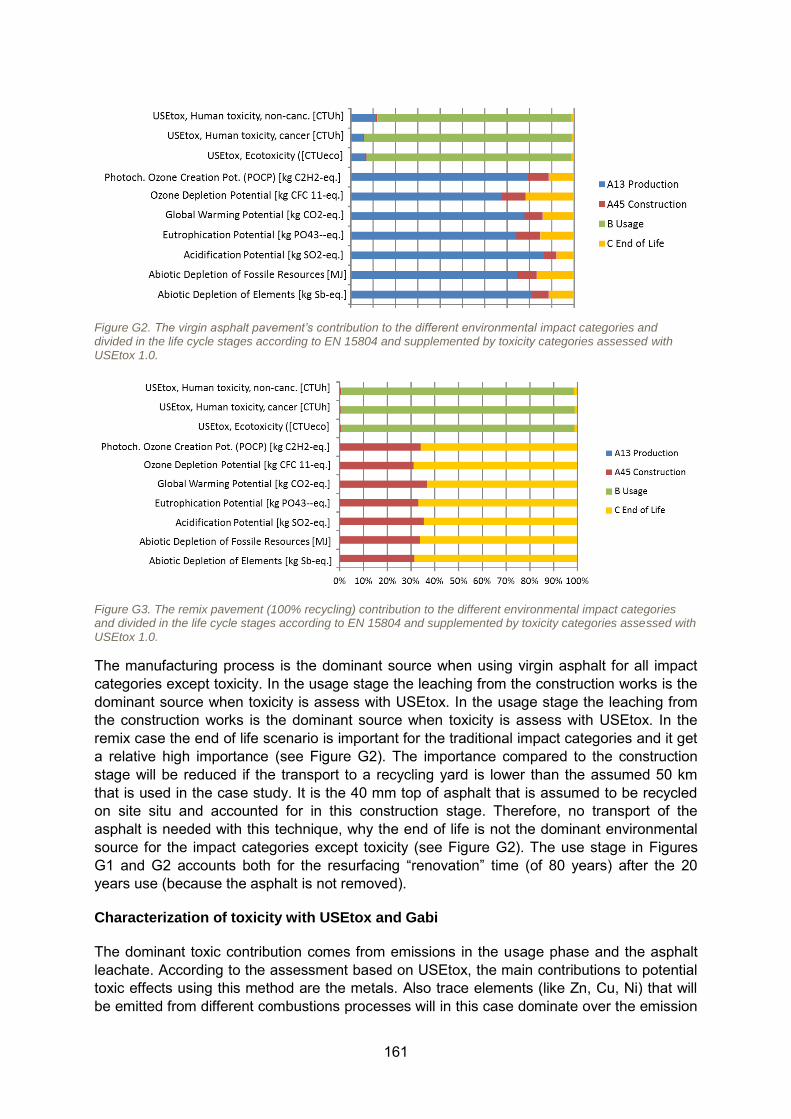
161
Figure G2. The virgin asphalt pavement’s contribution to the different environmental impact categories and divided in the life cycle stages according to EN 15804 and supplemented by toxicity categories assessed with USEtox 1.0.
Figure G3. The remix pavement (100% recycling) contribution to the different environmental impact categories and divided in the life cycle stages according to EN 15804 and supplemented by toxicity categories assessed with USEtox 1.0.
The manufacturing process is the dominant source when using virgin asphalt for all impact categories except toxicity. In the usage stage the leaching from the construction works is the dominant source when toxicity is assess with USEtox. In the usage stage the leaching from the construction works is the dominant source when toxicity is assess with USEtox. In the remix case the end of life scenario is important for the traditional impact categories and it get a relative high importance (see Figure G2). The importance compared to the construction stage will be reduced if the transport to a recycling yard is lower than the assumed 50 km that is used in the case study. It is the 40 mm top of asphalt that is assumed to be recycled on site situ and accounted for in this construction stage. Therefore, no transport of the asphalt is needed with this technique, why the end of life is not the dominant environmental source for the impact categories except toxicity (see Figure G2). The use stage in Figures G1 and G2 accounts both for the resurfacing “renovation” time (of 80 years) after the 20 years use (because the asphalt is not removed).
Characterization of toxicity with USEtox and Gabi
The dominant toxic contribution comes from emissions in the usage phase and the asphalt leachate. According to the assessment based on USEtox, the main contributions to potential toxic effects using this method are the metals. Also trace elements (like Zn, Cu, Ni) that will be emitted from different combustions processes will in this case dominate over the emission
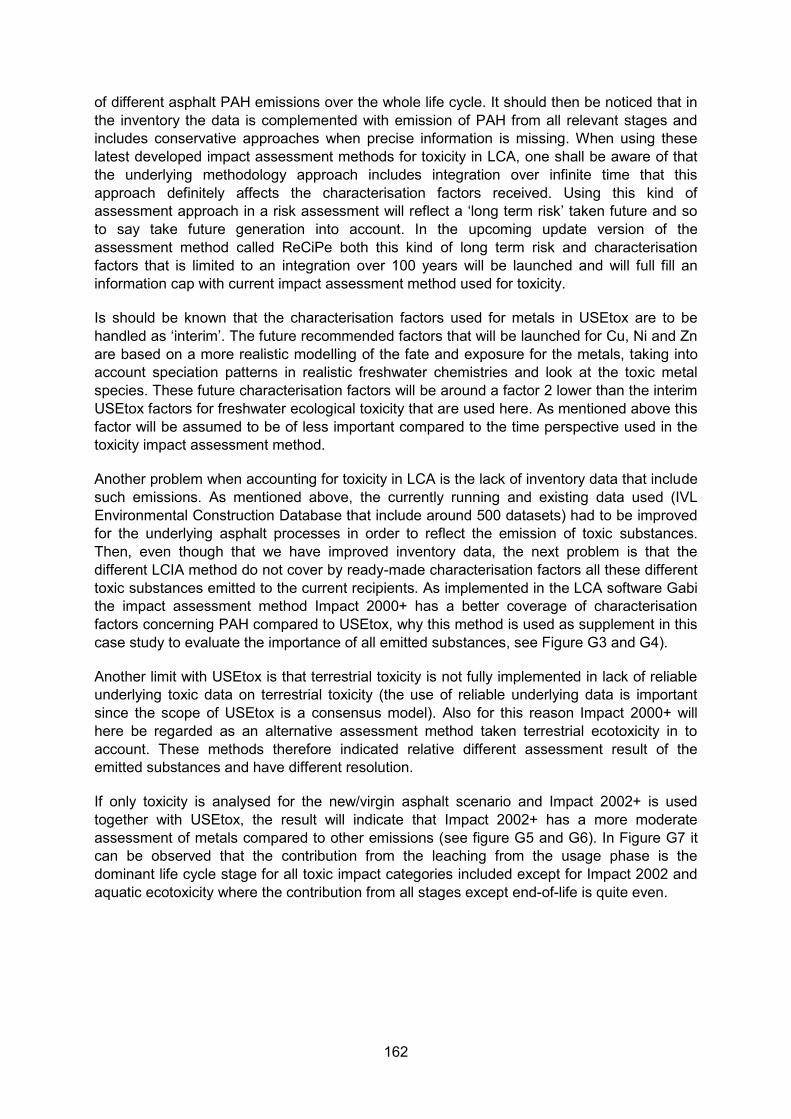
162
of different asphalt PAH emissions over the whole life cycle. It should then be noticed that in the inventory the data is complemented with emission of PAH from all relevant stages and includes conservative approaches when precise information is missing. When using these latest developed impact assessment methods for toxicity in LCA, one shall be aware of that the underlying methodology approach includes integration over infinite time that this approach definitely affects the characterisation factors received. Using this kind of assessment approach in a risk assessment will reflect a ‘long term risk’ taken future and so to say take future generation into account. In the upcoming update version of the assessment method called ReCiPe both this kind of long term risk and characterisation factors that is limited to an integration over 100 years will be launched and will full fill an information cap with current impact assessment method used for toxicity.
Is should be known that the characterisation factors used for metals in USEtox are to be handled as ‘interim’. The future recommended factors that will be launched for Cu, Ni and Zn are based on a more realistic modelling of the fate and exposure for the metals, taking into account speciation patterns in realistic freshwater chemistries and look at the toxic metal species. These future characterisation factors will be around a factor 2 lower than the interim USEtox factors for freshwater ecological toxicity that are used here. As mentioned above this factor will be assumed to be of less important compared to the time perspective used in the toxicity impact assessment method.
Another problem when accounting for toxicity in LCA is the lack of inventory data that include such emissions. As mentioned above, the currently running and existing data used (IVL Environmental Construction Database that include around 500 datasets) had to be improved for the underlying asphalt processes in order to reflect the emission of toxic substances. Then, even though that we have improved inventory data, the next problem is that the different LCIA method do not cover by ready-made characterisation factors all these different toxic substances emitted to the current recipients. As implemented in the LCA software Gabi the impact assessment method Impact 2000+ has a better coverage of characterisation factors concerning PAH compared to USEtox, why this method is used as supplement in this case study to evaluate the importance of all emitted substances, see Figure G3 and G4).
Another limit with USEtox is that terrestrial toxicity is not fully implemented in lack of reliable underlying toxic data on terrestrial toxicity (the use of reliable underlying data is important since the scope of USEtox is a consensus model). Also for this reason Impact 2000+ will here be regarded as an alternative assessment method taken terrestrial ecotoxicity in to account. These methods therefore indicated relative different assessment result of the emitted substances and have different resolution.
If only toxicity is analysed for the new/virgin asphalt scenario and Impact 2002+ is used together with USEtox, the result will indicate that Impact 2002+ has a more moderate assessment of metals compared to other emissions (see figure G5 and G6). In Figure G7 it can be observed that the contribution from the leaching from the usage phase is the dominant life cycle stage for all toxic impact categories included except for Impact 2002 and aquatic ecotoxicity where the contribution from all stages except end-of-life is quite even.
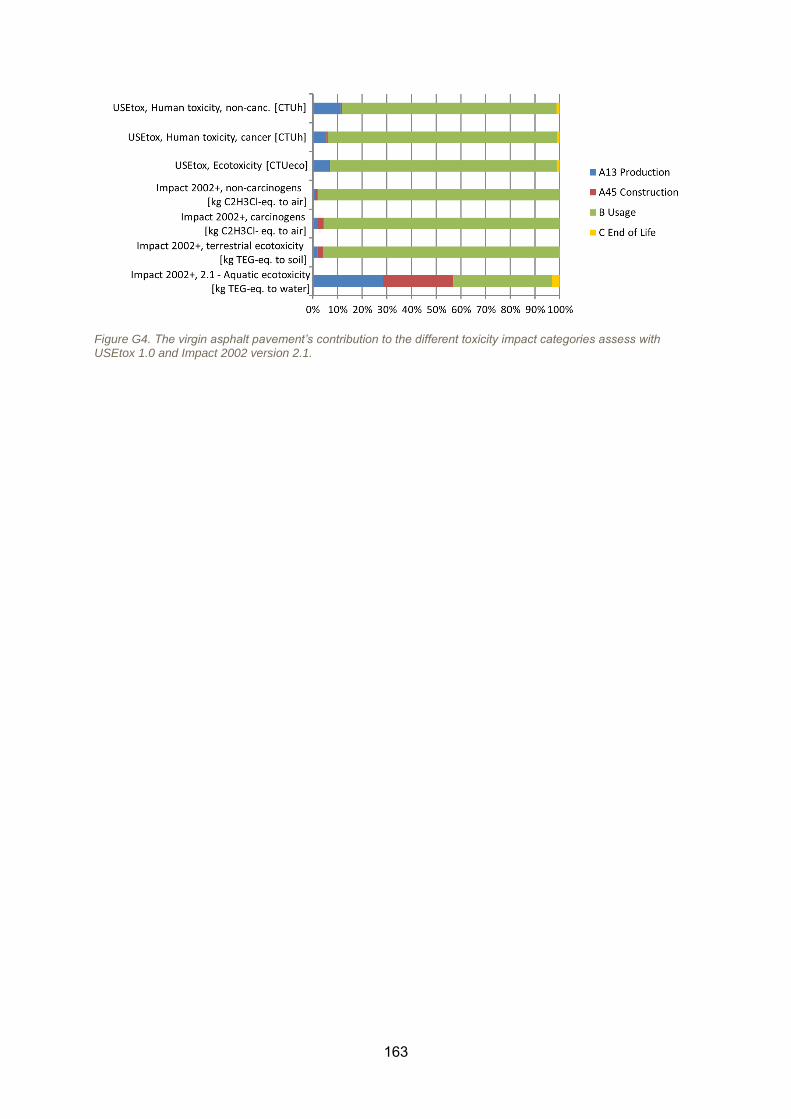
163
Figure G4. The virgin asphalt pavement’s contribution to the different toxicity impact categories assess with USEtox 1.0 and Impact 2002 version 2.1.
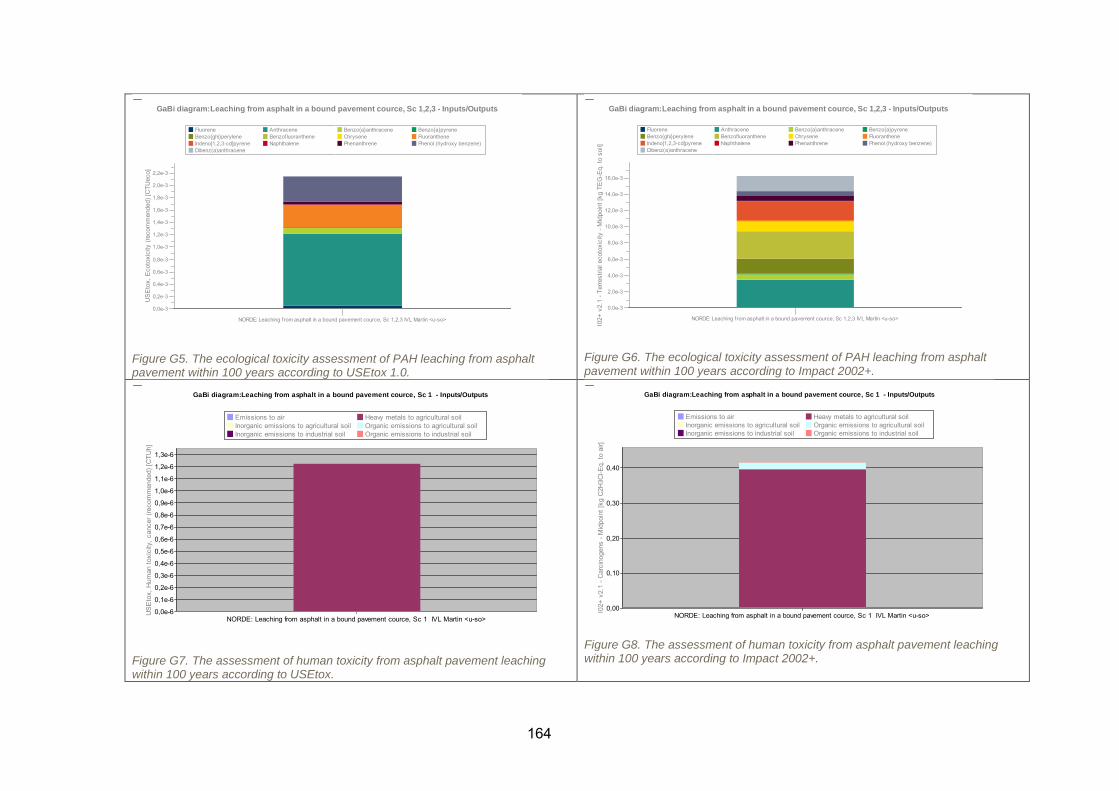
164
Figure G5. The ecological toxicity assessment of PAH leaching from asphalt pavement within 100 years according to USEtox 1.0.
Figure G6. The ecological toxicity assessment of PAH leaching from asphalt pavement within 100 years according to Impact 2002+.
Figure G7. The assessment of human toxicity from asphalt pavement leaching within 100 years according to USEtox.
Figure G8. The assessment of human toxicity from asphalt pavement leaching within 100 years according to Impact 2002+.
GaBi diagram:Leaching from asphalt in a bound pavement cource, Sc 1,2,3 - Inputs/Outputs
Fluorene Anthracene Benzo{a}anthracene Benzo{a}pyreneBenzo{ghi}perylene Benzofluoranthene Chrysene FluorantheneIndeno[1,2,3-cd]pyrene Naphthalene Phenanthrene Phenol (hydroxy benzene)Dibenz(a)anthracene
NORDE: Leaching from asphalt in a bound pavement cource, Sc 1,2,3 IVL Martin <u-so>
US
Eto
x, E
coto
xici
ty (r
ecom
men
ded)
[CTU
eco] 2,2e-3
2,0e-3
1,8e-3
1,6e-3
1,4e-3
1,2e-3
1,0e-3
0,8e-3
0,6e-3
0,4e-3
0,2e-3
0,0e-3
GaBi diagram:Leaching from asphalt in a bound pavement cource, Sc 1,2,3 - Inputs/Outputs
Fluorene Anthracene Benzo{a}anthracene Benzo{a}pyreneBenzo{ghi}perylene Benzofluoranthene Chrysene FluorantheneIndeno[1,2,3-cd]pyrene Naphthalene Phenanthrene Phenol (hydroxy benzene)Dibenz(a)anthracene
NORDE: Leaching from asphalt in a bound pavement cource, Sc 1,2,3 IVL Martin <u-so>
I02+
v2.
1 - T
erre
stria
l eco
toxi
city
- M
idpo
int [
kg T
EG
-Eq.
to s
oil]
16,0e-3
14,0e-3
12,0e-3
10,0e-3
8,0e-3
6,0e-3
4,0e-3
2,0e-3
0,0e-3
GaBi diagram:Leaching from asphalt in a bound pavement cource, Sc 1 - Inputs/Outputs
Emissions to air Heavy metals to agricultural soilInorganic emissions to agricultural soil Organic emissions to agricultural soilInorganic emissions to industrial soil Organic emissions to industrial soil
NORDE: Leaching from asphalt in a bound pavement cource, Sc 1 IVL Martin <u-so>
US
Eto
x, H
uman
toxi
city
, can
cer (
reco
mm
ende
d) [C
TUh]
1,3e-6
1,2e-6
1,1e-6
1,0e-6
0,9e-6
0,8e-6
0,7e-6
0,6e-6
0,5e-6
0,4e-6
0,3e-6
0,2e-6
0,1e-6
0,0e-6
GaBi diagram:Leaching from asphalt in a bound pavement cource, Sc 1 - Inputs/Outputs
Emissions to air Heavy metals to agricultural soilInorganic emissions to agricultural soil Organic emissions to agricultural soilInorganic emissions to industrial soil Organic emissions to industrial soil
NORDE: Leaching from asphalt in a bound pavement cource, Sc 1 IVL Martin <u-so>
I02+
v2.
1 - C
arci
noge
ns -
Mid
poin
t [kg
C2H
3Cl-E
q. to
air]
0,40
0,30
0,20
0,10
0,00
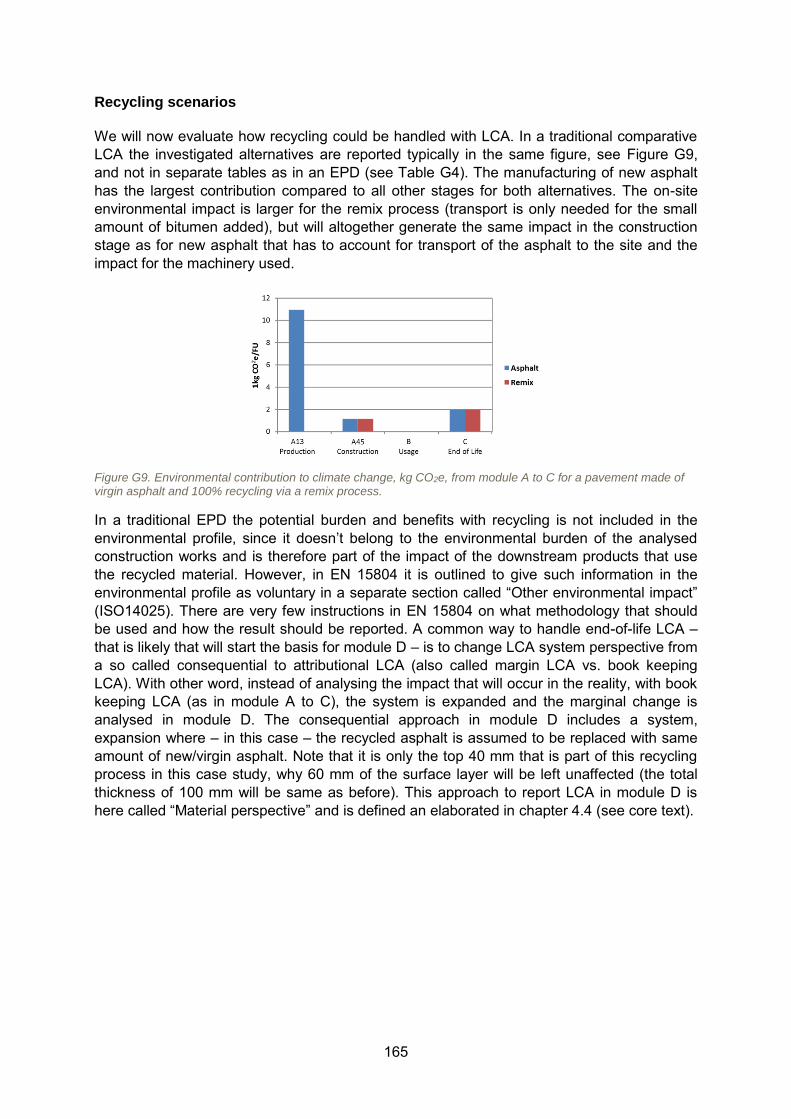
165
Recycling scenarios
We will now evaluate how recycling could be handled with LCA. In a traditional comparative LCA the investigated alternatives are reported typically in the same figure, see Figure G9, and not in separate tables as in an EPD (see Table G4). The manufacturing of new asphalt has the largest contribution compared to all other stages for both alternatives. The on-site environmental impact is larger for the remix process (transport is only needed for the small amount of bitumen added), but will altogether generate the same impact in the construction stage as for new asphalt that has to account for transport of the asphalt to the site and the impact for the machinery used.
Figure G9. Environmental contribution to climate change, kg CO2e, from module A to C for a pavement made of virgin asphalt and 100% recycling via a remix process.
In a traditional EPD the potential burden and benefits with recycling is not included in the environmental profile, since it doesn’t belong to the environmental burden of the analysed construction works and is therefore part of the impact of the downstream products that use the recycled material. However, in EN 15804 it is outlined to give such information in the environmental profile as voluntary in a separate section called “Other environmental impact” (ISO14025). There are very few instructions in EN 15804 on what methodology that should be used and how the result should be reported. A common way to handle end-of-life LCA – that is likely that will start the basis for module D – is to change LCA system perspective from a so called consequential to attributional LCA (also called margin LCA vs. book keeping LCA). With other word, instead of analysing the impact that will occur in the reality, with book keeping LCA (as in module A to C), the system is expanded and the marginal change is analysed in module D. The consequential approach in module D includes a system, expansion where – in this case – the recycled asphalt is assumed to be replaced with same amount of new/virgin asphalt. Note that it is only the top 40 mm that is part of this recycling process in this case study, why 60 mm of the surface layer will be left unaffected (the total thickness of 100 mm will be same as before). This approach to report LCA in module D is here called “Material perspective” and is defined an elaborated in chapter 4.4 (see core text).
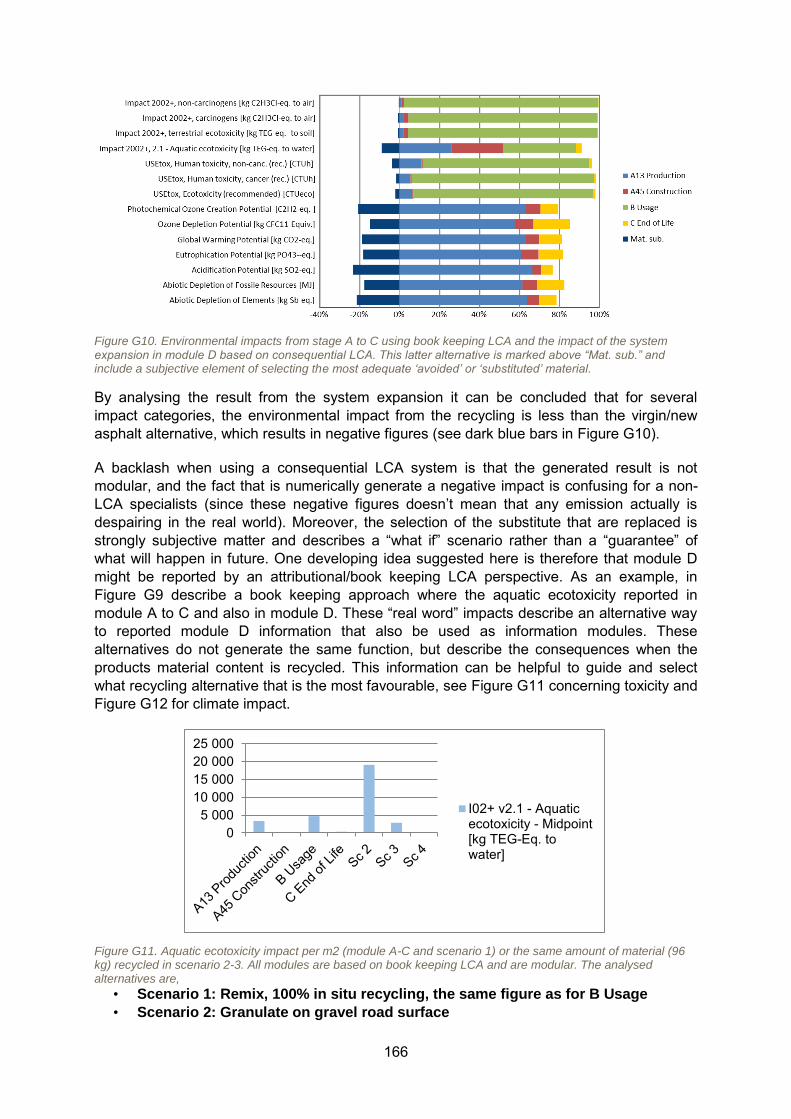
166
Figure G10. Environmental impacts from stage A to C using book keeping LCA and the impact of the system expansion in module D based on consequential LCA. This latter alternative is marked above “Mat. sub.” and include a subjective element of selecting the most adequate ‘avoided’ or ‘substituted’ material.
By analysing the result from the system expansion it can be concluded that for several impact categories, the environmental impact from the recycling is less than the virgin/new asphalt alternative, which results in negative figures (see dark blue bars in Figure G10).
A backlash when using a consequential LCA system is that the generated result is not modular, and the fact that is numerically generate a negative impact is confusing for a non-LCA specialists (since these negative figures doesn’t mean that any emission actually is despairing in the real world). Moreover, the selection of the substitute that are replaced is strongly subjective matter and describes a “what if” scenario rather than a “guarantee” of what will happen in future. One developing idea suggested here is therefore that module D might be reported by an attributional/book keeping LCA perspective. As an example, in Figure G9 describe a book keeping approach where the aquatic ecotoxicity reported in module A to C and also in module D. These “real word” impacts describe an alternative way to reported module D information that also be used as information modules. These alternatives do not generate the same function, but describe the consequences when the products material content is recycled. This information can be helpful to guide and select what recycling alternative that is the most favourable, see Figure G11 concerning toxicity and Figure G12 for climate impact.
Figure G11. Aquatic ecotoxicity impact per m2 (module A-C and scenario 1) or the same amount of material (96 kg) recycled in scenario 2-3. All modules are based on book keeping LCA and are modular. The analysed alternatives are,
• Scenario 1: Remix, 100% in situ recycling, the same figure as for B Usage
• Scenario 2: Granulate on gravel road surface
05 000
10 00015 00020 00025 000
I02+ v2.1 - Aquaticecotoxicity - Midpoint[kg TEG-Eq. towater]
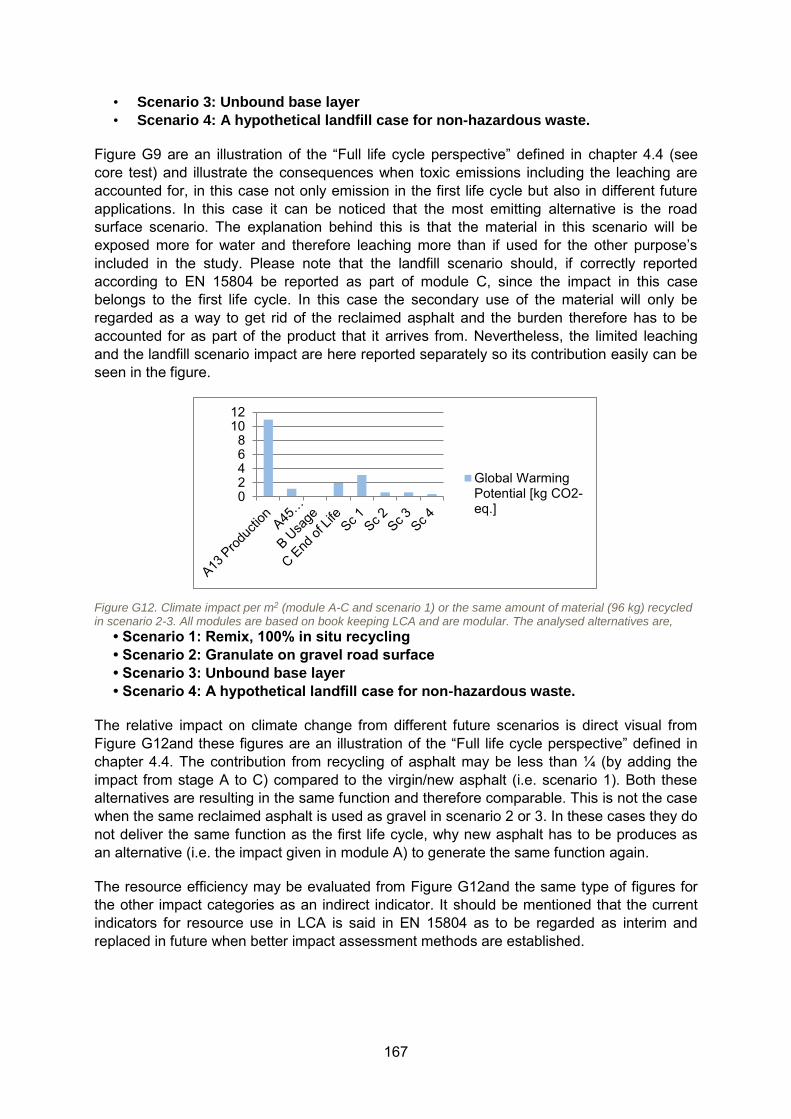
167
• Scenario 3: Unbound base layer
• Scenario 4: A hypothetical landfill case for non-hazardous waste.
Figure G9 are an illustration of the “Full life cycle perspective” defined in chapter 4.4 (see core test) and illustrate the consequences when toxic emissions including the leaching are accounted for, in this case not only emission in the first life cycle but also in different future applications. In this case it can be noticed that the most emitting alternative is the road surface scenario. The explanation behind this is that the material in this scenario will be exposed more for water and therefore leaching more than if used for the other purpose’s included in the study. Please note that the landfill scenario should, if correctly reported according to EN 15804 be reported as part of module C, since the impact in this case belongs to the first life cycle. In this case the secondary use of the material will only be regarded as a way to get rid of the reclaimed asphalt and the burden therefore has to be accounted for as part of the product that it arrives from. Nevertheless, the limited leaching and the landfill scenario impact are here reported separately so its contribution easily can be seen in the figure.
Figure G12. Climate impact per m2 (module A-C and scenario 1) or the same amount of material (96 kg) recycled in scenario 2-3. All modules are based on book keeping LCA and are modular. The analysed alternatives are,
• Scenario 1: Remix, 100% in situ recycling
• Scenario 2: Granulate on gravel road surface
• Scenario 3: Unbound base layer
• Scenario 4: A hypothetical landfill case for non-hazardous waste.
The relative impact on climate change from different future scenarios is direct visual from Figure G12and these figures are an illustration of the “Full life cycle perspective” defined in chapter 4.4. The contribution from recycling of asphalt may be less than ¼ (by adding the impact from stage A to C) compared to the virgin/new asphalt (i.e. scenario 1). Both these alternatives are resulting in the same function and therefore comparable. This is not the case when the same reclaimed asphalt is used as gravel in scenario 2 or 3. In these cases they do not deliver the same function as the first life cycle, why new asphalt has to be produces as an alternative (i.e. the impact given in module A) to generate the same function again.
The resource efficiency may be evaluated from Figure G12and the same type of figures for the other impact categories as an indirect indicator. It should be mentioned that the current indicators for resource use in LCA is said in EN 15804 as to be regarded as interim and replaced in future when better impact assessment methods are established.
02468
1012
Global WarmingPotential [kg CO2-eq.]
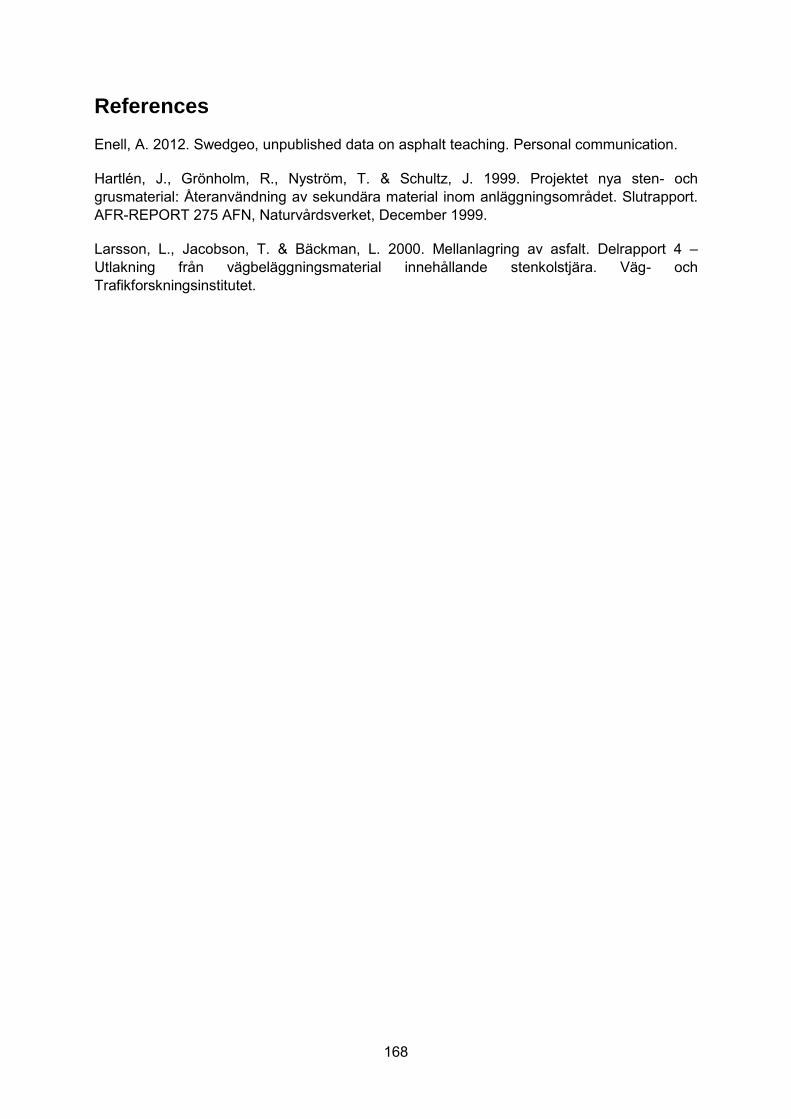
168
References
Enell, A. 2012. Swedgeo, unpublished data on asphalt teaching. Personal communication.
Hartlén, J., Grönholm, R., Nyström, T. & Schultz, J. 1999. Projektet nya sten- och grusmaterial: Återanvändning av sekundära material inom anläggningsområdet. Slutrapport. AFR-REPORT 275 AFN, Naturvårdsverket, December 1999.
Larsson, L., Jacobson, T. & Bäckman, L. 2000. Mellanlagring av asfalt. Delrapport 4 – Utlakning från vägbeläggningsmaterial innehållande stenkolstjära. Väg- och Trafikforskningsinstitutet.
Table of Abstract
Series title, number and report code of publication:Nordic Innovation publication 2014:03
Author(s):Margareta Wahlström, Jutta Laine-Ylijoki, Helena Järnström, Tommi Kaartinen, Martin Erlandsson, Anna Palm Cousins, Ola Wik, Pascal Suer, Anke Oberender, Ole Hjelmar, Harpa Birgisdottir, Stefania Butera, Thomas Fruergaard Astrup & Andreas Jørgensen
Organisation(s):Nordic Innovation & VTT Research Centre of Finland
Title (Full title of the report): Environmentally Sustainable Construction Products and Materials – Assessment of release and emissionsAbstract:The main objectives of sustainable construction activities are to avoid resource depletion of energy, water, and raw materials and to prevent environmental degradation caused by facilities and infrastructure throughout their life cycle. The construction sector consumes yearly about half of all natural resources extracted in Europe and their transformation into building products has huge energy demands. Therefore the focus of today’s environmental policy is on the building end-of-life scenarios and material efficiency. Here waste prevention and recycling / reuse play a key role by providing huge energy, water and material savings. These issues are also specifically addressed in the Construction Products Regulation (CPR 2011), where health and safety aspects related to use of construction products cover the entire lifecycle. Meanwhile the building sector is moving from new buildings towards maintenance and renovation. This trend will probably further increase by the energy conservation activities that will be required to achieve the 20-20-20 goals outlined by EC resulting in a need of renovation of a huge amount of buildings. Until today hardly any construction product is designed keeping recycling/reuse in mind, the “Design for the Environment” -concept is one of the key steps towards increased recycling and reuse and thereby towards minimal environmental impacts. This project has been carried out by VTT with cooperation with the Danish partners SBi, DTU and DHI and the Swedish partners SGI and IVL.
ISBN:ISBN 978-82-8277-059-0 (Print) ISBN 978-82-8277-060-6 (Digital) (URL: http://www.nordicinnovation.org/publications)
Language:English
Name of Nordic Innovation funding program (if relevant): Commissioned by (if relevant):
Name of project:Environmentally Sustainable Construction Products and Materials
Project acronym (if relevant):MATERAC
Nordic Innovation project number:P 10020
Pages:171
Date:March 2014
Keywords:Construction products; release; emission; dangerous substances; sustainability
Publisher:Nordic Innovation Stensberggata 25, NO-0170 Oslo, Norway Phone: +47 47 61 44 00 [email protected] www.nordicinnovation.org
Main contact person:Margareta Wahlström Senior Scientist VTT Technical Research Centre of Finland P.O. Box 1000, FI-02044 VTT, Finland [email protected]

The main objectives of sustainable construction activities are to avoid resource
depletion of energy, water, and raw materials and to prevent environmental degradation
caused by facilities and infrastructure throughout their life cycle. The construction
sector consumes yearly about half of all natural resources extracted in Europe and their
transformation into building products has huge energy demands. Therefore the focus of
today’s environmental policy is to be on the building end-of-life scenarios and material
efficiency. Here waste prevention and recycling /reuse play a key role by providing huge
energy, water and material savings. These issues are also specifically addressed in the
Construction Products Regulation (CPR 2011), where health and safety aspects related
to use of construction products cover of the entire lifecycle. Meanwhile the building
sector is moving from new buildings towards maintenance and renovation. This trend
will probably further increase by the energy conservation activities that will be required
to achieve the 20-20-20 goals outlined by EC resulting in a need of renovation of a
huge amount of buildings. Until today hardly any construction product is designed
keeping recycling/reuse in mind, the “Design for the Environment” -concept is one
of the key steps towards increased recycling and reuse and thereby towards minimal
environmental impacts of construction and operations.
Life cycle assessment (LCA) is the main tool for assessing environmental performance
and thus achieving sustainable development. This project addresses methods for
assessment of environmental properties that influence environmental sustainability
of construction products. It deals with the harmonised standard methods for the
measurement of emission and release and how data from these tests can be included
in a broader assessment of environmental sustainability e.g. LCA and environmental
product declarations (EPD).
Nordic Innovation is an institution under Nordic Council of Ministers that facilitates sustainable growth in the Nordic region. Our mission is to orchestrate increased value creation through international cooperation.
We stimulate innovation, remove barriers and build relations through Nordic cooperationNORDIC INNOVATION, Stensberggata 25, NO-0170 Oslo, Norway // Phone (+47) 47 61 44 00 // Fax (+47) 22 56 55 65
[email protected] // www.nordicinnovation.org // Twitter: @nordicinno // Facebook.com/nordicinnovation.org
Sign up for our newsletter!Scan the QR-code or visit: www.nordicinnovation.org/subscribe
Meeting unmet demand in emerging markets