envision equity
DESCRIPTION
Jefferson County Public Schools Equity ScorecardTRANSCRIPT
A community commitment to improving education for all students
J E F F E R S O N C O U N T Y P U B L I C S C H O O L S
Special Education
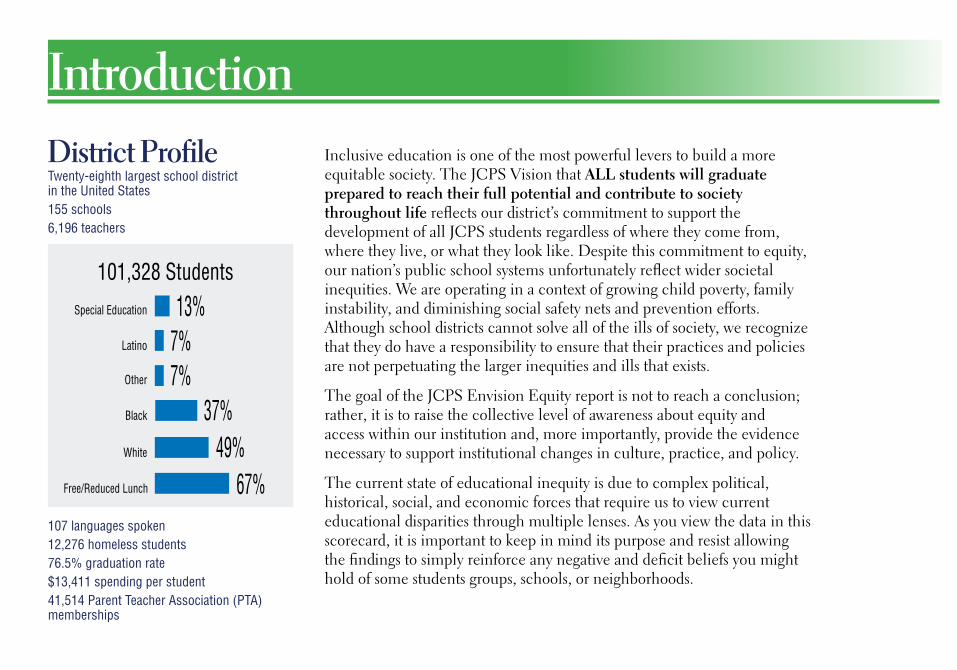
101,328 Students
Free/Reduced Lunch
Latino
Other
Black
White
13%7%7%
37%49%
67%
IntroductionInclusive education is one of the most powerful levers to build a more equitable society. The JCPS Vision that ALL students will graduate prepared to reach their full potential and contribute to society throughout life re!ects our district’s commitment to support the development of all JCPS students regardless of where they come from, where they live, or what they look like. Despite this commitment to equity, our nation’s public school systems unfortunately re!ect wider societal inequities. We are operating in a context of growing child poverty, family instability, and diminishing social safety nets and prevention efforts. Although school districts cannot solve all of the ills of society, we recognize that they do have a responsibility to ensure that their practices and policies are not perpetuating the larger inequities and ills that exists.
The goal of the JCPS Envision Equity report is not to reach a conclusion; rather, it is to raise the collective level of awareness about equity and access within our institution and, more importantly, provide the evidence necessary to support institutional changes in culture, practice, and policy.
The current state of educational inequity is due to complex political, historical, social, and economic forces that require us to view current educational disparities through multiple lenses. As you view the data in this scorecard, it is important to keep in mind its purpose and resist allowing the "ndings to simply reinforce any negative and de"cit beliefs you might hold of some students groups, schools, or neighborhoods.
District ProfileTwenty-eighth largest school district in the United States155 schools 6,196 teachers
107 languages spoken12,276 homeless students76.5% graduation rate$13,411 spending per student41,514 Parent Teacher Association (PTA) memberships
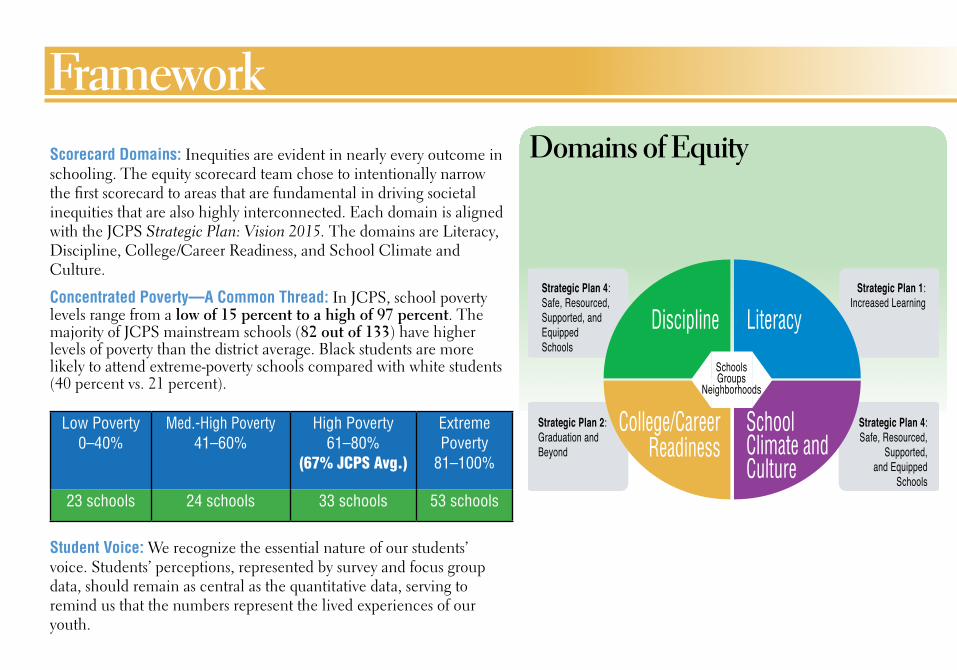
Scorecard Domains: Inequities are evident in nearly every outcome in schooling. The equity scorecard team chose to intentionally narrow the "rst scorecard to areas that are fundamental in driving societal inequities that are also highly interconnected. Each domain is aligned with the JCPS Strategic Plan: Vision 2015. The domains are Literacy, Discipline, College/Career Readiness, and School Climate and Culture.
Concentrated Poverty—A Common Thread: In JCPS, school poverty levels range from a low of 15 percent to a high of 97 percent. The majority of JCPS mainstream schools (82 out of 133) have higher levels of poverty than the district average. Black students are more likely to attend extreme-poverty schools compared with white students (40 percent vs. 21 percent).
Low Poverty0–40%
Med.-High Poverty41–60%
High Poverty61–80%
(67% JCPS Avg.)Avg.)
Extreme Poverty
81–100%
23 schools 24 schools 33 schools 53 schools
Student Voice: We recognize the essential nature of our students’ voice. Students’ perceptions, represented by survey and focus group data, should remain as central as the quantitative data, serving to remind us that the numbers represent the lived experiences of our youth.
Discipline Literacy
College/CareerReadiness
SchoolClimate and Culture
Strategic Plan 1:Increased Learning
Strategic Plan 4:Safe, Resourced,Supported, and Equipped Schools
Strategic Plan 2:Graduation andBeyond
Strategic Plan 4:Safe, Resourced,
Supported, and Equipped
Schools
SchoolsGroups
Neighborhoods
Domains of Equity
Framework
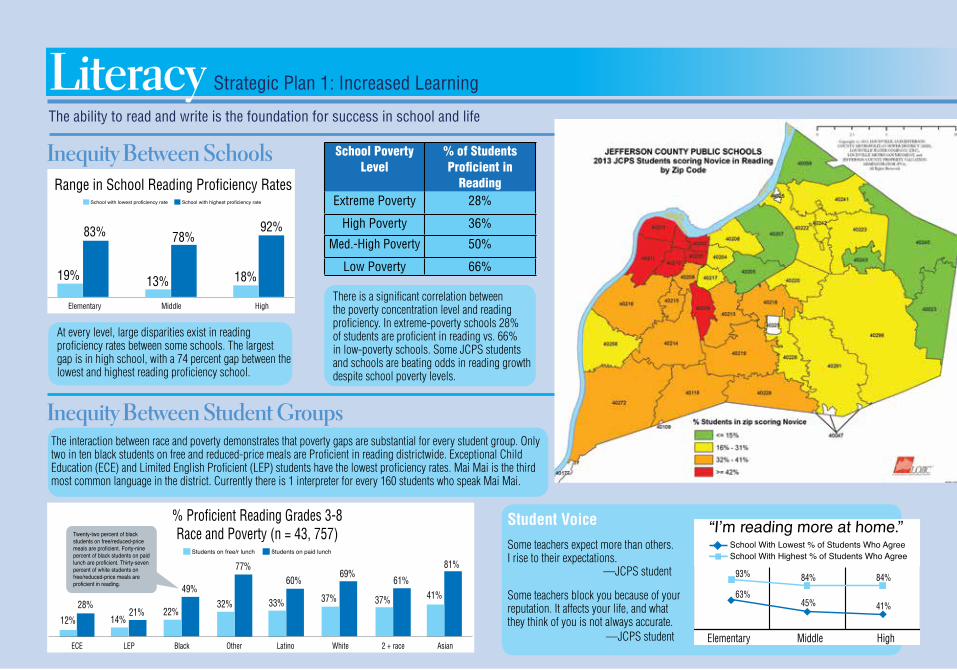
There is a significant correlation between the poverty concentration level and reading proficiency. In extreme-poverty schools 28% of students are proficient in reading vs. 66% in low-poverty schools. Some JCPS students and schools are beating odds in reading growth despite school poverty levels.
At every level, large disparities exist in reading proficiency rates between some schools. The largest gap is in high school, with a 74 percent gap between the lowest and highest reading proficiency school.
Inequity Between Student Groups
Inequity Between Schools
Literacy Strategic Plan 1: Increased Learning
The interaction between race and poverty demonstrates that poverty gaps are substantial for every student group. Only two in ten black students on free and reduced-price meals are Proficient in reading districtwide. Exceptional Child Education (ECE) and Limited English Proficient (LEP) students have the lowest proficiency rates. Mai Mai is the third most common language in the district. Currently there is 1 interpreter for every 160 students who speak Mai Mai.
School Poverty Level
% of Students Proficient in
ReadingExtreme Poverty 28%
High Poverty 36%Med.-High Poverty 50%
Low Poverty 66%
Student VoiceSome teachers expect more than others. I rise to their expectations. —JCPS student
Some teachers block you because of your reputation. It affects your life, and what they think of you is not always accurate. —JCPS student
Elementary
83% 78%92%
18%13%19%
Middle High
Range in School Reading Proficiency RatesSchool with lowest proficiency rate School with highest proficiency rate
93%
Elementary Middle High
63%
84%
45%
84%
41%
School With Lowest % of Students Who AgreeSchool With Highest % of Students Who Agree
“I’m reading more at home.”
The ability to read and write is the foundation for success in school and life
ECE LEP Black Other Latino White 2 + race Asian
28%12%
21%14%
49%
22%
77%
32%
60%
33%
69%
37%
61%
37%
81%
41%
% Proficient Reading Grades 3-8Race and Poverty (n = 43, 757)
Students on free/r lunch ßtudents on paid lunch
Twenty-two percent of black
students on free/reduced-price
meals are proficient. Forty-nine
percent of black students on paid
lunch are proficient. Thirty-seven
percent of white students on
free/reduced-price meals are
proficient in reading.
Inequity Between Student Groups
Student and Teacher Voice
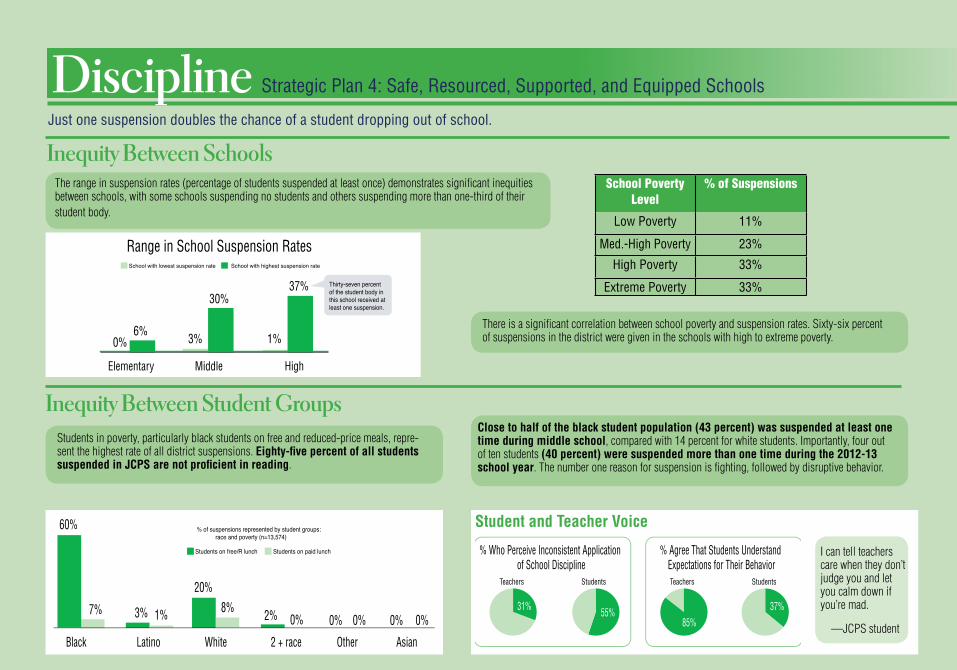
Inequity Between SchoolsJust one suspension doubles the chance of a student dropping out of school.
The range in suspension rates (percentage of students suspended at least once) demonstrates significant inequities between schools, with some schools suspending no students and others suspending more than one-third of their student body.
School Poverty Level
% of Suspensions
Low Poverty 11%
Med.-High Poverty 23%High Poverty 33%
Extreme Poverty 33%
There is a significant correlation between school poverty and suspension rates. Sixty-six percent of suspensions in the district were given in the schools with high to extreme poverty.
Students in poverty, particularly black students on free and reduced-price meals, repre-sent the highest rate of all district suspensions. Eighty-five percent of all students suspended in JCPS are not proficient in reading.
Close to half of the black student population (43 percent) was suspended at least one time during middle school, compared with 14 percent for white students. Importantly, four out of ten students (40 percent) were suspended more than one time during the 2012-13 school year. The number one reason for suspension is fighting, followed by disruptive behavior.
I can tell teachers care when they don’t judge you and let you calm down if you’re mad.
—JCPS student
Elementary Middle High
6%0%
30%37%
3% 1%
Thirty-seven percentof the student body inthis school received atleast one suspension.
Range in School Suspension RatesSchool with lowest suspension rate School with highest suspension rate
Black Latino White 2 + race Other Asian
7% 1% 8%0%3%
20%
60%
2% 0%0% 0%0%
Students on free/R lunch Students on paid lunch
% of suspensions represented by student groups:
race and poverty (n=13,574)
% Who Perceive Inconsistent Application of School Discipline
Teachers Students
% Agree That Students Understand Expectations for Their BehaviorTeachers Students
31% 55%85%
37%
Discipline Strategic Plan 4: Safe, Resourced, Supported, and Equipped Schools
Inequity Between Schools
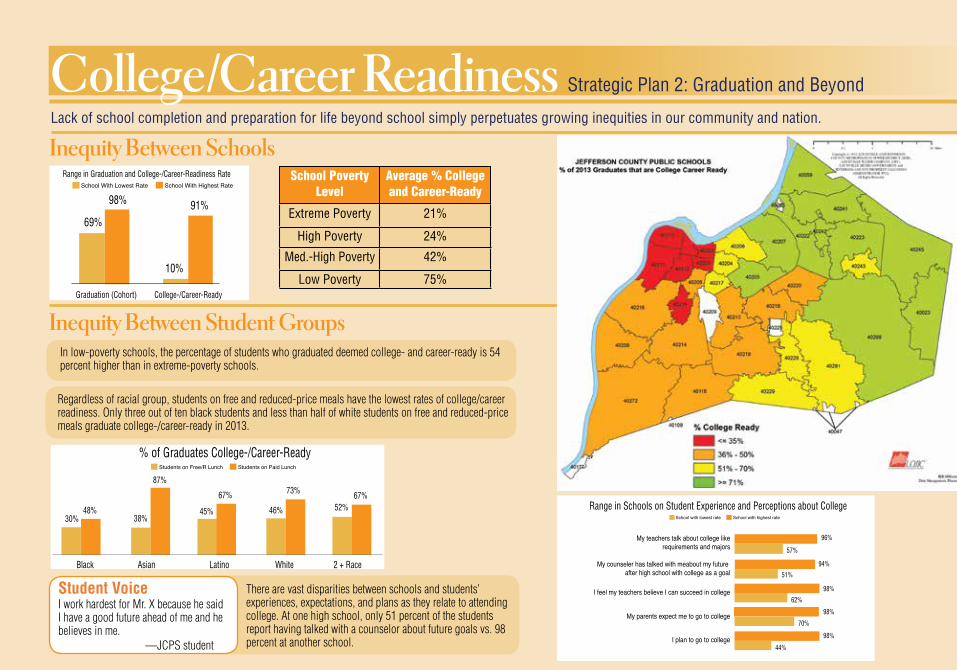
Inequity Between Student GroupsIn low-poverty schools, the percentage of students who graduated deemed college- and career-ready is 54 percent higher than in extreme-poverty schools.
Regardless of racial group, students on free and reduced-price meals have the lowest rates of college/career readiness. Only three out of ten black students and less than half of white students on free and reduced-price meals graduate college-/career-ready in 2013.
There are vast disparities between schools and students’ experiences, expectations, and plans as they relate to attending college. At one high school, only 51 percent of the students report having talked with a counselor about future goals vs. 98 percent at another school.
Student VoiceI work hardest for Mr. X because he said I have a good future ahead of me and he believes in me. —JCPS student
College/Career Readiness Strategic Plan 2: Graduation and Beyond
Black Asian Latino White 2 + Race
48%30%
87%
38%
67%
45%
73%
46%
67%52%
% of Graduates College-/Career-ReadyStudents on Free/R Lunch Students on Paid Lunch
School Poverty Level
Average % College and Career-Ready
Extreme Poverty 21%
High Poverty 24%Med.-High Poverty 42%
Low Poverty 75%
Lack of school completion and preparation for life beyond school simply perpetuates growing inequities in our community and nation.
Range in Schools on Student Experience and Perceptions about CollegeSchool with lowest rate School with highest rate
My teachers talk about college like
requirements and majors
My counseler has talked with meabout my future
after high school with college as a goal
I feel my teachers believe I can succeed in college
My parents expect me to go to college
I plan to go to college
57%
51%
62%
70%
44%
96%
94%
98%
98%
98%
Graduation (Cohort) College-/Career-Ready
98% 91%69%
10%
Range in Graduation and College-/Career-Readiness RateSchool With Lowest Rate School With Highest Rate
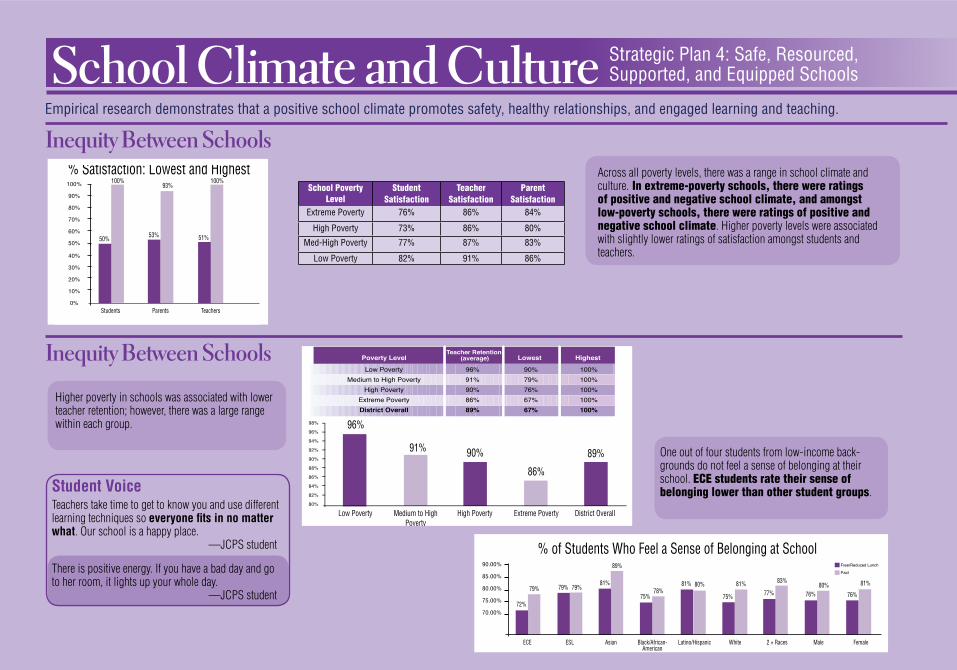
School Climate and Culture Inequity Between Schools
Inequity Between Schools
School Poverty Level
StudentSatisfaction
TeacherSatisfaction
ParentSatisfaction
Extreme Poverty 76% 86% 84%
High Poverty 73% 86% 80%Med-High Poverty 77% 87% 83%
Low Poverty 82% 91% 86%
Student VoiceTeachers take time to get to know you and use different learning techniques so everyone fits in no matter what. Our school is a happy place. —JCPS student
There is positive energy. If you have a bad day and go to her room, it lights up your whole day. —JCPS student
Higher poverty in schools was associated with lower teacher retention; however, there was a large range within each group.
Across all poverty levels, there was a range in school climate and culture. In extreme-poverty schools, there were ratings of positive and negative school climate, and amongst low-poverty schools, there were ratings of positive and negative school climate. Higher poverty levels were associated with slightly lower ratings of satisfaction amongst students and teachers.
One out of four students from low-income back-grounds do not feel a sense of belonging at their school. ECE students rate their sense of belonging lower than other student groups.
Strategic Plan 4: Safe, Resourced, Supported, and Equipped Schools
ECE ESL Asian Latino/Hispanic White Male Female2 + RacesBlack/African-American
72%
79%79% 79%81%
89%
75%78%
81% 80%
75%
81%77%
83%
76%80%
76%
81%
% of Students Who Feel a Sense of Belonging at SchoolFree/Reduced Lunch Paid
90.00%
85.00%
80.00%
75.00%
70.00%
Low Poverty
98%
96%
94%
92%
90%
88%
86%
84%
82%
80%
High Poverty Extreme Poverty District OverallMedium to HighPoverty
96%
90% 89%91%
86%
Low PovertyMedium to High Poverty
High PovertyExtreme PovertyDistrict Overall
96%91%90%86%89%
90%79%76%67%67%
100%100%100%100%100%
Poverty Level Lowest HighestTeacher Retention
(average)
Students Parents Teachers
50% 53%
100%93%
51%
100%100%
90%
80%
70%
60%
50%
40%
30%
20%
10%
0%
% Satisfaction: Lowest and Highest
Empirical research demonstrates that a positive school climate promotes safety, healthy relationships, and engaged learning and teaching.
The data presented in this report re!ect the reality that to fully realize equity within JCPS, two parallel efforts need to be made simultaneously and collaboratively: 1) systemic policy and practice efforts and changes within JCPS, and 2) communitywide efforts to expand involvement in JCPS, antipoverty programs, teacher preparation programs, health and social services, affordable housing policies, etc. We all play a role in improving educational equity within our community, and it is time to courageously confront the root causes of the disparities to improve the quality of life for us all. Together, let’s Envision Equity.
JCPS Equity Scorecard Team Mission:“To raise collective awareness about current system inequities in order to promote systemic district change on the basis of internal and community-wide collaboration to ensure that all of our children receive excellent, equitable, and digni!ed educational experiences, opportunities, and outcomes.”
Ways to Make a DifferenceBecome an Every 1 Reads volunteer and mentor by visiting http://every1reads.jefferson.kyschools.us
Partner with Louisville Linked to help our students receive the external services and support they need. Call 485-3703 for more information.
Donate new or gently used computers, books, or funds to our Every 1 Learns Program and Learning Place partners by calling 485-3710.
Provide students with scholarships for programs and learning opportunities they otherwise could not afford. For more information, call 485-3995.
Thank you!
www.jcpsky.netEqual Opportunity/Affirmative Action Employer Offering Equal Educational Opportunities
25673 Diversity, Equity, Poverty: Envision Equity Report kw 11/13
We want to hear your voice. Please provide your input.For a complete list of data, go to:
www.surveymonkey.com/s/L2T5T35
For more information about the Envision Equity scorecard visit:
www.jefferson.kyschools.us/Programs/mcconnections/EquityScorecard/