envs 102l final report dr. aurora pun and dylan...
TRANSCRIPT

ENVS 102L – FINAL REPORT
Dr. Aurora Pun and Dylan Garcia, Earth & Planetary Sciences
1. Abstract:
The Environmental Science 102L course is designed to introduce students to global change and
environmental concerns with a hands-on approach. The primary goals of the ENVS 102L redesign are to
redesign the laboratory to help students more effectively learn the fundamentals of environmental
sciences as well as to develop materials to help the instructors teach the content with research
supported pedagogical techniques. We address the basic concepts of environmental science, which
include the interdisciplinary aspects inherent within an Earth systems science field and the
misconceptions associated with it. The developed content aligns with the NM Higher Education
Department’s competencies in Area III: Laboratory Science Competencies (UNM Core Area 3: Physical
and Natural Sciences). To make these advances, we reassessed the student learning outcomes for ENVS
102L and redesigned 14 separate lab activities along with supporting materials: Student learning
outcomes, background readings, pre-lab assessments, iClicker questions, post-lab assessments,
assessment of outcomes, PowerPoint slides, activity keys, gradebook templates and other associated
supplemental materials.
To quantify student success in the course, we embedded summative assessment questions into each lab
activity. These were developed with adherence to our student learning outcomes. We collected
assessment data using rubrics for nearly 600 students for each lab during the 2015-2016 academic year.
Attitudinal data were also collected from the students as well as 15 different teaching assistants. Each
successive review of the data (over 2 semesters) provided insights for planning student learning
improvements. To improve student-success rates, we not only redesigned lab activities and
supplemental materials, but also made pedagogical changes. Pedagogical changes included the
development of teaching guidelines per each lab activity, lab training, and the development of a
workshop regarding expectations of teaching assistants and the theories/science behind the pedagogy
of active learning. We propose that these efforts will encourage our teaching assistants to better engage
with the course materials and expectations. We also suggest that the course redesign is not only a way
for to address student misperceptions of the subject matter, but to help Teaching Assistants learn to be
more effective teachers. We have had positive results regarding the success rates of our students and
positive feedback regarding the changes made in course design.
The development of lab redesign followed the methods supported by the STEM Gateway program and
associated workshops. This includes the implementation of an enhanced active learning environment
within our labs. This was made possible by incorporating iClicker questions with student discussion, pre-
and post-lab assessments with guided reading, and small-group assignments. Using our knowledge of
the backwards-design concept, the ICAP model, SMART goals, memory-forming processes, Bloom’s
Taxonomy, and other related concepts, we have made successful progress with the ENVS 102L course.
As the course progresses, we intend to further modify the lab activities as needed so as to improve the
learning experience for our students. This will, in turn, provide us with better outcomes.
2. Project motivation and goals:
Blue Planet Laboratory (ENVS 102L), along with the companion Blue Planet (ENVS 101) lecture course, is
the introduction to the Environmental Sciences (ENVS)major. This laboratory can be used to excite
students about science, introduce them to the field of environmental sciences, and to recruit students
into our Environmental Sciences program. Notably, the ENVS majors include a larger number of
Hispanic and Native American students than does the Earth and Planetary Sciences program and many
of these students become interested in the degree while taking the Blue Planet courses. It was our
motivation and goal to design or redesign laboratory activities to meet the NM Higher Education
Department's competencies in Area III: Laboratory Science Competencies (UNM Core Area 3: Physical
and Natural Sciences). It was our intent to align the laboratory activities to correspond with the needs
and expectations of outcomes in preparation for students who will take this course as a gateway into
the ENVS major, including increasing the quantitative rigor of the activities. We have designed the
laboratory exercises to address typical misconceptions regarding the environmental sciences; these
include misconceptions associated with climate change (e.g., how the greenhouse effect works), and
energy and resource sustainability (e.g. oil future, environmental impact of demand on resources). We
have also designed activities to help students understand the basics of practicing science, which include
more authentic activities such as use of field equipment, having students collect field and laboratory
data, and interpret their data and results.
Upon course completion, students will
be able to construct a hypothesis, propose a test, and then complete the test using quantitative
and spatial data.
be able to make measurements and make calculations using those measurements that lead to
graphical display and interpretation of data.
be able to make and use observational data to infer geologic/environmental processes.
be able to analyze graphical data and use the graphs to make interpretations.
be able to effectively communicate (written and/or oral) an interpretation of quantitative and
graphical data to evaluate a societally relevant environmental problem.
learn the basics of functioning successfully in a field setting, including use of some basic
equipment and techniques, and putting into practice the basic steps of collecting field data.
be able to interpret scales and elevations on a topographic contour map.
be able to use observational data in one context and apply this information in other contexts.
ENVS 102L is taught by graduate-student Teaching Assistants (TA), and these TAs change every
semester. Therefore, one of our goals was to provide TAs with complete teaching guidelines along with
keys and supplemental materials for each lab to help each TA to maximize their teaching effectiveness.
3. Project summary:
Each lab followed a particular template that we developed during our course redesign to maximize
learning.
Background Readings: Readings along with guided questions were put together for each laboratory.
These materials are hosted in UNM’s learning management system, Blackboard Learn. Students are
assigned background reading prior to each lab.
Pre-Lab Assessments: Assessments of 8 multiple-choice questions pertaining to the background reading
were developed for each lab. Students were required to take the assessments prior to lab to hold them
accountable for the readings as well as to assure preparation for the lab activities. The questions were
randomly rotated in learn, such that each student had variations in their multiple assessments per
attempt.
iClicker questions: Sets of iClicker questions were developed for each lab for use by the TAs. The goal
was to have the TA ask a few questions, using peer instruction, to help guide the short 10-minute,
content-driven, interactive opening lecture to make sure students understood the basics before
proceeding to the lab activity. The content was based on the background reading and anticipated lab
activity.
Lab Activity: Activities were designed or modified to meet the NM Higher Education Department's
competencies in Area III: Laboratory Science Competencies (UNM Core Area 3: Physical and Natural
Sciences). The laboratory activities were designed to correspond with the needs and expectations of
outcomes in preparation for students who will take this course as a gateway into the ENVS major,
including increasing the quantitative rigor of the activities, while acknowledging the absence of
mathematics prerequisites.
Post-Lab Assessments: Assessments of 8 multiple-choice questions pertaining to each lab activity were
developed for each lab. Students were required to take the assessments after the lab to hold them
individually accountable for their understanding of the material. The questions were randomly rotated
in Learn, such that each student received a unique assessment per attempt.
Teaching Assistant Guidelines: Guidelines were developed for each lab and includes general objectives,
outcomes for the lab, suggestions for teaching the material, keys for the activity, organization of the lab
and classroom management suggestions.
Outcomes: Outcomes-assessment questions were written for each lab, which corresponded to the
student learning outcomes developed for each lab and the course. These questions were embedded in
the laboratory worksheets. TAs are asked to collect outcomes data along with answering basic
questions on how the lab worked. The outcomes data along with the feedback are used to improve
continued efforts to improve the lab.
LMS, Blackboard Learn and DropBox: Each section of the lab has its own Learn site and we developed
and provided all of the materials for these sites. Each site contains folders for each labthat include
background readings, pre- and post-lab assessments, and gradebooks. TAs are given access to a
DropBox folder that houses all of the files that students see in Learn along with TA guidelines, outcomes-
assessment documents, and other supplements.
Supplemental materials: Supplemental materials such as pre-made PowerPoint slides with images for TA
use and modification for their interactive presentations were provided. Also, documents with
instructions on how to set up iClickers and use Blackboard Learn are available. Template gradebooks
are also provided for TA use as well as a general guideline for all TAs on the basics of teaching
introductory labs.
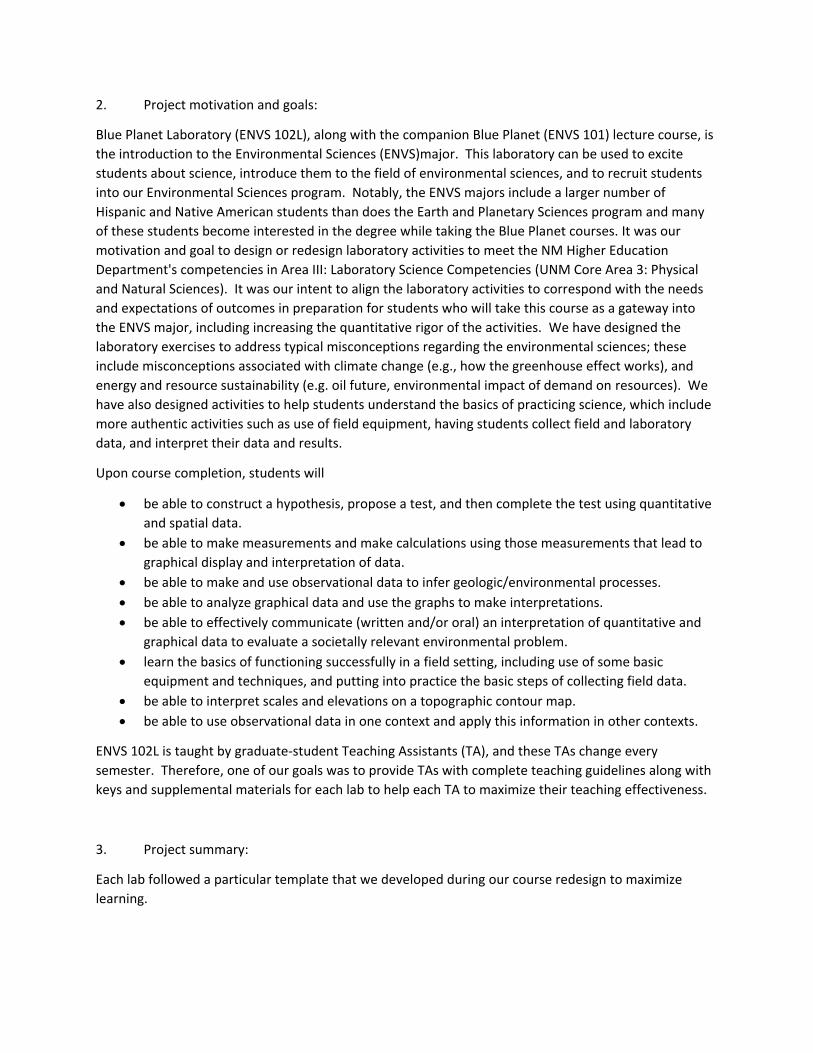
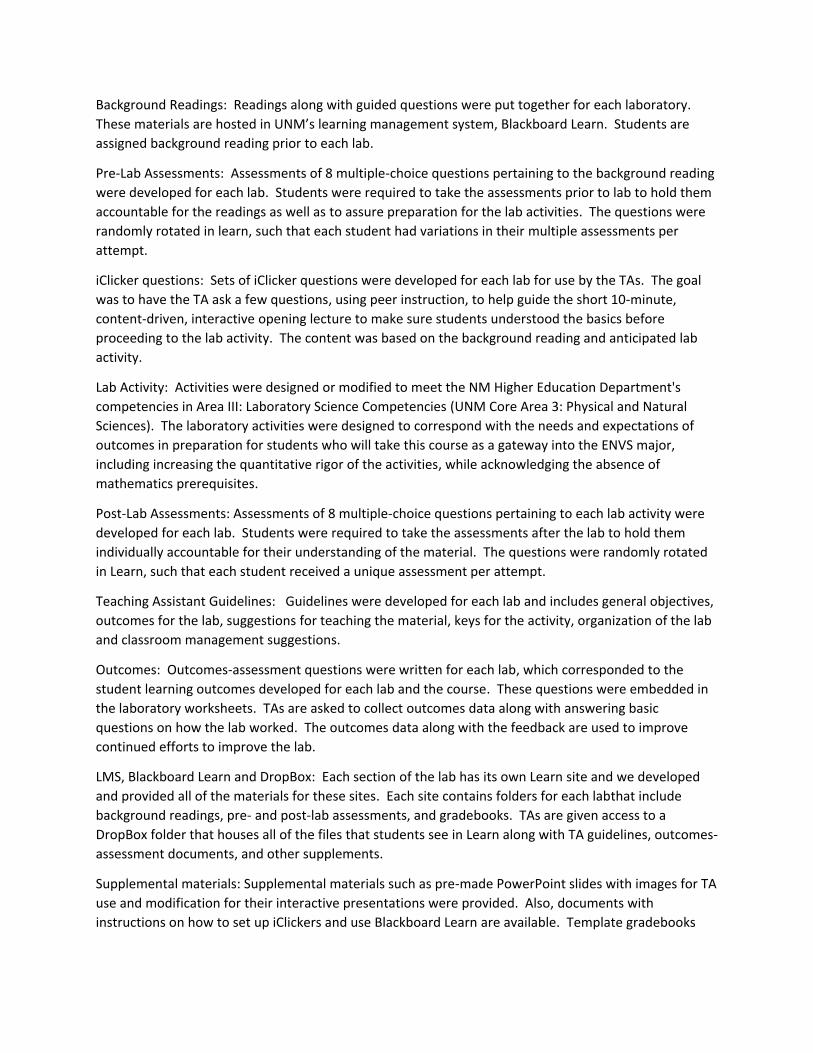
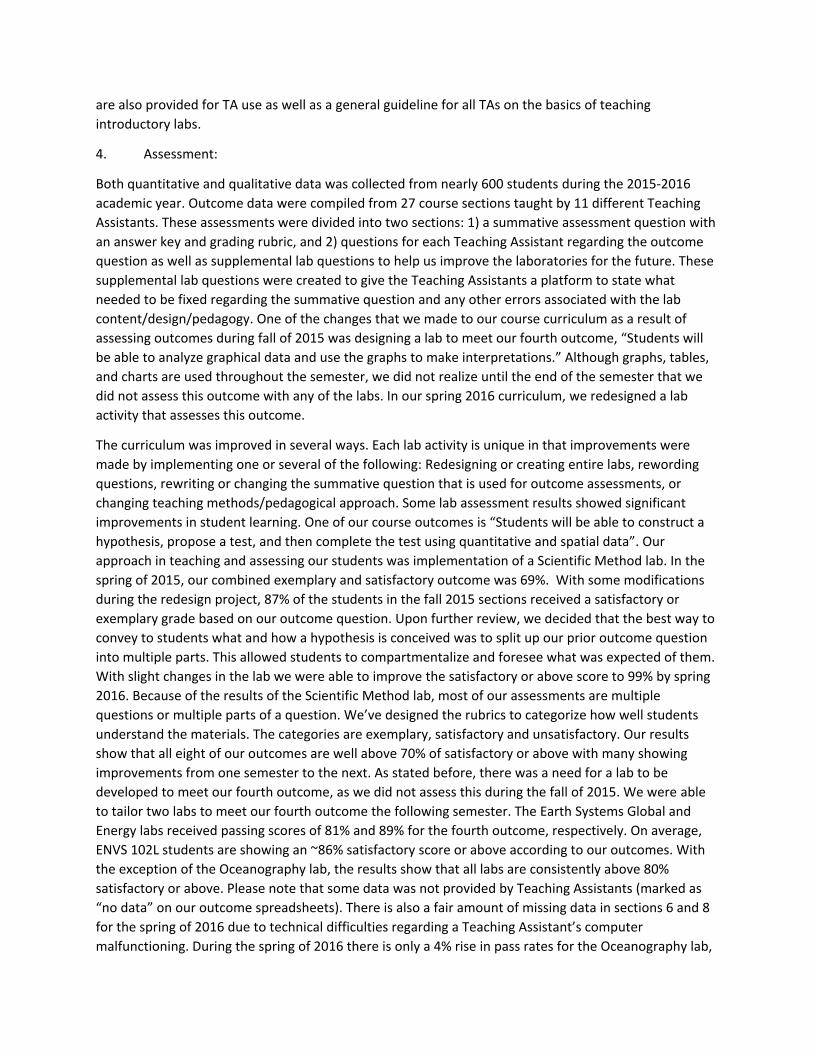
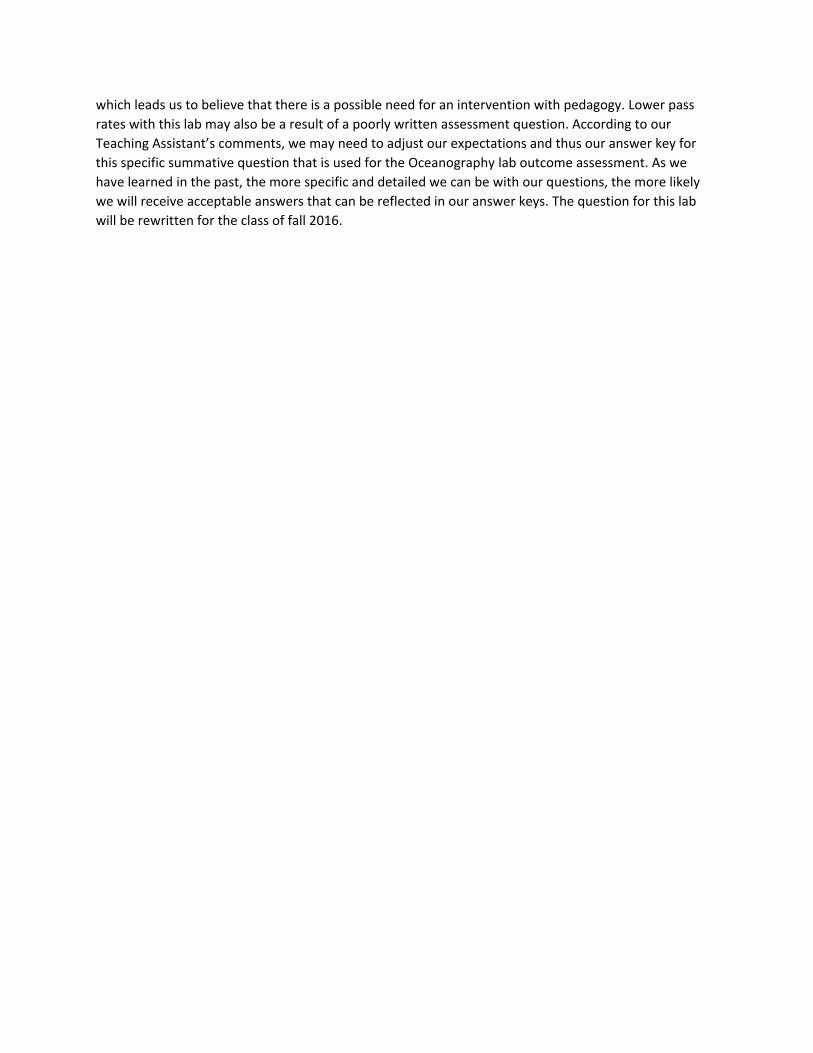
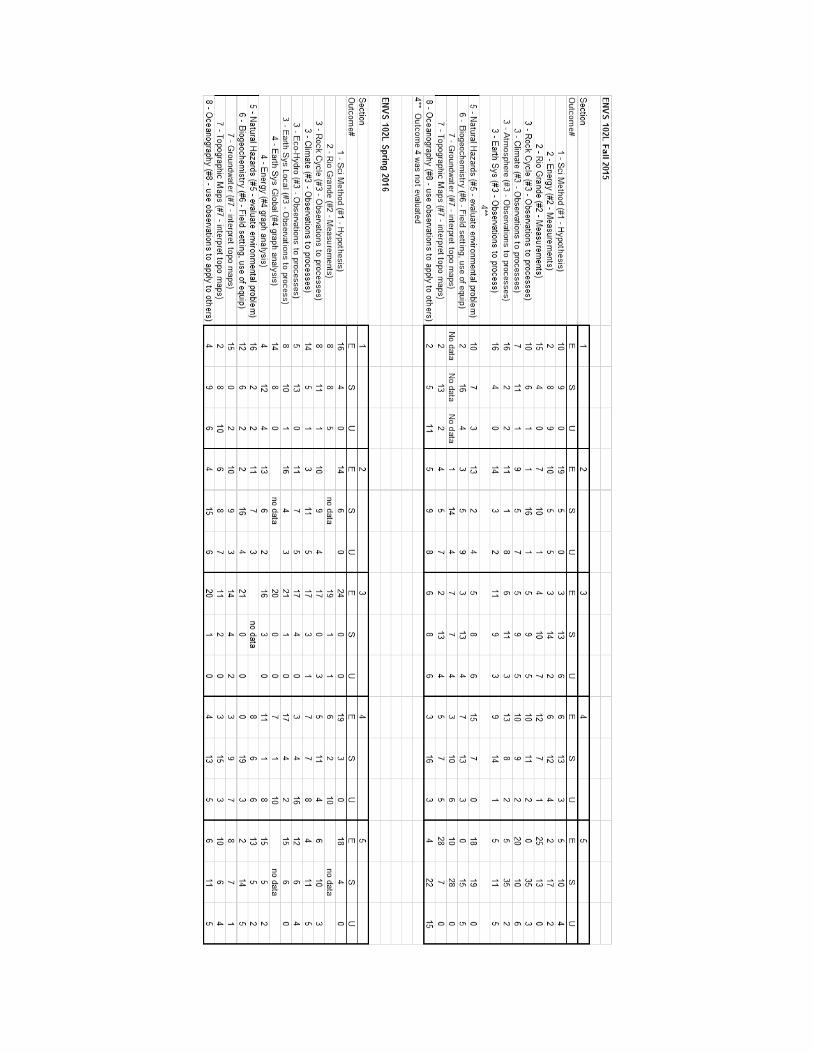
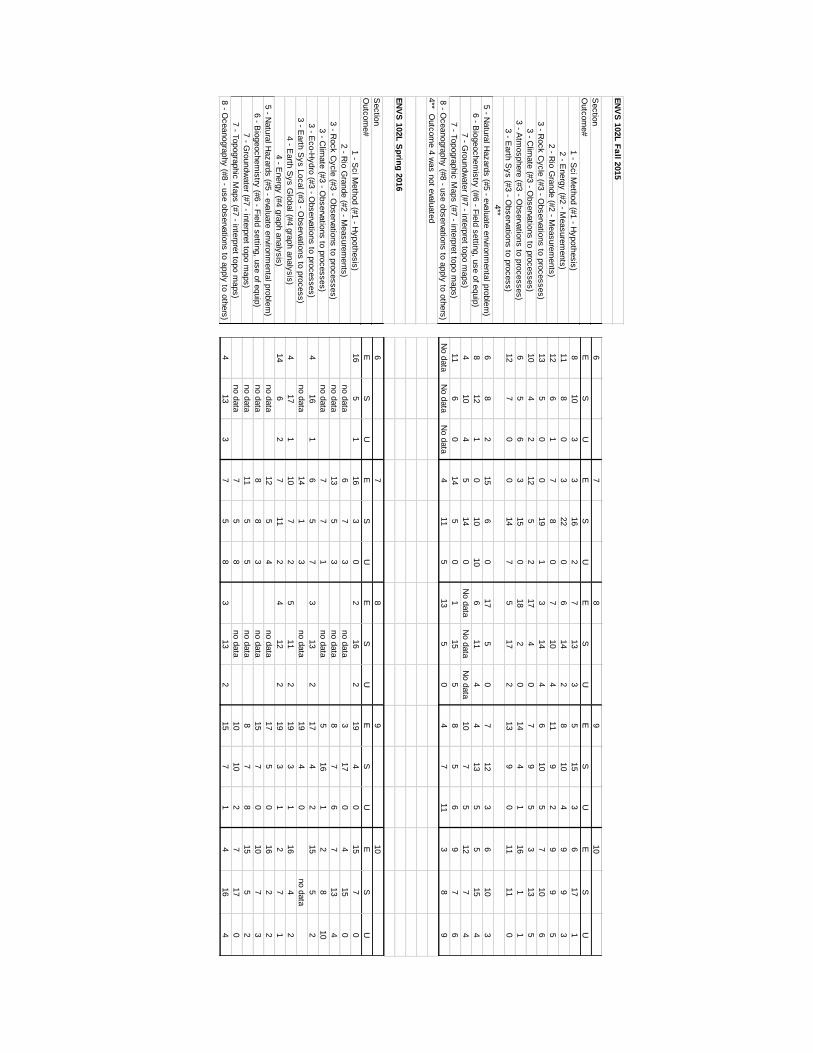
4. Assessment:
Both quantitative and qualitative data was collected from nearly 600 students during the 2015-2016
academic year. Outcome data were compiled from 27 course sections taught by 11 different Teaching
Assistants. These assessments were divided into two sections: 1) a summative assessment question with
an answer key and grading rubric, and 2) questions for each Teaching Assistant regarding the outcome
question as well as supplemental lab questions to help us improve the laboratories for the future. These
supplemental lab questions were created to give the Teaching Assistants a platform to state what
needed to be fixed regarding the summative question and any other errors associated with the lab
content/design/pedagogy. One of the changes that we made to our course curriculum as a result of
assessing outcomes during fall of 2015 was designing a lab to meet our fourth outcome, “Students will
be able to analyze graphical data and use the graphs to make interpretations.” Although graphs, tables,
and charts are used throughout the semester, we did not realize until the end of the semester that we
did not assess this outcome with any of the labs. In our spring 2016 curriculum, we redesigned a lab
activity that assesses this outcome.
The curriculum was improved in several ways. Each lab activity is unique in that improvements were
made by implementing one or several of the following: Redesigning or creating entire labs, rewording
questions, rewriting or changing the summative question that is used for outcome assessments, or
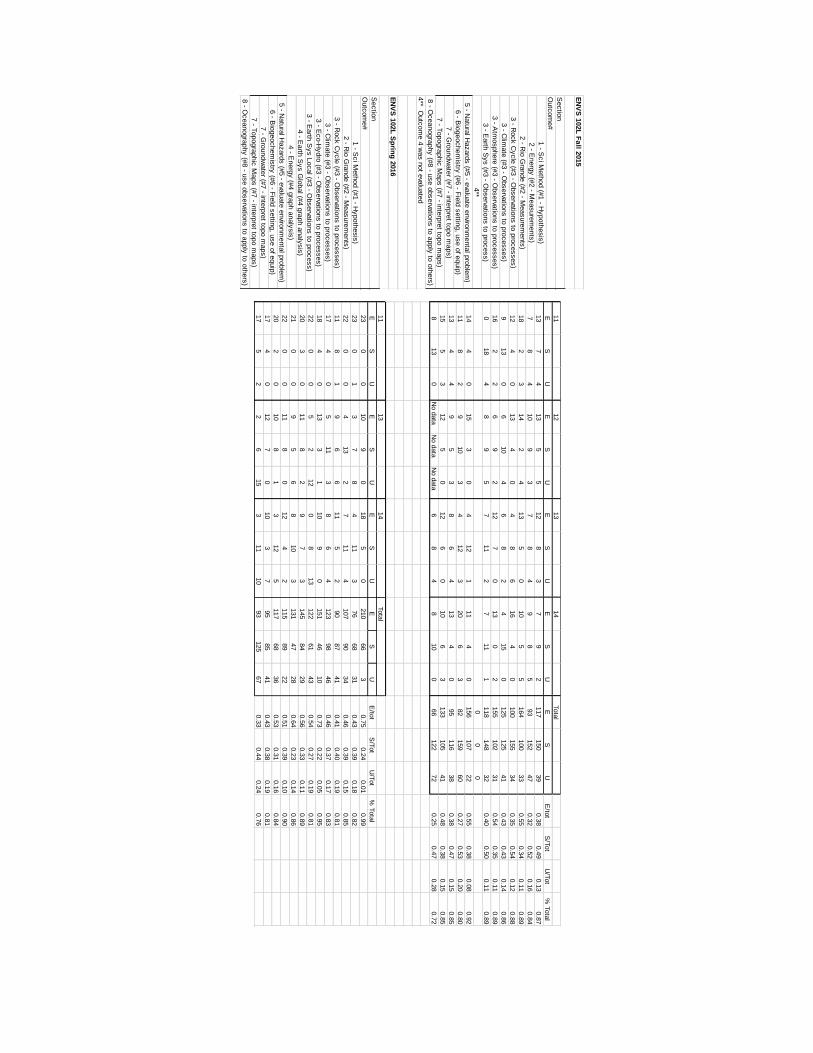
changing teaching methods/pedagogical approach. Some lab assessment results showed significant
improvements in student learning. One of our course outcomes is “Students will be able to construct a
hypothesis, propose a test, and then complete the test using quantitative and spatial data”. Our
approach in teaching and assessing our students was implementation of a Scientific Method lab. In the
spring of 2015, our combined exemplary and satisfactory outcome was 69%. With some modifications
during the redesign project, 87% of the students in the fall 2015 sections received a satisfactory or
exemplary grade based on our outcome question. Upon further review, we decided that the best way to
convey to students what and how a hypothesis is conceived was to split up our prior outcome question
into multiple parts. This allowed students to compartmentalize and foresee what was expected of them.
With slight changes in the lab we were able to improve the satisfactory or above score to 99% by spring
2016. Because of the results of the Scientific Method lab, most of our assessments are multiple
questions or multiple parts of a question. We’ve designed the rubrics to categorize how well students
understand the materials. The categories are exemplary, satisfactory and unsatisfactory. Our results
show that all eight of our outcomes are well above 70% of satisfactory or above with many showing
improvements from one semester to the next. As stated before, there was a need for a lab to be
developed to meet our fourth outcome, as we did not assess this during the fall of 2015. We were able
to tailor two labs to meet our fourth outcome the following semester. The Earth Systems Global and
Energy labs received passing scores of 81% and 89% for the fourth outcome, respectively. On average,
ENVS 102L students are showing an ~86% satisfactory score or above according to our outcomes. With
the exception of the Oceanography lab, the results show that all labs are consistently above 80%
satisfactory or above. Please note that some data was not provided by Teaching Assistants (marked as
“no data” on our outcome spreadsheets). There is also a fair amount of missing data in sections 6 and 8
for the spring of 2016 due to technical difficulties regarding a Teaching Assistant’s computer
malfunctioning. During the spring of 2016 there is only a 4% rise in pass rates for the Oceanography lab,
which leads us to believe that there is a possible need for an intervention with pedagogy. Lower pass
rates with this lab may also be a result of a poorly written assessment question. According to our
Teaching Assistant’s comments, we may need to adjust our expectations and thus our answer key for
this specific summative question that is used for the Oceanography lab outcome assessment. As we
have learned in the past, the more specific and detailed we can be with our questions, the more likely
we will receive acceptable answers that can be reflected in our answer keys. The question for this lab
will be rewritten for the class of fall 2016.
EN
VS
102L
Fa
ll 2015
Sectio
n
Outc
om
e#
1 - S
ci M
eth
od (#
1 - H
ypoth
esis
)
2 - E
nerg
y (#
2 - M
easure
ments
)
2 - R
io G
rande (#
2 - M
easure
ments
)
3 - R
ock C
ycle
(#3 - O
bserva
tions to
pro
cesses)
3 - C
limate
(#3 - O
bserva
tions to
pro
cesses)
3 - A
tmosphere
(#3 - O
bserva
tions to
pro
cesses)
3 - E
arth
Sys (#
3 - O
bserva
tions to
pro
cess)
4**
5 - N
atu
ral H
azard
s (#
5 - e
valu
ate
enviro
nm
enta
l pro
ble
m)
6 - B
iogeochem
istry
(#6 - F
ield
settin
g, u
se o
f equip
)
7 - G
roundw
ate
r (#7 - in
terp
ret to
po m
aps)
7 - T
opogra
phic
Maps (#
7 - in
terp
ret to
po m
aps)
8 - O
ceanogra
phy (#
8 - u
se o
bserva
tions to
apply
to o
thers
)
4** O
utc
om
e 4
was n
ot e
valu
ate
d
EN
VS
102L
Sp
ring
2016
Sectio
n
Outc
om
e#
1 - S
ci M
eth
od (#
1 - H
ypoth
esis
)
2 - R
io G
rande (#
2 - M
easure
ments
)
3 - R
ock C
ycle
(#3 - O
bserva
tions to
pro
cesses)
3 - C
limate
(#3 - O
bserva
tions to
pro
cesses)
3 - E
co-H
ydro
(#3 - O
bserva
tions to
pro
cesses)
3 - E
arth
Sys L
ocal (#
3 - O
bserva
tions to
pro
cess)
4 - E
arth
Sys G
lobal (#
4 g
raph a
naly
sis
)
4 - E
nerg
y (#
4 g
raph a
naly
sis
)
5 - N
atu
ral H
azard
s (#
5 - e
valu
ate
enviro
nm
enta
l pro
ble
m)
6 - B
iogeochem
istry
(#6 - F
ield
settin
g, u
se o
f equip
)
7 - G
roundw
ate
r (#7 - in
terp
ret to
po m
aps)
7 - T
opogra
phic
Maps (#
7 - in
terp
ret to
po m
aps)
8 - O
ceanogra
phy (#
8 - u
se o
bserva
tions to
apply
to o
thers
)
67
89
10
ES
UE
SU
ES
UE
SU
ES
U
810
33
16
27
13
35
15
36
17
1
11
80
322
06
14
28
10
49
93
12
61
78
07
10
411
92
99
5
13
50
019
13
14
46
10
57
10
6
10
42
12
52
17
40
79
53
13
5
65
63
15
018
20
14
41
16
11
12
70
014
75
17
213
90
11
11
0
68
215
60
17
50
712
36
10
3
812
10
10
10
611
44
13
55
15
4
410
45
14
0N
o d
ata
No d
ata
No d
ata
10
75
12
74
11
60
14
50
115
58
56
97
6
No d
ata
No d
ata
No d
ata
411
513
50
47
11
38
9
67
89
10
ES
UE
SU
ES
UE
SU
ES
U
16
51
16
30
216
219
40
15
70
no d
ata
67
3no d
ata
317
04
15
0
no d
ata
13
53
no d
ata
87
67
13
4
no d
ata
77
1no d
ata
516
12
810
416
16
57
313
217
42
15
52
no d
ata
14
13
no d
ata
19
40
no d
ata
417
110
72
511
219
31
16
42
14
62
711
24
12
219
31
27
1
no d
ata
12
54
no d
ata
17
50
16
22
no d
ata
88
3no d
ata
15
70
10
73
no d
ata
11
55
no d
ata
87
815
52
no d
ata
75
8no d
ata
10
10
27
17
0
413
37
58
313
215
71
416
4
EN
VS
102L
Fa
ll 2015
Sectio
n
Outc
om
e#
1 - S
ci M
eth
od (#
1 - H
ypoth
esis
)
2 - E
nerg
y (#
2 - M
easure
ments
)
2 - R
io G
rande (#
2 - M
easure
ments
)
3 - R
ock C
ycle
(#3 - O
bserva
tions to
pro
cesses)
3 - C
limate
(#3 - O
bserva
tions to
pro
cesses)
3 - A
tmosphere
(#3 - O
bserva
tions to
pro
cesses)
3 - E
arth
Sys (#
3 - O
bserva
tions to
pro
cess)
4**
5 - N
atu
ral H
azard
s (#
5 - e
valu
ate
enviro
nm
enta
l pro
ble
m)
6 - B
iogeochem
istry
(#6 - F
ield
settin
g, u
se o
f equip
)
7 - G
roundw
ate
r (#7 - in
terp
ret to
po m
aps)
7 - T
opogra
phic
Maps (#
7 - in
terp
ret to
po m
aps)
8 - O
ceanogra
phy (#
8 - u
se o
bserva
tions to
apply
to o
thers
)
4** O
utc
om
e 4
was n
ot e
valu
ate
d
EN
VS
102L
Sp
ring
2016
Sectio
n
Outc
om
e#
1 - S
ci M
eth
od (#
1 - H
ypoth
esis
)
2 - R
io G
rande (#
2 - M
easure
ments
)
3 - R
ock C
ycle
(#3 - O
bserva
tions to
pro
cesses)
3 - C
limate
(#3 - O
bserva
tions to
pro
cesses)
3 - E
co-H
ydro
(#3 - O
bserva
tions to
pro
cesses)
3 - E
arth
Sys L
ocal (#
3 - O
bserva
tions to
pro
cess)
4 - E
arth
Sys G
lobal (#
4 g
raph a
naly
sis
)
4 - E
nerg
y (#
4 g
raph a
naly
sis
)
5 - N
atu
ral H
azard
s (#
5 - e
valu
ate
enviro
nm
enta
l pro
ble
m)
6 - B
iogeochem
istry
(#6 - F
ield
settin
g, u
se o
f equip
)
7 - G
roundw
ate
r (#7 - in
terp
ret to
po m
aps)
7 - T
opogra
phic
Maps (#
7 - in
terp
ret to
po m
aps)
8 - O
ceanogra
phy (#
8 - u
se o
bserva
tions to
apply
to o
thers
)
11
12
13
14
Tota
l
ES
UE
SU
ES
UE
SU
ES
UE
/tot
S/T
ot
U/T
ot
% T
ota
l
13
74
13
55
12
83
79
2117
150
39
0.3
80.4
90.1
30.8
7
78
410
93
78
49
85
93
152
47
0.3
20.5
20.1
60.8
4
18
23
14
24
13
50
10
55
164
100
33
0.5
50.3
40.1
10.8
9
12
40
13
40
48
616
40
100
155
34
0.3
50.5
40.1
20.8
8
913
06
10
46
82
415
0125
125
41
0.4
30.4
30.1
40.8
6
16
22
69
212
70
13
02
155
102
31
0.5
40.3
50.1
10.8
9
018
48
95
711
27
11
1118
148
32
0.4
00.5
00.1
10.8
9
00
0
14
40
15
30
412
111
40
156
107
22
0.5
50.3
80.0
80.9
2
11
82
910
34
12
320
63
82
159
60
0.2
70.5
30.2
00.8
0
13
44
95
38
64
13
40
95
116
38
0.3
80.4
70.1
50.8
5
15
53
12
50
12
60
10
63
133
105
41
0.4
80.3
80.1
50.8
5
813
0N
o d
ata
No d
ata
No d
ata
68
48
10
066
122
72
0.2
50.4
70.2
80.7
2
11
13
14
Tota
l
ES
UE
SU
ES
UE
SU
E/to
tS
/Tot
U/T
ot
% T
ota
l
23
00
10
90
18
50
210
66
30.7
50.2
40.0
10.9
9
23
01
37
84
11
376
68
31
0.4
30.3
90.1
80.8
2
22
00
413
27
11
4107
90
34
0.4
60.3
90.1
50.8
5
11
81
96
611
52
90
87
41
0.4
10.4
00.1
90.8
1
17
40
511
38
64
123
98
46
0.4
60.3
70.1
70.8
3
18
40
13
31
10
90
151
46
10
0.7
30.2
20.0
50.9
5
22
00
52
12
08
13
122
61
43
0.5
40.2
70.1
90.8
1
20
30
11
82
97
3145
84
29
0.5
60.3
30.1
10.8
9
21
00
95
68
10
3131
47
28
0.6
40.2
30.1
40.8
6
22
00
11
80
12
42
115
89
22
0.5
10.3
90.1
00.9
0
20
20
10
81
312
5117
68
36
0.5
30.3
10.1
60.8
4
17
40
12
70
10
37
95
85
41
0.4
30.3
80.1
90.8
1
17
52
26
15
311
10
93
125
67
0.3
30.4
40.2
40.7
6
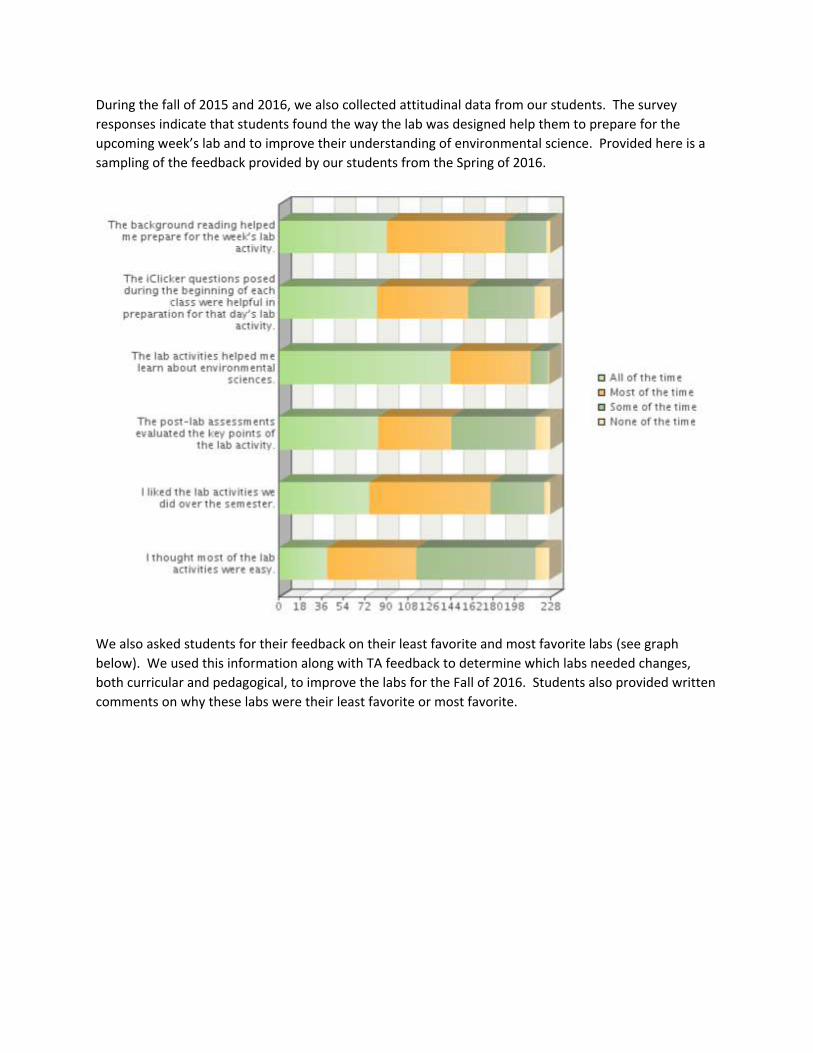
During the fall of 2015 and 2016, we also collected attitudinal data from our students. The survey
responses indicate that students found the way the lab was designed help them to prepare for the
upcoming week’s lab and to improve their understanding of environmental science. Provided here is a
sampling of the feedback provided by our students from the Spring of 2016.
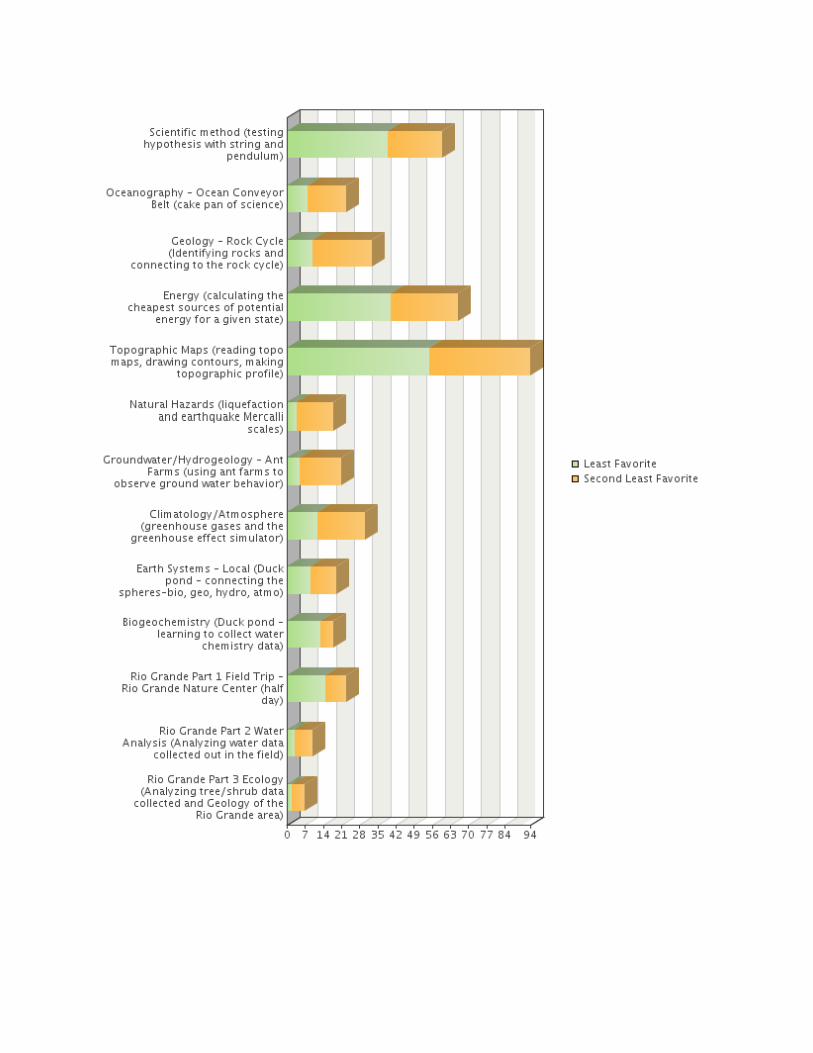
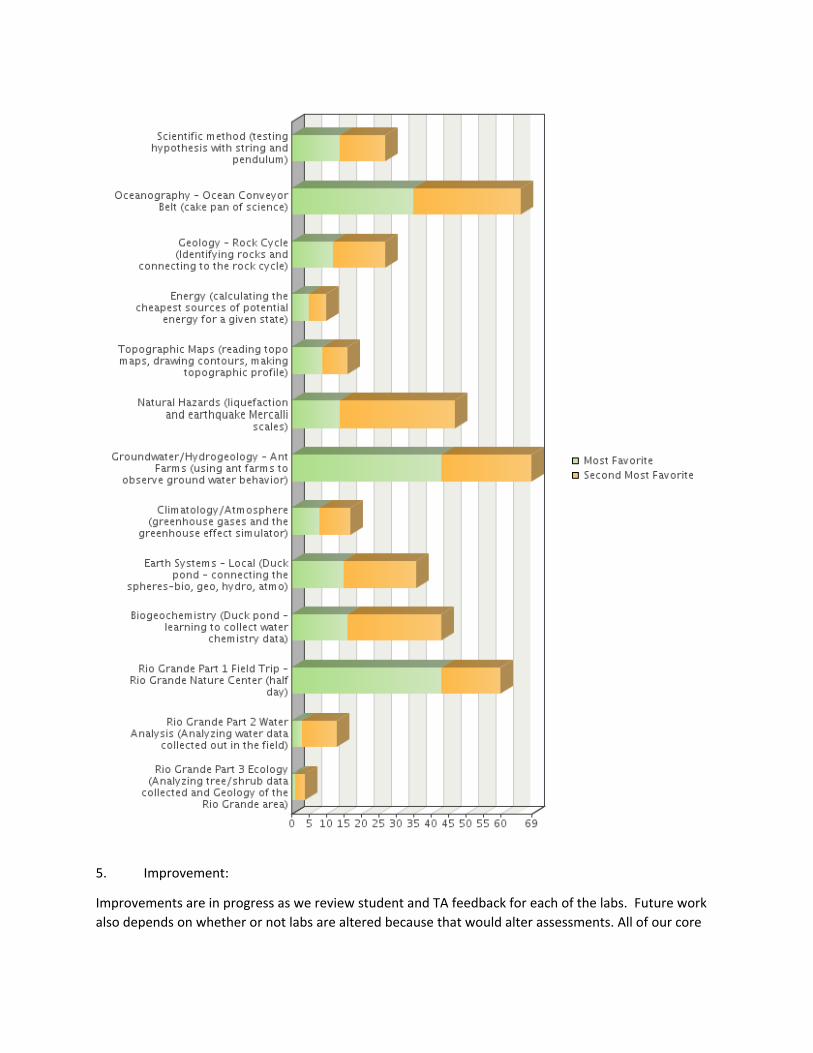
We also asked students for their feedback on their least favorite and most favorite labs (see graph
below). We used this information along with TA feedback to determine which labs needed changes,
both curricular and pedagogical, to improve the labs for the Fall of 2016. Students also provided written
comments on why these labs were their least favorite or most favorite.
5. Improvement:
Improvements are in progress as we review student and TA feedback for each of the labs. Future work
also depends on whether or not labs are altered because that would alter assessments. All of our core
lab outcome results show that more than 72% of our students are meeting minimum requirements. As a
result, one of our next steps is to evaluate how we can improve our success rates.
Approaches will involve redesigning labs and pedagogical changes to enhance and improve student
learning as well as Teaching Assistant training regarding teaching and pedagogy. To accomplish this, we
plan to redesign labs as needed. This will largely be based upon the responses we received from the
students and the Teaching Assistants after each respective lab. The Teaching Assistants were able to
answer questions in regards to whether or not the activity suited the outcome. All of the activities will
be redesigned to some extent, be it the lab activity itself or one of the many components for a particular
lab - .i.e. pre-lab assessments, post-lab assessments, iClicker questions, and background readings.
There are other challenges with teaching execution that will be worked on as we revise teaching
guidelines which are also created for each individual lab. An example of a change in teaching technique
was revising our lab on earth systems processes. Prior to receiving feedback from our Teaching
Assistants, we asked several questions about the movement of carbon dioxide throughout earth’s
systems (geosphere, biosphere, atmosphere, and hydrosphere). The students struggled with this
material because of their lack of knowledge regarding the carbon cycle. After receiving feedback,
however, we were able to build in more carbon dioxide materials into the lab activity so there was an
upward learning process. As a result our students were able to meet a higher level of understanding as
shown in our outcomes data; there is a 5% increase in passing grades. During the summer of 2016,
based on TA feedback, we decided to eliminate the earth systems lab, but incorporate the carbon
dioxide information into another lab. To replace the earth systems lab, we added a new lab on plate
tectonics. We have also re-written the geology lab, with feedback from our TAs. We plan to assess this
change in the fall of 2016.
Although all labs, with the exception of the Oceanography lab, are above an 80% pass rate, we will still
be aligning assessment questions with student learning outcomes in the coming months. We suggest
that by evaluating each individual lab, we can improve the alignment with the stated outcomes, and
thus the assessment of our outcomes and the lab itself. This is important in that our outcomes are not
static, but rather dynamic in that we want to stimulate progress and foster improved student
development practices in accordance to our goals. Ultimately, we want to improve pedagogy as well as
the learning experience for our students.
To improve pedagogy, we have developed a workshop for all new introductory lab TAs for the Fall of
2016. This workshop will provide guidance on TA expectations for their responsibilities of running their
laboratories as well as provide them with a pedagogical framework on how and why the labs were
designed. We are hoping that if TAs understand how the labs are set up and why they were designed in
this particular way, TAs will more likely see how they can contribute to student learning in their lab
sections.
6. Expansion:
We anticipate teaching 14 sections of ENVS 102L in the Fall of 2016 and 12 sections in the Spring of
2017, which is the same for the previous fall and spring semesters. We cannot expand beyond 14
sections as we are limited by the number of hours we can teach in our present laboratory classroom,
which we share with Biology. We are allowed 2.5 days and we have filled it with 14 sections of the lab.
We may be able to expand enrollments in the spring semesters from 12 to 14, as we have student
demand, but we may not have enough TAs to teach the courses. The instructors will continue to be
Teaching Assistants.
7. Sustaining:
All of the materials that have developed for the course, including materials from previous iterations of
the labs are curated with the Coordinator of the labs. If there is an anticipated change in coordination,
then the curated materials would be transferred to the new coordinator. All of the materials provided
to the Teaching Assistants are housed in DropBox for use during the semester in which they are TAs for
the course. The redesign team is continuing to assess outcomes and make adjustments to the labs and
associated materials for continuous improvement. Since all of the materials are curated, the redesign
course elements can be transferred and used by anyone who coordinates or teaches the labs.
8. Challenges:
One of our major challenges is that the labs are taught by TAs, and these TAs change from semester to
semester. This requires training every semester for any TA that has not previously taught the lab, and
re-training and/or encouragement to returning TAs to improve their pedagogy for the new semester.
Since TAs change semester to semester, the TAs are not always invested to follow the pedagogy or to
provide feedback to improve the labs. This can be challenging to the redesign team, as we are not
directly teaching the labs but relying on participation by, and constructive feedback from, the TAs for
continuous improvements.