eog 0219 - static.seekingalpha.com
TRANSCRIPT

4Q 2018
David Streit, Vice President IR/PR(713) 571‐4902, [email protected]
Kimberly Ehmer, Director IR/PR(713) 571‐4676, [email protected]
Neel Panchal, Director IR(713) 571‐4884, [email protected]
John Wagner, Engineer IR(713) 571‐4404, [email protected]
4Q 2018
Copyright; Assumption of Risk:Copyright 2019. This presentation and the contents of this presentation have been copyrighted by EOG Resources, Inc. (EOG). All rights reserved. Copying of the presentation is forbidden without the prior written consent of EOG. Information in this presentation is provided “as is” without warranty of any kind, either express or implied, including but not limited to the implied warranties of merchantability, fitness for a particular purpose and the timeliness of the information. You assume all risk in using the information. In no event shall EOG or its representatives be liable for any special, indirect or consequential damages resulting from the use of the information.
Cautionary Notice Regarding Forward‐Looking Statements:This presentation includes forward‐looking statements within the meaning of Section 27A of the Securities Act of 1933, as amended, and Section 21E of the Securities Exchange Act of 1934, as amended. All statements, other than statements of historical facts, including, among others, statements and projections regarding EOG's future financial position, operations, performance, business strategy, returns, budgets, reserves, levels of production, capital expenditures, costs and asset sales, statements regarding future commodity prices and statements regarding the plans and objectives of EOG's management for future operations, are forward‐looking statements. EOG typically uses words such as "expect," "anticipate," "estimate," "project," "strategy," "intend," "plan," "target," “aims,” "goal," "may," "will," "should" and "believe" or the negative of those terms or other variations or comparable terminology to identify its forward‐looking statements. In particular, statements, express or implied, concerning EOG's future operating results and returns or EOG's ability to replace or increase reserves, increase production, generate returns, replace or increase drilling locations, reduce or otherwise control operating costs and capital expenditures, generate cash flows, pay down or refinance indebtedness or pay and/or increase dividends are forward‐looking statements. Forward‐looking statements are not guarantees of performance. Although EOG believes the expectations reflected in its forward‐looking statements are reasonable and are based on reasonable assumptions, no assurance can be given that these assumptions are accurate or that any of these expectations will be achieved (in full or at all) or will prove to have been correct. Moreover, EOG's forward‐looking statements may be affected by known, unknown or currently unforeseen risks, events or circumstances that may be outside EOG's control. Furthermore, this presentation and any accompanying disclosures may include or reference certain forward‐looking, non‐GAAP financial measures, such as free cash flow or discretionary cash flow, and certain related estimates regarding future performance, results and financial position. Any such forward‐looking measures and estimates are intended to be illustrative only and are not intended to reflect the results that EOG will necessarily achieve for the period(s) presented; EOG’s actual results may differ materially from such measures and estimates. Important factors that could cause EOG's actual results to differ materially from the expectations reflected in EOG's forward‐looking statements include, among others:
• the timing, extent and duration of changes in prices for, supplies of, and demand for, crude oil and condensate, natural gas liquids, natural gas and related commodities; • the extent to which EOG is successful in its efforts to acquire or discover additional reserves; • the extent to which EOG is successful in its efforts to economically develop its acreage in, produce reserves and achieve anticipated production levels from, and maximize reserve recovery from, its existing and future crude oil and natural gas exploration and development
projects; • the extent to which EOG is successful in its efforts to market its crude oil and condensate, natural gas liquids, natural gas and related commodity production;• the availability, proximity and capacity of, and costs associated with, appropriate gathering, processing, compression, storage, transportation and refining facilities; • the availability, cost, terms and timing of issuance or execution of, and competition for, mineral licenses and leases and governmental and other permits and rights‐of‐way, and EOG’s ability to retain mineral licenses and leases;• the impact of, and changes in, government policies, laws and regulations, including tax laws and regulations; climate change and other environmental, health and safety laws and regulations relating to air emissions, disposal of produced water, drilling fluids and other
wastes, hydraulic fracturing and access to and use of water; laws and regulations imposing conditions or restrictions on drilling and completion operations and on the transportation of crude oil and natural gas; laws and regulations with respect to derivatives and hedging activities; and laws and regulations with respect to the import and export of crude oil, natural gas and related commodities;
• EOG's ability to effectively integrate acquired crude oil and natural gas properties into its operations, fully identify existing and potential problems with respect to such properties and accurately estimate reserves, production and costs with respect to such properties;• the extent to which EOG's third‐party‐operated crude oil and natural gas properties are operated successfully and economically;• competition in the oil and gas exploration and production industry for the acquisition of licenses, leases and properties, employees and other personnel, facilities, equipment, materials and services; • the availability and cost of employees and other personnel, facilities, equipment, materials (such as water and tubulars) and services;• the accuracy of reserve estimates, which by their nature involve the exercise of professional judgment and may therefore be imprecise;• weather, including its impact on crude oil and natural gas demand, and weather‐related delays in drilling and in the installation and operation (by EOG or third parties) of production, gathering, processing, refining, compression, storage and transportation facilities;• the ability of EOG's customers and other contractual counterparties to satisfy their obligations to EOG and, related thereto, to access the credit and capital markets to obtain financing needed to satisfy their obligations to EOG;• EOG's ability to access the commercial paper market and other credit and capital markets to obtain financing on terms it deems acceptable, if at all, and to otherwise satisfy its capital expenditure requirements;• the extent to which EOG is successful in its completion of planned asset dispositions;• the extent and effect of any hedging activities engaged in by EOG;• the timing and extent of changes in foreign currency exchange rates, interest rates, inflation rates, global and domestic financial market conditions and global and domestic general economic conditions;• geopolitical factors and political conditions and developments around the world (such as the imposition of tariffs or trade or other economic sanctions, political instability and armed conflict), including in the areas in which EOG operates;• the use of competing energy sources and the development of alternative energy sources;• the extent to which EOG incurs uninsured losses and liabilities or losses and liabilities in excess of its insurance coverage;• acts of war and terrorism and responses to these acts; • physical, electronic and cybersecurity breaches; and• the other factors described under ITEM 1A, Risk Factors, on pages 13 through 22 of EOG’s Annual Report on Form 10‐K for the fiscal year ended December 31, 2018 and any updates to those factors set forth in EOG's subsequent Quarterly Reports on Form 10‐Q or Current
Reports on Form 8‐K.
In light of these risks, uncertainties and assumptions, the events anticipated by EOG's forward‐looking statements may not occur, and, if any of such events do, we may not have anticipated the timing of their occurrence or the duration or extent of their impact on our actual results. Accordingly, you should not place any undue reliance on any of EOG's forward‐looking statements. EOG's forward‐looking statements speak only as of the date made, and EOG undertakes no obligation, other than as required by applicable law, to update or revise its forward‐looking statements, whether as a result of new information, subsequent events, anticipated or unanticipated circumstances or otherwise.
Oil and Gas Reserves; Non‐GAAP Financial Measures:The United States Securities and Exchange Commission (SEC) permits oil and gas companies, in their filings with the SEC, to disclose not only “proved” reserves (i.e., quantities of oil and gas that are estimated to be recoverable with a high degree of confidence), but also “probable” reserves (i.e., quantities of oil and gas that are as likely as not to be recovered) as well as “possible” reserves (i.e., additional quantities of oil and gas that might be recovered, but with a lower probability than probable reserves). Statements of reserves are only estimates and may not correspond to the ultimate quantities of oil and gas recovered. Any reserve or resource estimates provided in this presentation that are not specifically designated as being estimates of proved reserves may include "potential" reserves, “resource potential” and/or other estimated reserves or estimated resources not necessarily calculated in accordance with, or contemplated by, the SEC’s latest reserve reporting guidelines. Investors are urged to consider closely the disclosure in EOG’s Annual Report on Form 10‐K for the fiscal year ended December 31, 2018, available from EOG at P.O. Box 4362, Houston, Texas 77210‐4362 (Attn: Investor Relations). You can also obtain this report from the SEC by calling 1‐800‐SEC‐0330 or from the SEC's website at www.sec.gov. In addition, reconciliation and calculation schedules for non‐GAAP financial measures can be found on the EOG website at www.eogresources.com.
2
4Q 2018 3

4Q 2018
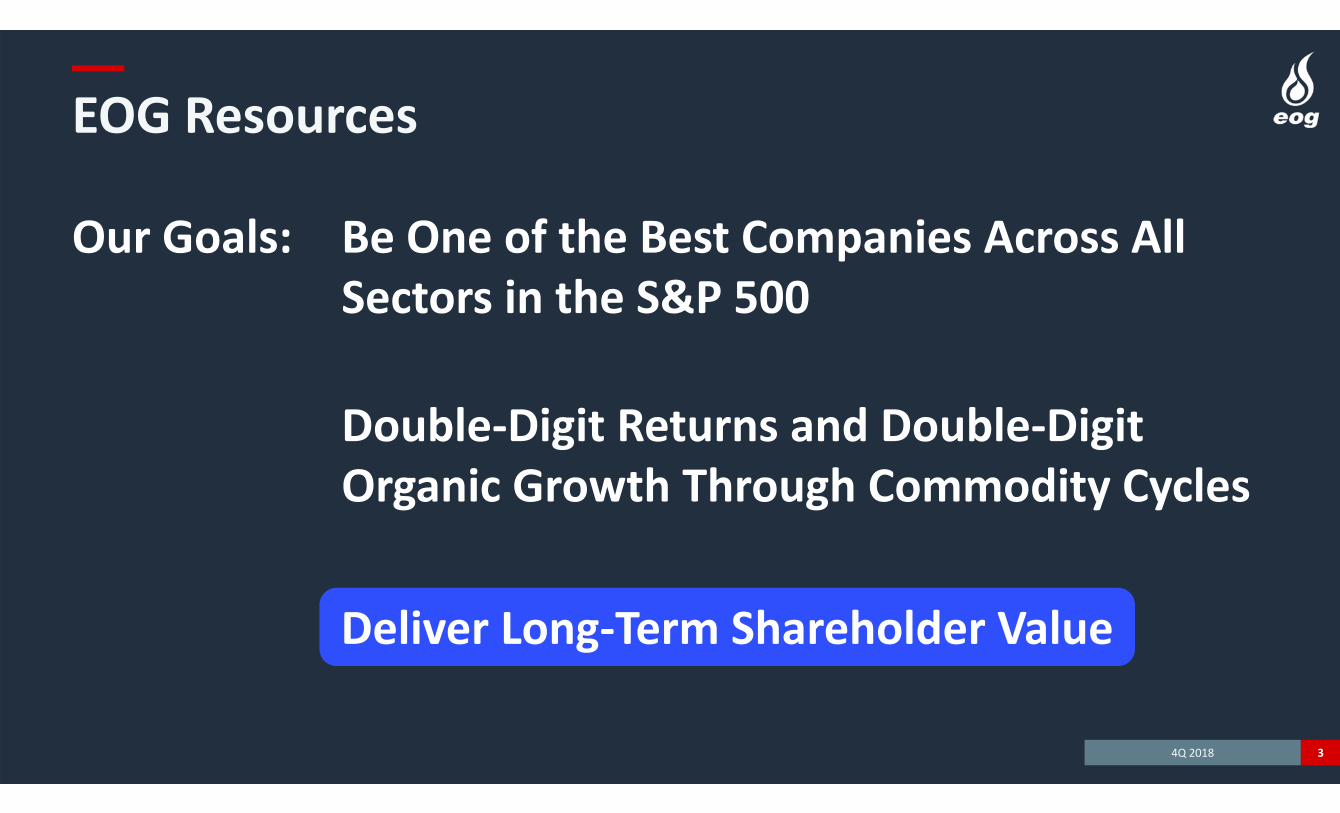
EOG ResourcesHigh Return Organic Growth Company
4
Leader in ROCE Through
Commodity Price Cycles
Leader in Disciplined Growth
Low‐Cost Producer Competitive in Global Energy
Market
Commitment to Sustainability

4Q 2018
2018 Performance Among the Best Across all SectorsDelivered A Premium Combination: High Return Organic Growth
(1) 2018 ROCE calculated using adjusted net income (non‐GAAP). See reconciliation schedules for reconciliations and definitions of non‐GAAP measures.(2) All‐in total, excluding revisions due to price. See reconciliation schedules for reconciliations and definitions of non‐GAAP measures.(3) Estimated potential reserves net to EOG, not proved reserves.(4) Well Costs = Drilling, Completion, Well‐Site Facilities and Flowback. (5) Includes LOE, Transportation and G&A. See reconciliation schedules for reconciliations and definitions of non‐GAAP measures.(6) Adjusted net income (non‐GAAP). See reconciliation schedules for reconciliations and definitions of non‐GAAP measures.(7) Discretionary Cash Flow less CAPEX and Dividend. See reconciliation schedules for reconciliations and definitions of non‐GAAP measures.(8) See reconciliation schedules for reconciliations and definitions of non‐GAAP measures.
5
Organic Growth Through Premium Drilling‐ Grew Oil Production 19%‐ 16% Increase in Proved Reserves at Sub‐$10 Finding Cost2
‐ Two New Premium Plays in Powder River Basin• 1,500+ Premium Net Drilling Locations and 1.9 BnBoe
of Net Resource Potential3 in the Mowry and Niobrara Shales
Strong Financial Results‐ Record Net Income6 of $3.2 Bn‐ Record $1.7 Bn of Free Cash Flow7
‐ Raised Dividend Rate 31%‐ Reduced Net Debt to Total Capitalization8 Ratio to 19%
Strong Operational Execution‐ Significant Technical Progress in All Premium Plays‐ Sustainable Improvement in Well Productivity‐ Achieved 3% Well Cost4 Reduction by 4Q18‐ Reduced Cash Operating Costs 6%5
ROCE Competitive with All Sectors‐ Realized 15%1 ROCE in 2018‐ Lowered Oil Price Required for 10% ROCE

4Q 2018
2019 Game PlanContinue Delivering Long‐Term Shareholder Value
(1) Based on midpoint of 2019 guidance, as of February 26, 2019.(2) Capital efficiency = amount of capital necessary to replace base decline and add new production. Base decline calculated on a full‐year average basis. (3) Net prospective acreage disclosed in the Eagle Ford, Delaware Basin, Powder River Basin, Bakken/Three Forks, DJ Basin and Woodford Oil Window. See slide 13.(4) Well Costs = Drilling, Completion, Well‐Site Facilities and Flowback. (5) Discretionary Cash Flow less CAPEX and Dividend. See reconciliation schedules for reconciliations and definitions of non‐GAAP measures. 6
Disciplined Growth + Opportunistic Investment‐ Target 12% ‐ 16% U.S. Oil Growth‐ Capital Budget of $6.3 Bn1
• ~740 Net Planned Completions• Increase Investment in New Premium Drilling
Potential
Financial Objectives Aligned with Shareholders‐ Free Cash Flow Positive5 at $50 Oil
• Generate Substantial Free Cash Flow with Higher Oil Prices
‐ Target Strong Dividend Growth‐ Retire $900 MM Bond in June 2019
Innovation + Operational Execution‐ Carry Strong Operational Momentum into 2019‐ Improve Capital Efficiency2 In Premium Areas3
‐ Continue to Improve Well Productivity‐ Reduce Well Costs 5%4
ROCE Competitive with All Sectors‐ Target Double‐Digit ROCE in 2019‐ Continue Lowering Oil Price Required for 10% ROCE

4Q 2018
27%
20%18%
5%
15%18%
30%
25%
16%
26%
5%
2%
8%
4%
12%15%
‐10%
1999 2000 2001 2002 2003 2004 2005 2006 2007 2008 2009 2010 2011 2012 2013 2014 2015 2016 2017 2018
2018 Return on Capital Employed1 Highest Since Shift to OilLong‐Term Track Record of Value Creation
7
‐22%
13%
(1) Calculated using reported net income (GAAP). See reconciliation schedules for reconciliations and definitions of non‐GAAP measures(2) Calculated using adjusted net income (non‐GAAP). See reconciliation schedules for reconciliations and definitions of non‐GAAP measures
Gas FocusedBusiness
Environment
Avg. ROCE
Shift to Oil High Oil Price & Growth Oil Downturn
20% 4% 10% ‐4%
Reset to Premium Strategy
16%
15%212% Average
1999 ‐2018
‐5%

4Q 2018
Strategy for Sustainable Double‐Digit ROCEPremium Drilling + Disciplined Growth
(1) See reconciliation schedules for reconciliations and definitions of non‐GAAP measures.(2) Well Costs / EUR. Well Costs = Drilling, Completion, Well‐Site Facilities and Flowback. EUR = Estimated Ultimate Recovery.(3) ROCE calculated using adjusted net income (GAAP). See reconciliation schedules for reconciliations and definitions of non‐GAAP measures.
8
Oil Price Required to Earn Double‐Digit ROCE3
Continue Lowering Oil Price Needed to Earn 10% ROCE
$83
$75
$81
$65
$55
2014 2015 2016 2017 2018
Premium Drilling‐ Minimum 30% Direct ATROR1 with Flat $40 Oil and
$2.50 Natural Gas‐ Ensures Strong Returns Through Cycles‐ Minimum Direct ATROR of Premium Wells
Increases with Oil Price‐ Sustains Direct Finding Cost2 < $10 Through Cycles
Disciplined Growth‐ Growth is a Result of High‐Return Investment in
Organic Premium Drilling‐ Priority on Sustainable Improvement of Cost
Structure and Well Productivity‐ Pace of Development Not to Exceed Learning Curve
Premium Drilling
4Q 2018
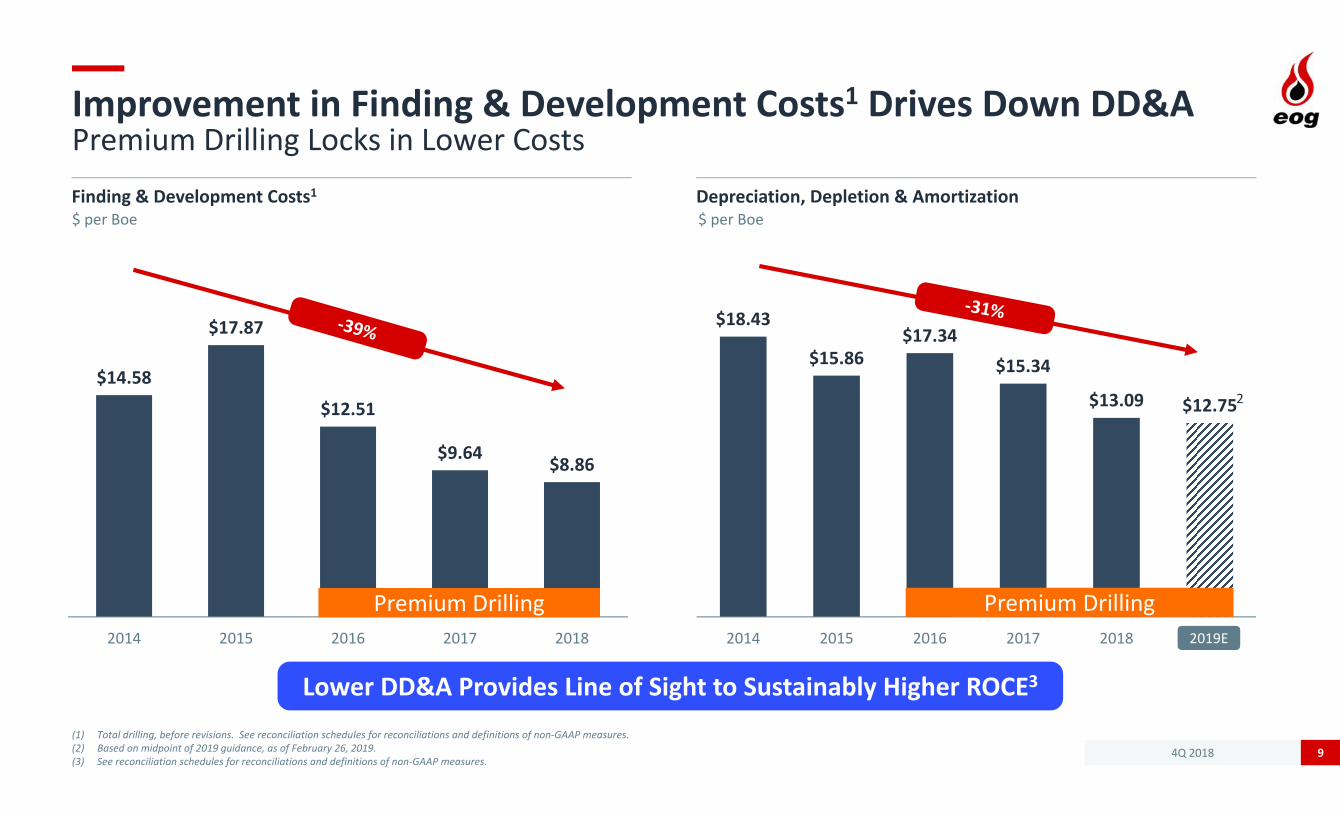
$8.86$9.64
$12.51
$17.87
$14.58
20182017201620152014
Improvement in Finding & Development Costs1 Drives Down DD&APremium Drilling Locks in Lower Costs
(1) Total drilling, before revisions. See reconciliation schedules for reconciliations and definitions of non‐GAAP measures.(2) Based on midpoint of 2019 guidance, as of February 26, 2019.(3) See reconciliation schedules for reconciliations and definitions of non‐GAAP measures.
9
Finding & Development Costs1 Depreciation, Depletion & Amortization $ per Boe
$12.75$13.09
$15.34$17.34
$15.86
$18.43
2019E20182017201620152014
$ per Boe
Lower DD&A Provides Line of Sight to Sustainably Higher ROCE3
2
Premium Drilling2019E
Premium Drilling
4Q 2018
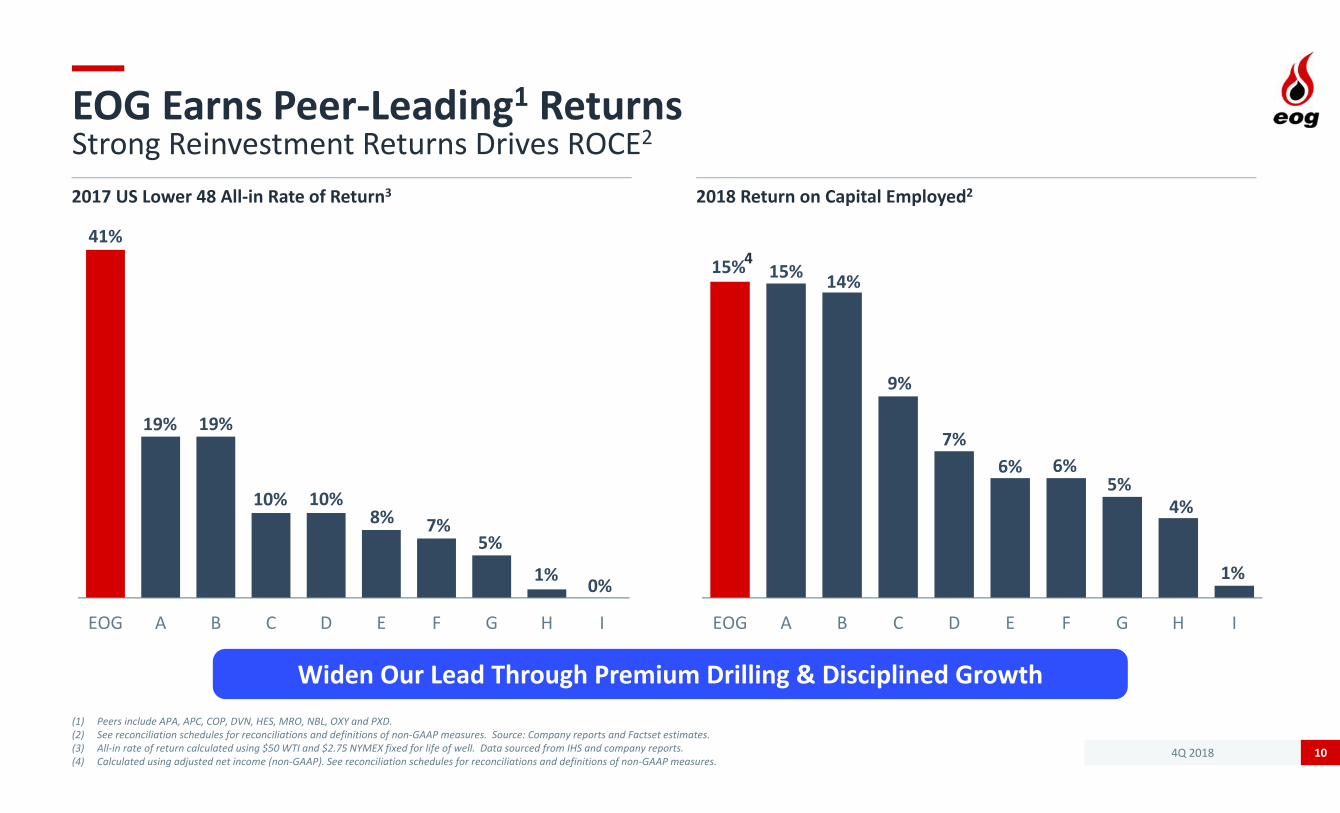
EOG Earns Peer‐Leading1 ReturnsStrong Reinvestment Returns Drives ROCE2
(1) Peers include APA, APC, COP, DVN, HES, MRO, NBL, OXY and PXD.(2) See reconciliation schedules for reconciliations and definitions of non‐GAAP measures. Source: Company reports and Factset estimates.(3) All‐in rate of return calculated using $50 WTI and $2.75 NYMEX fixed for life of well. Data sourced from IHS and company reports.(4) Calculated using adjusted net income (non‐GAAP). See reconciliation schedules for reconciliations and definitions of non‐GAAP measures.
10
2017 US Lower 48 All‐in Rate of Return3 2018 Return on Capital Employed2
41%
19% 19%
10% 10%8% 7%
5%
1% 0%
EOG A B C D E F G H I
15% 15% 14%
9%
7%6% 6%
5%4%
1%
EOG A B C D E F G H I
Widen Our Lead Through Premium Drilling & Disciplined Growth
4
4Q 2018
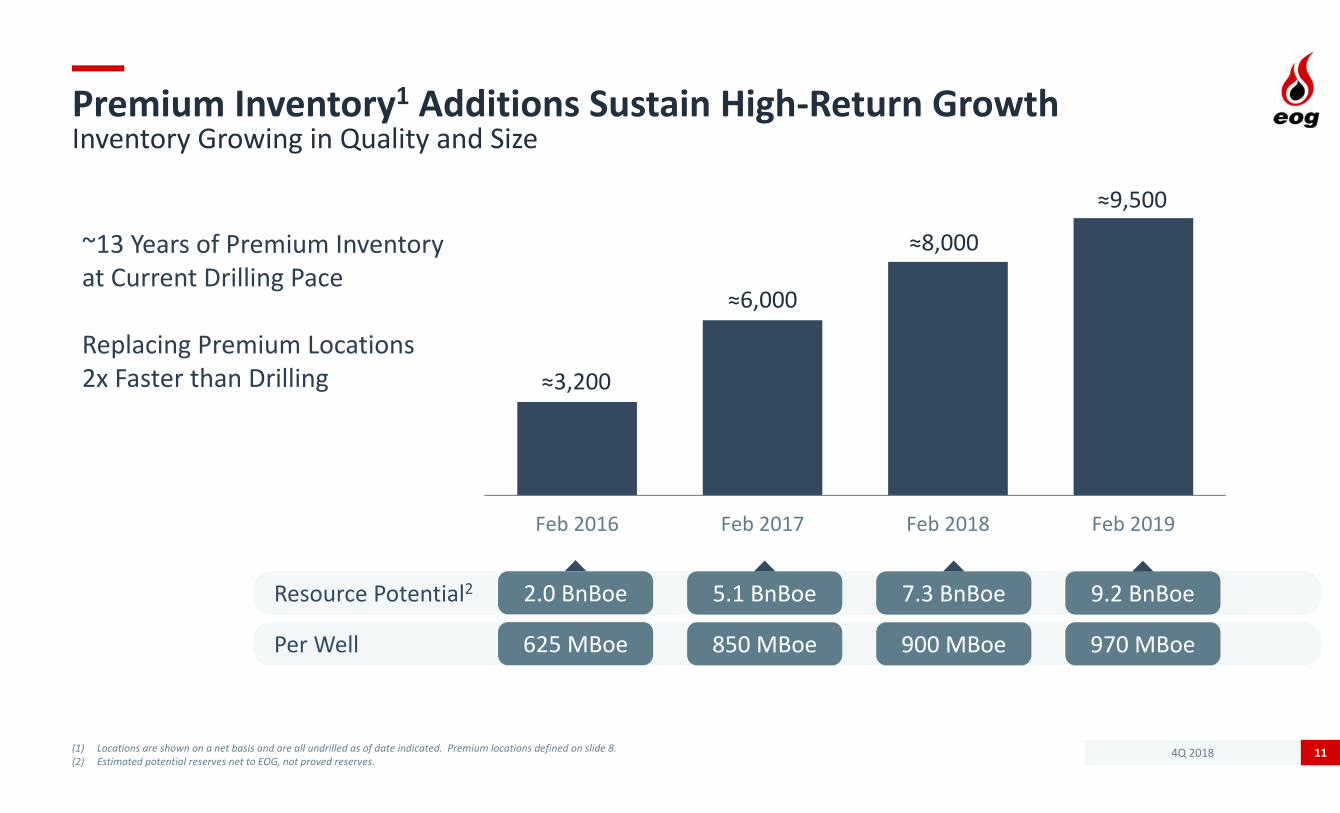
Premium Inventory1 Additions Sustain High‐Return GrowthInventory Growing in Quality and Size
(1) Locations are shown on a net basis and are all undrilled as of date indicated. Premium locations defined on slide 8.(2) Estimated potential reserves net to EOG, not proved reserves.
11
Feb 2016 Feb 2017 Feb 2018 Feb 2019
≈3,200
≈6,000
≈8,000
Resource Potential2 2.0 BnBoe
Per Well 625 MBoe
5.1 BnBoe
850 MBoe
7.3 BnBoe
900 MBoe
≈9,500
9.2 BnBoe
970 MBoe
~13 Years of Premium Inventory at Current Drilling Pace
Replacing Premium Locations 2x Faster than Drilling
4Q 2018
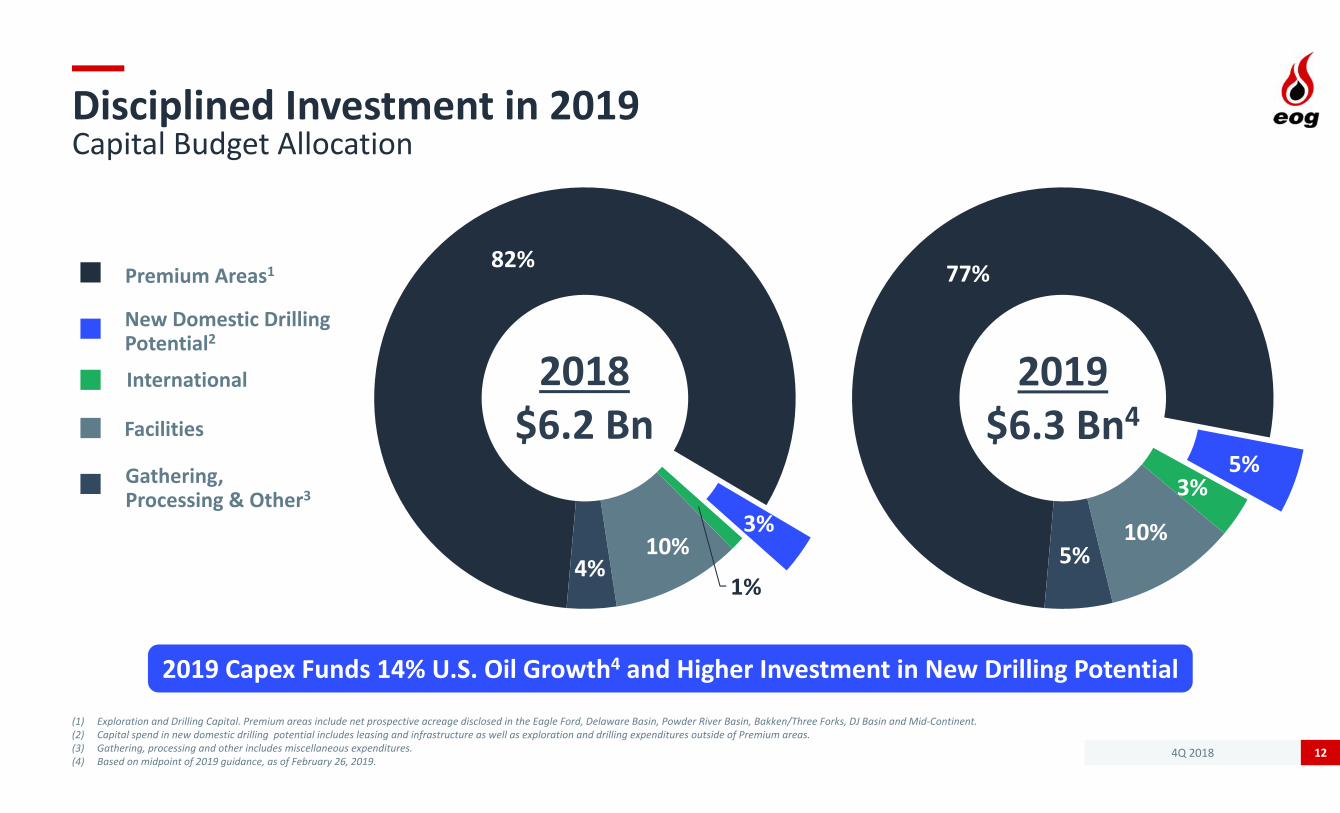
Disciplined Investment in 2019Capital Budget Allocation
12
82%
3%
1%
10%4%
Premium Areas1
New Domestic Drilling Potential2
Gathering, Processing & Other3
Facilities
77%
5%3%
10%5%
2018$6.2 Bn
2019$6.3 Bn4
International
2019 Capex Funds 14% U.S. Oil Growth4 and Higher Investment in New Drilling Potential
(1) Exploration and Drilling Capital. Premium areas include net prospective acreage disclosed in the Eagle Ford, Delaware Basin, Powder River Basin, Bakken/Three Forks, DJ Basin and Mid‐Continent.(2) Capital spend in new domestic drilling potential includes leasing and infrastructure as well as exploration and drilling expenditures outside of Premium areas.(3) Gathering, processing and other includes miscellaneous expenditures.(4) Based on midpoint of 2019 guidance, as of February 26, 2019.

4Q 2018
Improved Capital Efficiency Drives 2019 PlanDisciplined Growth + Opportunistic Investment
13
2018 2019
$190
Improvement in Capital Efficiency1 in Premium Areas2Assumes 31% Base Decline3
Opportunistic Investment for High Return, New Drilling Potential4$MM
2018 2019
$320
(1) Capital efficiency = amount of capital necessary to replace base decline and add new production. Base decline calculated on a full‐year average basis. (2) Investment includes leasing and infrastructure as well as exploration and drilling expenditures in Premium areas includes net prospective acreage disclosed in the Eagle Ford, Delaware Basin,
Powder River Basin, Bakken/Three Forks, DJ Basin and Woodford Oil Window. (3) Reflects 31% base decline rate for full year 2018 oil production. Base decline rate for full year 2018 total production is 25%.(4) Capital spend in new domestic drilling potential includes leasing and infrastructure as well as exploration and drilling expenditures outside of Premium areas.
$5,900$5,800
$39
$33
20182019
Investment in Premium Areas ($MM) $M per Bopd Added

4Q 2018
Substantial 2019 Free Cash Flow1 with Higher Oil Prices
14
(1) Discretionary Cash Flow less CAPEX and dividend. See reconciliation schedules for reconciliations and definitions of non‐GAAP measures. (2) Based on midpoint of 2019 guidance, as of February 26, 2019. (3) Annualized dividend as of February 26, 2019.
$50 $55 $60 $65
WTI Oil Price
Free Cash Flow1 Dividend3 CAPEX2CAPEX2 + Dividend3
≈$6.8 Bn

4Q 2018
Premium Capital Allocation Creates Value Through Price CyclesCash Flow Priorities
(1) Indicated annual rate, as of February 26, 2019.(2) Current and long‐term debt.
15
Disciplined, High‐Return Organic Growth‐ Diverse & Deep Premium Drilling Inventory‐ Exploration & Low‐Cost Leasing for New High‐Return Plays‐ Generate Substantial Free Cash Flow with Higher Oil Prices
Strengthen Balance Sheet‐ Target $3 Billion Total Debt2 Reduction from 2018‐2021‐ Lower Net Debt Provides Flexibility through Commodity Price Cycles
Focus on Stronger, Sustainable Dividend Growth‐ Target Dividend Growth Above Historical 19% CAGR‐ 2018 Dividend Growth of 31%1
Additional Cash Flow Investment Opportunities‐ Opportunistic Low‐Cost Property Additions
• Must Compete for Capital on Premium Drilling Return Criteria• No Expensive Corporate M&A
‐ Consider Value Accretive Share Repurchases

4Q 2018
EOG Culture Drives Sustainable Competitive Advantage
16
High‐Return Organic Growth
Rate‐of‐Return Driven
Decentralized / Non‐Bureaucratic
Multi‐Disciplinary Teamwork
Innovative / Entrepreneurial
Every Employee is a Business Person First
‐ Internal Prospect Generation‐ Early Mover Advantage‐ Best Rock / Best Plays‐ Low‐Cost Acreage‐ Most Prolific U.S. Horizontal
Wells
Exploration
‐ Low Cost Operator‐ Industry Leading Drilling & Completion
Technology‐ Self‐Sourcing Materials / Services‐ Proven Track Record of Execution
Operations
‐ Real‐Time Data Capture‐ Large Proprietary Integrated
Data Warehouses‐ Predictive Analytics‐ 100+ In‐House Desktop / Mobile Apps‐ Fast / Continuous Tech Advancement
Information Technology Sustainability
‐ Commitment to Safety, Environment and our Communities
‐ Commitment to Ethical Conduct‐ Inclusive and Diverse Workforce‐ Compensation Tied to Performance
Safety, Environment, & Community

4Q 2018 17

4Q 2018
Strong Second Half 2018 MomentumWolfcamp Well Productivity and Operating Efficiencies
18
0
20
40
60
80
100
0 10 20 30 40 50 60 70 80 90
1H 2018 2H 2018
Producing Days
Cumulative Crude Oil Production (MBo)Normalized to 7,000’ Lateral
(1) Spud to target depth.
Days to Drill1
Completed Lateral Feet per Day
19.4 18.4 17.5 16.0
1Q18 2Q18 3Q18 4Q18
880 990 1,130 1,150
1Q18 2Q18 3Q18 4Q18
+13%

4Q 2018
Strong Track Record of Cost Reduction in All Price Environments
(1) Well Costs = Drilling, Completion, Well‐Site Facilities and Flowback. Normalized to 5,300’ lateral. 19
Eagle Ford Well Costs1($MM)
7.2
6.2 6.15.7
4.7 4.5 4.6 4.5 4.3
2012 2013 2014 2015 2016 2017 1H 2018 2H 2018 2019Target2019 Target
4Q 2018
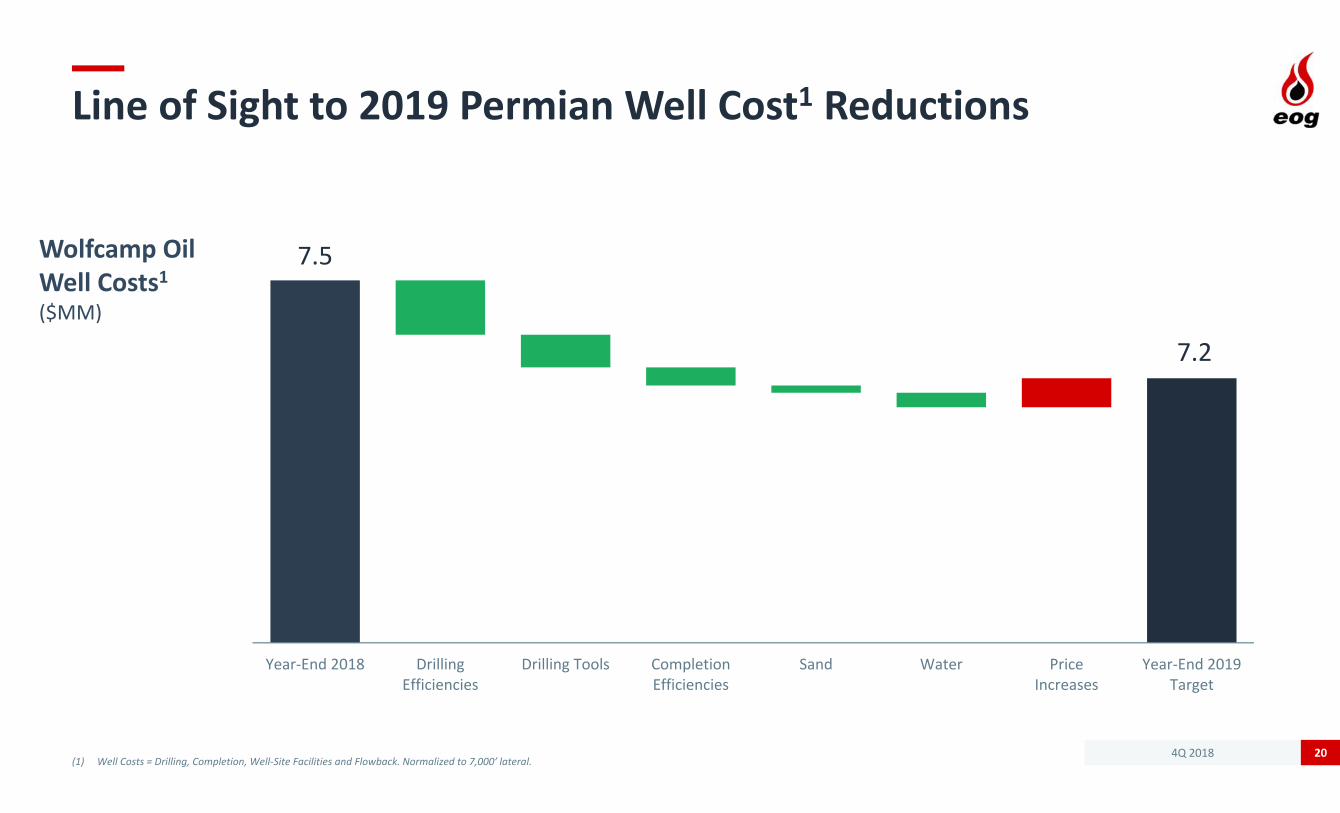
Line of Sight to 2019 Permian Well Cost1 Reductions
(1) Well Costs = Drilling, Completion, Well‐Site Facilities and Flowback. Normalized to 7,000’ lateral. 20
7.5
7.2
Year‐End 2018 DrillingEfficiencies
Drilling Tools CompletionEfficiencies
Sand Water PriceIncreases
Year‐End 2019Target
Wolfcamp OilWell Costs1($MM)

4Q 2018
Secured ≈65% of Anticipated 2019 Well Costs1at Competitive Pricing
21
Self‐Source ≈25% of Well Costs1
Drilling Services21%
Drilling Rigs9%
Tubulars10%
Completion Spreads13%
Completion Services33%
Sand9%
Facilities & Flowback
5%
65% of Spreads Secured
80% of TubularsSecured
80%+ of Rigs Secured
with Flexible Terms
Self‐SourceWater, Chemicals &Completion Design
Self‐SourceSand Sourcing &
Logistics
Self‐SourceGathering, Recycling &
Flowback Units
Self‐SourceDrilling Fluids
(1) Well Costs = Drilling, Completion, Well‐Site Facilities and Flowback.

4Q 2018
2014 2015 2016 2017 2018 2019E
$12.861
$11.391
$9.951 $9.911 $9.36
EOG Continues Reducing Cash Operating Costs($ Per Boe)
(1) Excludes one‐time expenses. See reconciliation schedules for reconciliations and definitions of non‐GAAP measures.(2) Based on mid point of guidance, as of February 26, 2019. 22
Transportation
LOE
G&A
$9.342
2019E
4Q 2018
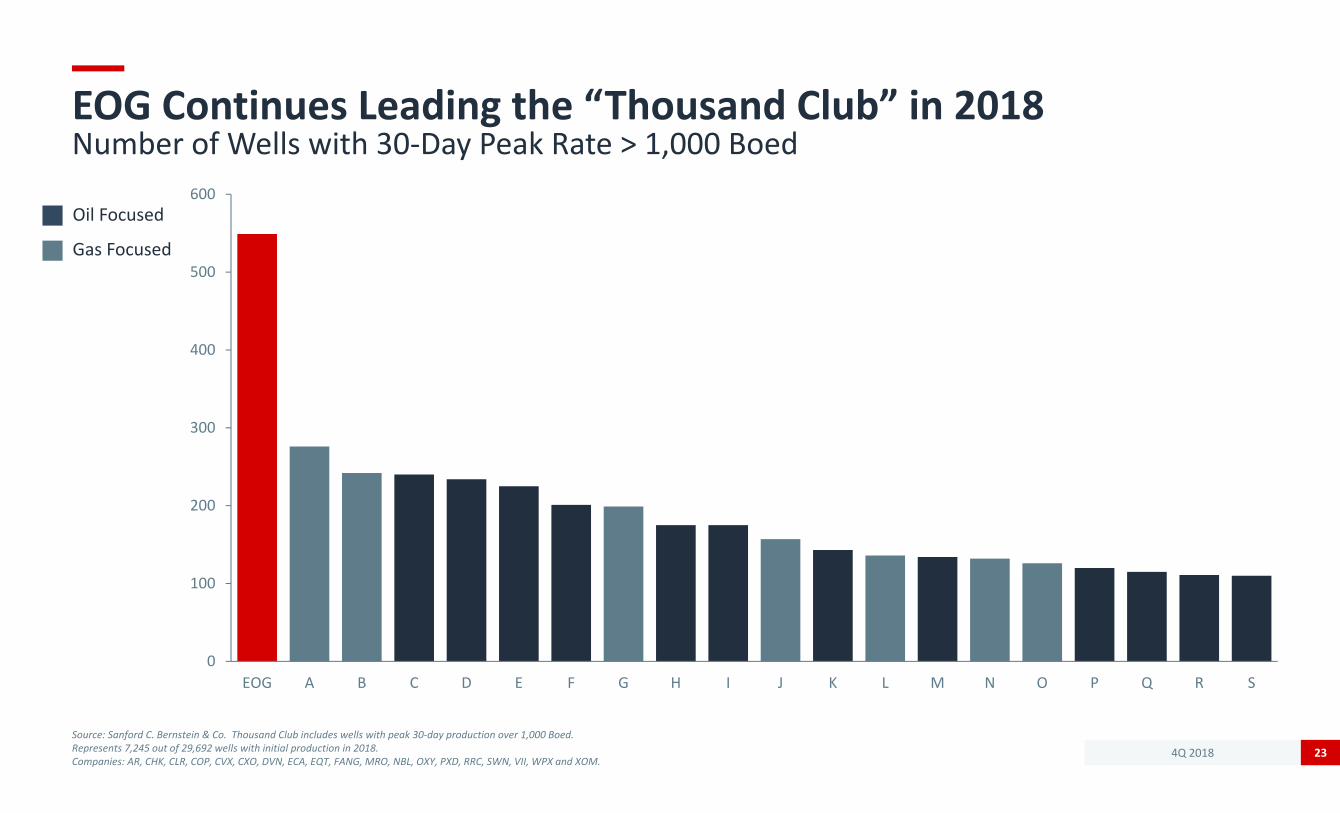
EOG Continues Leading the “Thousand Club” in 2018Number of Wells with 30‐Day Peak Rate > 1,000 Boed
Source: Sanford C. Bernstein & Co. Thousand Club includes wells with peak 30‐day production over 1,000 Boed.Represents 7,245 out of 29,692 wells with initial production in 2018.Companies: AR, CHK, CLR, COP, CVX, CXO, DVN, ECA, EQT, FANG, MRO, NBL, OXY, PXD, RRC, SWN, VII, WPX and XOM.
23
0
100
200
300
400
500
600
EOG A B C D E F G H I J K L M N O P Q R S
Oil Focused
Gas Focused
4Q 2018
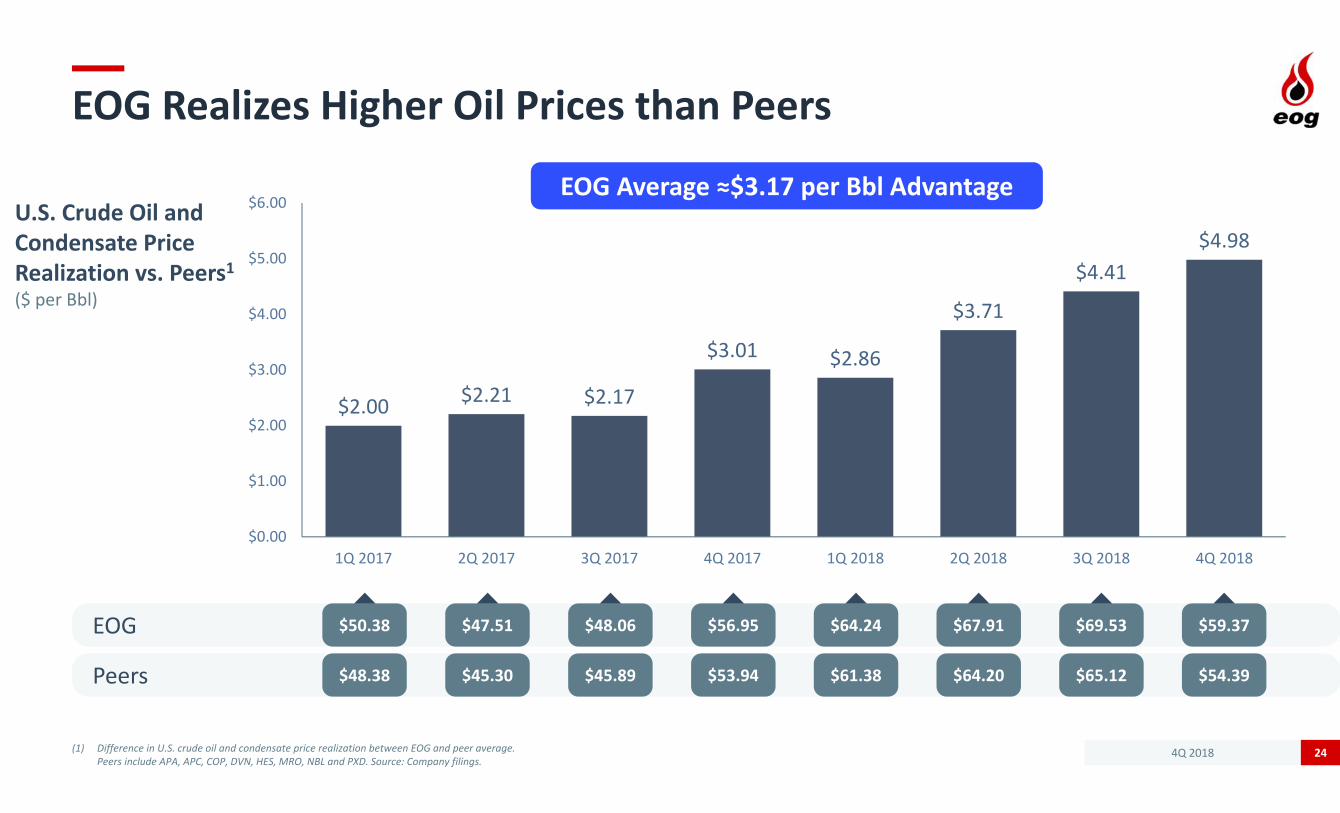
EOG Realizes Higher Oil Prices than Peers
(1) Difference in U.S. crude oil and condensate price realization between EOG and peer average. Peers include APA, APC, COP, DVN, HES, MRO, NBL and PXD. Source: Company filings.
24
U.S. Crude Oil and Condensate Price Realization vs. Peers1($ per Bbl)
EOG Average ≈$3.17 per Bbl Advantage
EOG
Peers
$50.38
$48.38
$47.51
$45.30
$48.06
$45.89
$56.95
$53.94
$64.24
$61.38
$67.91
$64.20
$69.53
$65.12
$2.00 $2.21 $2.17
$3.01 $2.86
$3.71
$4.41$4.98
$0.00
$1.00
$2.00
$3.00
$4.00
$5.00
$6.00
1Q 2017 2Q 2017 3Q 2017 4Q 2017 1Q 2018 2Q 2018 3Q 2018 4Q 2018
$59.37
$54.39
4Q 2018
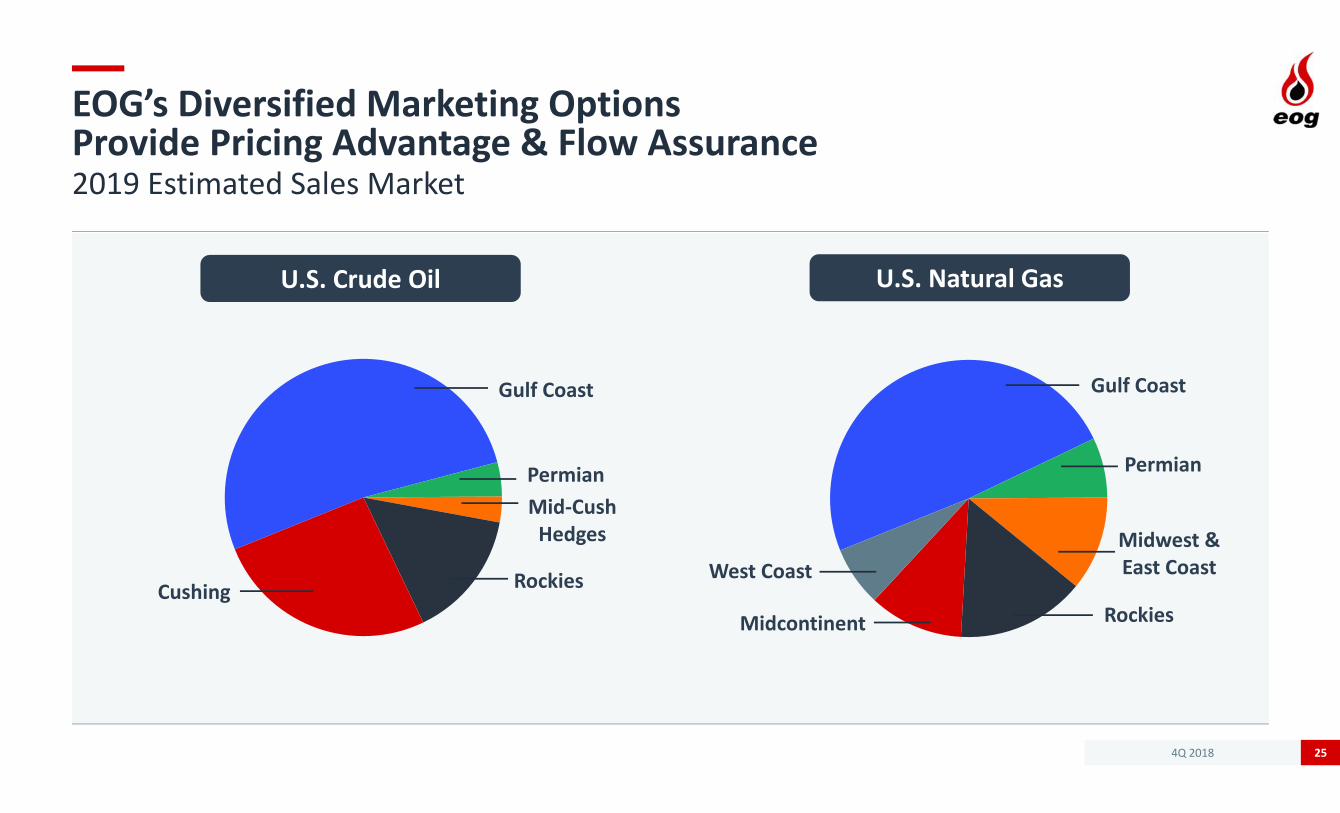
EOG’s Diversified Marketing Options Provide Pricing Advantage & Flow Assurance2019 Estimated Sales Market
25
U.S. Crude Oil U.S. Natural Gas
Gulf Coast
PermianMid‐Cush Hedges
RockiesCushing
Gulf Coast
Permian
Midwest & East Coast
RockiesMidcontinent
West Coast
4Q 2018
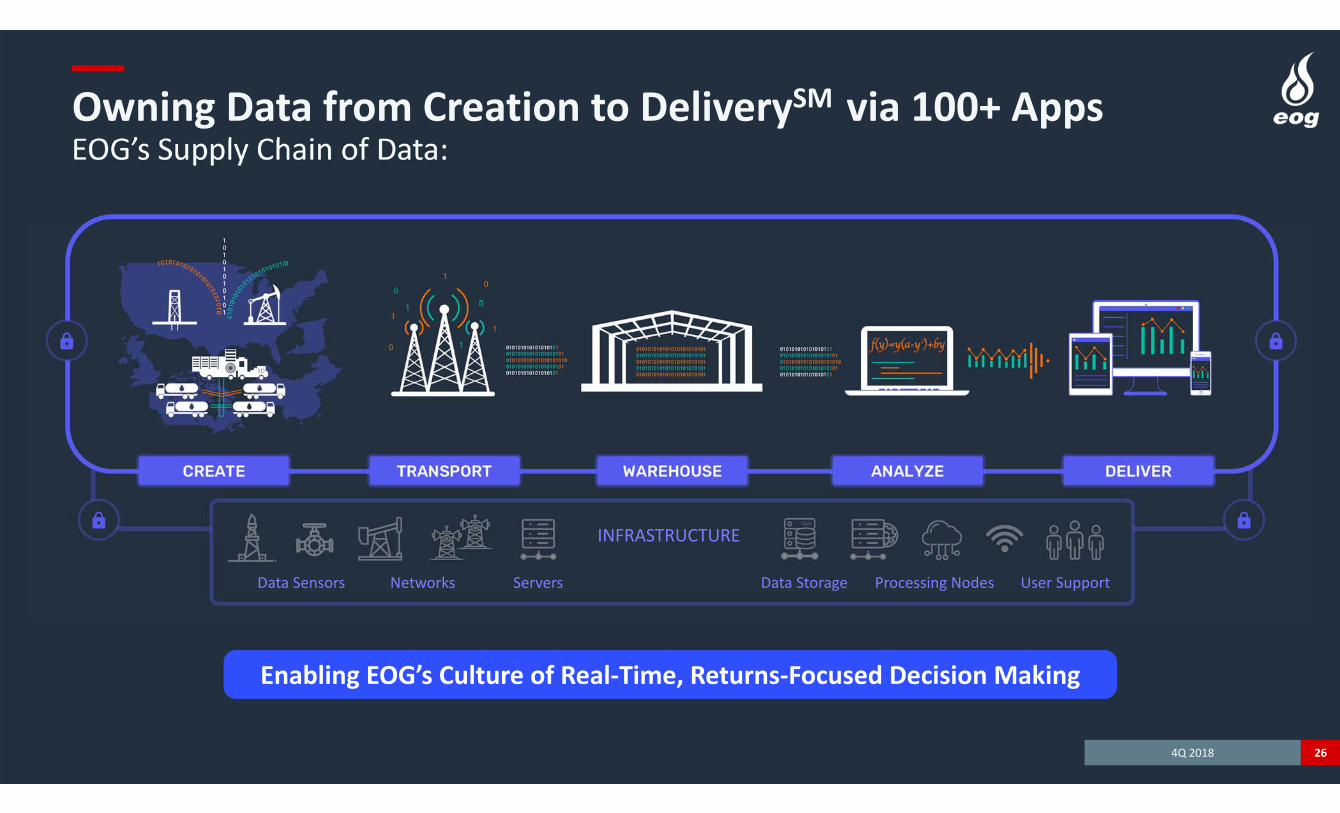
Owning Data from Creation to DeliverySM via 100+ AppsEOG’s Supply Chain of Data:
26
INFRASTRUCTURE
Data Sensors Networks Servers Data Storage Processing Nodes User Support
Enabling EOG’s Culture of Real‐Time, Returns‐Focused Decision Making
4Q 2018
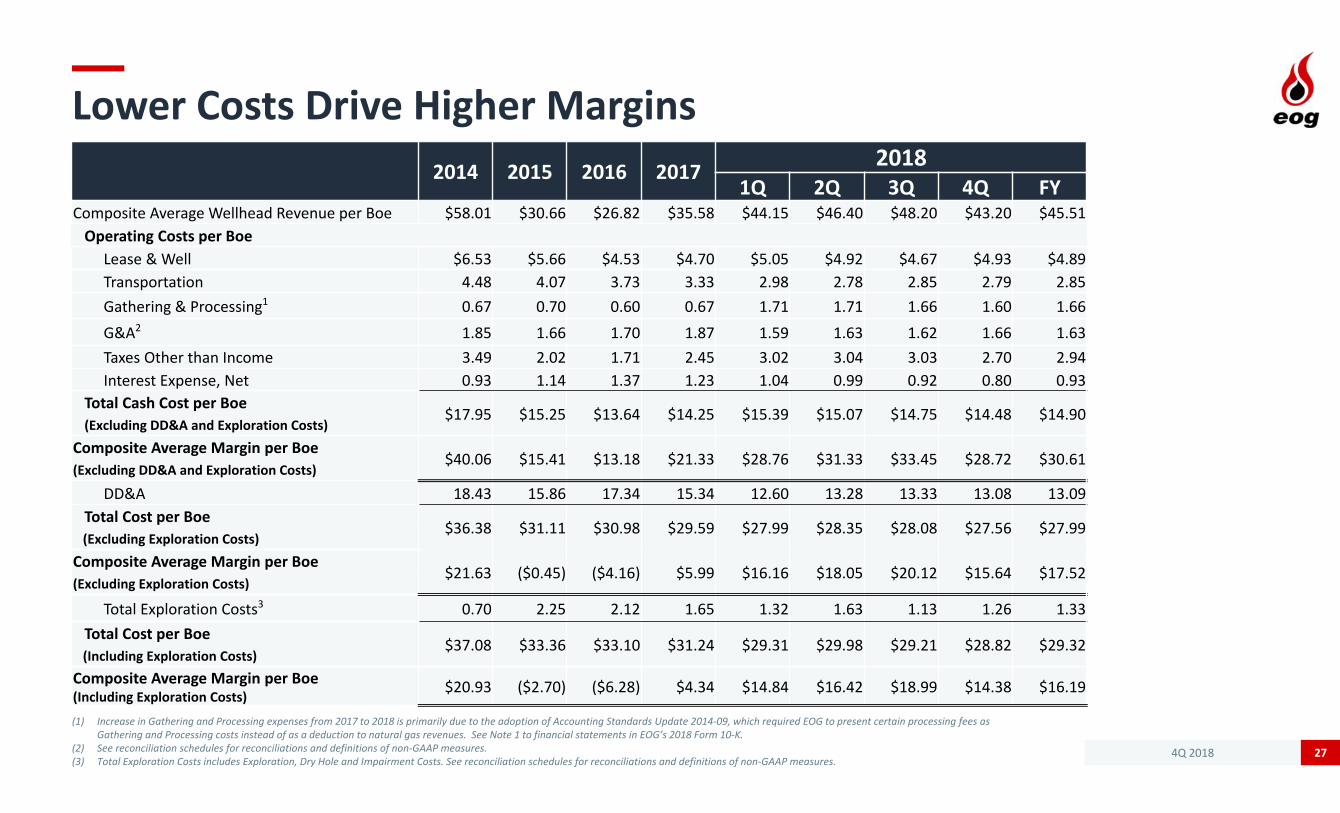
Lower Costs Drive Higher Margins
(1) Increase in Gathering and Processing expenses from 2017 to 2018 is primarily due to the adoption of Accounting Standards Update 2014‐09, which required EOG to present certain processing fees as Gathering and Processing costs instead of as a deduction to natural gas revenues. See Note 1 to financial statements in EOG’s 2018 Form 10‐K.
(2) See reconciliation schedules for reconciliations and definitions of non‐GAAP measures. (3) Total Exploration Costs includes Exploration, Dry Hole and Impairment Costs. See reconciliation schedules for reconciliations and definitions of non‐GAAP measures.
27
2014 2015 2016 2017 20181Q 2Q 3Q 4Q FY
Composite Average Wellhead Revenue per Boe $58.01 $30.66 $26.82 $35.58 $44.15 $46.40 $48.20 $43.20 $45.51Operating Costs per Boe
Lease & Well $6.53 $5.66 $4.53 $4.70 $5.05 $4.92 $4.67 $4.93 $4.89Transportation 4.48 4.07 3.73 3.33 2.98 2.78 2.85 2.79 2.85Gathering & Processing1 0.67 0.70 0.60 0.67 1.71 1.71 1.66 1.60 1.66
G&A2 1.85 1.66 1.70 1.87 1.59 1.63 1.62 1.66 1.63Taxes Other than Income 3.49 2.02 1.71 2.45 3.02 3.04 3.03 2.70 2.94Interest Expense, Net 0.93 1.14 1.37 1.23 1.04 0.99 0.92 0.80 0.93
Total Cash Cost per Boe$17.95 $15.25 $13.64 $14.25 $15.39 $15.07 $14.75 $14.48 $14.90
(Excluding DD&A and Exploration Costs)
Composite Average Margin per Boe$40.06 $15.41 $13.18 $21.33 $28.76 $31.33 $33.45 $28.72 $30.61
(Excluding DD&A and Exploration Costs)
DD&A 18.43 15.86 17.34 15.34 12.60 13.28 13.33 13.08 13.09Total Cost per Boe
$36.38 $31.11 $30.98 $29.59 $27.99 $28.35 $28.08 $27.56 $27.99(Excluding Exploration Costs)
Composite Average Margin per Boe$21.63 ($0.45) ($4.16) $5.99 $16.16 $18.05 $20.12 $15.64 $17.52
(Excluding Exploration Costs)
Total Exploration Costs3 0.70 2.25 2.12 1.65 1.32 1.63 1.13 1.26 1.33Total Cost per Boe
$37.08 $33.36 $33.10 $31.24 $29.31 $29.98 $29.21 $28.82 $29.32(Including Exploration Costs)
Composite Average Margin per Boe(Including Exploration Costs)
$20.93 ($2.70) ($6.28) $4.34 $14.84 $16.42 $18.99 $14.38 $16.19

4Q 2018
$0.00
$0.10
$0.20
$0.30
$0.40
$0.50
$0.60
$0.70
$0.80
$0.90
1999
2000
2001
2002
2003
2004
2005
2006
2007
2008
2009
2010
2011
2012
2013
2014
2015
2016
2017
2018
2
Strong Balance Sheet & Sustainable Dividend Through Commodity Price Cycles
(1) Current and long‐term debt. (2) Indicated annual rate, as of February 26, 2019.Note: Dividends adjusted for 2‐for‐1 stock splits effective March 1, 2005 and March 31, 2014.
28
$0.35
$0.90
$1.00
$0.75
YE 2017 2018 2019 2020 2021 YE 2021
$ Bn
$6.4
$3.4
Retire Maturing Bonds From 2018 ‐ 2021$ per Share31% Dividend Increase in 20182
Target $3 Billion Reduction in Total Debt1 Target Stronger Dividend Growth
Total Debt1
Bond MaturitiesRetired Bonds

4Q 2018
Premium Drilling in All Major U.S. Oil Basins
29
Wyoming DJ Basin≈35 Net Completions in 2019
Rocky Mountain Area62 MBopd in 2018
Powder River Basin≈40 Net Completions in 2019
Bakken≈20 Net Completions in 2019
Permian Basin132 MBopd in 2018
Delaware Basin≈270 Net Completions in 2019
Mid-Continent6 MBopd in 2018
Woodford Oil Window≈30 Net Completions in 2019
Eagle Ford171 MBopd in 2018
≈300 Net Completions in 2019
EOG Division Offices

4Q 2018
Deep Inventory of Crude Oil Assets
(1) Locations are shown on a net basis and are all undrilled. Premium locations defined on slide 8.30
Play Net UndrilledPremium Locations1
2019 Average Drilling Rigs
2019 Average Completion Spreads
2019 Net Planned Completions
Eagle Ford 2,300 10 7.5 300Delaware Basin 4,815 20 6 270Wolfcamp 1,700 220First Bone Spring 540 15Second Bone Spring 1,300 25Leonard 1,275 10Powder River Basin 1,630 2 1 40Mowry 875Niobrara 555Turner 200Bakken/Three Forks 330 1 0.5 20Wyoming DJ Basin 150 2 1 35Woodford Oil Window 260 3 1 30Other Plays ‐ 2 1 45
Total ≈ 9,500 40 18 740
4Q 2018
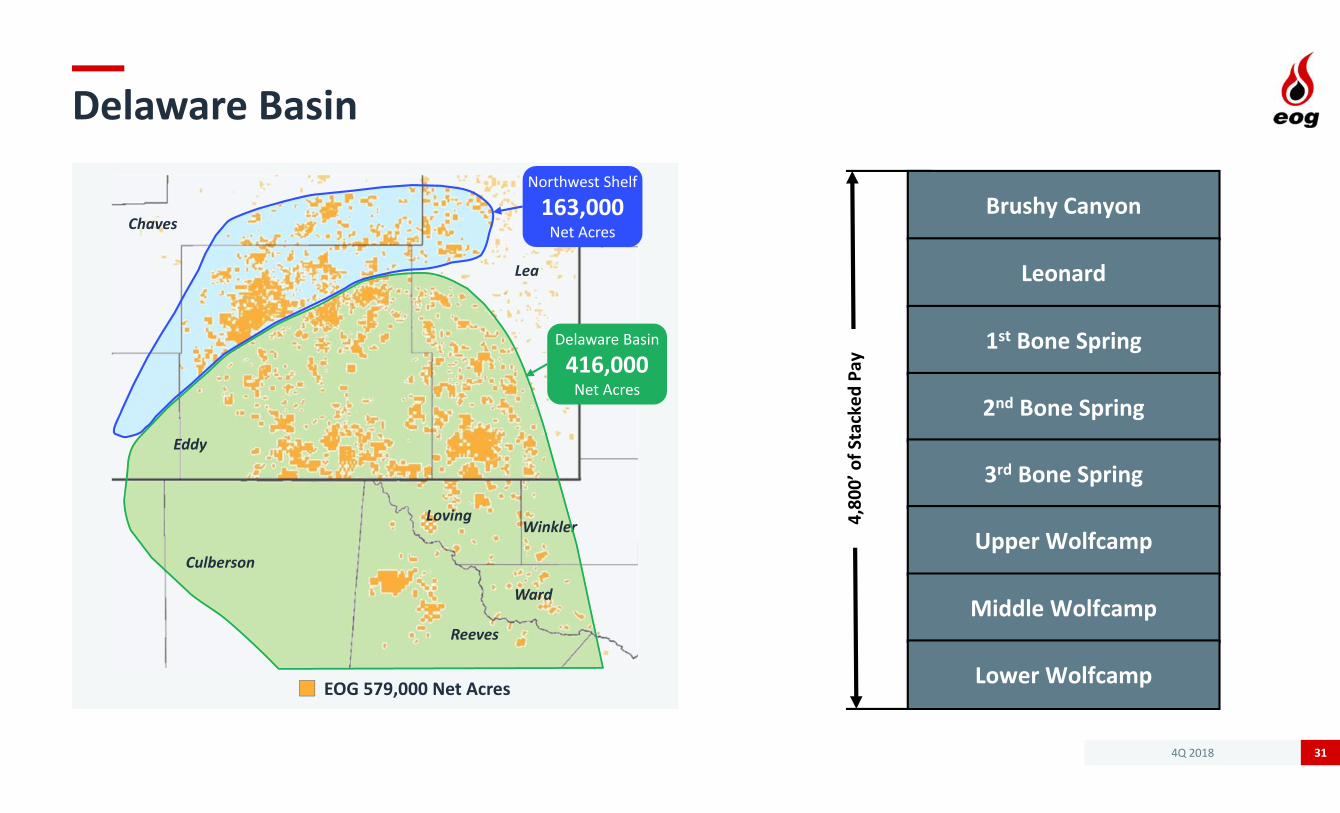
Delaware Basin
31
Eddy
Lea
LovingWinkler
Culberson
Ward
Reeves
Chaves
Northwest Shelf
163,000Net Acres
Delaware Basin
416,000Net Acres
EOG 579,000 Net Acres
4,80
0’ of S
tacked
Pay
Brushy Canyon
Leonard
1st Bone Spring
2nd Bone Spring
3rd Bone Spring
Upper Wolfcamp
Middle Wolfcamp
Lower Wolfcamp

4Q 2018
South Texas Eagle Ford Oil
32
579,000 Net Acres516,000 Net Acres in Oil Window
WEBB
FRIO
BEE
UVALDE
WEBB
BEXARKINNEY
ZAVALA
MEDINA
LA SALLE
LAVACA
MAVERICK
LIVE OAK
ATASCOSA
DE WITT
FAYETTE
MCMULLEN
WILSON
GONZALES
KARNES
GUADALUPE
Crude OilWindow
Dry GasWindow
Wet GasWindow
0 25 Miles
San Antonio
Laredo
Bellwether Asset for EOG‐ EOG Largest Oil Producer & Acreage Holder‐ Organically Leased Position for ≈$450 per Acre‐ Capable of Growth for 10+ Years
Corpus Christi
DIMMIT
Enhanced Oil Recovery Program‐ Converted 54 Wells in 2018‐ Strong Results from ~150 EOR Wells Converted Since Start of Program
‐ Continue to Refine Technique for Future Growth
Concurrent Austin Chalk Development‐ Focused on Matrix Flow‐ Complex Play with “Sweet Spots”

4Q 2018
Powder River Basin
33
Dakota
Muddy
Turner
Shannon
Parkman
Mowry
Niobrara
4,80
0’ of S
tacked
Pay
Reservoir RockSource Rock
Powder River Basin Core Area
4Q 2018
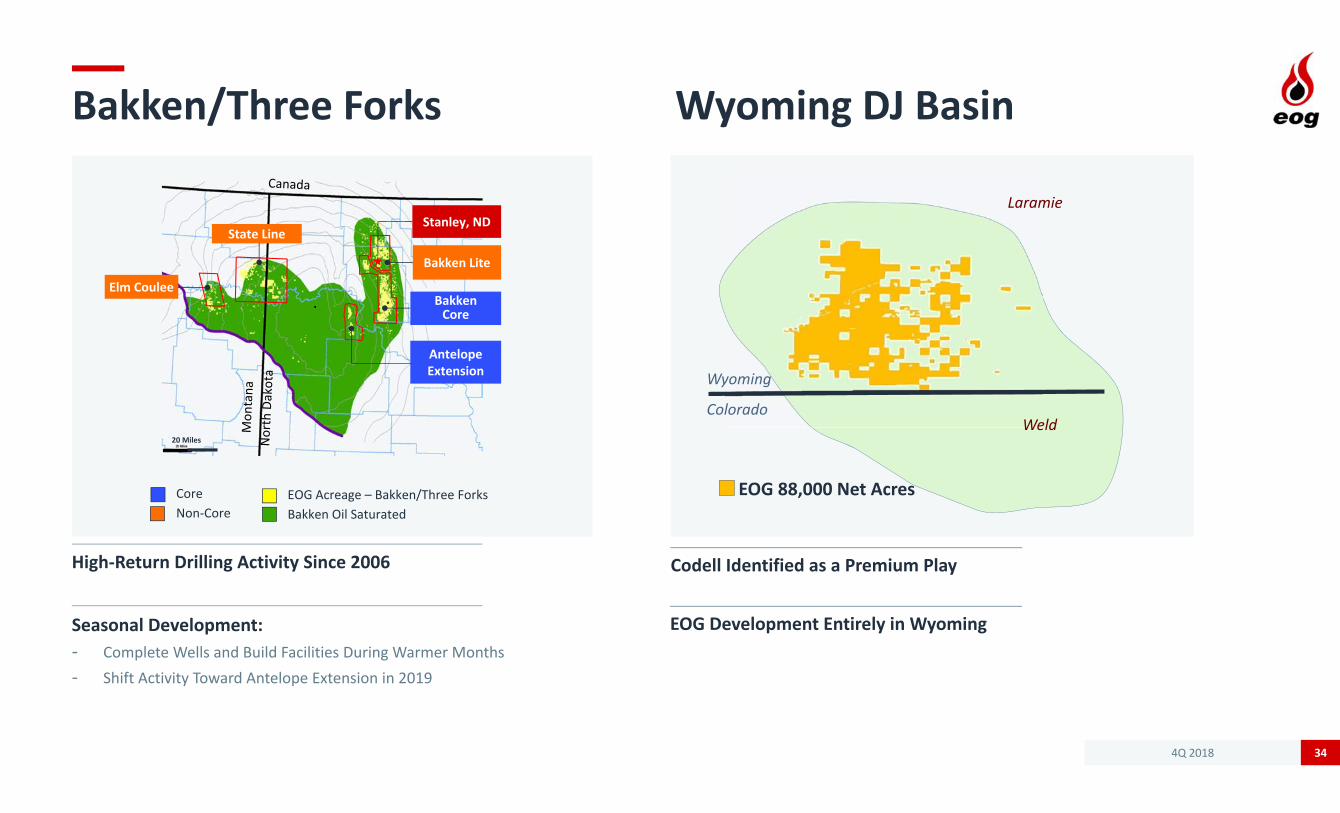
Bakken/Three Forks Wyoming DJ Basin
34
EOG 88,000 Net Acres
Laramie
WeldColorado
Wyoming
Bakken Core
AntelopeExtension
Bakken Lite
State Line
Elm Coulee
20 Miles
Stanley, ND
EOG Acreage – Bakken/Three ForksBakken Oil Saturated
CoreNon‐Core
Seasonal Development:‐ Complete Wells and Build Facilities During Warmer Months‐ Shift Activity Toward Antelope Extension in 2019
High‐Return Drilling Activity Since 2006 Codell Identified as a Premium Play
EOG Development Entirely in Wyoming

4Q 2018
Eastern Anadarko Basin Woodford Oil Window
(1) Well Costs = Drilling, Completion, Well‐Site Facilities and Flowback. Normalized to 9,500’ lateral.35
High‐Return, Low‐DeclinePremium Play in Crude Oil Window
MCCLAIN
Oklahoma City
CANADIAN
CADDO GRADY
OKLAHOMA
CLEVELAND
EOG Acreage Outline
Oil
Condensate
Gas
Lowered Well Cost1 Target to $7.6 MM
Anticipate Sourcing >50% of Water Needs with Recycled Water in 2019
2018 Spacing Tests Confirm Premium Economics

4Q 2018
Trinidad
36
Return to Drilling‐ 5 Well Drilling Program in 2019
Entered Into New Gas Supply Contract‐ Enables Additional Drilling‐ Sold into Trinidad Domestic Gas Market
TRINIDAD
TOBAGO
Atlantic Ocean
Columbus Channel
Gulf of
Paria
Caribbean Sea
VENEZUELA
VENEZUELA
SECC
U(a)
U(b)
Banyan
TSP Deep
SMR
EMZ4(a)
10 km
Pelican
Oil Fields
Gas Fields
EOG Blocks
Free Cash Flow Positive in 2019
4Q 2018
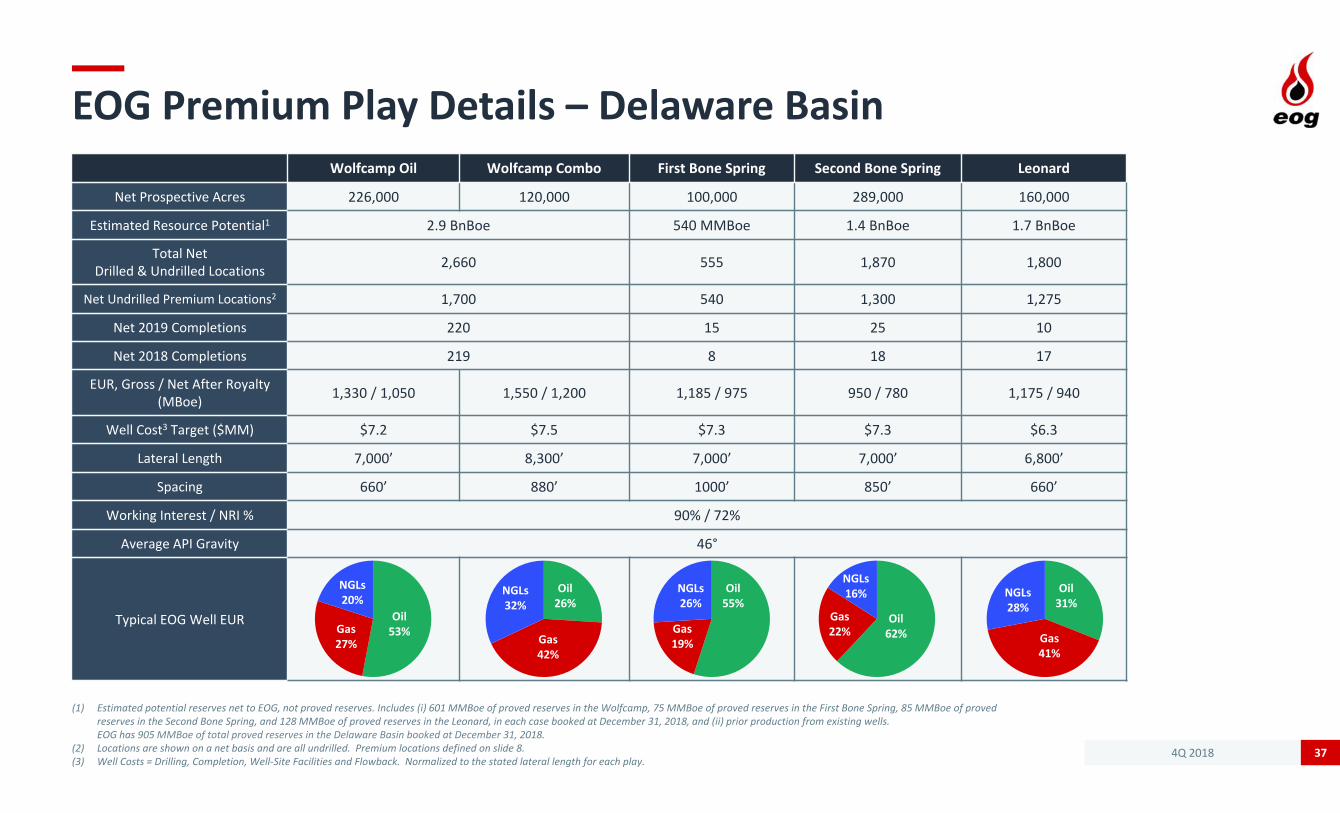
EOG Premium Play Details – Delaware Basin
(1) Estimated potential reserves net to EOG, not proved reserves. Includes (i) 601 MMBoe of proved reserves in the Wolfcamp, 75 MMBoe of proved reserves in the First Bone Spring, 85 MMBoe of proved reserves in the Second Bone Spring, and 128 MMBoe of proved reserves in the Leonard, in each case booked at December 31, 2018, and (ii) prior production from existing wells. EOG has 905 MMBoe of total proved reserves in the Delaware Basin booked at December 31, 2018.
(2) Locations are shown on a net basis and are all undrilled. Premium locations defined on slide 8.(3) Well Costs = Drilling, Completion, Well‐Site Facilities and Flowback. Normalized to the stated lateral length for each play.
37
Wolfcamp Oil Wolfcamp Combo First Bone Spring Second Bone Spring Leonard
Net Prospective Acres 226,000 120,000 100,000 289,000 160,000
Estimated Resource Potential1 2.9 BnBoe 540 MMBoe 1.4 BnBoe 1.7 BnBoe
Total Net Drilled & Undrilled Locations 2,660 555 1,870 1,800
Net Undrilled Premium Locations2 1,700 540 1,300 1,275
Net 2019 Completions 220 15 25 10
Net 2018 Completions 219 8 18 17
EUR, Gross / Net After Royalty(MBoe) 1,330 / 1,050 1,550 / 1,200 1,185 / 975 950 / 780 1,175 / 940
Well Cost3 Target ($MM) $7.2 $7.5 $7.3 $7.3 $6.3
Lateral Length 7,000’ 8,300’ 7,000’ 7,000’ 6,800’
Spacing 660’ 880’ 1000’ 850’ 660’
Working Interest / NRI % 90% / 72%
Average API Gravity 46°
Typical EOG Well EURGas27%
NGLs20%
Oil53% Gas
41%
NGLs28%
Oil31%
Gas19%
NGLs26%
Oil55%
Gas22%
NGLs16%
Oil62%Gas
42%
NGLs32%
Oil26%

4Q 2018
EOG Premium Play Details
(1) Estimated potential reserves net to EOG, not proved reserves. Includes (i) 1,163 MMBoe of proved reserves in the Eagle Ford, 6 MMBoe of proved reserves in the Mowry, 6 MMBoe of proved reserves in the Niobrara, 78 MMBoe of proved reserves in the Turner, 228 MMBoe of proved reserves in the Bakken / Three Forks, 48 MMBoe of proved reserves in the DJ Basin and 73 MMBoe of proved reserves in the Woodford, in each case booked at December 31, 2018, and (ii) prior production from existing wells. EOG has 107 MMBoe of total proved reserves in the Powder River Basin booked at December 31, 2018.
(2) Locations are shown on a net basis and are all undrilled. Premium locations defined on slide 8.(3) Well Costs = Drilling, Completion, Well‐Site Facilities and Flowback. Normalized to the stated lateral length for each play.
38
Eagle FordPowder River Basin Bakken /
Three ForksWyomingDJ Basin
Woodford Oil WindowMowry Shale Niobrara Shale Turner Sand
Net Prospective Acres 516,000 141,000 89,000 154,000 220,000 88,000 47,000
Estimated Resource Potential1 3.2 BnBoe 1,230 MMBoe 640 MMBoe 200 MMBoe 1.0 BnBoe 210 MMBoe 210 MMBoe
Total NetDrilled & Undrilled Locations 7,200 880 560 405 2,100 460 260
Net Undrilled Premium Locations2 2,300 875 555 200 330 150 260
Net 2019 Completions 300 40 20 35 30
Net 2018 Completions 304 41 20 48 26
EUR, Gross / Net After Royalty(MBoe) 580 / 450 1,700 / 1,400 1,400 / 1,150 730 / 500 Core
745 / 610 Codell
695 / 560 1,000 / 800
Well Cost3 Target ($MM) $4.3 $6.1 $5.9 $4.5 $4.6 $4.0 $7.6
Lateral Length 5,300’ 9,500’ 9,500’ 8,000’ 8,400’ 9,400’ 9,500’
Spacing 330’ 660’ 660’ 1,700’ 650’ 1,300’ 660’
Working Interest / NRI 96% / 74% 70% / 58% 70% / 59% 63% / 51%
Average API Gravity 44° 49° 40° 36° 42°
Typical EOG Well EURGas15%
NGLs14%
Oil71% Gas
47%
NGLs25%
Oil28%
Gas36%
NGLs16%
Oil48% Gas
39%
NGLs15%
Oil46%
Gas15%
NGLs15%
Oil70%
Gas10%
NGLs20%
Oil70%
Gas7%
NGLs15%
Oil78%

4Q 2018
Initial 30‐Day Average Production Rates
39
Gross Wells
Net Wells
GrossLateral
Bopd Boed
Delaware Basin Wolfcamp
4Q 2018 42 37 1,950 3,150 7,000’
3Q 2018 61 58 1,655 2,640 7,100’
2Q 2018 62 58 1,255 1,960 6,400’
1Q 2018 58 53 1,335 1,925 5,900’
4Q 2017 51 45 1,410 2,145 6,000’
Delaware BasinBone Spring
4Q 2018 13 11 1,550 2,150 5,300’
3Q 2018 4 4 1,135 1,675 5,200’
2Q 2018 13 9 1,150 1,615 5,700’
1Q 2018 9 8 1,195 1,645 5,900’
4Q 2017 9 9 1,085 1,470 6,700’
Delaware BasinLeonard
4Q 2018 2 1 1,200 2,350 4,600’
3Q 2018 6 5 995 1,645 4,500’
2Q 2018 7 3 965 1,745 4,500’
1Q 2018 3 3 1,640 2,430 4,300’
4Q 2017 5 5 1,230 1,865 8,700’
Powder River Basin Turner
4Q 2018 4 3 800 1,400 9,700
3Q 2018 13 11 795 1,730 7,500’
2Q 2018 7 6 760 915 6,200’
1Q 2018 9 8 675 1,210 6,100’
4Q 2017 9 7 990 2,150 7,700’
Powder River Basin Mowry
4Q 2018 2 2 700 2,050 9,200’
2Q 2018 2 2 760 2,190 9,100’
Gross Wells
Net Wells
GrossLateral
Bopd Boed
South Texas Eagle Ford
4Q 2018 82 78 1,300 1,600 7,300’
3Q 2018 90 83 1,235 1,540 7,300’
2Q 2018 74 67 1,530 1,920 7,200’
1Q 2018 72 65 1,325 1,620 6,900’
4Q 2017 74 70 1,525 1,915 7,400’
South Texas Austin Chalk
4Q 2018 6 5 2,650 3,650 5,500’
3Q 2018 14 10 1,815 2,485 5,000’
2Q 2018 5 5 2,355 3,275 7,900’
1Q 2018 10 8 1,960 2,750 4,600’
4Q 2017 4 4 2,280 3,130 5,300’
DJ Basin Codell
4Q 2018 20 10 700 800 9,600’
3Q 2018 25 19 915 1,090 10,100’
2Q 2018 8 4 675 765 9,300’
1Q 2018 12 9 895 1,055 9,200’
4Q 2017 3 2 950 1,120 9,100’
Williston Basin Bakken / Three Forks
4Q 2018 7 5 550 600 10,100’
3Q 2018 19 12 1,135 1,370 9,400’
2Q 2018 2 2 2,240 2,980 9,200’
Woodford Oil Window
4Q 2018 5 4 600 750 9,200’
3Q 2018 11 9 720 915 8,500’
2Q 2018 8 7 695 845 9,800’

4Q 2018
1Q & FY 2019 Guidance
40
Estimated Ranges(Unaudited)
1Q 2019 Full Year 2019Daily Sales VolumesCrude Oil and Condensate Volumes (MBbld)
United States 426.6 ‐ 434.2 442.6 ‐ 458.2Trinidad 0.4 ‐ 0.6 0.4 ‐ 0.6 Other International 0.0 ‐ 0.2 0.0 ‐ 0.2
Total 427.0 ‐ 435.0 443.0 ‐ 459.0
Natural Gas Liquids Volumes (MBbld)Total 115.0 ‐ 125.0 120.0 ‐ 140.0
Natural Gas Volumes (MMcfd)United States 950 ‐ 1,000 1,030 ‐ 1,130 Trinidad 245 ‐ 275 250 ‐ 290 Other International 30 ‐ 40 30 ‐ 40
Total 1,225 ‐ 1,315 1,310 ‐ 1,460
Crude Oil Equivalent Volumes (MBoed) United States 699.9 ‐ 725.9 734.3 ‐ 786.5 Trinidad 41.2 ‐ 46.4 42.1 ‐ 48.9 Other International 5.0 ‐ 6.9 5.0 ‐ 6.9
Total 746.1 ‐ 779.2 781.4 ‐ 842.3
Capital Expenditures (Excluding Acquisitions, $MM) $ 1,750 ‐ $ 1,950 $ 6,100 ‐ $ 6,500
Operating CostsUnit Costs ($/Boe)
Lease and Well $ 4.90 ‐ $ 5.30 $ 4.50 ‐ $ 5.30 Transportation Costs $ 2.50 ‐ $ 3.00 $ 2.60 ‐ $ 3.10 Depreciation, Depletion and Amortization $ 12.50 ‐ $ 13.00 $ 12.25 ‐ $ 13.25
Estimated Ranges(Unaudited)
1Q 2019 Full Year 2019Expenses ($MM)Exploration and Dry Hole $ 35 ‐ $ 45 $ 155 ‐ $ 195 Impairment $ 55 ‐ $ 65 $ 190 ‐ $ 230 General and Administrative $ 110 ‐ $ 120 $ 450 ‐ $ 490 Gathering and Processing $ 100 ‐ $ 110 $ 440 ‐ $ 480 Capitalized Interest $ 6 ‐ $ 8 $ 25 ‐ $ 30Net Interest $ 54 ‐ $ 56 $ 190 ‐ $ 200
Taxes Other Than Income (% of Wellhead Revenue) 7.2% ‐ 7.6% 7.2% ‐ 7.6%
Income TaxesEffective Rate 20% ‐ 25% 20% ‐ 25%Current Tax (Benefit) / Expense ($MM) $ (55) ‐ $ (15) $ (190) ‐ $ (110)
Pricing ‐ (Refer to Benchmark Commodity Pricing in text)Crude Oil and Condensate ($/Bbl)
DifferentialsUnited States ‐ above (below) WTI $ 0.25 ‐ $ 1.25 $ (1.00) ‐ $ 1.00 Trinidad ‐ above (below) WTI $ (11.00) ‐ $ (9.00) $ (11.00) ‐ $ (9.00)Other International ‐ above (below) WTI $ 5.00 ‐ $ 9.00 $ (1.00) ‐ $ 1.00
Natural Gas LiquidsRealizations as % of WTI 37% ‐ 43% 37% ‐ 43%
Natural Gas ($/Mcf)Differentials
United States ‐ above (below) NYMEX Henry Hub $ (0.40) ‐ $ 0.00 $ (0.50) ‐ $ 0.10
RealizationsTrinidad $ 2.50 ‐ $ 2.90 $ 2.50 ‐ $ 3.20 Other International $ 4.30 ‐ $ 4.80 $ 4.00 ‐ $ 5.00

4Q 2018
Premium Drilling Adds Low‐Cost Reserves2018 Net Proved Reserves
41
All‐in Reserve Replacement Cost1$ per BOE
$13.25
$11.91
$5.22
$8.71$9.33
2014 2015 2016 2017 2018
EOG Reserves Estimates Within 5% of Third‐Party Auditor for 31 Consecutive Years
$ 8.86 $ 8.85$ 9.33
$ 13.78
(1) All‐in excluding revisions due to price. See reconciliation schedules and definitions of non‐GAAP measures.(2) See reconciliation schedules and definitions of non‐GAAP measures.
Strong Reserve Growth‐ Increased YE 2018 Net Proved Reserves 16% to 2,928 MMBoe‐ Replaced 238%1 of 2018 Production
Attractive Reserve Replacement Costs2 ($ per Boe)‐ Total Drilling, Before Revisions‐ All‐in, Net of Revisions‐ All‐in, Excluding Revisions Due to Price‐ Proved Developed, Excluding Revisions Due to Price
4Q 2018
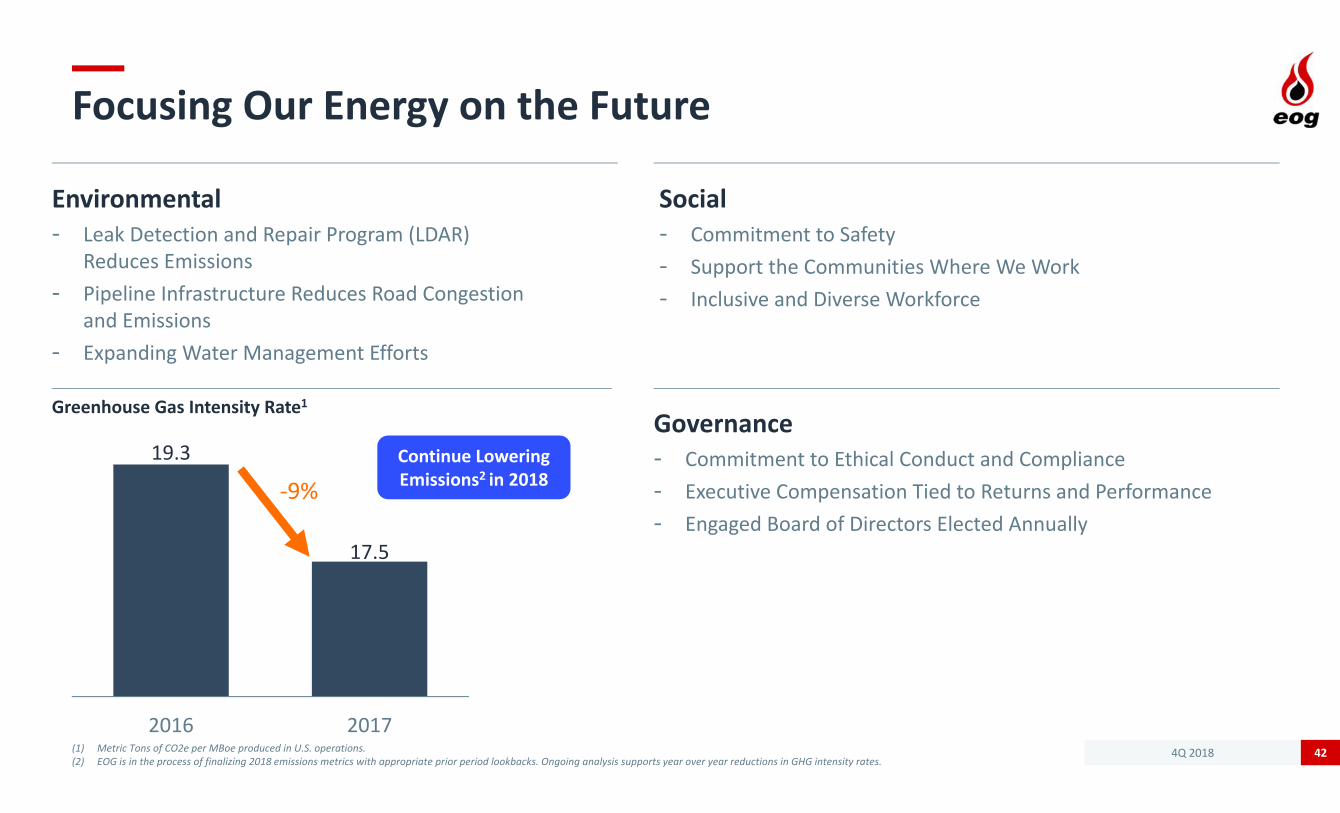
Focusing Our Energy on the Future
(1) Metric Tons of CO2e per MBoe produced in U.S. operations.(2) EOG is in the process of finalizing 2018 emissions metrics with appropriate prior period lookbacks. Ongoing analysis supports year over year reductions in GHG intensity rates.
42
Social‐ Commitment to Safety‐ Support the Communities Where We Work‐ Inclusive and Diverse Workforce
Governance‐ Commitment to Ethical Conduct and Compliance‐ Executive Compensation Tied to Returns and Performance‐ Engaged Board of Directors Elected Annually
Environmental‐ Leak Detection and Repair Program (LDAR)
Reduces Emissions‐ Pipeline Infrastructure Reduces Road Congestion
and Emissions‐ Expanding Water Management Efforts
19.3
17.5
2016 2017
Greenhouse Gas Intensity Rate1
‐9%Continue Lowering Emissions2 in 2018

4Q 2018
Committed to Minimizing Emissions
(1) Metric tons of 2017 CO2e emissions per MBoe of 2017 gross U.S. production. (2) Peers include APA, APC, COP, DVN, HES, MRO, NBL, OXY and PXD.Sources: EPA website for company emissions data and IHS for company gross production data.
43
EOG
Gassy Peers3
OilyPeers3
GreenhouseGas Intensity1(Metric Tons CO2eper MBoe)
0
30
60
0 100 200 300 400 500 600 700 800
Gross U.S. Production (MBoed)
EOG
EOG Peers2
4Q 2018
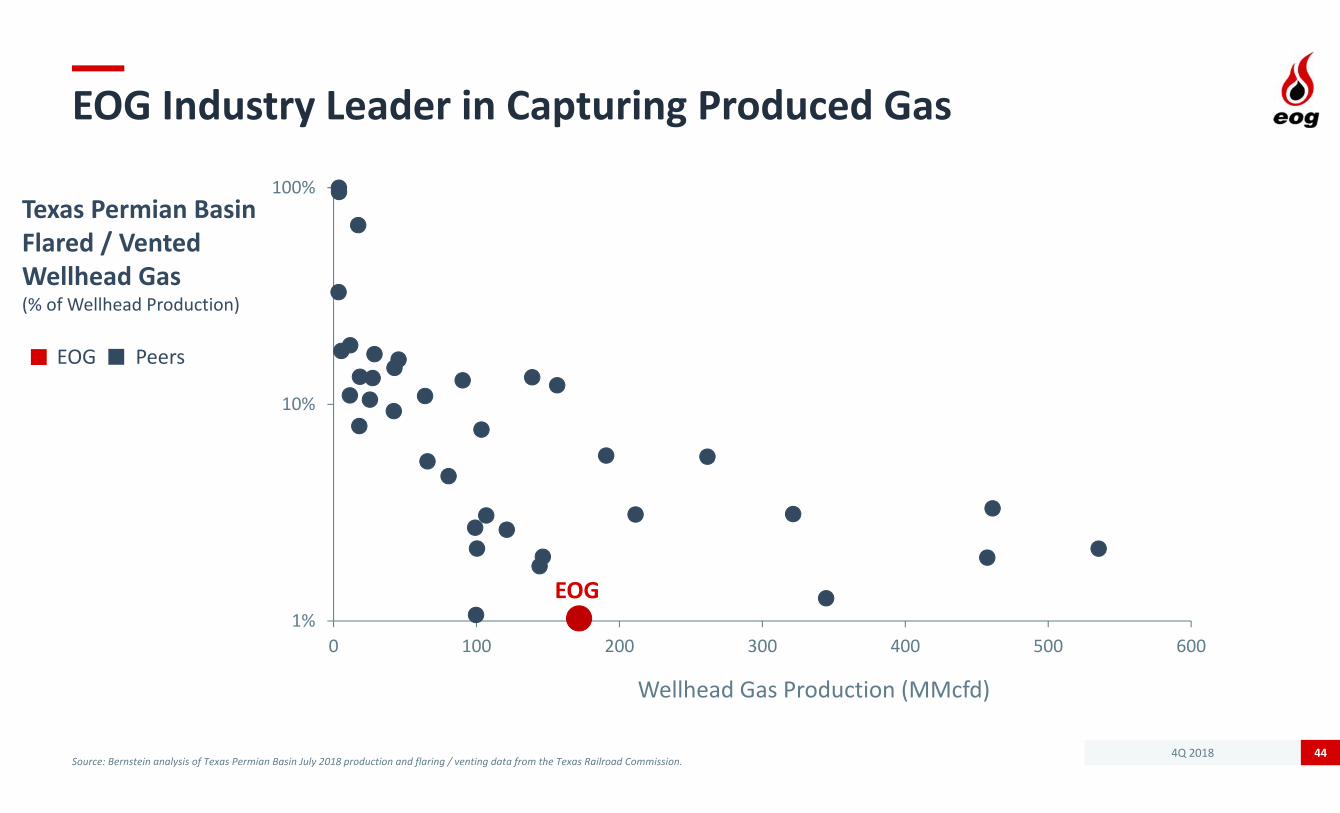
EOG Industry Leader in Capturing Produced Gas
Source: Bernstein analysis of Texas Permian Basin July 2018 production and flaring / venting data from the Texas Railroad Commission.44
1%
10%
100%
0 100 200 300 400 500 600
Wellhead Gas Production (MMcfd)
Texas Permian Basin Flared / VentedWellhead Gas(% of Wellhead Production)
EOG
EOG Peers

4Q 2018
Copyright; Assumption of Risk:Copyright 2019. This presentation and the contents of this presentation have been copyrighted by EOG Resources, Inc. (EOG). All rights reserved. Copying of the presentation is forbidden without the prior written consent of EOG. Information in this presentation is provided “as is” without warranty of any kind, either express or implied, including but not limited to the implied warranties of merchantability, fitness for a particular purpose and the timeliness of the information. You assume all risk in using the information. In no event shall EOG or its representatives be liable for any special, indirect or consequential damages resulting from the use of the information.
Cautionary Notice Regarding Forward‐Looking Statements:This presentation includes forward‐looking statements within the meaning of Section 27A of the Securities Act of 1933, as amended, and Section 21E of the Securities Exchange Act of 1934, as amended. All statements, other than statements of historical facts, including, among others, statements and projections regarding EOG's future financial position, operations, performance, business strategy, returns, budgets, reserves, levels of production, capital expenditures, costs and asset sales, statements regarding future commodity prices and statements regarding the plans and objectives of EOG's management for future operations, are forward‐looking statements. EOG typically uses words such as "expect," "anticipate," "estimate," "project," "strategy," "intend," "plan," "target," “aims,” "goal," "may," "will," "should" and "believe" or the negative of those terms or other variations or comparable terminology to identify its forward‐looking statements. In particular, statements, express or implied, concerning EOG's future operating results and returns or EOG's ability to replace or increase reserves, increase production, generate returns, replace or increase drilling locations, reduce or otherwise control operating costs and capital expenditures, generate cash flows, pay down or refinance indebtedness or pay and/or increase dividends are forward‐looking statements. Forward‐looking statements are not guarantees of performance. Although EOG believes the expectations reflected in its forward‐looking statements are reasonable and are based on reasonable assumptions, no assurance can be given that these assumptions are accurate or that any of these expectations will be achieved (in full or at all) or will prove to have been correct. Moreover, EOG's forward‐looking statements may be affected by known, unknown or currently unforeseen risks, events or circumstances that may be outside EOG's control. Furthermore, this presentation and any accompanying disclosures may include or reference certain forward‐looking, non‐GAAP financial measures, such as free cash flow or discretionary cash flow, and certain related estimates regarding future performance, results and financial position. Any such forward‐looking measures and estimates are intended to be illustrative only and are not intended to reflect the results that EOG will necessarily achieve for the period(s) presented; EOG’s actual results may differ materially from such measures and estimates. Important factors that could cause EOG's actual results to differ materially from the expectations reflected in EOG's forward‐looking statements include, among others:
• the timing, extent and duration of changes in prices for, supplies of, and demand for, crude oil and condensate, natural gas liquids, natural gas and related commodities; • the extent to which EOG is successful in its efforts to acquire or discover additional reserves; • the extent to which EOG is successful in its efforts to economically develop its acreage in, produce reserves and achieve anticipated production levels from, and maximize reserve recovery from, its existing and future crude oil and natural gas exploration and development
projects; • the extent to which EOG is successful in its efforts to market its crude oil and condensate, natural gas liquids, natural gas and related commodity production;• the availability, proximity and capacity of, and costs associated with, appropriate gathering, processing, compression, storage, transportation and refining facilities; • the availability, cost, terms and timing of issuance or execution of, and competition for, mineral licenses and leases and governmental and other permits and rights‐of‐way, and EOG’s ability to retain mineral licenses and leases;• the impact of, and changes in, government policies, laws and regulations, including tax laws and regulations; climate change and other environmental, health and safety laws and regulations relating to air emissions, disposal of produced water, drilling fluids and other
wastes, hydraulic fracturing and access to and use of water; laws and regulations imposing conditions or restrictions on drilling and completion operations and on the transportation of crude oil and natural gas; laws and regulations with respect to derivatives and hedging activities; and laws and regulations with respect to the import and export of crude oil, natural gas and related commodities;
• EOG's ability to effectively integrate acquired crude oil and natural gas properties into its operations, fully identify existing and potential problems with respect to such properties and accurately estimate reserves, production and costs with respect to such properties;• the extent to which EOG's third‐party‐operated crude oil and natural gas properties are operated successfully and economically;• competition in the oil and gas exploration and production industry for the acquisition of licenses, leases and properties, employees and other personnel, facilities, equipment, materials and services; • the availability and cost of employees and other personnel, facilities, equipment, materials (such as water and tubulars) and services;• the accuracy of reserve estimates, which by their nature involve the exercise of professional judgment and may therefore be imprecise;• weather, including its impact on crude oil and natural gas demand, and weather‐related delays in drilling and in the installation and operation (by EOG or third parties) of production, gathering, processing, refining, compression, storage and transportation facilities;• the ability of EOG's customers and other contractual counterparties to satisfy their obligations to EOG and, related thereto, to access the credit and capital markets to obtain financing needed to satisfy their obligations to EOG;• EOG's ability to access the commercial paper market and other credit and capital markets to obtain financing on terms it deems acceptable, if at all, and to otherwise satisfy its capital expenditure requirements;• the extent to which EOG is successful in its completion of planned asset dispositions;• the extent and effect of any hedging activities engaged in by EOG;• the timing and extent of changes in foreign currency exchange rates, interest rates, inflation rates, global and domestic financial market conditions and global and domestic general economic conditions;• geopolitical factors and political conditions and developments around the world (such as the imposition of tariffs or trade or other economic sanctions, political instability and armed conflict), including in the areas in which EOG operates;• the use of competing energy sources and the development of alternative energy sources;• the extent to which EOG incurs uninsured losses and liabilities or losses and liabilities in excess of its insurance coverage;• acts of war and terrorism and responses to these acts; • physical, electronic and cybersecurity breaches; and• the other factors described under ITEM 1A, Risk Factors, on pages 13 through 22 of EOG’s Annual Report on Form 10‐K for the fiscal year ended December 31, 2018 and any updates to those factors set forth in EOG's subsequent Quarterly Reports on Form 10‐Q or Current
Reports on Form 8‐K.
In light of these risks, uncertainties and assumptions, the events anticipated by EOG's forward‐looking statements may not occur, and, if any of such events do, we may not have anticipated the timing of their occurrence or the duration or extent of their impact on our actual results. Accordingly, you should not place any undue reliance on any of EOG's forward‐looking statements. EOG's forward‐looking statements speak only as of the date made, and EOG undertakes no obligation, other than as required by applicable law, to update or revise its forward‐looking statements, whether as a result of new information, subsequent events, anticipated or unanticipated circumstances or otherwise.
Oil and Gas Reserves; Non‐GAAP Financial Measures:The United States Securities and Exchange Commission (SEC) permits oil and gas companies, in their filings with the SEC, to disclose not only “proved” reserves (i.e., quantities of oil and gas that are estimated to be recoverable with a high degree of confidence), but also “probable” reserves (i.e., quantities of oil and gas that are as likely as not to be recovered) as well as “possible” reserves (i.e., additional quantities of oil and gas that might be recovered, but with a lower probability than probable reserves). Statements of reserves are only estimates and may not correspond to the ultimate quantities of oil and gas recovered. Any reserve or resource estimates provided in this presentation that are not specifically designated as being estimates of proved reserves may include "potential" reserves, “resource potential” and/or other estimated reserves or estimated resources not necessarily calculated in accordance with, or contemplated by, the SEC’s latest reserve reporting guidelines. Investors are urged to consider closely the disclosure in EOG’s Annual Report on Form 10‐K for the fiscal year ended December 31, 2018, available from EOG at P.O. Box 4362, Houston, Texas 77210‐4362 (Attn: Investor Relations). You can also obtain this report from the SEC by calling 1‐800‐SEC‐0330 or from the SEC's website at www.sec.gov. In addition, reconciliation and calculation schedules for non‐GAAP financial measures can be found on the EOG website at www.eogresources.com.
45