epa office of compliance sector notebook project: profile of
TRANSCRIPT

Ground Transportation Industry Sector Notebook Project
EPA/310-R-97-002
EPA Office of Compliance Sector Notebook Project:
Profile of the Ground Transportation IndustryTrucking, Railroad, and Pipeline
September 1997
Office of ComplianceOffice of Enforcement and Compliance Assurance
U.S. Environmental Protection Agency401 M St., SW (MC 2221-A)
Washington, DC 20460

Ground Transportation Industry Sector Notebook Project
Sector Notebook Project September 1997i
This report is one in a series of volumes published by the U.S. Environmental Protection Agency(EPA) to provide information of general interest regarding environmental issues associated withspecific industrial sectors. The documents were developed under contract by Abt Associates(Cambridge, MA), Science Applications International Corporation (McLean, VA), and Booz-Allen & Hamilton, Inc. (McLean, VA). This publication may be purchased from theSuperintendent of Documents, U.S. Government Printing Office. A listing of available SectorNotebooks and document numbers is included at the end of this document.
All telephone orders should be directed to:
Superintendent of DocumentsU.S. Government Printing OfficeWashington, DC 20402(202) 512-1800FAX (202) 512-22508:00 a.m. to 4:30 p.m., EST, M-F
Using the form provided at the end of this document, all mail orders should be directed to:
U.S. Government Printing OfficeP.O. Box 371954Pittsburgh, PA 15250-7954
Complimentary volumes are available to certain groups or subscribers, such as public andacademic libraries, Federal, State, and local governments, and the media from EPA’s NationalCenter for Environmental Publications and Information at (800) 490-9198. For furtherinformation, and for answers to questions pertaining to these documents, please refer to thecontact names and numbers provided within this volume.
Electronic versions of all Sector Notebooks are available via Internet on the Enviro$en$e WorldWide Web. Downloading procedures are described in Appendix A of this document.
Cover photograph by Steve Delaney, EPA.
Ground Transportation Industry Sector Notebook Project
Sector Notebook Project September 1997ii
Sector Notebooks Contacts
The Sector Notebooks were developed by the EPA Office of Compliance. Questions relating to theSector Notebook Project can be directed to:
Seth Heminway, Coordinator, Sector Notebook ProjectUS EPA Office of Compliance401 M St., SW (2223-A)Washington, DC 20460(202) 564-7017
Questions and comments regarding the individual documents can be directed to the appropriatespecialists listed below.
Document Number Industry Contact Phone (202)EPA/310-R-95-001. Dry Cleaning Industry Joyce Chandler 564-7073EPA/310-R-95-002. Electronics and Computer Industry Steve Hoover 564-7007EPA/310-R-95-003. Wood Furniture and Fixtures Industry Bob Marshall 564-7021EPA/310-R-95-004. Inorganic Chemical Industry Walter DeRieux 564-7067EPA/310-R-95-005. Iron and Steel Industry Maria Malave 564-7027EPA/310-R-95-006. Lumber and Wood Products Industry Seth Heminway 564-7017EPA/310-R-95-007. Fabricated Metal Products Industry Scott Throwe 564-7013EPA/310-R-95-008. Metal Mining Industry Jane Engert 564-5021EPA/310-R-95-009. Motor Vehicle Assembly Industry Anthony Raia 564-6045EPA/310-R-95-010. Nonferrous Metals Industry Jane Engert 564-5021EPA/310-R-95-011. Non-Fuel, Non-Metal Mining Industry Robert Lischinsky 564-2628EPA/310-R-95-012. Organic Chemical Industry Walter DeRieux 564-7067EPA/310-R-95-013. Petroleum Refining Industry Tom Ripp 564-7003EPA/310-R-95-014. Printing Industry Ginger Gotliffe 564-7072EPA/310-R-95-015. Pulp and Paper Industry Maria Eisemann 564-7016EPA/310-R-95-016. Rubber and Plastic Industry Maria Malave 564-7027EPA/310-R-95-017. Stone, Clay, Glass, and Concrete Industry Scott Throwe 564-7013EPA/310-R-95-018. Transportation Equipment Cleaning Ind. Virginia Lathrop 564-7057
EPA/310-R-97-001. Air Transportation Industry Virginia Lathrop 564-7057EPA/310-R-97-002. Ground Transportation Industry Virginia Lathrop 564-7057EPA/310-R-97-003. Water Transportation Industry Virginia Lathrop 564-7057EPA/310-R-97-004. Metal Casting Industry Jane Engert 564-5021EPA/310-R-97-005. Pharmaceuticals Industry Emily Chow 564-7071EPA/310-R-97-006. Plastic Resin and Manmade Fiber Ind. Sally Sasnett 564-7074EPA/310-R-97-007. Fossil Fuel Electric Power Generation. Ind. Rafael Sanchez 564-7028EPA/310-R-97-008. Shipbuilding and Repair Industry Anthony Raia 564-6045EPA/310-R-97-009. Textile Industry Belinda Breidenbach 564-7022EPA/310-R-97-010. Sector Notebook Data Refresh, 1979 Seth Heminway 564-7017

Ground Transportation Industry Sector Notebook Project
Sector Notebook Project September 1997iii
GROUND TRANSPORTATION INDUSTRY(SIC 40, 42, 46, AND 49)TABLE OF CONTENTS
List of Exhibits . . . . . . . . . . . . . . . . . . . . . . . . . . . . . . . . . . . . . . . . . . . . . . . . . . . . . . . . . . . . . . . vi
List of Acronyms . . . . . . . . . . . . . . . . . . . . . . . . . . . . . . . . . . . . . . . . . . . . . . . . . . . . . . . . . . . . vii
I. Introduction to the Sector Notebook Project . . . . . . . . . . . . . . . . . . . . . . . . . . . . . . . . . . . . . . 1A. Summary of the Sector Notebook Project . . . . . . . . . . . . . . . . . . . . . . . . . . . . . . . . . 1B. Additional Information . . . . . . . . . . . . . . . . . . . . . . . . . . . . . . . . . . . . . . . . . . . . . . . . 2
II. Introduction to the Ground Transportation Industry . . . . . . . . . . . . . . . . . . . . . . . . . . . . . . . . 3A. Introduction, Background, and Scope of the Notebook . . . . . . . . . . . . . . . . . . . . . . . 3B. Industry Sectors Analyzed . . . . . . . . . . . . . . . . . . . . . . . . . . . . . . . . . . . . . . . . . . . . . . 3
1. Rail Transportation . . . . . . . . . . . . . . . . . . . . . . . . . . . . . . . . . . . . . . . . . . . . . 32. Trucking . . . . . . . . . . . . . . . . . . . . . . . . . . . . . . . . . . . . . . . . . . . . . . . . . . . . . . 43. Pipelines . . . . . . . . . . . . . . . . . . . . . . . . . . . . . . . . . . . . . . . . . . . . . . . . . . . . . . 5
III. Rail Transportation . . . . . . . . . . . . . . . . . . . . . . . . . . . . . . . . . . . . . . . . . . . . . . . . . . . . . . . . . 7A. Characterization of the Rail Transportation Industry . . . . . . . . . . . . . . . . . . . . . . . . . 7
1.Industry Characterization . . . . . . . . . . . . . . . . . . . . . . . . . . . . . . . . . . . . . . . . . 72. Industry Size and Geographic Distribution . . . . . . . . . . . . . . . . . . . . . . . . . . . 83. Economic Trends . . . . . . . . . . . . . . . . . . . . . . . . . . . . . . . . . . . . . . . . . . . . . . 10
B. Operations in the Rail Transportation Industry . . . . . . . . . . . . . . . . . . . . . . . . . . . . . 121. Rail Car Refurbishing and Maintenance . . . . . . . . . . . . . . . . . . . . . . . . . . . . 122. Locomotive Maintenance . . . . . . . . . . . . . . . . . . . . . . . . . . . . . . . . . . . . . . . . 133. Transportation . . . . . . . . . . . . . . . . . . . . . . . . . . . . . . . . . . . . . . . . . . . . . . . . 13
C. Raw Material Inputs and Pollution Outputs . . . . . . . . . . . . . . . . . . . . . . . . . . . . . . . 131. Rail Car Refurbishing and Maintenance . . . . . . . . . . . . . . . . . . . . . . . . . . . . 132. Locomotive Maintenance . . . . . . . . . . . . . . . . . . . . . . . . . . . . . . . . . . . . . . . . 143. Transportation Operations . . . . . . . . . . . . . . . . . . . . . . . . . . . . . . . . . . . . . . . 16
IV. Trucking . . . . . . . . . . . . . . . . . . . . . . . . . . . . . . . . . . . . . . . . . . . . . . . . . . . . . . . . . . . . . . . . 19A. Characterization of the Trucking Industry . . . . . . . . . . . . . . . . . . . . . . . . . . . . . . . . 19
1. Industry Characterization . . . . . . . . . . . . . . . . . . . . . . . . . . . . . . . . . . . . . . . . 192. Industry Size and Geographic Distribution . . . . . . . . . . . . . . . . . . . . . . . . . . 213. Economic Trends . . . . . . . . . . . . . . . . . . . . . . . . . . . . . . . . . . . . . . . . . . . . . . 24
B. Operations in the Trucking Industry . . . . . . . . . . . . . . . . . . . . . . . . . . . . . . . . . . . . . 261. Truck Terminals and Maintenance Facilities . . . . . . . . . . . . . . . . . . . . . . . . . 262. Truck Washing . . . . . . . . . . . . . . . . . . . . . . . . . . . . . . . . . . . . . . . . . . . . . . . . 293. Tank Truck Cleaning . . . . . . . . . . . . . . . . . . . . . . . . . . . . . . . . . . . . . . . . . . . 294. Transport Operations . . . . . . . . . . . . . . . . . . . . . . . . . . . . . . . . . . . . . . . . . . . 30

Ground Transportation Industry Sector Notebook Project
Sector Notebook Project September 1997iv
C. Raw Material Inputs and Pollution Outputs . . . . . . . . . . . . . . . . . . . . . . . . . . . . . . . 301. Truck Terminals and Maintenance . . . . . . . . . . . . . . . . . . . . . . . . . . . . . . . . 302. Truck Washing . . . . . . . . . . . . . . . . . . . . . . . . . . . . . . . . . . . . . . . . . . . . . . . . 323. Tank Cleaning . . . . . . . . . . . . . . . . . . . . . . . . . . . . . . . . . . . . . . . . . . . . . . . . 324. Transport Operations . . . . . . . . . . . . . . . . . . . . . . . . . . . . . . . . . . . . . . . . . . . 33
V. Pipelines . . . . . . . . . . . . . . . . . . . . . . . . . . . . . . . . . . . . . . . . . . . . . . . . . . . . . . . . . . . . . . . . 37A. Characterization of Pipelines . . . . . . . . . . . . . . . . . . . . . . . . . . . . . . . . . . . . . . . . . . 37
1. Industry Characterization . . . . . . . . . . . . . . . . . . . . . . . . . . . . . . . . . . . . . . . . 372. Industry Size and Geographic Distribution . . . . . . . . . . . . . . . . . . . . . . . . . . 383. Economic Trends . . . . . . . . . . . . . . . . . . . . . . . . . . . . . . . . . . . . . . . . . . . . . . 40
B. Operations in the Pipeline Industry . . . . . . . . . . . . . . . . . . . . . . . . . . . . . . . . . . . . . . 431. Pigging . . . . . . . . . . . . . . . . . . . . . . . . . . . . . . . . . . . . . . . . . . . . . . . . . . . . . . 442. Pipeline Leaks . . . . . . . . . . . . . . . . . . . . . . . . . . . . . . . . . . . . . . . . . . . . . . . . 443. Pipeline Inspections . . . . . . . . . . . . . . . . . . . . . . . . . . . . . . . . . . . . . . . . . . . . 454. Glycol Dehydration Units . . . . . . . . . . . . . . . . . . . . . . . . . . . . . . . . . . . . . . . 49
C. Pollution Outputs and Causes of Pipeline Leaks . . . . . . . . . . . . . . . . . . . . . . . . . . . 501. Pipeline Failures . . . . . . . . . . . . . . . . . . . . . . . . . . . . . . . . . . . . . . . . . . . . . . . 502. Glycol Dehydration - Inlet Separator . . . . . . . . . . . . . . . . . . . . . . . . . . . . . . . 523. Breakout Tank Leakage . . . . . . . . . . . . . . . . . . . . . . . . . . . . . . . . . . . . . . . . . 52
VI. Pollution Prevention/Waste Minimization . . . . . . . . . . . . . . . . . . . . . . . . . . . . . . . . . . . . . 55A. Introduction . . . . . . . . . . . . . . . . . . . . . . . . . . . . . . . . . . . . . . . . . . . . . . . . . . . . . . . . 55B. Rail Transportation . . . . . . . . . . . . . . . . . . . . . . . . . . . . . . . . . . . . . . . . . . . . . . . . . . 55
1. Water Discharge . . . . . . . . . . . . . . . . . . . . . . . . . . . . . . . . . . . . . . . . . . . . . . . 552. Oil . . . . . . . . . . . . . . . . . . . . . . . . . . . . . . . . . . . . . . . . . . . . . . . . . . . . . . . . . 573. Waste from Maintenance and Repair Operations . . . . . . . . . . . . . . . . . . . . . 584. Paint . . . . . . . . . . . . . . . . . . . . . . . . . . . . . . . . . . . . . . . . . . . . . . . . . . . . . . . . 595. Fueling . . . . . . . . . . . . . . . . . . . . . . . . . . . . . . . . . . . . . . . . . . . . . . . . . . . . . . 59
C. Trucking . . . . . . . . . . . . . . . . . . . . . . . . . . . . . . . . . . . . . . . . . . . . . . . . . . . . . . . . . . 601. Truck Terminal and Maintenance Facilities . . . . . . . . . . . . . . . . . . . . . . . . . 602. Vehicle Washing . . . . . . . . . . . . . . . . . . . . . . . . . . . . . . . . . . . . . . . . . . . . . . 613. Stormwater Pollution Prevention . . . . . . . . . . . . . . . . . . . . . . . . . . . . . . . . . . 614. Alternatively-Fueled Vehicles . . . . . . . . . . . . . . . . . . . . . . . . . . . . . . . . . . . . 63
D. Pipelines . . . . . . . . . . . . . . . . . . . . . . . . . . . . . . . . . . . . . . . . . . . . . . . . . . . . . . . . . . 631. Direct Leak Detection Enhancements . . . . . . . . . . . . . . . . . . . . . . . . . . . . . . 632. Supervisory Control and Data Acquisition (SCADA) Systems . . . . . . . . . . . 643. Hydrostatic Testing . . . . . . . . . . . . . . . . . . . . . . . . . . . . . . . . . . . . . . . . . . . . 644. Cathodic Protection . . . . . . . . . . . . . . . . . . . . . . . . . . . . . . . . . . . . . . . . . . . . 655. Smart Pigs . . . . . . . . . . . . . . . . . . . . . . . . . . . . . . . . . . . . . . . . . . . . . . . . . . . 656. Breakout Tanks . . . . . . . . . . . . . . . . . . . . . . . . . . . . . . . . . . . . . . . . . . . . . . . 667. Proper Training . . . . . . . . . . . . . . . . . . . . . . . . . . . . . . . . . . . . . . . . . . . . . . . 66

Ground Transportation Industry Sector Notebook Project
Sector Notebook Project September 1997v
VII. Summary of Applicable Federal Statutes and Regulations . . . . . . . . . . . . . . . . . . . . . . . . 67A. General Description of Major Statutes . . . . . . . . . . . . . . . . . . . . . . . . . . . . . . . . . . . 67B. Industry Sector Specific Regulations . . . . . . . . . . . . . . . . . . . . . . . . . . . . . . . . . . . . 78
1. Rail Transportation . . . . . . . . . . . . . . . . . . . . . . . . . . . . . . . . . . . . . . . . . . . . 782. Trucking . . . . . . . . . . . . . . . . . . . . . . . . . . . . . . . . . . . . . . . . . . . . . . . . . . . . . 823. Pipelines . . . . . . . . . . . . . . . . . . . . . . . . . . . . . . . . . . . . . . . . . . . . . . . . . . . . . 84
C. Pending and Proposed Regulatory Requirements . . . . . . . . . . . . . . . . . . . . . . . . . . . 88
VIII. Compliance and Enforcement History . . . . . . . . . . . . . . . . . . . . . . . . . . . . . . . . . . . . . . . 89A. Background . . . . . . . . . . . . . . . . . . . . . . . . . . . . . . . . . . . . . . . . . . . . . . . . . . . . . . . . 89B. Compliance and Enforcement Profile Description . . . . . . . . . . . . . . . . . . . . . . . . . . 89C. Industry Sector Compliance History . . . . . . . . . . . . . . . . . . . . . . . . . . . . . . . . . . . . . 93D. Comparison of Enforcement Activity Between Selected Industries . . . . . . . . . . . . . 98
IX. REVIEW OF MAJOR LEGAL ACTIONS . . . . . . . . . . . . . . . . . . . . . . . . . . . . . . . . . . . . . . . . . 103A. Review of Major Cases . . . . . . . . . . . . . . . . . . . . . . . . . . . . . . . . . . . . . . . . . . . . . . 103
1. Rail . . . . . . . . . . . . . . . . . . . . . . . . . . . . . . . . . . . . . . . . . . . . . . . . . . . . . . . . 1032. Trucking . . . . . . . . . . . . . . . . . . . . . . . . . . . . . . . . . . . . . . . . . . . . . . . . . . . . 1043. Pipelines . . . . . . . . . . . . . . . . . . . . . . . . . . . . . . . . . . . . . . . . . . . . . . . . . . . . 105
B. Supplemental Environmental Projects (SEPs) . . . . . . . . . . . . . . . . . . . . . . . . . . . . 106
X. Compliance Activities and Initiatives . . . . . . . . . . . . . . . . . . . . . . . . . . . . . . . . . . . . . . . . . 107A. Sector-Related Environmental Programs and Activities . . . . . . . . . . . . . . . . . . . . . 107
1. Rail . . . . . . . . . . . . . . . . . . . . . . . . . . . . . . . . . . . . . . . . . . . . . . . . . . . . . . . . 1072. Trucking . . . . . . . . . . . . . . . . . . . . . . . . . . . . . . . . . . . . . . . . . . . . . . . . . . . . 1073. Pipelines . . . . . . . . . . . . . . . . . . . . . . . . . . . . . . . . . . . . . . . . . . . . . . . . . . . . 109
B. EPA Voluntary Programs . . . . . . . . . . . . . . . . . . . . . . . . . . . . . . . . . . . . . . . . . . . . 110C. Trade Association/Industry-Sponsored Activity . . . . . . . . . . . . . . . . . . . . . . . . . . . 113
1. Railroad Tank Car Safety Research and Test Project . . . . . . . . . . . . . . . . . 1132. The North American Non-Accident Release Reduction Program . . . . . . . . 1133. Environmental Compliance Handbook for Short Line Railroads . . . . . . . . 1144. Environmental Training Publications and Videotapes . . . . . . . . . . . . . . . . . 1145. Pipeline Integrity Programs - Natural Gas and Hazardous Liquid One-Call
Systems . . . . . . . . . . . . . . . . . . . . . . . . . . . . . . . . . . . . . . . . . . . . . . . . 1156. Summary of Trade Associations . . . . . . . . . . . . . . . . . . . . . . . . . . . . . . . . . 116
XI. Resource Materials/Bibliography . . . . . . . . . . . . . . . . . . . . . . . . . . . . . . . . . . . . . . . . . . . 121
Appendix A: Instructions for Downloading this Notebook . . . . . . . . . . . . . . . . . . . . . . . . . . . A-1

Ground Transportation Industry Sector Notebook Project
Sector Notebook Project September 1997vi
List of Exhibits
Exhibit 1: Facility Size Distribution of Rail Industry . . . . . . . . . . . . . . . . . . . . . . . . . . . . . . . . . 9Exhibit 2: Line-Haul and Switching and Terminal Railroads . . . . . . . . . . . . . . . . . . . . . . . . . . . 9Exhibit 3: Geographic Distribution of Railroads in the United States . . . . . . . . . . . . . . . . . . . . 10Exhibit 4: Tons Originated and Revenue by Commodity . . . . . . . . . . . . . . . . . . . . . . . . . . . . . 11Exhibit 5: Rail Car Refurbishing and Maintenance Process Material Input/Pollutant Output . 14Exhibit 6: Truck Types . . . . . . . . . . . . . . . . . . . . . . . . . . . . . . . . . . . . . . . . . . . . . . . . . . . . . . . 20Exhibit 7: Facility Size Distribution of Trucking Industry . . . . . . . . . . . . . . . . . . . . . . . . . . . . 22Exhibit 8: Geographic Distribution of Trucking Industry Facilities . . . . . . . . . . . . . . . . . . . . . 23Exhibit 9: Share of Freight Revenues by Mode of Transportation . . . . . . . . . . . . . . . . . . . . . . 24Exhibit 10: Typical Trucking Maintenance Facility . . . . . . . . . . . . . . . . . . . . . . . . . . . . . . . . . 28Exhibit 11: Hydrocarbons Emission Sources . . . . . . . . . . . . . . . . . . . . . . . . . . . . . . . . . . . . . . . 33Exhibit 12: Carbon Monoxide Emission Sources . . . . . . . . . . . . . . . . . . . . . . . . . . . . . . . . . . . 34Exhibit 13: Nitrogen Oxides Emission Sources . . . . . . . . . . . . . . . . . . . . . . . . . . . . . . . . . . . . 34Exhibit 14: Process Material Input/Pollutant Output from Trucking Operations . . . . . . . . . . . 35Exhibit 15: Facility Size Distribution of Pipeline Industry . . . . . . . . . . . . . . . . . . . . . . . . . . . . 39Exhibit 16: Geographic Distribution of Oil Pipelines . . . . . . . . . . . . . . . . . . . . . . . . . . . . . . . . 40Exhibit 17: Natural Gas Delivery Infrastructure . . . . . . . . . . . . . . . . . . . . . . . . . . . . . . . . . . . . 42Exhibit 18: Methods of Monitoring Pipelines . . . . . . . . . . . . . . . . . . . . . . . . . . . . . . . . . . . . . . 48Exhibit 19: Hazardous Liquid Pipeline Incident Summary by Cause . . . . . . . . . . . . . . . . . . . . 51Exhibit 20: Natural Gas Pipeline Incident Summary by Cause . . . . . . . . . . . . . . . . . . . . . . . . . 51Exhibit 21: Storm Water Pollution Prevention Flowchart . . . . . . . . . . . . . . . . . . . . . . . . . . . . . 62Exhibit 22: Clean Water Act Requirements Applicable to Railroads . . . . . . . . . . . . . . . . . . . . 80Exhibit 23: Heavy-Duty Truck Engine Emission Standards . . . . . . . . . . . . . . . . . . . . . . . . . . . 83Exhibit 24: Five-Year Enforcement and Compliance Summary for Transportation Sectors . . 94Exhibit 25: One-Year Enforcement and Compliance Summary for Transportation Sectors . . . 95Exhibit 26: Five-Year Enforcement and Compliance Summary by Statute for Transportation
Sectors . . . . . . . . . . . . . . . . . . . . . . . . . . . . . . . . . . . . . . . . . . . . . . . . . . . . . . . . . . . . . . 96Exhibit 27: One-Year Enforcement and Compliance Summary for Transportation Sectors . . . 97Exhibit 28: Five-Year Enforcement and Compliance Summary for Selected Industries . . . . . 99Exhibit 29: One-Year Enforcement and Compliance Summary for Selected Industries . . . . . 100Exhibit 30: Five-Year Inspection and Enforcement Summary by Statute for Selected
Industries . . . . . . . . . . . . . . . . . . . . . . . . . . . . . . . . . . . . . . . . . . . . . . . . . . . . . . . . . . . 101Exhibit 31: One-Year Inspection and Enforcement Summary by Statute for Selected
Industries . . . . . . . . . . . . . . . . . . . . . . . . . . . . . . . . . . . . . . . . . . . . . . . . . . . . . . . . . . . 102Exhibit 32: Supplemental Environmental Projects in the Transportation Industry . . . . . . . . . 106

Ground Transportation Industry Sector Notebook Project
Sector Notebook Project September 1997vii
TRANSPORTATION INDUSTRY
List of Acronyms
AAR - Association of American RailroadsAFS - AIRS Facility Subsystem (CAA database)AGA - American Gas AssociationAIRS - Aerometric Information Retrieval System (CAA database)ATA - American Trucking AssociationsBIFs - Boilers and Industrial Furnaces (RCRA)BOD - Biochemical Oxygen Demand CAA - Clean Air ActCAAA - Clean Air Act Amendments of 1990CERCLA - Comprehensive Environmental Response, Compensation and Liability ActCERCLIS - CERCLA Information SystemCFCs - ChlorofluorocarbonsCO - Carbon Monoxide COD - Chemical Oxygen Demand CSI - Common Sense Initiative CWA - Clean Water ActD&B - Dun and Bradstreet Marketing IndexELP - Environmental Leadership Program EPA - United States Environmental Protection AgencyEPCRA - Emergency Planning and Community Right-to-Know Act FIFRA - Federal Insecticide, Fungicide, and Rodenticide ActFINDS - Facility Indexing SystemHAPs - Hazardous Air Pollutants (CAA)HSDB - Hazardous Substances Data Bank IDEA - Integrated Data for Enforcement AnalysisLDR - Land Disposal Restrictions (RCRA)LEPCs - Local Emergency Planning CommitteesLERCs - Local Emergency Response CommissionsMACT - Maximum Achievable Control Technology (CAA)MCLGs - Maximum Contaminant Level Goals MCLs - Maximum Contaminant Levels MEK - Methyl Ethyl KetoneMSDSs - Material Safety Data Sheets NAAQS - National Ambient Air Quality Standards (CAA)NAFTA - North American Free Trade AgreementNAICS - North American Industrial Classification SystemNCDB - National Compliance Database (for TSCA, FIFRA, EPCRA)NCP - National Oil and Hazardous Substances Pollution Contingency Plan NEIC - National Enforcement Investigations Center NESHAP - National Emission Standards for Hazardous Air PollutantsNO Nitrogen Dioxide2
-

Ground Transportation Industry Sector Notebook Project
Sector Notebook Project September 1997viii
NOV - Notice of Violation NO Nitrogen Oxide X -NPDES - National Pollution Discharge Elimination System (CWA)NPL - National Priorities List NRC - National Response Center NSPS - New Source Performance Standards (CAA)OAR - Office of Air and RadiationOECA - Office of Enforcement and Compliance AssuranceOPA - Oil Pollution ActOPPTS - Office of Prevention, Pesticides, and Toxic SubstancesOSHA - Occupational Safety and Health Administration OSW - Office of Solid WasteOSWER - Office of Solid Waste and Emergency ResponseOW - Office of WaterP2 - Pollution PreventionPCS - Permit Compliance System (CWA Database)POTW - Publicly Owned Treatments Works RCRA - Resource Conservation and Recovery ActRCRIS - RCRA Information SystemRPI - Railway Progress InstituteRSPA - Research and Special Programs AdministrationSARA - Superfund Amendments and Reauthorization ActSDWA - Safe Drinking Water ActSEPs - Supplementary Environmental Projects SERCs - State Emergency Response Commissions SIC - Standard Industrial Classification SO - Sulfur Dioxide 2SPCC - Spill Prevention Control and CountermeasureTOC - Total Organic Carbon TRI - Toxic Release InventoryTRIS - Toxic Release Inventory System TCRIS - Toxic Chemical Release Inventory SystemTSCA - Toxic Substances Control ActTSDF - Treatment, Storage and Disposal FacilityTSS - Total Suspended Solids UIC - Underground Injection Control (SDWA)UST - Underground Storage Tanks (RCRA)VOCs - Volatile Organic Compounds

Ground Transportation Industry Introduction
Sector Notebook Project September 19971
TRANSPORTATION INDUSTRY(SIC 40, 42, 46, AND 49)
I. INTRODUCTION TO THE SECTOR NOTEBOOK PROJECT
I.A. Summary of the Sector Notebook Project
Integrated environmental policies based upon comprehensive analysis of air,water and land pollution are a logical supplement to traditional single-mediaapproaches to environmental protection. Environmental regulatory agenciesare beginning to embrace comprehensive, multi-statute solutions to facilitypermitting, enforcement and compliance assurance, education/ outreach,research, and regulatory development issues. The central concepts drivingthe new policy direction are that pollutant releases to each environmentalmedium (air, water and land) affect each other, and that environmentalstrategies must actively identify and address these inter-relationships bydesigning policies for the "whole" facility. One way to achieve a wholefacility focus is to design environmental policies for similar industrialfacilities. By doing so, environmental concerns that are common to themanufacturing of similar products can be addressed in a comprehensivemanner. Recognition of the need to develop the industrial “sector-based”approach within the EPA Office of Compliance led to the creation of thisdocument.
The Sector Notebook Project was originally initiated by the Office ofCompliance within the Office of Enforcement and Compliance Assurance(OECA) to provide its staff and managers with summary information foreighteen specific industrial sectors. As other EPA offices, states, the regulatedcommunity, environmental groups, and the public became interested in thisproject, the scope of the original project was expanded to its current form.The ability to design comprehensive, common sense environmentalprotection measures for specific industries is dependent on knowledge ofseveral inter-related topics. For the purposes of this project, the key elementschosen for inclusion are: general industry information (economic andgeographic); a description of industrial processes; pollution outputs; pollutionprevention opportunities; Federal statutory and regulatory framework;compliance history; and a description of partnerships that have been formedbetween regulatory agencies, the regulated community and the public.
For any given industry, each topic listed above could alone be the subject ofa lengthy volume. However, in order to produce a manageable document,this project focuses on providing summary information for each topic. Thisformat provides the reader with a synopsis of each issue, and referenceswhere more in-depth information is available. Text within each profile wasresearched from a variety of sources, and was usually condensed from more

Ground Transportation Industry Introduction
Sector Notebook Project September 19972
detailed sources pertaining to specific topics. This approach allows for awide coverage of activities that can be further explored based upon thecitations and references listed at the end of this profile. As a check on theinformation included, each notebook went through an external reviewprocess. The Office of Compliance appreciates the efforts of all those thatparticipated in this process who enabled us to develop more complete,accurate and up-to-date summaries. Many of those who reviewed thisnotebook are listed as contacts in Section IX and may be sources of additionalinformation. The individuals and groups on this list do not necessarilyconcur with all statements within this notebook.
I.B. Additional Information
Providing Comments
OECA’s Office of Compliance plans to periodically review and update thenotebooks and will make these updates available both in hard copy andelectronically. If you have any comments on the existing notebook, or if youwould like to provide additional information, please send a hard copy andcomputer disk to the EPA Office of Compliance, Sector Notebook Project(2223-A), 401 M St., SW, Washington, DC 20460. Comments can also beuploaded to the Enviro$en$e World Wide Web for general access to all usersof the system. Follow instructions in Appendix A for accessing this system.Once you have logged in, procedures for uploading text are available fromthe on-line Enviro$en$e Help System.
Adapting Notebooks to Particular Needs
The scope of the industry sector described in this notebook approximates thenational occurrence of facility types within the sector. In many instances,industries within specific geographic regions or states may have uniquecharacteristics that are not fully captured in these profiles. The Office ofCompliance encourages state and local environmental agencies and othergroups to supplement or re-package the information included in this notebookto include more specific industrial and regulatory information that may beavailable. Additionally, interested states may want to supplement the"Summary of Applicable Federal Statutes and Regulations" section with stateand local requirements. Compliance or technical assistance providers mayalso want to develop the "Pollution Prevention" section in more detail.Please contact the appropriate specialist listed on the opening page of thisnotebook if your office is interested in assisting us in the further developmentof the information or policies addressed within this volume. If you areinterested in assisting in the development of new notebooks for sectors notalready covered, please contact the Office of Compliance at 202-564-2395.

Ground Transportation Industry Introduction
Sector Notebook Project September 19973
II. INTRODUCTION TO THE GROUND TRANSPORTATION INDUSTRY
This section provides background information on the size, geographicdistribution, employment, production, sales, and economic condition of theground transportation industry. Facilities described within this document aredescribed in terms of their Standard Industrial Classification (SIC) codes.
II.A. Introduction, Background, and Scope of the Notebook
This notebook pertains to the transportation industry as classified by theOffice of Management and Budget (OMB) under Standard IndustrialClassification (SIC) codes 40 (Rail Transportation); 42 (Trucking); and 46,4922-4924 (Pipelines). Where possible, data are specific to sub-divisions ofthese SIC codes. In many cases, information about the industries (i.e., rail,trucking, and pipeline) does not directly correlate to SIC distinctions. Thisis due to various factors, including different reporting requirements andclassifications within each industry that are not consistent with SICdelineations. This limitation is discussed throughout the notebook, asappropriate. OMB is in the process of changing the SIC code system to asystem based on similar production processes called the North AmericanIndustrial Classification System (NAICS). In the NAICS system, RailTransportation is classified as NAIC 482, Trucking is NAIC 484 and 492,and Pipelines are NAIC 486.
The transportation industry includes other modes of transport such as waterand air. Although these are not addressed in this document, they make up animportant portion of overall transportation activity in the United States.
The transportation industry affects nearly every American. Either through thenecessity of traveling from one place to another, shipping goods and servicesaround the country, or working in a transportation-related job,transportation’s share of the national economy is significant. According tothe Eno Transportation Foundation, for all transportation-related industries,total transportation expenditures in the U.S. accounted for 16.1 percent of thegross national product in 1993.
II.B. Industry Sectors Analyzed
II.B.1. Rail Transportation
The rail transportation industry includes establishments furnishingtransportation by line-haul railroad, and switching and terminalestablishments. These terms refer to the distance the particular railroadoperation covers — line-haul operations cover longer distances, oftenconnecting two cities, while switching and terminal railroads generally travel

Ground Transportation Industry Introduction
Sector Notebook Project September 19974
through a single city. For the purpose of this notebook, rail transportationdoes not include passenger railways serving a single municipality, contiguousmunicipalities, or a municipality and its suburban areas; these economic unitsare classified in SIC 41. Other services related to railroad transportation areclassified in SIC 47; lessors of railroad property are classified in SIC 6517.The rail SIC sectors covered in this notebook are shown in the followingtable.
SIC 40 - RAILROAD TRANSPORTATION4011 Railroads, Line-Haul Operations4013 Railroad Switching and Terminal Establishments
II.B.2. Trucking
The trucking industry includes establishments engaged in motor freighttransportation and warehousing. This includes local and long-distancetrucking or transfer services, and establishments engaged in the storage offarm products, furniture, and other household goods, or commercial goods ofany kind. For the purpose of this notebook, the trucking industry alsoincludes the operation of terminal facilities for handling freight, both thosewith and without maintenance facilities. The trucking SIC sectors coveredin this notebook are shown in the following table.
SIC 42 - MOTOR FREIGHT TRANSPORTATION & WAREHOUSING4212 Local Trucking Without Storage4213 Trucking, Except Local4214 Local Trucking With Storage4215 Courier Services, Except by Air4221 Farm Product Warehousing & Storage4222 Refrigerated Warehousing & Storage4225 General Warehousing & Storage4226 Special Warehousing & Storage, NEC*4231 Terminal & Joint Terminal Maintenance Facilities for Motor
Freight Transportation* NEC = Not Elsewhere Classified

Ground Transportation Industry Introduction
Sector Notebook Project September 19975
II.B.3. Pipelines
The pipeline industry includes establishments primarily engaged in thepipeline transportation of petroleum and other commodities. Pipelines areclassified within two SIC categories, Major Group 46 (Pipelines, exceptNatural Gas) and Major Group 49 (Electric, Gas, and Sanitary Services).This notebook will integrate the relevant operations from the two groupswhenever possible. Occasionally, due to surveys that focus only on one ofthe groupings, data is segregated. The pipeline SIC sectors covered in thisnotebook are shown in the following table.
SIC 46 - PIPELINES, EXCEPT NATURAL GAS4612 Crude Petroleum Pipelines4613 Refined Petroleum Pipelines4619 Pipelines, NEC*
SIC 49 - ELECTRIC, GAS, AND SANITARY SERVICES
4922 Natural Gas Transmission4923 Natural Gas Transmission and Distribution4924 Natural Gas Distribution4925 Mixed, Manufactured, or Liquefied Petroleum Gas Production
and/or Distribution* NEC = Not Elsewhere Classified

Page 6 intentionally left blank.

Ground Transportation Industry Rail Transportation
Sector Notebook Project September 19977
III. RAIL TRANSPORTATION
III.A. Characterization of the Rail Transportation Industry
III.A.1.Industry Characterization
On February 28, 1827, the State of Maryland chartered the Baltimore & Ohio(B&O) Railroad, inaugurating America’s first common-carrier railroad. TheB&O marked the beginning of the nation’s rail system. By 1850, railtrackage extended over 9,000 miles, mostly in the Northeast. Mirroring themovement of people to the American West, the first transcontinental rail linkopened in 1869. By 1916, railroad tracks stretched across 254,000 miles.During the mid-twentieth century, railroads suffered from strict regulationand increased competition from trucks, buses, barges, and planes. By the late1970s, nearly a quarter of the nation’s rail mileage was operated inbankruptcy.
Railroads began to recover economically in 1980 with the passage of theStaggers Rail Act. This legislation partially deregulated the shipment ratescharged by railroads, but continued to allow the Interstate CommerceCommission (ICC) to protect shippers from market abuse. The economicbalance struck by the Staggers Act renewed the rail industry: by 1990, therates charged to ship goods by rail had fallen 28.8 percent (adjusted forinflation). Ton-miles of freight moved by rail (reflecting the number of tonshauled and the miles traveled) per employee more than doubled from 1980levels.
By 1993, the biggest railroads moved a record 1.1 trillion ton-miles of freightwith 57 percent fewer employees, 30 percent fewer miles of track, 36 percentfewer locomotives, and 48 percent fewer freight cars than in 1980(Association of American Railroads Information Handbook, 1994).
From an environmental standpoint, it is important to recognize that otherindustries have grown up around the rail industry. For example, railroads donot generally clean rail tank cars. This is usually performed by servicecompanies on a fee-for-service basis. In addition, rail cars and tank cars areoften owned and loaded by the shipper at its facility. Some of the operationsdescribed in this section are performed by these types of entities.

Ground Transportation Industry Rail Transportation
Sector Notebook Project September 19978
III.A.2. Industry Size and Geographic Distribution
Industry Size
Variations in facility counts occur across data sources due to many factors,including reporting and definition differences. This document does notattempt to reconcile these differences, but rather reports the data as they aremaintained by each source.
The Interstate Commerce Commission (ICC) was the Federal agency thatregulated many economic aspects of the rail industry. The ICC was abolishedby an act of Congress in December 1995, with remaining essential functionstransferred to a newly created Surface Transportation Board (STB) within theDepartment of Transportation. ICC statistics reported prior to the ICC'sabolishment are referenced in this document. The ICC classified railroadsbased on their level of operating revenue. The levels are adjusted annuallyto reflect inflation. For 1994, the revenue threshold for Class I railroads was$255.9 million or more; Class II railroads had revenues of between $20.5million and $255.8 million; and Class III railroads had revenues of less than$20.5 million. Since 1979, the ICC required reporting on financial andoperating information from Class I railroads only. Class I railroad systemsmake up approximately two percent of the number of American railroads, butaccount for 73 percent of the mileage operated, 89 percent of the employees,and 90 percent of freight revenue in the industry. To fill the gap ininformation left by the ICC’s decreased reporting requirements, theAssociation of American Railroads (AAR) annually surveys non-Class Irailroads.
The AAR defines non-Class I railroads as being either regional or local (incontrast to the ICC definitions, which were based strictly on revenue). In1994, regional railroads were defined as line-haul railroads operating at least350 miles of road and/or earning revenue between $40 million and $255.9million. Local railroads included those line-haul operations not meeting theregional criteria, plus switching and terminal railroads. Exhibit 1summarizes the operating information for Class I, regional, and localrailroads. Exhibit 2 depicts the relationship between line-haul railroads andswitching and terminal railroads.

Switching and TerminalRailroads
Line-haulRailroads
Ground Transportation Industry Rail Transportation
Sector Notebook Project September 19979
Exhibit 1Facility Size Distribution of Rail Industry
Railroad Number Miles Operated Year-End FreightEmployees Revenue
Class I 12 123335 189,240 $29,930,893Regional 32 19842 10,701 $1,744,893
Local 487 25599 13,070 $1,422,285Total 531 168776 213,011 $33,098,071
Source: Compiled from Railroad Facts (Association of American Railroads, 1995).
Exhibit 2Line-Haul and Switching and Terminal Railroads
Geographic Distribution
Reflecting the national importance of railroad transportation, the rail industryis widely dispersed, and the rail system passes through every State in thecountry. Due to the nature of its operations, however, the rail industry is notcharacterized on a State-by-State basis, but rather by dividing the country intotwo halves, separated by the Mississippi River. Freight train-miles measurethe movement of a train the distance of one mile, and are based on thedistance between terminals and/or stations. Of the 440,896,000 total freight-train miles in the U.S. in 1994, 281,347,000 (64 percent) are West of theMississippi and 159,549,000 (36 percent) are East of the Mississippi. Exhibit3 illustrates the miles of track associated with major rail routes in the UnitedStates.

432
0
189948
37
791
2263,203
3,633
2,602
2,692
2,415
4,367
2,387
0
2,0322,335
6,986
4,416
2,456
3,451
2,055
2,253 3,903
2,138
3,325
00
2,060
1,785
3,480
1,171
1,868
2,847
4,458
3,235
3,256
4,500
10,4132,608
3,2742,266
0
1,970 1,649
1,4241,348
1,407
5,435
0
2,766
Ground Transportation Industry Rail Transportation
Sector Notebook Project September 199710
Exhibit 3Geographic Distribution of Railroads in the United States:
Mileage of Class I Railroads*
III.A.3. Economic Trends
The rail industry began to recover from a period of nearly 25 years of steadyeconomic decline in 1980, with the passage of the Staggers Act. Thislegislation allowed railroad managers to restructure internal operations andmeet competitive pressures. The Staggers Act authorized railroads to offercontract rate volume discounts for guaranteed shipments. The railroad isassured minimum volumes, which assists in capital budgeting and operationsplanning.
The railroad industry rebounded from the effects of widespread flooding in1993 to post improved financial and operational results in 1994. Class Irailroad traffic in 1994 increased 8.2 percent from 1993 to 1.201 trillionrevenue ton-miles, reflecting increases in tons originated and longer averagehauls. American railroads accounted for 39.2 percent of total inter-cityrevenue freight ton-miles.
Operating revenue rose 6.9 percent in 1994 to $30.8 billion, while operatingexpenses rose at a less rapid rate of 4.1 percent to $25.5 billion. Net railwayoperating income (defined as operating revenue minus the sum of operatingexpenses, current and deferred taxes, and rents for equipment and jointfacilities) was $3.4 billion, an increase of 34.7 percent over 1993 figures.

Ground Transportation Industry Rail Transportation
Sector Notebook Project September 199711
Traditionally, the largest segment of railroad freight has been coal. In 1994,coal accounted for 39.1 percent of total tonnage and 21.7 percent of freightrevenue. Other major rail commodities in 1994 included chemicals and alliedproducts, motor vehicles and equipment, food and kindred products, and farmproducts. Exhibit 4 summarizes the tons originated and revenue associatedwith the shipment of commodities by Class I railroads in 1994.
Exhibit 4Tons Originated and Revenue by Commodity — 1994*
TONS ORIGINATED REVENUE
Commodity Group Tons Percent of $(millions) Percent of(thousands) Total Total
Coal 574,213 39.1 7,021 21.7Chemicals & Allied Products 142,931 9.7 4,559 14.1Farm Products 130,992 8.9 2,407 7.4Non-metallic Minerals 106,404 7.2 862 2.7Food & Kindred Products 87,710 6 2,427 7.5Lumber & Wood Products 54,192 3.7 1,421 4.4Primary Metal Products 47,799 3.3 1,165 3.6Stone, Clay & Glass Products 42,257 2.9 1,009 3.1Petroleum & Coke 41,564 2.8 928 2.9Metallic Ores 40,367 2.7 378 1.2Pulp, Paper & Allied Products 36,583 2.5 1,510 4.7Waste & Scrap Materials 36,527 2.5 655 2Motor Vehicles & Equipment 27,792 1.9 3,174 9.8All Other Commodities 100,666 6.8 4,909 15.1TOTAL 1,469,997 100 32,424 100
*Information is for Class I railroads only.Source: Railroad Facts (Association of American Railroads, 1995).
The 1990's saw an increase in the efficiency of railroads, the transport ofdifferent materials such as waste and scrap materials, and a shift from boxcarto the faster intermodal container transport. Intermodal is a term used todescribe containerization of freight for easy transloading to different modesof transportation. For example, the same container may be transferred froma truck to a train, with both modes of transportation equipped with locks orother mechanisms to hold the container in place. In rail transport, there is agrowing use of truck containers and trailers.

Ground Transportation Industry Rail Transportation
Sector Notebook Project September 199712
III.B. Operations in the Rail Transportation Industry
This section provides an overview of commonly employed operations in therailroad industry. This discussion is not exhaustive; the operations discussedare intended to represent the major sources of environmental hazards fromrailroad transportation practices. These operations are grouped into threecategories: rail car refurbishing and maintenance; locomotive maintenance;and transportation operations. Rail car refurbishing and maintenanceoperations consist of cleaning the interiors and exteriors of the rail cars,striping and painting the rail cars, and maintaining/repairing rail car parts.Locomotive maintenance operations include the cleaning, repair, andmaintenance of the engine and locomotive car. Transportation operationsinclude all activities associated with the movement of locomotives and carsover a section of track, including the loading and unloading of freight.
III.B.1. Rail Car Refurbishing and Maintenance
Rail car refurbishing and maintenance consists of cleaning the interiors andexteriors of rail cars, refurbishing operations (i.e., striping and painting railcars), and other maintenance operations (i.e., brake and wheel set repair).
The initial cleaning of rail cars involves two steps: a mechanical cleaning anda water wash. Mechanical cleaning is the physical shaking and vibrating ofthe rail cars to loosen dirt and other debris. Typically, dirt and debris fallthrough a steel grate in the floor of the maintenance facility and areintermittently collected for disposal. The wash step usually consists of a highpressure water cleaning, collection of wastewater, and wastewater treatmentat an on-site treatment facility.
Refurbishing operations are not employed at all rail facilities. Many railroadestablishments contract out refurbishing work. Refurbishing operationsusually start with paint removal using a steel grit blast system or othermethod. Paint chips and grit are collected through a steel grate in the floorand the mixture is conveyed to a cyclone and filter system for separation ofreusable grit and paint. Once the original paint has been removed from therail cars, new paint is applied to the clean rail car surface.
Rail cars have brakes and wheel sets that must be maintained and sometimesrepaired or replaced. Brake and wheel set maintenance and repair operationsconsist of disassembly, cleaning, and repair; or disassembly and replacementof damaged parts. When wheel sets and air brakes are to be replaced orrebuilt, the cars must first be disassembled. Axles that can be reused arewashed in a caustic solution to remove grease and dirt. External debris isremoved from the air brakes or wheels using a grit or bead blast system orother method. Parts cleaning may also include the removal of paint and

Ground Transportation Industry Rail Transportation
Sector Notebook Project September 199713
cleaning with solvents or caustics. Repaired brakes or wheel set may requirerepainting with spray guns.
III.B.2. Locomotive Maintenance
Locomotive maintenance includes, but is not limited to, the followingoperations: brake repair; large scale equipment cleaning operations (e.g.,locomotive car); small scale cleaning operations (e.g., engine parts);hydraulic system repair, locomotive coolant disposal, metal machining, oilfilter replacement and used oil management, painting and metal finishing,paint stripping, and spent battery management.
Locomotive maintenance operations usually take place at facility that isowned and maintained by the railroad. Most used oil is recycled or reused inenergy recovery. Most locomotive batteries are recycled.
III.B.3. Transportation
Transportation operations include all activities associated with the movementof locomotives and cars over a section of track. These activities includefueling and hazardous material transport.
III.C. Raw Material Inputs and Pollution Outputs
III.C.1. Rail Car Refurbishing and Maintenance
Pollutant outputs from rail car refurbishing and maintenance are generally inthe form of wastewater from preliminary cleaning of interiors and exteriors,and hazardous wastes generated from painting, paint removal, and thecleaning of parts. Exhibit 5 shows typical hazardous wastes generatedincluding: spent solvents and solvent sludges; spent caustics and causticsludges; paint chips; and paint sludges. Volatile organic compound (VOC)air emissions are also generated during the use of solvents and paints.Wastewater from preliminary cleaning of the rail cars and spent causticsolution is often treated in an on-site wastewater treatment system and thendischarged to a publicly owned treatment works (POTW). Hazardous wastesare typically drummed and shipped off site as RCRA hazardous waste. Spentsolvents, however, can be sent off site for reclamation. Brake and wheel setrepair is not a significant environmental hazard, but discarded brake shoesmay be regulated under the Resource Conservation and Recovery Act(RCRA) in some States.

Ground Transportation Industry Rail Transportation
Sector Notebook Project September 199714
Exhibit 5Rail Car Refurbishing and Maintenance Process Material Input/Pollutant Output
Process Material Input WasteOil and Grease Degreasers, engine cleaners, Ignitable wastes, spent solvents,Removal aerosol, solvents, acids/alkalies combustible solids, waste acid/alkaline
solutions, used oilCar and Equipment Degreasers, solvents, Ignitable wastes, spent solvents,Cleaning acids/alkalies, cleaning fluids combustible solids, waste acid/alkaline
solutions, ragsRust Removal Strong acids, strong alkalies Waste acids, waste alkaliesPaint Preparation Paint thinners, enamel reducers, Spent solvents, ignitable wastes, ignitable
white spirits paint wastes, paint wastes with heavymetals, rags
Painting Enamels, lacquers, epoxies, Ignitable paint wastes, spent solvents,alkyds, acrylics, primers paint wastes with heavy metals, ignitable
wastes, ragsSpray Booth, Spray Paint thinners, enamel reducers, Ignitable paint wastes, heavy metal paintGuns, and Brush solvents, white spirits wastes, spent solventsCleaningPaint Removal Solvents, paint thinners, enamel Ignitable paint wastes, heavy metal paint
reducers, white spirits wastes, spent solvents, ragsSource: U.S. EPA Office of Solid Waste, 1993.
III.C.2. Locomotive Maintenance
Each of the locomotive maintenance operations listed above is a potentialsource of pollution outputs. Following are brief discussions of the wastesthat can be generated by these locomotive maintenance operations.
Brake Repair
Brake repair does not pose a significant environmental hazard, but discardedbrake shoes may be regulated under RCRA in some States. Some older brakeshoes contain asbestos and may require special disposal.
Cleaning Operations
Sludges created as a result of cleaning operations may be characterized ashazardous. If so, hazardous waste regulations must be complied with priorto disposal. Waste waters from locomotive cleaning can contain elevatedlevels of oil, grease, suspended solids (a measure of particulate matter inwater) and pH (acidity or alkalinity of water). These substances are regulatedwater pollutants, so wash waters must be processed in a way that is consistentwith Clean Water Act (CWA) requirements. In most cases, the State hasauthority for enforcement of CWA provisions and permit administration.Treatment of wash waters may be required before release to a local sewersystem or an outfall regulated by a National Pollutant Discharge Elimination

Ground Transportation Industry Rail Transportation
Sector Notebook Project September 199715
System (NPDES) permit. The type of cleaning solution used may also posean environmental concern. If mineral sprits or other chemicals are used toclean equipment, a variety of environmental compliance issues may result.Mineral sprits are hazardous substances that have environmental compliancerequirements for storage, handling, and disposal.
Hydraulic System Repair
Used hydraulic fluids are listed as used oils under RCRA. The majorcompliance issues associated with hydraulic system repair involve handlingand disposing of the hydraulic fluid, spill containment, and storage. Environmental damage can occur from waste oil seepage into the soil, wasteoil run-off into water bodies during storms, and other contamination methods.
Coolant Disposal
Locomotive cooling systems do not contain automotive type ethylene glycol-based antifreeze. Because of this, locomotive cooling systems may need tobe drained when engines are shut down during road operation in coldweather. Failure to do so can result in serious engine damage due to freezingof the coolant. To protect the cooling system from corrosion, locomotivecoolants contain a dilute additive package, which is basically a mixture ofsodium borate and sodium nitrate. The additive package usually contains adye, to help identify leaks and ensure the cooling system is protected. Thecompounds are diluted in the cooling system to approximately one to threepercent. The concentrations of the individual corrosion inhibitors is afraction of one percent. Used coolant must be disposed of properly.
Metal Machining
Metal machining and punching can generate regulated wastes that maycontaminate the environment from direct release into water or fromstormwater runoff. Pollutant-carrying stormwater runoff may violate theCWA. Coolants from metal multi-punch operations may be regulatedsubstances under RCRA or local waste regulations and may require specialhandling.
Oil Filter Replacement and Used Oil Disposal
A variety of environmental issues need to be considered when performing anyoil handling activities such as oil changes or oil filter replacement tolocomotives. Oil can drip or spill during maintenance and repair operations,particularly during oil filter replacement operations. Oil releases to theenvironment from oil drippage can also occur during locomotive tie-up. Oilfilter and used oil replacement are generally conducted indoors at locomotivemaintenance facilities and locomotive idling is conducted, to the extent

Ground Transportation Industry Rail Transportation
Sector Notebook Project September 199716
practical, over track pans, absorbent materials, or other collection devices.This makes it possible for most facilities to collect used oil and oil filtersbefore they leak or spill oil into the environment. Some facilities have routedtrack pan drains to oil-water separation systems. Used oils are not typicallycategorized as hazardous wastes under RCRA, but used oils have strictdisposal requirements in some States.
Painting
Painting operations can be significant sources of environmental harm. Airpollution from the evaporation of chemicals contained in the paint (e.g.,solvents) can contribute to smog and worker health and safety problems.Solid and hazardous wastes from the painting process (e.g., paint-coveredcloths) may contaminate water and soil if not disposed of properly. Whetherhazardous wastes are generated during painting depends upon the type ofpaint applied. Typically, latex paints and related paint wastes are classifiedas non-hazardous. Ignitable or solvent-based paint or paint thinner wastes areclassified as hazardous. Air pollution issues are typical concerns only forlarge-scale painting operations involving paint booths and associated airducting.
Battery Storage and Disposal
Used battery storage and disposal can be a significant environmental liabilityfor railroads since many spent signal batteries are classified as hazardouswastes under RCRA. Most locomotive batteries are lead acid and recycledas non-hazardous solid waste.
III.C.3. Transportation Operations
The three main transportation operations that pose potential environmentalproblems are fueling, hazardous material transport, and oil and coolantreleases during transport.
Fueling Operations
Air pollution and fuel spillage are the major environmental concernsassociated with fueling operations. While air emissions are a problem forvolatile petroleum products such as gasoline, the railroad industry uses verylittle gasoline on site. Their largest fuel product is diesel fuel, which is lessvolatile. If gasoline is dispensed on site, it could contribute to local airquality problems, and may require permitting and control. Spilled fuel maycontaminate soil, ground water, or water bodies. Some super tanker fuelingsystems deliver fuel at approximately four gallons per second, so even a smallconnection malfunction can result in a large spill event. Filling andmaintenance of fuel storage may require air quality permitting in some States.

Ground Transportation Industry Rail Transportation
Sector Notebook Project September 199717
Hazardous Materials
The spilling/leaking of hazardous materials is a significant environmentalconcern for the rail industry. According to DOT statistics, approximately 16percent of all hazardous material releases to the environment in 1988 werefrom rail transport. In addition to being harmful to the environment,hazardous material spills and releases are subject to a variety ofenvironmental regulations and may result in costly cleanups or fines.
Valve leakage or safety valve releases can be sources of material spills onpressurized and general service tank cars or other hazardous materialcontainers such as covered hoppers, intermodal trailers/containers, or portabletanks. These leaks can manifest themselves as odors or vapors clouds fromtanker top valves; spraying or splashing from the tanker top valves; wetnesson the side of the car; or drippage from the bottom outlet valve. Inintermodal cars, spills/leaks can result from improper packing and resultantload shifting during transport. Intermodal container doors and other openingscan be spill/release sources. Unloading and transfer facilities are highpotential spill and release areas. It should be noted that it is the responsibilityof the shipper to properly secure the transportation vehicles to prevent thesetypes of occurrences. In the latest effort to identify the source of these leaks,in 1995 the Association of American Railroads (AAR) introduced the non-accident release (NAR) program. The purpose was to identify and reportthese releases so that corrective measures could be taken to reduce them.
If hazardous materials are transported, DOT requirements regulate carinspections, car placement, switching, and shipping papers (e.g., waybills,manifests). If hazardous materials pass through a facility, rail containersshould be inspected for proper labeling, valve cover placement, any signs ofleakage, proper car stenciling, and fulfillment of other DOT requirements.Placarding and/or labeling is required for all containers carrying hazardousmaterials.
Oil and Coolant Releases
Oil and coolant releases from the locomotive engine to the environment canoccur during transport operations. Oils can contaminate surface water,ground water, and soil, and expose the rail facility to punitive fines fromviolations of a variety of environmental statutes. Coolants may be regulatedsubstances under RCRA or local waste regulations.

Page 18 intentionally left blank.

Ground Transportation Industry Trucking
Sector Notebook Project September 199719
IV. TRUCKING
IV.A. Characterization of the Trucking Industry
IV.A.1. Industry Characterization
Construction of the nation’s first transcontinental highway, the LincolnHighway (U.S. 30), started in 1912. It took 20 years to complete the 3385-mile road between New York City and San Francisco. In 1956, the FederalAid Highway Act was signed into law, authorizing the 41,000-mile NationalSystem of interstate and defense highways to be completed by 1972 at a costof $42 billion. In 1982, landmark legislation boosted Federal spending forhighway construction and repair work. By 1986, more than 97 percent of the42,500-mile interstate highway system was open to traffic as the programentered its 30th year. The system represented a total Federal and Stateinvestment of more than $120 billion. Currently, there are 44,700 miles ofinterstate highways with 132,000 miles of other arteries in the United States.
The types of trucks that travel these roads are diverse, ranging from smallpickup trucks to large tractor trailer combination units. Methods ofquantifying these vehicles vary as well. This section presents informationfrom a variety of sources, including the Census Bureau and truckingassociations. Different groups use various benchmarks to quantify thetrucking industry. This document does not attempt to reconcile thesedifferences, but rather reports the data as they are maintained by each source.
According to the American Trucking Associations (ATA), the total numberof commercial trucks in 1993 was 16.2 million, with approximately 3.9million commercial trailers registered in the same period. The ATA reports322,739 interstate motor carriers on file with the U.S. Department ofTransportation (DOT) as of January 5, 1995. Eighty-two percent of thoseoperate fewer than six trucks, and 96 percent operate 28 or fewer trucks.59,310 for-hire carriers were authorized by the Interstate CommerceCommission (ICC), to haul goods.
Types of trucks and trucking establishments are defined by variousclassifications. Exhibit 6 shows the shape and size of different truck types.This diagram does not include smaller trucks such as pickups, panels, vans,and utility trucks which are usually not counted in industry statistics becausethey are often used for personnel purposes.
In general, trucking establishments falls into two broad categories: privateand for-hire. Private carriers are shippers, manufacturers, merchants, andothers who use their own vehicles or leased trucks under their direct controlfor moving their own goods. For-hire carriers are compensated for providingtransportation of freight belonging to another entity.

Ground Transportation Industry Trucking
Sector Notebook Project September 199720
Exhibit 6Truck Types

Ground Transportation Industry Trucking
Sector Notebook Project September 199721
There are three types of interstate for -hire carriers: common, contract, andexempt carriers. Common carriers transport freight for the general public atpublished rates. Contract carriers are those in stipulated types of operations,such as trucks used only to carry newspapers, or vehicles used incidentally tosupport air transport. (Motor Trucking Engineering Handbook, James W.Fitch, Society of Automotive Engineers, 1994).
For-hire carriers regulated by the ICC were classified by size of operatingrevenue. The ICC was abolished by an act of Congress in December 1995,with remaining essential functions transferred to a newly created SurfaceTransportation Board (STB) within the Department of Transportation. ICCstatistics reported prior to the ICC’s abolishment are referenced in thisdocument. As of January 1, 1994, the ICC defined Class I carriers as thoseestablishments with annual revenues greater than $10 million, Class IIcarriers with annual revenues between $3 and $10 million, and Class IIIcarriers with annual revenues of less than $3 million.
IV.A.2. Industry Size and Geographic Distribution
As discussed in Section IV.A.1 above, variation in facility counts occuracross data sources due to many factors, including reporting and definitiondifferences. This document does not attempt to reconcile these differences.
Industry Size
Trucking companies are diverse, ranging from large employers to privatetransporters who work for themselves and have no additional employees. Aconcise discussion of the trucking industry is complicated by the differentmethods used by the Census Bureau, the ICC, and trucking associations toestimate the size of the trucking industry. In some cases, as with most censusdata, only those companies with payrolls – those that pay drivers who werenot also owners – are tracked. In addition, only those trucking companiesformerly regulated by the ICC were required to report data.
The trucking industry consists of approximately 111,000 establishments withpayrolls, employing nearly 1.6 million people. This does not include small,independent truckers who have no employees other than themselves. Thetotal number of truck drivers holding commercial drivers licenses as of June1995 exceeded 6.5 million. In 1993, these drivers drove 656.6 billion miles(American Trucking Trends, 1995). According to the American TruckingAssociations (ATA), 7.8 million people were employed throughout theeconomy in jobs that relate to trucking activity and 2.8 million heavy-dutytruck drivers (including linehaul, local, courier, government, etc.) wereemployed in 1994. In 1993, $226.9 billion was paid in wages relating totrucking activity.

Ground Transportation Industry Trucking
Sector Notebook Project September 199722
Over 88 percent of trucking companies are small businesses, as defined bythe Small Business Administration. According to the ATA, of the 359,787interstate motor carriers on file with the Office of Motor Carriers, 82 percentoperate six or few trucks, while 96 percent operate 28 or fewer trucks (as ofFebruary 1996).
Exhibit 7 illustrates the facility size distribution for those motor freighttransportation and warehousing facilities with payrolls, based on the latestcomplete Census Bureau data (1992).
Exhibit 7Facility Size Distribution of Trucking Industry*
Industry SIC Total Employees Total Number Employees perCode of Facilities Facility
Local Trucking Without 4212 354,742 49,870 7.11Storage
Trucking, Except Local 4213 758,435 40,821 18.6
Local Trucking with Storage 4214 64,417 4,512 14.3
Courier Services, Except by 4215 307,061 5,966 51.5Air
Farm Product Warehousing 4221 6,497 584 11.1and Storage
Refrigerated Warehousing 4222 18,963 929 20.4and Storage
General Warehousing and 4225 49,091 6,753 7.3Storage
Special Warehousing and 4226 20,594 1,452 14.2Storage, NEC*
Terminal and Joint Terminal 4231 295 21 14.1Maintenance Facilities forMotor Freight Transportation
Total 1,580,095 110,908 14.2
Source: Compiled from official 1992 statistics of the U.S. Bureau of the Census.*Facilities with payrolls only.
As demonstrated in Exhibit 7, the majority of establishments and employeesin the trucking industry which maintain payrolls are classified in SIC Code4212, Local Trucking Without Storage. This category includes dumptrucking, general freight, and garbage and trash collection. Trucking, exceptlocal (SIC 4313), accounts for most of the other establishments and personsemployed in the trucking industry. General freight trucking accounts formost trucking industry facilities.

1,1363,874
15,266
7,811
7,912
1,136
486
9,789
20,727
12,188
3,968
10,280
25,912
21,607
2,944
7,04811,176
21,714
13,825
13,363
13,026
10,682
5,778 12,460
4,943
8,566
2,0891,240
25,524
1,128
4,768
2,562
2,205
7,364
5,298
8,538
6,025
11,771
36,1247,338
2,2142,466
0
6,110 2,950
1,5171,517
5,295
43,313
1,114
7,762
Ground Transportation Industry Trucking
Sector Notebook Project September 199723
Geographic Distribution
Reflecting the national importance of highway transit, the trucking industryis widely dispersed, with every State reporting the existence of at least 400industry establishments (U.S. Bureau of the Census). The numbers in Exhibit8 include both businesses with and without payrolls. All businesses coveredby the economic censuses are included, except direct sales retail and taxexempt service businesses.
Exhibit 8Geographic Distribution of Trucking Industry Facilities
Source: Compiled from official 1992 statistics of the U.S. Bureau of the Census.
Although the trucking industry is highly represented throughout the country,motor freight facilities are most heavily concentrated around the Great LakesStates (Minnesota, Wisconsin, Illinois, Indiana, Michigan, and Ohio).Reflecting the important trade routes between these States and the Northeast,this concentrated area extends through Pennsylvania and New York. The fivelargest States in terms of number of trucking establishments with payrolls areCalifornia, Texas, Ohio, Florida, and New York.

7 8 .6
7 .95 .2 4
2 .2 2 .1
0
10
20
30
40
50
60
70
80
T ruck Rail W a te r A ir P ip e lin e O t h er
Perc
ent o
f Rev
enue
.0
Ground Transportation Industry Trucking
Sector Notebook Project September 199724
Exhibit 8 illustrates the number of trucking establishments as recorded by theBureau of the Census. These numbers do not correlate to those presented inExhibit 9, also from the Bureau of the Census, due to the different scope ofthe census data.
Exhibit 9Share of Freight Revenues by Mode of Transportation
Source: American Trucking Trends, 1995
IV.A.3. Economic Trends
In terms of revenue, trucking accounts for the vast majority of total U.S.freight services. Exhibit 8 illustrates the trucking industry’s enormous shareof total freight revenue. This reflects trucking’s higher revenues-per-ton andper-ton mile (a ton-mile equals the movement of one ton of weight over a onemile distance), compared to the rail and barge sectors, which generally carrylower-valued bulk commodities. Thus, the trucking industry’s share of tonsshipped (43 percent) and ton-miles (27 percent) is much lower than its shareof revenues (U.S. Industrial Outlook 1994 – Transportation).
The growing use of rail transport and rail transport of truck containers andtrailers has offered economic competition to motor freight companies.According to the ATA, by the year 2003, trucking will lose 1.9 percent of itsshare of total 1993 revenue – primarily to air and rail intermodal – but truckswill still account for 76.7 percent of freight transportation revenue.

Ground Transportation Industry Trucking
Sector Notebook Project September 199725
Reportedly, the estimated profit margin of the companies and independenttruckers averages one to two percent.
The following economic information is from the Census Bureau’s 1993Motor Freight Transportation and Warehousing Survey Report. As with thecensus data conveyed in Exhibit 7, this survey excludes private motor carriersthat operate as auxiliary establishments to non-transportation companies, aswell as independent owner-operators with no paid employees. As a result,the dollar volume estimates and estimates of year-to-year percentage changepresented in this report should not be interpreted as representingmeasurements of total trucking industry activity.
Revenue in 1993 for the for-hire trucking and courier services industry(excluding air courier services) was estimated at $135.9 billion, up sixpercent from 1992. Long-distance trucking, which accounted forapproximately 75 percent of all motor carrier revenue, was up 5.6 percentover 1992. Local trucking revenue rose 9.6 percent from 1992 toapproximately $31.6 billion in 1993. Truckload shipments accounted forapproximately 61 percent of motor carrier revenue in 1993 and increased 6.8percent from 1992.
Nearly 48 percent of motor carrier revenue comes from transportingmanufactured products, such as furniture, hardware, glass products, textilesand apparel, and the delivery of small packages. Revenue in 1993 from thetransport of metal products rose 8.8 percent from 1992. Expenses totaled$127.9 billion in 1993, up 5.8 percent from 1992. Revenue for the courierservices industry, excluding air courier services (SIC 4215), rose 7.7 percentin 1992 to approximately $20.2 billion in 1993. The Truck Inventory andUse Summary (TIUS), part of the Census Bureau’s Census of Transportation,provides data on the physical and operational characteristics of the U.S. truckpopulation. According to TIUS, an increasing proportion of trucks are beingused mainly for “personal transportation,” i.e., commuting to work, outdoorrecreation, etc. In 1992, almost 70 percent of all trucks were identified asbeing for personal use; in 1987 the proportion was 66 percent, and in 1982only 57 percent.
Annual payroll accounted for approximately 33 percent of all truckingexpenses, totaling $41.5 million for 1993. Purchased transportation rose 7.6percent from 1992, while the cost of fuels and maintenance and repairexpenses rose 6.7 percent and 7.0 percent, respectively.
Public Warehouse Services
Total operating revenue for public warehousing services increased 8.6 percentfrom 1992 to $8.1 billion. Total operating expenses rose 8.4 percent from

Ground Transportation Industry Trucking
Sector Notebook Project September 199726
1992 to $6.8 billion. Employer contributions to employee benefit plans wereup to 7.2 percent and represented almost eight percent of the warehousingindustry’s total operating expenses.
Over 50 percent of all revenue was from general warehousing and storage(SIC 4225). Revenue from refrigerated warehousing and storage (SIC 4222)increased 3.3 percent to $1.7 billion, and accounted for 21 percent of thewarehousing industry’s total operating revenue in 1993.
Revenue in 1993 for farm product warehousing and storage (SIC 4221),which represents approximately eight percent of the warehousing industry’stotal operating revenue, increased 9.2 percent to $686 million from 1992,while expenses for the industry were up 7.8 percent to $593 million over thesame period.
IV.B. Operations in the Trucking Industry
This section provides an overview of commonly-employed processes withinthe trucking industry, broken down by operations. This discussion is notexhaustive; the operations discussed here are intended to represent the majorsources of environmental hazards from trucking operations. The operationsdiscussed include materials transport, truck maintenance, truck washing, tanktruck cleaning, and transport operations.
IV.B.1. Truck Terminals and Maintenance Facilities
Many segments of the trucking industry operate their own truck terminals andmaintenance facilities. Truck terminals are places where trucks come toconsolidate and transfer loads of shipped goods. Terminals typically havelarge parking and staging areas for tractors and trailers, and a loading dock,from which freight is moved between trailers. Truck maintenance facilities,which may be located on the same property as the maintenance facilities,which may be located on the same property as the terminals, perform routinevehicle maintenance activities which are similar to those performed in theautomotive service industry. These activities include replacement of fluids(e.g., motor oil, radiator coolant, transmission fluid, brake fluid), replacementof non-repairable equipment (e.g., brake shoes/pads, shocks, batteries, belts,mufflers, electrical components, water pumps),and repair of fixableequipment (e.g., brake calipers/rotors/drums, alternators, fuel pumps,carburetors). Some maintenance terminals also have fueling facilities, repairvehicle bodies, wash trucks, and perform painting operations.
Truck maintenance involves the regular changing of a number of fluids.Automotive fluids used to maintain trucks include brake fluid, transmissionfluid, gear oil, radiator fluid, and motor oil. Truck parts removed for repairoften require cleaning to allow for better visual inspection of the parts and to

Ground Transportation Industry Trucking
Sector Notebook Project September 199727
remove contaminated lubricants/greases that would lead to early failure of therepaired part. Rags are often used to clean up a fluid spill or to wipe greasefrom a part being repaired. If necessary, clean lubricants/greases are appliedto the parts during reassembly.
Parts cleaning often involves the use of a parts washer. Washers used in thetrucking industry include solvent parts washers, hot tanks, and jet spraywashers. A solvent parts washer recirculates solvent continuously from thesolvent drum to the solvent wash tray where the parts are cleaned. Oldsolvent is typically replaced with fresh solvent on a monthly basis. Thesolvents used for parts cleaning contain petroleum-based ingredients ormineral spirits. Carburetor cleaner contains methylene chloride. Electricallyheated tanks are also used to clean parts. Parts are placed in a tank of hotaqueous detergent or caustic solution to achieve cleaning and air ormechanical agitation is employed to increase cleaning efficiency. Jet spraywashers also use hot aqueous solutions for cleaning, but in this application,rotating jets spray the parts with cleaner. Both hot tanks and jet sprays areusually serviced monthly by removing the spent cleaner and sludge andrecharging the washer with fresh detergent. Sludge that accumulates in thewaste sump of the pressure spray cleaning bays and in area wash-downclarifiers is often taken off site to a local municipal landfill.
Truck maintenance facilities may also perform fueling operations. Fuelingfacilities typically dispense diesel fuel. Exhibit 10 shows the layout of atypical truck maintenance facility.

Ground Transportation Industry Trucking
Sector Notebook Project September 199728
Exhibit 10Typical Trucking Maintenance Facility
Source: Stormwater Pollution Prevention Manual for the Trucking Industry ATA, 1993

Ground Transportation Industry Trucking
Sector Notebook Project September 199729
IV.B.2. Truck Washing
Trucks can be washed manually or by using a fixed wash bay system. Drywashing, by using dry rags and a spray bottle, can be an option for manualtruck washing. Manual washing includes hand-held wash systems, hand-heldwand systems, and hand brushing with soap. Fixed bay washing operationsinvolve fixed equipment, such as drive-through wash racks or gantry washsystems. Typically, wash bay systems include chemical storage facilities,chemical and water application arches, water reclamation systems, and wastewater treatment systems.
IV.B.3. Tank Truck Cleaning
Tank trucks typically haul a wide range of liquid and dry bulk commodities,including food-grade products such as milk and corn syrup, and industrialprocess chemicals. Many aspects of transportation and labeling, as well asspills and releases of these materials, are regulated by the Research SpecialPrograms Administration (RSPA) of the DOT. Because the material beingtransported is loaded directly into a tank truck without any sort of container,these trucks require special cleaning to remove residual cargo. Washing,rinsing, and drying methods vary depending on the facility’s equipment, thelast cargo carried, and the next cargo to be carried. Some cargoes may requireonly a water rinse, while others may need a series of wash and rinse cyclesusing different wash solutions.
Prior to tank cleaning, residual cargo, or heel, is removed. Heel volume fromtank trucks is typically five to ten gallons (EPA Office of Water andPreliminary Data Summary for the Transportation Equipment CleaningIndustry, U.S. EPA, 1989, and EPA Office of Water, Engineering AnalysisDivision, 1995). Heel can be sent to an off-site Treatment Storage andDisposal Facility (TSDF) or can be treated on site if it is an aqueous solution.If organic, it may be put into containers for later treatment as a hazardouswaste.
Tank truck washing is performed either manually with hand-held sprayers,or automatically with high pressure spinner nozzles or “butterworths.” Withautomatic washing, high pressure spinner nozzles are inserted through themain tank hatch, and wash solution and rinse water is automatically sprayedonto the tank surface at 100-600 p.s.i. while rotating around vertical andhorizontal axes.
Washing solution may consist of detergent solution, caustic solution, organicsolvents, or steam. Any wash solution can be used with either the manual orautomatic washing method, although worker safety is a concern whenmanually spraying solvent and caustic wash solutions. Some facilities havethe capability to recycle washing solutions within a closed system, and

Ground Transportation Industry Trucking
Sector Notebook Project September 199730
periodically change to fresh water solutions. Tanks can be rinsed with hot orcold water, and dried with passive or forced air.
IV.B.4. Transport Operations
Transport operations refer to all operations performed by a truck while on theroad. These operations include loading and unloading cargo, running thetruck engine, and fuel consumption. Commercial trucking transportationoperations consumed approximately 36 billion gallons of oil in 1993, orabout 63 percent of total U.S. consumption. This figure, according to theATA, includes 23 billion gallons of diesel fuel and 13 billion gallons ofgasoline.
IV.C. Raw Material Inputs and Pollution Outputs
IV.C.1. Truck Terminals and Maintenance
Materials Spills and Releases
In truck terminals, spills and releases of hazardous material shipments are themain environmental issue of concern. Hazardous waste transportation is ahighly regulated and specialized segment of the trucking industry, covered byextensive EPA (40 CFR) and DOT (49 CFR) regulations while the waste isin transit. Due to the additional insurance and safety requirements, themajority of general freight trucking companies do not have the authority nordesire to transport hazardous waste.
Truck Maintenance
Maintenance facilities handle vehicle fluids that are used during normaltrucking operations, including oil, transmission fluid, brake fluid, andantifreeze. The quantities of waste materials vary depending on the size ofthe facility and the types of maintenance activities that are performed.
Oil, transmission fluid, and other liquids that are replaced, must be collectedand stored for later disposal. The storage, disposal, and transportation ofused oil is regulated by EPA and is a primary environmental concern in thetrucking industry. Generators of used oil must meet on-site managementstandards for storage prior to shipment off-site or burning on-site for energyrecovery. Storage containers must be in good condition without leaks andclearly labeled with the words “USED OIL.” If a release occurs (spill orleak), the generator must stop and contain the release, clean up and properlymanage the released used oil, and repair or replace any leaking containers.
Fluids such as antifreeze must be evaluated for hazardous waste

Ground Transportation Industry Trucking
Sector Notebook Project September 199731
characteristics and dealt with accordingly if spilled or released. Antifreezeconsists of water and ethylene glycol. Neither of these ingredientsdemonstrates hazardous waste characteristics, however, as a result of use, theantifreeze may become hazardous based on metals or benzene content.
Sludge that accumulates in the maintenance facility floor drains can containoil, grease, solvents, and dirt from routine operations. The hazardous/non-hazardous nature of the sludge will determine the applicable disposalregulations.
Truck Repair
Repair activities typically produce several types of waste materials in additionto the parts themselves (i.e., batteries, brake parts, etc.), including oil,coolants, and solvents. Oil rags can be considered a “used oil” waste. Shoprags which are used to wipe up a hazardous waste (i.e., paint thinner) may bea hazardous waste.
Spent lead-acid batteries are exempt from regulation as a hazardous wasteprovided they are recycled. Generators of spent lead-acid batteries may storeand/or transport those batteries without waste activity notifications or permitsas long as the batteries are ultimately reclaimed. In some States, a newbattery cannot be purchased without the return of a used battery.
Used tires are a significant waste produced at truck maintenance facilities.Old tires are not acceptable for landfill disposal unless they have beenshredded or quartered. Tires can be returned to a central location forprocessing or recycling. Used truck tires are usually retreaded or recycled.Used tires otherwise ready to be scrapped might be categorized as hazardouswaste.
Parts Washing
Parts washing solvents and residual liquids such as petroleum distillates,mineral spirits, and naphtha are all considered hazardous wastes due toignitability. Filters removed from parts whose units may also be hazardousdue to toxicity (presence of metals and/or benzene) and ignitability. Evenfilters which are not hazardous may still not be acceptable for landfilldisposal due to hydrocarbon content.
Air emissions occur when the solvent is sprayed onto parts and when partsare improperly drained of solvent. Many air quality control districts specifythat equipment cannot be designed so as to provide a fine spray mist (whichleads to high evaporation rates) and that parts must be properly drained beforeremoval from the washer. For washers in which the solvent bath is alwaysexposed to the atmosphere (i.e., wash tanks), the lid must be kept closed
Ground Transportation Industry Trucking
Sector Notebook Project September 199732
whenever the tank is not in use.
Fueling Operations
Fueling operations may result in fuel spills or releases. Waste diesel fuel maybe a hazardous waste because its flash point ranges from 120°F to 160°F andbecause it may contain concentrations of heavy metals and benzene in excessof regulatory limits. Diesel fuel spills and releases – both underground andabove ground – are a significant concern in the trucking industry in terms ofstormwater run-off and land contamination.
IV.C.2. Truck Washing
The waste streams generated by vehicle washing operations are variable. Ifvehicles are washed often, they enter the washing operation relatively clean,and the waste wash water generated is cleaner thana waste stream generatedfrom washing vehicles that are washed only occasionally. The technologyused to wash the vehicle will also affect the waste stream. For example, if atwo-step acid-detergent wash is used, acid or salts will be found in the wastestream that would not be present if the vehicle was steam cleaned. Seasonand location can also affect the waste stream generated, for example, vehiclesin the northeast often bring in heavy mud and road salt in the winter months.
Vehicle washing is a regulated maintenance activity under the NPDESprogram. Wastewater from vehicle washing and floor drain discharge isconsidered industrial waste. The hazardous or nonhazardous nature of thewastewater determines the applicable disposal regulations.
IV.C.3. Tank Cleaning
The primary pollutant output from tank cleaning operations is wastewatercontaminated with tank residues and cleaning solutions. Specific outputsinclude: spent cleaning fluids, fugitive volatile organic compound (VOC)emissions, water treatment system sludges, and tank residues. The quantitiesof these outputs vary widely from facility to facility depending on the type ofcargo and cleaning methods. For example, an independent owner/operatortank truck cleaning facility serving a large number of different users willgenerate wastewater containing many ore contaminants than a shipperoperated facility serving trucks all carrying the same cargo.
Tank heels from a shipment of hazardous waste greater than 0.3 percent ofweight of the tank capacity continue to be regulated by RCRA after thedischarge of the waste at a TSDF. Under current regulation, the use ofsolvents to further rinse out tanks is not considered treatment; however,certain State RCRA programs regulate these processes more stringently andshould be contacted to determine if a treatment permit is required.

Ground Transportation Industry Trucking
Sector Notebook Project September 199733
IV.C.4. Transport Operations
Transport operations have the potential to generate three types of waste: therelease or spill of a hazardous waste during loading and unloading operations;the spill or release of vehicle fluids such as oil or antifreeze during travel;and, most significant, the emissions generated during fuel combustion. Asdiscussed above, engines, especially those of heavy duty trucks, generateseveral forms of air pollution. Among common substances released to the airfrom truck engines are hydrocarbons, carbon monoxide, oxides of nitrogen,sulfur compounds, and particulate matter. A description of each of thesepollutants follows, while more information about EPA regulations governingemissions is provided in Section VII.
Hydrocarbons: Although hydrocarbon emissions are not problematic whenthey leave the vehicle, some hydrocarbons react in the atmosphere to promotethe formation of photochemical smog. Ozone concentration is generally usedto measure the extent of this photochemical reaction. Hydrocarbon emissionstandards have been set to meet the National Ambient Air Quality Standard(NAAQS) for ozone.
Exhibit 11Hydrocarbons Emission Sources
Hydrocarbons Emissions Source Percentage of TotalEmissions
Stationary Fuel Combustion 3.1%
Industrial Processes 13.3%
Passenger Cars - Gasoline Engine 17.8%
Light-Duty Trucks - Gasoline Engine 6.4%
Heavy-Duty Vehicles - Gasoline Engine 0.8%
Diesel Engine Vehicles 1.8%
Other 56.8%Source: ATA
Carbon Monoxide: Carbon monoxide (CO) is a byproduct of incomplete fuelcombustion. The chemical is a colorless, tasteless, odorless gas that displacesoxygen in the body. At high concentration in confined areas, CO can beinjurious to health. EPA has set a NAAQS and a vehicle emission standardfor CO.

Ground Transportation Industry Trucking
Sector Notebook Project September 199734
Exhibit 12Carbon Monoxide Emission Sources
Carbon Monoxide Emissions Source Percentage of Total Emissions
Stationary Fuel Combustion 7.1%
Industrial Processes 5.7%
Passenger Cars - Gasoline Engine 44.0%
Light-Duty Trucks - Gasoline Engine 14.5%
Heavy-Duty Vehicles - Gasoline Engine 2.9%
Diesel Engine Vehicles 1.9%
Other 23.8%Source: ATA
Nitrogen Oxides: Emissions of nitrogen oxides (NO ) are a significantX
contributor to the creation of nitrogen dioxide, and are ingredients in theformation of smog, although they play an ambiguous role in the process; attimes No appear to promote smog, while at other times they seem to inhibitx
smog in urban areas.
Exhibit 13Nitrogen Oxides Emission Sources
Nitrogen Oxides Emissions Source Percentage of TotalEmissions
Stationary Fuel Combustion 50.6%
Industrial Processes 3.8%
Passenger Cars - Gasoline Engine 15.2%
Light-Duty Trucks - Gasoline Engine 4.9%
Heavy-Duty Vehicles - Gasoline Engine 0.8%
Diesel Engine Vehicles 11.4%
Other 13.2%Source: ATA
Sulfur Compounds: Sulfur compounds are oxides that aggravate therespiratory system and may cause respiratory disease. Very dense smog isgenerally attributed to the buildup of SO and particulates during periods oflittle air movement. Motor vehicles of all types, including passenger cars,contribute only 4.2 percent of ambient sulfur compounds.

Ground Transportation Industry Trucking
Sector Notebook Project September 199735
Particulates: Particulates are particles of solid material that are products ofincomplete combustion, such as soot and fly ash. Small particles may remainsuspended in the air for long periods of time, while larger particles return tothe ground as dust. Suspended particles cause reduced visibility andincreased health hazards from other contaminants by providing a surface tocarry chemicals into human lungs.
Exhibit 14 summarizes the pollution outputs from those operations in thetrucking industry discussed in this document.
Exhibit 14Process Material Input/Pollutant Output from Trucking Operations
Activity Material Input Air Emissions Process Wastes
Truck Terminals and Motor oil, brake fluid, Possible CFC and Used oil, usedMaintenance Facilities transmission fluid, VOC emissions automotive fluids,
coolants, solvents, parts solvents, coolants,cleaning solutions, used rags, usedlubricants, truck cargo cleaning solutions,
spilled or releasedtruck cargo
Vehicle Exterior Detergent, caustic VOC emissions Oil and grease,Washing solution, organic solvents, suspended solids,
steam detergents, pH,metals
Tank Cleaning Residuals from VOC emissions Spent cleaning fluids,shipments, cleaning fluids water treatment– detergent, caustic system sludges, tanksolution, organic solvents, residuessteam
Transport Operations Gas and diesel fuels, Hydrocarbons, carbon Used oil, usedalternative fuels, motor monoxide, oxides of automotive fluids,oil, brake fluid, nitrogen, sulfur spilled or releasedtransmission fluid, compounds, truck cargocoolant, truck cargo particulates

Page 36 intentionally left blank.
Ground Transportation Industry Pipelines
Sector Notebook Project September 199737
V. PIPELINES
V.A. Characterization of Pipelines
V.A.1. Industry Characterization
The history of oil and gas pipelines as they are used today begins with thefirst commercial oil well, drilled in 1859. The first oil pipeline – 109 mileslong, with a diameter of six inches – was laid from Bradford to Allentown,Pennsylvania, in 1879. Since the late 1920s, virtually all oil and gas pipelineshave been welded steel, a departure from the early versions made fromwrought iron. Although the first cross-country pipeline was laid in 1930,connecting Chicago, Minneapolis, and other cities, it was not until WorldWar II, with frequent disruptions in coastal tanker traffic, that large-scalepipelines were laid connecting different regions of the country. In the 1960s,larger-diameter pipelines proved their economic advantage when a lineconsisting of 32, 34, and 36 inch diameters was built from Houston to NewYork, and a 40-inch pipeline was constructed connecting Louisiana toIllinois. Discovery of oil on Alaska’s North Slope precipitated theconstruction of the country’s largest pipeline, the 48-inch diameter Trans-Alaskan Pipeline, or Alyeska (Oil and Gas Pipeline Fundamentals, Kennedy,1994).
By 1994, U.S. interstate pipeline mileage totaled nearly 410,000 miles, ofwhich over 250,000 miles transported gas and over 158,000 shipped liquidoil and petroleum. Natural gas is delivered to U.S. consumers through anetwork of 1.2 million miles of buried pipe and 429 underground storagereservoirs that are linked to more than 1,200 local gas distribution companies.
Throughout this section, distinctions are made between gas and oil pipelines.Although the fundamental design and purpose of these two systems aresimilar, there are differences in their conveyance systems. Distinctions arealso made for product pipelines and breakout tanks which are defined below.
Oil Pipelines
Crude oil must undergo refining before it can be used as product. Once oilis pumped from the ground, it travels through pipes to a tank battery. One ormore tank batteries may be installed in a single field, each serving a numberof individual wells. A typical tank battery contains a separator to separate oil,gas, and water; a fired heater to break water/oil emulsions to promoteremoval of water from the oil; and tanks for storing the oil until it is shippedas crude oil by truck or, more commonly, by a gathering line connected tostorage tanks. From these tanks, the oil is moved through large diameter,long-distance trunk lines to refineries or to other storage terminals.
Ground Transportation Industry Pipelines
Sector Notebook Project September 199738
Trunk lines rely on pumps to initiate and maintain pipeline pressure at thelevel required to overcome friction, changes in elevation, or other pressure-decreasing factors. Pumps are required at the beginning of the line and arespaced along the pipeline to adequately propel the oil along.
Gas Pipelines
The purpose of gas-gathering and gas transmission pipelines is similar to thatof crude-gathering and crude trunk lines, but operating conditions andequipment are quite different. Gas pipelines operate at higher pressures thando crude lines, and use compressors instead of pumps to force the gas along.Unlike oil, gas does not undergo refining, and transmission lines connectdirectly to utility companies that distribute the gas to consumers via small,metered pipelines. Gas is often treated in scrubbers or filters to ensure it is“dry” prior to distribution.
Gas-well flowlines connect individual gas wells to field gas-treating andprocessing facilities or to branches of a larger gathering system. The gas isprocessed at the treating facility to remove water, sulfur, acid gases, hydrogensulfide, or carbon dioxide. Most field gas processing plants also removehydrocarbon liquids from the produced as stream. From field processingfacilities, the dried, cleaned natural gas enters the gas transmission pipelinesystem, analogous to the oil trunk line system.
Products Pipelines
Once oil is refined, product pipelines transport it to storage and distributionterminals. Refined oil products include automotive gasoline, diesel, homeheating oils, ammonia, and other liquids. Other products pipelines transportliquefied petroleum gases (LPG) and natural gas liquids (NGL) fromprocessing plants, where oil and gas are produced, to refineries andpetrochemical plants.
Breakout Tanks
Breakout tanks are above ground tanks used to relieve surges in a hazardousliquid pipeline systems or to receive and store hazardous liquid transportedby a pipeline for reinjection and continued transportation by the pipeline.
V.A.2. Industry Size and Geographic Distribution
Variation in facility counts occur across data sources due to many factors,including reporting and definition differences. This document does notattempt to reconcile these differences, but rather reports the data as they aremaintained by each source. The Bureau of the Census segregates economicdata depending on whether an establishment maintains a payroll. In the

Ground Transportation Industry Pipelines
Sector Notebook Project September 199739
transportation industry, many owners/operators are independent businesseswith no employees, while others, including companies involved withpipelines, hire contracted employees who are reported under other entities’payrolls. The following data is available only for establishments withpayrolls.
Industry Size
According to the Census Bureau, the pipeline industry consists ofapproximately 4,900 establishments and employs nearly 170,000 people.Exhibit 15 illustrates the facility size distribution for the industry based on1992 U.S. Census Bureau data.
Exhibit 15Facility Size Distribution of Pipeline Industry*
Industry SIC Total Employees Total Number of Employees perCode Facilities Facility
Crude Petroleum 4612 10,355 405 25.6Pipelines
Refined Petroleum 4613 5,578 358 15.6Pipelines
Pipelines, NEC** 4619 846 81 10.4
Natural Gas Transmission 4922 12,928 515 25.1
Natural Gas Transmission 4923 69,311 1,648 42.1and Distribution
Natural Gas Distribution 4924 65,239 1,734 37.6
Mixed, Manufactured, or 4925 445 71 6.3Liquefied Petroleum GasProduction and/orDistribution
Gas and Other Services 4932 4,459 124 36.0Combined
Total 169,161 4936 34.3
Source: Compiled from official 1992 statistics of the U.S. Bureau of the Census.*Facilities with Payrolls only**Not Elsewhere Classified

0
0
06
1
5
111
6
14
2
6
22
3
3
711
41
16
11
20
10
25 29
10
14
20
13
29
15
6
22
46
42
18
18
8
19655
814
0
3 4
111
12
55
9
5
Ground Transportation Industry Pipelines
Sector Notebook Project September 199740
Geographic Distribution
State data is available only for those facilities with payrolls, as discussedabove. Because the Census Bureau does not segregate data for the natural gassectors covered by this profile, State-by-State information is available onlyfor oil pipelines. The oil pipeline industry is anchored in the Southwest, withTexas, Louisiana, and Oklahoma accounting for over one-third of all reported establishments. California, with 55 pipeline facilities, and Illinois,with 41, have the next highest numbers of oil lines.
Exhibit 16 illustrates the number of oil pipeline establishments per State asrecorded by the U.S. Census for 1992.
Exhibit 16Geographic Distribution of Oil Pipelines*
Source: Compiled from official 1987 statistics of the U.S. Bureau of the Census.*Establishments with payroll only.
V.A.3. Economic Trends
Most gathering and long-distance pipelines in the U.S. are owned by pipelinecompanies whose sole function is to operate a pipeline system. Historically,natural gas in the U.S. was purchased by the pipeline company from theproducer, transported to market, then resold to a local distribution company.Now, most gas is sold directly to the local distribution company the producer,and pipeline companies provide only a transportation service. Oil, on the

Ground Transportation Industry Pipelines
Sector Notebook Project September 199741
other hand, has traditionally been transported in the U.S. via pipeline by ashipper/owner, who is generally a refiner as well (Kennedy).
Annual reports filed for 1994 with the Federal Energy RegulatoryCommission (FERC) show that both natural-gas and petroleum liquidspipeline companies increased their net incomes in 1994 despite decliningoperating figures. The ongoing shift of natural gas pipelines to primarilytransportation providers was reflected by an increase in volumes of gasmoved for others while volumes sold declined. Liquids pipelines movednearly the same number of barrels in 1994 as in 1993, but showed an increasein barrel-miles, a measure of heightened efficiencies (Oil and Gas Journal,November 1995).
The nearly 410,000 miles of pipeline in the U.S. in 1994 represents a 2.2percent, 9,000 mile, decline from the previous year. All pipeline mileageoperated to move natural gas in interstate service declined nearly 4,000 miles,while mileage used in deliveries of petroleum liquids fell more than 5,000miles. Transmission pipeline mileage showed little change from 1993 to1994. Transmission mileage accounted for 77.5 percent of all natural gasmileage reported to FERC. The more than 128,000 miles of crude oil andproduct trunk lines represented more than 80 percent of all liquids mileageoperated.
Natural gas companies have completed the shift from being marketers tobeing transporters that began when the FERC began implementing a seriesof regulatory orders that increased efficiency and heightened competition byestablishing open-access transportation. This allowed traditional pipelinecustomers to buy gas from other sellers and have the pipelines providetransportation only. A final piece of regulatory restructuring occurred in1992 with the release of FERC Order 636, requiring pipelines to offer gassales, transportation, and storage services separately. In 1994, gas pipelinecompanies moved nearly 20 times as much gas for other companies as theysold from their own systems. Exhibit 17 demonstrates the relationshipbetween pipelines, marketers, producers, and users of natural gas.

Ground Transportation Industry Pipelines
Sector Notebook Project September 199742
Exhibit 17Natural Gas Delivery Infrastructure

Ground Transportation Industry Pipelines
Sector Notebook Project September 199743
U.S. crude oil and product oil trunk line traffic also increased in 1994. Crudeoil traffic increased by 33 percent, while product traffic saw a modest rise ofnearly three percent.
A solid measure of the profitability of oil and natural gas pipeline companiesis the portion of operating income that is net income. For liquid pipelinecompanies in 1994, income as a portion of operating revenues was 29.5percent, up from 25.4 percent in 1993. Income as a portion of revenues fornatural gas companies was 14.3 percent, a marked increase from the 9.1percent level reported in 1993.
Available information concerning future construction for the gas pipelineindustry indicates a slow growth rate. Based on filings during the 12 monthsending June 30, 1995, 725 new miles of land pipeline were proposed, andnearly 78,000 horsepower of new or additional compression were applied for.
The world oil price (the average cots of imported crude oil for U.S. refiners)is not expected to move significantly in 1996 from its current level ofapproximately $16 per barrel. Despite the continued rise in world oil demandover the forecast period, expected to exceed one million barrels per day peryear, world oil production capacity increases should accommodate thedemand growth in a balanced manner, keeping average prices relatively flat.
V.B. Operations in the Pipeline Industry
Gas and oil pipelines are essentially similar, with the greatest operationaldifference resulting from the varying needs of transporting gas versus liquid.Oil pipelines require pumps to propel their liquid contents, while gas linesrely on compression to force the resource through the pipe. In both pump andcompressor stations, corrosion of piping and vessels must be monitoredconstantly to prevent failure.
Most pipelines fall into three groups: gathering, trunk/transmission, ordistribution. One type of gathering pipeline is flowlines. Flowlines aresmall-diameter pipelines that are owned by the producer and connectindividual oil or gas wells to central treatment, storage, or processingfacilities in the field. Another gathering system made up of larger-diameterlines, normally owned by a pipeline company rather than an oil or gasproducer, connects these field facilities to the large-diameter, long-distancetrunk or transmission line. In some cases, individual wells are connecteddirectly to the pipeline company’s gathering system. Crude trunk lines moveoil from producing areas to refineries for processing. Gas transmission linescarry natural gas from producing areas and treatment/processing facilities tocity utility companies and other customers. Through distribution networksof small pipelines and metering facilities, utilities distribute natural gas tocommercial, residential, and industrial users.

Ground Transportation Industry Pipelines
Sector Notebook Project September 199744
Refined liquids and products, such as gasoline, kerosene, fuel oil, and jet fuelare transported thousands of miles throughout the U.S. in product pipelines.Efficient long distance transport by pipeline requires high operatingpressures, typically 500-1200 psi. Liquefied petroleum gases such aspropane, butane, and their mixtures, are usually liquids under normal lineoperating pressures, so the pipelines transporting them are classified as liquidlines. Pump stations are needed on liquid lines at line friction, and elevationchanges. Storage structures, such as tank farms for liquids and, increasingly,underground salt caverns for propane, are also used as buffers in transmissionnetwork operations and to distribution points of contact. Common pipelineoperations are discussed below.
V.B.1. Pigging
Pipeline pigs are used for multiple purposes in both liquid and natural gaspipelines. A mechanical pig consists of a steel body with rubber or plasticcups attached to seal against the inside of the pipeline and to allow pressureto move the pig through the line. Brushes and scrapers are attached to the pigto facilitate cleaning or other functions. Pigs and spheres are forced throughthe pipeline by the pressure of the flowing fluid.
Mechanical pigs have traditionally been used to clean or segregate fluidswithin liquid pipelines. Mechanical pigs are most often used in gas pipelinesto clean the line and maintain maximum efficiency. Downstream ofcompressor stations, lubricating oil from the compressors needs to beremoved from the gas lines. On the intake side of both compressor and pumpstations, cleaning pigs are used to prevent unwanted materials fromcontaminating the pumps or compressors. Recently, the use of pigs hasincreased as sophisticated instruments are used to monitor pipeline conditionsand detect potential problems.
Large amounts of debris can be removed by a pig run over a long distance.For example, assume a pig is run in a 24-inch diameter pipeline that is 100miles long and removes 0.016 inches of wax material from the wall of thepipeline. After 100 miles, the pig would be pushing a plug of wax about1,450 feet long (Kennedy). Several sweeps by the pig may be required toeffectively clean the line. Both brush and scraper pigs contain holes thatallow fluid to bypass the pig, preventing buildups in front of the machine thatcould cause plugging.
V.B.2. Pipeline Leaks
Pipeline leaks are considered either small, medium, or large. Small leaks arebelow the limits of current computational pipeline monitoring leak detectioncapabilities. They can be detected with chemical sensing cables or by finding

Ground Transportation Industry Pipelines
Sector Notebook Project September 199745
small pools of leaking product or dead vegetation on the pipeline right ofway. They result from small, stable fractures or small corrosion holes thatresult in leak rates usually less than one percent of flow. Many vendor- andcompany-developed systems can detect leaks as small as 0.1 percent flow infield tests, but pipeline operators are not counting on this capability and arecontinuing with visual inspections (US DOT/RSPA/Volpe Center 1995).Small leaks can stay small and go unnoticed for weeks.
Medium leaks are detectable with some inferential leak detection methods,but are not large enough to cause a loss of working line pressure. Spill ratesas high as 100 bbls per hour have gone undetected for up to a day on largelines without the use of sophisticated detection systems. Medium leaks arecaused by fractures that remain narrow and by worn gaskets and valve stempackings.
Large leaks result in a rapid loss of working line pressure, which willgenerate an alarm to the dispatcher, even without a leak detection system(LDS). They are caused by third party damage and by unstable fractures thatcan grow many feet in length. Many high carbon steels used before 1`970 areprone to unstable fracture. Hydrogen gas, generated by cathodic protectionsystems with excessively high voltage, and hydrogen sulfide, found in sourcrude oil, can make steel brittle and more prone to such fractures.
Improvements in materials, construction technologies, and inspection andmonitoring techniques have reduced the incidence of damage to pipelines.In Western Europe, for example, gas leaks have dropped by 30 percent in thepast 20 years, despite an aging pipeline system.
V.B.3. Pipeline Inspections
More than half of the gas transmission pipeline capacity in the U.S. will beover 40 years old by the year 2000. It is becoming increasingly important toguarantee the structural integrity of these pipelines through structuralmonitoring and periodic inspections. In addition, pipelines in unstable terrainmust be monitored using geotechnical instruments such as inclinometers andpezometers, as well as by direct measurement of pipeline deformations, usingstrain gauges. Over the past 50 years, methods for performing these taskshave steadily improved.
Leak detection methods may be divided into two categories, direct andinferential. Direct methods detect leaking commodity outside the pipeline.Inferential methods deduce a leak by measuring and comparing the amountof product moving through various points on a line.
Traditionally, pipelines have been inspected visually by walking along thisline or patrolling the pipeline route from the air. Today, leak detection ha

Ground Transportation Industry Pipelines
Sector Notebook Project September 199746
become more thorough, in part to meet environmental and safety regulations.A thorough inspection program requires both systematic periodic controls(e.g., patrolling the line or cathodic protection measurements) and specificoccasional controls (e.g., in-line inspection or hydrostatic retesting).Inspection programs must address the needs of the pipeline, requiring adetailed knowledge of construction characteristics, past and present serviceconditions, the local environment, and maintenance history. Factorsinfluencing the rate of detection include the type of fluid, the accuracy ofmeasuring systems, line size, pipe thickness, length of the line, analyticalequipment, and the experience of the personnel involved.
One successful inspection technology is the instrument internal inspectiondevice, commonly referred to as the smart pig. Growing out of earliertechnology (mechanical pigs used for cleaning), smart pigs carry detectionand logging tools that store data on the state of the pipeline including data onmetal loss, pits, gouges, and dents while moving through the pipeline system.The smart pig is launched from a pig launcher (a spur off the mainline), runthrough the pipeline segment, trapped, and removed from the pipeline. Thedata is then downloaded from the start pig data storage unit and analyzed.
The smart pig technology is based on the use of a single “sensor,” calledmagnetic flux leakage, or MFL. MFL pigs can detect metal loss, usually theresult of corrosion. Based on limited data, smart pigs are able to detectapproximately 60 percent of pipe defects. They cannot detect stress corrosioncracking, longitudinal cracks, small defects, or gouges and dents caused byexcavation damage. An emerging technology called ultrasonic sensortechnology can detect smaller cracks and defects. However, sensors currentlyrequire liquid to serve as a contact between the sensor and the material beinginspected. Research is underway to develop ultrasonic sensors that canfunction in a dry natural gas pipeline. One of the most difficult inspectionhurdles is the many miles of pipes that cannot be inspected using pigs.Design constraints such as intrusive valves, varying pipe diameters, and sharpturns make internal pipe inspection difficult.
Another inspection practice is to measure the amount of pressure and volumein a pipeline. This is done through metering. Metering measures the amountof flow in and out of a pipeline segment. This approach is effective usingboth simple and complex leak detection systems. The detection of smallleaks can be enhanced by sophisticated instrumentation and the use ofcomputer models.
Natural gas pipelines can be inspected for leaks with surface-samplinginstruments by the flame-ionization principle. These units are made up of asampling probe with a pump to draw an atmospheric sample to a detectioncell. In the cell, the sample envelops a small hydrogen flame and carbon ionsflow to a collector plate, causing an imbalance in the circuit that deflects the

Ground Transportation Industry Pipelines
Sector Notebook Project September 199747
indicating meter. Because natural gas weighs less than air, it rises to theground surface as it progresses through the atmosphere. Leaks in liquidnatural gas pipelines are not as easily detected, and the soil around the linemust be tested for constituents like propane and butane. Exhibit 18 showssome of the practices used to monitor pipelines and the types of damage theycan reveal.

Ground Transportation Industry Pipelines
Sector Notebook Project September 199748
Aer
ial P
atro
ls
Gro
und
Syst
ems
CP
Mea
sure
men
ts
Clo
se In
terv
al
Cou
pons
M
onito
rs
MFL
Pig
s
Geo
met
ry P
igs
Map
ping
Pig
s
Cam
eras
Vis
ual
Insp
ectio
n
ND
EEx
amin
atio
n
Hyd
rost
atic
Ret
estin
g
Exhibit 18Methods of Monitoring Pipelines
R-O-W CORROSION IN-LINE BELLHOLES TESTSPATROL CONTROL INSPECTION
PRACTICES
CONDITIONS
OUTSIDE FORCES
3rd party damage X X X X X
Earth movements X X X X
METAL LOSS
External corrosion X X X X X X
Internal corrosion X X X X
Gouges X X X X
GAS LEAKAGE X X X
COATING X X X
CRACKS
Seam weld X X X
Girth weld X X X
Stress corrosion X X
Fatigue X
Selective corrosion X X X
GEOMETRY
Ovality, buckles X X X
Obstructions, dents X X X
Ovality, wrinkles X X X
Bend radius X X
Pipeline movement X
METALLURGICAL
Inclusions X X X
Hard spots X X X
Laminations X
Source: Natural Gas Technologies, 1993.

Ground Transportation Industry Pipelines
Sector Notebook Project September 199749
V.B.4. Glycol Dehydration Units
Glycol dehydration units are commonly used to remove water vapor fromnatural gas. Glycol dehydration of natural gas streams helps preventcorrosion and the formation of hydrates in pipelines. Up to 40,000 glycoldehydration units may be operating in the U.S. Approximately 17 to 18trillion cubic feet per year of natural gas is currently dehydrated in NorthAmerica, with a large fraction of that amount being treated in the UnitedStates.
During the water removal process, the glycol picks up other compounds fromthe natural gas that can become part of waste streams. The most significantissue is air emissions from the reboiler still vent. Increasing regulatorypressure has made emissions of benzene, toluene, ethylbenzene, the xyleneisomers (BTEX), and volatile organic compounds (VOC) from the reboilerstill vent of glycol dehydration units a major concern of the natural gasindustry.
Varying amounts of water accompany the production of natural gas,depending on the temperature and pressure of the gas and the age of the field.In addition to the produced water, most natural gas is saturated with watervapor at the production temperature and pressure. The water vapor contentof saturated natural gas can be estimated given the temperature and pressureof the gas. For example, at 800 psig and 80 smuch as 38 pounds of water per million standard cubic feet (MMSCF). Inaddition, sour natural gas (i.e., gas containing significant concentrations ofhydrogen sulfide and carbon dioxide) will have a higher water content thansweet gas.
As the pressure and temperature vary in the gas pipeline, water can combinewith the natural gas molecules (e.g., methane, ethane, and propane) to formsolid hydrates that can block or plug a pipeline. Hydrates are crystallinestructures composed primarily of water and hydrocarbons; methane can formhydrate cells with up to 136 molecules of water. Hydrates may alsoincorporate other gases such as hydrogen sulfide, ammonia, carbon dioxide,acetylene, and bromine into their structure.
Initially, small hydrate crystals will form in the flowing gas when free liquidwater is present at the proper temperature and pressure. These small crystalsbecome condensation nuclei, and, as they collide and stick together, largercrystals are formed. They will also accumulate on obstructions such asvalves, orifice meters, or sharp objects where pressure and flow rate changesoccur. Eventually, these crystals can grow to become a solid block ofhydrates that can completely close off a pipeline or other equipment at highpressure.

Ground Transportation Industry Pipelines
Sector Notebook Project September 199750
Water also increases the corrosivity of the acid gases in the natural gas. Uponcooling, water may condense in the pipeline and cause slug flow, resulting inincreased pipeline corrosion, erosion, and pressure drop.
To prevent the formation of hydrates at pipeline pressures and to limitcorrosion, natural gas must be dehydrated before it is sent to the pipeline. Inthe U.S., the typical pipeline specification for the water content of the gas is7 lb/MMSCF of natural gas.
V.C. Pollution Outputs and Causes of Pipeline Leaks
Unlike the other pollution output sections in the document, this sectionreflects the importance of determining the causes of pipeline ruptures, ratherthan focusing on the material released. By definition, most pollution outputsassociated with pipelines are the oil and gas resources and products that thepipelines convey.
The Federally-regulated pipeline system has consistently improved its safetyrecord over the last 25 years. However, there are still about 20 large (1,000barrels or more) spills on the DOT’s Office of Pipeline Safety (OPS)regulated liquids lines each year (US DOT/RSPA/Volpe Center 1995).Between 1988 and 1994, the OPS received 1,401 reports of hazardous-liquidspills on U.S. pipelines in which operators claimed a total of 1.2 millionbarrels of lost product and $220 million in property damage, as well as anumber of injuries and fatalities.
Large crude and other viscous product spills are difficult and expensive toclean up. Lighter products, such as gasoline and highly volatile liquids poseless of a cleanup problem, but the risk of fire and explosion is significant.Much of the improvement in the pipeline safety record over the last 25 yearshas resulted from technical developments such as those in pipelinecomponents, construction, inspection, and corrosion control.
V.C.1. Pipeline Failures
According to the DOT, for gas pipelines, 40 percent of leak/spill incidents aredue to outside force or third-party damage; 21 percent are due to corrosion;16 percent to material construction defects, and 23 to operational causes. Foroil pipelines, only 18 percent of incidents are due to outside force or third-party damage; 20 percent due to corrosion, 16 percent due to materialconstruction defect, and 45 percent to operational incidents (US DOTNational Pipeline Safety Summit 1994, Data prepared by the NJ Institute ofTechnology). Exhibits 19 and 20 provide more specific breakdowns of thecauses of pipeline leaks for hazardous liquid pipelines and natural gaspipelines as well as a breakdown of the resulting damage.

Ground Transportation Industry Pipelines
Sector Notebook Project September 199751
Exhibit 19Hazardous Liquid Pipeline Incident Summary by Cause - 1994
Cause Number of Percent of Property Percent of Deaths InjuriesIncidents Total Damage Total
Incidents Damages
Internal 9 3.69 $282,000 0.50 0 0Corrosion
External 38 15.57 $1,833,043 3.25 0 0Corrosion
Defective 21 8.61 $4,320,680 7.65 0 0Weld
Incorrect 8 3.28 $15,600 0.03 0 0Operation
Defective 11 4.51 $2,154,000 3.82 0 0Pipe
Outside 57 23.36 $35,593,513 63.05 0 1,853Damage
Malf.. of 22 9.02 $1,159,517 2.05 0 1Equipment
Other 78 31.97 $11,095,251 19.65 1 4
Total 244 100 $56,453,604 100 1 1,858
Source: DOT Office of Pipeline Safety, 1995.
Exhibit 20Natural Gas Pipeline Incident Summary by Cause - 1994
Cause Number Percent of Property Percent of Deaths Injuriesof Total Damage Total
Incidents Incidents Damages
Internal 20 25.0 $2,632,812 583 0 0Corrosion
External 13 16.25 $2,028,835 4.49 0 1Corrosion
Damage from 23 28.75 $32,127,680 71.13 0 16Outside Forces
Construction/ 9 11.25 $342,647 0.76 0 2Material Defect
Other 15 18.75 $8,038,319 17.8 0 0
Total 80 100 $45,170,293 100 0 19Source: DOT Office of Pipeline Safety, 1995.

Ground Transportation Industry Pipelines
Sector Notebook Project September 199752
V.C.2. Glycol Dehydration - Inlet Separator
The inlet separator removes liquid water, heavy hydrocarbons, brine solution,and particulate matter such as sand, pipeline scale, and rust, or iron sulfidefrom the incoming natural gas. The vessel is typically sized on the basis ofoperating pressure and gas throughput to ensure that adequate separationoccurs and carryover is prevented. The liquid level must be regulated orchecked regularly so that plugs or upsets do not result in carryover; one wayto do this is to install a high-liquid-level shutdown. The liquid drain lineshould be protected from freezing; if this line is frozen or plugged, theseparator will not remove any liquids. A mist eliminator in the top of theseparator is usually sufficient to reduce or prevent the carryover of liquiddroplets and particulate matter, although a filter may be required if aerosolsor compressor oils are present in the gas stream.
The inlet separator is considered by many to be the most important part of aglycol unit, because a properly designed inlet separator can eliminate manydownstream problems. If the inlet separator is undersized or poorly designed,contaminants may be carried over into the absorber, resulting in the followingproblems in downstream equipment:
• Free liquid water may enter the absorber and overload the glycol inthe absorber, which may prevent the gas from being dried to pipelinespecifications.
• Hydrocarbon contamination of the glycol may cause foaming.
• Heavy hydrocarbons may foul the heat exchange surfaces in thereboiler, resulting in poor heat transfer, localized thermal degradationof the glycol, inadequate glycol regeneration, and eventual fire tubefailures.
• Sodium chloride and calcium chloride may enter the system. Sodiumchloride often precipitates in the reboiler, calcium chlorideprecipitates in the coldest portions of the system such as the absorber.Salt contamination may ultimately necessitate replacement of theglycol.
V.C.3. Breakout Tank Leakage
Leaking above ground storage tanks pose several environmental problems.First, leaking above ground tanks can seriously contaminate groundwater,often making it impossible to ever return the groundwater to drinking waterstandards. Groundwater is a source of drinking water for over half thecountry; in rural areas, nearly all residents drink water from groundwaterwells. Pipeline-related facilities are frequently located in populated areas that

Ground Transportation Industry Pipelines
Sector Notebook Project September 199753
may rely on groundwater for drinking. Leaking tanks can also pose healthand fire hazards to nearby buildings or infrastructures such as sewers, sincegaseous components can migrate into these enclosed areas and concentrateto toxic or combustible levels.
Page 54 intentionally left blank.

Ground Transportation Industry Pollution Prevention
Sector Notebook Project September 199755
VI. POLLUTION PREVENTION/WASTE MINIMIZATION
VI.A. Introduction
The best way to reduce pollution is to prevent it in the first place. Somecompanies have creatively implemented pollution prevention techniques thatimprove efficiency and increase profits while at the same time minimizingenvironmental impacts. This can be done in many ways, such as reducingmaterial inputs, re-engineering processes to reuse by-products, improvingmanagement practices, and employing substitution of toxic chemicals. Somesmaller facilities are able to actually get below regulatory thresholds just byreducing pollutant releases through aggressive pollution prevention policies.
The Pollution Prevention Act of 1990 established a national policy ofmanaging waste through source reduction, which means preventing thegeneration of waste. The Pollution Prevention Act also established asnational policy a hierarchy of waste management options for situations inwhich source reduction cannot be implemented feasibly. In the wastemanagement hierarchy, if source reduction is not feasible the next alternativeis recycling of wastes, followed by energy recovery, and waste treatment asa last alternative.
In order to encourage these approaches, this section provides both general andcompany-specific descriptions of pollution prevention activities that havebeen implemented within the pharmaceutical industry. While the list is notexhaustive, it does provide core information that can be used as the startingpoint for facilities interested in beginning their own pollution preventionprojects. When possible, this section provides information from realactivities that can be, or are being, implemented by this sector -- including adiscussion of associated costs, time frames, and expected rates of return.This section provides summary information from activities that may be, orare being implemented by this sector. Please note that the activities describedin this section do not necessarily apply to all facilities that fall within thissector. Facility-specific conditions must be carefully considered whenpollution prevention options are evaluated, and the full impacts of the changemust be examined to determine how each option affects air, land and waterpollutant releases.
VI.B. Rail Transportation
VI.B.1. Water Discharge
At locomotive maintenance facilities, eliminating water from the clean upprocesses may enable a facility to seal off the floor drains and attain zerodischarge. Spent solvents and cleaning solutions are often toxic and/orhazardous and should be disposed of in an environmentally safe manner

Ground Transportation Industry Pollution Prevention
Sector Notebook Project September 199756
rather than by pouring them into the storm drain or waste water line. Ifhazardous cleaning agents (e.g., solvents) are used, care should be taken towear protective safety gear and follow good housekeeping practices (e.g.,clear labeling of all chemicals and wastes to avoid misuse and potential injuryor contamination).
If a discharge is going to a wastewater treatment facility, it should bepretreated. Pretreatment means reducing the amount of pollutants in adischarge before it proceeds to a municipal wastewater treatment plant. Ifwaste water is discharged directly or indirectly (i.e., via percolation orinjection wells) into a stream, a facility must obtain and comply with theterms of an NPDES or State permit.
When disposing of wastewater, the following activities will foster pollutionprevention:
• If a municipal treatment plant is not available, or it will not accept thewaste, route the waste to a tank or container for proper accumulation,treatment, and disposal.
• Keep wastewater from service bays out of storm drains byconstructing berms around hazardous material storage areas to keepspills from leaving the storage area.
• Do not discharge industrial wastes to septic systems, drain fields, drywells, cesspools, pits, or separate storm drains or sewers. Facilitiesthat use these types of disposal systems may be in violation ofFederal, State, or local requirements.
• If there is a floor drain in the facility, it should be plumbed to anoil/water separator or appropriate wastewater treatment facility.
• Alternatives to water cleaning include recycled solvents in selfcontained solvent sinks. Dry cleaning can include cleaning by wirebrush or bake oven.
Waste minimization in equipment cleaning may be achieved by reducing theamount of water used to clean large equipment. A reduction in water usagewill translate into a reduction in the volumes of generated waste waters.
Axle protective coatings can be removed with 140 solvent or a similar non-hazardous or aqueous solvent to avoid hazardous waste generation. The useof hazardous cleaning compounds in outdoor large equipment cleaning canalso be avoided by using a detergent/water mixture or steam. In theseprocesses, waste waters must be channeled properly for treatment or disposal.

Ground Transportation Industry Pollution Prevention
Sector Notebook Project September 199757
For small cleaning operations, it is possible to switch from hazardousorganic-based to non-hazardous aqueous-based solvents. This will reduce theamount of hazardous waste generated from cleaning operations. Solventrecycling can also decrease hazardous waste production from small partscleaning.
Spent solvents can be cleaned and recycled with a solvent still. Spentsolvent, if hazardous, must be treated and disposed of as hazardous waste,unless recycled properly. Solvents should not be poured down sewer drains,mixed with used oil, or stored in open containers that allow them toevaporate. Certain aqueous parts washers can use detergents instead ofsolvents.
VI.B.2. Oil
Most facilities in the rail industry recycle used oil. Recycling used oilrequires equipment like a drip table with a used oil collection bucket tocollect oil dripping off parts. Drip pans can be placed under locomotive orrail cars awaiting repairs in case they are leaking fluids. Some facilities useabsorbent materials (e.g., pigmat) to catch drips or spills during activitieswhere oil drips might occur. One facility has established a reuse system forits waste oil: waste oil is transported to another facility where it is used forfuel. This method decreased disposal and heating costs while reducinglandfill waste loads. Used oil burning of this nature has permittingimplications that a facility needs to follow. Used oil burning can also occurin on-site space heaters under certain circumstances. Recycling used oil bysending it to a commercial recycling facility saves money and protects theenvironment. To encourage recycling, the publication "How To Set Up ALocal Program To Recycle Used Oil" is available at no cost from theRCRA/Superfund Hotline at 1-800-424-9346 or 1-703-412-9810.
Another pollution prevention alternative some railroads have initiated is theuse of retention tanks on locomotives. Locomotive retention tanks catchleaking oil from the engine compartment. The tanks are subsequently drainedto an appropriate waste treatment facility during routine maintenance andservicing.
Spent petroleum-based fluids and solids should be sent to a recycling centerwherever possible. Solvents that are hazardous waste must not be mixed withused oil, or, under RCRA regulations, the entire mixture may be consideredhazardous waste. Non-listed hazardous wastes can be mixed with waste oil,and as long as the resulting mixture is not hazardous, can be handled as wasteoil. All used drip pans and containers should be properly labeled.
A Material Safety Data Sheets (MSDS) logbook should be kept in a centrallocation and be easily accessible during an emergency. Along with MSDS's,

Ground Transportation Industry Pollution Prevention
Sector Notebook Project September 199758
an emergency response plan should posted at all times and each employeeshould know where it is and what procedures are included in it. Allemployees should be aware of and understand the properties and potentialadverse effects of the materials they handle.
Facilities should conduct audits of the spill possibilities at their facilities.Spills can be avoided by determining those locations and situations wherespill events are likely to take place and making employees aware of them.Some facilities have posted signs at likely spill locations or conductedtraining with their employees on spill awareness and preparedness. Inaddition, MSDS sheets can be centralized for easy access in case of a spillevent. A folder or binder can be used for this purpose and should bemaintained by a designated MSDS collection person.
VI.B.3. Waste from Maintenance and Repair Operations
Batteries may be recycled through suppliers. Batteries should be stored in anopen rack or in a water tight, secondary containment area like a concrete binwith sealer on the floor and walls. Batteries should be inspected for leaksand/or cracks as they are received at the facility. Acid residue from crackedor leaking batteries is likely to be hazardous waste under RCRA because itis likely to demonstrate the characteristic of corrosivity, and may containlead and other metals. Many waste batteries must therefore be handled ashazardous waste. Lead acid batteries are not considered a hazardous wasteas long as they are recycled. Facilities have many battery disposal options:recycling on site, recycling through a local rail facility, recycling through asupplier, or direct disposal. Facilities should explore all options to find onethat is right for the facility. In general, recycling batteries may reduce theamount of hazardous waste stored at a facility, and thus the facility'sresponsibilities under RCRA. The following best management practices arerecommended when sorting used batteries:
• Palletize and label them by battery type (e.g., lead acid, nickel, andcadmium)
• Protect them from the weather with a tarp, roof, or other means
• Store them in an open rack or in a water tight secondary containmentunit to prevent leaks
• Inspect and document them for cracks and leaks as they come in toyour storage program. If a battery is dropped, treat it as if it iscracked
• Avoid skin contact with leaking or damaged batteries

Ground Transportation Industry Pollution Prevention
Sector Notebook Project September 199759
• Neutralize acid spills and dispose of the resulting waste as hazardousif it still exhibits a characteristic of a hazardous waste.
Coolants for locomotives are not glycol based, but are a nitrate-basedcorrosion inhibitor in water. These type of waste coolants can be disposedto most POTWs. Though much of the activities associated with vehiclestakes place at off-site service centers, some maintenance is performed on thistype of equipment, where coolants from maintenance vehicles and fleetvehicles should be collected and recycled and not mixed with locomotivecoolant. Solvents containing chlorinated hydrocarbons should be stored inseparate containers and disposed of properly. When possible, coolant shouldbe discharged when the locomotive has stopped and is at a location where thecoolant can be collected and managed. Locomotive operators should befamiliar with the spill reporting requirements of the States in which theyoperate, and act accordingly when a coolant discharge takes place.
Metal scrap from old machine parts that is likely to be contaminated with oil(e.g., wheel truing scrap), should be stored under a roof or covered withtarpaulin to protect it from the elements. This scrap metal should also beprotected from rain water to eliminate the potential of contaminated runoff.Metal scrap can be recycled if sorted and properly stored. Labeled recyclingcontainers can be placed around the shop for easy access and later sorting.
Liquid drum containers, if stored outdoors, should be in a berm and on apaved impermeable surface or in a secondary containment unit to preventspills from running into water bodies.
Metal filings from parts machining should be collected and recycled ifpossible. In no case should the filings be allowed to fall into a storm drain.
VI.B.4. Paint
To reduce the amount of wastes created by painting operations, all paintshould be used until containers are completely empty. "Empty" containersof latex paint may be disposed of as solid waste. Used containers ofhazardous substances may need to be disposed of as hazardous wastes, if theyare not completely empty. To prevent environmental problems, it is possibleto switch from hazardous organic-based to non-hazardous aqueous-basedpaints. Also, paint may be purchased in recyclable and/or returnablecontainers to reduce disposal costs.
VI.B.5. Fueling
Self-locking fueling nozzles minimize the risk of both fuel spillage and airpollution by ensuring a secure seal between the fuel source and tank. Duringlocomotive fueling, personnel should look for fuel drippage and spillage.Catchment pans on either side of and between the rails will collect fuel spills

Ground Transportation Industry Pollution Prevention
Sector Notebook Project September 199760
and prevent soil contamination. These pans should be drained to an oil-waterseparator or retention tank. These pans can be cleaned periodically byrailroad personnel to remove fuel debris and accumulated wastes for properdisposal. In case of a spill, facilities should keep the following on hand:absorbent booms, pads, or blankets to help contain spills and soak up poolingliquid; rubber gloves and boots; and a shovel.
VI.C. Trucking
VI.C.1. Truck Terminal and Maintenance Facilities
Trucks require regular changing of fluids, including oil, coolant, and others.To minimize releases to the environment, these fluids should be drained andreplaced in areas where there are no connections to storm drains or municipalsewers. Minor spills should be cleaned prior to reaching drains. Used fluidsshould be collected and stored in separate containers. Automotive fluids canoften be recycled. For example, brake fluid, transmission gear, and gear oilare recyclable. Some liquids are able to be legally mixed with used motor oilwhich, in turn, can be reclaimed.
During the process of engine and parts cleaning, spills of fluids are likely tooccur. The “dry shop” principle encourages spills to be cleaned immediately,without waiting for the spilled fluids to evaporate into the air, be transmittedto land, or to contaminate other surfaces. The following techniques helpprevent spills from happening:
• Collect leaking or dripping fluids in designated drip pans orcontainers. Keep all fluids separated so that they may be properlyrecycled.
• Keep a designated drip pan under the truck while unclipping hoses,unscrewing filters, or removing other parts. The drip pan preventssplattering of fluids and keeps chemicals from penetrating the shopfloor or outside area where the maintenance is taking place.
• Immediately transfer used fluids to proper containers. Never leavedrip pans or other open containers unattended.
Radiator fluids are often acceptable to antifreeze recyclers. This includesfluids used to flush out radiators during cleaning. Reusing the flushing fluidminimizes waste discharges. If a licensed recycler does not accept the spentflushing fluids, consider changing to another brand of fluid that can berecycled.
If the maintenance facility services air conditioners, special equipment mustbe used to collect the Freon or other refrigerant because it is not permissible

Ground Transportation Industry Pollution Prevention
Sector Notebook Project September 199761
to vent the refrigerant to the atmosphere. Reusing the refrigerant on site isless costly than sending the refrigerant to an off site recycler.
VI.C.2. Vehicle Washing
Vehicle washing has become a major environmental compliance issue formost companies that operate a fleet of vehicles. The following pollutionprevention activities will help ensure that a facility is addressing potentialsources of pollution:
• Waste water discharge can be prevented by dry washing vehiclesusing a chemical cleaning and waxing agent, rather than detergent andwater. The dry washing chemical is sprayed on and wiped off withrags. No waste water is generated. Dry washing is labor intensiveand creates solid waste that must be disposed of properly.
• Waste water can be contained by washing at a low point of thefacility, blocking drains from the facility using a containment dike orblanket, or washing on a built-in or a portable containment pad.
• Waste water can be disposed of by evaporation from the containmentarea, or by discharging the waste water to a sanitary sewer system.(Pretreatment of waste wash water generated from manual washingbefore disposal to the sanitary sewer is not usually required forvehicle exterior (no undercarriages or engines) washing. Permissionmust be obtained from the sewer district before waste wash water canbe drained, pumped, or vacuumed to a sanitary sewer connection.
VI.C.3. Stormwater Pollution Prevention
Under the Clean Water Act NPDES requirements, discussed in more detailbelow, truck maintenance facilities must maintain a stormwater pollutionprevention plan. The following information is taken from StormwaterPollution Prevention Plan for the Trucking Industry, American TruckingAssociations, 1993.
An effective pollution prevention plan for trucking facilities strives to preventpollution at the source, before it enters the environment. This is best done byproperly addressing the following potential sources of pollution:
• Underground and above ground storage tanks of petroleum fuel
• Drips, spills, and releases from fueling operations
• Routine maintenance, including tire, battery, fluids, and oil changes
• Containers of antifreeze, solvents, used oil, and other liquid wastes

EXHIBIT 21Storm Water Pollution Prevention Flowchart
ASSESSMENT PHASE • Develop a site map • Inventory and describe exposed
materials • List significant spills and leaks • Test for non-storm water discharges • Evaluate monitoring data • Summarize pollutant sources and risks
PLANNING AND ORGANIZATION • Form Pollution Prevention Team • Review other plans
BMP IDENTIFICATION PHASE • Baseline Best Management Practices • Select activity - and site-specific
BMPs
EVALUATION MONITORING • Perform annual site inspection/BMP
evaluation • Perform recordkeeping and reporting • Review and revise plan
IMPLEMENTATION PHASE • Implement BMPs • Train employees
Source: Stormwater Pollution Prevention Manual for the Trucking Industry, ATA, 1993.
Ground Transportation Industry Pollution Prevention
Sector Notebook Project September 199762
Exhibit 21Storm Water Pollution Prevention Flowchart
• Management of shop drains (sometimes connected to an oil-waterseparator) which may accumulate oil, grease, and other shop wastes
• Vehicle washing operations
• Storage of scrap tires and batteries.
The American Trucking Associations has developed a flowchart, duplicatedas Exhibit 21, that directs the attention of facility managers to the sources ofenvi r o n m e n t acont a m i n a t i o na na l e r tt h ett hp r a c t i c et h ab e se n s u rt h en oo n lp r e v e np o l l u t i o nb ur e s p o nts p i l la no t h eu n p l a n n ei n c i d e n tp r o m p t la ne f f e c t i v e l y

Ground Transportation Industry Pollution Prevention
Sector Notebook Project September 199763

Ground Transportation Industry Pollution Prevention
Sector Notebook Project September 199764
VI.C.4. Alternatively-Fueled Vehicles
One way to reduce vehicle emissions from the trucking industry is to switchto alternative fuels. Natural gas vehicles, for example, are a viable alternativeto gasoline-and diesel-powered transportation. Almost any gasoline- ordiesel-powered vehicle can be converted to run on natural gas including,light-duty trucks and vans, medium-duty trucks, and even heavy-duty truckssuch as semi-tractors. Converting a gasoline-powered vehicle to run onnatural gas involves installing a natural gas fuel system and storage tankswithout removing any existing equipment. Diesel conversions are somewhatmore complicated because they also involve reducing compression andadding a sparked-ignition system. Other fuels suitable for trucks can includemethanol, ethanol, and propane.
Some of the momentum to switch to alternative fuels such as natural gas iscoming from legislation. Over the past few years, Congress has passed evenstricter clean-air laws, as well as incentives to encourage the use ofalternative fuels. Federal (and in some areas State) tax deductions forAlternative Fuel Vehicles (AFVs) and related refueling equipment areavailable. The maximum tax deductions range from $2,000 to $50,000 foreach AFV and up to $100,000 on refueling stations. Deductions on vehicles,including original equipment manufactured vehicles or after-marketconversions, apply to the incremental cost of an AFV over the cost of itsgasoline or diesel counterpart. The deduction for AFVs can be taken byeither an individual or a business, but the deduction on refueling equipmentapplies only to businesses.
VI.D. Pipelines
VI.D.1. Direct Leak Detection Enhancements
Direct leak detection is typically performed by line patrols who inspect thepipeline right-of-way for pools of leaking product and dead vegetation.Section 195.412 of the Federal pipeline safety regulation requires thathazardous liquid pipelines be patrolled 26 times each year. A newtechnology for direct leak detection is chemical sensing cable buried alongthe pipeline right of way. Some cable systems can detect the presence andlocation of hydrocarbon vapors. Other cables locate leaks by absorbingliquids, which results in a loss in the cables' electrical conductivity at anidentifiable location. Sensing cables can offer superior detection times,sensitivity, and location accuracy, especially in gathering lines, where theflows can be too irregular for other methods. These cables must be buriedclose to the pipeline to work well, and some liquid sensing cables must bedug up and replaced after every detection. New burying methods are beingdeveloped for these cables to lower their operating cost.

Ground Transportation Industry Pollution Prevention
Sector Notebook Project September 199765
VI.D.2. Supervisory Control and Data Acquisition (SCADA) Systems
The traditional inferential method of leak detection is called line balance,where one measures the volume of product sent into the pipeline andcompares it with the volume that comes out the other end. Enhancement ofthis method and others are used by SCADA and LDS systems to provide thedispatcher with information that suggests a possible leak. SCADA systemsgive pipeline dispatchers the ability to effectively monitor pipeline conditionsand control a pipeline's operation from a central location. SCADA systemsinclude pipeline sensing devices, a communications network, a centralizedor distributed data processing system, and a user interface for the dispatcher.
SCADA systems continuously monitor, transmit, and process pipelineinformation for the control room dispatcher. Monitoring is conducted usingRemote Terminal Units (RTUs), which are placed at intervals along thepipeline and at associated facilities, such as pump stations and deliveryterminals. RTUs periodically collect data from field instruments, whichmeasure pressure, temperature, flow, and product density. RTUs can alsoreceive information from vapor detectors and tank level gauges in pipelinesystem routing and storage areas. RTUs process this information to varyingdegrees and transmit it for analysis to a central computer through acommunications network. Information from RTUs may be transmitted bycompany-owned lines, by a commercial telephone service, or by usingground- or satellite-based microwave or radio communication.
The leak detection capabilities of most SCADA systems can be enhancedwith additional leak detection software and user interfaces. Field instrumentsspecifically designed for leak detection are also available for SCADAsystems, such as acoustic sensors and hydrocarbon cables.
VI.D.3. Hydrostatic Testing
Pipeline and utility companies test the pipes that comprise their system bothbefore they are buried and when they suspect that a section of pipe may needmaintenance. Hydrostatic testing is the process of filling a section of pipewith water and pressurizing it to a level above normal operating levels. Thisverifies the integrity of the pipeline.
Depending on the location of the pipeline, the water used in a hydrostatic testis drawn from a local river, stream, or lake; taken from municipal supplies;or trucked to the site. After air is bled from the pipeline, a pump raises thepressure inside the pipe to the pre-determined testing level, where it ismaintained and monitored during the test period. Precision measurement

Ground Transportation Industry Pollution Prevention
Sector Notebook Project September 199766
instruments are used to monitor pressures, and a record is maintained to chartthe results.
VI.D.4. Cathodic Protection
Corrosion in pipelines is a common phenomenon, and must be controlled toeffectively prevent pipeline leaks or structural problems. Although modernpipes are constructed of high quality steel, this will nevertheless corrode overtime. Corrosion results from an electrical current that naturally flows from apipe into the surrounding soil. As this occurs, metal loss, or corrosion, results.
One way to impede this process is to insulate the metal from the soil. Thisoccurs in the manufacturing process, when the pipe is coated. The coating isrechecked at the construction site using a detector that looks forimperfections or gouges that could occur during transportation. New coatingis then applied at the welded joints between pipe sections, first bysandblasting the weld, and then applying the new coat.
To further protect the pipeline from corrosion, anodes or “ground beds” areconstructed at strategic points along the pipeline. These groundbeds providecathodic protection by inducing a very small electrical charge into the soil,impeding the flow of electrons to the pipe.
The rectifier that induces the current into the ground bed is regularly checkedby pipeline personnel, who ensure that the system is applying sufficientcurrent to maintain cathodic protection to the pipeline. A single 200 footground bed can protect as much as 50 miles of pipeline, but the low voltagesused does not harm animals or plants in the vicinity.
VI.D.5. Smart Pigs
Surveying a working pipeline for damage or corrosion can be disruptive toconsumers if sections of the pipeline must be taken out of service. Onenondestructive method of evaluation is a device called a smart pig. Smartpigs are designed for use inside larger operating pipelines (as opposed tosmaller distribution lines) to identify possible corrosion defects orabnormalities. Smart pigs are self-contained units consisting of three to fivesections held together by universal joints, allowing them to negotiate bendsin the line. A typical pig will have a recorder section for storing survey data,a magnetic section that creates the magnetic field used to measure pipelineflaws, and a drive section holding the battery power for the unit. Around theperimeter of the pig are the transducers that measure the fluctuations in themagnetic field indicating possible wall abnormalities.
The smart pig is placed into the pipeline at a pig launcher, which is a spur offthe mainline. Once the pig has been loaded, the launcher is pressurized so

Ground Transportation Industry Pollution Prevention
Sector Notebook Project September 199767
that the pig enters the mainline. The pig will travel between five to ten milesper hour while collecting data about the pipeline. To enable the pig to recordits location while gathering data, devices called above ground markers(AGMs) are placed at regular intervals along the surveyed pipeline.
The pig is removed from service at a pig trap or receiver. Crews prepare thereceiving site with a catch pan to collect pipeline liquids pushed ahead of thepig. After removing the pig and placing it back into a holding trough, surveypersonnel remove the tape recorder and download its records. The tape isplaced onto a special playback machine that feeds the data into instrumentsthat analyze the information and print out a log revealing information like thelocation of potential corrosion sites or other anomalies not recognizable byabove-ground inspection methods.
VI.D.6. Breakout Tanks
To prevent spills and leaks, above ground tanks should have secondarycontainment underneath tank bases and piping (or move piping above groundfor daily visual inspection) to capture any releases before soil or groundwateris contaminated. Corrosion protection should be added to tank bottoms.Regular groundwater water monitoring should be employed and baselinemeasurements should be taken at the time of installation.
VI.D.7. Proper Training
In a DOT study of remote control spill reduction technology, most pipelineoperators interviewed felt that the critical link in reducing the number ofincidents and the volume of pipeline spills lies with dispatcher training. Theyfrequently indicated that there was no substitute for a well-trained dispatcher,especially not a software unit designed to automatically shut down thepipeline. The dispatcher is often the final decision-maker in the process ofleak detection and pipeline shutdown. If dispatchers fail to recognize aproblematic situation and fail to intervene, unchecked spills are likely to belarge.

Ground Transportation Industry Pollution Prevention
Sector Notebook Project September 199768

Ground Transportation Industry Federal Statutes and Regulations
Sector Notebook Project September 199769
VII. SUMMARY OF APPLICABLE FEDERAL STATUTES AND REGULATIONS
This section discusses the Federal statutes and regulations that may apply tothis sector. The purpose of this section is to highlight, and briefly describethe applicable Federal requirements, and to provide citations for moredetailed information. The three following sections are included.
• Section VII.A contains a general overview of major statutes
• Section VII.B contains a list of regulations specific to this industry
• Section VII.C contains a list of pending and proposed regulations.
The descriptions within Section VII are intended solely for generalinformation. Depending upon the nature or scope of the activities at aparticular facility, these summaries may or may not necessarily describe allapplicable environmental requirements. Moreover, they do not constituteformal interpretations or clarification of the statutes and regulations. Forfurther information, readers should consult the Code of Federal Regulationsand other State or local regulatory agencies. EPA Hotline contacts are alsoprovided for each major statute.
VII.A. General Description of Major Statutes
Resource Conservation and Recovery Act
The Resource Conservation And Recovery Act (RCRA) of 1976 whichamended the Solid Waste Disposal Act, addresses solid (Subtitle D) andhazardous (Subtitle C) waste management activities. The Hazardous andSolid Waste Amendments (HSWA) of 1984 strengthened RCRA’s wastemanagement provisions and added Subtitle I, which governs undergroundstorage tanks (USTs).
Regulations promulgated pursuant to Subtitle C of RCRA (40 CFR Parts260-299) establish a “cradle-to-grave” system governing hazardous wastefrom the point of generation to disposal. RCRA hazardous wastes include thespecific materials listed in the regulations (commercial chemical products,designated with the code "P" or "U"; hazardous wastes from specificindustries/sources, designated with the code "K"; or hazardous wastes fromnon-specific sources, designated with the code "F") or materials whichexhibit a hazardous waste characteristic (ignitability, corrosivity, reactivity,or toxicity and designated with the code "D").
Regulated entities that generate hazardous waste are subject to wasteaccumulation, manifesting, and record keeping standards. Facilities mustobtain a permit either from EPA or from a State agency which EPA has

Ground Transportation Industry Federal Statutes and Regulations
Sector Notebook Project September 199770
authorized to implement the permitting program if they store hazardouswastes for more than 90 days before treatment or disposal. Facilities maytreat hazardous wastes stored in less-than-ninety-day tanks or containerswithout a permit. Subtitle C permits contain general facility standards suchas contingency plans, emergency procedures, record keeping and reportingrequirements, financial assurance mechanisms, and unit-specific standards.RCRA also contains provisions (40 CFR Part 264 Subpart S and §264.10) forconducting corrective actions which govern the cleanup of releases ofhazardous waste or constituents from solid waste management units atRCRA-regulated facilities.
Although RCRA is a Federal statute, many States implement the RCRAprogram. Currently, EPA has delegated its authority to implement variousprovisions of RCRA to 47 of the 50 States and two U.S. territories.Delegation has not been given to Alaska, Hawaii, or Iowa.
Most RCRA requirements are not industry specific but apply to any companythat generates, transports, treats, stores, or disposes of hazardous waste. Hereare some important RCRA regulatory requirements:
Identification of Solid and Hazardous Wastes (40 CFR Part 261) lays out theprocedure every generator must follow to determine whether the material inquestion is considered a hazardous waste, solid waste, or is exempted fromregulation.
Standards for Generators of Hazardous Waste (40 CFR Part 262)establishes the responsibilities of hazardous waste generators includingobtaining an EPA ID number, preparing a manifest, ensuring properpackaging and labeling, meeting standards for waste accumulation units, andrecordkeeping and reporting requirements. Generators can accumulatehazardous waste for up to 90 days (or 180 days depending on the amount ofwaste generated) without obtaining a permit.
Land Disposal Restrictions (LDRs) (40 CFR Part 268) are regulationsprohibiting the disposal of hazardous waste on land without prior treatment.Under the LDRs program, materials must meet LDR treatment standardsprior to placement in a RCRA land disposal unit (landfill, land treatment unit,waste pile, or surface impoundment). Generators of waste subject to theLDRs must provide notification of such to the designated TSD facility toensure proper treatment prior to disposal.
Used Oil Management Standards (40 CFR Part 279) impose managementrequirements affecting the storage, transportation, burning, processing, andre-refining of the used oil. For parties that merely generate used oil,regulations establish storage standards. For a party considered a used oilprocessor, re-refiner, burner, or marketer (one who generates and sells

Ground Transportation Industry Federal Statutes and Regulations
Sector Notebook Project September 199771
off-specification used oil), additional tracking and paperwork requirementsmust be satisfied.
RCRA contains unit-specific standards for all units used to store, treat, ordispose of hazardous waste, including Tanks and Containers. Tanks andcontainers used to store hazardous waste with a high volatile organicconcentration must meet emission standards under RCRA. Regulations (40CFR Part 264-265, Subpart CC) require generators to test the waste todetermine the concentration of the waste, to satisfy tank and containeremissions standards, and to inspect and monitor regulated units. Theseregulations apply to all facilities that store such waste, including largequantity generators accumulating waste prior to shipment off-site.
Underground Storage Tanks (USTs) containing petroleum and hazardoussubstances are regulated under Subtitle I of RCRA. Subtitle I regulations (40CFR Part 280) contain tank design and release detection requirements, aswell as financial responsibility and corrective action standards for USTs. TheUST program also includes upgrade requirements for existing tanks that mustbe met by December 22, 1998.
Boilers and Industrial Furnaces (BIFs) that use or burn fuel containinghazardous waste must comply with design and operating standards. BIFregulations (40 CFR Part 266, Subpart H) address unit design, provideperformance standards, require emissions monitoring, and restrict the type ofwaste that may be burned.
EPA's RCRA, Superfund and EPCRA Hotline, at (800) 424-9346, respondsto questions and distributes guidance regarding all RCRA regulations. TheRCRA Hotline operates weekdays from 9:00 a.m. to 6:00 p.m., ET, excludingFederal holidays.
Comprehensive Environmental Response, Compensation, and Liability Act
The Comprehensive Environmental Response, Compensation, and LiabilityAct (CERCLA), a 1980 law known commonly as Superfund, authorizes EPAto respond to releases, or threatened releases, of hazardous substances thatmay endanger public health, welfare, or the environment. CERCLA alsoenables EPA to force parties responsible for environmental contamination toclean it up or to reimburse the Superfund for response costs incurred by EPA.The Superfund Amendments and Reauthorization Act (SARA) of 1986revised various sections of CERCLA, extended the taxing authority for theSuperfund, and created a free-standing law, SARA Title III, also known asthe Emergency Planning and Community Right-to-Know Act (EPCRA).
The CERCLA hazardous substance release reporting regulations (40 CFRPart 302) direct the person in charge of a facility to report to the National

Ground Transportation Industry Federal Statutes and Regulations
Sector Notebook Project September 199772
Response Center (NRC) any environmental release of a hazardous substancewhich equals or exceeds a reportable quantity. Reportable quantities arelisted in 40 CFR §302.4. A release report may trigger a response by EPA, orby one or more Federal or State emergency response authorities.
EPA implements hazardous substance responses according to proceduresoutlined in the National Oil and Hazardous Substances Pollution ContingencyPlan (NCP) (40 CFR Part 300). The NCP includes provisions for permanentcleanups, known as remedial actions, and other cleanups referred to asremovals. EPA generally takes remedial actions only at sites on the NationalPriorities List (NPL), which currently includes approximately 1300 sites.Both EPA and states can act at sites; however, EPA provides responsibleparties the opportunity to conduct removal and remedial actions andencourages community involvement throughout the Superfund responseprocess.
EPA's RCRA, Superfund and EPCRA Hotline, at (800) 424-9346, answersquestions and references guidance pertaining to the Superfund program. TheCERCLA Hotline operates weekdays from 9:00 a.m. to 6:00 p.m., ET,excluding Federal holidays.
Emergency Planning And Community Right-To-Know Act
The Superfund Amendments and Reauthorization Act (SARA) of 1986created the Emergency Planning and Community Right-to-Know Act(EPCRA, also known as SARA Title III), a statute designed to improvecommunity access to information about chemical hazards and to facilitate thedevelopment of chemical emergency response plans by State and localgovernments. EPCRA required the establishment of State emergencyresponse commissions (SERCs), responsible for coordinating certainemergency response activities and for appointing local emergency planningcommittees (LEPCs).
EPCRA and the EPCRA regulations (40 CFR Parts 350-372) establish fourtypes of reporting obligations for facilities which store or manage specifiedchemicals:
EPCRA §302 requires facilities to notify the SERC and LEPC of thepresence of any extremely hazardous substance (the list of such substancesis in 40 CFR Part 355, Appendices A and B) if it has such substance in excessof the substance's threshold planning quantity, and directs the facility toappoint an emergency response coordinator.
EPCRA §304 requires the facility to notify the SERC and the LEPC in theevent of a release equaling or exceeding the reportable quantity of aCERCLA hazardous substance or an EPCRA extremely hazardous substance.

Ground Transportation Industry Federal Statutes and Regulations
Sector Notebook Project September 199773
EPCRA §311 and §312 require a facility at which a hazardous chemical, asdefined by the Occupational Safety and Health Act, is present in an amountexceeding a specified threshold to submit to the SERC, LEPC and local firedepartment material safety data sheets (MSDSs) or lists of MSDS's andhazardous chemical inventory forms (also known as Tier I and II forms).This information helps the local government respond in the event of a spillor release of the chemical.
EPCRA §313 requires manufacturing facilities included in SIC codes 20through 39, which have ten or more employees, and which manufacture,process, or use specified chemicals in amounts greater than thresholdquantities, to submit an annual toxic chemical release report. This report,known commonly as the Form R, covers releases and transfers of toxicchemicals to various facilities and environmental media, and allows EPA tocompile the national Toxic Release Inventory (TRI) database.
All information submitted pursuant to EPCRA regulations is publiclyaccessible, unless protected by a trade secret claim.
EPA's RCRA, Superfund and EPCRA Hotline, at (800) 424-9346, answersquestions and distributes guidance regarding the emergency planning andcommunity right-to-know regulations. The EPCRA Hotline operatesweekdays from 9:00 a.m. to 6:00 p.m., ET, excluding Federal holidays.
Clean Water Act
The primary objective of the Federal Water Pollution Control Act, commonlyreferred to as the Clean Water Act (CWA), is to restore and maintain thechemical, physical, and biological integrity of the nation's surface waters.Pollutants regulated under the CWA include "priority" pollutants, includingvarious toxic pollutants; "conventional" pollutants, such as biochemicaloxygen demand (BOD), total suspended solids (TSS), fecal coliform, oil andgrease, and pH; and "non-conventional" pollutants, including any pollutantnot identified as either conventional or priority.
The CWA regulates both direct and indirect discharges. The NationalPollutant Discharge Elimination System (NPDES) program (CWA §502)controls direct discharges into navigable waters. Direct discharges or "pointsource" discharges are from sources such as pipes and sewers. NPDESpermits, issued by either EPA or an authorized State (EPA has authorized 42States to administer the NPDES program), contain industry-specific,technology-based and/or water quality-based limits, and establish pollutantmonitoring requirements. A facility that intends to discharge into the nation'swaters must obtain a permit prior to initiating its discharge. A permitapplicant must provide quantitative analytical data identifying the types of

Ground Transportation Industry Federal Statutes and Regulations
Sector Notebook Project September 199774
pollutants present in the facility's effluent. The permit will then set theconditions and effluent limitations on the facility discharges.
A NPDES permit may also include discharge limits based on Federal or Statewater quality criteria or standards, that were designed to protect designateduses of surface waters, such as supporting aquatic life or recreation. Thesestandards, unlike the technological standards, generally do not take intoaccount technological feasibility or costs. Water quality criteria andstandards vary from State to State, and site to site, depending on the useclassification of the receiving body of water. Most States follow EPAguidelines which propose aquatic life and human health criteria for many ofthe 126 priority pollutants.
Storm Water Discharges
In 1987 the CWA was amended to require EPA to establish a program toaddress storm water discharges. In response, EPA promulgated the NPDESstorm water permit application regulations. These regulations require thatfacilities with the following storm water discharges apply for an NPDESpermit: (1) a discharge associated with industrial activity; (2) a dischargefrom a large or medium municipal storm sewer system; or (3) a dischargewhich EPA or the State determines to contribute to a violation of a waterquality standard or is a significant contributor of pollutants to waters of theUnited States.
The term "storm water discharge associated with industrial activity" meansa storm water discharge from one of 11 categories of industrial activitydefined at 40 CFR 122.26. Six of the categories are defined by SIC codeswhile the other five are identified through narrative descriptions of theregulated industrial activity. If the primary SIC code of the facility is one ofthose identified in the regulations, the facility is subject to the storm waterpermit application requirements. If any activity at a facility is covered by oneof the five narrative categories, storm water discharges from those areaswhere the activities occur are subject to storm water discharge permitapplication requirements.
Those facilities/activities that are subject to storm water discharge permitapplication requirements are identified below. To determine whether aparticular facility falls within one of these categories, consult the regulation.
Category i: Facilities subject to storm water effluent guidelines, new sourceperformance standards, or toxic pollutant effluent standards.
Category ii: Facilities classified as SIC 24-lumber and wood products(except wood kitchen cabinets); SIC 26-paper and allied products (exceptpaperboard containers and products); SIC 28-chemicals and allied products

Ground Transportation Industry Federal Statutes and Regulations
Sector Notebook Project September 199775
(except drugs and paints); SIC 291-petroleum refining; and SIC 311-leathertanning and finishing, 32 (except 323)-stone, clay, glass, and concrete, 33-primary metals, 3441-fabricated structural metal, and 373-ship and boatbuilding and repairing.
Category iii: Facilities classified as SIC 10-metal mining; SIC 12-coalmining; SIC 13-oil and gas extraction; and SIC 14-nonmetallic mineralmining.
Category iv: Hazardous waste treatment, storage, or disposal facilities.
Category v: Landfills, land application sites, and open dumps that receiveor have received industrial wastes.
Category vi: Facilities classified as SIC 5015-used motor vehicle parts; andSIC 5093-automotive scrap and waste material recycling facilities.
Category vii: Steam electric power generating facilities.
Category viii: Facilities classified as SIC 40-railroad transportation; SIC 41-local passenger transportation; SIC 42-trucking and warehousing (exceptpublic warehousing and storage); SIC 43-U.S. Postal Service; SIC 44-watertransportation; SIC 45-transportation by air; and SIC 5171-petroleum bulkstorage stations and terminals.
Category ix: Sewage treatment works.
Category x: Construction activities except operations that result in thedisturbance of less than five acres of total land area.
Category xi: Facilities classified as SIC 20-food and kindred products; SIC21-tobacco products; SIC 22-textile mill products; SIC 23-apparel relatedproducts; SIC 2434-wood kitchen cabinets manufacturing; SIC 25-furnitureand fixtures; SIC 265-paperboard containers and boxes; SIC 267-convertedpaper and paperboard products; SIC 27-printing, publishing, and alliedindustries; SIC 283-drugs; SIC 285-paints, varnishes, lacquer, enamels, andallied products; SIC 30-rubber and plastics; SIC 31-leather and leatherproducts (except leather and tanning and finishing); SIC 323-glass products;SIC 34-fabricated metal products (except fabricated structural metal); SIC35-industrial and commercial machinery and computer equipment; SIC 36-electronic and other electrical equipment and components; SIC 37-transportation equipment (except ship and boat building and repairing); SIC38-measuring, analyzing, and controlling instruments; SIC 39-miscellaneousmanufacturing industries; and SIC 4221-4225-public warehousing andstorage.

Ground Transportation Industry Federal Statutes and Regulations
Sector Notebook Project September 199776
Pretreatment Program
Another type of discharge that is regulated by the CWA is one that goes toa publicly-owned treatment works (POTWs). The national pretreatmentprogram (CWA §307(b)) controls the indirect discharge of pollutants toPOTWs by "industrial users." Facilities regulated under §307(b) must meetcertain pretreatment standards. The goal of the pretreatment program is toprotect municipal wastewater treatment plants from damage that may occurwhen hazardous, toxic, or other wastes are discharged into a sewer systemand to protect the quality of sludge generated by these plants. Discharges toa POTW are regulated primarily by the POTW itself, rather than the State orEPA.
EPA has developed technology-based standards for industrial users ofPOTWs. Different standards apply to existing and new sources within eachcategory. "Categorical" pretreatment standards applicable to an industry ona nationwide basis are developed by EPA. In addition, another kind ofpretreatment standard, "local limits," are developed by the POTW in order toassist the POTW in achieving the effluent limitations in its NPDES permit.
Regardless of whether a State is authorized to implement either the NPDESor the pretreatment program, if it develops its own program, it may enforcerequirements more stringent than Federal standards.
Spill Prevention, Control and Countermeasure Plans
The 1990 Oil Pollution Act requires that facilities that could reasonably beexpected to discharge oil in harmful quantities prepare and implement morerigorous Spill Prevention Control and Countermeasure (SPCC) Plan requiredunder the CWA (40 CFR §112.7). There are also criminal and civil penaltiesfor deliberate or negligent spills of oil. Regulations covering response to oildischarges and contingency plans (40 CFR Part 300), and Facility ResponsePlans to oil discharges (40 CFR §112.20) and for PCB transformers andPCB-containing items were revised and finalized in 1995.
EPA’s Office of Water, at (202) 260-5700, will direct callers with questionsabout the CWA to the appropriate EPA office. EPA also maintains abibliographic database of Office of Water publications which can beaccessed through the Ground Water and Drinking Water resource center, at(202) 260-7786.
Safe Drinking Water Act
The Safe Drinking Water Act (SDWA) mandates that EPA establishregulations to protect human health from contaminants in drinking water.The law authorizes EPA to develop national drinking water standards and to

Ground Transportation Industry Federal Statutes and Regulations
Sector Notebook Project September 199777
create a joint Federal-State system to ensure compliance with these standards.The SDWA also directs EPA to protect underground sources of drinkingwater through the control of underground injection of liquid wastes.
EPA has developed primary and secondary drinking water standards underits SDWA authority. EPA and authorized States enforce the primarydrinking water standards, which are, contaminant-specific concentrationlimits that apply to certain public drinking water supplies. Primary drinkingwater standards consist of maximum contaminant level goals (MCLGs),which are non-enforceable health-based goals, and maximum contaminantlevels (MCLs), which are enforceable limits set as close to MCLGs aspossible, considering cost and feasibility of attainment.
The SDWA Underground Injection Control (UIC) program (40 CFR Parts144-148) is a permit program which protects underground sources ofdrinking water by regulating five classes of injection wells. UIC permitsinclude design, operating, inspection, and monitoring requirements. Wellsused to inject hazardous wastes must also comply with RCRA correctiveaction standards in order to be granted a RCRA permit, and must meetapplicable RCRA land disposal restrictions standards. The UIC permitprogram is primarily State-enforced, since EPA has authorized all but a fewStates to administer the program.
The SDWA also provides for a Federally-implemented Sole Source Aquiferprogram, which prohibits Federal funds from being expended on projects thatmay contaminate the sole or principal source of drinking water for a givenarea, and for a State-implemented Wellhead Protection program, designed toprotect drinking water wells and drinking water recharge areas.
EPA’s Safe Drinking Water Hotline, at (800) 426-4791, answers questionsand distributes guidance pertaining to SDWA standards. The Hotlineoperates from 9:00 a.m. through 5:30 p.m., ET, excluding Federal holidays.
Toxic Substances Control Act
The Toxic Substances Control Act (TSCA) granted EPA authority to createa regulatory framework to collect data on chemicals in order to evaluate,assess, mitigate, and control risks which may be posed by their manufacture,processing, and use. TSCA provides a variety of control methods to preventchemicals from posing unreasonable risk.
TSCA standards may apply at any point during a chemical’s life cycle.Under TSCA §5, EPA has established an inventory of chemical substances.If a chemical is not already on the inventory, and has not been excluded byTSCA, a premanufacture notice (PMN) must be submitted to EPA prior tomanufacture or import. The PMN must identify the chemical and provide

Ground Transportation Industry Federal Statutes and Regulations
Sector Notebook Project September 199778
available information on health and environmental effects. If available dataare not sufficient to evaluate the chemicals effects, EPA can imposerestrictions pending the development of information on its health andenvironmental effects. EPA can also restrict significant new uses ofchemicals based upon factors such as the projected volume and use of thechemical.
Under TSCA §6, EPA can ban the manufacture or distribution in commerce,limit the use, require labeling, or place other restrictions on chemicals thatpose unreasonable risks. Among the chemicals EPA regulates under §6authority are asbestos, chlorofluorocarbons (CFCs), and polychlorinatedbiphenyls (PCBs).
EPA’s TSCA Assistance Information Service, at (202) 554-1404, answersquestions and distributes guidance pertaining to Toxic Substances ControlAct standards. The Service operates from 8:30 a.m. through 4:30 p.m., ET,excluding Federal holidays.
Clean Air Act
The Clean Air Act (CAA) and its amendments, including the Clean Air ActAmendments (CAAA) of 1990, are designed to “protect and enhance thenation's air resources so as to promote the public health and welfare and theproductive capacity of the population.” The CAA consists of six sections,known as Titles, which direct EPA to establish national standards for ambientair quality and for EPA and the States to implement, maintain, and enforcethese standards through a variety of mechanisms. Under the CAAA, manyfacilities will be required to obtain permits for the first time. State and localgovernments oversee, manage, and enforce many of the requirements of theCAAA. CAA regulations appear at 40 CFR Parts 50-99.
Pursuant to Title I of the CAA, EPA has established national ambient airquality standards (NAAQSs) to limit levels of "criteria pollutants," includingcarbon monoxide, lead, nitrogen dioxide, particulate matter, volatile organiccompounds (VOCs), ozone, and sulfur dioxide. Geographic areas that meetNAAQSs for a given pollutant are classified as attainment areas; those thatdo not meet NAAQSs are classified as non-attainment areas. Under section110 of the CAA, each State must develop a State Implementation Plan (SIP)to identify sources of air pollution and to determine what reductions arerequired to meet Federal air quality standards. Revised NAAQSs forparticulates and ozone were proposed in 1996 and may go into effect as earlyas late 1997.
Title I also authorizes EPA to establish New Source Performance Standards(NSPSs), which are nationally uniform emission standards for new stationarysources falling within particular industrial categories. NSPSs are based on

Ground Transportation Industry Federal Statutes and Regulations
Sector Notebook Project September 199779
the pollution control technology available to that category of industrialsource.
Under Title I, EPA establishes and enforces National Emission Standards forHazardous Air Pollutants (NESHAPs), nationally uniform standards orientedtowards controlling particular hazardous air pollutants (HAPs). Title I,section 112(c) of the CAA further directed EPA to develop a list of sourcesthat emit any of 189 HAPs, and to develop regulations for these categoriesof sources. To date EPA has listed 174 categories and developed a schedulefor the establishment of emission standards. The emission standards will bedeveloped for both new and existing sources based on "maximum achievablecontrol technology" (MACT). The MACT is defined as the controltechnology achieving the maximum degree of reduction in the emission ofthe HAPs, taking into account cost and other factors. Title II of the CAA pertains to mobile sources, such as cars, trucks, buses,and planes. Reformulated gasoline, automobile pollution control devices,and vapor recovery nozzles on gas pumps are a few of the mechanisms EPAuses to regulate mobile air emission sources.
Title IV of the CAA establishes a sulfur dioxide nitrous oxide emissionsprogram designed to reduce the formation of acid rain. Reduction of sulfurdioxide releases will be obtained by granting to certain sources limitedemissions allowances, which, beginning in 1995, will be set below previouslevels of sulfur dioxide releases.
Title V of the CAA of 1990 created a permit program for all "major sources"(and certain other sources) regulated under the CAA. One purpose of theoperating permit is to include in a single document all air emissionsrequirements that apply to a given facility. States are developing the permitprograms in accordance with guidance and regulations from EPA. Once aState program is approved by EPA, permits will be issued and monitored bythat State.
Title VI of the CAA is intended to protect stratospheric ozone by phasing outthe manufacture of ozone-depleting chemicals and restrict their use anddistribution. Production of Class I substances, including 15 kinds ofchlorofluorocarbons (CFCs) and chloroform, were phased out (except foressential uses) in 1996.
EPA's Clean Air Technology Center, at (919) 541-0800, provides generalassistance and information on CAA standards. The Stratospheric OzoneInformation Hotline, at (800) 296-1996, provides general information aboutregulations promulgated under Title VI of the CAA, and EPA's EPCRAHotline, at (800) 535-0202, answers questions about accidental releaseprevention under CAA §112(r). In addition, the Clean Air Technology
Ground Transportation Industry Federal Statutes and Regulations
Sector Notebook Project September 199780
Center’s website includes recent CAA rules, EPA guidance documents, andupdates of EPA activities (www.epa.gov/ttn then select Directory and thenCATC).
VII.B. Industry Sector Specific Regulations
The transportation industry is regulated by several different Federal, State,and local agencies. As noted earlier, several government entities regulatespecific transportation sectors. For example, the Department ofTransportation's (DOT's) Research and Special Program Administration isdesigned to ensure the safe, reliable and environmentally sound operation ofthe nation's pipeline transportation system. The DOT has traditionallyestablished national standards that are not affected by local or State laws.
EPA has traditionally relied on delegation to States to meet environmentalstandards, in many cases without regard to the methods used to achievecertain performance standards. This has resulted in States with morestringent air, water, and hazardous waste requirements than the Federalminimums. This document does not attempt to discuss State standards, butrather highlights relevant Federal laws and proposals that affect the rail,trucking, and pipeline industries.
VII.B.1. Rail Transportation
RCRA
Railroad facilities produce a variety of RCRA regulated wastes in the courseof normal operations and utilize underground storage tanks for product andfuel storage. Many railroad facilities qualify as hazardous waste generatorsunder RCRA law. Under RCRA, it is the facility's responsibility todetermine whether or not a waste is hazardous. See 40 CFR 261.31 - 261.33for a full list of EPA hazardous wastes. Some examples of hazardous wastes produced during railroad operationsinclude solvent residues from parts cleaning and spent nickel cadmiumbatteries. Used oil is currently not listed as a hazardous waste under RCRA;however, if used oil meets one of the hazardous waste characteristics (e.g.,ignitable) or is mixed with a listed hazardous waste, it must be stored anddisposed of as a hazardous waste. Most waste oil generated by a railroad(e.g., spilled diesel fuel, motor oil) is not a hazardous waste, but cutting oil,hydraulic oils, and any oil containing heavy metals may require hazardouswaste handling.

Ground Transportation Industry Federal Statutes and Regulations
Sector Notebook Project September 199781
Potential RCRA hazardous wastes generated during railroad operationsinclude:
• Absorbent materials contaminated with hazardous substances
• Aerosol cans, still pressurized
• Cutting oils, hydraulic oils, and oil with heavy metals contamination
• Grit blast wastes
• Ignitable paint thinners
• Lead-based or ignitable paint and related wastes
• Lead acid batteries, non-recycled
• Nickel cadmium, nickel iron, and carbonaire batteries
• Oil filters constructed with "terne"metal (a lead-tin alloy)
• Solvents and solvent sludge.
Clean Water Act
The CWA is set up to regulate two types of water pollution: one from a pointsource (e.g., an outflow pipe from a parts-washing basin), the other from anon-point source (e.g., non-drained ground where oil has dripped). TheCWA applies to a variety of railroad operations. Any railroad operation thatproduces a wastewater (e.g., locomotive, rail car, and small parts washing)or deposits substances on the ground that may be carried away by stormwater(e.g., fuel and oil spills), will trigger CWA requirements.
The CWA requires the following from railroads:
• NPDES or POTW permits
• Stormwater discharge permits
• Spill prevention control and countermeasure (SPCC) plans and spillreporting.

Ground Transportation Industry Federal Statutes and Regulations
Sector Notebook Project September 199782
Exhibit 22Clean Water Act Requirements Applicable to Railroads
NPDES Permits Stormwater Discharge Permits SPCC Plans and Spill Reporting• Sets limits on volume and • For certain industrial facilities, • Triggered by oil or petroleum
nature of discharge required if stormwater drains to product storage in excess of• Sets limits on quantity of a municipal separate storm 660 gallons in a single tank or
certain pollutants sewer system or directly to 1,320 gallons in aggregate at• Contains monitoring and receiving water facility
reporting requirement • Required for facilities involved • Local environmental• Note: facilities discharging to in vehicle maintenance or representatives to be contacted
POTWs do not require NPDES equipment cleaning in case of dischargepermits. • Site maps, drainage and • Documentation of storage
discharge structures, and other vessels, types of containment,information required by permit emergency equipmentapplications available, etc.
The CWA also requires facilities to develop SPCC plans for petroleumproducts, such as oil, if they are stored in large quantities at a particularrailroad. SPCC plans document the location of storage vessels, types ofcontainment, dangers associated with a major release of material from thetanks, types of emergency equipment available at each site, and proceduresfor notifying the appropriate regulatory and emergency agencies. No SPCCplan is considered complete until it has been reviewed and certified by aRegistered Professional Engineer.
Clean Air Act
The CAA establishes two major categories for air pollution regulation:mobile sources (e.g., automobiles, locomotives) and stationary sources (e.g.,power boilers, solvent-based cleaning stations). Possible air pollutionsources for the railroad industry include boilers, incinerators, forges,foundries, painting or refinishing operations, shop blasting and dustcollection control systems, degreasers, and the filling and maintaining of fuelstorage tanks.
The CAA regulations on chlorofluorocarbons (CFCs) and asbestos-containing materials also affect railroad operations. Equipment containingCFCs, such as refrigeration units or air conditioning systems, are common.In addition, many old railroad facilities have asbestos-containing materialsin floor tiles, ceiling tiles, siding, or thermal system insulation.
Title II of the 1990 CAA Amendments deals with "mobile sources" and seeksto phase in a new set of limits on emissions between 1994 and 1998. Ifnecessary, the EPA has discretion to implement an additional round ofmobile source emission limits in 2003.
Section 213(a)(5) of the CAA requires EPA to regulate emissions from
Ground Transportation Industry Federal Statutes and Regulations
Sector Notebook Project September 199783
locomotives. EPA is expecting to propose locomotive emission regulationsin the latter part of 1996 and issue final regulations in the latter part of 1997.The final regulations are expected to impose emission limits onremanufactured and new locomotives.
TSCA
Railroad operations may be affected by TSCA with respect to electricalequipment, such as transformers, containing PCBs. TSCA regulationsrequire proper use, inspection, labeling and marking, recordkeeping, storage,reporting, transportation, management, and disposal of all equipmentcontaining PCBs.
CERCLA
Under CERCLA, incidents must be immediately reported when any spill orrelease exceeds the Reportable Quantity (RQ). Such a release must bereported if it:
• Occurs on a railroad's property.
• Occurs during transport
• Occurs at a mechanical fixed facility like repair shops or engineeringoperations.
EPCRA
EPCRA requires companies to identify their facilities to enforcementagencies and provide certain data about the chemicals used at those facilities.EPCRA does not require the reporting of spills that are confined to theboundaries of a facility. All railroads with fixed facilities should maintainMaterial Safety Data Sheets (MSDSs) for the materials used or stored at thefacility. Hard copies should be kept at the facility's site or be available bycomputer or fax. The transportation of hazardous materials and storageincident to such transportation is exempted from EPCRA requirements.
FIFRA
FIFRA regulations are applicable to railroad operations where herbicides areused to control weeds and brush, or when pesticides and rodenticides areused for pest control in company buildings. FIFRA can also apply to thefield application of creosote when bridge timbers or switch ties are installed.
Railroad operations should only apply herbicides, both general and restricted

Ground Transportation Industry Federal Statutes and Regulations
Sector Notebook Project September 199784
use, according to label instructions. Certification is required for use ofrestricted use herbicides. Railroads often use outside contractors to applythese products. The National Railroad Contractors Association, anorganization comprised of railroad weed control contractors, providestraining for restricted use herbicide applicators.
Oil Pollution Act of 1990
See page 84.
VII.B.2. Trucking
Clean Water Act - NPDES Requirements
As discussed above under the general description of the Clean Water Act,EPA published storm water regulations on November 16, 1990, whichrequire certain dischargers of storm water to waters of the U.S. to apply forNPDES permits. According to the final rule, facilities with a "storm waterdischarge associated with industrial activities" are required to apply for astorm water permit." The rule states that transportation facilities classifiedas SIC 40, 41, 42 (except 4221-4225), 43, 44, and 5171 which have vehiclemaintenance shops, equipment cleaning operations, or airpost deicingoperations are considered to have a storm water discharge associated withindustrial activity. However, only those portions of the facility that are eitherinvolved in vehicle maintenance (including vehicle rehabilitation, mechanicalrepairs, painting, fueling, and lubrication), equipment cleaning operations,airpost deicing operations, or which are otherwise identified underparagraphs (b)(14)(I)-(xi) of section 122.26 are considered to be associatedwith industrial activity.
Storm water discharges associated with industrial activity that reach watersof the U.S. through municipal separate storm sewer systems (MS4s) are alsorequired to obtain NPDES storm water permit coverage. Discharges of stormwater to a combined sewer system or to a POTW are excluded.
The storm water regulation presents two options for storm water dischargesassociated with industrial activity. The first option is to submit an individualapplication consisting of NPDES Forms 1 and 2F. The second option is tofile a Notice of Intent (NOI) to be covered under a general permit.Regardless of which permit option a facility selects, the resulting storm waterdischarge permit will most likely contain a requirement to develop andimplement a Storm Water Pollution Prevention Plan. Trucking companieswhich store petroleum products in quantities over 1320 gallons in aboveground tanks are also required to develop a Spill Prevention Control andCountermeasures plan (SPCC).

Ground Transportation Industry Federal Statutes and Regulations
Sector Notebook Project September 199785
Clean Air Act - Emissions Standards
The most significant CAA regulations under the CAA that affect the truckingindustry address mobile source air emissions from truck engines. EPA hasset limits on exhaust emissions from new heavy-duty engines. EPAconsiders heavy-duty truck engines to be those in vehicles weighing at least8500 pounds gross vehicle weight rating (GVWR). In 1994, the regulationsrequired all heavy-duty truck engines to reduce the emission of nitrogenoxides (NOx) from 5.0g/bhp-hr to 4.0 g/bhp-hr by 1998. Emissionsstandards are also set for hydrocarbons (HC), carbon monoxide (CO), andparticulates (PM). Exhibit 23 displays the past, current, and future emissionstandards for heavy-duty truck engines.
Exhibit 23Heavy-Duty Truck Engine Emission Standards
(g/bhp-hr measured during EPA heavy-duty engine test)Model Year NOx HC CO PM
1991 6 1.3 15.5 0.61994 5 1.3 15.5 0.251998 4 1.3 15.5 0.1Source: Motor Trucking Engineering Handbook, 1994.
CAA regulations mandate the use of alternate fuels for fleets of vehicles inthe 8500-26,000 pound class that operate in 22 of the country’s most pollutedareas. These fleets will be required to purchase 50 percent of their new orreplacement vehicles as clean fuel vehicles in any one of the covered areas.Alternative fuels are defined by their ability to reduce NOx and non-methanehydrocarbon emissions by a combined 50 percent from diesel baseline levels,although a 30 percent reduction is permitted if 50 percent is unattainable.
In large part due to the 1993 introduction of congressionally mandated low-sulfur, limited aromatic diesel fuel, manufacturers of diesel engines havebeen able to closely approach the 1994 emission limits and to focus theirefforts on controlling particulates. New engine designs have been used toachieve more efficient and cleaner combustion (Motor Trucking EngineeringHandbook, James W. Fitch, 1994).
Truck maintenance facilities may face CAA issues for vapor recoverysystems on underground fuel tanks, waste oil to energy shop heaters, vehiclepainting operations, or CFC recycling and recovery systems.
RCRA
Hazardous waste transportation is a highly regulated and specialized segmentof the trucking industry, covered by extensive EPA and DOT regulations.The majority of general freight trucking companies do not transport

Ground Transportation Industry Federal Statutes and Regulations
Sector Notebook Project September 199786
hazardous waste. Nevertheless, RCRA issues at trucking facilities includeseveral non-transportation activities.
Some fluids used in truck maintenance are considered hazardous waste,requiring specific storage treatment, and disposal. Waste accumulated orgenerated during trucking maintenance may cause facilities to be consideredsmall or large quantity generators depending on the volume waste. Theprimary RCRA issues for maintenance facilities are used oil, lead-acid motorvehicle batteries, vehicle maintenance fluids, and scrap tire disposal.
EPCRA
Most trucking companies do not store listed chemicals for use in theirfacilities. The only exception is diesel fuel or gasoline, which when storedat facilities in quantities slightly over 10,000 gallons, requires reporting toLocal Emergency Response Commissions (LERCs) and State EmergencyResponse Commissions (SERCs). Chemicals in transition are exempt frominventory reporting under EPCRA. This includes all hazardous materialsshipments in packages or bulk quantities.
OPA
OPA imposes contingency planning and readiness requirements on certainfacilities defined to include rolling stock and motor vehicles. Theserequirements may affect some trucking establishments.
VII.B.3. Pipelines
Almost all of the petroleum feed stock and products used in the U.S. are, atsome point, transported through a Federally-regulated pipeline. The Officeof Pipeline Safety (OPS), part of the DOT's Research and Special ProgramsAdministration, regulate essentially all of the approximately 155,000 milesof hazardous liquid pipelines in the U.S., as well as the approximately255,000 miles of gas transmission lines.
RCRA
Natural gas pipelines do not generate significant quantities of listedhazardous waste. Typical pipeline wastes include condensate, cleaningsolvents, and used oil. Each gas pipeline compressor station typicallyproduces an average of 20,000 gallons of used oil each year. This figuredepends on the amount of maintenance performed on engines, how often theengines are running, and how much oil is drained from the engines. UnderRCRA, used oil is not necessarily a hazardous waste and most gas pipelinecompanies sell it to refiners.

Ground Transportation Industry Federal Statutes and Regulations
Sector Notebook Project September 199787
Water contaminated with constituents of crude oil and petroleum can beregulated under RCRA. Oil pipelines generate hazardous waste whenhydrocarbons are mixed with water through pressure testing duringinstallation or through settling in tank bottoms. Oil pipelines can alsogenerate hazardous sludge that results from pigging operations. At pigreceipt sites, scraper and cleaning pigs deposit waste materials that oftencontain hazardous levels of benzene and/or metals.
With regard to storage tanks, RCRA covers hazardous wastes (rather thanproducts) stored in tanks, and such tanks must have secondary containment.EPA has the authority to issue administrative orders requiring cleanup orproduct releases causing "imminent and substantial endangerment to healthor the environment."
OPA
Under the Oil Pollution Act (OPA), the owner or operator of an oil pipelineis liable for removal costs and damages caused by the discharge of oil ontoa U.S. shoreline or into navigable waters. The OPA also imposesrequirements on affected facilities concerning contingency planning andreadiness. Under previous EPA regulations, facilities with the potential todischarge oil were required to have spill prevention, control, andcountermeasure (SPCC) plans. Under new requirements, facilities that couldbe reasonably expected to cause "substantial harm" to the environment by adischarge of oil into navigable waters may be required to adopt such plans.
The DOT's Office of Pipeline Safety (OPS) is responsible for implementingOPA requirements as they apply to onshore oil pipelines that couldreasonably be expected to cause significant and substantial harm to theenvironment by discharging oil into the navigable waters of the U.S. andadjoining shorelines. The OPA applies to all oil pipelines, whether or notthey are currently exempt from existing Federal regulations or statutes.
Storage tank facilities that could cause significant and substantial harm to theenvironment by discharging to navigable water must develop facilityresponse plans and submit them to the Federal government for approval. Theact includes extensive liability provisions for spills to navigable waters.
Pipeline Safety Act
Congress passed the Pipeline Safety Act in 1992. The most far-reachingeffect of the Act is the expansion of OPS' traditional safety mission to includeenvironmental protection. Major provisions in the Act relate to excess flowvalves, cast iron pipelines, gathering lines, customer-owned service lines,
Ground Transportation Industry Federal Statutes and Regulations
Sector Notebook Project September 199788
underwater inspection and burial, underwater abandoned pipeline facilities,low internal stress pipelines, and emergency flow restricting devices, andcontain increased inspection requirements including use of "smart pigs," andoperator qualification testing. The Act also provides a statutory basis for theDOT’s Research and Special Programs Administration (RSPA), which hadbeen initially established by the Secretary of Transportation in 1977. TheRSPA Administrator is to be appointed by the President and confirmed by theSenate.
Natural Gas Pipeline Safety Act and the Hazardous Liquid Pipeline Safety Act
The Natural Gas Pipeline Safety Act (NGPSA) of 1968 provides for Federalsafety regulation of pipeline facilities used in the transportation of naturalgases. The Hazardous Liquid Pipeline Safety Act (HLPSA) of 1979 providesfor safety regulation of pipeline facilities used in the transportation ofhazardous liquids. Both provide a framework for promoting pipeline safetythrough exclusive Federal regulation of interstate pipeline facilities, andFederal delegation to the States for all or part of the responsibility forintrastate pipeline facilities. To provide expertise during development ofpipeline safety regulations, NGPSA and HLPSA established two pipelinesafety advisory committees, the Technical Pipeline Safety StandardsCommittee and the Technical Hazardous Liquid Pipeline Safety StandardsCommittee, respectively. The Committees review proposed regulations fortechnical feasibility, reasonableness, and practicability. The Committees alsoprovide advice to the DOT on pipeline safety and environmental issues.
TSCA
Some natural gas pipelines used PCBs in their system through the 1980s.PCBs were widely used in transformers, as heat transfer fluids, and in sometypes of compressor lubricants. In 1989, the Gas Research Institute began aprogram to deal with the management of PCB residue. The first stepinvolved measuring and analyzing statistical data on PCB contamination ofgas transmission pipelines and reviewing remediation programs involvingcondensate, soil, pipelines, and surface facilities. The Gas Research Institutedeveloped information on physical properties and analytical methods for PCBcondensate mixtures, the soil-water partitioning behavior of these mixtures,and an evaluation of the risks associated with typical pipeline operations andPCB abandonment.
CAA
The Clean Air Act affects pipeline system design, operation, andmaintenance. Materials such as carbon dioxide, hydrogen sulfide, andmercaptan sulfur are often present in the field gathering systems that movenatural gas from wells to processing plants. Pipeline operators must track

Ground Transportation Industry Federal Statutes and Regulations
Sector Notebook Project September 199789
emissions from compressor and pump stations. Fugitive emissions ofbenzene from seals on pumps, compressors, valves, meters, and storage tanksmust also be evaluated and controlled.
In areas that meet Federal clean air standards, new or modified "majorsources" (e.g., tank farms) must install "Best Available Control Technology"(BACT). In areas that do not meet Federal clean air standards, new ormodified major sources must utilize "Lowest Achievable Emission Rate"technology, which must be at least as stringent as BACT; existing majorsources must utilize designated "Reasonably Available Control Technology,"which may be less stringent than BACT. For major sources that emit"Hazardous Air Pollutants," EPA is developing "Maximum AchievableControl Technology" regulations.
CWA
The Spill Prevention Control and Countermeasures (SPCC) program coverspetroleum above ground tank facilities that may affect "navigable waters."The SPCC program requires reporting of spills to navigable waters anddevelopment of contingency plans that must be kept on-site. EPA has theauthority to issue administrative orders requiring cleanup.
SDWA
Regulations promulgated under the Safe Drinking Water Act classifyunderground injection wells according to the type of operation or substanceinvolved. 40 CFR §144.6(b) describes Class II injection wells as those whichinject fluids:
• Which are brought to the surface in connection with natural gasstorage operations, or conventional oil or natural gas production andmay be commingled with waste waters from gas plants which are anintegral part of production operations, unless those waters areclassified as a hazardous waste at the time of injection.
• For enhanced recovery of oil or natural gas; and
• For storage of hydrocarbons which are liquid at standard temperatureand pressure.
Many wells associated with the oil and gas industry, including salt waterinjection wells, enhanced recovery wells, and wells injecting liquidhydrocarbons for storage, are likely to be regulated under the UndergroundInjection Control (UIC) program.
Under the UIC, wells are required to obtain and adhere to the requirements

Ground Transportation Industry Federal Statutes and Regulations
Sector Notebook Project September 199790
of operating permits. The permit application must prove to the permittingauthority (usually the State) that operation of the underground injection wellwill not endanger drinking water sources. Class II permits are issued for thelife of the well, but can be reviewed every five years.
VII.C. Pending and Proposed Regulatory Requirements
Regulations are currently under development for the transportationequipment cleaning industry. These regulations, when effective, will impactrailroads that clean the interior of tank cars, hopper cars, and box cars, andproduce wastewater. If a tank car has carried hazardous materials, its carcleaning waste waters may require proper handling under RCRA in additionto that for normal waste waters due to contamination from leftover tankcontents or "heel."
In addition there may soon be an effluent guideline on Metal Products andMachinery, which will apply to the rail industry especially for metalmachining shops.

Ground Transportation Industry Compliance and Enforcement History
Sector Notebook Project September 199791
VIII. COMPLIANCE AND ENFORCEMENT HISTORY
VIII.A. Background
Until recently, EPA has focused much of its attention on measuringcompliance with specific environmental statutes. This approach allows theAgency to track compliance with the Clean Air Act, the ResourceConservation and Recovery Act, the Clean Water Act, and otherenvironmental statutes. Within the last several years, the Agency has begunto supplement single-media compliance indicators with facility-specific,multimedia indicators of compliance. In doing so, EPA is in a better positionto track compliance with all statutes at the facility level, and within specificindustrial sectors.
A major step in building the capacity to compile multimedia data forindustrial sectors was the creation of EPA's Integrated Data for EnforcementAnalysis (IDEA) system. IDEA has the capacity to "read into" the Agency'ssingle-media databases, extract compliance records, and match the recordsto individual facilities. The IDEA system can match Air, Water, Waste,Toxics/Pesticides/EPCRA, TRI, and Enforcement Docket records for a givenfacility, and generate a list of historical permit, inspection, and enforcementactivity. IDEA also has the capability to analyze data by geographic area andcorporate holder. As the capacity to generate multimedia compliance dataimproves, EPA will make available more in-depth compliance andenforcement information. Additionally, sector-specific measures of successfor compliance assistance efforts are under development.
VIII.B. Compliance and Enforcement Profile Description
Using inspection, violation and enforcement data from the IDEA system, thissection provides information regarding the historical compliance andenforcement activity of this sector. In order to mirror the facility universereported in the Toxic Chemical Profile, the data reported within this sectionconsists of records only from the TRI reporting universe. With this decision,the selection criteria are consistent across sectors with certain exceptions.For the sectors that do not normally report to the TRI program, data havebeen provided from EPA's Facility Indexing System (FINDS) which tracksfacilities in all media databases. Please note, in this section, EPA does notattempt to define the actual number of facilities that fall within each sector.Instead, the section portrays the records of a subset of facilities within thesector that are well defined within EPA databases.
As a check on the relative size of the full sector universe, most notebookscontain an estimated number of facilities within the sector according to theBureau of Census (See Section II). With sectors dominated by smallbusinesses, such as metal finishers and printers, the reporting universe within

Ground Transportation Industry Compliance and Enforcement History
EPA Regions include the following states: I (CT, MA, ME, RI, NH, VT); II (NJ, NY, PR, VI); III (DC, DE, MD,1
PA, VA, WV); IV (AL, FL, GA, KY, MS, NC, SC, TN); V (IL, IN, MI, MN, OH, WI); VI (AR, LA, NM, OK, TX);VII (IA, KS, MO, NE); VIII (CO, MT, ND, SD, UT, WY); IX (AZ, CA, HI, NV, Pacific Trust Territories); X (AK,ID, OR, WA).
Sector Notebook Project September 199792
the EPA databases may be small in comparison to Census data. However,the group selected for inclusion in this data analysis section should beconsistent with this sector's general make-up.
Following this introduction is a list defining each data column presentedwithin this section. These values represent a retrospective summary ofinspections and enforcement actions, and reflect solely EPA, State, and localcompliance assurance activities that have been entered into EPA databases.To identify any changes in trends, the EPA ran two data queries, one for thepast five calendar years (April 1, 1992 to March 31, 1997) and the other forthe most recent twelve-month period (April 1, 1996 to March 31, 1997). Thefive-year analysis gives an average level of activity for that period forcomparison to the more recent activity.
Because most inspections focus on single-media requirements, the dataqueries presented in this section are taken from single media databases.These databases do not provide data on whether inspections are state/local orEPA-led. However, the table breaking down the universe of violations doesgive the reader a crude measurement of the EPA's and states' efforts withineach media program. The presented data illustrate the variations across EPARegions for certain sectors. This variation may be attributable to state/local1
data entry variations, specific geographic concentrations, proximity topopulation centers, sensitive ecosystems, highly toxic chemicals used inproduction, or historical noncompliance. Hence, the exhibited data do notrank regional performance or necessarily reflect which regions may have themost compliance problems.
Compliance and Enforcement Data Definitions
General Definitions
Facility Indexing System (FINDS) -- this system assigns a common facilitynumber to EPA single-media permit records. The FINDS identificationnumber allows EPA to compile and review all permit, compliance,enforcement and pollutant release data for any given regulated facility.
Integrated Data for Enforcement Analysis (IDEA) -- is a data integrationsystem that can retrieve information from the major EPA program officedatabases. IDEA uses the FINDS identification number to link separate datarecords from EPA’s databases. This allows retrieval of records from acrossmedia or statutes for any given facility, thus creating a f

Ground Transportation Industry Compliance and Enforcement History
Sector Notebook Project September 199793
records for that facility. Some of the data systems accessible through IDEAare: AIRS (Air Facility Indexing and Retrieval System, Office of Air andRadiation), PCS (Permit Compliance System, Office of Water), RCRIS(Resource Conservation and Recovery Information System, Office of SolidWaste), NCDB (National Compliance Data Base, Office of Prevention,Pesticides, and Toxic Substances), CERCLIS (ComprehensiveEnvironmental and Liability Information System, Superfund), and TRIS(Toxic Release Inventory System). IDEA also contains information fromoutside sources such as Dun and Bradstreet and the Occupational Safety andHealth Administration (OSHA). Most data queries displayed in notebooksections IV and VII were conducted using IDEA.
Data Table Column Heading Definitions
Facilities in Search -- are based on the universe of TRI reporters within thelisted SIC code range. For industries not covered under TRI reportingrequirements (metal mining, nonmetallic mineral mining, electric powergeneration, ground transportation, water transportation, and dry cleaning), orindustries in which only a very small fraction of facilities report to TRI (e.g.,printing), the notebook uses the FINDS universe for executing data queries.The SIC code range selected for each search is defined by each notebook'sselected SIC code coverage described in Section II.
Facilities Inspected --- indicates the level of EPA and state agencyinspections for the facilities in this data search. These values show whatpercentage of the facility universe is inspected in a one-year or five-yearperiod.
Number of Inspections -- measures the total number of inspectionsconducted in this sector. An inspection event is counted each time it isentered into a single media database.
Average Time Between Inspections -- provides an average length of time,expressed in months, between compliance inspections at a facility within thedefined universe.
Facilities with One or More Enforcement Actions -- expresses the numberof facilities that were the subject of at least one enforcement action within thedefined time period. This category is broken down further into federal andstate actions. Data are obtained for administrative, civil/judicial, andcriminal enforcement actions. Administrative actions include Notices ofViolation (NOVs). A facility with multiple enforcement actions is onlycounted once in this column, e.g., a facility with 3 enforcement actionscounts as 1 facility.

Ground Transportation Industry Compliance and Enforcement History
Sector Notebook Project September 199794
Total Enforcement Actions -- describes the total number of enforcementactions identified for an industrial sector across all environmental statutes.A facility with multiple enforcement actions is counted multiple times, e.g.,a facility with 3 enforcement actions counts as 3.
State Lead Actions -- shows what percentage of the total enforcementactions are taken by state and local environmental agencies. Varying levelsof use by states of EPA data systems may limit the volume of actionsrecorded as state enforcement activity. Some states extensively reportenforcement activities into EPA data systems, while other states may usetheir own data systems.
Federal Lead Actions -- shows what percentage of the total enforcementactions are taken by the United States Environmental Protection Agency.This value includes referrals from state agencies. Many of these actionsresult from coordinated or joint state/federal efforts.
Enforcement to Inspection Rate -- is a ratio of enforcement actions toinspections, and is presented for comparative purposes only. This ratio is arough indicator of the relationship between inspections and enforcement. Itrelates the number of enforcement actions and the number of inspections thatoccurred within the one-year or five-year period. This ratio includes theinspections and enforcement actions reported under the Clean Water Act(CWA), the Clean Air Act (CAA) and the Resource Conservation andRecovery Act (RCRA). Inspections and actions from the TSCA/FIFRA/EPCRA database are not factored into this ratio because most of the actionstaken under these programs are not the result of facility inspections. Also,this ratio does not account for enforcement actions arising from non-inspection compliance monitoring activities (e.g., self-reported waterdischarges) that can result in enforcement action within the CAA, CWA, andRCRA.
Facilities with One or More Violations Identified -- indicates thepercentage of inspected facilities having a violation identified in one of thefollowing data categories: In Violation or Significant Violation Status(CAA); Reportable Noncompliance, Current Year Noncompliance,Significant Noncompliance (CWA); Noncompliance and SignificantNoncompliance (FIFRA, TSCA, and EPCRA); Unresolved Violation andUnresolved High Priority Violation (RCRA). The values presented for thiscolumn reflect the extent of noncompliance within the measured time frame,but do not distinguish between the severity of the noncompliance. Violationstatus may be a precursor to an enforcement action, but does not necessarilyindicate that an enforcement action will occur.

Ground Transportation Industry Compliance and Enforcement History
Sector Notebook Project September 199795
Media Breakdown of Enforcement Actions and Inspections -- fourcolumns identify the proportion of total inspections and enforcement actionswithin EPA Air, Water, Waste, and TSCA/FIFRA/EPCRA databases. Eachcolumn is a percentage of either the lActions” column.
VIII.C. Industry Sector Compliance History
Exhibits 24-31 illustrate recent enforcement activity within the transportationindustry. Of the 12,904 inspections conducted at rail, trucking, and oil andgas pipeline facilities over a five year period, 774, or 6 percent, resulted inenforcement actions. Of the three transportation industries addressed by thisprofile, the pipeline industry has received greater scrutiny from Federal andState inspectors, although certain portions of the trucking industry have alsobeen subject to environmental compliance inspections. While the greatestnumber of inspections of rail facilities addressed the CWA, the truckingindustry had more RCRA inspections while the pipeline industry was subjectto the most inspections under the CAA.

Ground Transportation Industry Compliance and Enforcement History
Sector Notebook Project September 199796
Exhibit 24 Five-Year Enforcement and Compliance Summary for Transportation Sectors
A B C D E F G H I JSIC Facilities Facilities Number Average Facilities Total State Federal Enforcemen
Code in Search Inspected of Number of w/One or Enforcement Lead Lead t toInspections Months More Actions Actions Actions Inspection
Between Enforcemen RateInspections t Actions
Rail 4011 434 165 717 36 30 51 74% 26% 0.07
4013 136 62 328 25 9 13 85% 15% 0.04
Trucking 4212 991 236 987 60 52 147 83% 17% 0.15
4213 475 205 737 39 34 69 88% 12% 0.09
4214 195 87 539 22 22 43 81% 19% 0.08
4215 103 31 60 103 0 0 - - -
4221 219 119 337 39 10 15 73% 27% 0.04
4222 63 16 52 73 3 6 33% 67% 0.12
4225 427 151 599 43 25 54 94% 6% 0.09
4226 479 264 1,828 16 75 182 87% 13% 0.1
4231 492 180 747 40 28 68 85% 15% 0.09
Oil 4612 377 189 780 29 16 85 82% 18% 0.11
Pipelines 4613 362 193 991 22 16 71 86% 14% 0.07
4619 45 21 57 47 3 5 100% 0% 0.09
Natural 4922 2,942 1,380 4,566 39 88 122 93% 7% 0.03
Gas 4923 190 84 342 33 2 3 100% 0% 0.01
Pipelines 4924 118 53 210 34 5 7 100% 0% 0.03
4925 192 112 620 19 12 31 87% 13% 0.05
4932 30 17 90 20 4 4 100% 0% 0.04
Totals 7,786 3,263 12,904 36 375 774 84% 16% 0.06

Ground Transportation Industry Compliance and Enforcement History
Sector Notebook Project September 199797
Exhibit 25 One-Year Enforcement and Compliance Summary for Transportation Sectors
A B C D E F G H
SIC Facilities Facilities Number of Facilities w/One or More Facilities w/One or Total EnforcementCode in Search Inspected Inspections Violations More Enforcement Enforcement to Inspection
Actions Actions Rate
Number Percent* Number Percent*Rail 4011 434 73 125 49 67% 6 8% 7 0.06
4013 136 28 60 23 82% 1 4% 1 0.02
Trucking 4212 991 82 167 87 106% 11 13% 16 0.10
4213 475 70 126 59 84% 10 14% 16 0.13
4214 195 43 106 46 107% 9 21% 10 0.09
4215 103 8 8 5 63% 0 0% 0 -
4221 219 58 71 24 41% 1 2% 1 0.01
4222 63 4 6 2 50% 0 0% 0 -
4225 427 58 95 70 121% 2 3% 2 0.02
4226 479 152 317 85 56% 17 11% 24 0.08
4231 492 65 137 45 69% 8 12% 10 0.07
Oil 4612 377 114 185 20 18% 2 2% 4 0.02
Pipelines 4613 362 122 186 32 26% 3 2% 5 0.03
4619 45 10 45 6 60% 0 0% 0 -
Natural 4922 2,942 708 963 159 22% 23 3% 23 0.02
Gas 4923 190 41 66 13 32% 1 2% 2 0.03
Pipelines 4924 118 29 50 9 31% 2 7% 3 0.06
4925 192 58 107 16 28% 3 5% 9 0.08
4932 30 8 13 5 63% 1 13% 1 0.08
Totals 7,786 1585 2499 681 27% 85 3% 103 0.04
*Percentages in Columns E and F are based on the number of facilities inspected (Column C). Percentages can exceed 100%because violations and actions can occur without a facility inspection.
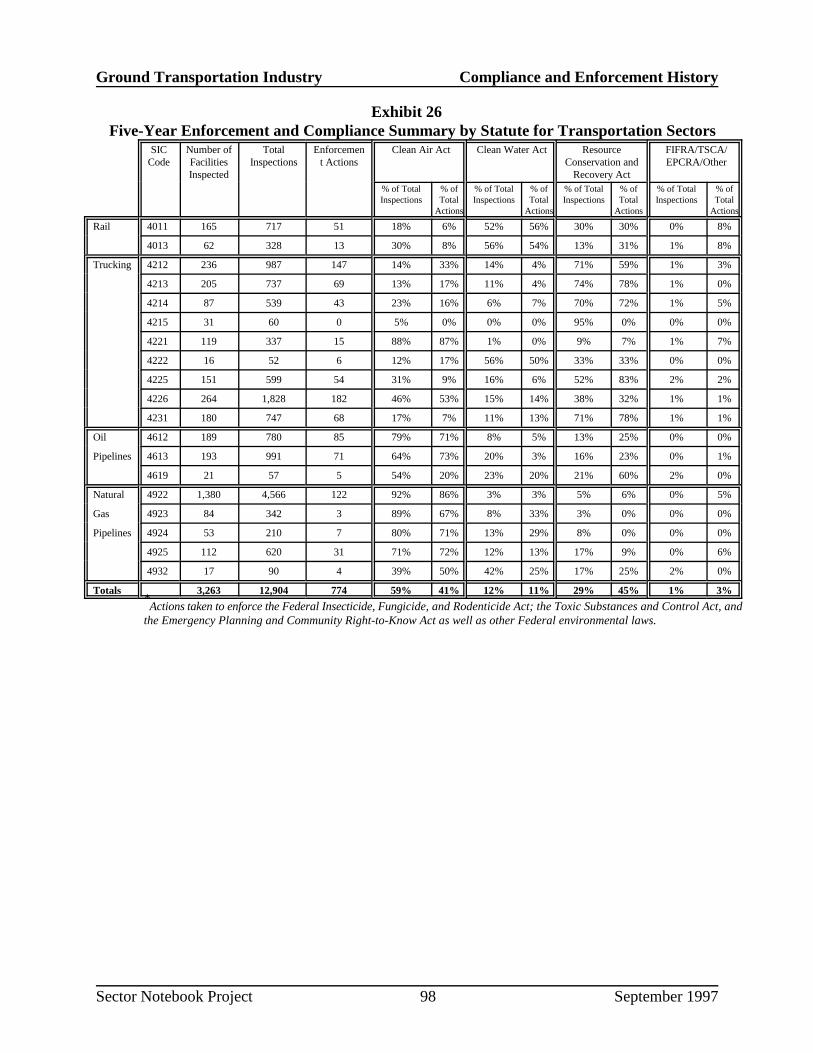
Ground Transportation Industry Compliance and Enforcement History
Sector Notebook Project September 199798
Exhibit 26 Five-Year Enforcement and Compliance Summary by Statute for Transportation Sectors
SIC Number of Total Enforcemen Clean Air Act Clean Water Act Resource FIFRA/TSCA/Code Facilities Inspections t Actions Conservation and EPCRA/Other
Inspected Recovery Act% of Total % of % of Total % of % of Total % of % of Total % ofInspections Total Inspections Total Inspections Total Inspections Total
Actions Actions Actions Actions
Rail 4011 165 717 51 18% 6% 52% 56% 30% 30% 0% 8%
4013 62 328 13 30% 8% 56% 54% 13% 31% 1% 8%
Trucking 4212 236 987 147 14% 33% 14% 4% 71% 59% 1% 3%
4213 205 737 69 13% 17% 11% 4% 74% 78% 1% 0%
4214 87 539 43 23% 16% 6% 7% 70% 72% 1% 5%
4215 31 60 0 5% 0% 0% 0% 95% 0% 0% 0%
4221 119 337 15 88% 87% 1% 0% 9% 7% 1% 7%
4222 16 52 6 12% 17% 56% 50% 33% 33% 0% 0%
4225 151 599 54 31% 9% 16% 6% 52% 83% 2% 2%
4226 264 1,828 182 46% 53% 15% 14% 38% 32% 1% 1%
4231 180 747 68 17% 7% 11% 13% 71% 78% 1% 1%
Oil 4612 189 780 85 79% 71% 8% 5% 13% 25% 0% 0%
Pipelines 4613 193 991 71 64% 73% 20% 3% 16% 23% 0% 1%
4619 21 57 5 54% 20% 23% 20% 21% 60% 2% 0%
Natural 4922 1,380 4,566 122 92% 86% 3% 3% 5% 6% 0% 5%
Gas 4923 84 342 3 89% 67% 8% 33% 3% 0% 0% 0%
Pipelines 4924 53 210 7 80% 71% 13% 29% 8% 0% 0% 0%
4925 112 620 31 71% 72% 12% 13% 17% 9% 0% 6%
4932 17 90 4 39% 50% 42% 25% 17% 25% 2% 0%
Totals 3,263 12,904 774 59% 41% 12% 11% 29% 45% 1% 3%Actions taken to enforce the Federal Insecticide, Fungicide, and Rodenticide Act; the Toxic Substances and Control Act, and
*
the Emergency Planning and Community Right-to-Know Act as well as other Federal environmental laws.
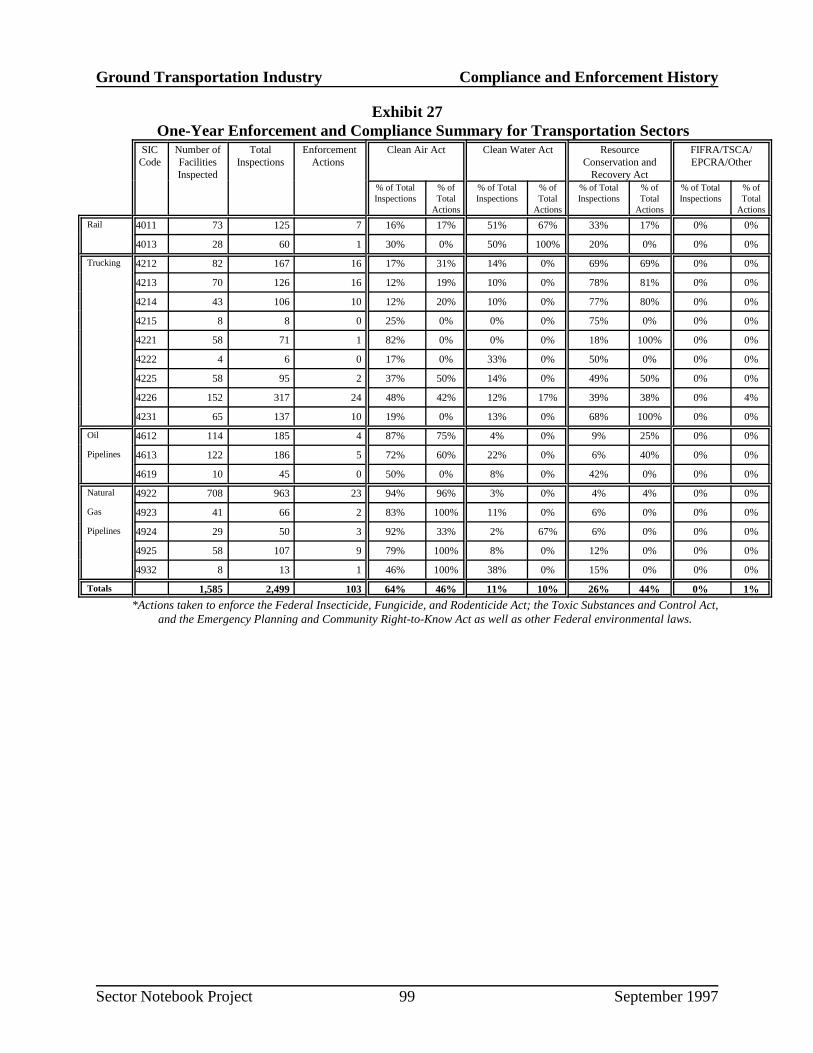
Ground Transportation Industry Compliance and Enforcement History
Sector Notebook Project September 199799
Exhibit 27 One-Year Enforcement and Compliance Summary for Transportation Sectors
SIC Number of Total Enforcement Clean Air Act Clean Water Act Resource FIFRA/TSCA/Code Facilities Inspections Actions Conservation and EPCRA/Other
Inspected Recovery Act% of Total % of % of Total % of % of Total % of % of Total % ofInspections Total Inspections Total Inspections Total Inspections Total
Actions Actions Actions Actions
Rail 4011 73 125 7 16% 17% 51% 67% 33% 17% 0% 0%
4013 28 60 1 30% 0% 50% 100% 20% 0% 0% 0%
Trucking 4212 82 167 16 17% 31% 14% 0% 69% 69% 0% 0%
4213 70 126 16 12% 19% 10% 0% 78% 81% 0% 0%
4214 43 106 10 12% 20% 10% 0% 77% 80% 0% 0%
4215 8 8 0 25% 0% 0% 0% 75% 0% 0% 0%
4221 58 71 1 82% 0% 0% 0% 18% 100% 0% 0%
4222 4 6 0 17% 0% 33% 0% 50% 0% 0% 0%
4225 58 95 2 37% 50% 14% 0% 49% 50% 0% 0%
4226 152 317 24 48% 42% 12% 17% 39% 38% 0% 4%
4231 65 137 10 19% 0% 13% 0% 68% 100% 0% 0%
Oil 4612 114 185 4 87% 75% 4% 0% 9% 25% 0% 0%
Pipelines 4613 122 186 5 72% 60% 22% 0% 6% 40% 0% 0%
4619 10 45 0 50% 0% 8% 0% 42% 0% 0% 0%
Natural 4922 708 963 23 94% 96% 3% 0% 4% 4% 0% 0%
Gas 4923 41 66 2 83% 100% 11% 0% 6% 0% 0% 0%
Pipelines 4924 29 50 3 92% 33% 2% 67% 6% 0% 0% 0%
4925 58 107 9 79% 100% 8% 0% 12% 0% 0% 0%
4932 8 13 1 46% 100% 38% 0% 15% 0% 0% 0%
Totals 1,585 2,499 103 64% 46% 11% 10% 26% 44% 0% 1%*Actions taken to enforce the Federal Insecticide, Fungicide, and Rodenticide Act; the Toxic Substances and Control Act,
and the Emergency Planning and Community Right-to-Know Act as well as other Federal environmental laws.

Ground Transportation Industry Compliance and Enforcement History
Sector Notebook Project September 1997100
VIII.D. Comparison of Enforcement Activity Between Selected Industries
The following exhibits present inspection and enforcement informationacross numerous manufacturing sector industries including the ground, water,and air transportation industries.

Ground Transportation Industry Compliance and Enforcement History
Sector Notebook Project September 1997101
Exh
ibit
28: F
ive-
Yea
r E
nfor
cem
ent a
nd C
ompl
ianc
e Su
mm
ary
for
Sele
cted
Ind
ustr
ies
AB
CD
EF
GH
IJ
Indu
stry
Sec
tor
Faci
litie
sin
Sear
ch
Faci
litie
sIn
spec
ted
Num
ber
ofIn
spec
tions
Ave
rage
Mon
ths
Bet
wee
nIn
spec
tions
Faci
litie
s w
ith 1
or M
ore
Enf
orce
men
tA
ctio
ns
Tot
alE
nfor
cem
ent
Act
ions
Perc
ent
Stat
e L
ead
Act
ions
Perc
ent
Fede
ral
Lea
dA
ctio
ns
Enf
orce
men
tto
Insp
ectio
nR
ate
Met
al M
inin
g1,
232
378
1,60
046
6311
153
%47
%0.
07
Coa
l Min
ing
3,25
674
13,
748
5288
132
89%
11%
0.04
Oil
and
Gas
Ext
ract
ion
4,67
61,
902
6,07
146
149
309
79%
21%
0.05
Non
-Met
allic
Min
eral
Min
ing
5,25
62,
803
12,8
2625
385
622
77%
23%
0.05
Text
iles
355
267
1,46
515
5383
90%
10%
0.06
Lum
ber a
nd W
ood
712
473
2,76
715
134
265
70%
30%
0.10
Furn
iture
499
386
2,37
913
6591
81%
19%
0.04
Pulp
and
Pap
er48
443
04,
630
615
047
880
%20
%0.
10
Prin
ting
5,86
22,
092
7,69
146
238
428
88%
12%
0.06
Inor
gani
c C
hem
ical
s44
128
63,
087
989
235
74%
26%
0.08
Res
ins
and
Man
mad
e Fi
bers
329
263
2,43
08
9321
976
%24
%0.
09
Phar
mac
eutic
als
164
129
1,20
18
3512
280
%20
%0.
10
Org
anic
Che
mic
als
425
355
4,29
46
153
468
65%
35%
0.11
Agr
icul
tura
l Che
mic
als
263
164
1,29
312
4710
274
%26
%0.
08
Petro
leum
Ref
inin
g15
614
83,
081
312
476
368
%32
%0.
25
Rub
ber a
nd P
last
ic1,
818
981
4,38
325
178
276
82%
18%
0.06
Ston
e, C
lay,
Gla
ss a
ndC
oncr
ete
615
388
3,47
411
9727
775
%25
%0.
08
Iron
and
Ste
el34
927
54,
476
512
130
571
%29
%0.
07
Met
al C
astin
gs66
942
42,
535
1611
319
171
%29
%0.
08
Non
ferr
ous
Met
als
203
161
1,64
07
6817
478
%22
%0.
11
Fabr
icat
ed M
etal
Pro
duct
s2,
906
1,85
87,
914
2236
560
075
%25
%0.
08
Elec
troni
cs1,
250
863
4,50
017
150
251
80%
20%
0.06
Aut
omob
ile A
ssem
bly
1,26
092
75,
912
1325
341
382
%18
%0.
07
Ship
build
ing
and
Rep
air
4437
243
920
3284
%16
%0.
13
Gro
und
Tra
nspo
rtat
ion
7,78
63,
263
12,9
0436
375
774
84%
16%
0.06
Wat
er T
rans
porta
tion
514
192
816
3836
7061
%39
%0.
09
Air
Tran
spor
tatio
n44
423
197
327
4897
88%
12%
0.10
Foss
il Fu
el E
lect
ric P
ower
3,27
02,
166
14,2
1014
403
789
76%
24%
0.06

Ground Transportation Industry Compliance and Enforcement History
Sector Notebook Project September 1997102
Exh
ibit
29: O
ne-Y
ear
Enf
orce
men
t and
Com
plia
nce
Sum
mar
y fo
r Se
lect
ed I
ndus
trie
s
AB
CD
EF
GH
Faci
litie
s w
ith 1
or
Mor
eV
iola
tions
Faci
litie
s w
ith 1
or
mor
eE
nfor
cem
ent A
ctio
nsT
otal
Enf
orce
men
tA
ctio
nsIn
dust
ry S
ecto
rFa
cilit
ies
in S
earc
hFa
cilit
ies
Insp
ecte
dN
umbe
r of
Insp
ectio
nsN
umbe
rPe
rcen
t*N
umbe
rPe
rcen
t*E
nfor
cem
ent t
oIn
spec
tion
Rat
eM
etal
Min
ing
1,23
214
221
110
272
%9
6%10
0.05
Coa
l Min
ing
3,25
636
276
590
25%
206%
220.
03O
il an
d G
as E
xtra
ctio
n4,
676
874
1,17
312
715
%26
3%34
0.03
Non
-Met
allic
Min
eral
Min
ing
5,25
61,
481
2,45
138
426
%73
5%91
0.04
Text
iles
355
172
295
9656
%10
6%12
0.04
Lum
ber a
nd W
ood
712
279
507
192
69%
4416
%52
0.10
Furn
iture
499
254
459
136
54%
94%
110.
02Pu
lp a
nd P
aper
484
317
788
248
78%
4314
%74
0.09
Prin
ting
5,86
289
21,
363
577
65%
283%
530.
04In
orga
nic
Che
mic
als
441
200
548
155
78%
1910
%31
0.06
Res
ins
and
Man
mad
e Fi
bers
329
173
419
152
88%
2615
%36
0.09
Phar
mac
eutic
als
164
8020
984
105%
810
%14
0.07
Org
anic
Che
mic
als
425
259
837
243
94%
4216
%56
0.07
Agr
icul
tura
l Che
mic
als
263
105
206
102
97%
55%
110.
05Pe
trole
um R
efin
ing
156
132
565
129
98%
5844
%13
20.
23R
ubbe
r and
Pla
stic
1,81
846
679
138
983
%33
7%41
0.05
Ston
e, C
lay,
Gla
ss a
nd C
oncr
ete
615
255
678
151
59%
197%
270.
04Ir
on a
nd S
teel
349
197
866
174
88%
2211
%34
0.04
Met
al C
astin
gs66
923
443
324
010
3%24
10%
260.
06N
onfe
rrou
s M
etal
s20
310
831
098
91%
1716
%28
0.09
Fabr
icat
ed M
etal
2,90
684
91,
377
796
94%
637%
830.
06El
ectro
nics
1,25
042
078
040
296
%27
6%43
0.06
Aut
omob
ile A
ssem
bly
1,26
050
71,
058
431
85%
357%
470.
04Sh
ipbu
ildin
g an
d R
epai
r44
2251
1986
%3
14%
40.
08G
roun
d T
rans
port
atio
n7,
786
1,58
52,
499
681
43%
855%
103
0.04
Wat
er T
rans
porta
tion
514
8414
153
63%
1012
%11
0.08
Air
Tran
spor
tatio
n44
496
151
6972
%8
8%12
0.08
Foss
il Fu
el E
lect
ric P
ower
3,27
01,
318
2,43
080
461
%10
08%
135
0.06
Dry
Cle
anin
g6,
063
1,23
41,
436
314
25%
121%
160.
01
*Per
cent
ages
in C
olum
ns E
and
F a
re b
ased
on
the
num
ber
of fa
cilit
ies
insp
ecte
d (C
olum
n C
). P
erce
ntag
es c
an e
xcee
d 10
0% b
ecau
se v
iola
tions
and
act
ions
can
occu
r w
ithou
t a fa
cilit
y in
spec
tion.

Ground Transportation Industry Compliance and Enforcement History
Sector Notebook Project September 1997103
Exh
ibit
30: F
ive-
Yea
r In
spec
tion
and
Enf
orce
men
t Sum
mar
y by
Sta
tute
for
Sele
cted
Ind
ustr
ies
Indu
stry
Sec
tor
Faci
litie
sIn
spec
ted
Tot
alIn
spec
tions
Tot
alE
nfor
cem
ent
Act
ions
Cle
an A
ir A
ctC
lean
Wat
er A
ctR
CR
AFI
FRA
/TSC
A/
EPC
RA
/Oth
er
% o
f Tot
alIn
spec
tions
% o
fT
otal
Act
ions
% o
f Tot
alIn
spec
tions
% o
fT
otal
Act
ions
% o
f Tot
alIn
spec
tions
% o
fT
otal
Act
ions
% o
f Tot
alIn
spec
tions
% o
fT
otal
Act
ions
Met
al M
inin
g37
81,
600
111
39%
19%
52%
52%
8%12
%1%
17%
Coa
l Min
ing
741
3,74
813
257
%64
%38
%28
%4%
8%1%
1%
Oil
and
Gas
Ext
ract
ion
1,90
26,
071
309
75%
65%
16%
14%
8%18
%0%
3%
Non
-Met
allic
Min
eral
Min
ing
2,80
312
,826
622
83%
81%
14%
13%
3%4%
0%3%
Text
iles
267
1,46
583
58%
54%
22%
25%
18%
14%
2%6%
Lum
ber a
nd W
ood
473
2,76
726
549
%47
%6%
6%44
%31
%1%
16%
Furn
iture
386
2,37
991
62%
42%
3%0%
34%
43%
1%14
%
Pulp
and
Pap
er43
04,
630
478
51%
59%
32%
28%
15%
10%
2%4%
Prin
ting
2,09
27,
691
428
60%
64%
5%3%
35%
29%
1%4%
Inor
gani
c C
hem
ical
s28
63,
087
235
38%
44%
27%
21%
34%
30%
1%5%
Res
ins
and
Man
mad
e Fi
bers
263
2,43
021
935
%43
%23
%28
%38
%23
%4%
6%
Phar
mac
eutic
als
129
1,20
112
235
%49
%15
%25
%45
%20
%5%
5%
Org
anic
Che
mic
als
355
4,29
446
837
%42
%16
%25
%44
%28
%4%
6%
Agr
icul
tura
l Che
mic
als
164
1,29
310
243
%39
%24
%20
%28
%30
%5%
11%
Petro
leum
Ref
inin
g14
83,
081
763
42%
59%
20%
13%
36%
21%
2%7%
Rub
ber a
nd P
last
ic98
14,
383
276
51%
44%
12%
11%
35%
34%
2%11
%
Ston
e, C
lay,
Gla
ss a
ndC
oncr
ete
388
3,47
427
756
%57
%13
%9%
31%
30%
1%4%
Iron
and
Ste
el27
54,
476
305
45%
35%
26%
26%
28%
31%
1%8%
Met
al C
astin
gs42
42,
535
191
55%
44%
11%
10%
32%
31%
2%14
%
Non
ferr
ous
Met
als
161
1,64
017
448
%43
%18
%17
%33
%31
%1%
10%
Fabr
icat
ed M
etal
1,85
87,
914
600
40%
33%
12%
11%
45%
43%
2%13
%
Elec
troni
cs86
34,
500
251
38%
32%
13%
11%
47%
50%
2%7%
Aut
omob
ile A
ssem
bly
927
5,91
241
347
%39
%8%
9%43
%43
%2%
9%
Ship
build
ing
and
Rep
air
3724
332
39%
25%
14%
25%
42%
47%
5%3%
Gro
und
Tra
nspo
rtat
ion
3,26
312
,904
774
59%
41%
12%
11%
29%
45%
1%3%
Wat
er T
rans
porta
tion
192
816
7039
%29
%23
%34
%37
%33
%1%
4%
Air
Tran
spor
tatio
n23
197
397
25%
32%
27%
20%
48%
48%
0%0%
Foss
il Fu
el E
lect
ric P
ower
2,16
614
,210
789
57%
59%
32%
26%
11%
10%
1%5%
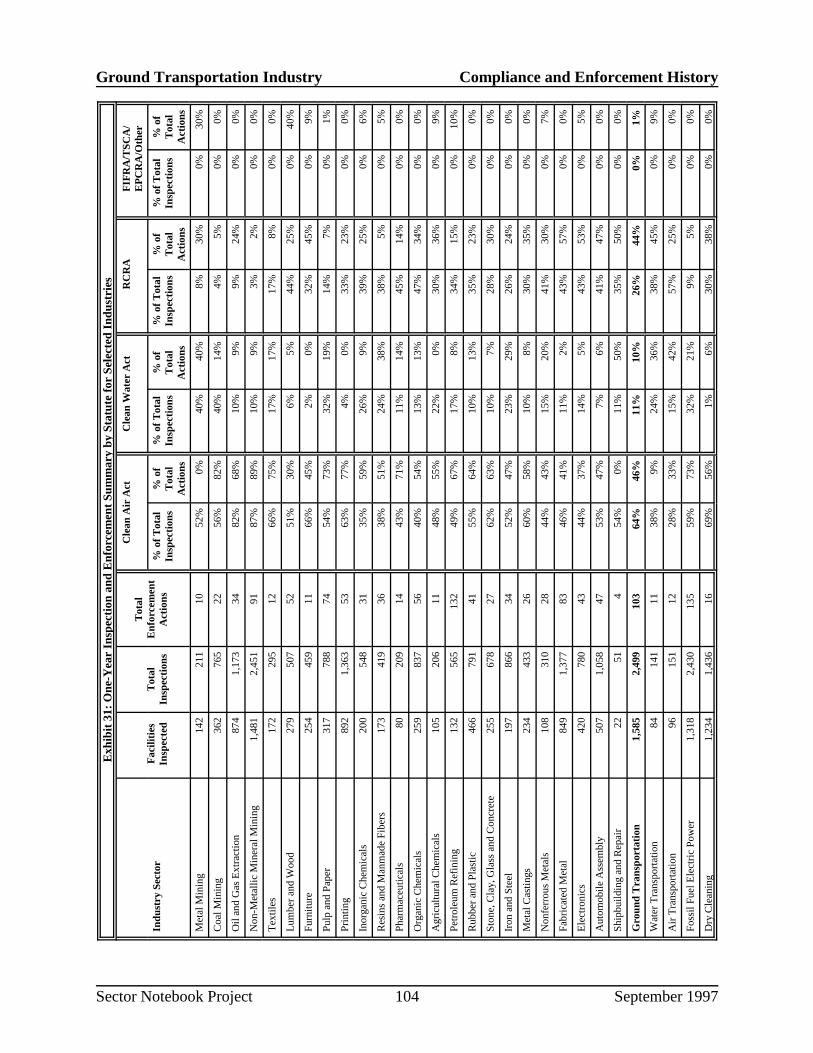
Ground Transportation Industry Compliance and Enforcement History
Sector Notebook Project September 1997104
Exh
ibit
31: O
ne-Y
ear
Insp
ectio
n an
d E
nfor
cem
ent S
umm
ary
by S
tatu
te fo
r Se
lect
ed I
ndus
trie
s
Faci
litie
sIn
spec
ted
Tot
alIn
spec
tions
Tot
alE
nfor
cem
ent
Act
ions
Cle
an A
ir A
ctC
lean
Wat
er A
ctR
CR
AFI
FRA
/TSC
A/
EPC
RA
/Oth
er
Indu
stry
Sec
tor
% o
f Tot
alIn
spec
tions
% o
fT
otal
Act
ions
% o
f Tot
alIn
spec
tions
% o
fT
otal
Act
ions
% o
f Tot
alIn
spec
tions
% o
fT
otal
Act
ions
% o
f Tot
alIn
spec
tions
% o
fT
otal
Act
ions
Met
al M
inin
g14
221
110
52%
0%40
%40
%8%
30%
0%30
%
Coa
l Min
ing
362
765
2256
%82
%40
%14
%4%
5%0%
0%
Oil
and
Gas
Ext
ract
ion
874
1,17
334
82%
68%
10%
9%9%
24%
0%0%
Non
-Met
allic
Min
eral
Min
ing
1,48
12,
451
9187
%89
%10
%9%
3%2%
0%0%
Text
iles
172
295
1266
%75
%17
%17
%17
%8%
0%0%
Lum
ber a
nd W
ood
279
507
5251
%30
%6%
5%44
%25
%0%
40%
Furn
iture
254
459
1166
%45
%2%
0%32
%45
%0%
9%
Pulp
and
Pap
er31
778
874
54%
73%
32%
19%
14%
7%0%
1%
Prin
ting
892
1,36
353
63%
77%
4%0%
33%
23%
0%0%
Inor
gani
c C
hem
ical
s20
054
831
35%
59%
26%
9%39
%25
%0%
6%
Res
ins
and
Man
mad
e Fi
bers
173
419
3638
%51
%24
%38
%38
%5%
0%5%
Phar
mac
eutic
als
8020
914
43%
71%
11%
14%
45%
14%
0%0%
Org
anic
Che
mic
als
259
837
5640
%54
%13
%13
%47
%34
%0%
0%
Agr
icul
tura
l Che
mic
als
105
206
1148
%55
%22
%0%
30%
36%
0%9%
Petro
leum
Ref
inin
g13
256
513
249
%67
%17
%8%
34%
15%
0%10
%
Rub
ber a
nd P
last
ic46
679
141
55%
64%
10%
13%
35%
23%
0%0%
Ston
e, C
lay,
Gla
ss a
nd C
oncr
ete
255
678
2762
%63
%10
%7%
28%
30%
0%0%
Iron
and
Ste
el19
786
634
52%
47%
23%
29%
26%
24%
0%0%
Met
al C
astin
gs23
443
326
60%
58%
10%
8%30
%35
%0%
0%
Non
ferr
ous
Met
als
108
310
2844
%43
%15
%20
%41
%30
%0%
7%
Fabr
icat
ed M
etal
849
1,37
783
46%
41%
11%
2%43
%57
%0%
0%
Elec
troni
cs42
078
043
44%
37%
14%
5%43
%53
%0%
5%
Aut
omob
ile A
ssem
bly
507
1,05
847
53%
47%
7%6%
41%
47%
0%0%
Ship
build
ing
and
Rep
air
2251
454
%0%
11%
50%
35%
50%
0%0%
Gro
und
Tra
nspo
rtat
ion
1,58
52,
499
103
64%
46%
11%
10%
26%
44%
0%1%
Wat
er T
rans
porta
tion
8414
111
38%
9%24
%36
%38
%45
%0%
9%
Air
Tran
spor
tatio
n96
151
1228
%33
%15
%42
%57
%25
%0%
0%
Foss
il Fu
el E
lect
ric P
ower
1,31
82,
430
135
59%
73%
32%
21%
9%5%
0%0%
Dry
Cle
anin
g1,
234
1,43
616
69%
56%
1%6%
30%
38%
0%0%

Ground Transportation Industry Review of Major Legal Actions
Sector Notebook Project September 1997105
IX. REVIEW OF MAJOR LEGAL ACTIONS
This section provides summary information about major cases that haveaffected this sector. As indicated in EPA’s Enforcement AccomplishmentsReports from 1992-1994, several significant enforcement actions wereresolved between 1992-1994 involving the rail, trucking, and pipelineindustries. Characterizations of the types of enforcement actions taken areprovided for each of the cited cases.
IX.A. Review of Major Cases
IX.A.1. Rail
U.S. v. Consolidated Rail Corporation, CAA, 1992
U.S. District Court entered a second amendment to consent order resolvingEPA's CAA contempt action against Consolidated Rail Corporation(Conrail). The amendment requires Conrail to pay $165,000 in penalties forpast violations. In addition, it allows the company to apply encrusting agentsin lieu of water to control fugitive dust. The amendment is based on aconsent order EPA and Conrail negotiated in 1986 to resolve violations ofOhio's State Implementation Plan (SIP).
U.S. v. CSX Transportation, CWA, 1993
CSX Transportation signed a consent decree to pay $3,00,000 in civilpenalties and perform four Supplemental Environmental Projects (SEPs)valued at $4,000,000 for alleged violations of CWA for exceeding NPDESlimits.
Burlington Northern, Multi-media, 1994
EPA Region V sought $279,078 to recover costs incurred consistent with theNCP under CERCLA and OPA, natural resource damages totaling $250,000,and CWA penalties totaling $2,500,000 for three incidents of railroadderailment.
In the matter of Burlington Northern Railroad, EPCRA, 1994
A RCRA consent order was issued for the contamination of groundwater, anda 1993 unilateral administrative order, based on a multimedia inspection,required the defendant to cease discharge of oil and chlorinated waters.

Ground Transportation Industry Review of Major Legal Actions
Sector Notebook Project September 1997106
Southern Pacific Transportation Corporation, 1994
A train derailment caused the release of a herbicide into the SacramentoRiver killing all plant life for 42 miles. The settlement provided for recoveryof $36 million in response costs. The decree also required payment of a$500,000 civil penalty (the statutory maximum for the violation). Defendantsmust also establish a $14 million fund for natural resource damages.
U.S. v. Norfolk & Western Railway Company, 1994
Criminal plea agreement and settlement resulted in the U.S. receiving$500,000 fine and $500,000 restitution. Missouri received $700,000 fine and$1.7 million in restitution, $1 million for creation of a park, andestablishment of a $2.2 million environmental awareness program.
IX.A.2. Trucking
U.S. v. The Carborundum Company, et al. , CERCLA, 1994
On March 30, 1994, a consent decree was lodged in the District Court of NewJersey which partially settles Region II's cost recovery claims relating to theCaldwell Trucking Company Superfund site in Fairchild Township, NewJersey. From 1950 through the mid 1970s, Caldwell Trucking hauled septageand other wastes from residential, commercial, and industrial customers anddisposed of these wastes in unlined lagoons at the site. The nine settlingdefendants agreed to pay $2.46 million for EPA's past and future costs andagreed to perform all scheduled remedial and natural resource restorationwork at the site, valued at an additional $32 million. New Jersey will alsoreceive its first natural resource damage payment under CERCLA, in theamount of $984,000, and the U.S. Department of the Interior will receive$40,000 for its assessment and monitoring costs.
U.S. v. Gomer's Diesel and Electric Company, RCRA, 1994
Gomer's Diesel and Electric Co., with automotive and truck maintenancefacilities located in Belgrade, Great Falls, and Missoula, Montana, wassentenced on March 24, 1994, following a plea of guilty to one-count ofunlawful transportation of a hazardous waste in violation of RCRA. Thecompany was placed on supervised probation for two years and fined$100,000, $50,000 of which was suspended in recognition of remediationconducted at its Belgrade facility.
Hamner, Inc., Corpus Christi, CWA, 1994
An administrative Class I complaint was issued against Hamner, Inc. CorpusChristi, Texas, on May 24, 1994, with a proposed penalty of $9,108 for

Ground Transportation Industry Review of Major Legal Actions
Sector Notebook Project September 1997107
violations of the CWA. The corporation's tanker truck overturned,discharging approximately 24 barrels of petroleum naphtha. The petroleumnaphtha entered navigable waters of the U.S. in quantities determined to beharmful. The oil did not enter a major waterway, no drinking water supplywas affected, and there were no signs of damage to wildlife or aquatic life.Settlement negotiations are underway.
IX.A.3. Pipelines
U.S. v. Shell Oil Pipeline Corporation, Criminal Enforcement, 1992
Pipeline rupture caused an 860,000 gallon oil spill into the Mississippi,Gasconade, and Missouri rivers. Shell pleaded guilty to violation of theRefuse Act and agreed to pay $8,400,000 in fines, restitution, andsettlements.
U.S. v. Texaco, CERCLA, 1993
Texaco entered a consent decree for performance of a remedial design andremedial action at the Pacific Cost Pipeline Superfund site in California. TheRA is valued at $4,000,000. Texaco also agreed to reimburse California forresponse costs, the U.S. for future response costs, and EPA for past RI/FScosts.
U.S. v. Transwestern Pipeline Company, TSCA, 1993
A consent decree was terminated when the defendant met all terms andconditions of settlement (including payment of a penalty of $375,000 andgroundwater monitoring). Under the decree, 144,991 tons of PCBcontaminated soil and debris were removed and disposed in TSCA landfill.
U.S. v. Tennessee Gas Pipeline Co., CWA, 1993
Court entered final order for dismissal after parties agreed to a penalty of$725,000 for unauthorized discharges of PCBs from a pumping station.
U.S. v. U.S. Oil and U.S. v. Texaco, OPA, 1993
U.S. Oil agreed to pay civil penalties of $425,000 and Texaco agreed to pay$480,000 in penalties. Both were made to acquire and install state-of-the-artspill detection and prevention equipment valued at $800,000 for eachcompany. Both were also required to reimburse for Federal spill responsecosts of $60,000 and $125,000 respectively. The actions represent the firstjudicial penalties assessed under OPA.

Ground Transportation Industry Review of Major Legal Actions
Sector Notebook Project September 1997108
IX.B. Supplemental Environmental Projects (SEPs)
Below is a list of Supplementary Environmental Projects (SEPs). SEPs arecompliance agreements that reduce a facility's stipulated penalty in return foran environmental project that exceeds the value of the reduction. Often, theseprojects fund pollution prevention activities that can significantly reduce thefuture pollutant loadings of a facility.
Exhibit 32 contains a sample of SEPs from the transportation industry. Theinformation contained in the chart is not comprehensive and provides only asample of the types of SEPs developed for the transportation industry.
Exhibit 32Supplemental Environmental Projects in the Transportation Industry
Case Name Statute Estimated Environmentally Beneficial Activities Cost to
CompanyGeneral Chemical CAA $90,000, Facility was to purchase and install an Airless Paint
Company Spray Unit and Fanu Robotics Spray Unit in orderto reduce total VOC releases to the atmosphere by10 percent.
Thatcher Chemical EPCRA §304 Not Known SEP included the construction of a building withCompany scrubbing equipment for enclosing loading
products to prevent future releases into theenvironment to be completed by January 24, 1994.
CSX Transportation CAA $ 4,000,000 Company was required to:• Perform NPDES compliance audits at 21
active CSX railroad yards• Conduct multi-media risk assessment audit at
61 inactive facilities• Provide environmental awareness training
program for managers• Develop best management practices manual
and a seminar on storm water runoff at railroadyards.
Ground Transportation Industry Compliance Activities and Initiatives
Sector Notebook Project September 1997109
X. COMPLIANCE ACTIVITIES AND INITIATIVES
This section highlights the activities undertaken by this industry sector andpublic agencies to voluntarily improve the sector's environmentalperformance. These activities include those independently initiated byindustrial trade associations. This section of the notebook also contains alisting and description of national and regional trade associations.
X.A. Sector-Related Environmental Programs and Activities
Environmental compliance assurance activities have been conducted by themajor trade associations for each of the transportation sectors covered in thisreport. The following examples represent some of the industry initiatives thatpromote compliance, or assess methods to reduce environmentalcontamination.
X.A.1. Rail
Waste Minimization Assessment for a Manufacturer of Rebuilt Railway Cars andComponents
U.S. EPA funded a pilot project to assist small- and medium-sizemanufacturers wishing to minimize their generation of hazardous waste, butlacking the expertise to do so. The Agency established Waste MinimizationAssessment Centers (WMACs) at selected universities, adapting proceduresfrom EPA’s Waste Minimization Opportunity Assessment Manual. TheWMAC team at the University of Tennessee inspected a plant that rebuildsapproximately 2,000 railway cars each year and that refurbishes wheelassemblies and air brake systems. The team issued a report and made anumber of recommendations for minimizing hazardous waste outputs.
X.A.2. Trucking
Consolidated Compliance Reviews
The trucking industry has worked with the Department of Transportation,Federal Highway Administration (FHWA), to develop streamlined processesfor conducting compliance reviews. As a result, the FHWA now conducts allrecord reviews and inspection activities in a "one stop" process. The original process involved several different inspections. The first type ofinspection focused on compliance with ICC rules and operating authoritylicenses. The second type of inspection focused on safety compliance issues.Additional inspections were conducted to ensure compliance with hazardousmaterials transportation regulations were added in the 1980's. More recently,driver drug testing was added to the inspection requirements.

Ground Transportation Industry Compliance Activities and Initiatives
Sector Notebook Project September 1997110
DOT-FHWA's compliance review is now conducted with the inspector usinga lap-top computer with built in prompters, programs to generate checklists,work sheets, tabulations, and regulations and interpretations. These toolsallow the inspector to cover all the components of the inspection in “onestop.” The compliance review often occurs at corporate headquarters. Thesystem was developed in 1986; currently, about 200 DOT-FHWA inspectorsuse the system.
Inspectors receive six weeks of training when they come into the DOT-FHWA, including training on case development, regulations, compliancereviews, and sensitivity. Inspectors do not need permission before enteringa facility but usually call in advance so the appropriate staff and records canbe available. Unannounced inspections may occur if criminal activity issuspected.
DOT-FHWA inspectors are providing more and more technical assistance tothe regulated community. They have education packages on specific issues,such as hazardous materials, and "On Guard" announcements of new safetyproblems or rules affecting the industry.
Cooperative Hazardous Materials Enforcement Development
The Cooperative Hazardous Materials Enforcement Development(COHMED) program is an outreach activity of the U.S. DOT’s Research andSpecial Programs Administration (RSPA). COHMED works to promotecoordination, cooperation, education, and communication for Federal, State,local agencies, and industry having enforcement, response, and managementresponsibilities for the safe transportation of hazardous materials. Througheducation and training, COHMED participants are able to improve currentprograms, and develop new programs to enhance hazardous materials safety.
COHMED conducts semi-annual conferences and hazardous materialsseminars. COHMED also publishes a quarterly newsletter, "The Reporter,"and the "Bullet" when expedient dissemination of information is required.COHMED participation is open to Federal, State, local agencies, and industryinvolved in enforcement, emergency response or planning and preparedness.For more information call (202) 366-4900.
CHEMTREC
CHEMTREC is a pubic service organization established by the ChemicalManufacture’s Association and its members in 1971 to provide firstresponders, the transportation industry, medical professionals, and othersaccess to response information and technical assistance from chemicalindustry experts for incidents involving hazardous materials. The Center is

Ground Transportation Industry Compliance Activities and Initiatives
Sector Notebook Project September 1997111
staffed by trained communicators who can contact thousands of chemicalmanufacturers, shippers, distributors, and carriers. Through these contacts,CHEMTREC can teleconference responders at the scene of an incident withtechnical experts to provide immediate advice and assistance. CHEMTRECcan also immediately provide and transmit, via fax, product Material SafetyData Sheets or other specific product information. The CHEMTREC Centercan be reached 24 hours a day, 7 days a week at 1-800-424-9300.
TRANSCAER
TRANSCAER is an outreach program that focuses on assisting communitiesthat do not host a major chemical facility but have major transportation routeswithin their jurisdiction. TRANSCAER is sponsored by the chemicalmanufacturing, distribution and transportation industries. TRANSCAER'sobjectives are to ensure that communities are prepared to handle hazardousmaterials transportation emergencies and that an ongoing dialogue exists withthe public about chemical transportation. The program provides assistancefor communities to develop and evaluate their emergency response plan forhazardous material transportation incidents. For more information contactthe TRANSCAER Task Group at c/o CMA, 1300 Wilson Blvd., Arlington,VA, 22209.
CMA's Lending Library
Since 1985, the CMA's Lending Library has provided free access to videotapetraining programs on hazardous materials and handling hazardous materialsincidents. Contact the CMA Publication Fulfillment department at (202)887-1253 for ordering information.
X.A.3. Pipelines
The giant Alaska company Alyeska has undertaken the most expensivecorrosion repair program in the industry’s history with a campaign to inspectpipelines for corrosion, repair damaged sections, and replace pipe sections asneeded. The estimated costs of this effort from 1991-1996 are $600-800million. External and internal corrosion at some of the 800-mile line’s pumpstations was discovered with the help of a corrosion detection pig thatexceeded Federal standards for corrosion detection and mitigation (U.S.Petroleum Strategies, Bob Williams, 1991).

Ground Transportation Industry Compliance Activities and Initiatives
Sector Notebook Project September 1997112
X.B. EPA Voluntary Programs
Environmental Leadership Program
The Environmental Leadership Program (ELP) is a national initiativedeveloped by EPA that focuses on improving environmental performance,encouraging voluntary compliance, and building working relationships withstakeholders. EPA initiated a one year pilot program in 1995 by selecting 12projects at industrial facilities and federal installations that demonstrate theprinciples of the ELP program. These principles include: environmentalmanagement systems, multimedia compliance assurance, third-partyverification of compliance, public measures of accountability, pollutionprevention, community involvement, and mentor programs. In return forparticipating, pilot participants received public recognition and were givena period of time to correct any violations discovered during theseexperimental projects.
EPA is making plans to launch its full-scale Environmental LeadershipProgram in 1997. The full-scale program will be facility-based with a 6-yearparticipation cycle. Facilities that meet certain requirements will be eligibleto participate, such as having a community outreach/employee involvementprograms and an environmental management system (EMS) in place for 2years. (Contact: http://es.inel.gov/elp or Debby Thomas, ELP DeputyDirector, at 202-564-5041)
Project XL
Project XL was initiated in March 1995 as a part of President Clinton’sReinventing Environmental Regulation initiative. The projects seek toachieve cost effective environmental benefits by providing participantsregulatory flexibility on the condition that they produce greater environmentalbenefits. EPA and program participants will negotiate and sign a FinalProject Agreement, detailing specific environmental objectives that theregulated entity shall satisfy. EPA will provide regulatory flexibility as anincentive for the participants’ superior environmental performance.Participants are encouraged to seek stakeholder support from localgovernments, businesses, and environmental groups. EPA hopes toimplement fifty pilot projects in four categories, including industrialfacilities, communities, and government facilities regulated by EPA.Applications will be accepted on a rolling basis. For additional informationregarding XL projects, including application procedures and criteria, see theMay 23, 1995 Federal Register Notice. (Contact: Fax-on-Demand Hotline202-260-8590, Web: http://www.epa.gov/ProjectXL, or Christopher Knopesat EPA’s Office of Policy, Planning and Evaluation 202-260-9298)

Ground Transportation Industry Compliance Activities and Initiatives
Sector Notebook Project September 1997113
Climate Wise Program
EPA’s ENERGY STAR Buildings Program is a voluntary, profit-based programdesigned to improve the energy-efficiency in commercial and industrialbuildings. Expanding the successful Green Lights Program, ENERGY STARBuildings was launched in 1995. This program relies on a 5-stage strategydesigned to maximize energy savings thereby lowering energy bills,improving occupant comfort, and preventing pollution -- all at the same time.If implemented in every commercial and industrial building in the UnitedStates, ENERGY STAR Buildings could cut the nation’s energy bill by up to$25 billion and prevent up to 35% of carbon dioxide emissions. (This isequivalent to taking 60 million cars of the road). ENERGY STAR Buildingsparticipants include corporations; small and medium sized businesses; local,federal and state governments; non-profit groups; schools; universities; andhealth care facilities. EPA provides technical and non-technical supportincluding software, workshops, manuals, communication tools, and aninformation hotline. EPA’s Office of Air and Radiation manages theoperation of the ENERGY STAR Buildings Program. (Contact: GreenLight/Energy Star Hotline at 1-888-STAR-YES or Maria Tikoff Vargas, EPAProgram Director at 202-233-9178 or visit the ENERGY STAR BuildingsProgram website at http://www.epa.gov/appdstar/buildings/)
Green Lights Program
EPA’s Green Lights program was initiated in 1991 and has the goal ofpreventing pollution by encouraging U.S. institutions to use energy-efficientlighting technologies. The program saves money for businesses andorganizations and creates a cleaner environment by reducing pollutantsreleased into the atmosphere. The program has over 2,345 participants whichinclude major corporations, small and medium sized businesses, federal, stateand local governments, non-profit groups, schools, universities, and healthcare facilities. Each participant is required to survey their facilities andupgrade lighting wherever it is profitable. As of March 1997, participantshad lowered their electric bills by $289 million annually. EPA providestechnical assistance to the participants through a decision support softwarepackage, workshops and manuals, and an information hotline. EPA’s Officeof Air and Radiation is responsible for operating the Green Lights Program.(Contact: Green Light/Energy Star Hotline at 1-888-STARYES or MariaTikoff Vargar, EPA Program Director, at 202-233-9178 the )
WasteWi$e Program
The WasteWi$e Program was started in 1994 by EPA’s Office of SolidWaste and Emergency Response. The program is aimed at reducingmunicipal solid wastes by promoting waste prevention, recycling collectionand the manufacturing and purchase of recycled products. As of 1997, the

Ground Transportation Industry Compliance Activities and Initiatives
Sector Notebook Project September 1997114
program had about 500 companies as members, one third of whom areFortune 1000 corporations. Members agree to identify and implement actionsto reduce their solid wastes setting waste reduction goals and providing EPAwith yearly progress reports. To member companies, EPA, in turn, providestechnical assistance, publications, networking opportunities, and national andregional recognition. (Contact: WasteWi$e Hotline at 1-800-372-9473 orJoanne Oxley, EPA Program Manager, 703-308-0199)
NICE3
The U.S. Department of Energy is administering a grant program called TheNational Industrial Competitiveness through Energy, Environment, andEconomics (NICE ). By providing grants of up to 45 percent of the total3
project cost, the program encourages industry to reduce industrial waste at itssource and become more energy-efficient and cost-competitive through wasteminimization efforts. Grants are used by industry to design, test, anddemonstrate new processes and/or equipment with the potential to reducepollution and increase energy efficiency. The program is open to allindustries; however, priority is given to proposals from participants in theforest products, chemicals, petroleum refining, steel, aluminum, metal castingand glass manufacturing sectors. (Contact: http//www.oit.doe.gov/access/nice3, Chris Sifri, DOE, 303-275-4723 or Eric Hass, DOE, 303-275-4728)
Design for the Environment (DfE)
DfE is working with several industries to identify cost-effective pollutionprevention strategies that reduce risks to workers and the environment. DfEhelps businesses compare and evaluate the performance, cost, pollutionprevention benefits, and human health and environmental risks associatedwith existing and alternative technologies. The goal of these projects is toencourage businesses to consider and use cleaner products, processes, andtechnologies. For more information about the DfE Program, call (202) 260-1678. To obtain copies of DfE materials or for general information aboutDfE, contact EPA’s Pollution Prevention Information Clearinghouse at (202)260-1023 or visit the DfE Website at http://es.inel.gov/dfe.

Ground Transportation Industry Compliance Activities and Initiatives
Sector Notebook Project September 1997115
X.C. Trade Association/Industry-Sponsored Activity
The trade associations that represent the transportation industry are a valuablesource of economic and environmental compliance data. The followingsubsections list major transportation trade organizations and highlightenvironmental initiatives sponsored by some of these groups.
X.C.1. Railroad Tank Car Safety Research and Test Project
Since 1970 the Railway Progress Institute (RPI) and Association of AmericanRailroads (AAR) have cosponsored the RPI-AAR Railroad Tank Car SafetyResearch and Test Project. The purpose of the project, initiated followingseveral fatal tank car crashes in the late 1960s, is to identify and understandthe causes of tank car punctures and ruptures in accidents and to developengineering solutions. Results of this continuing project have led to thedevelopment and introduction of several devices to improve tank car crashworthiness, including double-shelf couplers and head and thermal protectionsystems. In addition, the program has produced a database of more than35,000 records of tank cars damaged over the past 30 years (EnsuringRailroad Tank Car Safety, Transportation Research Board, National ResearchCouncil, 1994).
The research conducted on tank car safety has resulted in the implementationof regulation to increase the safety of certain hazardous material cars. DOTHM-175 which was finalized in September 1995, covers a wide range of tankcar safety related issues, including new tank car specifications forhalogenated organic compounds. This effort has resulted in significantlysafer tank cars for these materials.
In addition, there have been several improvements in an industry agreementbetween the AAR, the Chemical Manufacturers Association (CMA), and RPI,including:
• Thicker tank cars made of stronger steel;
• Elimination of bottom outlets, a common source of releases inaccidents; and
• A full height head shield to protect the end of the tank from puncturesin accidents.
X.C.2. The North American Non-Accident Release Reduction Program
The North American Non-Accident Release Reduction Program was initiatedin June 1995 by the rail industry. A "Non-Accident Release" (NAR) is anyunintended release of a hazardous commodity from a railroad car not caused

Ground Transportation Industry Compliance Activities and Initiatives
Sector Notebook Project September 1997116
by a train accident. Most NAR's involve small quantity releases, but somehave been very costly and all have the potential for serious injury. The NorthAmerican NAP Program is an awareness campaign designed to alert shippersand carriers to repeated instances of NARs of hazardous commodities fromrail tank cars and encourage positive action to prevent recurrence.
General oversight of the NAR Program rests with AAR's HazardousMaterials Working Committee and the NAR General Committee, made upof representatives from shippers, carriers, car owners, and industryassociations. The NAR Program has two sub-committees, a TechnicalSubcommittee and a Communications/Regulatory Subcommittee. TheTechnical group reviews NAR data and attempts to develop technicalsolutions to identified problems. The Communications/Regulatory groupworks on program publicity and government (regulatory) relations.
NAR data is collected by carriers and reported to AAR, who enters it into anNAR database, keeping all business data confidential. When a thresholdnumber of releases has been recorded for any given company, AAR preparesan "action package" outlining the details of each release and forwards theinformation to a designated individual at that company. Recipients of actionpackages are encouraged to take whatever actions are appropriate to addressthe causes of the releases, advising AAR of their response. The NARGeneral Committee has set a goal to reduce the number of NARs fromhazardous materials tank cars in North America by 25 percent over a two yearperiod. The North American NAR Program is an expansion of a successfulprogram started in Canada in 1992. NAR's in Canada were reduced 32%over a two year period after implementation of the program.
X.C.3. Environmental Compliance Handbook for Short Line Railroads
As part of its mandate to clarify and communicate environmental regulatoryresponsibilities to the freight and rail industry, EPA’s Freight, Economy, andthe Environmental Work Group has worked with the Federal RailroadAdministration (FRA) to prepare a handbook on EPA regulations applicableto short line railroads. The handbook is a "plain English" guide to short linerailroad environmental responsibilities and the laws that created them. Thehandbook also provides State and Federal agency contacts and Hotlines.
X.C.4. Environmental Training Publications and Videotapes
The American Trucking Associations (ATA) has developed numerousdocuments and videotapes to help those in the trucking industry to betterunderstand applicable environmental regulations and to assist them incompliance. Following is a list of some the materials offered by the ATA.For a more complete catalogue listing these and other products, contact theATA document center at (800) ATA-LINE.

Ground Transportation Industry Compliance Activities and Initiatives
Sector Notebook Project September 1997117
• Stormwater Best Management Practices: Guidance for VehicleMaintenance Facilities (video) - Identifies practical and effective bestmanagement practices that can be used in vehicle washing, fueling,and loading areas.
• Used Oil: A Guidebook to Best Management Practices - Helps theuser determine the company's responsibilities and developprocedures that are productive, cost-efficient, and in compliance withFederal and State guidelines.
• Hazardous Waste Regulations for the Trucking Industry - Outlinesand explains hazardous waste regulations as they relate to thetrucking industry.
• Stormwater: Pollution Prevention for the Trucking Industry -Explains how to write a pollution prevention plan and covers the fivegeneral phases of a plan in detail.
• Vehicle Washing Compliance Manual - Provides a State-by-Statereview of applicable regulations affecting vehicle washing and asurvey of vehicle washing technology.
X.C.5. Pipeline Integrity Programs - Natural Gas and Hazardous Liquid One-CallSystems
More than 60 percent of pipeline accidents are the result of third-partydamage. One-call systems were developed to reduce the number of incidentsinvolving accidental pipeline ruptures.
Contractors and homeowners who work in the vicinity of natural gas andhazardous liquid lines can learn of their location via a single telephonenumber. This number is supplied in 48 of the 50 States and in Canada byvarious one-call systems, and is usually posted on pipeline markers along thepipe route.
Each one-call system is an organization funded by member undergroundutilities. The system acts as a computerized link between people diggingaround pipelines and the operators of these conveyance systems. When acontractor or homeowner calls the toll-free number, the one-call operatortakes information regarding the time and location of planned work andimmediately notifies all members with underground facilities in theexcavation area.
When a member receives notification of planned excavation in its area, itsoperators are responsible for determining the potential hazards to the line. If

Ground Transportation Industry Compliance Activities and Initiatives
Sector Notebook Project September 1997118
the work does have the potential to affect the pipeline, the company willdispatch crews within 24 to 72 business hours to locate and mark thepipeline’s route. After determining the direction and width of the pipe,personnel use a series of flags or spray paint to mark the exact location of thesystem. If the work will cross the pipeline, crews also test for exact pipelinedepth.
X.C.6. Summary of Trade Associations
The trade and professional organizations serving the transportation industryare presented below, classified by industry sector.
Rail
Association of American Railroads Members: 6450 F Street, NW Staff: 607Washington, D.C. 20001 Budget: $48,800,000Phone: (202) 639-2839Fax: (202) 639-2465
The Association of American Railroads (AAR) is the coordinating andresearch agency of the American railway industry. Membership is comprisedof the larger, Class I, railroads. Focus areas include: railroad operation andmaintenance, statistics, medical problems, cooperative advertising and publicrelations, rates, communication, safety, and testing of railroad equipment.The AAR was founded in 1934 and maintains a library of current andhistorical volumes and periodicals. The AAR also operates an on-linedatabase of all railcars, trailers, and containers used in North America calledUniversal Machine Language Equipment Register. Publications include thequarterly Official Railway Equipment Register, the biweekly Rail NewsUpdate, and the annual Railroad Facts. The AAR also publishes studies,statistical reports, and general information publications.
National Railway Labor Conference Members: 1501901 L Street, NW, Suite 500 Staff: 25Washington, D.C. 20036 Budget: $4,100,000Phone: (202) 862-7200Fax: (202) 862-7230
The National Railway Labor Conference (NRLC), founded in 1963, servesas a management collective bargaining agency for the railroad industry.NRLC represents railroads as well as switching and terminal companies andcompiles statistics on the industry.

Ground Transportation Industry Compliance Activities and Initiatives
Sector Notebook Project September 1997119
Trucking
American Trucking Associations Members: 4,1002200 Mill Road Staff: 300Alexandria, VA 22314 Budget: $45,000,000Phone: (703) 838-1844Fax: (703) 838-1992
The American Trucking Associations (ATA), founded in 1933, representsmotor carriers, suppliers, State trucking associations, and nationalconferences of trucking companies. The ATA works to influence thedecisions of Federal, State, and local governmental bodies to promoteincreased efficiency, productivity, and competitiveness in the truckingindustries. ATA promotes highway and driver safety, supports highwayresearch projects, and studies technical and regulatory problems of thetrucking industry. ATA and its affiliated conferences provide extensiveeducational opportunities and products to assist trucking companies withsafety, OSHA, and environmental regulation. In addition, the associationprovides members with a guide to Federal and State regulations and offers acomprehensive accounting service for carriers of all sizes. An informationcenter containing numerous ATA and other publications is available tomembers and the public.
Association of Waste Hazardous Materials Members: 75Transporters Staff: 22200 Mill RoadAlexandria, VA 22314Phone: (703) 838-1703Fax: (703) 519-1866
The Association of Waste Hazardous Materials Transporters representscarriers that transport PCBs, used oil, and hazardous and radioactive wasteby truck and rail.
National Tank Truck Carriers Members: 2602200 Mill Road Staff: 7Alexandria, VA 22314 Budget: $1,000,000Phone: (703) 838-1960Fax: (703) 864-5753
The National Tank Truck Carriers (NTTC) was founded in 1945 andrepresents common or contract tank truck carriers transporting liquid and drybulk commodities, chemicals, food processing commodities, petroleum, andrelated products. NTTC promotes Federal standards of construction, design,operation, and use of tank trucks and equipment. NTTC sponsors schools,

Ground Transportation Industry Compliance Activities and Initiatives
Sector Notebook Project September 1997120
conducts research, and produces periodicals, including the annual CargoTank Hazardous Materials Regulations and Hazardous CommoditiesHandbook.
Regional and Distribution Carriers Conference Members: 3752200 Mill Road, Suite 540 Staff: 5Alexandria, VA 22314Phone: (703) 838-1990Fax: (703) 836-6870
The Regional and Distribution Carriers Conference (RDCC) consists ofcompanies participating in trucking for hire, including local cartage and shorthaul. RDCC was founded in 1943 and represents motor haul carriersrendering distribution services beyond commercial zones. RDCC is affiliatedwith ATA and conducts an executive management seminar and exhibit.RDCC produces a monthly newsletter and several informational phamplets.
Interstate Truck Carriers Conference Members: 8002200 Mill Road, 3rd Floor Staff: 7Alexandria, VA 22314 Budget: $800,000Phone: (703) 838-1950
Fax: (703) 836-6610
The Interstate Truck Carriers Conference (ITCC) consists of contract carriers,irregular route common carriers, shippers, and others related to the motorcarrier industry. ITCC was founded in 1983 and serves as an industryspokesperson for this part of the trucking industry. ITCC represents theirmembers' interests before Congress, the Interstate Commerce Commission,and the courts. ITCC is affiliated with ATA and has a refrigerated carrierdivision as well as a political action committee. ITCC conducts amanagement development seminar at Notre Dame University and producesbulletins and newsletters.
Pipelines
Interstate Natural Gas Association of America Members: 35555 13th Street, NW, Suite 300 West Staff: 30Washington, DC 20004Phone: (202) 626-3200Fax: (202) 626-3249
The Interstate Natural Gas Association of America (INGAA) representstransporters of natural gas. INGAA has established committees on issuesregarding regulatory and government affairs, policy analysis, and the

Ground Transportation Industry Compliance Activities and Initiatives
Sector Notebook Project September 1997121
environment. INGAA produces Interstate Natural Gas Association ofAmerican - Washington Report, a weekly newsletter that covers legislativeand regulatory developments affecting the industry which is available to bothmembers and non-members.
American Petroleum Institute Members: 3001220 L Street, NW Staff: 500Washington, DC 20005Phone: (202) 682-8000Fax: (202) 682-8030
The American Petroleum Institute (API) works to ensure cooperationbetween industry and government on all matters of mutual concern. APIconducts research, sets standards, provides information services, andmaintains a large library. API was founded in 1919 and representscorporations in the petroleum and allied industries, including producers,refiners, marketers, and transporters of crude oil, lubricating oil, gasoline, andnatural gas. API has committees on industry technical issues, health,environment and safety, and government affairs and produces manystandards, periodicals, books, and manuals.
Association of Oil Pipe Lines Members: 801101 Vermont Avenue, NW, Suite 604 Staff: 3Washington, DC 20005Phone: (202) 408-7970Fax: (202) 408-7983
The Association of Oil Pipe Lines (AOPL), founded in 1947, consists of oilpipeline companies which are generally regulated carriers. AOPL compilesand presents statistical and other data related to the pipeline industry toCongress, government departments, agencies and commissions, tradeassociations, and the public. AOPL is affiliated with API and producesseveral publications, including Oil Pipelines of the United States: Progressand Outlook.

Page 120 intentionally left blank.

Ground Transportation Industry Resource Materials/Bibliography
Sector Notebook Project September 1997123
XI. RESOURCE MATERIALS/BIBLIOGRAPHY
For further information on selected topics within the transportation industry sectors profiled in thisdocument, a list of publications is provided below:
General Profile
Transportation in America, Eno Transportation Foundation, Inc., 1994.
National Transportation Statistics, U.S. Department of Transportation, 1995.
1992 Census of Transportation, Communications, and Utilities: Geographic Area Series Summary,U.S. Department of Commerce.
1992 Census of Transportation, Communications, and Utilities: Subject Series (Establishment andFirm Size), U.S. Department of Commerce.
1992 Census of Transportation, Communications, and Utilities: Nonemployer Statistics SeriesSummary, U.S. Department of Commerce.
Encyclopedia of Associations, 27th ed., Deborah M. Burke, ed., Gale Research Inc., Detroit,Michigan, 1992.
Enforcement Accomplishments Report, FY 1992, U.S. EPA, Office of Enforcement (EPA/230-R93-001), April 1993.
Enforcement Accomplishments Report, FY 1993, U.S. EPA, Office of Enforcement (EPA/300-R94-003), April 1994.
Enforcement Accomplishments Report, FY 1994, U.S. EPA, Office of Enforcement , April 1995.
Environmental Sources and Emissions Handbook, No. 2, Marshall Sitig, Noyes Data Corporation,1975.
McGraw-Hill Encyclopedia of Science & Technology, 7th ed., vol. 8, McGraw-Hill Book Company,New York, New York, 1992.
Standard Industrial Classification Manual, Office of Management and Budget, 1987.
U.S. Industrial Outlook 1994, Department of Commerce.

Ground Transportation Industry Resource Materials/Bibliography
Sector Notebook Project September 1997124
Rail Profile
Railroad Facts, 1995 Edition, Association of American Railroads, 1995.
Waste Minimization Assessment for a Manufacturer of Rebuilt Railway Cars and Components, F.William Kirsch and Gwen P. Looby, University City Science Center, Philadelphia,Pennsylvania and U.S. Risk Reduction Engineering Laboratory, Cincinnati, Ohio, July, 1991.EPA/600/M-91/017.
Ensuring Railroad Tank Car Safety, Transportation Research Board, National Research Council,1994.
Association of American Railroads Catalogue of Publications: 1995-1996, AAR.
Railroad Information Handbook, AAR, 1994.
Trucking Profile
Source Assessment: Rail Tank Car, Tank Truck, and Drum Cleaning, State-of-the-Art, MonsantoResearch Corporation, Dayton, Ohio, 1978.
One Hundred Years of Infrastructure: 1892-1992. July 1992.
General Pipeline Profile
Oil and Gas Pipeline Fundamentals, Second edition, John L. Kennedy, Pennwell Books, 1993.
“U.S. Interstate Pipelines Ran More Efficiently in 1994,” Oil and Gas Journal, November 27, 1995.
Gas Pipeline Profile
Natural Gas 1995: Issues and Trends, Energy Information Administration, 1995.
Energy Policy Act Transportation Study: Interim Report on Natural Gas Flows and Rates, EnergyInformation Administration, 1995.
Natural Gas Technologies: Energy Security, Environment and Economic Development: ConferenceProceedings, 1993, International Energy Agency, 1993.
Reporting Requirements of Interstate Natural Gas Pipelines (Report No. 93-1), INGAA, 1993.
Overview of Natural Gas Storage Operations (Report No. 91-6), INGAA, 1991.
Analyses Related to the Impact of Air Quality Regulation on the Natural Gas Transmission Industry,INGAA Foundation, 1992.
Ground Transportation Industry Resource Materials/Bibliography
Sector Notebook Project September 1997125
New Directions: Natural Gas Supply, Natural Gas Council, 1992.
New Directions: Natural Gas Energy, Natural Gas Council, 1992.
Natural Gas Reliability, Natural Gas Council, 1993.
New Directions: Natural Gas Technology Research and Development, Natural Gas Council, 1993.
Natural Gas Reliability Principles, Natural Gas Council, 1995.
New Directions: Natural Gas, Energy and the Environment, Natural Gas Council, 1993.
America’s Natural Gas Pipelines: A Network Built on Safety, INGAA.
Pipeline to Clean Energy: An Introduction to Interstate Natural Gas Association of AmericaLegislative Affairs, 104th Congress, INGAA.
Going the Extra Mile for Safety: America’s Interstate Natural Gas Pipelines, INGAA Foundation.
Natural Gas Pipelines: The Safe Route to Energy Security, INGAA.
Factbook: Energy, the Environment, and Natural Gas, AGA, 1983.
Profiles of U.S. and Canadian Natural Gas Pipeline Companies, Third Edition, 1995.
Oil Pipeline Profile
International Petroleum Encyclopedia, Pennwell Publishing Co., 1994.
U.S. Oil Pipelines, George S. Wolbert, Jr., API, 1979.
U.S. Petroleum Strategies in the Decade of the Environment, Bob Williams, Pennwell PublishingCo., 1991.
Modern Petroleum: A Basic Primer of the Industry, Third Edition, Bill Berger and Ken Anderson,Pennwell Books, 1992.
“Regulation of Underground Storage,” Petroleum Supply Monthly, August, 1991.

A - 1Sector Notebook Project September 1997
APPENDIX AINSTRUCTIONS FOR DOWNLOADING THIS NOTEBOOK
Electronic Access to this Notebook via the U.S. EPA Site on the World Wide Web (WWW)
This Notebook is available through the EPA Public Access Server and the Enviro$enseCommunications Network on the World Wide Web at http://www.epa.gov/oeca/sector/index.html. Enviro$ense is a free, public, environmental exchange system operated by EPA's Office ofEnforcement and Compliance Assurance and Office of Research and Development. The Networkallows regulators, the regulated community, technical experts, and the general public to shareinformation regarding: pollution prevention and innovative technologies; environmental enforcementand compliance assistance; laws, executive orders, regulations, and policies; points of contact forservices and equipment; and other related topics. The Network welcomes receipt of environmentalmessages, information, and data from any public or private person or organization.
ACCESS THROUGH THE U.S.EPA WORLD WIDE WEB SITE
To access this Notebook through the Web, set your web browser to the aforementioned webaddress, and select the desired Notebook; or point and click your way there as follows:
1) set your browser to our primary web address: http://www.epa.gov/oeca;
2) select “Industry and Gov’t. Sectors”;
3) select “EPA Sector Notebooks”; and
4) select the desired sector and file format.
HELPLINE NUMBER FOR OECA’S WORLD WIDE WEB SITE : 703-908-2007
EPA OECA WORLD WIDE WEB MANAGER: Louis Paley 202-564-2613