epa standard operating procedure for … standrad operating procedure for the analysis of volatile...
TRANSCRIPT

00019
STANDRAD OPERATING PROCEDURE
FOR
THE ANALYSIS OF VOLATILE ORGANICS WITH LOW DETECTION LIMITS
IN RESIDENTIAL WELL WATER SAMPLES
USING GAS CHROMATOGRAPHY/MASS SPECTROMETRY
PREPARED BY
Cheng-Wen Tsai
October 1987
Revised January 1989
Revised May, 1989

ANALYSIS OF VOLATILE QRGANICS WITH LOW DETECTION LIMITS
BXPURGE AND TRAP GAS CHROMATOGRAPHY/MASS SPECTROMETRY METHOD
(PREPARED BY CHENG-WEN TSAI )
REVISED JANUARY 1989Revised Hay, 1989
1.0 SCOPE AND APPLICATION
1.1 This standard operating procedure describes the methodfor the analysis of volatile organics in private well,municipal water supply and domestic well samples.
1.2 This is a purge and trap gas chromatography/massspectrometry (GC/MS) method applicable to the determi-nation of 38 compounds (See Table 1> in municipal watersupply, and private well water samples.
1.3 The required method detection limit (HDD for eachcompo-und is listed in Table 1.
1.4 This method is restricted to use by or under the super-vision of analysts experienced in the operation ofa purge and trap system, and gas chromatography/massspectrometry, and in the interpretation of mass spectra.Each analyst must demonstrate the ability to generateacceptable results with this method using the proceduredescribed in Section 10.
2.0 SUMMARY OF METHOD
2.1 An inert gas is bubbled through a 20-ml water samplecontained in a specially designed purging chamber atambient temperature. The purgeables are efficientlytransferred from the aqueous phase to the vapor phase.The vapor is swept through a sorbent trap where thepurgeables are trapped. After purging is completed, thetrap is heated and backflushed with the inert gas to

TABLE 1
TARGET COMPOUND LIST (TCL) AND QUANTITATION LIMITS (QLS)
(FOR RESIDENTIAL WELL WATER SAMPLES)
VOLATILE ORGANICS CAS NUMBER OUANTITATION LIMITS (ug
BenzeneBromdichloromethaneBromoformBromomethaneCarbon TetrachlorideChlorobenzeneChloroethaneChloroformChloromethaneDibromochloromethane1 , 1-Dichloroethane1 ,2-Dichloroethane1 ,1-Dichloroethene1 ,2-Dichloroethene (Total)1 ,2-DichloropropaneCis-1 , 3-DichloropropeneTrans-1 , 3-DichloropropeneEthyl BenzeneMethylene Chloride (*)1,1,2, 2-TetrachloroethaneTetrachloroetheneToluene (*)1 ,1 ,1-Trichloroethane1 ,1 ,2-TrichloroethaneTrichloroetheneVinyl ChlorideAcroleinAcetone (*)AcrylonitrileCarbon Disulfide2-Butanone (*)Vinyl Acetate4-Methyl-2-Pentanone2-HexanoneStyrenem-Xylene **
71-43-275-27-475-25-274-83-956-23-5108-90-775-00-367-66-374-87-3124-48-175-34-3107-06-275-35-4
78-87-510061-01-510061-02-6100-41-475-09-279-34-5127-18-4108-88-371-55-679-00-579-01-675-01-4107-02-867-64-1107-13-175-15-078-93-3108-05-4108-10-1519-78-6100-42-5108-38-3
11111111111111121111111111
255
253551511
.5
.5
.5
.5
.5
.5
.5
.5
.5
. 5
.5
.5
.5
.5
.5
.0
.0
.5
.0
.5
.5
.5
.5
.5
.5
.5
.0
.0
.0
.0
.0
.0
.5
.0
.0
.5
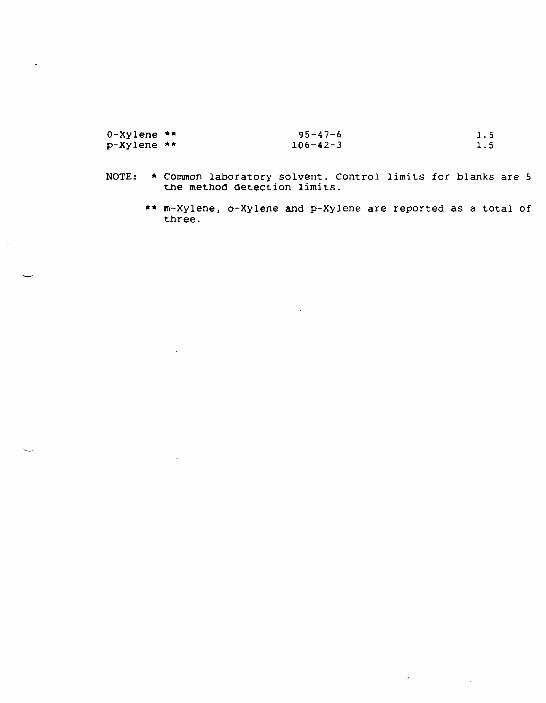
0-Xylene ** 95-47-6 1.5p-Xylene ** 106-42-3 1.5
NOTE: * Common laboratory solvent. Control limits for blanks are 5the method detection limits.
** m-Xylene, o-Xylene and p-Xylene are reported as a total ofthree.

desorb the purgeables onto a gas chromatographic column.The gas chromatograph is temperature programmed toseparate the purgeables which are then detected withmass spectrometer.
3. 0
3.1 Impurities in the purge gas, organic compounds outgasingfrom the plumbing ahead of the trap, and solvent vaporsin the laboratory account for the majority of contamina-tion problems. The analytical system must be demonstratedto be free from contamination under the conditions of theanalysis by running laboratory reagent blanks. The use ofnon-telfon plastic tubing, non-telfon thread sealants, orflow controllers with rubber components in the purge andtrap system should be avoided.
3.2 Samples can be contaminated by diffusion of volatileorganics through the septum seal into the sample duringshipment and storage. A trip blank sample prepared fromorganic-free water and carried through the sampling andhandling protocol can serve as a check on such contami-nation.
3.3 Contamination by carry-over can occur whenever high leveland low level samples are sequentially analyzed. To reducecarry-over, the purging device and sample syringe must berinsed with reagent water between sample analysis.Whenever an unusually concentrated sample is encountered,it should be followed by an analysis of reagent water tocheck for cross contamination. It may be necessary towash the purging device with a detergent solution, rinseit with distilled water, and then dry it in a lOS^Coven between analysis. The trap and other parts of thesystem are also subjected to contamination; therefore,frequent bakeout and purging of the entire system maybe required.
4.0 SAFETY PRECAUTIONS
4.1 The toxicity or carcinogenicity of chemicals used inthis method has not been precisely defined, eachchemical should be treated as a potential health hazard,and exposure to these chemicals should be minimized.Each laboratory is responsible for maintaining awarenessof OSHA regulations regarding safe handling of chemicals
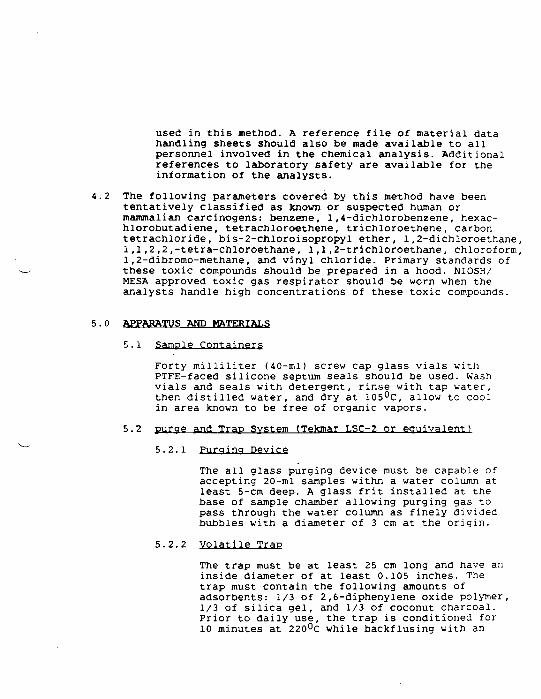
used in this method. A reference file of material datahandling sheets should also be made available to allpersonnel involved in the chemical analysis. Additionalreferences to laboratory safety are available for theinformation of the analysts.
4.2 The following parameters covered by this method have beententatively classified as taiown or suspected human ormammalian carcinogens: benzene, 1,4-dichlorobenzene, hexac-hlorobutadiene, tetrachloroethene, trichloroethene, carbontetrachloride, bis-2-chloroisopropyl ether, 1,2-dichloroethane,1,1,2,2,-tetra-chloroethane, 1,1,2-trichloroethane, chloroform,1,2-dibromo-methane, and vinyl chloride. Primary standards ofthese toxic compounds should be prepared in a hood. NIOSH/MESA approved toxic gas respirator should be worn when theanalysts handle high concentrations of these toxic compounds.
5.0 APPARATUS AND MATERIALS
5.1 Sample Containers
Forty milliliter (40-ml) screw cap glass vials withPTFE-faced silicone septum seals should be used. Washvials and seals with detergent, rinse with tap water,then distilled water, and dry at 105°C, allow to coolin area known to be free of organic vapors.
5.2 purge and Trap System ITekmar LSC-2 or equivalent)
5.2.1 Purging Device
The all glass purging device must be capable ofaccepting 20-ml samples withn a water column atleast 5-cm deep. A glass frit installed at thebase of sample chamber allowing purging gas topass through the water column as finely dividedbubbles with a diameter of 3 cm at the origin.
5.2.2 Volatile Trap
The trap must be at least 25 cm long and have aninside diameter of at least 0.105 inches. Thetrap must contain the following amounts ofadsorbents: 1/3 of 2,6-diphenylene oxide polymer,1/3 of silica gel, and 1/3 of coconut charcoal.Prior to daily use, the trap is conditioned for10 minutes at 220°C while backflusing with an

inert gas flow of at least 20 ml/min. The trapeffluent is vented to the room through a charcoaltrap.
5.2.3 Desorber
The desorber must be capable of rapidly preheat-ing the trap to 180°C, then desorbing the trapto the GC column while maintaining the temperatureof 180°C.
5 . 3 GC/MS SYSTEM
5.3.1 Gas Chromatograph (Hewlet Parkard 5993 GC orEquivalent)
Gas chromatograph must be capable of temperatureprogramming and achieving an initial columntemperature of 30°c - 45°C. Variable constantdifferential flow controllers capable ofmaintaining constant flow rates throughout thedesorption and temperature program should be used.
5.3.2 Gas Chromatoaraphic Column
Eight Ft. long x 1/8 O.D. glass column, packaedwith 1% SP-1000 on Carbopack B (60/80 mesh) orequivalent.
5.3.3 Mass Spectrometer (Finniaan 5100 MS or equivalent)
Must be capable of scanning from 20 to 260 amuevery 7 seconds or less, utilizing 70 V (nominal)electron energy in the electron impact ionizationmode, and producing a mass spectrum which meet allthe criteria in Table 3 when 50 ng of 4-bromo-fluorobenzene (BFB) is injected through the GC inlet.
5.3.4 GC/MS Interface
GC to ms interface constructed of all glass orglasslined materials should be used. Glass canbe deactivated by silanizing with dichlorodi-methylsilane.
5.3.5 Data System
A computer system must be interfaced to the mass

spectrometer that allows the continuous acquisitionand storage on machine-readable media of all massspectra obtained through the duration of thechromatographic program. The computer must havethe software that allows searching any GC/MS datafile for spectra m/z (masses) and plotting suchm/z abundance versus time or scan number.Software must also allow integrating theabundance in any Extracted Ion Current Profile(EICP) between specific time or scan numberlimits.
5.3.6 Syringe and Syringe Valves
5.3.6.1 Syringes - 5-ml and 25-ml glasshypodermic with luerlocX tip (two each).
5.3.6.2 Micro Syringes - 25- and 100-ul.
5.3.6.3 Gas Syringes - 1.0 and 5.0 ml gas tight,with shut-off valve.
5.3.7 Miscellaneous
5.3.7.1 Standard Storage Containers - 3.7 mlscrew cap amber vilas.
5.3.7.2 Mininert Valves - Screw cap.
6 . 0
6.1 Methanol, demonstrated to be free of analytes (spike100 ul into 25 ml of reagent water and analyze. Resultshould be less than detection limits.).
6.2 Reagent water, producing less than detection limits ofthose compounds that are monitored. Prepared by boilingdistilled or natural waters for 15 minutes followed by1 hour purge with inert gas while temperature is heldat 90°c or carbon filtered. Store in clean, narrowmouthed crip top PTFE-lined septa bottles.
6.3 Stock Standards - Commerical mixed stocX solutionsare available (Supelco Purgeeables A, B, and C) thatcontain most of the compounds of interest at a concen-tration of 0.2 mg/ml. stock solutions must be preparedfrom neat, as folows for those compounds not included
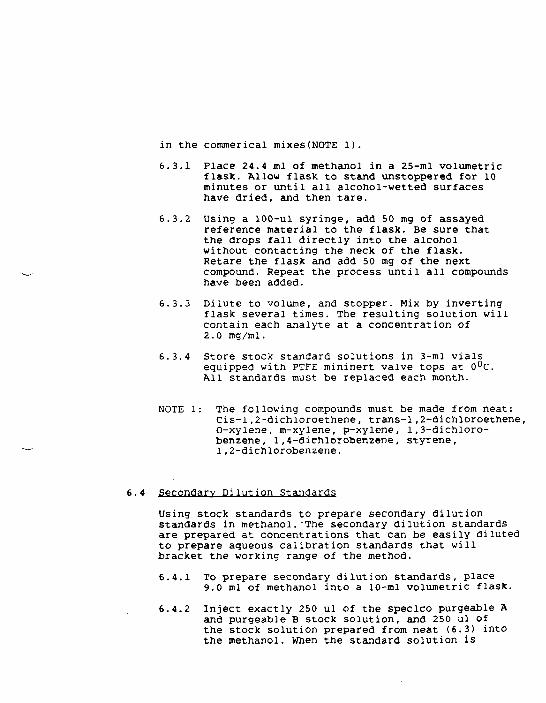
in the commerical mixes(NOTE 1).
6.3.1 Place 24.4 ml of methanol in a 25-ml volumetricflask. Allow flask to stand unstoppered for 10minutes or until all alcohol-wetted surfaceshave dried, and then tare.
6.3.2 Using a 100-ul syringe, add 50 mg of assayedreference material to the flask. Be sure thatthe drops fall directly into the alcoholwithout contacting the neck of the flask.Retare the flask and add 50 mg of the nextcompound. Repeat the process until all compoundshave been added.
6.3.3 Dilute to volume, and stopper. Mix by invertingflask several times. The resulting solution willcontain each analyte at a concentration of2.0 mg/ml.
6.3.4 Store stock standard solutions in 3-ml vialsequipped with PTFE mininert valve tops at 0°C.All standards must be replaced each month.
NOTE 1: The following compounds must be made from neat:Cis-1,2-dichloroethene, trans-1,2-dichloroethene,O-xylene, m-xylene, p-xylene, 1,3-dichloro-benzene, 1, 4-dichlorobenzene, styrene,1,2-aichlorobenzene.
6. 4 Secondary Dilution Standards
Using stock standards to prepare secondary dilutionstandards in methanol.-The secondary dilution standardsare prepared at concentrations that can be easily dilutedto prepare aqueous calibration standards that willbracket the working range of the method.
6.4.1 To prepare secondary dilution standards, place9.0 ml of methanol into a 10-ml volumetric flask.
6.4.2 Inject exactly 250 ul of the speclco purgeable Aand purgeable B stock solution, and 250 ul ofthe stock solution prepared from neat (6.3) intothe methanol. When the standard solution is

prepared as above, the solution will contain eachanalyte at a concentration of 5 ng/ul.
6.4.3 Separate secondary dilution standard mixtureshould be prepared weekly for the gases from theSupelco purgeable C mix.
6.4.4 Store secondary dilution standards in 3-ml glassvials equipped with PTFE mininert valve screwtops. Storage conditions and time described forstock standary solutions (6.3.4) also apply to thesecondary dilution standard solutions.
6.5 Working Aqueous Calibration Standards
Using the secondary dilution standards to prepare fivecalibration standards at concentrations of 5, 10, 20,40 and 60 ug/L for all volatile compounds except theacrolein and acrylonitrile, which should be atconcentrations of 25, 50, 75, 100 and 125 ug/L.
6.6 Continuing Calibration Check Standard
Prepare the aqueous continuing calibration checkstandard solution at concentration of 20 ug/L for allcompounds except acrolein and acrylonitrile, whichshould be at concentration of 50 ug/L.
6. 7 Sample matrix Spiking Solution
Prepare a matrix spiking solution containing allcompounds of interest in methanol using the proceduresdescribed in Section 6.3 and 6.4. It is recommendedthat the secondardy dilution standard be prepared at aconcentration of 50 ug/mL for all compounds exceptacrolein and acrylonitrile, which shall be at aconcentration of 125 ug/mL. The addition of 10 uL ofsuch standard solution to 25 mL of reagent water orsamples would be equivalent to 20 ug/L. Store at 0°C.The sample matrix spiking solution should be discardedafter 1 month.
6.8 Internal Standard Solution

Prepare a spiking solution containing Bromochloromefhane,1,4-Difluorobenzene, arid chlorobenzene-<S5 in methanolusing the procedures described in Section 6.3 and 6.4.It is recommended that the secondary dilution standardbe prepared at a concentration of 50 ug/mL of eachinternal standard compound. The addition of 10 uL ofsuch a standard to 25 mL of sample or calibrationstandard would be equivalent to 20 ug/L.
6.9 Surrogate Spike Standard Solution
Prepare a surrogate spiking solution containingToluene-d8, Bromofluorobenzene, and 1,2-dichloro-ethane-d4 in methanol using the procedures describedin Section 6.3 and 6.4. It is recommended that thesecondary dilution standard be prepared at a concentra-tion of 50 ug/mL of each surrogate spike compound.The addition of 10 uL of such as standard to 25 mL ofsample or calibration standard would be equivalent to20 ug/L.
6.10 4-BORMOFLUOROBENZENE (BFB1 Solution
Prepare a 25 ug/mL solution of bromofluorobenzene inmethanol. This solution would be used for MS tuning.
7.0 SAMPLE COLLECTION. PRESERVATION. MTO STORAGE
7.1 Sample collection
7.1.1 Collect all samples in duplicated 40-ml glassvials). Fill sample bottles to overflowing.No air bubbles should pass through the sampleas the bottle is filled, or be trapped in thesample when the bottle is sealed.
7.1.2 When sampling from a water tap, open the tap andallow the system to flush until water temperaturehas stabilized (usually about 10 minutes). Adjustthe flow to about 500 ml/min. and collectduplicate samples from the flowing system.
7.1.3 When sampling from an open body of water, filla 1-quart wide-mouth bottle or 1-liter beakerwith sample from a respresentative area, and

carefully fill duplicate sample bottles fromthe container.
7.2 Sample Preservation
7.2.1 Adjust the pH of the duplicate samples to <2 bycarefully adding one drop of 1:1 HC1 for each20 ml of sample volume (See Reference No.6). Sealthe sample bottles, PFTE-face down, and shakevigorously for one minutes.
7.2.2 The samples must be chilled to 4°C on the dayof collection and maintained at that temperatureuntil analysis. Field samples that will not bepackaged for shipment with sufficient ice toensure that they will be at 4°C on arrival atthe laboratory.
7.3 Sample storage
7.3.1 Store samples at 4^C until analysis. The samplestoragearea must be free of organic solvent vapors.
7.3.2 Analyze all samples within 7 days of collection.Samples not analyzed within this period must bediscarded and replaced.

8.0 CALIBRATION AND STANDARDIZATION
8.1 Tuning and GC/MS Calibration
8.1.1 The laboratory must establish that a given GC/MSsystem meet the standard spectral abundancecriteria prior to initiating any on-going datacollection. The GC/MS system must be hardwaretuned to meet the abundance criteria listed inTable 4 for a maximum of a 50 ng injection of4-Bromofluorobenzene (BFB). Add 50 ng of BFBsolution to 20 ml of reagent water and analyzealone. BFB should NOT be analyzed simultaneouslywith any calibration standards or blanks. Thiscriteria must be demonstrated dialy or for eachtwelve-hour (12) time period. If required,background substraction must be straight forwardand designed only to eliminate column bleedor instrument background.
8.1.2 BFB criteria MUST be met before any standards,samples or blanks are analyzed.
8.1.3 Any action taken which may results in effectingthe tuning criteria for BFB, the tune must beverified irrespective of the twelve-hour tuningrequirement.
8.1.4 The laboratory shall document the GC/MS tuningand mass calibration each time the system is tuned.
8.2 Calibration of GC/MS System
8.2.1 Initial Internal Standard Calibration
8.2.1.1 Prior to the analysis of samples andrequired blanks and after tuningcriteria have been met, the GC/MS systemmust be initially calibrated at a minimumof five concentrations to determine thelinearity of response utilizing theinitial calibration standard solutionscontaining all compounds listed in Table 2.Once the system has been calibrated,the calibration must he verified afterthe initial calibration and each twelve(12)hours time period for each GC/MS system.

TABLE 2
CHARACTERISTIC IONS FOR VOLATILE ORGANIC COMPOUNDS
Parameters Primary Ion Secondary Ions
ChloromethaneBromomethaneVinyl ChlorideChloroethaneMethylene ChlorideAcetoneCarbon Bisulfide1 ,1-Dichloroethene1 ,1-Dichloroethane1 ,2-DichloroetheneChloroform1 , 2-Dichloroethane2-Butanone1,1, 1-Tr ichloroethaneCarbon TetrachlorideVinyl AcetateBromodichloromethane1,1,2, 2-Tetrachloroethane1 ,2-DichloropropaneTrans-1 ,3-DichloropropeneTrichloroetheneDibromochloromethane1 ,1 , 2-TrichloroethaneBenzeneCis-1 ,3-DichloropropeneBromoform2-Hexanone4-Methyl-2-pentanoneTetrachloroetheneTolueneChlorobenzeneEthyl BenzeneStyreneTotal Xylenes
50946264844376966396836272971274383836375130129977875173434316492112106104106
52966466
49, 51, 865878
61, 9865, 83, 85, 98, 100
61, 9885
64, 100, 9857
99, 117, 119119, 1218685
85, 131, 133, 16665, 11477
95, 97, 132208, 206
83, 85, 99, 132, 134-77
171, 175, 250, 252, 25458, 57, 100
58, 100129, 131, 166
911149178, 10391
The primary ion should be used unless interferences are present,in which case, a secondary ion may be used.

TABLE 3
VOLATILE INTERNAL STANDARDS WITH CORRESPONDING TCL ANALYTES
ASSIGNED FOR QUANTISATION
Bromochloromethane 1,4-Difluorobenzene Chlorobenzene-d5
ChloromethaneBromomethaneVinyl ChlorideChloroethane
Methylene ChlorideAcetoneCarbon Disulfide1,1-dicnioroethene1,1-dicnloroethane
1,1,1-TrichloroetnaneCarbon TetrachlorideVinyl AcetateBromodiChloromethane
1,2-DichloropropaneTrans-1,3-dichloropropeneTrichloroetheneDibromochloromethane1,1,2-Trichloroethane
1,2-Dichloroethene(Total(BenzeneChloroform Cis-1,3-dichloropropene1,2-Dichloroethane Boroform2-Butanone1,2-Dichloroethane-d4(surrogate)
2-Hexanone4-Methyl-2-PentanoneTetrachloroethene1,1,2,2-tetra-
chloroethaneTolueneChlorobenzeneEthylbenzeneStyreneXylene (total)Bromofluorobenzene
(Surrogate)Toluene-ds(surrogate)

TABLE 4
p-BROMOFLUOROBENZENE (BFB) KEY IONS AND ABUNDANCE CRITERIA
Mass Ion Abundance Criteria
50 15.0 - 40.0 % of the base peak15 30.0 - 60.0 % of the base peak95 Base peak, 100 % relative abundance96 5.0 - 9.0% of the base peak
173 Less than 1.00% of the base peak174 Greater than 50.0% of the base peak175 5.0 - 9.0% of mass 174176 Greater than 95.0%, but less than 101.
of mass 174.
NOTE: BFB criteria MUST be met before any samples, sample extracts,blanks, or standards are analyzed.

8.2.1.2 Prepare calibration standards by spikingfive portions of 20 ml reagent waters withvarious amount of secondary dilutionstandard solution (6.4) to yield thefollowing specific concentrations: 5, 10,20, 40, and 60 ug/L for all compoundsexcept acrolein and acrylonitrile, whichhave the specific concentrations at 25,50, 75, 100 and 125 ug/L.
Internal standards and surrogate spikestandards will be added to each eachcalibration standard solutions to yield aconcentration of 20 ug/L.
8.2.1.3 Analyze each calibration standard solutionand tabulate the area of the primarycharacteristic ion againt concentrationfor each compound including all requiredinternal standards and surrogate standardcompounds. The relative retention time(RRT) of each compound in each calibrationrun should agree within 0.06 RRT units.
8.2.1.4 Use Table 4 and Equation 1 to calculatethe relative response factor (RRF) foreach compound at each concentration level.
RRF = --- —— x — ——— ——— Equation 1Ais Cx
Where,
Ax = Area of the characteristic ion forthe compound to be measured.
Ais = Area of the characteristic ion forthe specific internal standardsfrom Table 2.
cis ~ Concentration of the internalstandard (ng/UL) .
Cx = Concentration of the compound tobe measured (ng/uL).

8.2.1.5 Use equation 2 and the relative responsefactors (RRF) from the initial calibra-tion to calculate the relative standarddeviation (%RSD) for compounds labelledas calibration check compounds in Table 4.
SD%RSD = — —— -——— x 100 Equation 2
X
Where,
RSD = Relative Standard Deviation
SD = Standard Deviation of initialrelative response factors(per compound).
Eq. 3
X = Mean of initial relativeresponse factors (per compound
The *RSD for each individual calibrationcheck compound must be less than or equalto 30.0%. This criteria must be met forthe initial calibration to be valid.
8.2.1.6 System Performance Check
A system performance check must be performedto insure that minimum average relativeresponse factors are met before the calibra-tion curve is used. This is done by analyzinfive system check compounds (SPCCs):Chloromethane, 1,1-dichloroethane, bromoform1,1,2,2-tetrachloroethane, and chlorobenzeneThe minimum acceptable RRF for these compounis 0.300 (0.100 for bromoform, and 0.200 for1,1,2,2-tetrachloroethane).
8.2.1.7 The initial calibration is valid only after

both the %RSD for calibration check compoundand the minimum RRF for SPCC have been met.Only after both of these criteria are met casample analysis begin.
8. 3 Continuing Calibration Check
8.3.1 A calibration standard(s) containing all volatileorganics listed in Table 2, including all requiredsurrogate compounds, must be analyzed each twelvehours during analysis. The concentration of eachcompound in the continuing calibration check (CCC)is 20 ug/L except acrolein and acrylonitrile(50 ug/L). Compare the relative response factordata from the standards each twelve hours with theaverage relative response factor from the initialcalibration for a specific instrument. A systemperformance check must be made each twelve hours.If the SPCC criteria are met, a comparison ofrelative response factors is made for all compounds.
8.3.2 After the system performance check is met, useequation 4 to calculate the percent difference(% difference) for all calibration check compoundsin Table 4 in order to check the validity of theinitial calibration.
8.3.2.1 Calculate the percent difference usingEquation 4.
- RRFC%Difference = ---- — — --___-__ x IQO Eq. 4
RRFj
Where
RRFj = Average relative response factorfrom initial calibration.
RRFC = Relative response factor fromcurrent calibration check.
8.3.2.2 If the percent difference for any compoundis greater than 20%, the laboratory shouldconsider this a warning limit. If thepercent difference for each CCC is less

than or equal to 25.0%, the initialcalibration is assumed to be valid. If thecriteria are not met (>25.0% difference ),for any one of the calibration checkcompound, corrective action MUST be taken.Problems similar to those listed underSPCC could affect this criteria. If nosource of the problem can be determinedafter corrective action have been taken,a new initial five points calibration MUSTbe generated. These criteria MUST be metbefore sample analysis begins.
9.0 QUALITY CONTROL
9.1 Each laboratory that uses this method is required tooperate formal quality control program. The minimumrequirements of this program consists of an intialdemonstration of laboratory capability and an ongoinganalysis of spiked samples to evaluate and documentdata quality. The laboratory must maintain records todocument the quality of data that is generated. Ongoingdata quality checks are compared with establishedperfromance criteria to determine if the results ofanalysis meet the performance characteriztics of themethod. A quality control check standard must beanalyzed to confirm that the measurements vereperformed in an in-control mode of operation.
9.1.1 The analyst must make an initial, one-time,demonstration of the ability to generateacceptable accuracy and precision with thismethod. This ability is established as aredescribed in Section 9.2
9.1.2 In recognition of advances that are occurring inchromatography, the analyst is permitted certainoptions (detailed in Section 10.2.2) to improvethe separation or lower the cost of measurements.Each time such a modification is made to themethod, the analyst is required to repeat theprocedure in Section 9.2 .
9.1.3 Each day, the analyst must analyze a reagentwater blank to demonstrate that interferencesfrom the analytical system are under control.

9.1.4 The laboratory must, on an ongoing basis,demonstrate through the analyses of qualitycontrol check standards that the operation ofthe measurement system is in control. Thefrequency of the check standard analyses isequivalent ot 10% of all samples analyzed but atleast two samples per month. Using thefollowing procedure to analyze a quality controlcheck sample for all analytes of interestat 10 ug/L:
9.1.4.1 Prepare a QC check sample by adding50 ul of QC check sample concentrateto 20 ml of reagent water in a glasssyringe.
9.1.4.2 Analyze the QC check sample according toSection 10, and calculate the recoveryfor each analyte. The recovery must bebetween 60% and 140% of the expectedvalues.
9.1.4.3 If the recovery for any analyte fallsoutside the designated range,the analytehas failed the acceptance criteria.A check standard containing each analytethat failed must be re-analyzed.
9.1.5 On a weekly basis, the laboratory must demonstratethe ability to analyze low level samples. Thefollowing procedure should be used:
9.1.5.1 Prepare a low level check sample byspiking 10 ul of QCcheck sampleconcentrated to 25 ml of reagent waterand analyze according to the methodin Section 10.0 .
9.1.5.2 For each analyte, the recovery must bebetween 60% and 140% of the expected value.
9.1.5.3 When one or more analytes fail the test,the analyst must repeat the test onlyfor those analytes which failed to meetthe criteria. Repeated failure, however,will confirm a general problem with themeasurement system. If this occurs,locate

and correct the source of the problem andrepeat the test for all compounds ofinterest beginning with 9.1.5.1.
9.1.6 The laboratory must maintain performance recordsto document the quality of data that is generated.The following procedure should be performed:
9.1.6.1 It is recommeded that the laboratoryadopt additional quality assurancepractices for use with this method. Thespecific practices that are most productivedepend upon the needs of the laboratoryand the nature of the samples. As a minimum,field duplicate samples must be analyzedto assess the precision of the environmentalmeasurements.
9.2 To establish the ability to generate acceptable accuracyand precision, the analyst must perform the followingoperations.
9.2.1 A quality control check sample concentrate containingeach analyte at a concentration of 500 times the MDLin methanol is required. The QC check sample must bepreparea by the laboratorry using stock standardsprepared independently from those used for calibratio
9.2.2 Analyze seven 20-ml QC check samples at 2 ug/Laccording to the method beginning in Section 10.0 .Each sample is produced by injecting 10 ul of QCcheck sample concentrate into 25 ml of reagent waterin a glass syringe through the syringe valve.
9.2.3 Calculate the average recovery (X) in ug/L, and thestandard deviation of the recovery (S) in ug/Lfor each analyte using the seven results. Calculatethe MDL for each analyte as specified in Reference 2.The calculated MDL must be less than the spike level.
9.2.4 For each analyte, (X) must be between 90% and 110% ofthe true value. Additionally, s must be <35% of X.If s and X for all analytes meet the criteria, thesystem performance is acceptable and analysis ofactual samples can begin. If any s exceeds theprecision limits or any X falls outside the rangefor accuracy, the system performance is unacceptablefor that analyte.

NOTE: The larger number of analytes present asubstantial probability that one or more willfail at least one of the acceptance criteriawhen all analytes are analyzed.
9.2.5 When one or more of the analytes tested fail at leastone of the acceptance criteria, the analyst mustproceed according to Section 9.2.2 only for theanalytes which fialed the test.
10.0 PROCEDURE OF SAMPLE ANALYSIS
10.1 DRILY GC/MS PERFORMANCE TESTS
10.1.1 At the beginning of each day that analyses areto be performed, the GC/MS system must bechecked to see if acceptable performance criteriaare achieved.for 4-Bromofluorobenzene (BFB).The performance test must be passed before anysamples, blanks, or standard are analyzed.
10.1.2 At the beginning of each day, inject 2 ul(50 ng) of BFB solution directly onto the column.Alternatively, add 2 ul of BFB solution to20.0 ml of reagent water or calibration standardand analyze the solution according to Section 8.1Obtain a background-corrected mass spectrum ofBFB and confirm that all the key n/z criteria inTable 4 are achieved. If all the criteria arenot achieved, the analyst must re-tune the massspectrometer and repeat the test until allcriteria are achieved.
10.2 INITIAL CONDITIONS
10.2.1 Acquire GC/MS data for perfomance tests,standards and samples using the followinginstrumental conditions:
Electron Energy : 70 V (Nominal)
Mass Range : 35 to 300 ami
Scan Time : To give at least 5 .-:ansper second, but not to exceed2 seconds per scan.
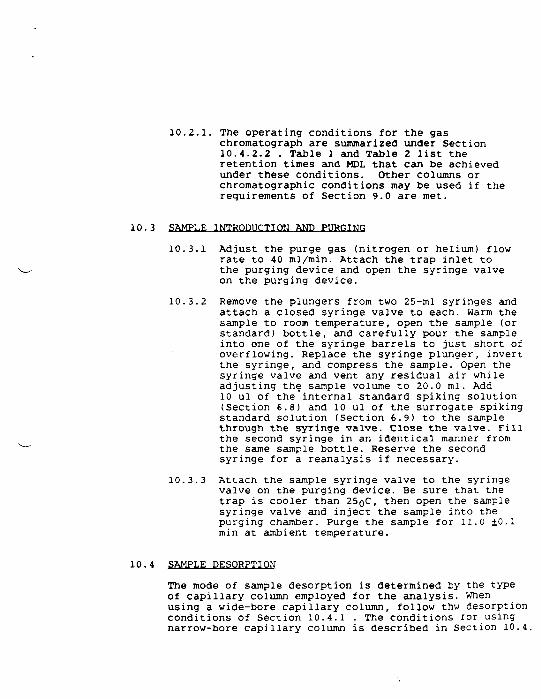
10.2.1. The operating conditions for the gaschromatograph are summarized under Section10.4.2.2 . Table 1 and Table 2 list theretention times and MDL that can be achievedunder these conditions. Other columns orchromatographic conditions may be used if therequirements of Section 9.0 are met.
10.3 SAMPLE INTRODUCTION AND PURGING
10.3.1 Adjust the purge gas (nitrogen or helium) flowrate to 40 ml/min. Attach the trap inlet tothe purging device and open the syringe valveon the purging device.
10.3.2 Remove the plungers from two 25-ml syringes andattach a closed syringe valve to each. Warm thesample to room temperature, open the sample (orstandard) bottle, and carefully pour the sampleinto one of the syringe barrels to just short ofoverflowing. Replace the syringe plunger, invertthe syringe, and compress the sample. Open thesyringe valve and vent any residual air whileadjusting the sample volume to 20.0 ml. Add10 ul of the"internal standard spiking solution(Section 6.8) and 10 ul of the surrogate spikingstandard solution (Section 6.9) to the samplethrough the syringe valve. Close the valve. Fillthe second syringe in an identical manner fromthe same sample bottle. Reserve the secondsyringe for a reanalysis if necessary.
10.3.3 Attach the sample syringe valve to the syringevalve on the purging device. Be sure that thetrap is cooler than 25(jC, then open the samplesyringe valve and inject the sample into thepurging chamber. Purge the sample for 11.0 ±0.1min at ambient temperature.
10.4 SAMPLE DESQRPTIOM
The mode of sample desorption is determined by the typeof capillary column employed for the analysis. Whenusing a wide-bore capillary column, follow thw desorptionconditions of Section 10.4.1 . The conditions for usingnarrow-bore capillary column is described in Section 10.4.

10.4.1 Sample Desorotion for Wide-Bore Capillary Column
Undre most conditions,this type of column must beinterfaced to MS through a all-glass jet separator
10.4.1.1 After the 11-minute purge, attach thetrap to the chromatograph, adjust thepurge and trap system to the desorbmode and initiate the temperatureprogram sequence of the gas chromatograpand start data aquisition. Introducethe trapped materials to the GC columnby rapidly heating the trap to 180°Cwhile backflushing the trap with an inergas at 15 ml/min for 4.0 ± 0.1 min.While the extracted sample is beingintroduced into the gas chromatograph,empty the purging device using the samplsyringe and wash the chamber with two25-ml flushes of reagent water. Afterthe purging device has been emptied,leave the syringe valve open to allowthe purge gas to vent through the sampleintroduction needle.
10.4.1.2 Gas Chromatography - Hold the columntemperature at 10°C for 5 minutes,then program at 6°C/min to 160°Cand hold until all analytes eluted.
10.4.1.3 Trap Reconditioning - After desorbingthe sample for 4 min, recondition thetrap by returning the purge and trapsystem to the purge mode. Wait 15seconds, then closed the syringe valveon the purging device to begin gas flowthrough the trap. Maintain the traptemperature at 180°C. After approxi-mately 7 minutes, turn off the trapheater and open the syringe valve tostop the gas flow through the trap.When the trap is cool, the next samplecan be analyzed.
10.4.2 Sample Desorption for Narrow-Bore Capillary Column
Under normal operating conditions, most narrow-

bore capillary columns can be interfaceddirectly to the MS without a jet separator.
10.4.2.1 Sample Desorption
After the 11 minutes purge, attachthe trap to the cyrogenically cooledinterface at -15°C and adjust thepurge and trap system to the desorbmode. Introduce the trapped materialsto the interface by rapidly heatingthe trap to 180°C while backflusingthe trap with an inert gas at 4 ml/minfor 5.0+0.1 min. While the extractedsample is being introduced into theinterface,empty the purging deviceusing the sample syringe and rinse thechamber with two 25-ml flushes ofreagent water. After the purgingdevice has been emptied, leavethe syringe valve open to allow thepurge gas to vent through the sampleintroduction needle. After desorbingfor 5 minutes, flash heat the interfaceto 250°C and quickly introduce thesample onto the chromatographic column.Start the temperature program sequence,and initiate data acquisition.
10.4.2.2 Gas Chromatograph
Hold the column temperature at 10°Cfor 5 minutes, then program at 6°C/minto 70°C and then at 15°C/min to145°C.
10.4.2.3 Trap Reconditioning
After desorbing the sample for 5minutes, recondition the trap byreturning the purge and trap system tothe purge mode. Wait 15 seconds, thenclose the syringe valve on the purgingdevice to begin gas flow through thetrap. Maintain the trap temperatureat 180°C. After approximately 15minutes, turn off the trap heater andopen the syringe valve to stop the gas

flow through the trap. When the trapis cool, the next sample can be analyzed
10.5 TERMINATION OF DATA ACQUISITION
When sample components have eluted from the GC, terminateMS data acquisition and store data files on the data systestorage device. Use appropriate data output software todisplay full range mass spectra and appropriate EICPs.If any ion abundance exceeds the system working range,dilute the sample aliquot in the second syringe withreagent water and analyze the diluted aliquot.
11. 0 QUALITATIVE IDENTIFICATION
11.1 IDENTIFICATION PROCEDURES CRITERIA
Tentatively identify a sample component by comparison ofits mass spectrum (after background substraction) to areference spectrum in a collection. Use the follwoingcriteria to confirm a tentative identification:
11.1.1 The GC retention time of the sample componentmust be within 10 seconds of the time observedfor that sample compound when a calibrationsolution was analyzed.
11.1.2 All ions that are present above 10% relativeabundance in the mass spectrum of the standardmust be present in the mass spectrum of thesample component and should agree within absolute10%. For example, if an ion has a relativeabundance of 30% in the standard spectrum, itsabundance in the sample component should be inthe range of 20 to 40%.
11.1.3 Identification is hampered when sample componentsare not resolved chromatographically and producemass spectra containing ions contributed by morethan one analyte. Because purgeable organiccompounds are relatively small molecules andproduce comparatively simple mass spectra, thisis not a significant problem for most methodanalytes. When GC peaks obviously represent morethan one sample component (i.e., broadened peakwith shoulder(s) or valley between two or more

maxima), appropriate analyte spectra and backgrounspectra can be selected by examining EICPs ofcharacteriztic ions for tentatively identifiedcomponents. When analytes coelute (i.e., onlyone GC peak is apparent), the identificationcriteria described in Section 11.1.2 can be metbut each analyte spectrum will contain extraneousions contributed by the coeluting compound.
11.1.4 Structural Isomers that produce very similarmass spectra can be explicity identified only ifthey have sufficiently different GC retentiontimes. Acceptable resolution is achieved if theheight of the valley between two isomer peaks isless than 25% of the sum of the two peak heights.Otherwise, structural isomers are identified asisomeric pairs.
12.0 CALCULATI ON
12.1 When an analyte has been identified, the quantitationof that analyte should be based on the integratedabundance from the EICPs of the primary characteristicm/z given in Table 2. If the sample produces aninterference for the primary m/z, use a secondarycharacteristic m/z to quantitate. Instrument calibrationfor secondary ions is performed, as necessary, usingthe data and procedures described in Section 8.2.
12.2 Calculate the concentration in the sample using thecalibration curve or average response factor (RF)determined in Section 8.2.2 and Equation 3 :
<A S> (Cis)Concentration (ug/L) = -———-—_________ Equ. 3
(Ais> (RF)
Where,
As = Area of the characteristic m/z for theanalyte to be measured;
AJS = Area of the characteristic m/z for theinternal standard;
Concentration of the internal standard,in ug/L.
12.3 Report results in ug/L. All QC data obtained shouldbereported with the sample results.
13.0
13.1 All reports and documentation must be legible, single-sided, and clearly labelled and paginated.
13.2 The sample data package must be consecutivelypaginated and shall include the cover pages, sampledata, and the raw data as they are described in thefollowing:
13.2.1 Cover Pages for the data package, includingthe project name; laboratory name; fieldsample number cross-referenced with laboratoryID number ; comments describing in details anyproblems encountered in processing the samplesin the data package; and validation andsignature by the Laboraotry Manager.
13.2.2 Sample Data
Sample data shall be reported using the OrganicAnalysis Data Reporting Forms (Attachment I)for all samples, arranging in increasingalphanumeric sample number order, followed bythe QC analysis data, Quarterly verification ofinstrument parameters forms, raw data, and copiesof the sample preparation logs.
13.2.2.1 FORM I ( Organic Analysis Data Sheet)
13.2.2.2 FORM I (Tentatively Identified Compounds
13.2.2.3 FORM II (Surrogate Recovery)
13.2.2.4 FORM III (Matrix Spike/Matrix SpikeDuplicate Recovery)
13.2.2.5 FORM IV (Method Blank Summary)
13.2.2.6 FORM V (GC/MS Tuning and Mass

14.0
Calibration)
13.2.2.7 FORM VI (Initial Calibration Data)
13.2.2.8 FORM VII (Continuing Calibration Data)
13.2.2.9 FORM VIII (Internal Standard AreaSummary)
13.2.2.10 Raw Data
Raw data shall includes ReconstructedIon Current (RIO Chromatogram, Massspectrum (with and without backgroundsubstraction for all compoundsquantified.mass spectrum of tentativelyidentified compound including the mostmatched library standard spectra, anyinstrument printouts, etc.
14.1 A. Alford-Stevens, J.W. Eichelberger, W.L. Budde,"Purgeable Organic Compounds in Water by Gas Chroma-tography/Mass Spectrometry, Method 524." EnvironmentalMonitoring and Support Laboratory, U.S. EnvironmentalProtection Agency, Cincinnati, Ohio, February 1983.
14.2 Glaser , J. A., D. L. Foerst, G.D. McKee, S.A. Quave, andW.L.Budde, "Trace Analyses for Wastewaters," Environ. Sci.Technol., 15, 1426, 1981.
14.3 "The Determination of Halogenated Chemicals in Water bythe Purge and Trap Method, Method 502.1, "EnvironmentalProtection Agency, Environmental Monitoring and SupportLaboratory, Cincinnati, Ohio 45268, April, 1981.
14.4 "Volatile Aromatic and Unstaturated Organic Compounds inWater by Purge and Trap Gas Chromatography, Method 503.1,"Environmental Protection Agency, Environmental Monitoringand Support Laboratory, Cincinnati, Ohio, April, 1981.
14.5 Bellar, T.A. and J.J. Lichtenberg, "The determination ofSynthetic Organic Compounds in Water by Purge andSequential Trapping Capillary Column Gas Chromatography,"U.S.Environmental Protection Agency, Environmental
Monitoring and Support Laboratory, Cincinnati, Ohio,45268.
14.6 Ho. J.S. Method Performance Data for Method 502.2,Unpublished Report, September, 1986.
14.7 "Gas Chromatographic Analysis of Purgeable Halocarbon andAromatic Compounds in Drinking Water Using Two Detectorsin series," Kingsley, B.A., Gin, C., Coulson, D.M., andThomas, R.F., Water Chlorination, Environmental Impactand Health Effects, Volume 4, Ann Arbor Science.
14.8 "EPA Method Validation Study 23, Method 601 (PurgeableHalocarbon)," U.S. Environmental Protection Agency,Environmental Monitoring and Support Laboratory,Cincinnati, Ohio 45268.

VOLATILE OKGANICS ANALYSIS DATA «HZTT
Lab MUI*:
Field Saaple Bu»ber_Matrix: water
vol: _(lov/Md) _
Column: (pack/cap) ___
CAS NO. COMPOUND
Lab
Lab File XD:Data Kae«iv«d:
Data Analyicd:Dilution Factor:
CONCENTRATION UNITS:
74-87-3-----™—Chl oroB* than*__________74-83-9-—————BroBOBathan*____________75-01-4——————-Vinyl Chlorida_________75-00-3——————Chleroathana________75-09-2——————Mathylan* Chlcrida67-64-1——————Aeatena___________75-15-0——————Carbon Diaulfida75-35-4——————1.1-fiiehleroathan*______75-34-3——————l,l-Dichloro*tnana_____540-59-0—————1,2-Dichloroathana (total)67-66-3——————Chlorofor»___________"107-06-2—————l,2-Dichloro«than*_____78-93-3——————2-Butanona____________71-55-6——————1,1.1-Trichloroathana106-05-4—————Vinyl ftcatata75-27-4———————BrOBOdichloroBathana • ~78-87-5———-———l,2-0iehloropropan«_____10061-01-5———cia-1.3-Dichlorepropana79-01-6——————Trichloroathana________124-48-1™———DibroBochloroBathanc_____79-00-S————•—1.1.2-Trichloroathana71-43-2—————-Bantana10061-02-6———tranc-1,3-Dichloropropana_75-25-2——————BroBofor-_____________108-10-1—————4-M»thyl-2-Pant*nona____591-78-6——•———2-Haxanona____________127-18-4—————-Tatrachloroathana_______79-34-5———————-1,1.2,2-108-88-3—————Toluana_____108-90-7——————Chlorobansena_100-41-4—————tthylbansana_100-42-5—————Ctyrana_____1330-20-7————-Xylana (total)
FORM I VOA

ORCAXXCS ANALYSIS DATA CHTETXOEMTIPIEO COKPOOHDS
Lab Maac:_________Lab Soapie I.D. _Matrix: water
Caapl* Vol:
X«vel: (low/B«d)
Coluan: (pack/c«p)
Kumb«r TICc found:
Field Sample Bu»l>er_
L*b ril* ID:D*t* R«c«iv«d:Data Analysed:
Dilution Factor:
CONCZHTRATIOH OKITS:(ug/L
CAS KUMBER
1.2.3.4.5.6.7.I.9.10.11.12.13.14.15.16.17.18.19.20.21.22.21.24.25.26.27.21.29.10.
COMPOUND MAKE KT 1ST. CONC. 0
FORM I VOX-TIC

8ATZR TO1A7ILE CUMtOGATX UCOVBtY
lab Na»e:
IField| SAMPLE MO.I
01|_________02|_________03|_________
| SI | S2 | S3 (OTHER|(TOL)f|(BrB)f|(DCZ)f|
|TOT|IOOTI
_05106|.07|
12!«l-«l-151lei!17|1111»|.20|21122|2 3 12« l l«(.2C|27|~28|29f30|.
QC LIMITS51 (TOL) • Tolu«n*-d8 (88-110)52 (BFB) • BroBofluorob«nz*nc (8C-115)53 (OCX) " l,2-Dichloro«th»ne-d4 (76-114)
f Column to b« u»«a to flag recovery value*• Value* outside of contract required OC limitsD Surrogates diluted out
page _ of _FORM XI VOA-1
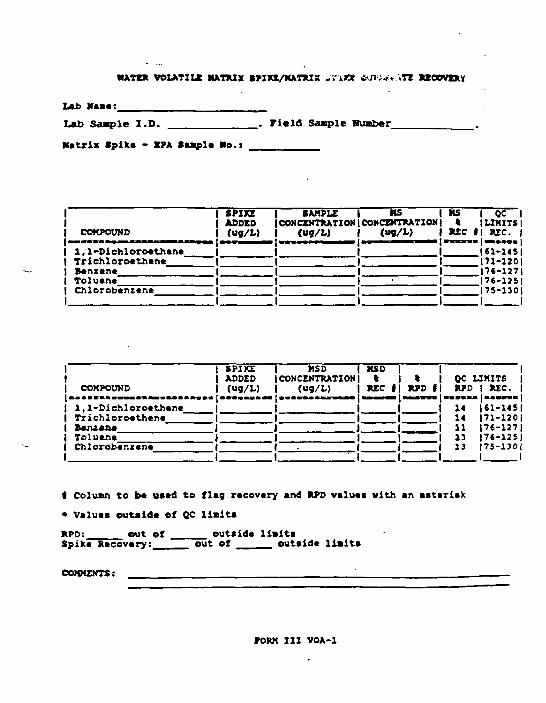
MATE* VOLATILE MATRIX SPIH/MATRIX .,r.kWt C RECOVERY
Lab MM*:Lab Sample I.D. _. Field Sample Buaber_
Matrix Spike - EPA Sup}* Ho.i
COMPOUND
1 . 1-DiehloroetheneTrichloroetheneBenzeneTolueneChlorob«nz«n«
SPIKEADDED(ug/L)
CAMPLECONCENTRATION
<ug/L)
MSCONCENTRATION
(U9/L)— ——— • —— — —
MS 1 QC It I LIMITS I
WC f| REC. 1
I«1-14SI171-1201nt-1271176-1251175-13011 1
COMPOUND
1 . l-Dichloro*th«neTri chl oroe then*B&rvzca*TolueneChl orobenzene
SPIKEADDED(ug/D
HSDCONCENTRATION
(ug/L)KSD
%XEC «
%RPD f
1QC LIMITS |RPD | REC. |
14 161-145114 |71-120|11 |76-127|13 |76-125|13 |75-130|
1 1
I Column to b« used to flag recovery and RPD value* with an asteriak
* Values outside of QC liaits
RPD:____ out of ____ outside limitsSpike Recovery:____ out of ____ outside limits
COMMENTS:
FORM III VOA-1
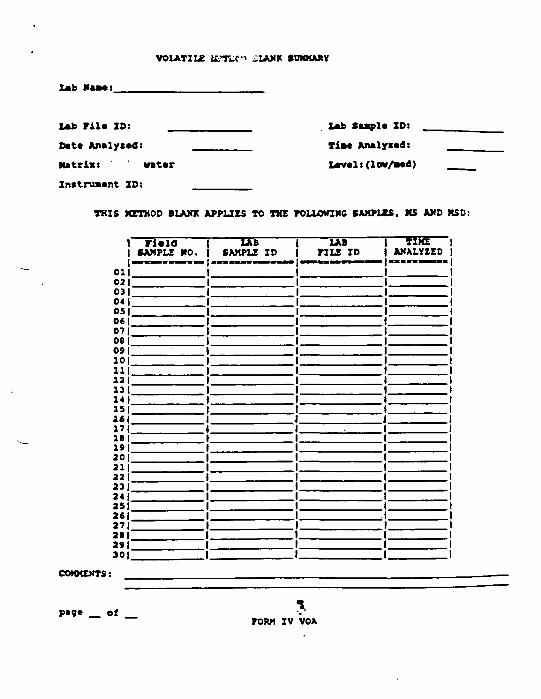
VOLATILE ffi*TW» J.IAMK SUMMARY
L*b
Lab ril« ID: _Datt Analysed:Matrix: ' ' mt«rJnstniBant ID:
Lab S*«pl« XD:TiM Analyiad:I«v*li(lew/Md)
THIS METHOD BLAOTC APPLIES TO THE FOLLOWING SAMPLES, MS AMD KSD:
t Field| SAMPLE MO.
Oil021031041051061071OBI09110111!12111114)151a«i171181191201211221211241251261271211291301
SABSAMPLE ID
LABPILE ID
TIKEANALYZED
COMMENTS:
P«9« _ of _FORM IV VOA
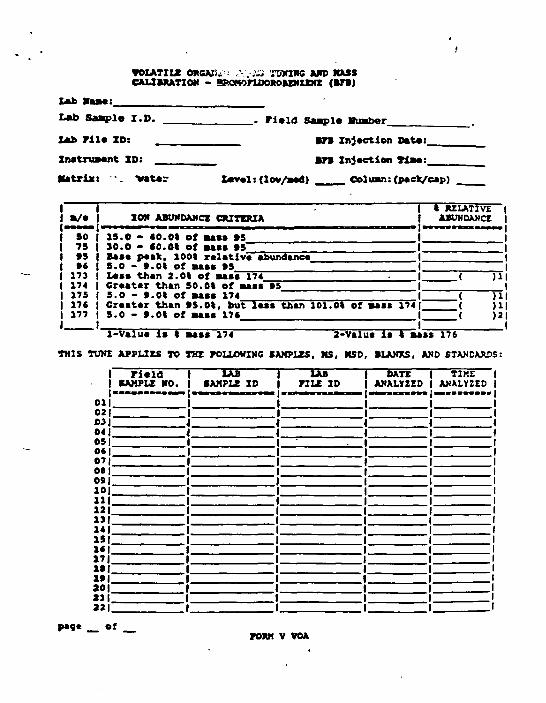
VOLATILE OKCAJS- : ,'• .,-& TONIHC AND MASSCAUHUTION - BROMOrLDOROBENZWE (BFB)
Lab Maae:_____Lab Sample I.D.
Lab File ID:Instrument ID:Matrix:
_. Field Saaple Bu»ber_BFB Injection Dete:_•n Injection Ti»e:_
Vatar Level :(lov/Md) Oeluan:(pack/cap)
»/•so73ts»«173174175176177
ION ABUNDANCE CRITERIA
15.0 - 40.0% Of MM »590.0 - «O.OI Of •••• »5~Base p«»X. loot relative abundance5.0 - t.0% of *a»« tsL**> than 2.01 of Base 174Greater than 50. Ot of MM »55.0 - f .Ot Of MM 174Greater than fS.Ot, but lee* than 101.04 of maaa 1745.0 - t.Ot of Mas 176
k RELATIVEABUNDANCE
( 11
( )1_____ ( )1
( 12
1-Value !• t MM 174 J-Value l » l M M 176THIS TUNE APPLIES TO THE FOLLOWING SAMPLES, MS. MSD, BLANK, AND STANDARDS:
1 FieldI CAMPLE MO.
Oil02103104105106107|08109110111112 1131141IS)1611711*11*1301211221
IABSAMPLE ID
..
IABFILE ID
•
DATEANALYZED
TIMEANALYZED
peg* _ of _FORM V VOA

9OIATXIC ORCAXICS ZXXTXAX. C3OIBXATION BATA
Lib «a»ai
ID: Calibration Data(a):.MatriKi watar _ lavalt (low/Bad) _____ Columni (pack/cap) __Min IKF for SPCCd) - 0.900 (0.250 for BroBoform) Max %MD for CCC(«)(LAB FILE 1C:""
jo.0%•V20 "KKT150-'
|Chloroaathana_|IroBoaathan*__(Vinyl ChloridT;(Chloroathana|H«thyl«n« ChloridejAc*ton*(Carbon Diculfid*|1,l-Dlchloro*th*n*111.1-Di chl oro*than* _____|},2-Dichloro*tb*n* (total)| Chl or of ore______ ~|1,2-Dichloroctban*(2-Butanon*(1,1,l-Trlchloro«than*(Carbon T*tr.chlorid* ~(Vinyl Ac*tat« —|»iOBodi ehloroB*than«__11 ,t -*1 CM eroprepaikai___________|cl«-l,3-Dlchloroprep«fl*——|Trlchloro«th*n*____ —|DibroBochlores*tEani|l,1.2-Trlchloro*than*~| Mnun* ____~| trarn-1.1-Dichloropropan*...|>roBofor» ______14-K*tItyl-a-r*ntanen*|2-Maxanon« ~|T*traehloro«tBan*(1,1,2,a-TatrachloroatftanaI Tol uana___________________|Chlorobantan«_________jStyranallylana Itotal).(Tolu*n*-dl(•roBefluerobanianaI1,2-D1chloro«th«n*-d4_
I I I IMVIOO i Mtriso i mn oo |
Fbwt vi VGA

VOXATXtK rZMDXNC CAIIBUTJCH
Lab
XMtraant IB:&ab Fil« XBt _•atrixi
Calibration tat*tZait. Calib. Bat«(«)i_
«nt*r __ X«v«l:(lov/Md)___Column:! ___•in SOT50 tor SPCC(f) - 0.900 (0.2*0 for »romoform) Max tB for CCC(«J > 25.0%
rOOKPOWD
j Chleroa«th«n«__| Bro»c>»«thM«_{Vinyl ChleriSiT|dilero«tban« ~|M«thyl*n« Chlerid«_|Ac*ton*_(Carbon Biaulfidaj1,l-Bichloro«than«
I, l-Bichloro«than«~|1.2-Biehloro«tb«na (total)(Chlorofo: ~1,Z-Dlchloro«than«_2-Butanon« ~1,1,1-Trie!) Joro« than*
(Carbon T«traehlorl«« ~(Vinyl Acatat*_IBro»od i ehlero»*tbanajl,2-Dichloropropan«J____|clB-l,9-Olchloroprop«n*__(Triehl -- ———{DibroBoclil«ro**tSi>M|1,1,2-Trlehloro«tban«IB«ns«n«|tran»-l,l-0lehler»propan«__|Bro>ofozB|4-M«thyl-2-P*ntanon«|T«traehloro«th*na11,1,2,2-Tctraeblorocthan*_ITeluan*|Chlorob«nt«n«Ctyran*Xyl*n* (total).
_______Bre»ofluoro>»ni»n«
,2-Dichloro«Ukan*:tfT.
fXF imtrso %D
rora vzx

VOXATXU XMTBUIAL
lab Maae:
tab File ZD (Standard)<Ina truant ZDs ._____Matrix: Water __ levels(low/Bed)
Data Analy«ed:*i»e Analr«ed>_ Colon: (pack/cap)
•t-
ZCI(PCM) |AREA l|
12 10UK CTDIAXEA rr
UPPER LIMIT
LOWER LIMIT
rieldSAMPLEMO.
111
Oil021Oil04|05|06 107 |Ot|0*1
Ml1911*11711*1
21122)
ZS1 (BCM) • BroMochlereMathanaZC2 (DFB) « l,4-Difluorob«ntanaZS3 (CM) • OUorobensane-dS
1*1(C»Z) IAMA || HT
om* LIMIT • 4 100%of internal standard ara».LOWEK LIMIT • - BOt•f internal standard era*.
I Celuan o*«d to flag internal standard area valoe* with an aaterickP«9« _ Of _
row TIII vox

, _
COVER FACE - XMORCAXIC ANALYSES DATA PACKAGE
lab Maata: ____________________
Field *aaple Mo. Lab Saapl* ZD.
Were ICP interele»ent correction* applied? Yes/No
Were ICP background correction! applied? Yas/NoIf yes-wara raw data generated beforeapplication of background correction*? yes/No
Coanents:
Keleaae of the data contained in this hardeopy data package and in theeoBputer-readable data e-ubnitted on floppy diakette has bean authorized bythe Laboratory Manager or the Manager's deaignee, as verified by thefollowing signature.
tab Manager: .____________._____Bate:
COVER PACE - ZH