epg products update · epg applications portfolio ... > system model validation –automation,...
TRANSCRIPT
|
EPG Products Update
May 31, 2019JSIS Meeting
Neeraj Nayak
|
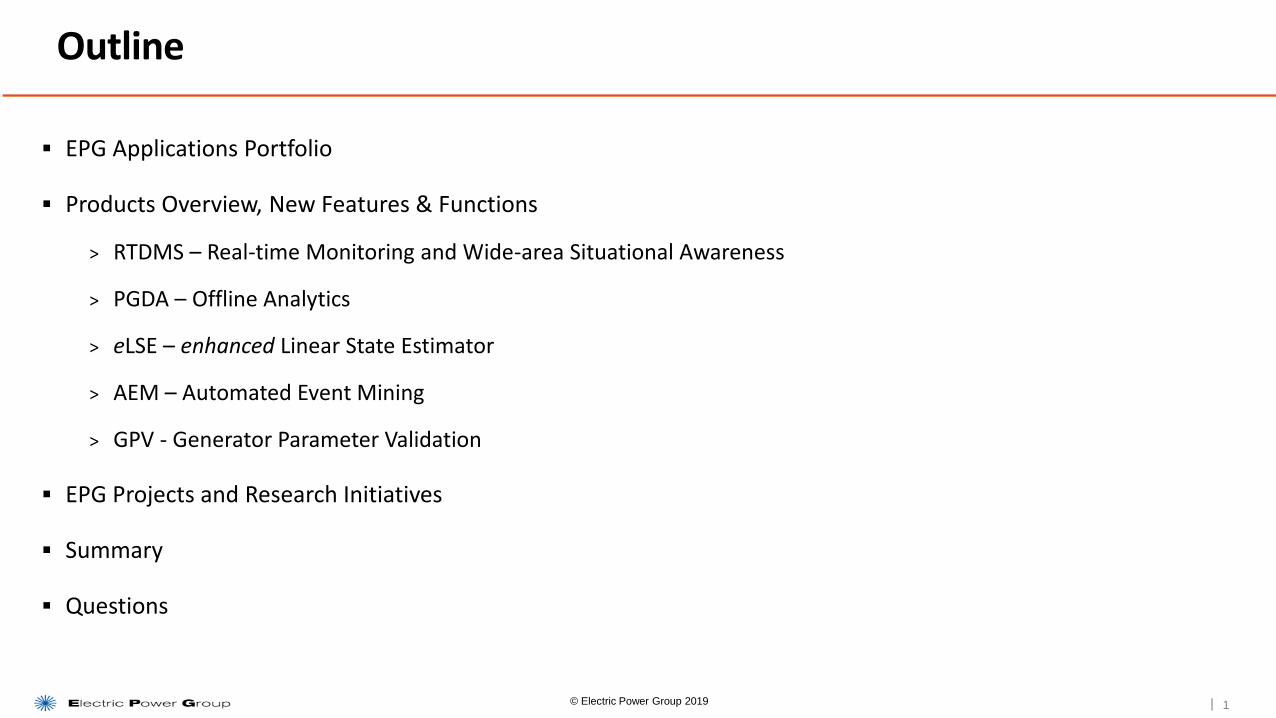
▪ EPG Applications Portfolio
▪ Products Overview, New Features & Functions
> RTDMS – Real-time Monitoring and Wide-area Situational Awareness
> PGDA – Offline Analytics
> eLSE – enhanced Linear State Estimator
> AEM – Automated Event Mining
> GPV - Generator Parameter Validation
▪ EPG Projects and Research Initiatives
▪ Summary
▪ Questions
Outline
1© Electric Power Group 2019
|
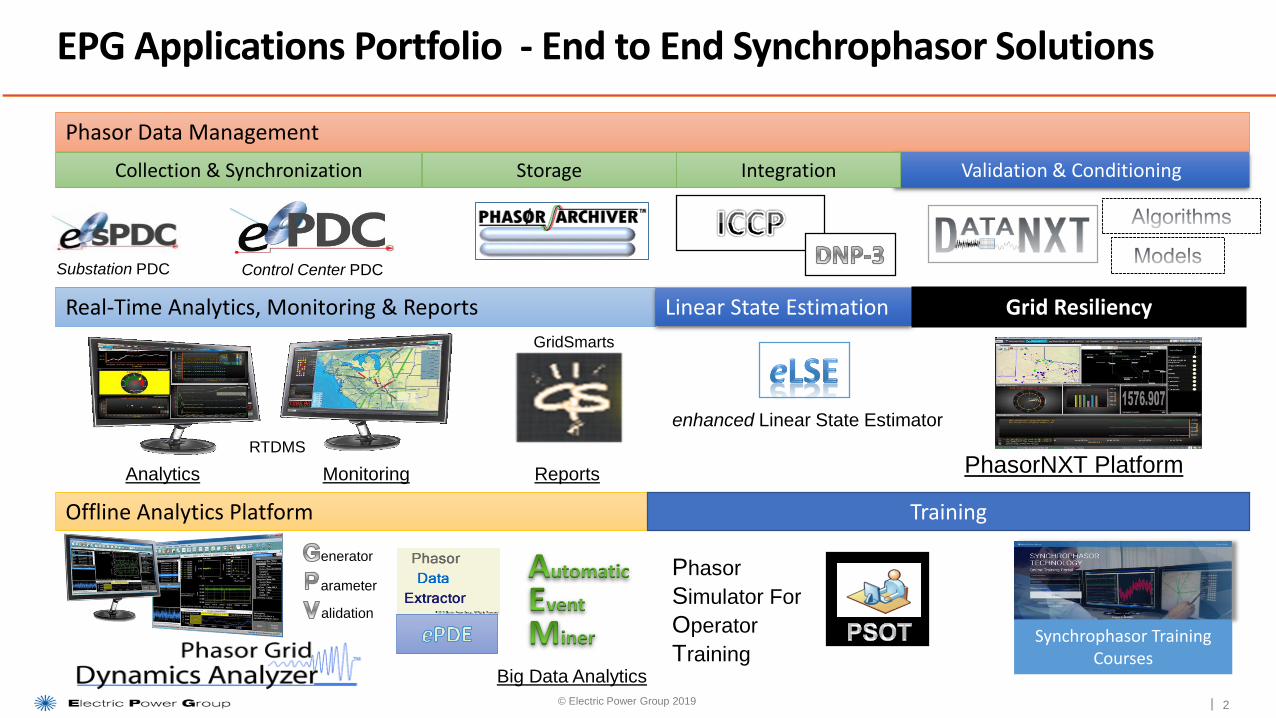
Real-Time Analytics, Monitoring & Reports
EPG Applications Portfolio - End to End Synchrophasor Solutions
2
Phasor Data Management
Offline Analytics Platform
Collection & Synchronization Validation & ConditioningStorage Integration
Analytics PhasorNXT Platform
Training
Synchrophasor Training Courses
Substation PDC Control Center PDC
Phasor
Simulator For
Operator
Training
Linear State Estimation
enhanced Linear State Estimator
Grid Resiliency
Reports
Big Data Analytics
Monitoring
GridSmarts
RTDMS
enerator
arameter
alidation
© Electric Power Group 2019
|
RTDMS
Real-Time Monitoring and Wide-area Situational Awareness
3© Electric Power Group 2019
|
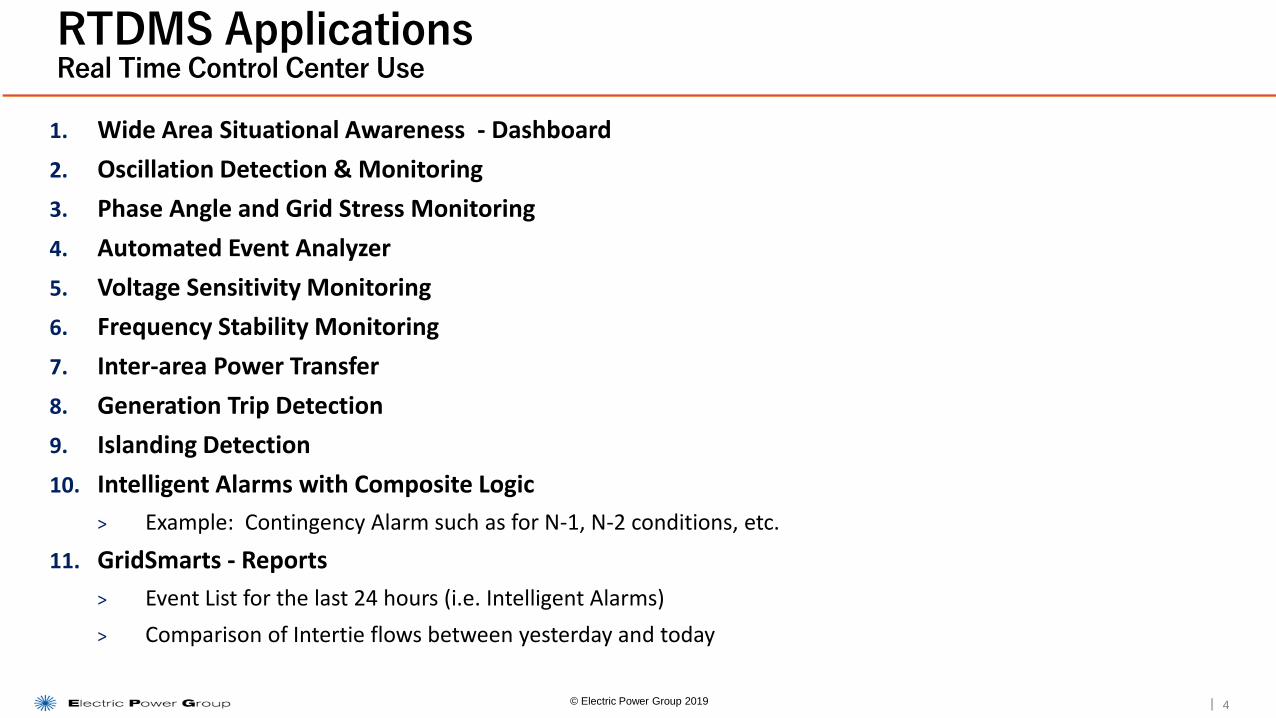
1. Wide Area Situational Awareness - Dashboard
2. Oscillation Detection & Monitoring
3. Phase Angle and Grid Stress Monitoring
4. Automated Event Analyzer
5. Voltage Sensitivity Monitoring
6. Frequency Stability Monitoring
7. Inter-area Power Transfer
8. Generation Trip Detection
9. Islanding Detection
10. Intelligent Alarms with Composite Logic
> Example: Contingency Alarm such as for N-1, N-2 conditions, etc.
11. GridSmarts - Reports
> Event List for the last 24 hours (i.e. Intelligent Alarms)
> Comparison of Intertie flows between yesterday and today
RTDMS ApplicationsReal Time Control Center Use
4© Electric Power Group 2019
|
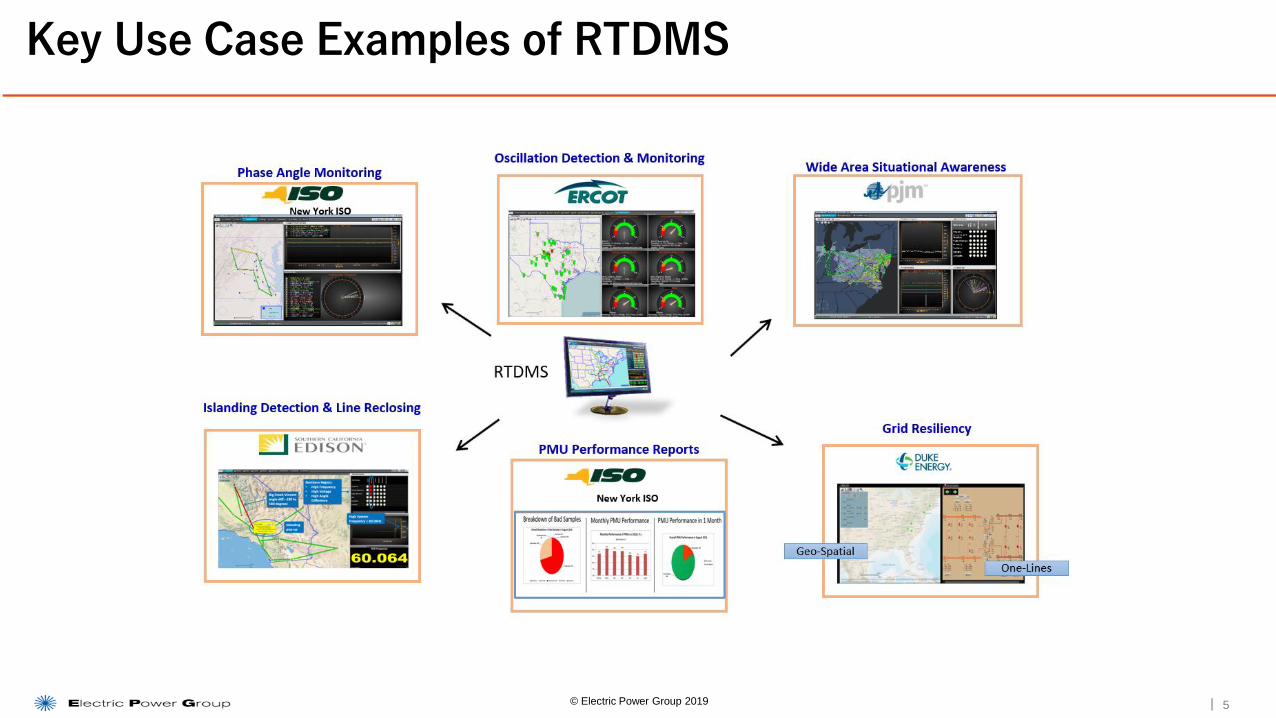
Key Use Case Examples of RTDMS
5© Electric Power Group 2019
|
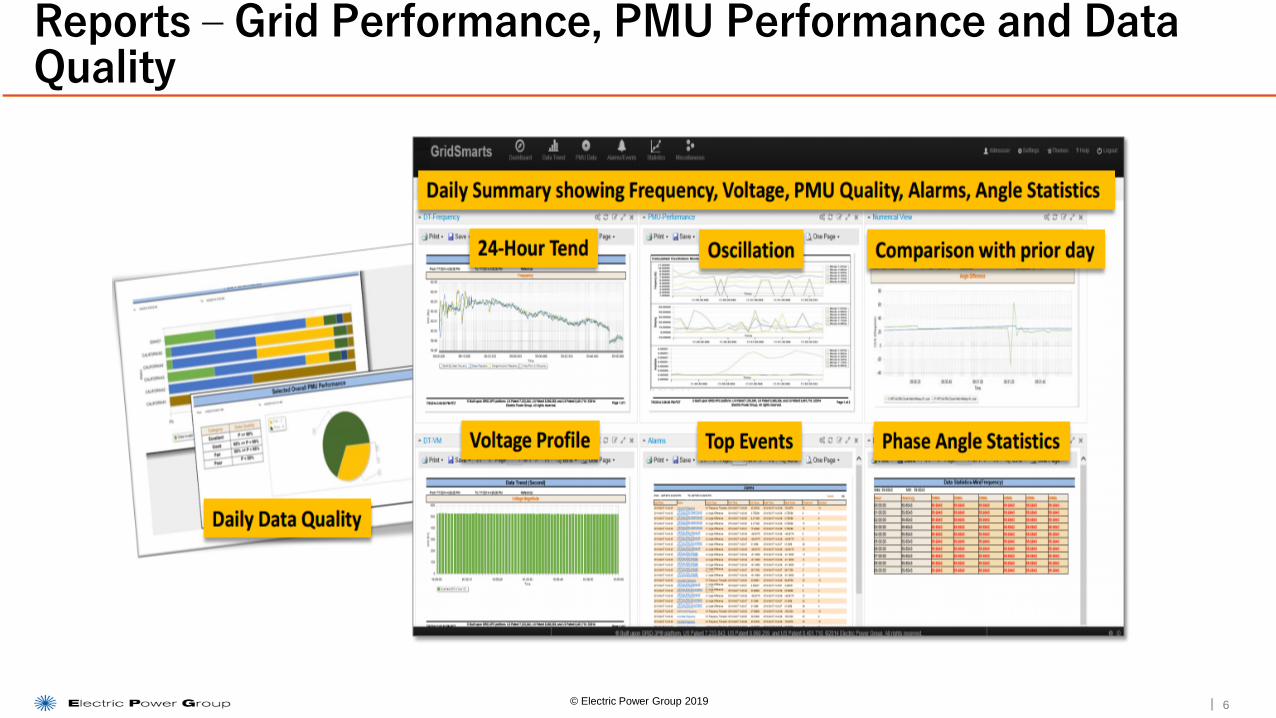
Reports – Grid Performance, PMU Performance and Data Quality
6© Electric Power Group 2019
|
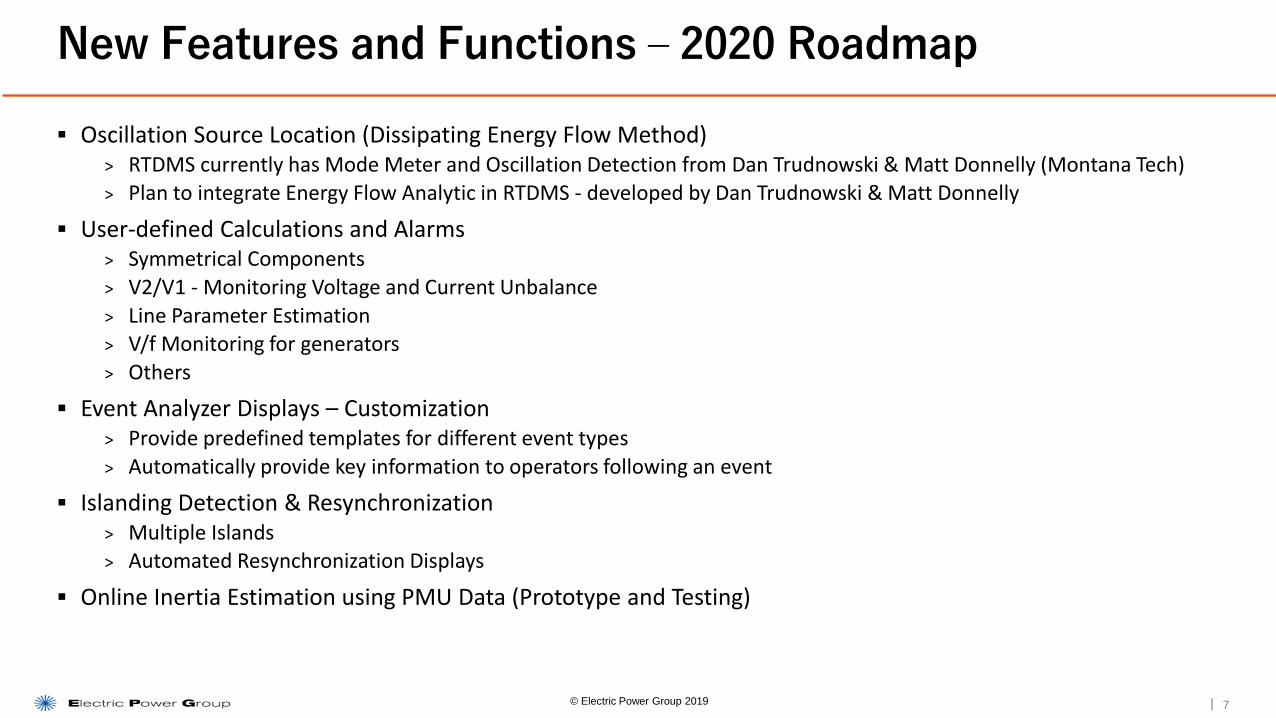
▪ Oscillation Source Location (Dissipating Energy Flow Method) > RTDMS currently has Mode Meter and Oscillation Detection from Dan Trudnowski & Matt Donnelly (Montana Tech) > Plan to integrate Energy Flow Analytic in RTDMS - developed by Dan Trudnowski & Matt Donnelly
▪ User-defined Calculations and Alarms> Symmetrical Components
> V2/V1 - Monitoring Voltage and Current Unbalance
> Line Parameter Estimation> V/f Monitoring for generators
> Others
▪ Event Analyzer Displays – Customization> Provide predefined templates for different event types
> Automatically provide key information to operators following an event
▪ Islanding Detection & Resynchronization> Multiple Islands> Automated Resynchronization Displays
▪ Online Inertia Estimation using PMU Data (Prototype and Testing)
New Features and Functions – 2020 Roadmap
© Electric Power Group 2019 7
|
PGDA
Offline Analytics
8© Electric Power Group 2019
|
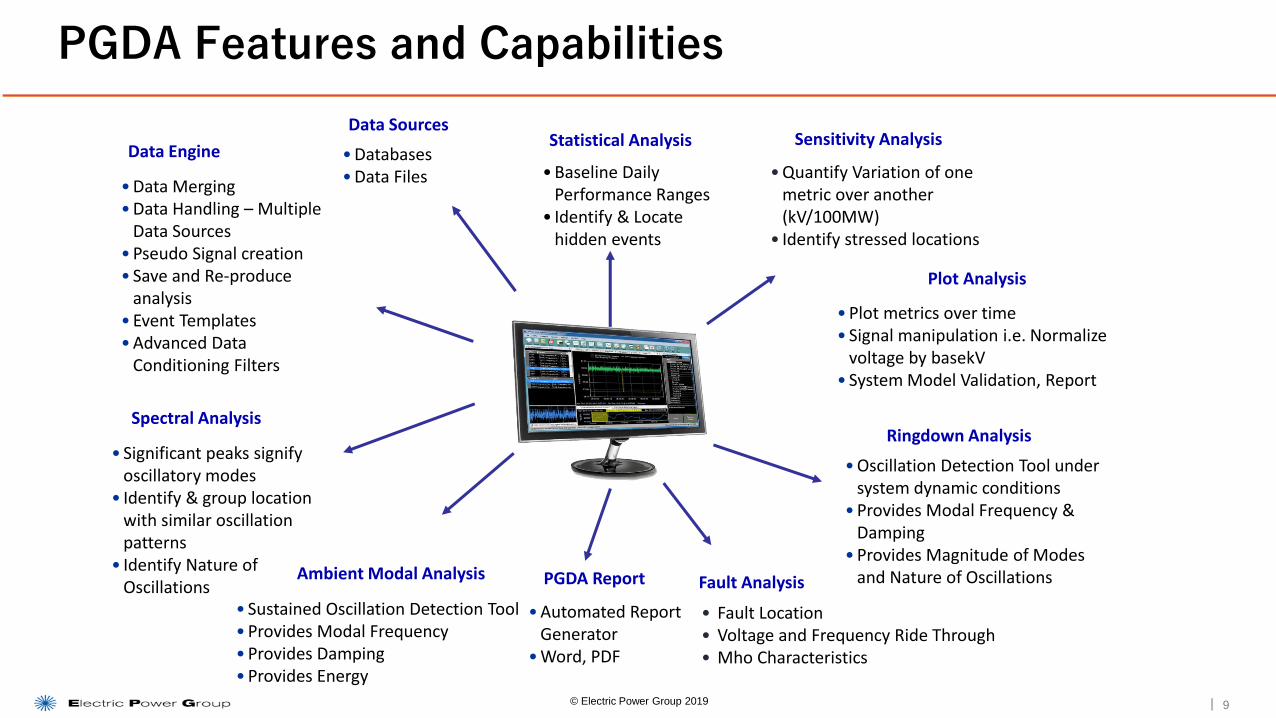
• Baseline Daily Performance Ranges
• Identify & Locate hidden events
• Plot metrics over time • Signal manipulation i.e. Normalize
voltage by basekV• System Model Validation, Report
• Databases• Data Files
• Automated Report Generator
• Word, PDF
Sensitivity Analysis
• Significant peaks signify oscillatory modes
• Identify & group location with similar oscillation patterns
• Identify Nature of Oscillations
• Oscillation Detection Tool under system dynamic conditions
• Provides Modal Frequency & Damping
• Provides Magnitude of Modes and Nature of Oscillations
Data Sources
PGDA Report
Plot Analysis
Spectral AnalysisRingdown Analysis
Ambient Modal Analysis
• Sustained Oscillation Detection Tool • Provides Modal Frequency• Provides Damping• Provides Energy
• Quantify Variation of one metric over another (kV/100MW)
• Identify stressed locations
Statistical Analysis
PGDA Features and Capabilities
Data Engine
• Data Merging • Data Handling – Multiple
Data Sources • Pseudo Signal creation• Save and Re-produce
analysis• Event Templates • Advanced Data
Conditioning Filters
9
Fault Analysis
• Fault Location• Voltage and Frequency Ride Through• Mho Characteristics
© Electric Power Group 2019
|
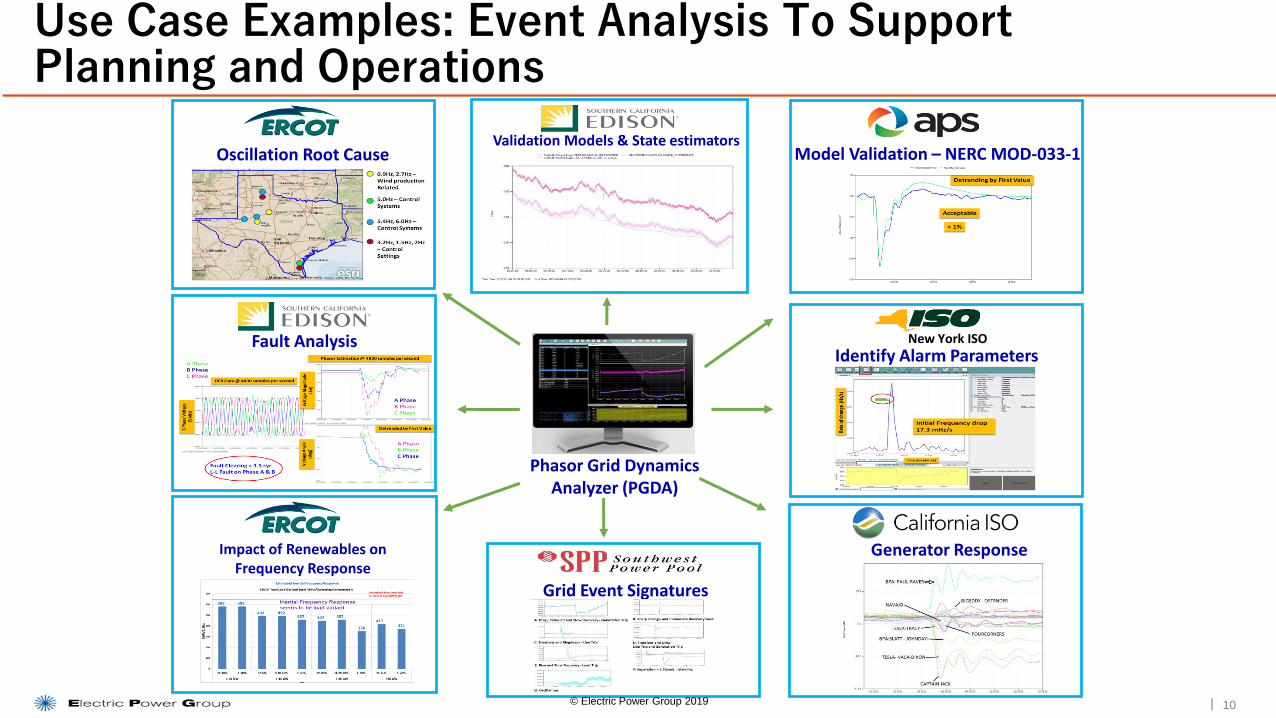
Use Case Examples: Event Analysis To Support Planning and Operations
Oscillation Root Cause Model Validation – NERC MOD-033-1
Fault Analysis New York ISO
Identify Alarm Parameters
Impact of Renewables on Frequency Response
Validation Models & State estimators
Generator Response
Grid Event Signatures
Phasor Grid Dynamics Analyzer (PGDA)
10© Electric Power Group 2019
|
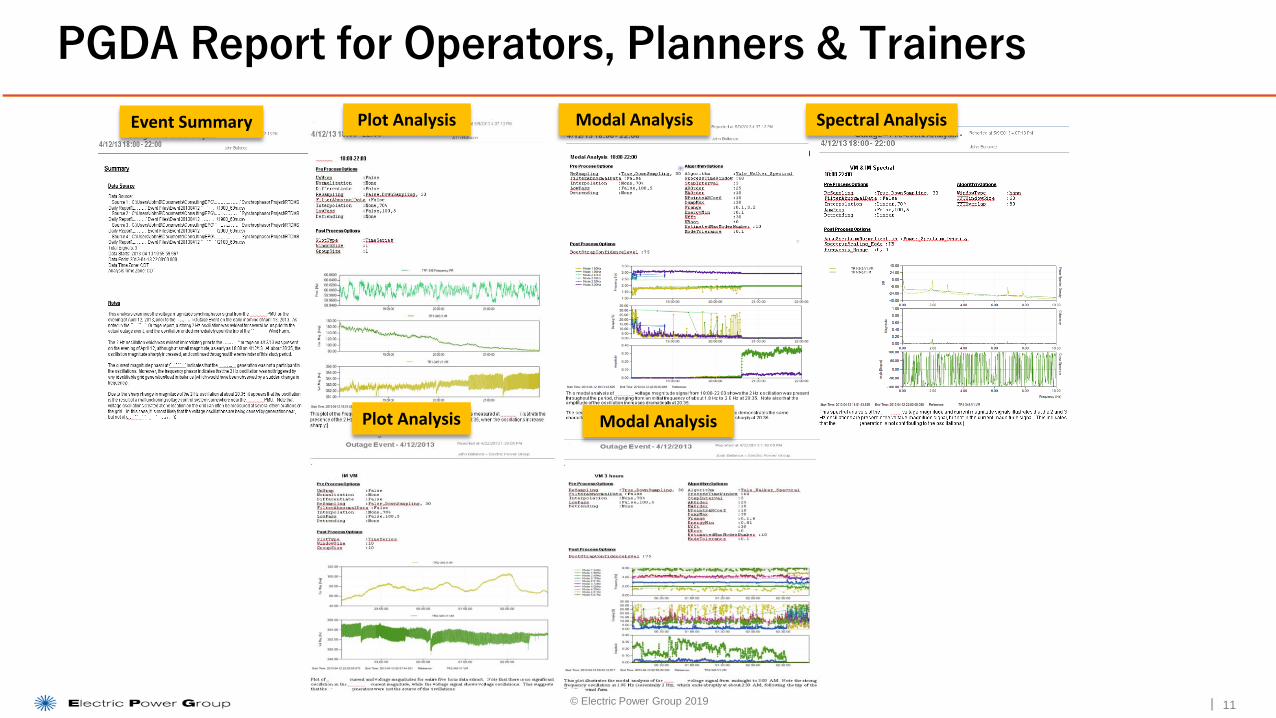
PGDA Report for Operators, Planners & Trainers
© Electric Power Group 2019 11
Plot Analysis
Event Summary Plot Analysis Modal Analysis Spectral Analysis
Modal Analysis
|
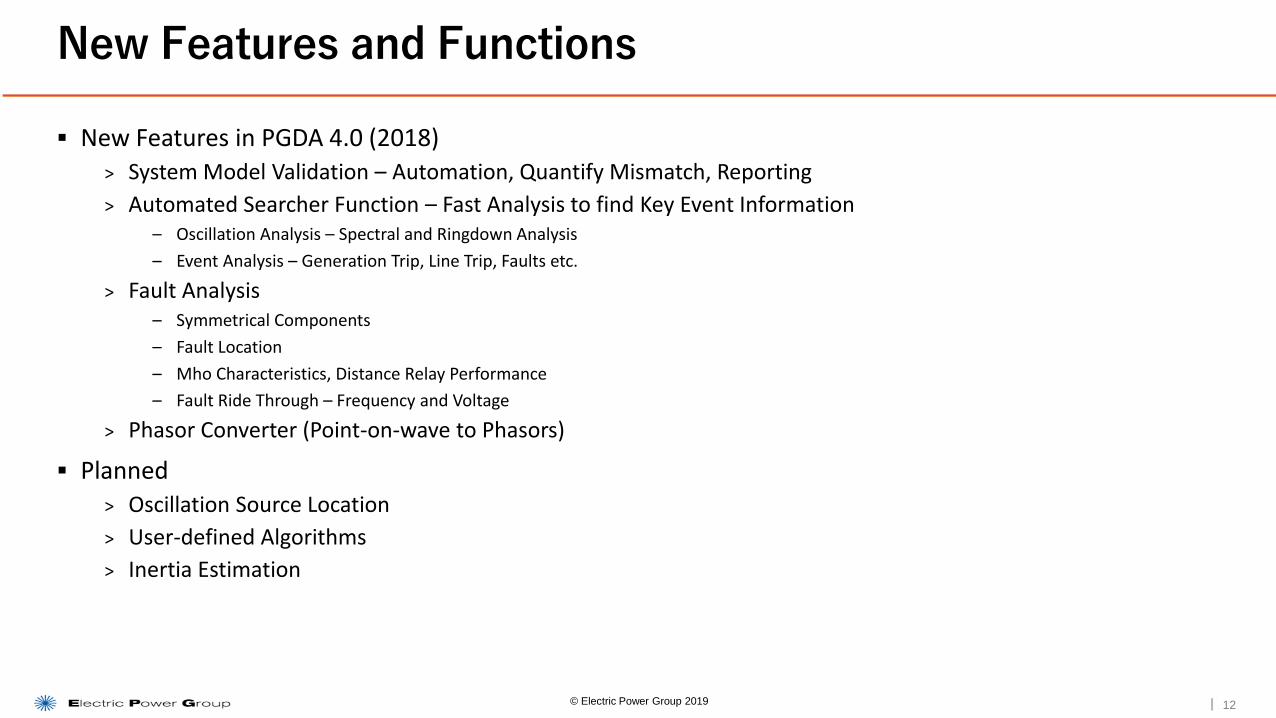
▪ New Features in PGDA 4.0 (2018)> System Model Validation – Automation, Quantify Mismatch, Reporting
> Automated Searcher Function – Fast Analysis to find Key Event Information– Oscillation Analysis – Spectral and Ringdown Analysis
– Event Analysis – Generation Trip, Line Trip, Faults etc.
> Fault Analysis– Symmetrical Components
– Fault Location
– Mho Characteristics, Distance Relay Performance
– Fault Ride Through – Frequency and Voltage
> Phasor Converter (Point-on-wave to Phasors)
▪ Planned> Oscillation Source Location
> User-defined Algorithms
> Inertia Estimation
New Features and Functions
© Electric Power Group 2019 12
|
eLSE – enhanced Linear State Estimator
Extended Grid Visibility and Grid Resiliency
13© Electric Power Group 2019. All rights reserved
|
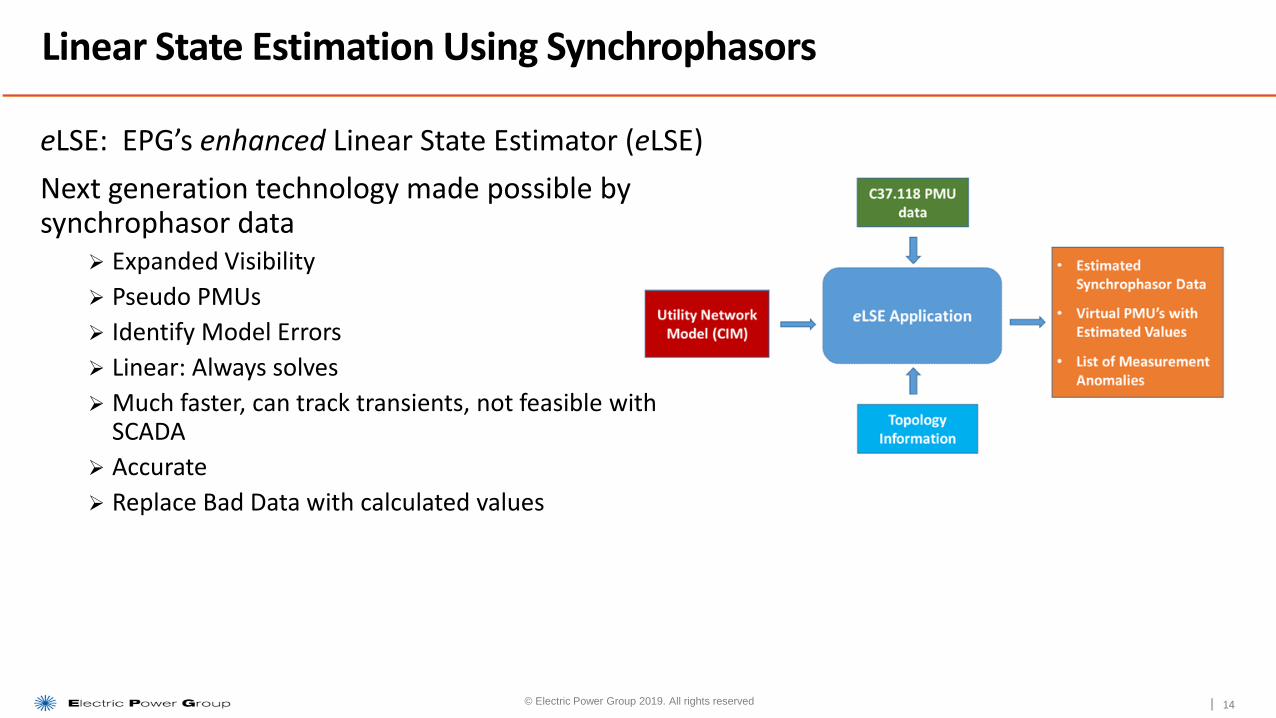
eLSE: EPG’s enhanced Linear State Estimator (eLSE)
Next generation technology made possible by synchrophasor data
➢ Expanded Visibility
➢ Pseudo PMUs
➢ Identify Model Errors
➢ Linear: Always solves
➢ Much faster, can track transients, not feasible with SCADA
➢ Accurate
➢ Replace Bad Data with calculated values
Linear State Estimation Using Synchrophasors
14© Electric Power Group 2019. All rights reserved
|
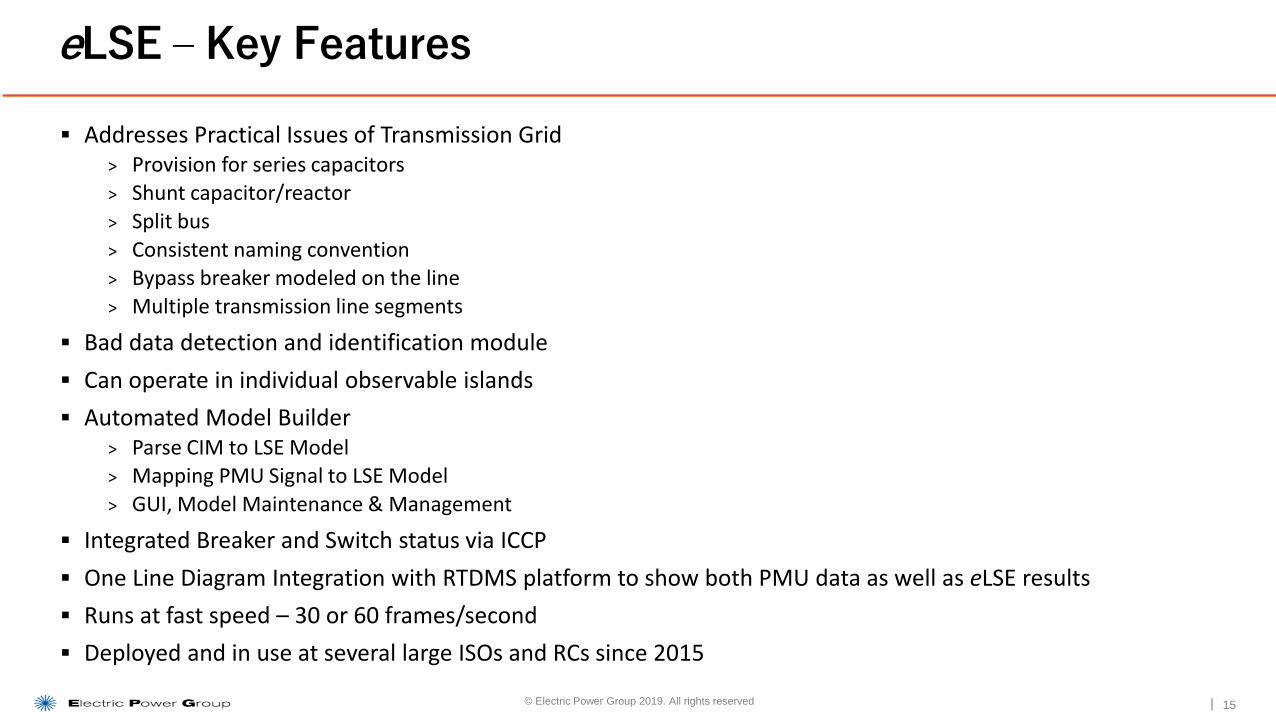
▪ Addresses Practical Issues of Transmission Grid> Provision for series capacitors> Shunt capacitor/reactor
> Split bus
> Consistent naming convention> Bypass breaker modeled on the line
> Multiple transmission line segments
▪ Bad data detection and identification module
▪ Can operate in individual observable islands
▪ Automated Model Builder> Parse CIM to LSE Model> Mapping PMU Signal to LSE Model
> GUI, Model Maintenance & Management
▪ Integrated Breaker and Switch status via ICCP
▪ One Line Diagram Integration with RTDMS platform to show both PMU data as well as eLSE results
▪ Runs at fast speed – 30 or 60 frames/second
▪ Deployed and in use at several large ISOs and RCs since 2015
eLSE – Key Features
15© Electric Power Group 2019. All rights reserved
|
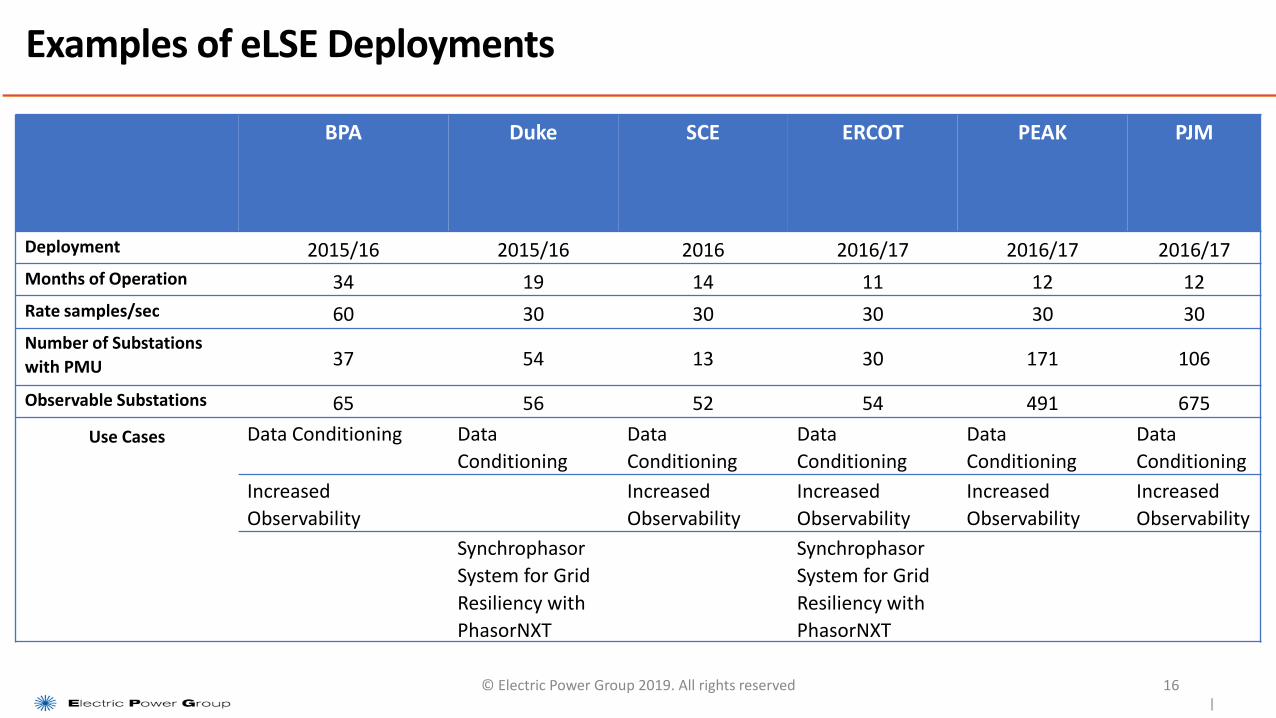
Examples of eLSE Deployments
© Electric Power Group 2019. All rights reserved 16
BPA Duke SCE ERCOT PEAK PJM
Deployment 2015/16 2015/16 2016 2016/17 2016/17 2016/17
Months of Operation 34 19 14 11 12 12
Rate samples/sec 60 30 30 30 30 30
Number of Substations
with PMU 37 54 13 30 171 106
Observable Substations 65 56 52 54 491 675
Use Cases Data Conditioning Data
Conditioning
Data
Conditioning
Data
Conditioning
Data
Conditioning
Data
Conditioning
Increased
Observability
Increased
Observability
Increased
Observability
Increased
Observability
Increased
Observability
Synchrophasor
System for Grid
Resiliency with
PhasorNXT
Synchrophasor
System for Grid
Resiliency with
PhasorNXT
|
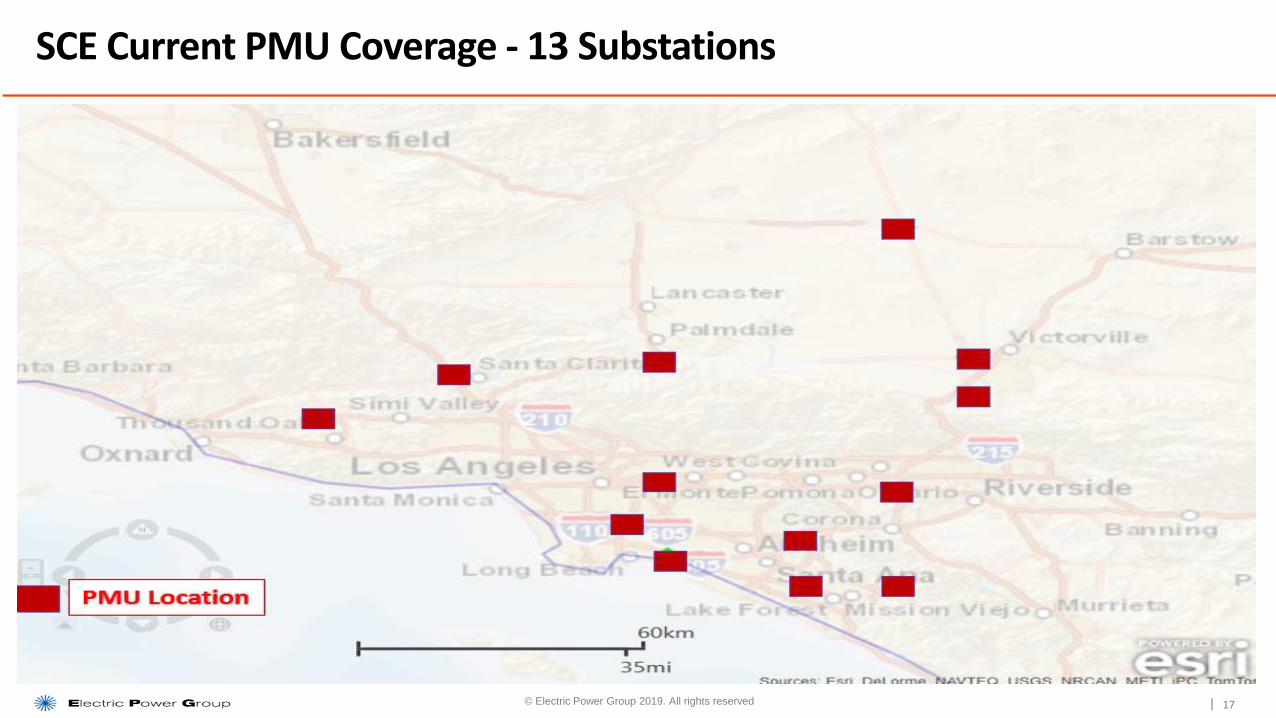
SCE Current PMU Coverage - 13 Substations
17© Electric Power Group 2019. All rights reserved
|
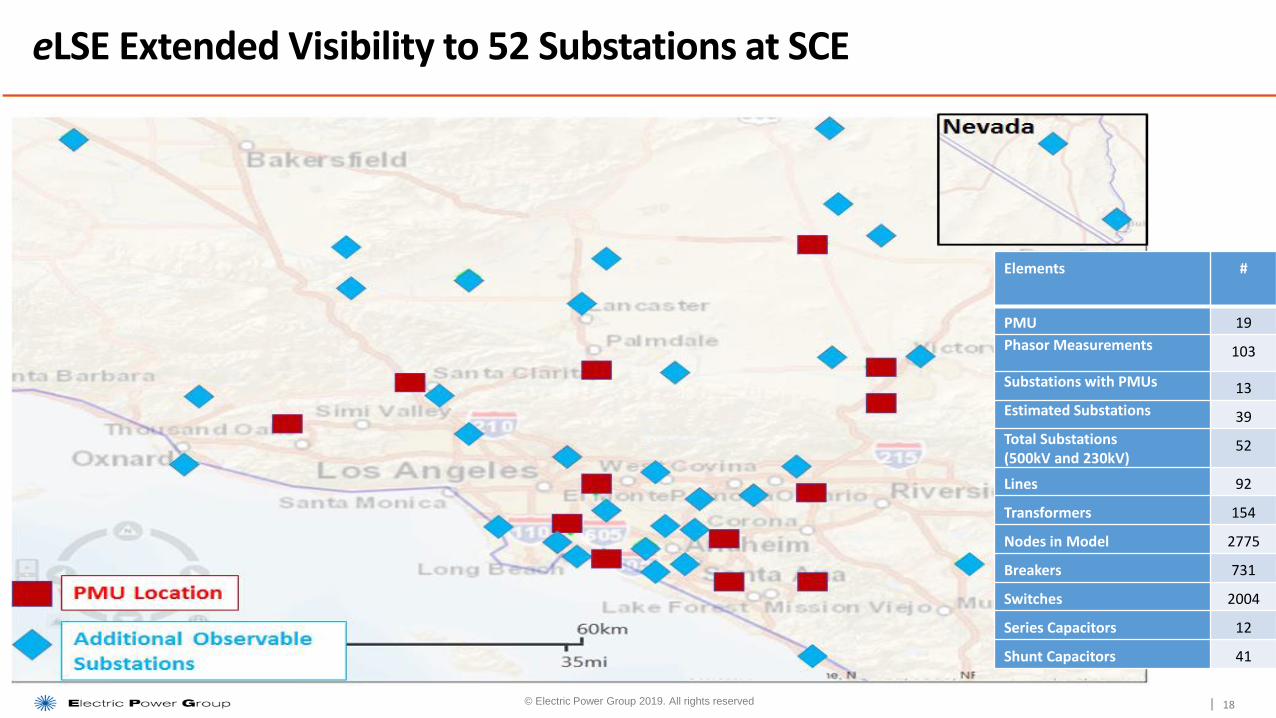
eLSE Extended Visibility to 52 Substations at SCE
18
Elements #
PMU 19
Phasor Measurements 103
Substations with PMUs 13
Estimated Substations 39
Total Substations(500kV and 230kV)
52
Lines 92
Transformers 154
Nodes in Model 2775
Breakers 731
Switches 2004
Series Capacitors 12
Shunt Capacitors 41
© Electric Power Group 2019. All rights reserved
|
▪ Use eLSE as Platform for Synchrophasor Applications including
> RTCA
> Cascading Analysis
> Voltage Stability Assessment
> Area Angle Monitoring
> Other DSA applications
e LSE – Platform for Synchrophasor Applications
© Electric Power Group 2019 19

|
AEM
Automated Event Mining
20© Electric Power Group 2019
|
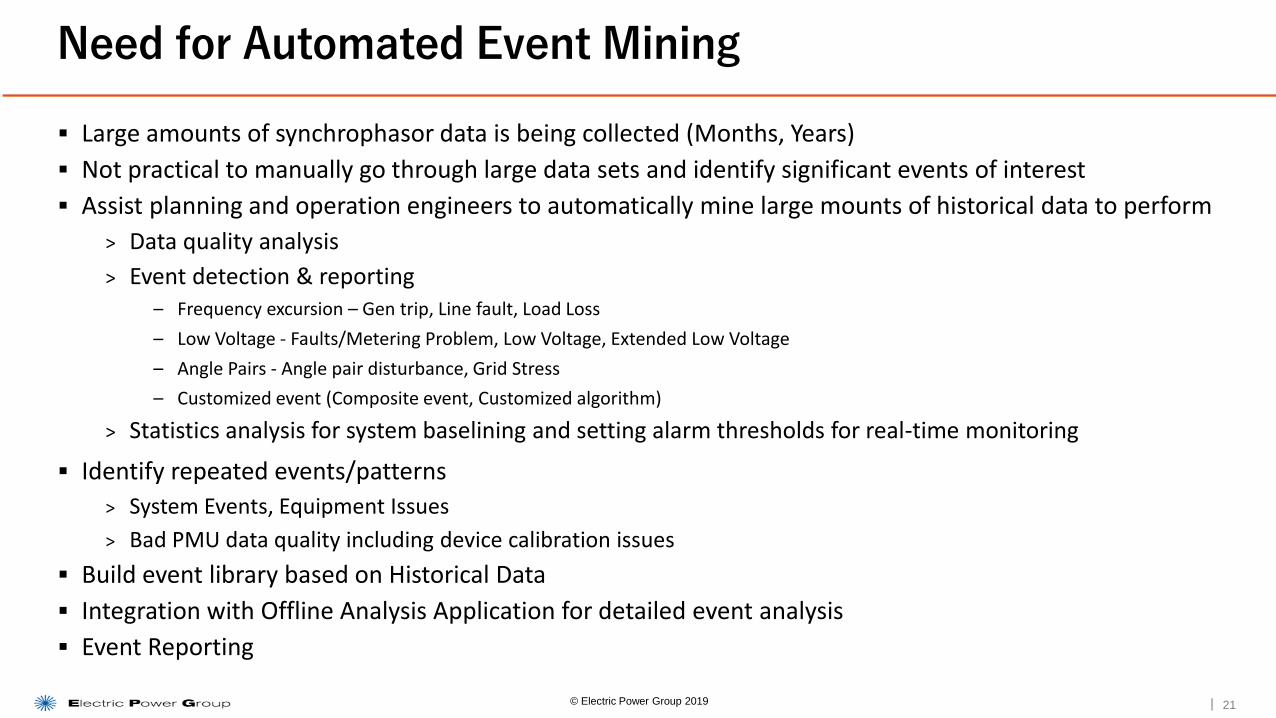
▪ Large amounts of synchrophasor data is being collected (Months, Years)
▪ Not practical to manually go through large data sets and identify significant events of interest
▪ Assist planning and operation engineers to automatically mine large mounts of historical data to perform
> Data quality analysis
> Event detection & reporting– Frequency excursion – Gen trip, Line fault, Load Loss
– Low Voltage - Faults/Metering Problem, Low Voltage, Extended Low Voltage
– Angle Pairs - Angle pair disturbance, Grid Stress
– Customized event (Composite event, Customized algorithm)
> Statistics analysis for system baselining and setting alarm thresholds for real-time monitoring
▪ Identify repeated events/patterns
> System Events, Equipment Issues
> Bad PMU data quality including device calibration issues
▪ Build event library based on Historical Data
▪ Integration with Offline Analysis Application for detailed event analysis
▪ Event Reporting
Need for Automated Event Mining
© Electric Power Group 2019 21
|
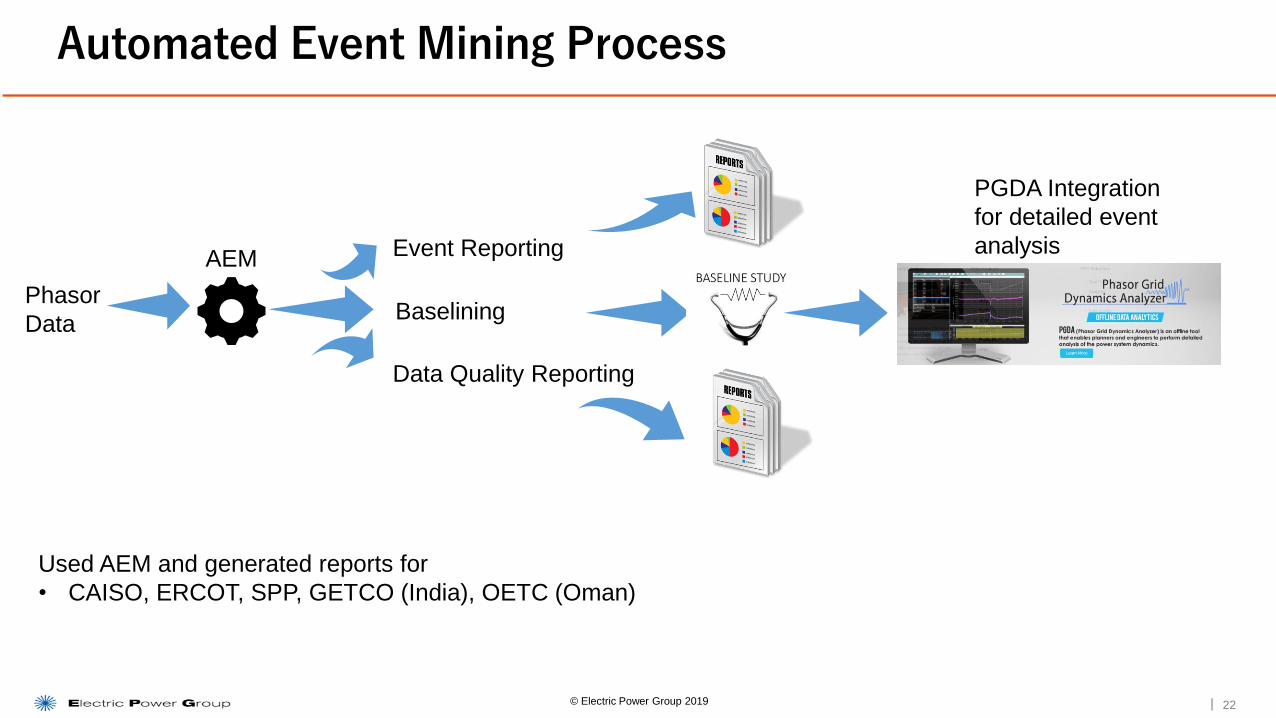
Automated Event Mining Process
22© Electric Power Group 2019
AEM
Phasor
Data
Event Reporting
Data Quality Reporting
Baselining
PGDA Integration
for detailed event
analysis
Used AEM and generated reports for
• CAISO, ERCOT, SPP, GETCO (India), OETC (Oman)
|
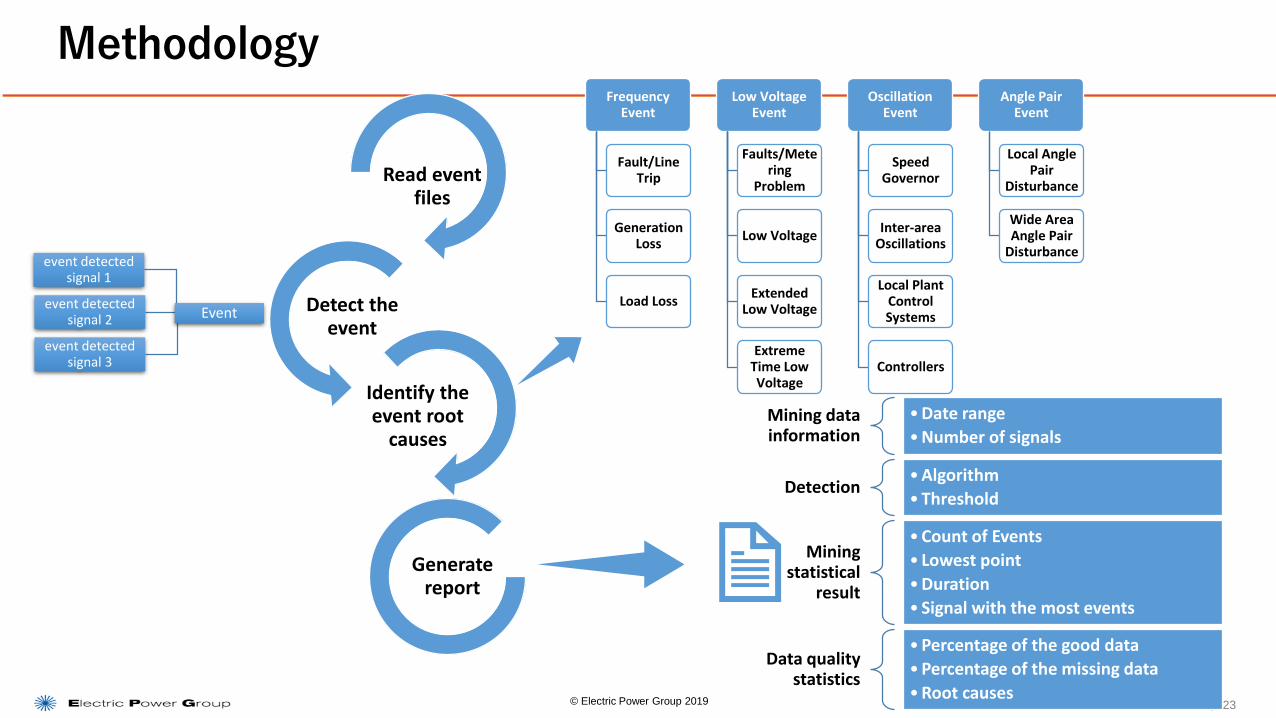
Methodology
23© Electric Power Group 2019
Event
event detected signal 1
event detected signal 2
event detected signal 3
Frequency Event
Fault/Line Trip
Generation Loss
Load Loss
Low Voltage Event
Faults/Metering
Problem
Low Voltage
Extended Low Voltage
Extreme Time Low Voltage
Oscillation Event
Speed Governor
Inter-area Oscillations
Local Plant Control Systems
Controllers
Angle Pair Event
Local Angle Pair
Disturbance
Wide Area Angle Pair
Disturbance
Read event files
Detect the event
Identify the event root
causes
Generate report
Mining data information
• Date range
• Number of signals
Detection• Algorithm
• Threshold
Mining statistical
result
• Count of Events
• Lowest point
• Duration
• Signal with the most events
Data quality statistics
• Percentage of the good data
• Percentage of the missing data
• Root causes
|
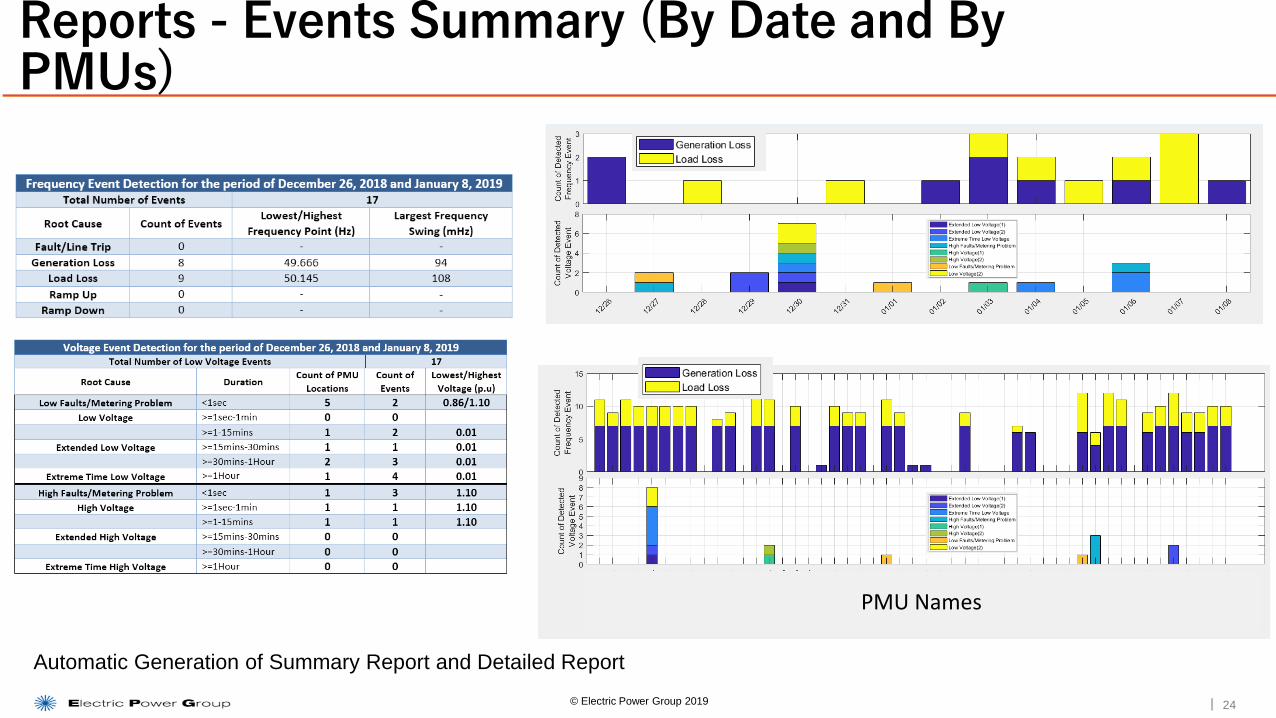
Reports - Events Summary (By Date and By PMUs)
© Electric Power Group 2019 24
PMU Names
Automatic Generation of Summary Report and Detailed Report
|
GPV
Generator Parameter Validation
25© Electric Power Group 2019
|
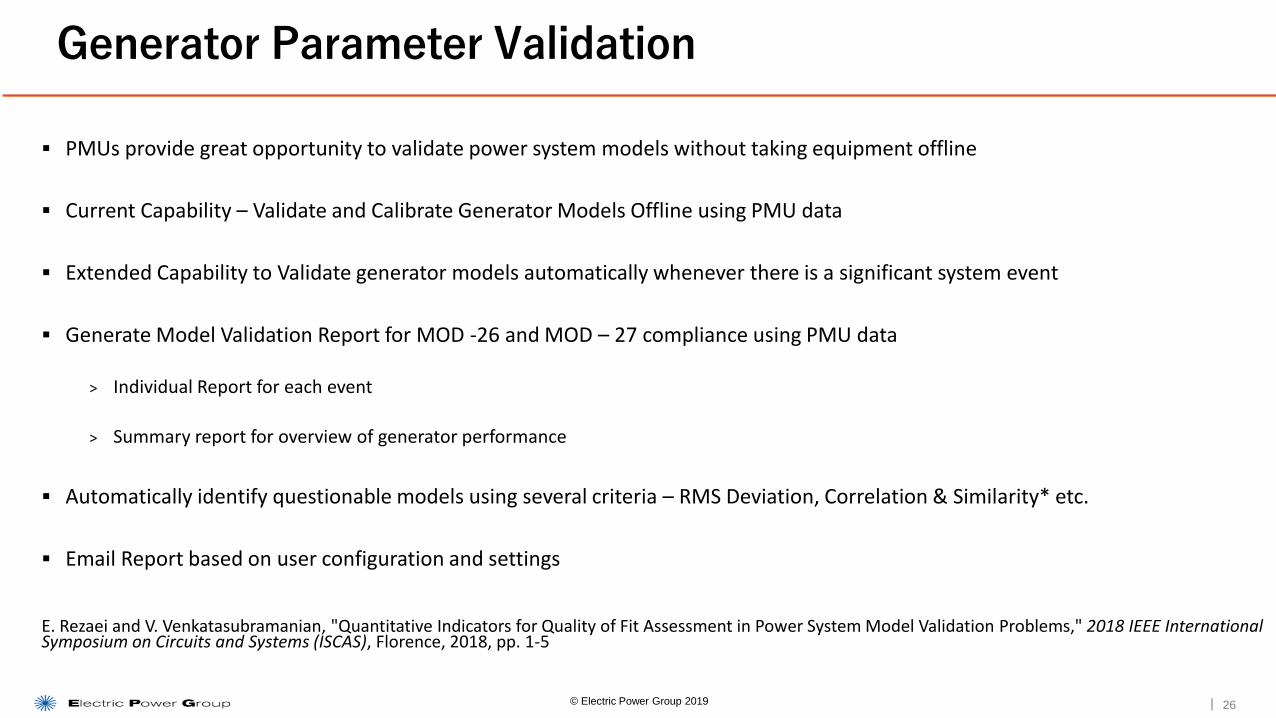
▪ PMUs provide great opportunity to validate power system models without taking equipment offline
▪ Current Capability – Validate and Calibrate Generator Models Offline using PMU data
▪ Extended Capability to Validate generator models automatically whenever there is a significant system event
▪ Generate Model Validation Report for MOD -26 and MOD – 27 compliance using PMU data
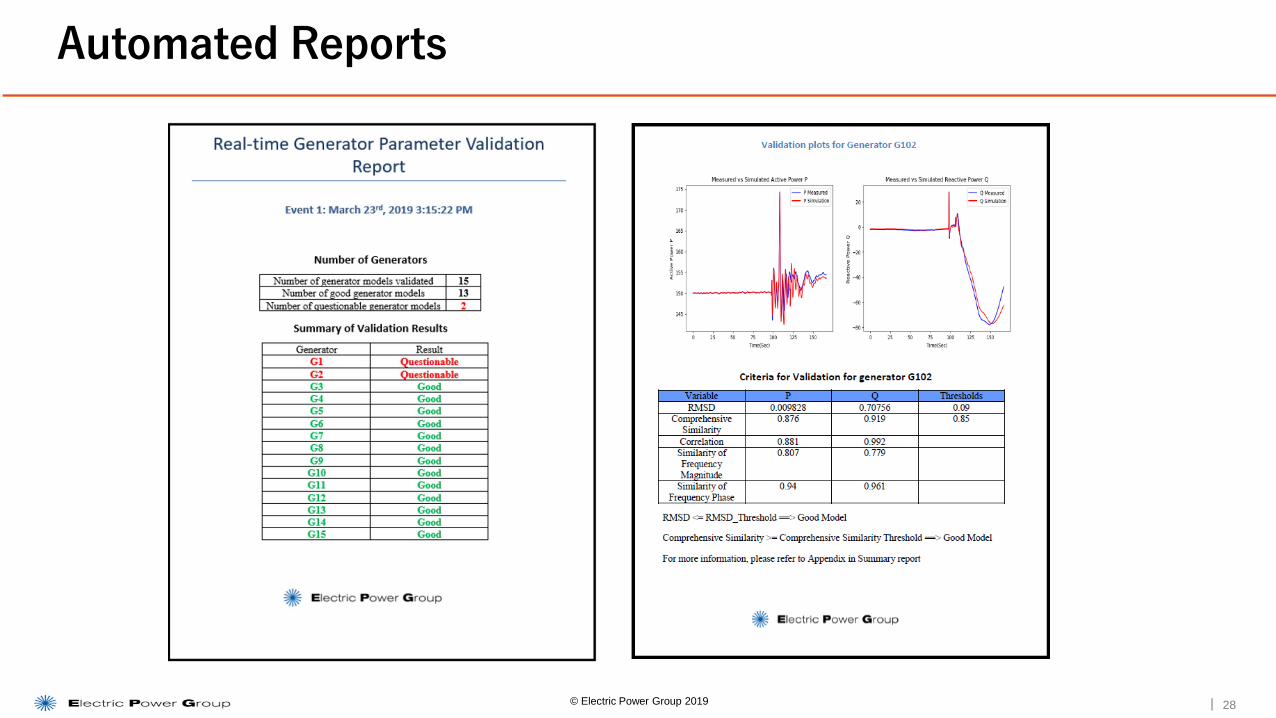
> Individual Report for each event
> Summary report for overview of generator performance
▪ Automatically identify questionable models using several criteria – RMS Deviation, Correlation & Similarity* etc.
▪ Email Report based on user configuration and settings
E. Rezaei and V. Venkatasubramanian, "Quantitative Indicators for Quality of Fit Assessment in Power System Model Validation Problems," 2018 IEEE International Symposium on Circuits and Systems (ISCAS), Florence, 2018, pp. 1-5
Generator Parameter Validation
© Electric Power Group 2019 26
|
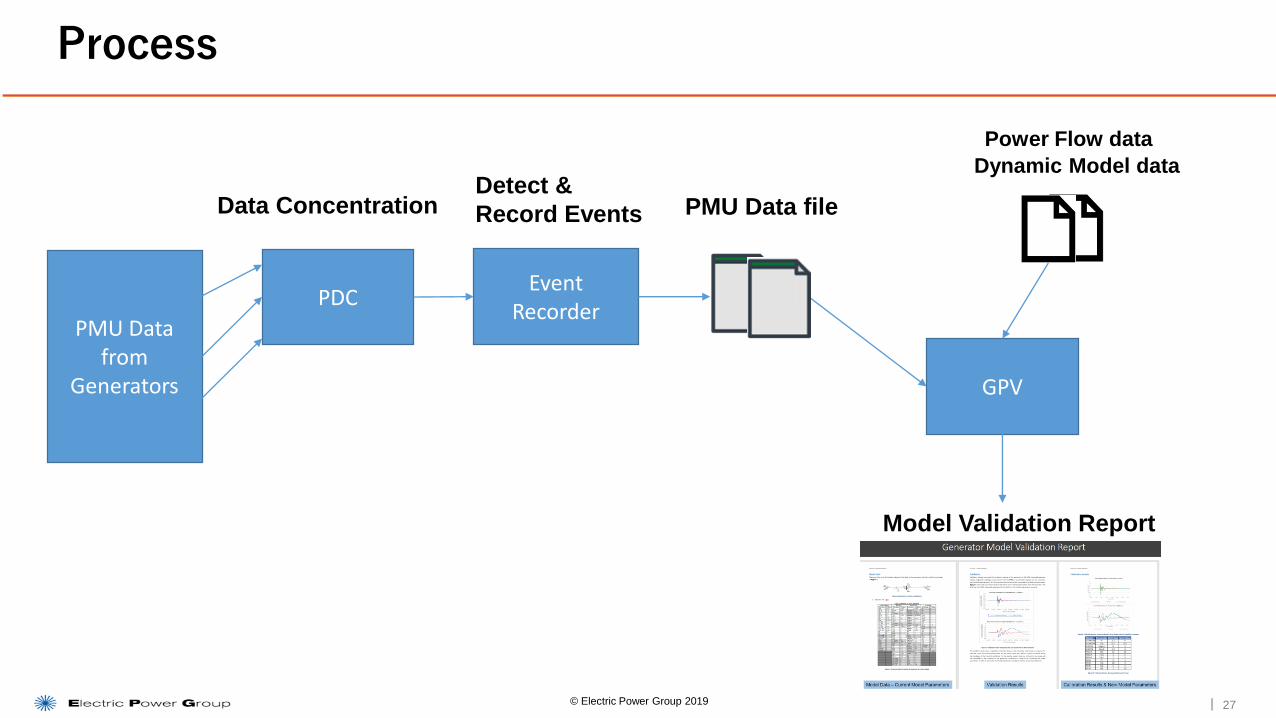
Process
© Electric Power Group 2019 27
Event Recorder
PMU Data from
Generators
PDC
GPV
Detect &
Record EventsData Concentration PMU Data file
Power Flow data
Dynamic Model data
Model Validation Report
|
Automated Reports
© Electric Power Group 2019 28

|
EPG Projects & Research Initiatives
29© Electric Power Group 2019
|
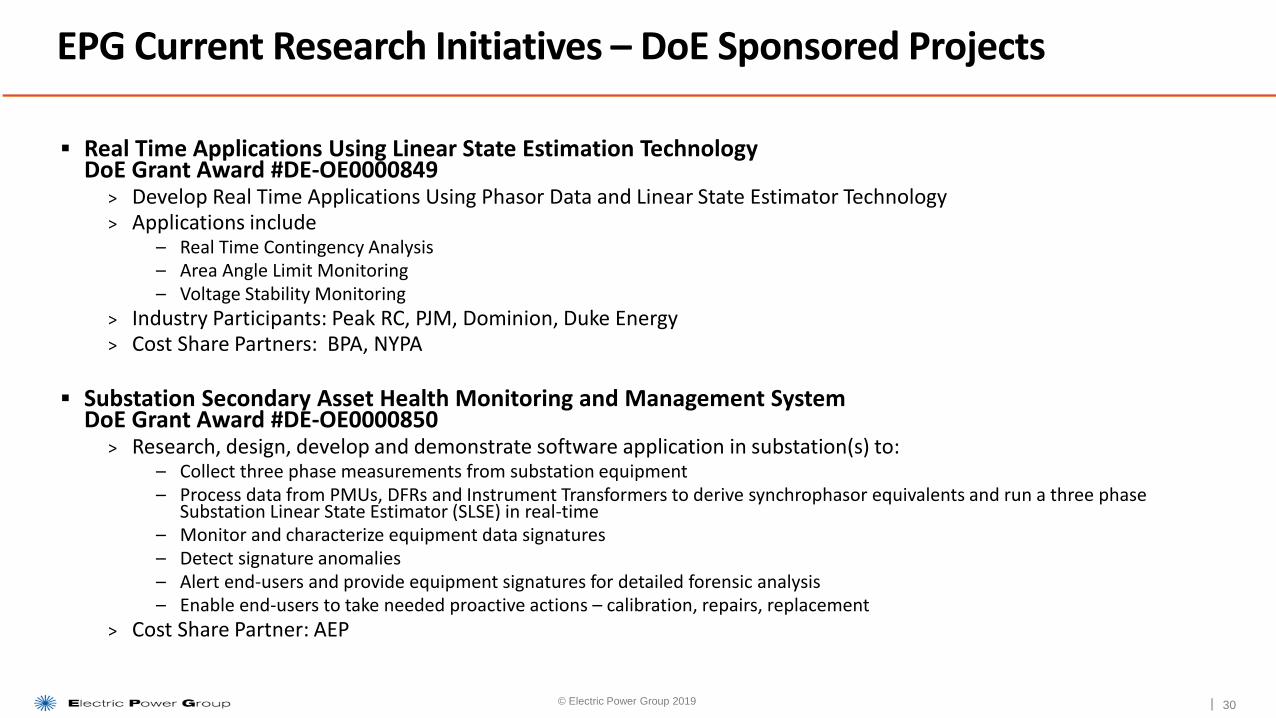
▪ Real Time Applications Using Linear State Estimation TechnologyDoE Grant Award #DE-OE0000849
> Develop Real Time Applications Using Phasor Data and Linear State Estimator Technology> Applications include
– Real Time Contingency Analysis– Area Angle Limit Monitoring– Voltage Stability Monitoring
> Industry Participants: Peak RC, PJM, Dominion, Duke Energy> Cost Share Partners: BPA, NYPA
▪ Substation Secondary Asset Health Monitoring and Management SystemDoE Grant Award #DE-OE0000850
> Research, design, develop and demonstrate software application in substation(s) to:– Collect three phase measurements from substation equipment– Process data from PMUs, DFRs and Instrument Transformers to derive synchrophasor equivalents and run a three phase
Substation Linear State Estimator (SLSE) in real-time– Monitor and characterize equipment data signatures– Detect signature anomalies– Alert end-users and provide equipment signatures for detailed forensic analysis– Enable end-users to take needed proactive actions – calibration, repairs, replacement
> Cost Share Partner: AEP
EPG Current Research Initiatives – DoE Sponsored Projects
30© Electric Power Group 2019

|
▪ Eastern Interconnection Situational Awareness Monitoring System – ESAMS > A PMU-based system that provides a common view of interconnection-wide operating conditions—focusing
on conditions not currently visible with existing systems
> Key Elements of the initial high-level view will include:
– Detect and identify forced and natural oscillations
– Monitor phase angle pairs and identify when values are outside of normal operating ranges
– Detect atypical behavior from an ensemble of measurements and identify which ones are contributing to the atypicality
▪ Timing Intrusion Management Ensuring Resiliency (TIMER)DoE Grant Award #DE-OE0000825
> Research, develop and demonstrate detection modules for timing intrusion management in the synchrophasor and other similar energy management systems to ensure resiliency of the systems:
– The technology will be field tested and demonstrated in both laboratory and field environment with partner electric utility (IPC).
> Project Participants: Texas A&M University, Pacific Northwest National Laboratory (PNNL), Idaho Power Company (IPC), Electric Power Group (EPG)
EPG Current Research Initiatives – DoE Sponsored Projects
31© Electric Power Group 2019
|
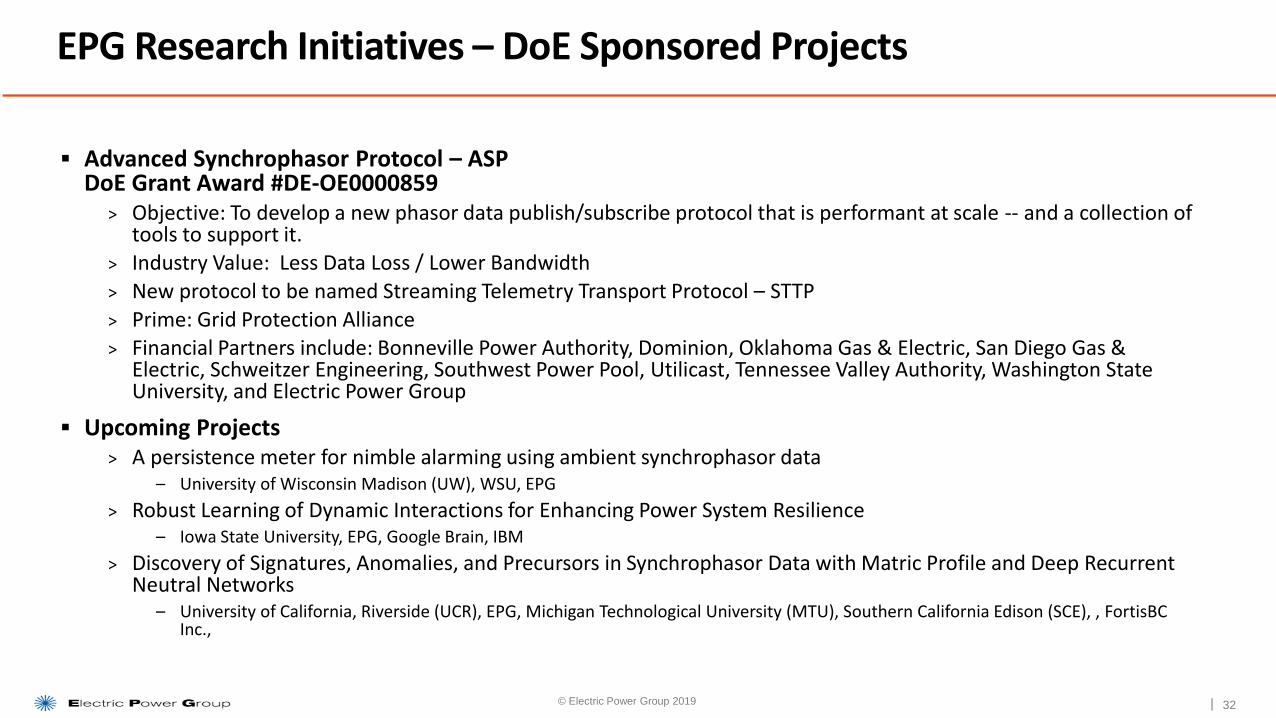
▪ Advanced Synchrophasor Protocol – ASPDoE Grant Award #DE-OE0000859
> Objective: To develop a new phasor data publish/subscribe protocol that is performant at scale -- and a collection of tools to support it.
> Industry Value: Less Data Loss / Lower Bandwidth
> New protocol to be named Streaming Telemetry Transport Protocol – STTP
> Prime: Grid Protection Alliance> Financial Partners include: Bonneville Power Authority, Dominion, Oklahoma Gas & Electric, San Diego Gas &
Electric, Schweitzer Engineering, Southwest Power Pool, Utilicast, Tennessee Valley Authority, Washington State University, and Electric Power Group
▪ Upcoming Projects > A persistence meter for nimble alarming using ambient synchrophasor data
– University of Wisconsin Madison (UW), WSU, EPG
> Robust Learning of Dynamic Interactions for Enhancing Power System Resilience– Iowa State University, EPG, Google Brain, IBM
> Discovery of Signatures, Anomalies, and Precursors in Synchrophasor Data with Matric Profile and Deep Recurrent Neutral Networks
– University of California, Riverside (UCR), EPG, Michigan Technological University (MTU), Southern California Edison (SCE), , FortisBC Inc.,
EPG Research Initiatives – DoE Sponsored Projects
32© Electric Power Group 2019
|
Summary
© Electric Power Group 2019 33
• Portfolio of Synchrophasor Applications – Over 15 applications
• Robust Comprehensive Platform for Real-time Monitoring (RTDMS) and Offline Analytics (PGDA) in use at Major ISOs and
Utilities
• enhanced Linear State Estimator (eLSE) – expanded visibility, model based bad data detection, platform for applications
• Automated Event Mining – Mine through large amount of synchrophasor data and identify significant events
• Generator Parameter Validation – Automated Process for Generator Model Validation and Reporting for NERC MOD
standards
• Applications developed through research projects and initiatives
• Synchrophasor Based RTCA
• Area Angle Monitoring
• Voltage Stability Assessment
• Substation Secondary Asset Health Monitoring System

|
Questions
34© Electric Power Group 2019

|
Thank You
251 S. Lake Ave., Suite 300Pasadena, CA 91101
626.685.2015www.electricpowergroup.com