epidemiologic principles
TRANSCRIPT

EPIDEMIOLOGIC PRINCIPLES:STUDY DESIGNS
July 23, 2004
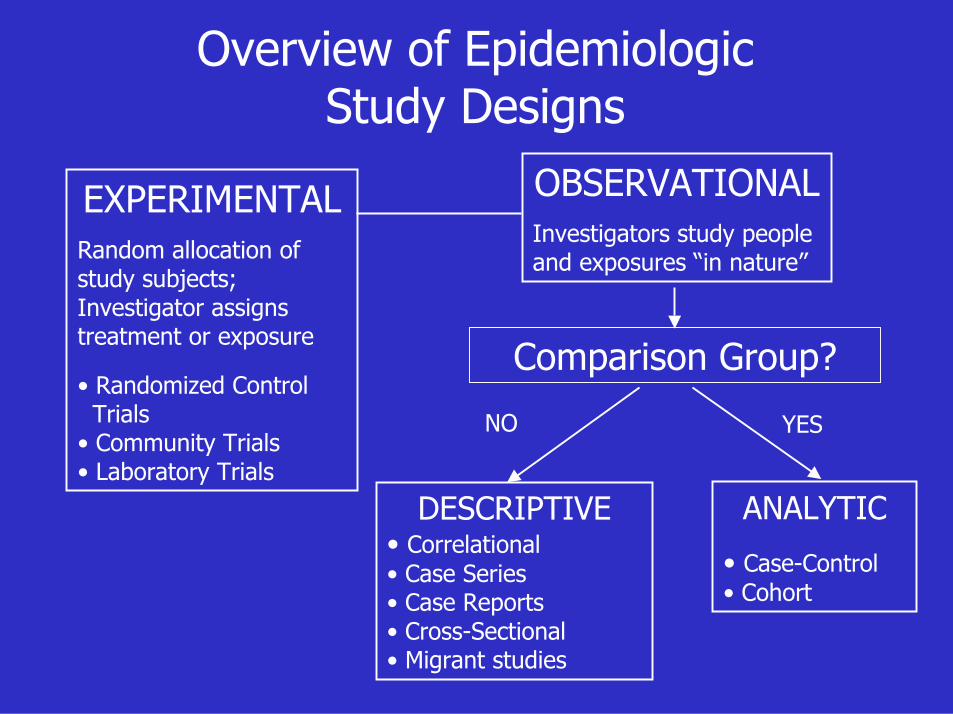
Overview of Epidemiologic Study Designs
EXPERIMENTALRandom allocation of study subjects; Investigator assigns treatment or exposure
• Randomized ControlTrials
• Community Trials• Laboratory Trials
OBSERVATIONALInvestigators study people and exposures “in nature”
DESCRIPTIVE• Correlational• Case Series• Case Reports• Cross-Sectional• Migrant studies
ANALYTIC
• Case-Control• Cohort
Comparison Group?
NO YES

Descriptive vs. Analytic Studies
• Descriptive studies provide information on patterns of disease occurrence– The descriptive statistics generated can be correlated
with clinical observations or laboratory studies to generate hypotheses
– Often provide clues about disease causation that can be pursued by more sophisticated research designs
• Analytic studies are designed specifically to test hypotheses that have usually been generated from descriptive studies

Person, Place and Time
The three critical dimensions for describing a health condition
– Person: demographic (i.e., age, gender, race) and other personal characteristics of the population under study
– Place: region, residence, workplace, topography, or location of rooms, buildings or other structures
– Time: seasonal patterns, secular trends, or acute changes in disease occurrence (i.e., epidemic)

Description by Person
In 2000, more African Americans were reported with AIDS than any other racial/ethnic group.

Description by PlaceRocky Mountain Spotted Fever, by county, 1993.
Source: Gordis L. 1996. Epidemiology. Philadelphia: W.B. Saunders Company.
• Clear clustering of cases of RMSF along the east coast and in the south central U.S.
• Disease is not randomly distributed.

Description by TimeTrends in infectious disease mortality in the U.S. from 1900 to 1996
With the exception of the influenza pandemic of 1918, death rates due to infectious diseases decreased until around 1980, at which time several factors (including HIV-related mortality and antibiotic resistance) caused these rates to rise. Source: Centers for Disease Control and Prevention, National Center for Infectious Diseases, 2002.
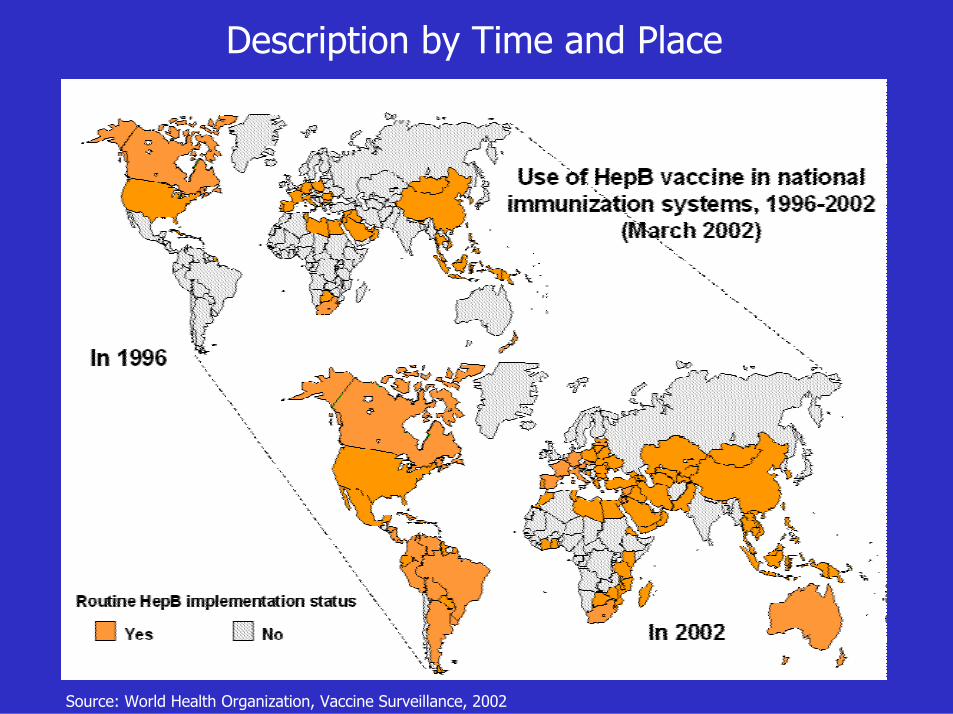
Description by Time and Place
Source: World Health Organization, Vaccine Surveillance, 2002

Surveillance Artifact
Source: Centers for Disease Control and Prevention. Mortality and Morbidity Weekly Report.

DESCRIPTIVE STUDY DESIGNS

Main Types of Descriptive Studies
(1) Correlational studies
(2) Case reports and case series
(3) Cross-sectional studies

Correlational Studies
Typically, an ecologic measure of exposure and an aggregate measure of disease or mortality are compared
– Measure of association: correlation coefficient (r)• Linear association between exposure and outcome,
ranging from -1 to 1
– Examples• Correlation of rate of a given disease and average amount of
caloric intake, proportion of smokers, or median income• Death rates from coronary artery disease correlate with per
capita cigarette sales

Uses of Correlational Studies
• To suggest disease causation
• To describe broad social and cultural attributes affecting health
• Surveillance
• To evaluate disease control measures

From Gordis, Epidemiology, Figure 13.4
600 1600800 1000 1200 1400
250
50
200
150
100
00
Japan
Romania
Yugoslavia
Hong Kong
Inci
denc
e Rat
e pe
r 10
0,00
0 W
omen
Correlation between fat intake and breast cancer by country
Per Capita Supply of Fat Calories
HungaryPoland
SpainFinland
Norway
U.S.A.
Australia
Israel
Italy
Sweden
GreatBritain
CanadaSwitzerland
New ZealandFrance
GermanyDenmark

Correlational Studies Summary
Advantages
• Quick and relatively inexpensive
• May be able to use readily available data
• Useful in hypothesis generation
Disadvantages
• Does not provide information about the relationship between risk factor levels and disease in individuals
• Ecologic fallacy - association observed between variables on an aggregate level does not necessarily represent the association at an individual level
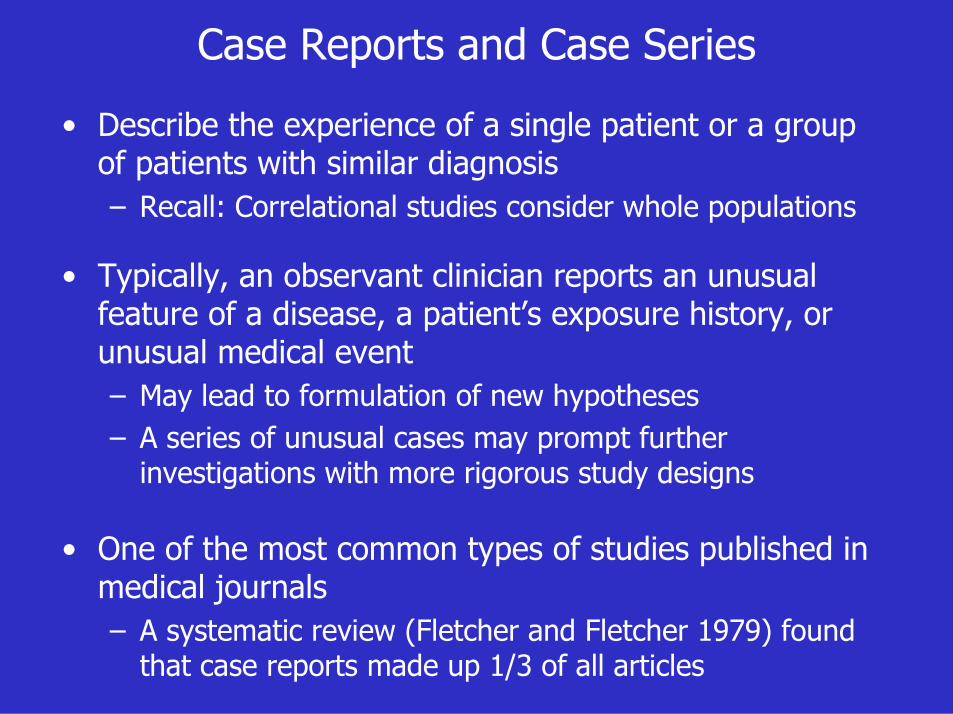
Case Reports and Case Series
• Describe the experience of a single patient or a group of patients with similar diagnosis– Recall: Correlational studies consider whole populations
• Typically, an observant clinician reports an unusual feature of a disease, a patient’s exposure history, or unusual medical event– May lead to formulation of new hypotheses– A series of unusual cases may prompt further
investigations with more rigorous study designs
• One of the most common types of studies published in medical journals– A systematic review (Fletcher and Fletcher 1979) found
that case reports made up 1/3 of all articles

Case Series
Collections of individual case reports- May occur in a relatively short time period
(1) Can indicate the beginning or presence of an epidemic
(2) Hypothesis formulation - through investigation of the experiences of the affected individuals
(3) Identification of possible causal factors - analytic study to compare experiences of the case series with a group of individuals who did not develop the disease

Early Epidemiology of AIDS
• Between Oct 1980 and May 1981, 5 cases of Pneumocystis carinii pneumonia were reported among young, previously healthy, homosexual men in L.A.– Previously occurred only in older, immunosuppressed
cancer patients
• Also in 1981, an unprecedented number of cases of Kaposi’s sarcoma were diagnosed in young homosexual men– Previously seen almost exclusively in the elderly, and
affected men and women equally
• CDC initiated a surveillance program– Established diagnostic criteria for this new syndrome
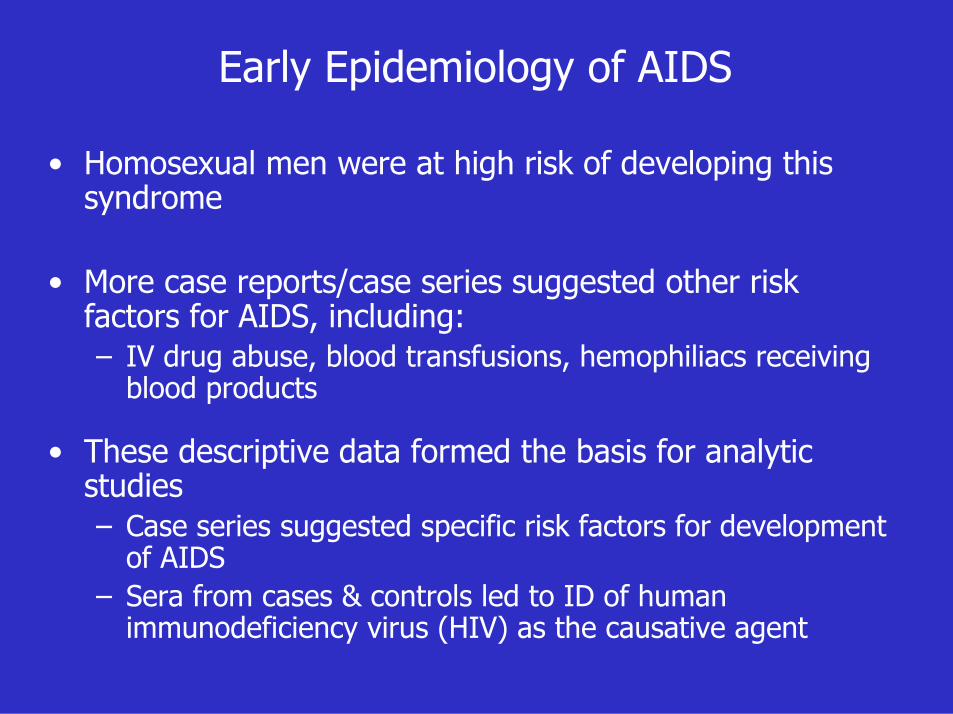
Early Epidemiology of AIDS
• Homosexual men were at high risk of developing this syndrome
• More case reports/case series suggested other risk factors for AIDS, including:– IV drug abuse, blood transfusions, hemophiliacs receiving
blood products
• These descriptive data formed the basis for analytic studies– Case series suggested specific risk factors for development
of AIDS– Sera from cases & controls led to ID of human
immunodeficiency virus (HIV) as the causative agent
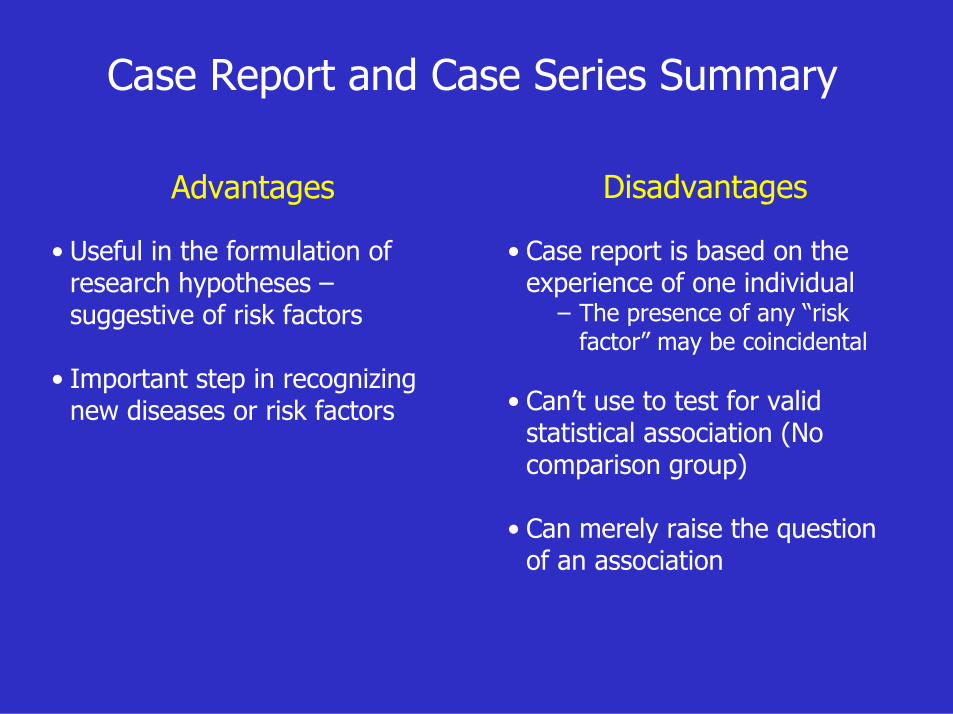
Case Report and Case Series Summary
Advantages
• Useful in the formulation of research hypotheses –suggestive of risk factors
• Important step in recognizing new diseases or risk factors
Disadvantages
• Case report is based on the experience of one individual− The presence of any “risk
factor” may be coincidental
• Can’t use to test for valid statistical association (No comparison group)
• Can merely raise the question of an association
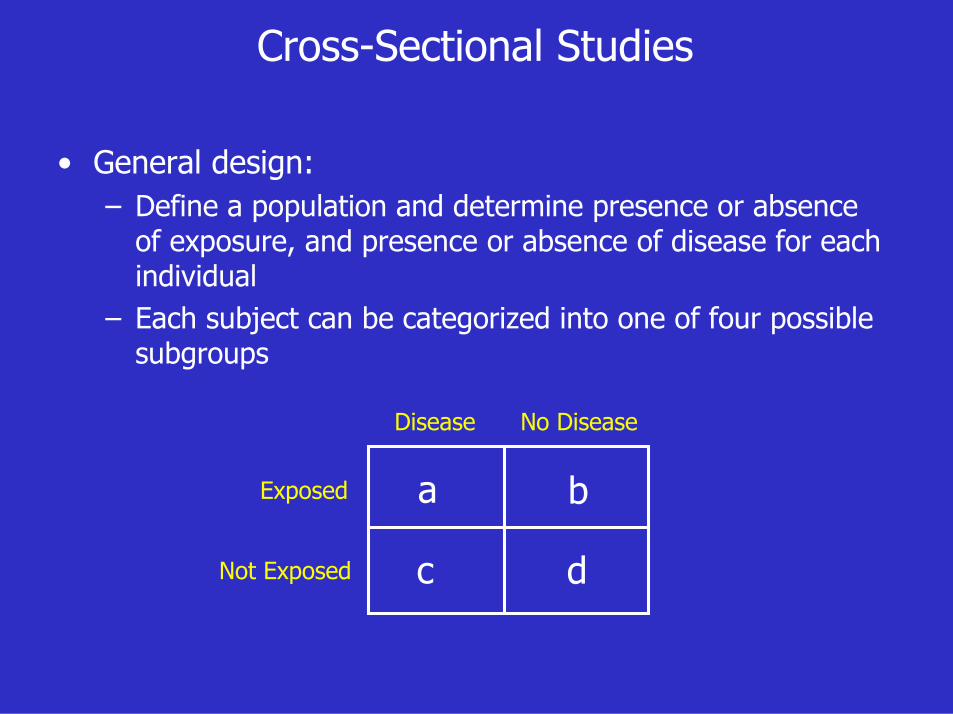
Cross-Sectional Studies
• General design:– Define a population and determine presence or absence
of exposure, and presence or absence of disease for each individual
– Each subject can be categorized into one of four possible subgroups
a b
c d
Disease No Disease
Exposed
Not Exposed

Cross-Sectional Studies
• Exposure and disease outcome are determined simultaneously for each subject– Identify prevalent cases (the cases existed at the time of
the study, but do not know their duration)– Measure prevalence, not incidence (new cases)– Also called a “prevalence study”
• Prevalence is a function of both incidence and duration of disease– Prevalence = Incidence rate x Duration of disease– So measures of association based on prevalent cases reflect both
• The exposure’s effect on incidence• The exposure’s effect on duration or survival

Cross-Sectional Studies:Determining an Association
• Compare the prevalence of disease in persons with the exposure, [a/(a+b)], with the prevalence of disease in persons without theexposure, [c/(c+d)]
• Compare the prevalence of exposure in persons with the disease, [a/(a+c)], with the prevalence of exposure in persons without the disease, [b/(b+d)]
a b
c d
Disease No Disease
Exposed
Not Exposed
a+b
c+d
a+c b+d

In a cross-sectional study, we identify prevalent (existing) cases rather than incident (new) cases.
– Prevalent cases may not be representative of all cases in this population
– If an association is observed, it may be with survival, or may be a result of the disease, rather than with risk of development of disease
– Incidence-prevalence bias• Prevalent cases include long-term survivors, who have a
better average survival than that of incident cases (represent the full spectrum of disease severity)
Cross-Sectional Studies
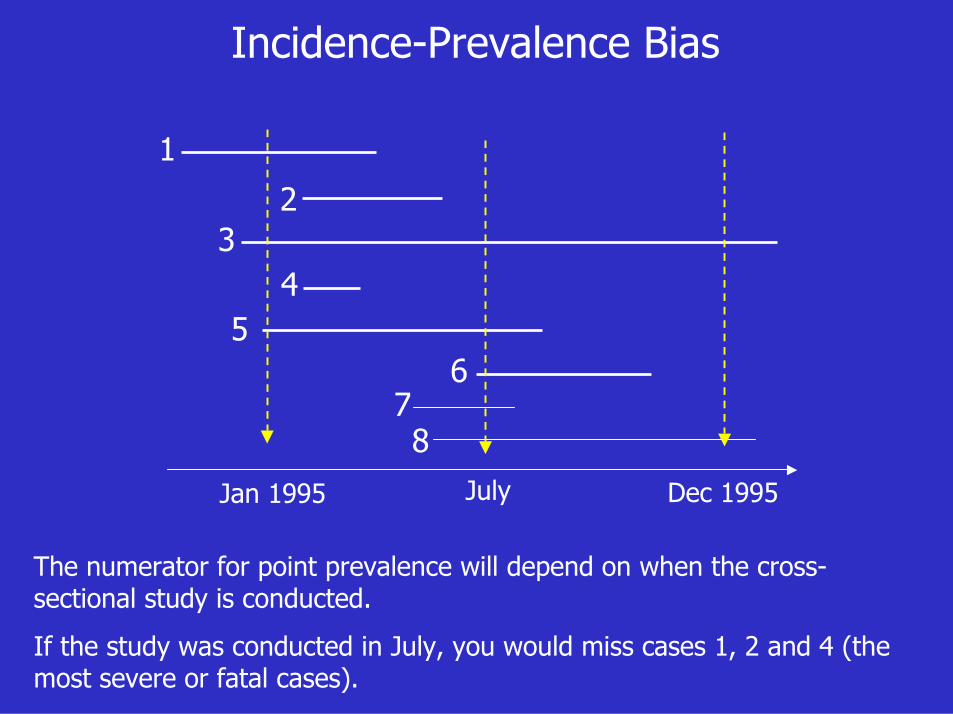
Incidence-Prevalence Bias
July
1
23
45
678
Jan 1995 Dec 1995
The numerator for point prevalence will depend on when the cross-sectional study is conducted.
If the study was conducted in July, you would miss cases 1, 2 and 4 (the most severe or fatal cases).

Descriptive Studies Summary
Advantages
• Often uses routinely collected,readily available data
• Less expensive and time-consumingas compared to analytic studies
• Good for assessing prevalenceand patterns of disease occurrence
• Useful in the formulation of research hypotheses – suggestive of risk factors
Disadvantages
• Usually cannot test epidemiologic hypotheses
• Lacks comparison group
• Cannot usually discern a temporal relationship between an exposure and disease
• Not useful for rare events
• May be subject to selection bias due to refusal, death, etc.

Early Leads from Descriptive Studies
Clinical observation
Hepatocellular carcinoma in young women
Blindness in newborns
Kaposi’s sarcoma in young men
Cataracts, heart defects, and deafness in newborns
Underlying association
Exposure to high-dose oral contraceptives
High ambient oxygen concentrations in incubators
Infection with HIV-1
Maternal infection with rubella during pregnancy

ANALYTIC STUDY DESIGNS

Validity in Epidemiologic Studies
• Internal validity: Does the study truly measure what it set out to measure?
– Bias: Any systematic error (not random or by chance) in a study which leads to an incorrect estimate of the association between an exposure and disease (threat to internal validity)
– Chance – Confounding
• External validity: Can results obtained using the study sample be generalized to a population?

Exposure Disease
Confounder
• Confounders are third variables that are associated with both the exposure and the disease
• Confounders can distort the true association between disease and exposure
Confounding

ANALYTIC STUDY DESIGNS:
CASE-CONTROL STUDIES

Case Selection• Case definition
– e.g. lung cancer confirmed by biopsy
• Prevalent vs. incident cases– Prevalent:
• No waiting• Risk factors may be more related to survival with disease
than development (incidence) of disease• If many people die soon after diagnosis, may over-represent
long term survivors
– Incident:• Recruit new cases at time of disease occurrence • Better for making inference about association between risk
factor and developing the disease

Total Population
Reference Population
Cases Controls
• Should be comparable to cases.
• Should have the potential to become cases (must be susceptible to the disease of interest)
• Possible control sources: population, neighborhood, friend, hospital
Control Selection

Measure of Association: Case-control Study
Disease No Disease
Exposure a b
No Exposure c d
Odds ratio
= Odds of exposure among cases/Odds of exposure among controls
= ad/bc

Example: Alcohol Consumption and Laryngeal Cancer
Cases ControlsAlcohol 160 90
No Alcohol 40 110
Total 200 200
Odds ratio = 160 x 110 = 4.8990 x 40
The odds of alcohol consumption are 4.89 times greater among those with laryngeal cancer than the odds of alcohol consumption among those without laryngeal cancer.

Matching
• A technique to reduce potential confounding– The process of selecting controls so that they are similar to
cases on certain specific characteristics, such as age, race, gender
– Cannot measure the effects of matching variables
• Group (frequency) vs. individual (matched pairs) matching– Group: Proportion of cases and controls with a matching
characteristic is the same– Individual: For each case a control is selected who is identical
to the case on matching characteristics

Bias in Case-control Studies
Selection bias: Systematic error due to differences in characteristics between those selected for a study and those not selected
Example: Hospitalized cases

Bias in Case-control Studies
Recall bias: Systematic error due to differences in accuracy or completeness of reporting of past events or experiences
Example: Mothers of children with birth defects
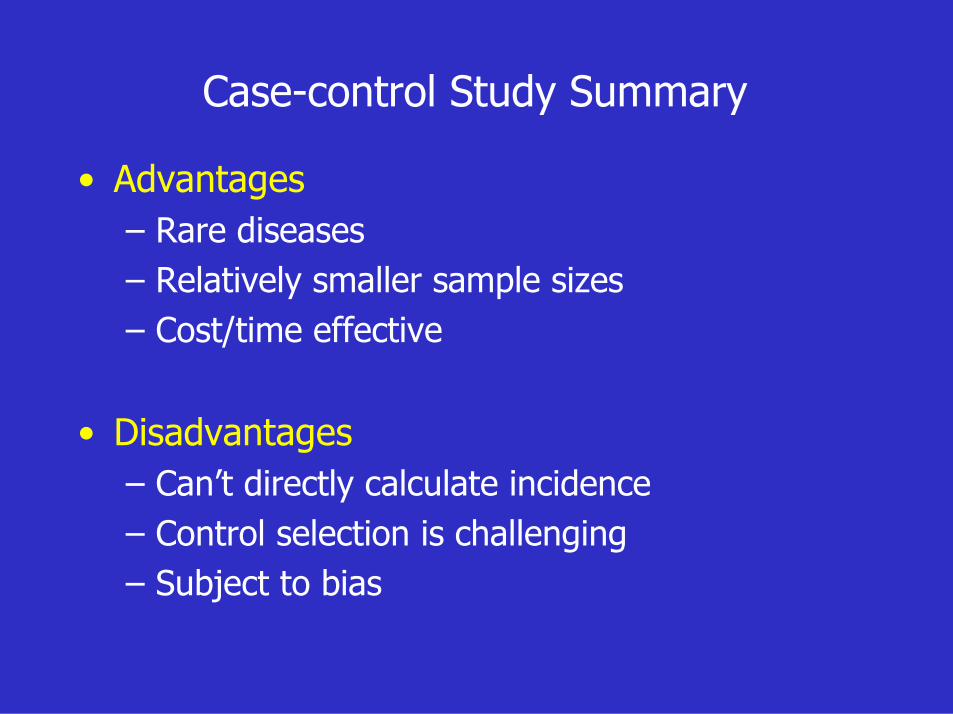
Case-control Study Summary
• Advantages– Rare diseases– Relatively smaller sample sizes– Cost/time effective
• Disadvantages– Can’t directly calculate incidence– Control selection is challenging– Subject to bias

ANALYTIC STUDY DESIGNS:
COHORT STUDIES

Cohort Study: General Design
1 2
Disease No DiseaseExposure a bNo Exposure c d
1. Subjects are defined on the basis of exposure status2. Subjects are followed over time to assess disease development

Group Selection
Exposed• Select a sample of the population– Good for relatively common exposures, such as cigarette smoking
or coffee drinking
• Select based on special exposure– Individuals in certain occupations – Individuals who have undergone a particular medical process– Individuals living near a suspected environmental hazard
Unexposed• Should be similar to the exposed group with respect to all factors that
may be related to the disease except the exposure under investigation
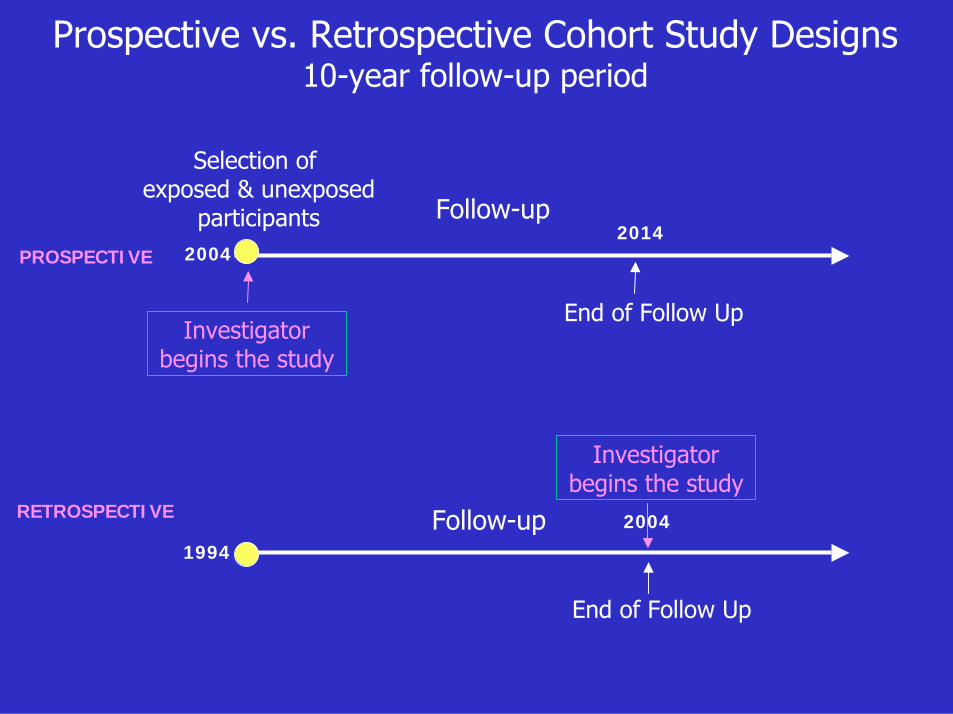
Prospective vs. Retrospective Cohort Study Designs10-year follow-up period
PROSPECTIVE
Investigator begins the study
Follow-up
Selection of exposed & unexposed
participants
End of Follow Up
20042014
RETROSPECTIVE
Investigator begins the study
End of Follow Up
2004
1994Follow-up

Example: Retrospective Cohort Study
• From medical records, identify a group of women who were using OCPs 10 years ago and a group of women who were not using OCPs
• Interview the women or use medical records to determine their history of heart disease from the point of OCP use to the present

Main Threats to Validity in Cohort Studies
• Differential loss to follow-up– Example: Some participants given a new antibiotic
might have such poor outcomes that they are unable to complete questionnaires or return for examination. Their disappearance would make the new antibiotic look better than it is.
• Biased assessment of exposure and/or outcome– Example: If the exposed group in an occupational
setting has periodic health examinations, and rate of disease is compared with that of the general population, a biased estimated could result because of greater opportunity to have the disease diagnosed among the exposed.

Measures of Association: Cohort Study
Need to know the frequency of disease in the absence of exposure(baseline or background rate) to determine relative risk
• Risk Ratio– Ratio of the cumulative incidence among exposed to the
cumulative incidence among unexposed, using count data
• Rate Ratio– Ratio of the incidence rate among exposed to the incidence rate
among unexposed, using person-time data
• Survival Analysis– Compare time to disease diagnosis in exposed and
unexposed – Life table analysis– Hazard Ratio
Indicate the likelihood of developing the disease in the exposed group relative to those who are not exposed

Hip FractureLow BMD Yes No Total
Yes 230 400 630
No 110 369 479
Total 340 769 1,109
Risk Ratio (Relative Risk) = CIe / CIu = (230/630) / (110/479) = 1.59
The risk of developing hip fractures was 1.59 times higher in those with low bone mineral density compared to those with normal bonemineral density during this 5-year follow-up study.
Example: Risk of hip fracture among those with low BMD in 5 years of follow-up
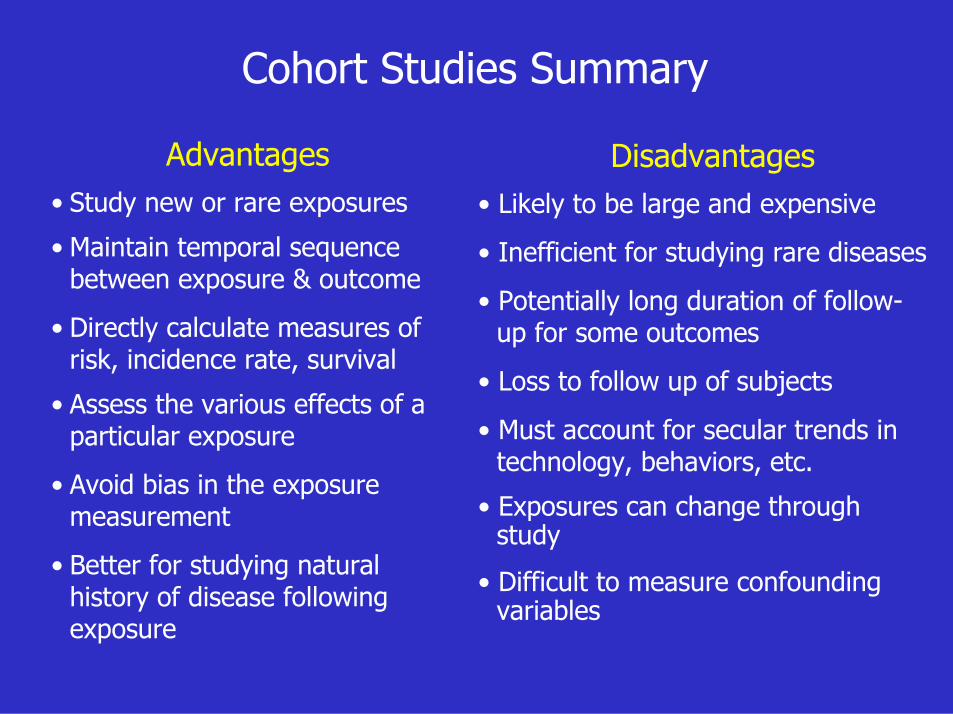
Cohort Studies Summary
Advantages• Study new or rare exposures
• Maintain temporal sequencebetween exposure & outcome
• Directly calculate measures of risk, incidence rate, survival
• Assess the various effects of a particular exposure
• Avoid bias in the exposure measurement
• Better for studying natural history of disease following exposure
Disadvantages• Likely to be large and expensive
• Inefficient for studying rare diseases
• Potentially long duration of follow-up for some outcomes
• Loss to follow up of subjects
• Must account for secular trends in technology, behaviors, etc.
• Exposures can change through study
• Difficult to measure confounding variables

Source: Grimes DA, Schulz KF. Lancet 2002; 359: 58.
Classification of Study Designs