epidemiological studies on the atomic-bomb survivors (handout) · epidemiological studies on the...
TRANSCRIPT
1
HICARE June, 2013
Epidemiological Studies on the Atomic-bomb Survivors
(Handout)
Kotaro OZASADepartment of Epidemiology
Radiation Effects Research FoundationHiroshima, JAPAN
2
HICARE June, 2013
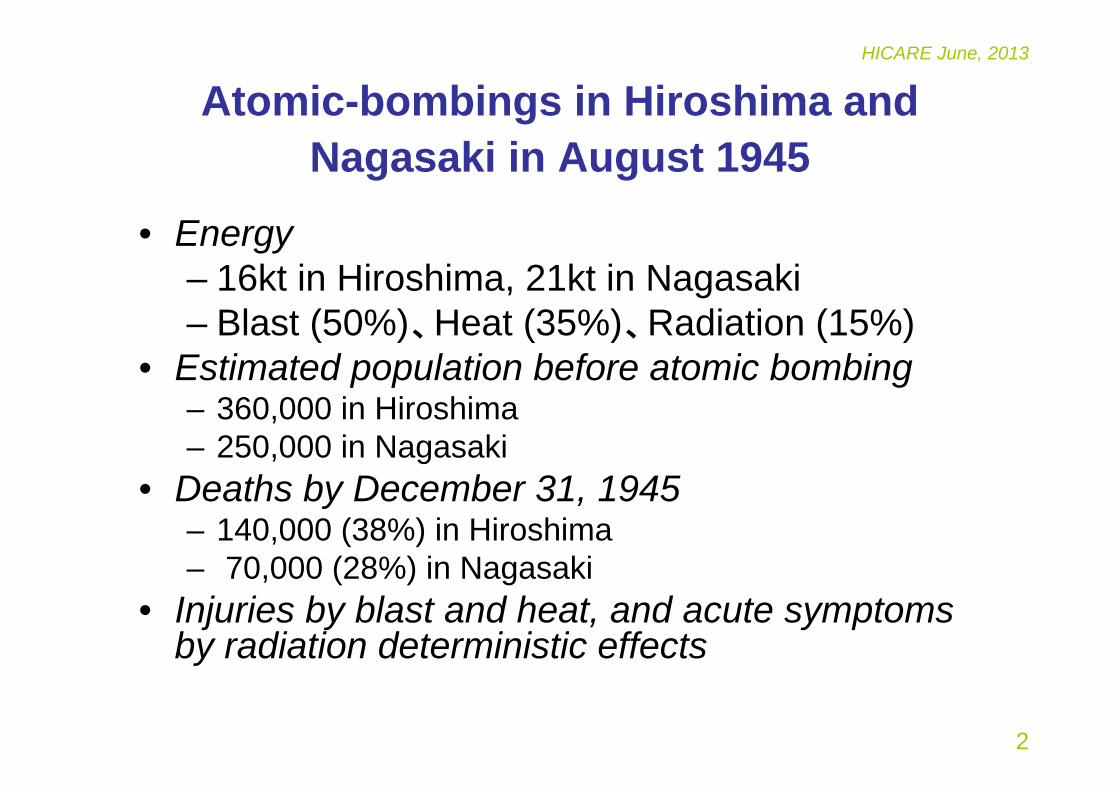
Atomic-bombings in Hiroshima and Nagasaki in August 1945
• Energy– 16kt in Hiroshima, 21kt in Nagasaki– Blast (50%)、Heat (35%)、Radiation (15%)
• Estimated population before atomic bombing– 360,000 in Hiroshima– 250,000 in Nagasaki
• Deaths by December 31, 1945– 140,000 (38%) in Hiroshima– 70,000 (28%) in Nagasaki
• Injuries by blast and heat, and acute symptoms by radiation deterministic effects
3
HICARE June, 2013
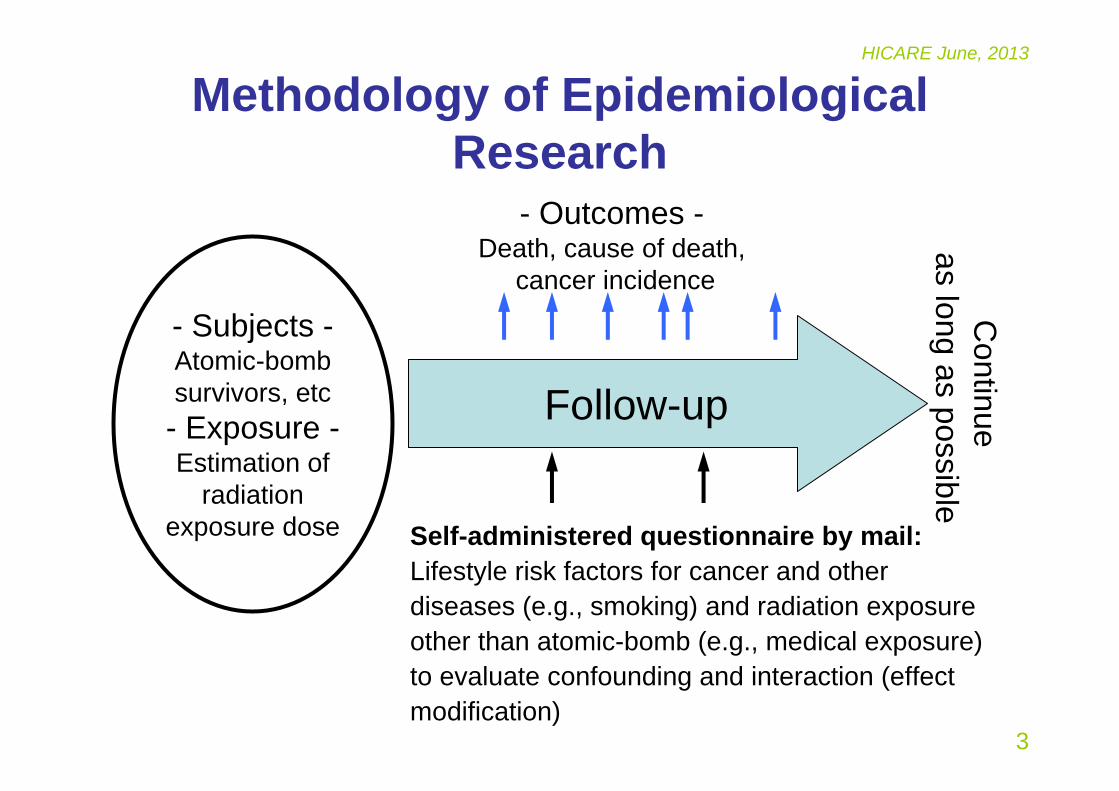
Methodology of Epidemiological Research
- Subjects -Atomic-bomb survivors, etc- Exposure -Estimation of
radiation exposure dose
Follow-up
- Outcomes -Death, cause of death,
cancer incidence
Self-administered questionnaire by mail: Lifestyle risk factors for cancer and other diseases (e.g., smoking) and radiation exposure other than atomic-bomb (e.g., medical exposure) to evaluate confounding and interaction (effect modification)
Continue
as long as possible
4
HICARE June, 2013
Definition of the Population
5
HICARE June, 2013
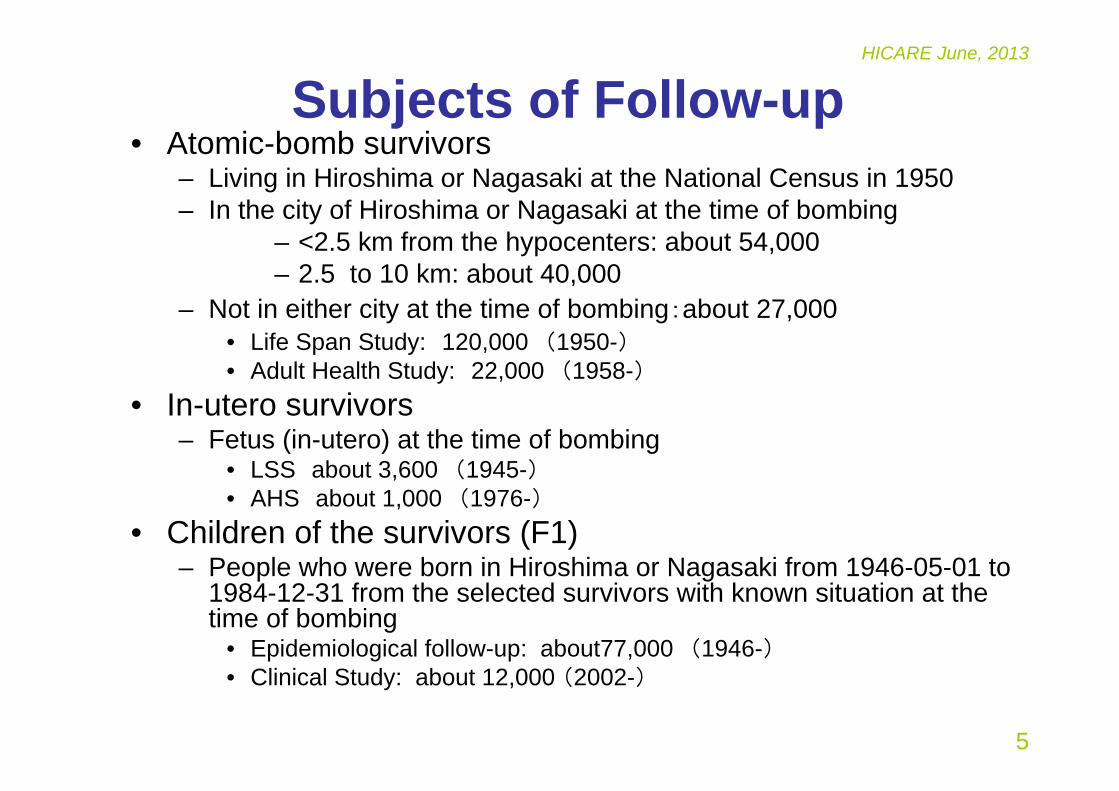
Subjects of Follow-up• Atomic-bomb survivors
– Living in Hiroshima or Nagasaki at the National Census in 1950– In the city of Hiroshima or Nagasaki at the time of bombing
– <2.5 km from the hypocenters: about 54,000– 2.5 to 10 km: about 40,000
– Not in either city at the time of bombing:about 27,000• Life Span Study: 120,000 (1950-)• Adult Health Study: 22,000 (1958-)
• In-utero survivors– Fetus (in-utero) at the time of bombing
• LSS about 3,600 (1945-)• AHS about 1,000 (1976-)
• Children of the survivors (F1)– People who were born in Hiroshima or Nagasaki from 1946-05-01 to
1984-12-31 from the selected survivors with known situation at the time of bombing
• Epidemiological follow-up: about77,000 (1946-)• Clinical Study: about 12,000 (2002-)

6
HICARE June, 2013
Estimation of Individual Radiation Dose
(Evaluation of Exposure)
7
HICARE June, 2013
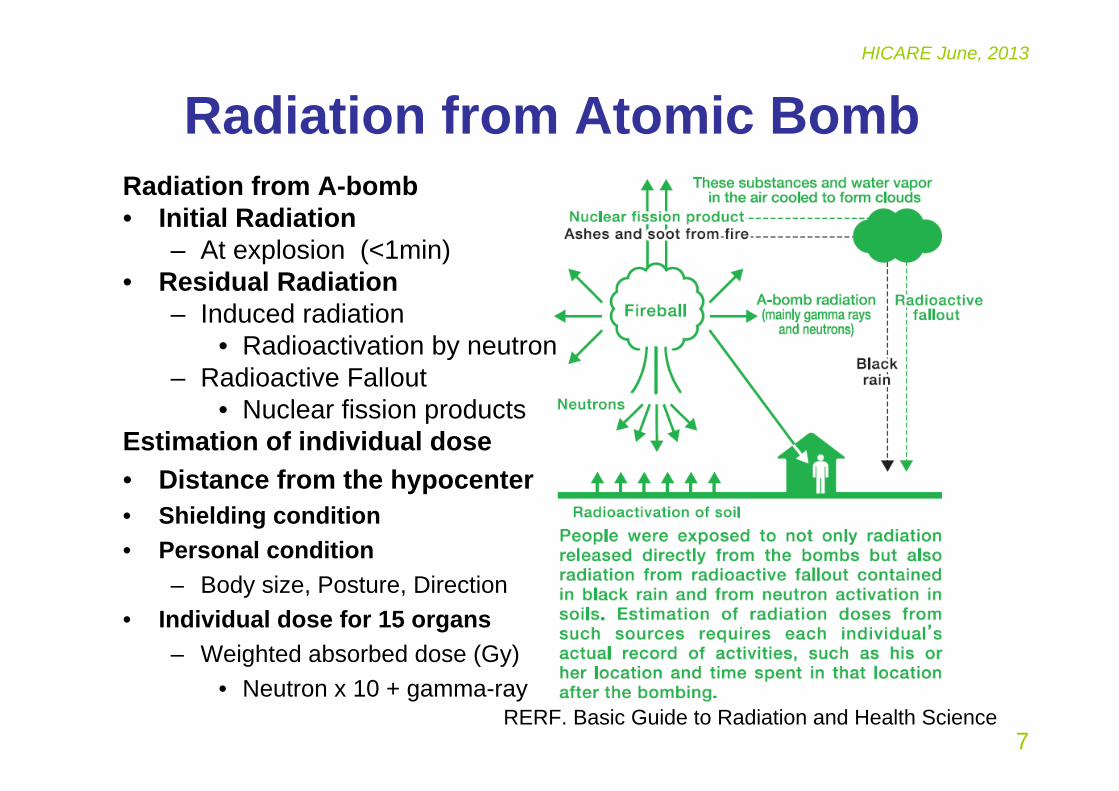
Radiation from Atomic BombRadiation from A-bomb• Initial Radiation
– At explosion (<1min)• Residual Radiation
– Induced radiation• Radioactivation by neutron
– Radioactive Fallout• Nuclear fission products
Estimation of individual dose• Distance from the hypocenter• Shielding condition• Personal condition
– Body size, Posture, Direction• Individual dose for 15 organs
– Weighted absorbed dose (Gy)• Neutron x 10 + gamma-ray
RERF. Basic Guide to Radiation and Health Science
8
HICARE June, 2013
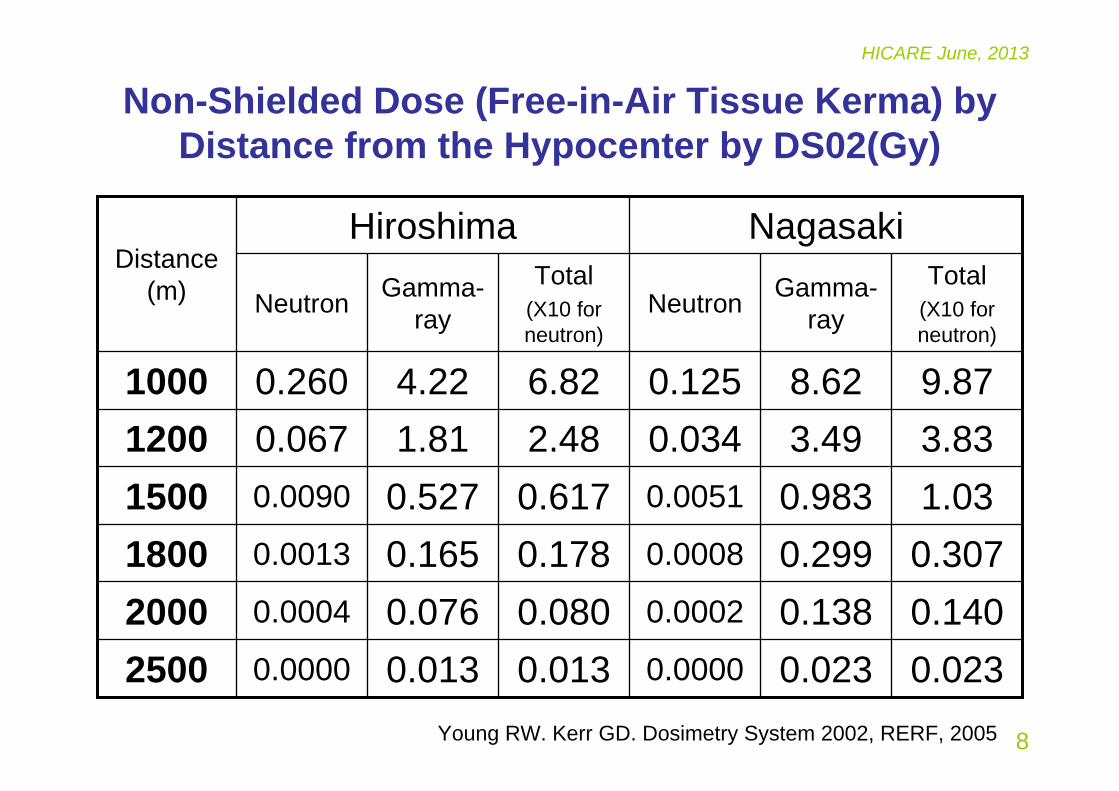
Non-Shielded Dose (Free-in-Air Tissue Kerma) by Distance from the Hypocenter by DS02(Gy)
3.833.490.0342.481.810.0671200
0.0230.0230.00000.0130.0130.000025000.1400.1380.00020.0800.0760.000420000.3070.2990.00080.1780.1650.001318001.030.9830.00510.6170.5270.00901500
9.878.620.1256.824.220.2601000
Total(X10 for neutron)
Gamma-rayNeutron
Total(X10 for neutron)
Gamma-rayNeutron
NagasakiHiroshimaDistance
(m)
Young RW. Kerr GD. Dosimetry System 2002, RERF, 2005
9
HICARE June, 2013
Estimated Individual Dose (DS02)
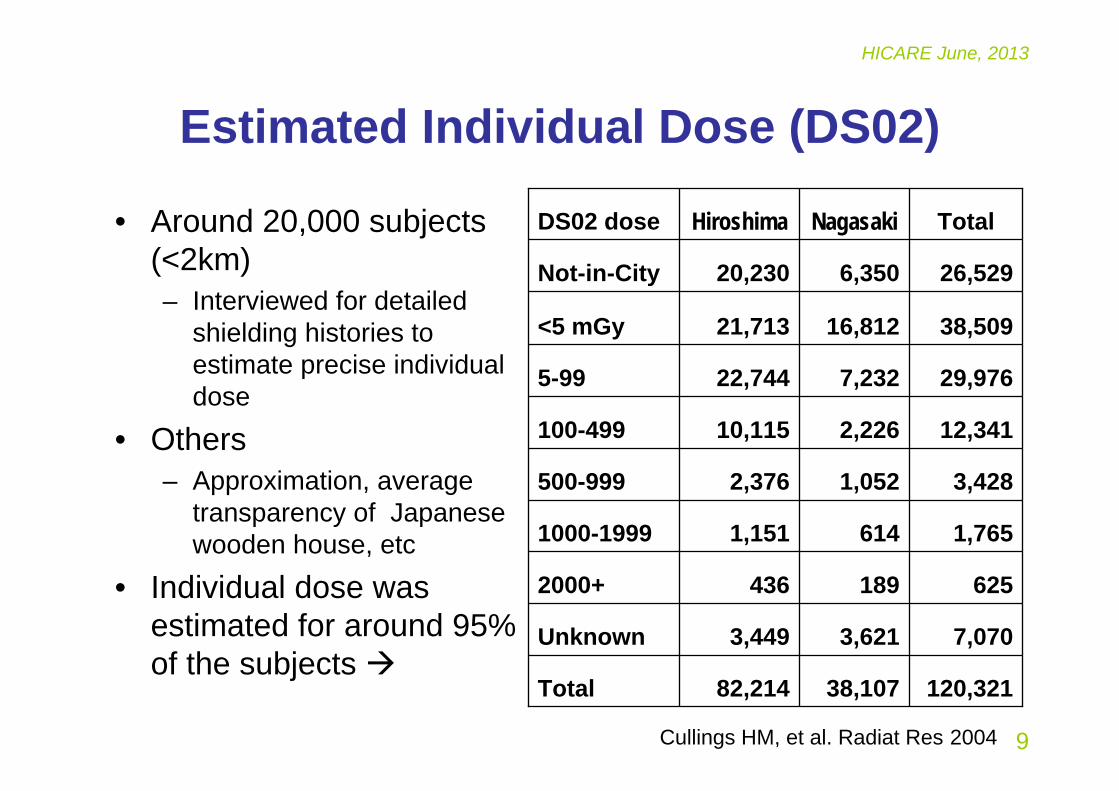
• Around 20,000 subjects (<2km)– Interviewed for detailed
shielding histories to estimate precise individual dose
• Others – Approximation, average
transparency of Japanese wooden house, etc
• Individual dose was estimated for around 95%of the subjects
TotalNagasakiHiroshimaDS02 dose
120,32138,10782,214Total
7,0703,6213,449Unknown
6251894362000+
1,7656141,1511000-1999
3,4281,0522,376500-999
12,3412,22610,115100-499
29,9767,23222,7445-99
38,50916,81221,713<5 mGy
26,5296,35020,230Not-in-City
Cullings HM, et al. Radiat Res 2004

10
HICARE June, 2013
Residual Radiation at Hiroshima/NagasakiInduced radiation by neutron
Radiation dose by staying at the location from the hypocenter for 12hr daytime
Radioactive fallout– Maximum expected external exposure
•Hiroshima: 0.01-0.03Gy•Nagasaki: 0.2-0.4Gy
– Maximum expected internal exposure•Nagasaki: Cumulated dose 1945-85: 8-10mrem (0.08-0.1mSv)*
•Hiroshima: Less than 1/10 of Nagasaki *
*DS86 Report (A-Bomb Radiation Effects 1992, Bunko-do)A Brief Description (http://www.rerf.jp/shared/briefdescript/briefdescript.pdf)、 TR 2-62, 7-67
http://www.rerf.or.jp/news/pdf/residualrad_ps_e.pdf
13815
500m
<0.59Nagasaki, 11th Aug<0.518Nagasaki, 10th Aug<0.540Hiroshima, 8th Aug<0.582 Hiroshima, 7th Aug
1000m200mDistance
11
HICARE June, 2013
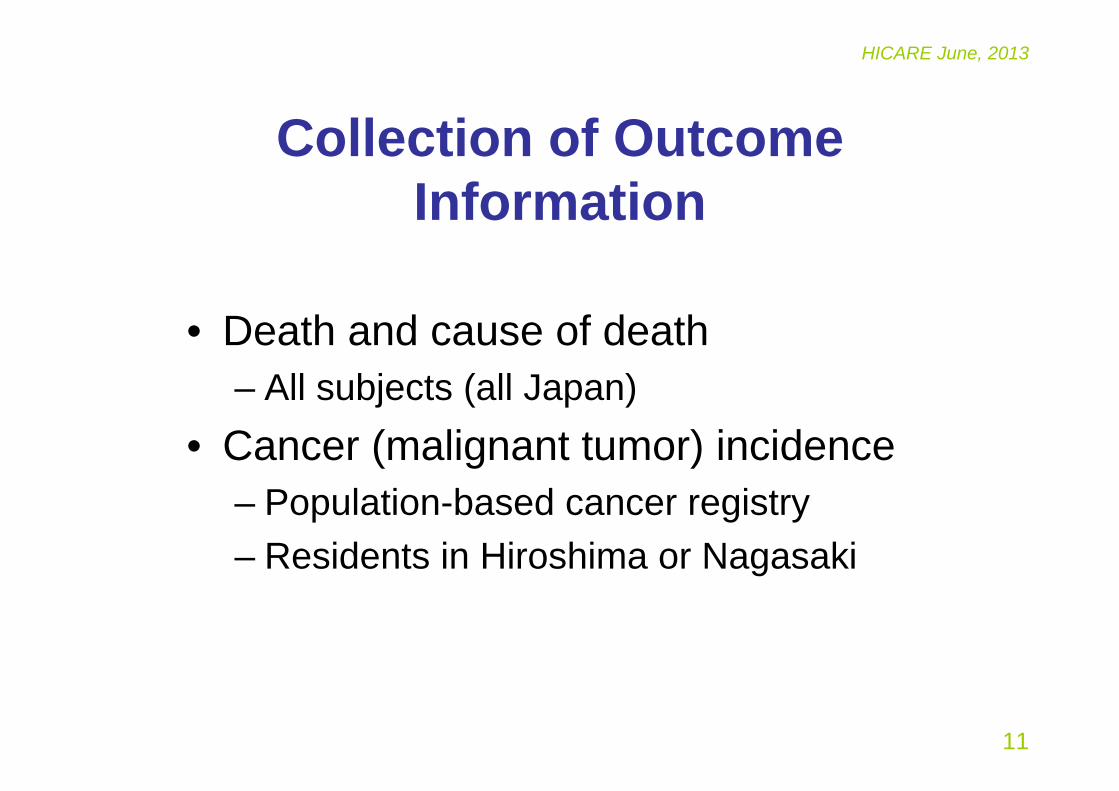
Collection of Outcome Information
• Death and cause of death– All subjects (all Japan)
• Cancer (malignant tumor) incidence– Population-based cancer registry– Residents in Hiroshima or Nagasaki
12
HICARE June, 2013
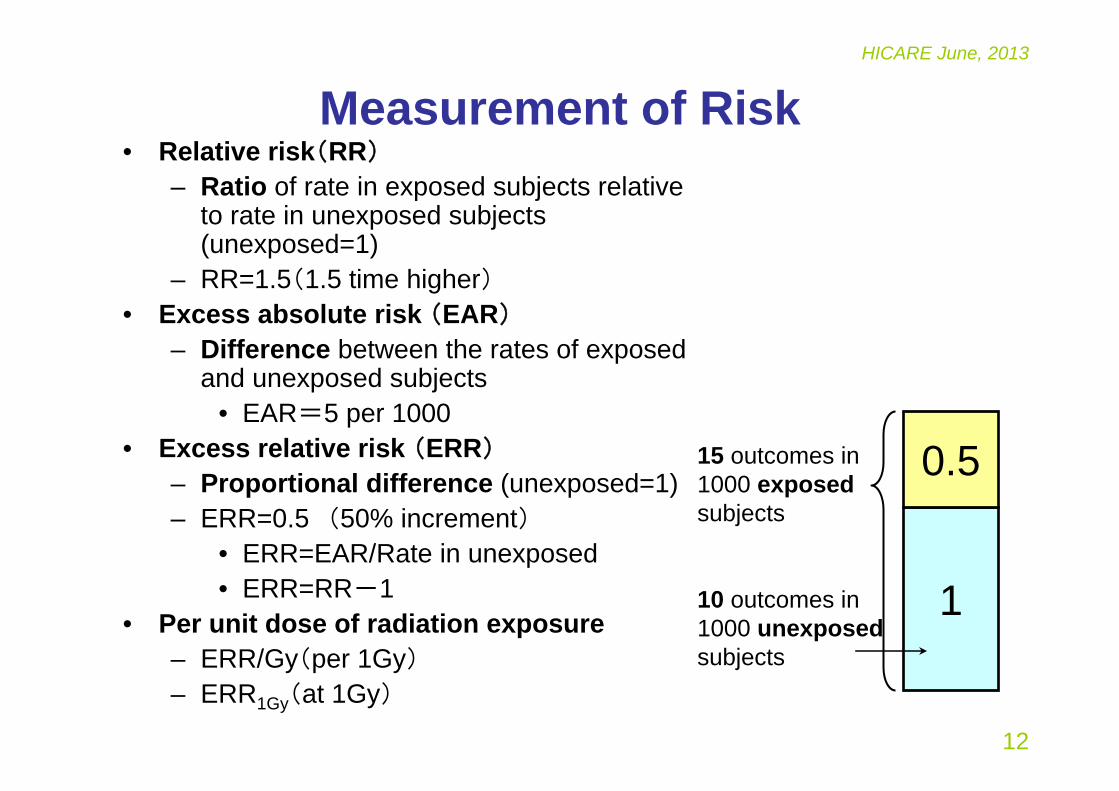
Measurement of Risk• Relative risk(RR)
– Ratio of rate in exposed subjects relative to rate in unexposed subjects (unexposed=1)
– RR=1.5(1.5 time higher)• Excess absolute risk (EAR)
– Difference between the rates of exposed and unexposed subjects
• EAR=5 per 1000 • Excess relative risk (ERR)
– Proportional difference (unexposed=1)– ERR=0.5 (50% increment)
• ERR=EAR/Rate in unexposed• ERR=RR-1
• Per unit dose of radiation exposure– ERR/Gy(per 1Gy)– ERR1Gy(at 1Gy)
1
0.515 outcomes in 1000 exposedsubjects
10 outcomes in 1000 unexposedsubjects
13
HICARE June, 2013
Results
14
HICARE June, 2013
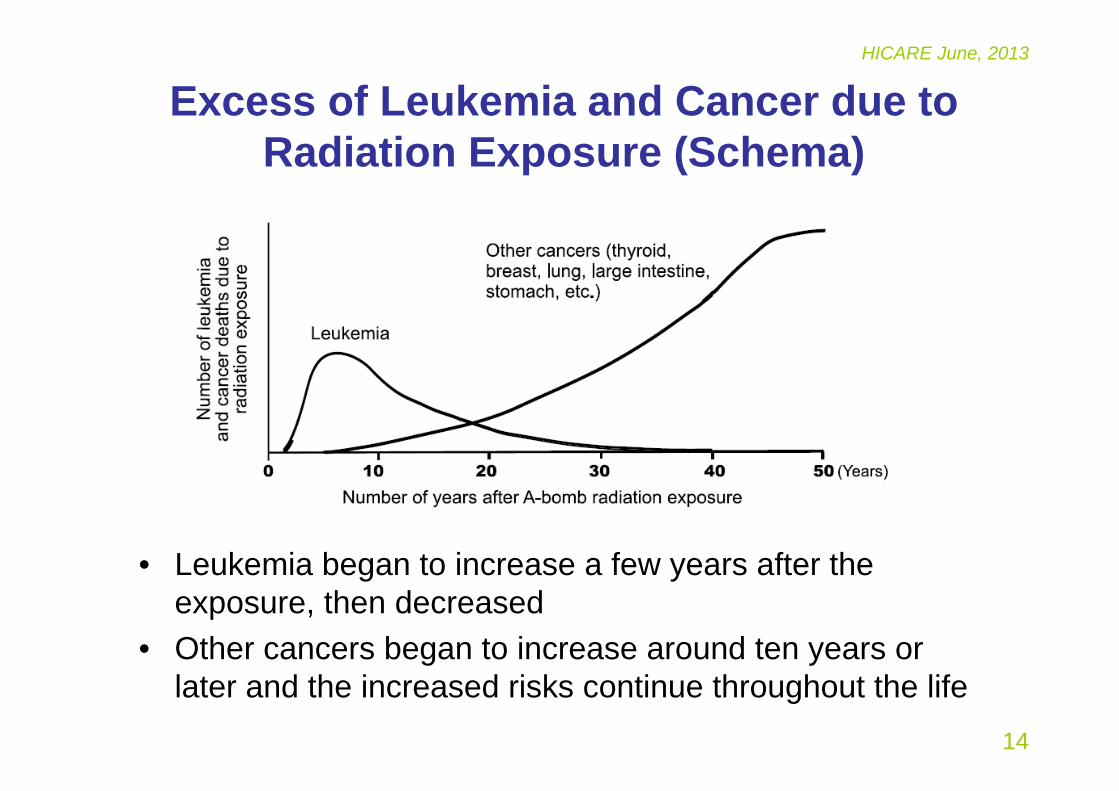
Excess of Leukemia and Cancer due to Radiation Exposure (Schema)
• Leukemia began to increase a few years after the exposure, then decreased
• Other cancers began to increase around ten years or later and the increased risks continue throughout the life
15
HICARE June, 2013
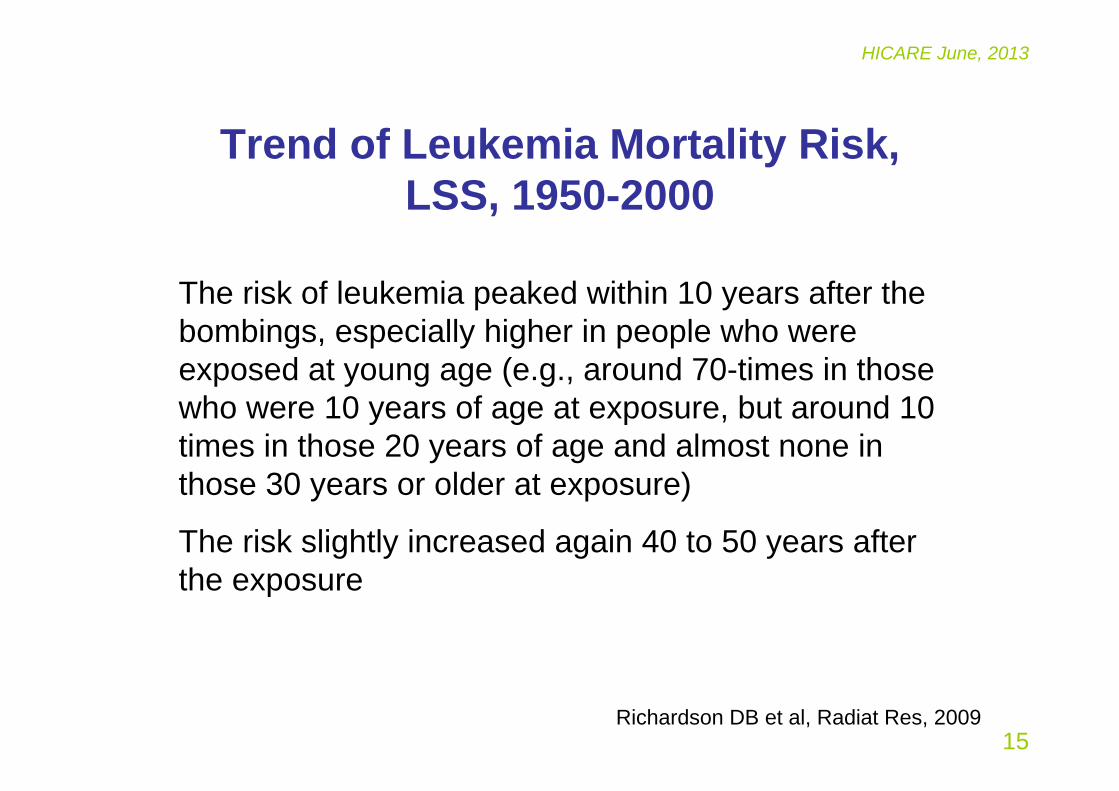
Trend of Leukemia Mortality Risk,LSS, 1950-2000
Richardson DB et al, Radiat Res, 2009
The risk of leukemia peaked within 10 years after the bombings, especially higher in people who were exposed at young age (e.g., around 70-times in those who were 10 years of age at exposure, but around 10 times in those 20 years of age and almost none in those 30 years or older at exposure)
The risk slightly increased again 40 to 50 years after the exposure
16
HICARE June, 2013
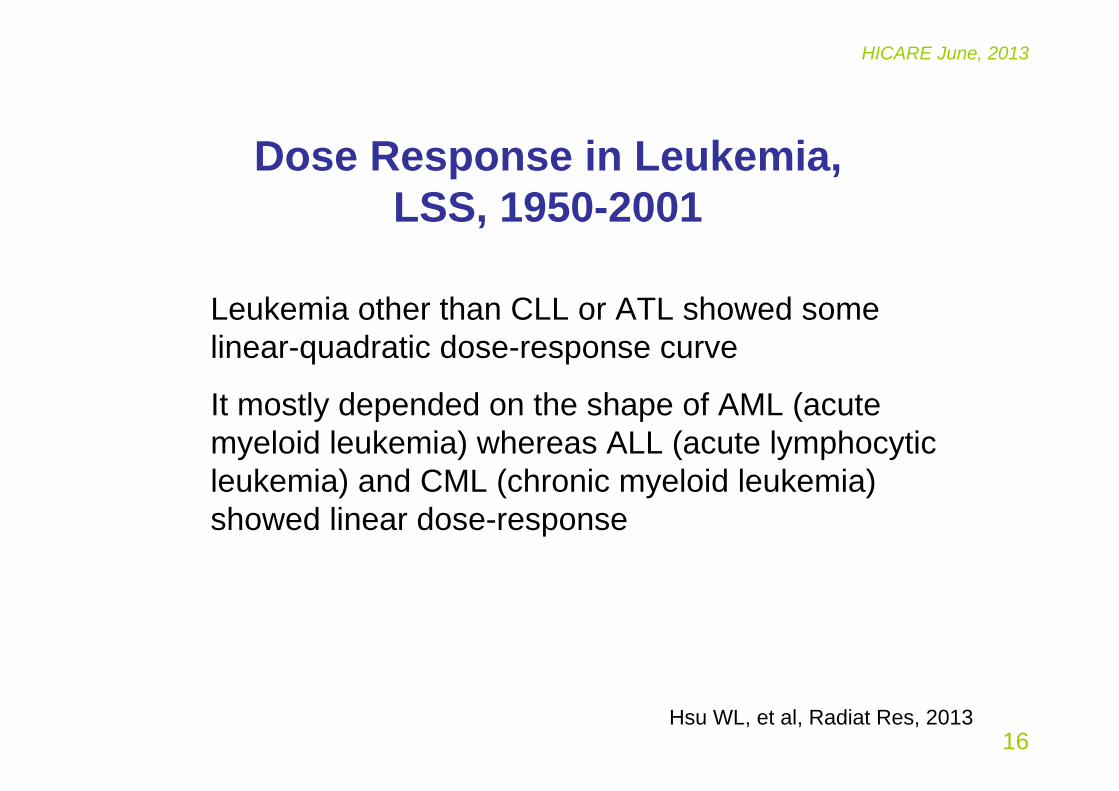
Dose Response in Leukemia, LSS, 1950-2001
Hsu WL, et al, Radiat Res, 2013
Leukemia other than CLL or ATL showed some linear-quadratic dose-response curve
It mostly depended on the shape of AML (acute myeloid leukemia) whereas ALL (acute lymphocytic leukemia) and CML (chronic myeloid leukemia) showed linear dose-response
17
HICARE June, 2013
Solid Cancer
18
HICARE June, 2013
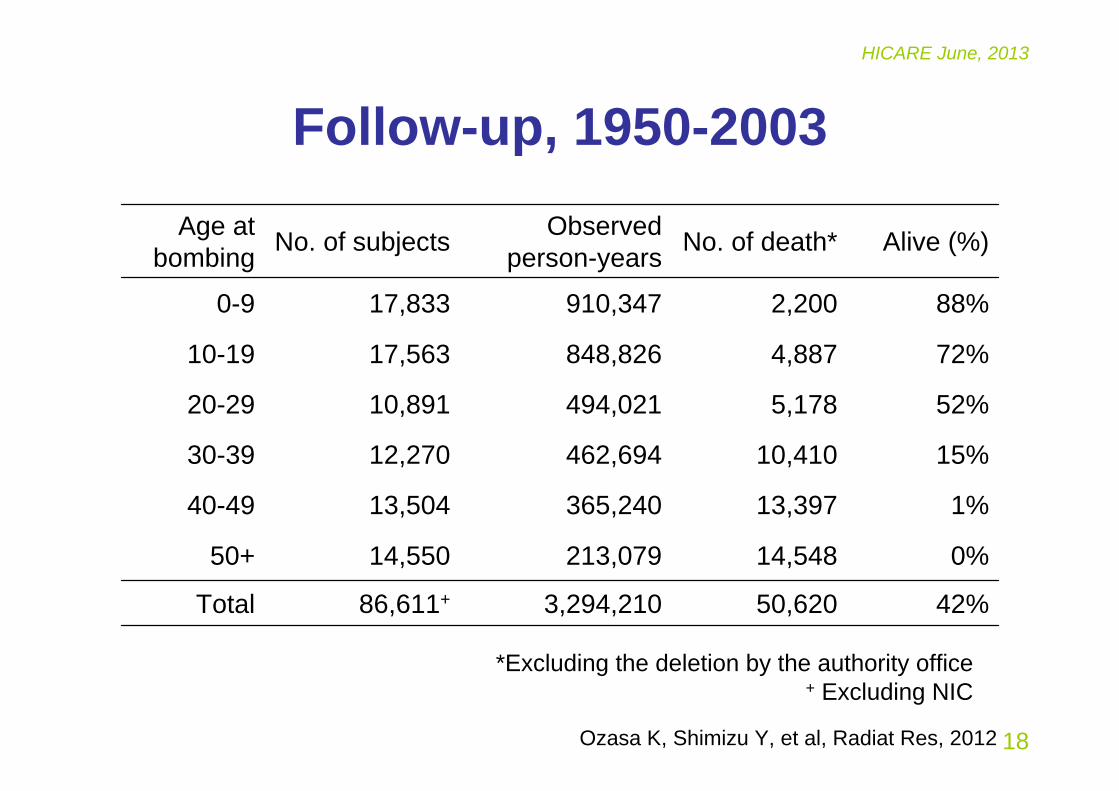
Follow-up, 1950-2003
42%50,620 3,294,210 86,611+Total
0%14,548 213,079 14,550 50+
1%13,397 365,240 13,504 40-49
15%10,410 462,694 12,270 30-39
52%5,178 494,021 10,891 20-29
72%4,887 848,826 17,563 10-19
88%2,200 910,347 17,833 0-9
Alive (%)No. of death*Observed person-yearsNo. of subjectsAge at
bombing
*Excluding the deletion by the authority office+ Excluding NIC
Ozasa K, Shimizu Y, et al, Radiat Res, 2012
19
HICARE June, 2013
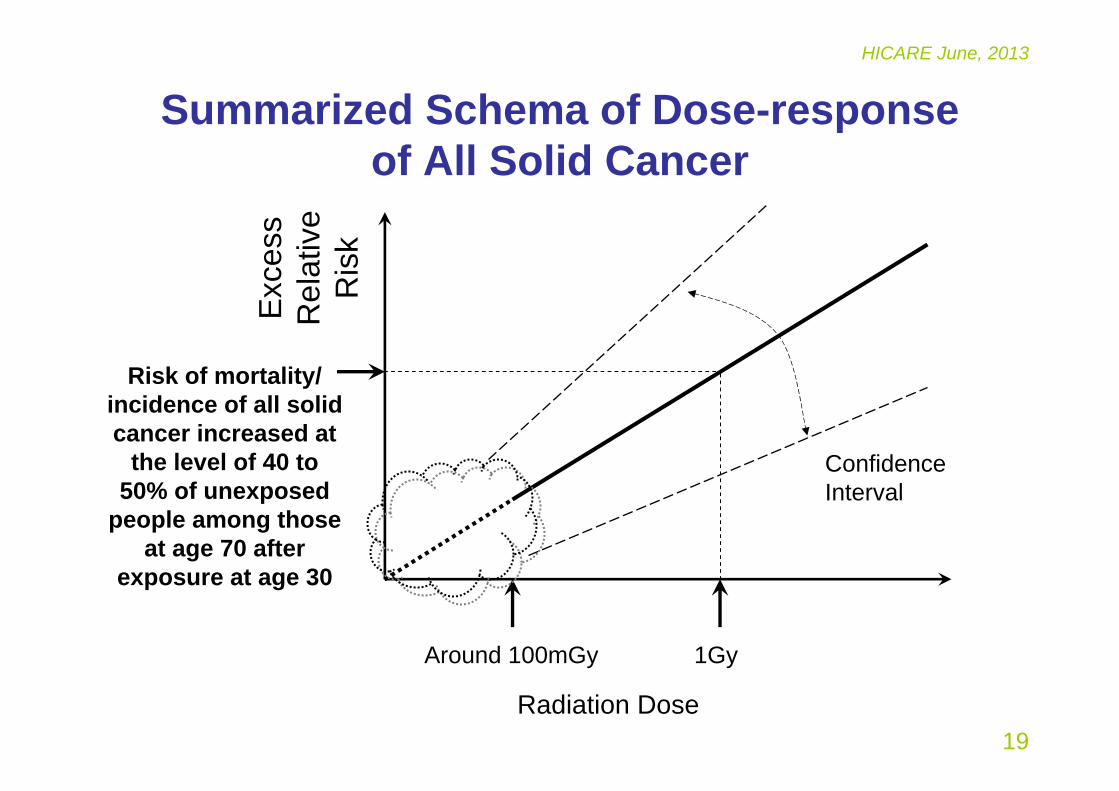
Summarized Schema of Dose-response of All Solid Cancer
Radiation Dose
Exc
ess
Rel
ativ
e R
isk
Around 100mGy 1Gy
Risk of mortality/ incidence of all solid cancer increased at
the level of 40 to 50% of unexposed
people among those at age 70 after
exposure at age 30
Confidence Interval
20
HICARE June, 2013
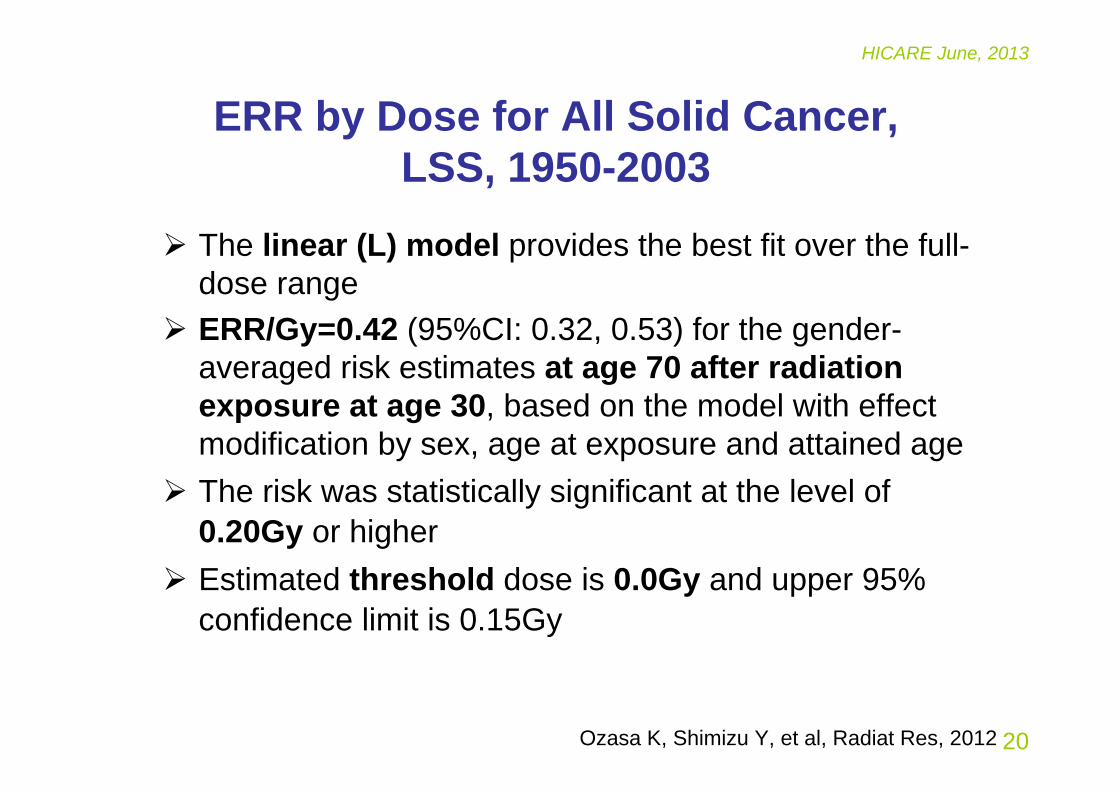
ERR by Dose for All Solid Cancer, LSS, 1950-2003
The linear (L) model provides the best fit over the full-dose range
ERR/Gy=0.42 (95%CI: 0.32, 0.53) for the gender-averaged risk estimates at age 70 after radiation exposure at age 30, based on the model with effect modification by sex, age at exposure and attained age
The risk was statistically significant at the level of 0.20Gy or higher
Estimated threshold dose is 0.0Gy and upper 95% confidence limit is 0.15Gy
Ozasa K, Shimizu Y, et al, Radiat Res, 2012
21
HICARE June, 2013
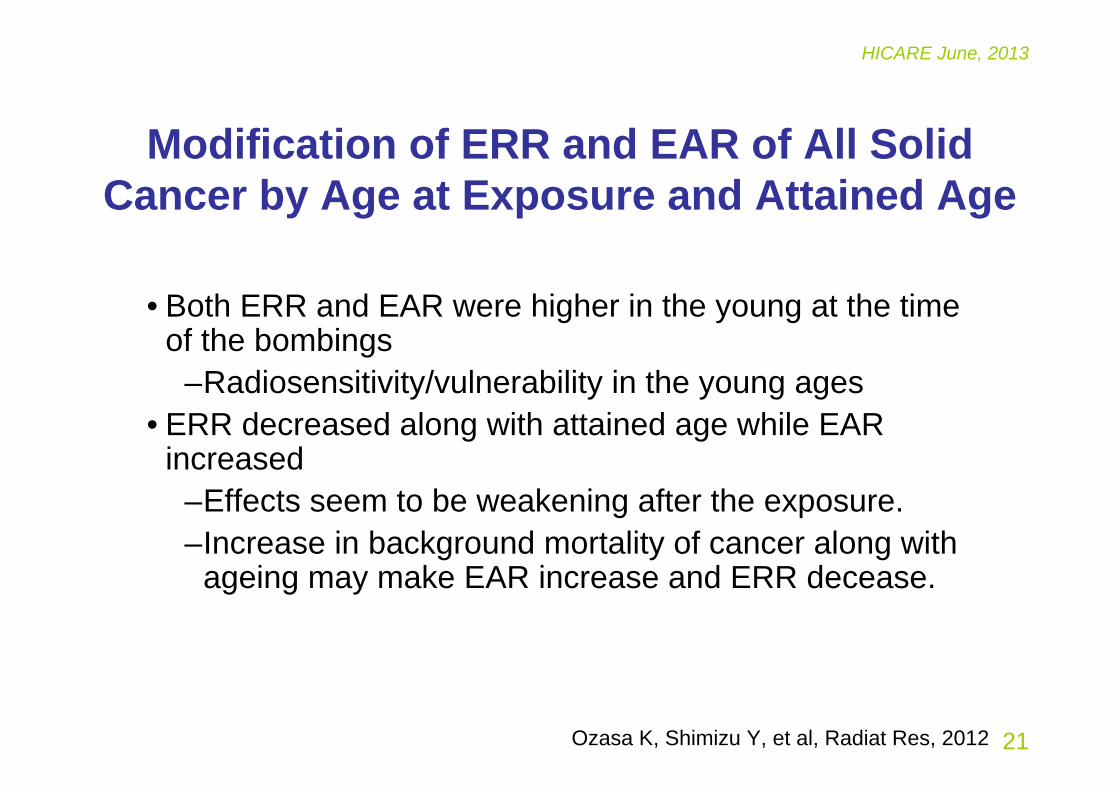
Modification of ERR and EAR of All Solid Cancer by Age at Exposure and Attained Age
Ozasa K, Shimizu Y, et al, Radiat Res, 2012
• Both ERR and EAR were higher in the young at the time of the bombings
–Radiosensitivity/vulnerability in the young ages• ERR decreased along with attained age while EAR
increased–Effects seem to be weakening after the exposure.–Increase in background mortality of cancer along with
ageing may make EAR increase and ERR decease.
22
HICARE June, 2013
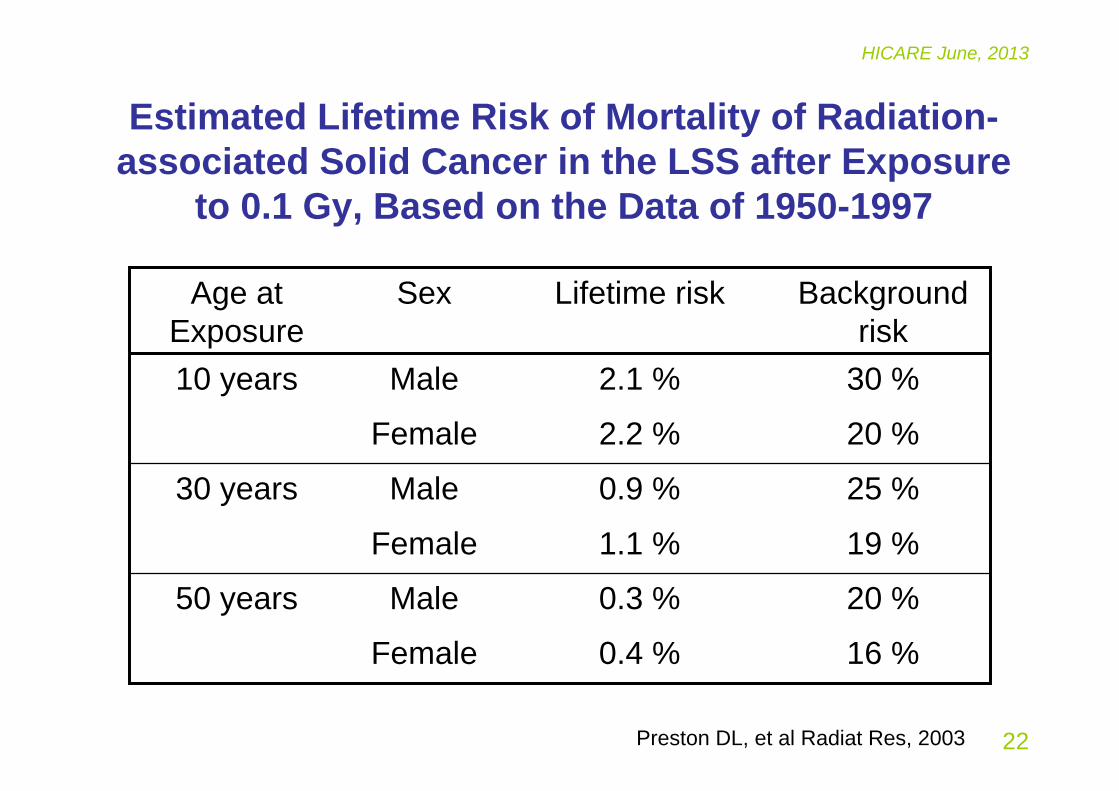
Estimated Lifetime Risk of Mortality of Radiation-associated Solid Cancer in the LSS after Exposure
to 0.1 Gy, Based on the Data of 1950-1997
16 %0.4 %Female
20 %0.3 %Male50 years
19 %1.1 %Female
25 %0.9 %Male30 years
20 %2.2 %Female
30 %2.1 %Male10 years
Background risk
Lifetime riskSexAge at Exposure
Preston DL, et al Radiat Res, 2003

23
HICARE June, 2013
Associations with Site-specific Cancers
• Observed association with radiation exposure
– Stomach, Lung, Liver, Colon, Breast, Gallbladder, Esophagus, Bladder (pelvis, ureter), Ovary, Thyroid, Skin, ...
• No observation of association with radiation exposure
– Pancreas, Rectum, Uterus, Prostate, Renal parenchyma
Preston DL, et al Radiat Res, 2007
24
HICARE June, 2013
Risk of Thyroid Cancer Incidence, 1958-2005
Furukawa K, et al. Int J Cancer, 2012
Risk of thyroid cancer was high (ERR/Gy= 1.28, 95%CI: 0.59, 2.70), especially in a young age at exposure
25
HICARE June, 2013
Interaction of Radiation and Smoking on Lung Cancer Risk, Incidence, 1958-99
Furukawa K, et al. Radiat Res, 2010
ERR at 1 Gy was 0.7 in non-smokers (cigarettes/day=0)ERR at 1 Gy showed a remarkable positive interaction with smoking in light smokers Almost no additional increase in risk by radiation in heavy smokers
26
HICARE June, 2013
Risk of Second Primary Cancer
Radiation risk of second primary cancer (SPC) was similar to that of first primary cancer (FPC) although the background rate of SPC among the carrier of FPC was higher than the rate of FPC in all subjects
Li CI, et al. Cancer Res, 2010
27
HICARE June, 2013
Risk of Noncancer Diseases
Ozasa K, Shimizu Y, et al, Radiat Res, 2012
28
HICARE June, 2013
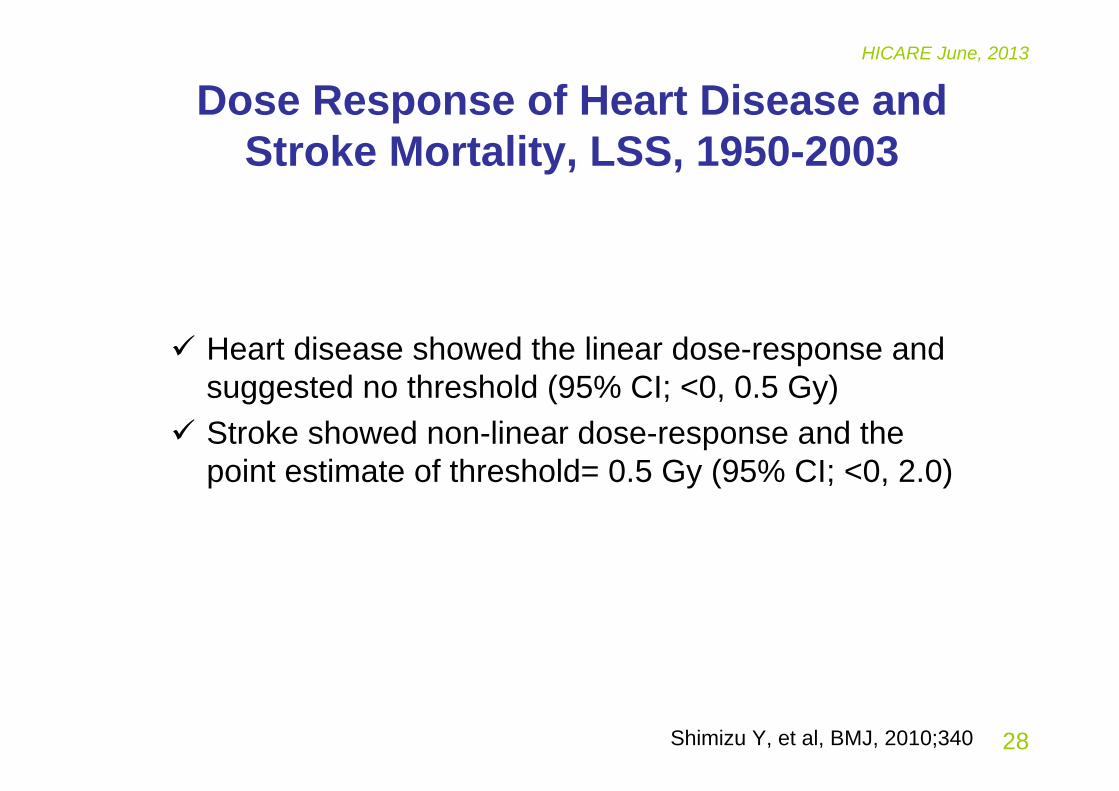
Dose Response of Heart Disease and Stroke Mortality, LSS, 1950-2003
Heart disease showed the linear dose-response and suggested no threshold (95% CI; <0, 0.5 Gy)
Stroke showed non-linear dose-response and the point estimate of threshold= 0.5 Gy (95% CI; <0, 2.0)
Shimizu Y, et al, BMJ, 2010;340
29
HICARE June, 2013
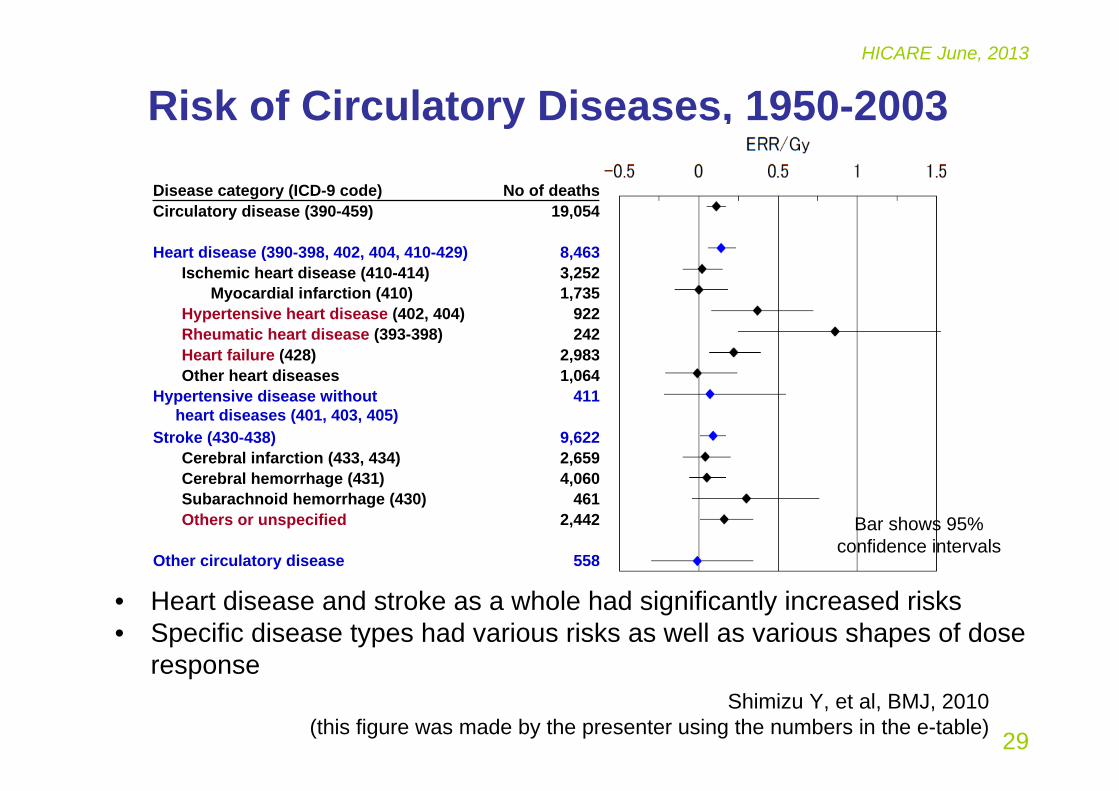
Risk of Circulatory Diseases, 1950-2003
No of deathsDisease category (ICD-9 code)
558Other circulatory disease
2,442Others or unspecified461Subarachnoid hemorrhage (430)
4,060Cerebral hemorrhage (431)2,659Cerebral infarction (433, 434)9,622Stroke (430-438)
411Hypertensive disease without heart diseases (401, 403, 405)
1,064Other heart diseases2,983Heart failure (428)
242Rheumatic heart disease (393-398)922Hypertensive heart disease (402, 404)
1,735Myocardial infarction (410)3,252Ischemic heart disease (410-414)8,463Heart disease (390-398, 402, 404, 410-429)
19,054Circulatory disease (390-459)
Shimizu Y, et al, BMJ, 2010(this figure was made by the presenter using the numbers in the e-table)
Bar shows 95% confidence intervals
• Heart disease and stroke as a whole had significantly increased risks• Specific disease types had various risks as well as various shapes of dose
response
30
HICARE June, 2013
Effects on In-utero Survivors
31
HICARE June, 2013
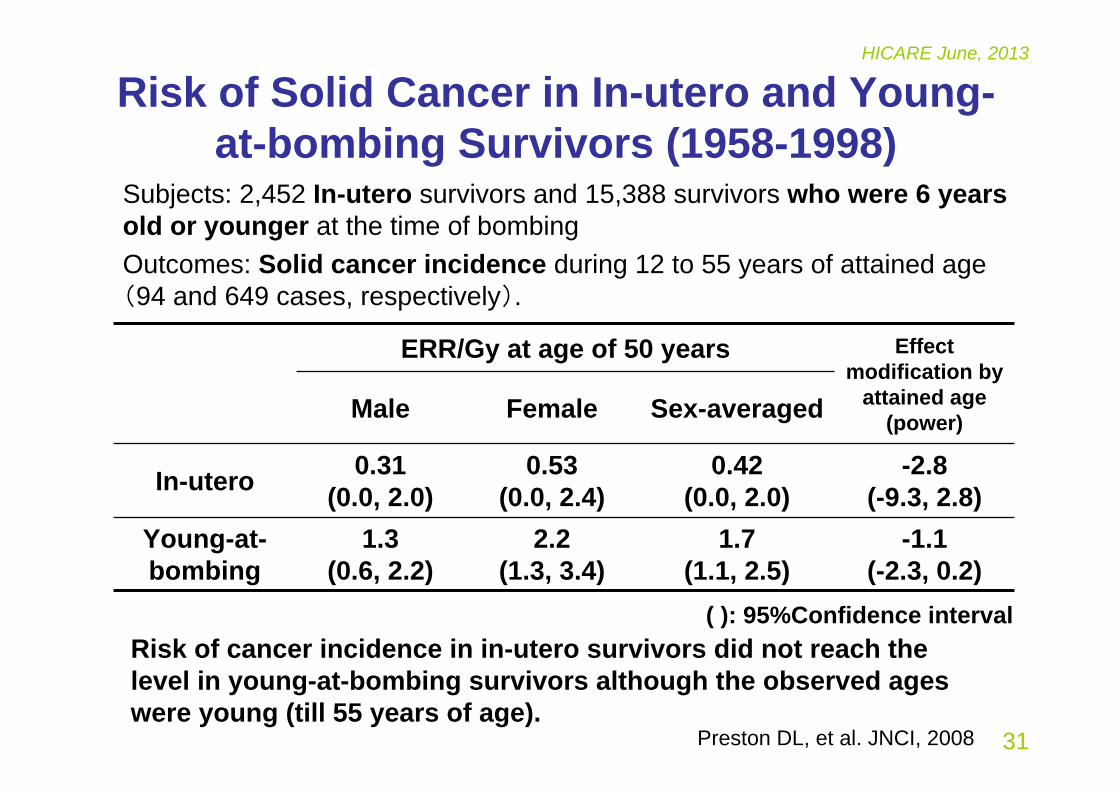
Risk of Solid Cancer in In-utero and Young-at-bombing Survivors (1958-1998)
-2.8(-9.3, 2.8)
0.42(0.0, 2.0)
0.53(0.0, 2.4)
0.31(0.0, 2.0)In-utero
Effect modification by
attained age (power)Sex-averagedFemaleMale
ERR/Gy at age of 50 years
-1.1(-2.3, 0.2)
1.7(1.1, 2.5)
2.2(1.3, 3.4)
1.3(0.6, 2.2)
Young-at-bombing
Preston DL, et al. JNCI, 2008
Subjects: 2,452 In-utero survivors and 15,388 survivors who were 6 years old or younger at the time of bombingOutcomes: Solid cancer incidence during 12 to 55 years of attained age (94 and 649 cases, respectively).
( ): 95%Confidence intervalRisk of cancer incidence in in-utero survivors did not reach the level in young-at-bombing survivors although the observed ages were young (till 55 years of age).
32
HICARE June, 2013
Effects on Children of Survivors

33
HICARE June, 2013
50- mGy5- 49mGy
0-4 mGy1-19 years
500+ mGy
20+ years
1-19 yearsAttained age
20+ years
Attained age
150- mGy
0-4 mGy
5-49 mGy0-4 mGy
Maternal dose500+ mGy150- mGy50- mGy5- 49mGy0-4 mGy
5-49 mGy
Paternal dose
All solid cancer Leukemia
No significant risks, but the age at end of follow-up was still young
Bar
indi
cate
s 95
% c
onfid
ence
inte
rval
50- mGy5- 49mGy
0-4 mGy1-19 years
500+ mGy
20+ years
1-19 yearsAttained age
20+ years
Attained age
150- mGy
0-4 mGy
5-49 mGy0-4 mGy
Maternal dose500+ mGy150- mGy50- mGy5- 49mGy0-4 mGy
5-49 mGy
Paternal dose
(The figure was made by the presenter using the numbers in the table) Izumi S, et al. Brit J Cancer, 2003
Relative Risk Relative Risk
Association of Parental Radiation Dose and Risk of Cancer Incidence in Children of Survivors
(Born in 1946-84, Followed-up in 1958-97)
34
HICARE June, 2013
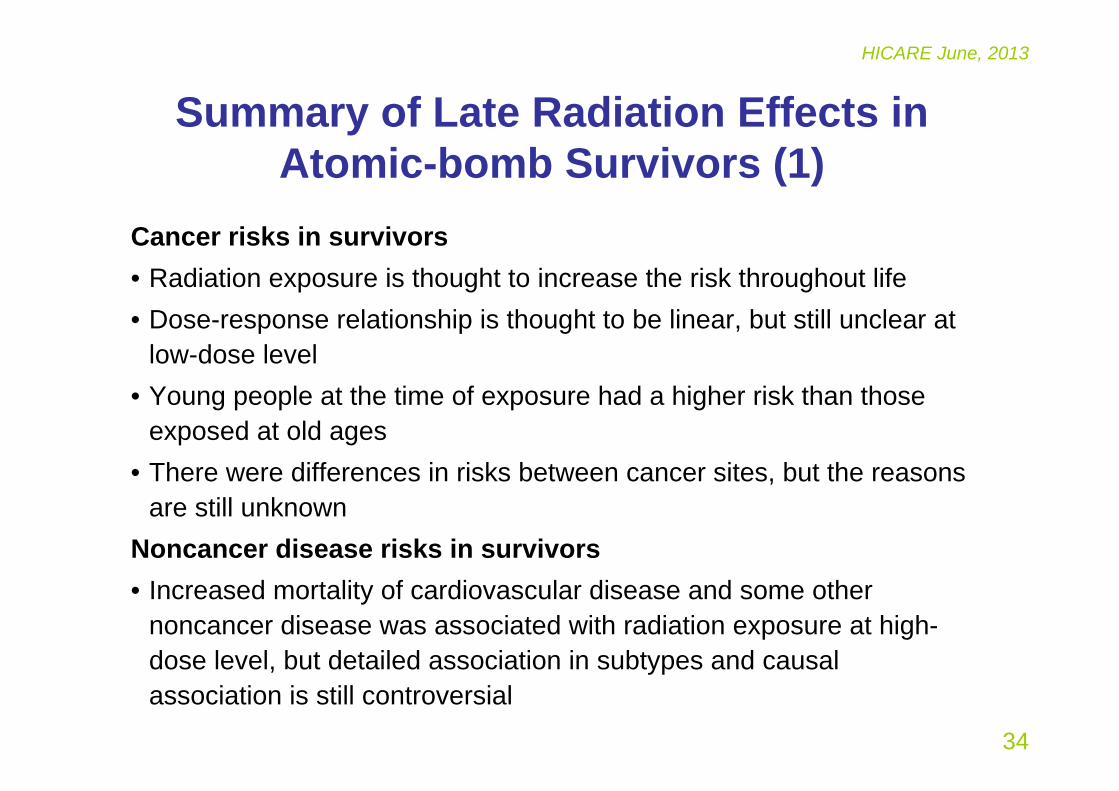
Summary of Late Radiation Effects in Atomic-bomb Survivors (1)
Cancer risks in survivors• Radiation exposure is thought to increase the risk throughout life• Dose-response relationship is thought to be linear, but still unclear at
low-dose level• Young people at the time of exposure had a higher risk than those
exposed at old ages• There were differences in risks between cancer sites, but the reasons
are still unknown Noncancer disease risks in survivors• Increased mortality of cardiovascular disease and some other
noncancer disease was associated with radiation exposure at high-dose level, but detailed association in subtypes and causal association is still controversial
35
HICARE June, 2013
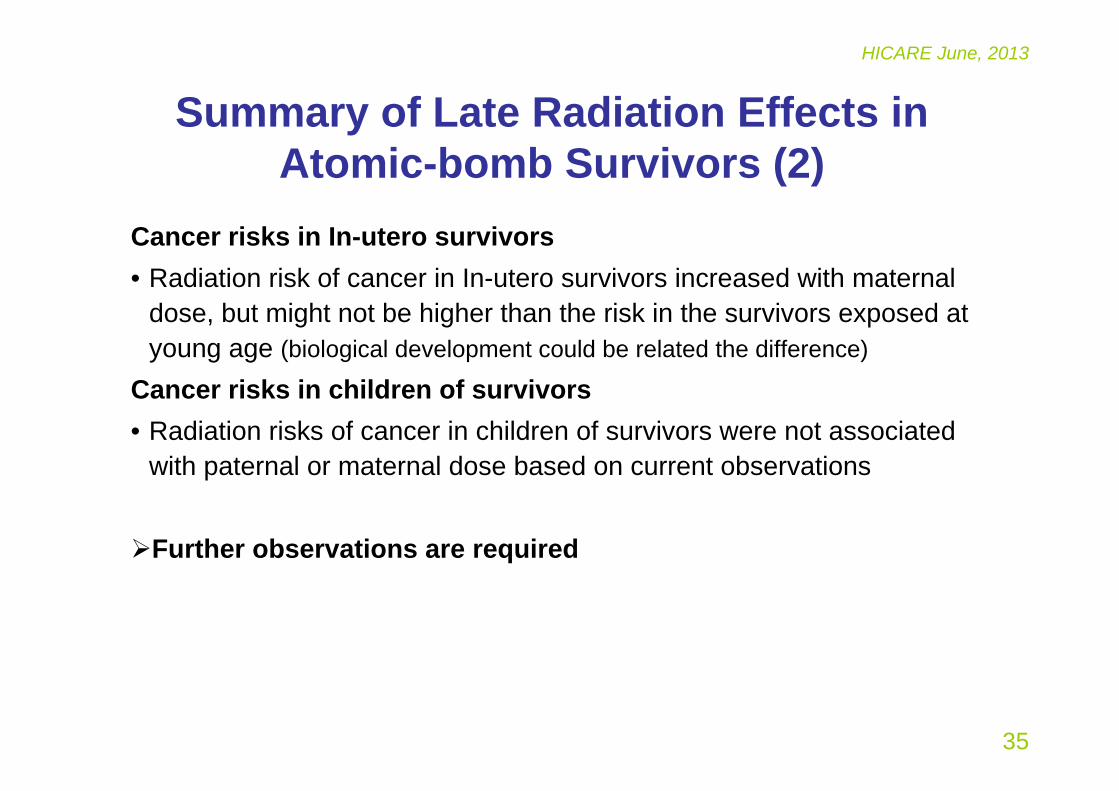
Summary of Late Radiation Effects in Atomic-bomb Survivors (2)
Cancer risks in In-utero survivors• Radiation risk of cancer in In-utero survivors increased with maternal
dose, but might not be higher than the risk in the survivors exposed at young age (biological development could be related the difference)
Cancer risks in children of survivors• Radiation risks of cancer in children of survivors were not associated
with paternal or maternal dose based on current observations
Further observations are required
36
HICARE June, 2013
References (1)RERF. http://www.rerf.jp/RERF. Basic Guide to Radiation and Health Sciences, http://www.rerf.jp/shared/
basicg/basicg_e.pdfRERF. Brief Description, http://www.rerf.jp/shared/briefdescript/briefdescript.pdfRERF. RERF’s Views on Residual Radiation,
http://www.rerf.or.jp/news/pdf/residualrad_ps_e.pdfRERF. Technical Report, 2-62, 7-67RERF. Basic Guide to Radiation and Health Science,
http://www.rerf.or.jp/shared/basicg/basicg_e.pdfYoung RW, Kerr GD, eds. Reassessment of the atomic bomb radiation dosimetry for
Hiroshima and Nagasaki—Dosimetry system 2002. Hiroshima, Japan: Radiation Effects Research Foundation; 2005
Cullings HM, et al. Dose estimation for atomic bomb survivor studies: Its evolution and present status. Radiat Res 166:219–54, 2006.
Ozasa K, et al. Studies of the mortality of atomic bomb survivors, Report 14, 1950-2003: An overview of cancer and noncancer diseases. Radiat Res 2012;177:229-243.
Preston DL, et al. Studies of mortality of atomic bomb survivors. Report 13: Solid cancer and noncancer disease mortality: 1950–1997. Radiat Res 2003;160: 381–407.

37
HICARE June, 2013
References (2)Preston DL, et al. Solid cancer incidence in atomic bomb survivors: 1958–1998. Radiat Res
2007;168:1–64.Richardson DB, et al. Ionizing radiation and leukemia mortality among Japanese atomic
bomb survivors, 1950–2000. Radiat Res 2009;172:368–382.Hsu WL, et al. The incidence of leukemia, lymphoma and multiple myeloma among atomic
bomb survivors: 1950–2001. Radiat Res 2013;179:361–382Furukawa K, et al. Long-term trend of thyroid cancer risk among Japanese atomic-bomb
survivors: 60 years after exposure. Int J Cancer, 2013;132:1222–6. Furukawa K, et al. Radiation and smoking effects on lung cancer incidence among atomic-
bomb survivors. Radiat Res 2010; 74:72-82.Li CI, et al. Relationship between radiation exposure and risk of second primary cancers
among atomic bomb survivors. Cancer Res, 2010;70:7187-98. Shimizu Y, et al. Radiation exposure and circulatory disease risk: Hiroshima and Nagasaki
atomic bomb survivor data, 1950-2003. Brit Med J 2010;340:b5349, doi:10.1136/bmj.b5349
Preston DL, et al. Solid cancer incidence in atomic bomb survivors exposed in utero or as young children. J Nat Cancer Inst, 2008;100:428-36.
Izumi S, et al. Cancer incidence in children and young adults did not increase relative to parental exposure to atomic bombs. Brit J Cancer, 2003; 89:1709-1713.