epigenome-wide association study (ewas) of bmi, bmi change
TRANSCRIPT
OR I G INA L ART I C L E
Epigenome-wide association study (EWAS) of BMI, BMIchange and waist circumference in African Americanadults identifies multiple replicated lociEllen W. Demerath1,*, Weihua Guan2, Megan L. Grove3, Stella Aslibekyan4,Michael Mendelson6,7,8, Yi-Hui Zhou9, Åsa K. Hedman10,11, Johanna K.Sandling11,12, Li-An Li20, Marguerite R. Irvin4, Degui Zhi5, PanosDeloukas12,13,14,Liming Liang6,7,15, Chunyu Liu7,16, Jan Bressler3, Tim D. Spector17, Kari North18,Yun Li21,22,23, Devin M. Absher19, Daniel Levy6,7, Donna K. Arnett4, MyriamFornage3,20, James S. Pankow1 and Eric Boerwinkle3,20
1Division of EpidemiologyandCommunityHealth, School of Public Health, University ofMinnesota,Minneapolis,MN 55454, USA, 2Division of Biostatistics, School of Public Health, University of Minnesota, Minneapolis, MN55454, USA, 3Human Genetics Center, School of Public Health, University of Texas Health Sciences Center atHouston, Houston, TX 77030, USA, 4Department of Epidemiology and 5Department of Biostatistics, School ofPublic Health, University of Alabama at Birmingham, Birmingham, AL 35294, USA, 6Population Sciences Branch,National Heart, Lung, and Blood Institute, National Institutes of Health, Bethesda, MD 20824, USA, 7FraminghamHeart Study, Framingham, MA 01702, USA, 8Department of Cardiology, Boston Children’s Hospital, Boston, MA02215, USA, 9Department of Statistics, North Carolina State University, Raleigh, NC 27695, USA, 10Wellcome TrustCentre for Human Genetics, University of Oxford, Oxford, UK, 11Department of Medical Sciences, MolecularMedicine and Science for Life Laboratory, Uppsala University, Uppsala, Sweden, 12Wellcome Trust SangerInstitute, Wellcome Trust Genome Campus, Hinxton, UK, 13William Harvey Research Institute, Barts and TheLondon School of Medicine and Dentistry, Queen Mary University of London, London, UK, 14Princess Al-JawharaAl-Brahim Centre of Excellence in Research of Hereditary Disorders (PACER-HD), King Abdulaziz University,Jeddah 21589, Saudi Arabia, 15Departments of Epidemiology and Biostatistics, School of Public Health, HarvardUniversity, Boston, MA 02115, USA, 16Department of Biostatistics, Boston University, Boston, MA 02118, USA,17Department of Twin Research and Genetic Epidemiology, King’s College London, London SE1 7EH, UK,18Department of Epidemiology, University of North Carolina at Chapel Hill, Chapel Hill, NC 27514, USA, 19HudsonAlpha Institute for Biotechnology, Huntsville, AL 34806, USA, 20Human Genome Sequencing Center, BaylorCollege of Medicine, Houston, TX 77030, USA, 21Department of Genetics, 22Department of Biostatistics and23Department of Computer Science, University of North Carolina, Chapel Hill, NC 27599, USA
*To whom correspondence should be addressed at: Division of Epidemiology and Community Health, School of Public Health, University of Minnesota,1300 S. Second Street, Suite 300, Minneapolis, MN 55454, USA. Tel: +1 6126248231; Fax: +1 6126240315; Email: [email protected]
Received: March 5, 2015. Revised: March 5, 2015. Accepted: April 13, 2015
© The Author 2015. Published by Oxford University Press. All rights reserved. For Permissions, please email: [email protected]
Human Molecular Genetics, 2015, Vol. 24, No. 15 4464–4479
doi: 10.1093/hmg/ddv161Advance Access Publication Date: 1 May 2015Original Article
4464
at Acquisition Services on June 24, 2016
http://hmg.oxfordjournals.org/
Dow
nloaded from

AbstractObesity is an important component of the pathophysiology of chronic diseases. Identifying epigenetic modifications associatedwith elevated adiposity, includingDNAmethylation variation,may point to genomicpathways that are dysregulated innumerousconditions. The Illumina 450K Bead Chip array was used to assay DNAmethylation in leukocyte DNA obtained from 2097 AfricanAmerican adults in the Atherosclerosis Risk in Communities (ARIC) study. Mixed-effects regressionmodels were used to test theassociation of methylation beta value with concurrent body mass index (BMI) and waist circumference (WC), and BMI change,adjusting for batch effects and potential confounders. Replication using whole-blood DNA from 2377 White adults in theFraminghamHeart Study and CD4+ T cell DNA from 991Whites in the Genetics of Lipid Lowering Drugs and Diet Network Studywas followed by testing using adipose tissue DNA from 648 women in the Multiple Tissue Human Expression Resource cohort.Seventy-six BMI-related probes, 164 WC-related probes and 8 BMI change-related probes passed the threshold for significance inARIC (P < 1 × 10⁻⁷; Bonferroni), including probes in the recently reportedHIF3A, CPT1A andABCG1 regions. Replication using bloodDNAwas achieved for 37 BMI probes and 1 additional WC probe. Sixteen of these also replicated in adipose tissue, including15 novel methylation findings near genes involved in lipid metabolism, immune response/cytokine signaling and other diversepathways, including LGALS3BP, KDM2B, PBX1 and BBS2, among others. Adiposity traits are associated with DNA methylation atnumerous CpG sites that replicate across studies despite variation in tissue type, ethnicity and analytic approaches.
IntroductionEpigenetics is the study of mitotically heritable modifications inchromatin structure not involving the underlying DNA sequence,and their impact on the transcriptional control of genes and cel-lular function. Of the different forms of epigenetic modification,DNA methylation is the most extensively studied and involvesthe addition and removal of methyl (-CH3) groups at CpG dinu-cleotides to influence regional DNA transcription (1). Althoughgenome-wide demethylation and re-methylation occur duringembryogenesis and established patterns must be set to initiatedifferentiation and maintain cell type-specific gene expression(2), DNA methylation and other features of the epigenome arealso modifiable throughout the life course by environmentaland behavioral exposures such as the nutrient content of thematernal diet (3), cigarette smoking (4) and environmentalpollutants (5). Because of their role in gene expression, alterationsin epigenetic patterns are amechanism bywhich these and otherenvironmental factors may increase risk of disease (6,7).
As individuals accrue excess adipose tissue, they experiencechronic low-grade inflammation, associatedwith immunologicalactivation and oxidative stress (8,9), as well as insulin resistance,hypertension and dyslipidemia (10). These features explain, inpart, why obesity is among the strongest modifiable risk factorsfor diabetes, atherosclerosis and some cancers (11–19). In an epi-genetic framework, obesity can be seen as an environmentalfactor that exposes the genome in many tissues to a suite ofsystemic factors [e.g. elevated circulating C-reactive protein,interleukin (IL) 6], potentially altering DNA methylation or his-tone protein acetylation patterns. Identifying epigenetic modifi-cations associated with obesity may therefore point to genomicpathways that are dysregulated in numerous conditions.
As of 2015, only a small number of studies had been publishedshowing obesity-related variation in DNA methylation, withmost studies generally using either targeted repeat sequence(global methylation) or candidate gene-centric approaches.With some exceptions (20,21), such studies have not yielded re-sults that have been replicated in independent cohorts (reviewedby Drong et al.) (7). Recent technological advances have providedplatforms for systematically interrogating DNAmethylation vari-ation across the genome (22), paving theway for epigenome-wideassociation studies (EWASs), analogous to genome-wide associ-ation studies, to identify regions of the genome-harboring DNAmethylation variation associated with disease phenotypes (6).
EWASs of obesity traits have shown that methylation variantsare influenced by nearby genetic variants (i.e. are haplotypespecific) as in the case of the well-documented obesity geneFTO (23–26). To date, only one obesity EWAS has yielded a novelreplicated locus (CpG sites in HIF3A) (27), and only one obesityEWAS has been conducted in African Americans (25), despitethe fact that African-ancestry groups tend to carry higher chronicdisease risk factor loads, including greater obesity, comparedwith European-ancestry populations (28–30).
The goal of the present investigation is to advance our under-standing of the methylation signatures associated with obesitytraits using leukocyte DNA samples from over 2000 AfricanAmerican adults, many of whom were overweight or obese atthe time of DNA collection, with replication in three independentcohorts. Our findings replicate those from recent EWAS of bodymass index (BMI), lipid and diabetes-related traits and identifya number of novel associations with BMI, waist circumference(WC) and BMI change. The results are a step toward understand-ing the pathophysiology of obesity and identifying new molecu-lar targets to avert its negative health consequences.
ResultsDescription of discovery sample
The ARIC Study is a prospective cohort study of cardiovasculardisease risk in White and Black adults from four US communi-ties (31). Subjects were seen at baseline (Visit 1) in 1987–1989,with four follow-up visits (Visits 2–5) thereafter. The study sam-ple for the present investigation (N = 2097; 64% female) includesonly those with methylation data (all of whom are AfricanAmerican). Average age was 56 years at the time of Visit 2when DNA methylation data and adiposity measures wereboth available. Subjects had mean BMI, WC and BMI change of30.1 kg/m2, 101.3 cm and 7.0 kg/m2 (6.0), respectively. Most ofthe subjects were overweight (37%) or obese (44%) and 67%exceeded National Heart, Lung, and Blood Institute (NHLBI)-recommended WC limits (>88 cm for women and >102 cm formen). Prevalent diabetes was present in 26% of the participants.Imputed white blood cell (WBC) count differentials wereobtained for all subjects, and the mean proportions of eachcell type aswell as other study covariates are provided inTable 1.A flowchart (Fig. 1) outlines the results of the subsequent ana-lyses, detailed later.
Human Molecular Genetics, 2015, Vol. 24, No. 15 | 4465
at Acquisition Services on June 24, 2016
http://hmg.oxfordjournals.org/
Dow
nloaded from

Gene pathway analysis
To test the global hypothesis that there are significant associa-tions of adiposity traits with methylation variation, we con-ducted a genome-wide gene ontology (GO) pathway analysis forBMI andWC including all CpGs, using the same statisticalmodelsas in the subsequent EWAS. The approach accounted for the de-gree of clustering of probes included in the HM450 in particulargenes and gene regions. Results yielded significant [false discov-ery rate (FDR)-adjusted q-value < 0.05] enrichment of over 100biological process pathways for BMI and 90 biological processpathways for WC (Supplementary Material, Tables S1 and S2),
involving 11–204 genes per pathway. These pathways representa diverse range of processes, particularly related to neuronalfunction (e.g. neuronmigration andneuroblast proliferation), im-mune response/cytokine signaling (e.g. humoral immune re-sponse and positive regulation of IL-6 production) and energyand fatty acid metabolism [e.g. tricarboxylic acid (Krebs’) cycleand arachidonic acid secretion].
Association study
Manhattan plots showing the −log10 P-values for individual auto-somal CpG probe associations for BMI and WC are provided in
Table 1. Characteristics of the study sample: N = 2097 African American adults in the ARIC study
Mean (SD) Range N
Age (years) 56.2 (5.7) 47–70 2097BMI (kg/m2) 30.1 (6.1) 14.7–62.4 2096WC (cm) 101.3 (15.1) 61–163 2097BMI change (kg/m2) 7.0 (6.0) −25.9–36.4 2039Physical activity (scale of 1–5)a 2.1 (0.6) 1–4.25 2097WBC count (1000/mm3) 5.6 (1.9) 2.0–28.8 2097
N (proportion)SexMale 763 (0.36) 2097Female 1334 (0.64)
Field centerForsyth County, NC 157 (0.07) 2097Jackson, MS 1940 (0.93)
BMI statusb
Underweight (BMI < 18.5 kg/m2) 19 (0.01) 2095Normal weight (BMI 18.5–24.99 kg/m2) 369 (0.18)Overweight (BMI 25.0–29.99 kg/m2) 789 (0.37)Obese (≥30.0 kg/m2) 918 (0.44)
WC statusb
Normal 698 (0.33) 2097Elevated 1399 (0.67)
Cigarette smokingCurrent smoker 512 (0.24) 2097Current nonsmoker 1585 (0.76)
Alcohol useCurrent drinker 717 (0.34) 2097Current nondrinker 1380 (0.66)
Education<High school 843 (0.40) 2097High school graduate 581 (0.28)>High school 673 (0.32)
Household income<$16 000 1087 (0.52) 2097$16 000–$24 999 379 (0.18)$25 000–$34 999 278 (0.13)$35 000–$49 999 202 (0.10)>$50 000 151 (0.07)
Differential WBC proportionsc
Neutrophils 0.56 2097Lymphocytes 0.36Monocytes 0.05Eosinophils 0.03
Diabetes statusd
No 1539 (0.74) 2087Yes 548 (0.26)
aSelf-reported leisure time physical activity using the Baecke Questionnaire at Visit 1.bBMI status: underweight (BMI <18.5 kg/m2), normal weight (BMI 18.5–24.99 kg/m2), overweight (BMI 25.0–29.99 kg/m2) and obese (≥30.0 kg/m2). WC status: low risk
(WC ≤88 cm for women and ≤102 cm for men) and high risk (WC >88 cm for women and >102 cm for men).cDifferential WBC proportions were imputed using the method of Houseman et al. (32) using measured differentials from a subset of 179 ARIC subjects as the reference.dPrevalent diabetes at the time of the DNA collection was defined as a self-reported physician diagnosis of or treatment for diabetes.
4466 | Human Molecular Genetics, 2015, Vol. 24, No. 15
at Acquisition Services on June 24, 2016
http://hmg.oxfordjournals.org/
Dow
nloaded from

Figure 2. A total of 76 probes passed the threshold for genome-wide significance for BMI, and 164 probes passed this thresholdfor WC. For BMI change, eight probes passed this threshold, allof which were also among the statistically significant BMIand/or WC probes (P < 1 × 10⁻⁷) (Supplementary Material,Table S3), including cg15871086 (Chr. 18 intergenic, P = 8.77E −10), cg09554443 (near CD247, P = 2.68E − -09), cg00574958 [nearcarnitine palmitoyltransferase-1A (CPT1A), P = 4.30E − 08] and
cg16672562 [near hypoxia-inducible factor 3 (HIF3A), P = 8.60E −08]. CPT1A methylation probe associations have been recentlyreported to be associated with atherogenic lipoprotein subfrac-tions in the Genetics of Lipid Lowering Drugs and Diet Network(GOLDN) cohort (33). Methylation at cg16672562 near HIF3Awasrecently reported to be associated with BMI in ∼2500 Europeanadults in the Cardiogenetics Consortium, MARseille THrombosisAssociation and Cooperative Health Research in the Region of
Figure 1. Flowchart of experiments and summary of results.
Figure 2. Manhattan plot of CpG methylation association −log10 P-values in 2107 African American adults in the ARIC study. (A) BMI and (B) WC.
Human Molecular Genetics, 2015, Vol. 24, No. 15 | 4467
at Acquisition Services on June 24, 2016
http://hmg.oxfordjournals.org/
Dow
nloaded from
Augsburg cohorts (27). BMI change associations arenot discussedin further detail due to their complete overlap with BMI and WCresults.
Regression coefficients, standard errors, P-values and CpGmarker information for the significant associations for BMI andWC in the ARIC discovery sample are provided in SupplementaryMaterial, Tables S4 and S5, respectively. For BMI, the top CpG(cg06500161, P = 1.52E − 13) explained ∼2.6% of variation in BMIand is located in a CpG island shore in the gene body of ABCG1[ATP-binding cassette, subfamily G (WHITE), member 1]. Thisgene is expressed in blood plasma and platelets and is involvedinmacrophage cholesterol and phospholipids transport, and cel-lular regulation of lipid homeostasis (34).ABCG1 promoter hyper-methylation is strongly associated with coronary heart disease(CHD) (35), and this particular CpG was also associated withinsulin-related traits in the GOLDN cohort (33). A second CpGsite near ABCG1 also was among the top results (cg27243685, P =3.61E − 08). The two CpGs are ∼14 kb distant from one another;their mean methylation beta values were significantly differentfrom one another (mean beta value for cg006500161 = 0.62;mean beta value for cg27243685 = 0.85; unpaired t-test P-value <0.0001) and weremoderately inter-correlated (r = 0.32; P < 0.0001).Other loci exhibiting two ormore significant CpG associations in-cluded the smoking-relatedmethylation locus AHRR (cg23576855and cg05575921),HIF3A (cg27146050, cg22891070 and cg16672562)with the same three CpG sites previously reported by Dick et al.(27) to be associatedwith BMI, the innate immune response regu-lator NFKBIL1 (cg21053741 and cg21587837), the histone H3 de-methylase KDM2B (cg15695155, cg26995224 and cg13708645),the natural killer immune response gene LGALS3BP (cg04927537and cg25178683) and NWD1 of unknown function (cg15845821and cg19344626). Conditional regression models (which requiredswitching BMI to the dependent variable) were run for loci with>1 CpG association and showed no evidence for multiple inde-pendent signals within these loci. After ABCG1 and AHRR, thethird-ranked CpG association was near the CD247 gene, involvedin T-cell receptor signaling, immune response and IL-12-inducedinterferon gamma (IFNγ) production. As a note, it is likely that theobserved CpG associations near AHRR were the result of residualconfounding; our EWAS was conducted using smoking coded ascurrent/noncurrent, andwhenwe further adjusted the results forformer smoking and total pack years of smoking, the associa-tions with BMIwere greatly attenuated and no longer statisticallysignificant (data not shown).
There was considerable overlap between results for BMI andWC; 56 of the BMI associations (74%) were also significant forWC and the top CpG was the same for both traits (cg06500161near ABCG1, P for WC = 4.41E − 19). This CHD-associated markerexplained ∼3.6% of variation in WC. The second-ranked probein the WC analysis was cg00574958 (P = 5.79E − 17) near CPT1A,also mentioned earlier. Additional high-ranking probes inour WC EWAS included a site near LY6G6E (cg13123009, P = 1.8 ×10⁻¹³), which belongs to a cluster of leukocyte antigen-6 (LY6)genes located in the major histocompatibility complex (MHC)class III region on chromosome 6, and C7orf50, a longevity locus(36). It is generally noted that probes passing the threshold forsignificance for BMI and WC in ARIC explained 0.2–3.6% traitvariance, included CpG sites across the spectrum of averagemethylation values (minimum 0.04 to maximum 0.95 meanmethylation) and had intra-class correlation (ICC) coefficient va-lues for replicates of >0.35 (Supplementary Material, Tables S4and S5). Most CpG markers had ICC > 0.60, suggesting higherprobe reliability/quality as measured by ICC increases the prob-ability of detecting association.
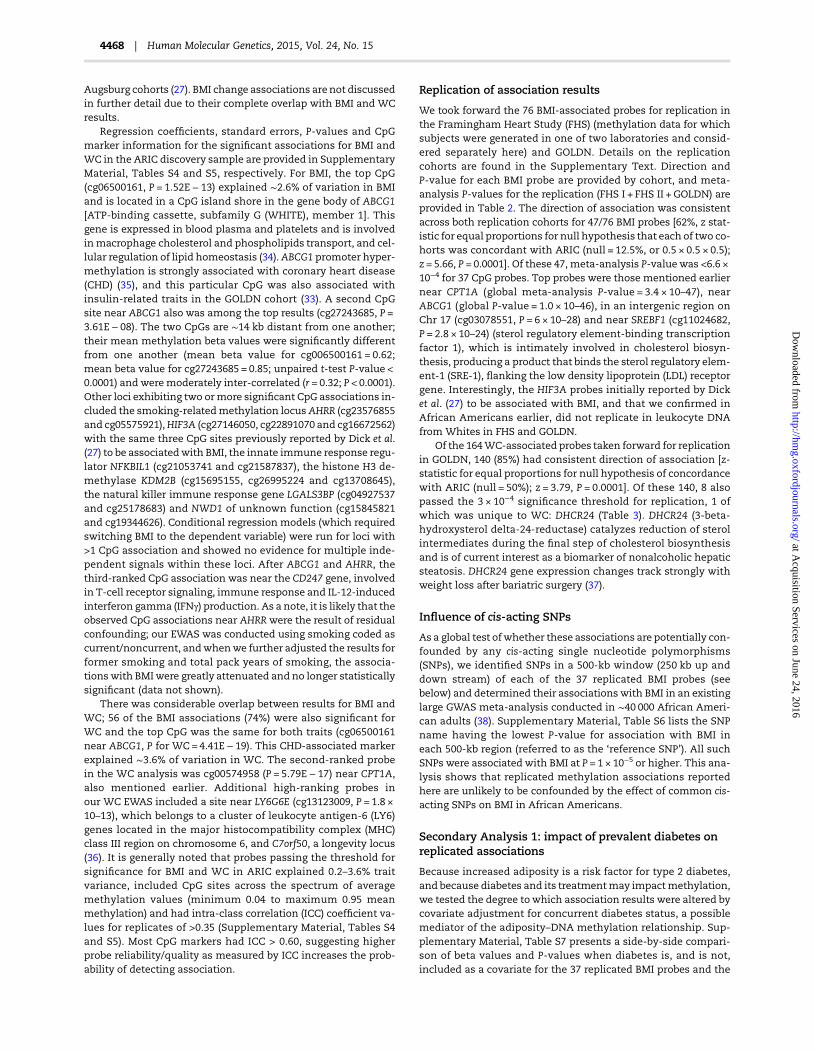
Replication of association results
We took forward the 76 BMI-associated probes for replication inthe Framingham Heart Study (FHS) (methylation data for whichsubjects were generated in one of two laboratories and consid-ered separately here) and GOLDN. Details on the replicationcohorts are found in the Supplementary Text. Direction andP-value for each BMI probe are provided by cohort, and meta-analysis P-values for the replication (FHS I + FHS II + GOLDN) areprovided in Table 2. The direction of association was consistentacross both replication cohorts for 47/76 BMI probes [62%, z stat-istic for equal proportions for null hypothesis that each of two co-horts was concordant with ARIC (null = 12.5%, or 0.5 × 0.5 × 0.5);z = 5.66, P = 0.0001]. Of these 47, meta-analysis P-value was <6.6 ×10⁻⁴ for 37 CpG probes. Top probes were those mentioned earliernear CPT1A (global meta-analysis P-value = 3.4 × 10–47), nearABCG1 (global P-value = 1.0 × 10–46), in an intergenic region onChr 17 (cg03078551, P = 6 × 10–28) and near SREBF1 (cg11024682,P = 2.8 × 10⁻²⁴) (sterol regulatory element-binding transcriptionfactor 1), which is intimately involved in cholesterol biosyn-thesis, producing a product that binds the sterol regulatory elem-ent-1 (SRE-1), flanking the low density lipoprotein (LDL) receptorgene. Interestingly, the HIF3A probes initially reported by Dicket al. (27) to be associated with BMI, and that we confirmed inAfrican Americans earlier, did not replicate in leukocyte DNAfrom Whites in FHS and GOLDN.
Of the 164WC-associated probes taken forward for replicationin GOLDN, 140 (85%) had consistent direction of association [z-statistic for equal proportions for null hypothesis of concordancewith ARIC (null = 50%); z = 3.79, P = 0.0001]. Of these 140, 8 alsopassed the 3 × 10⁻⁴ significance threshold for replication, 1 ofwhich was unique to WC: DHCR24 (Table 3). DHCR24 (3-beta-hydroxysterol delta-24-reductase) catalyzes reduction of sterolintermediates during the final step of cholesterol biosynthesisand is of current interest as a biomarker of nonalcoholic hepaticsteatosis. DHCR24 gene expression changes track strongly withweight loss after bariatric surgery (37).
Influence of cis-acting SNPs
As a global test ofwhether these associations are potentially con-founded by any cis-acting single nucleotide polymorphisms(SNPs), we identified SNPs in a 500-kb window (250 kb up anddown stream) of each of the 37 replicated BMI probes (seebelow) and determined their associations with BMI in an existinglarge GWAS meta-analysis conducted in ∼40 000 African Ameri-can adults (38). Supplementary Material, Table S6 lists the SNPname having the lowest P-value for association with BMI ineach 500-kb region (referred to as the ‘reference SNP’). All suchSNPs were associated with BMI at P = 1 × 10⁻⁵ or higher. This ana-lysis shows that replicated methylation associations reportedhere are unlikely to be confounded by the effect of common cis-acting SNPs on BMI in African Americans.
Secondary Analysis 1: impact of prevalent diabetes onreplicated associations
Because increased adiposity is a risk factor for type 2 diabetes,and because diabetes and its treatmentmay impactmethylation,we tested the degree to which association results were altered bycovariate adjustment for concurrent diabetes status, a possiblemediator of the adiposity–DNA methylation relationship. Sup-plementary Material, Table S7 presents a side-by-side compari-son of beta values and P-values when diabetes is, and is not,included as a covariate for the 37 replicated BMI probes and the
4468 | Human Molecular Genetics, 2015, Vol. 24, No. 15
at Acquisition Services on June 24, 2016
http://hmg.oxfordjournals.org/
Dow
nloaded from

Table 2. Replicationa of BMI–DNA methylation associations in the FHS (Cohorts I and II) and GOLDN cohorts, in order of meta-analysis P-value
CpGmarker
CHR Closestgene
ARIC (discovery cohort)analysis
Replication meta-analysis(FHS I + FHS II + GOLDN)
Discovery + replication cohort meta-analysis
ARICregressioncoefficient
ARICP-value
Replicationz statistic
ReplicationP-value
Direction SummaryP-value
HetISq HetChiSq HetPVal
cg00574958 11 CPT1A −0.0029 3.23E− 12 −12.881 5.77E− 38 −−−− 3.44E− 47 55.9 6.801 0.0785cg06500161 21 ABCG1 0.0081 1.52E− 13 12.456 1.29E− 35 ++++ 1.01E− 46 77.8 13.543 0.0036cg03078551 17 NA −0.0026 7.49E− 09 −9.399 5.52E− 21 −−−− 6.03E− 28 1.4 3.042 0.3851cg11024682 17 SREBF1 0.0068 9.58E− 09 8.424 3.63E− 17 ++++ 2.76E− 24 55.6 6.755 0.0801cg13123009 6 LY6G6E;
LY6G6D0.0069 1.80E− 11 6.894 5.41E− 12 ++++ 1.01E− 21 0 1.657 0.6466
cg04927537 17 LGALS3BP 0.0108 5.91E− 10 7.17 7.48E− 13 ++++ 2.93E− 21 0 2.45 0.4845cg27243685 21 ABCG1 0.0057 3.61E− 08 7.661 1.85E− 14 ++++ 4.23E− 21 61.3 7.747 0.0515cg26403843 5 RNF145 0.0099 1.06E− 08 6.934 4.09E− 12 ++++ 2.51E− 19 0 0.567 0.9040cg09349128 22 NA −0.0059 1.44E− 08 −6.92 4.51E− 12 −−−− 3.76E− 19 0 0.507 0.9173cg07814318 15 KLF13 0.0081 2.33E− 10 5.896 3.73E− 09 ++++ 1.19E− 17 73.8 11.445 0.0095cg07573872 19 SBNO2 −0.0069 2.80E− 08 −6.377 1.80E− 10 −−−− 3.00E− 17 0 0.683 0.8771cg13708645 12 KDM2B 0.0096 4.68E− 10 5.74 9.48E− 09 ++++ 6.03E− 17 60.7 7.631 0.0543cg25178683 17 LGALS3BP 0.0087 1.67E− 08 6.138 8.36E− 10 ++++ 9.25E− 17 0 0.869 0.8328cg12992827 3 NA −0.0075 5.31E− 09 −5.939 2.87E− 09 −−−− 1.25E− 16 47.3 5.693 0.1275cg09664445 17 KIAA0664 0.0055 8.89E− 09 5.93 3.03E− 09 ++++ 2.08E− 16 65.4 8.672 0.0340cg06876354 2 RALB 0.0057 1.02E− 09 5.62 1.91E− 08 ++++ 2.53E− 16 39 4.916 0.1780cg23998749 1 NA 0.0052 5.66E− 08 5.92 3.22E− 09 ++++ 1.14E− 15 40.4 5.035 0.1692cg06192883 15 MYO5C 0.0065 5.29E− 08 5.791 7.01E− 09 ++++ 2.45E− 15 0 0.979 0.8062cg26033520 10 NA 0.0070 1.44E− 08 5.578 2.43E− 08 ++++ 3.01E− 15 0 1.065 0.7856cg07136133 11 PRR5L −0.0048 6.70E− 09 −5.36 8.34E− 08 −−−− 6.24E− 15 0 1.871 0.5996cg08972190 7 MAD1L1 0.0054 6.43E− 10 5.054 4.33E− 07 ++++ 6.42E− 15 27.7 4.149 0.2458cg06946797 16 NA −0.0070 8.35E− 09 −5.131 2.88E− 07 −−−− 3.04E− 14 17.2 3.622 0.3052cg18568872 15 ZNF710 0.0062 3.74E− 10 4.709 2.49E− 06 ++++ 3.54E− 14 66.8 9.04 0.0288cg15871086 18 NA 0.0062 8.31E− 11 4.354 1.34E− 05 ++++ 1.00E− 13 67.5 9.226 0.0264cg08857797 17 VPS25 0.0063 3.40E− 09 4.74 2.14E− 06 ++++ 1.55E− 13 39.9 4.99 0.1725cg20954977 2 B3GNT7 0.0101 1.68E− 08 4.898 9.66E− 07 ++++ 2.13E− 13 21.3 3.811 0.2826cg04816311 7 C7orf50 0.0090 2.56E− 12 3.823 1.32E− 04 ++++ 2.18E− 13 77.1 13.094 0.0044cg14017402 2 NA 0.0080 1.47E− 10 4.226 2.38E− 05 ++++ 3.17E− 13 75.9 12.462 0.0060cg17560136 8 EPB49 0.0063 3.03E− 08 4.824 1.41E− 06 ++++ 5.27E− 13 25.3 4.018 0.2595cg11592786 15 NA −0.0031 3.60E− 08 −4.584 4.56E− 06 −−−− 2.36E− 12 14.8 3.52 0.3181cg01844514 7 ZNF862 0.0046 3.17E− 08 4.27 1.96E− 05 ++++ 1.21E− 11 4.5 3.143 0.3701cg18307303 5 IL12B 0.0044 4.67E− 08 4.217 2.48E− 05 ++++ 2.16E− 11 46.4 5.592 0.1332cg04869770 1 PBX1 0.0057 5.65E− 09 3.805 1.42E− 04 ++++ 4.23E− 11 57.6 7.074 0.0696cg00863378 16 BBS2 0.0055 1.91E− 08 3.967 7.27E− 05 ++++ 4.24E− 11 49.5 5.939 0.1146cg26354221 22 ADORA2A 0.0032 1.39E− 08 3.725 1.95E− 04 ++++ 1.20E− 10 52.7 6.343 0.0961cg15695155 12 KDM2B 0.0079 4.03E− 08 3.802 1.43E− 04 ++++ 1.71E− 10 49 5.883 0.1175cg27614723 15 SLCO3A1 0.0071 5.62E− 08 3.62 2.94E− 04 ++++ 5.44E− 10 39.4 4.947 0.1757
aSuccessful replication was defined as consistent direction of association across all four studies (ARIC, FHS I, FHS II and GOLDN) and P < 0.05/76 (<6.6 × 10⁻⁴) in the
replication meta-analysis. Meta-analysis used Stouffer’s Z for trend test, which is based on meta-analysis of P-values with adjustment for cohort sample size and
direction.
Table 3. Replicationa of WC–DNA methylation associations in the GOLDN cohort (N = 911), in order of replication P-value
CpGmarker
Chr Nearestgene
ARIC regression coefficient(per 1 SD WC)
ARIC(P-value)
GOLDN regressioncoefficient (per 1 SD WC)
GOLDN(P-value)
Direction Combined meta-analysis (P-value)
cg13708645 12 KDM2B 0.0098 7.22E− 11 0.0074 1.28E− 05 ++ 4.52E − 15cg11024682 17 SREBF1 0.0080 3.52E− 12 0.0039 1.33E− 05 ++ 2.37E − 16cg03078551 17 intergenic −0.0025 8.16E− 09 −0.0021 1.74E− 05 −− 6.61E − 13cg06192883 15 MYO5C 0.0083 1.50E− 12 0.0031 2.56E− 05 ++ 2.15E − 16cg26403843 5 RNF145 0.0101 2.38E− 09 0.0044 7.53E− 05 ++ 7.92E − 13cg13123009 6 LY6G6E 0.0074 1.81E− 13 0.0032 8.25E− 05 ++ 1.07E − 16cg06500161 21 ABCG1 0.0096 4.41E− 19 0.0043 9.39E− 05 ++ 1.09E − 21cg17901584 1 DHCR24 −0.0080 8.34E− 08 −0.0049 2.39E− 04 −− 8.15E − 11
aSuccessful replication was defined as consistent direction of association in GOLDN and ARIC and P-value of <0.05/164 (<3 × 10⁻⁴) in the replication cohort. Meta-analysis
used Stouffer’s Z for trend test, which is based on meta-analysis of P-values with adjustment for cohort sample size and direction.
Human Molecular Genetics, 2015, Vol. 24, No. 15 | 4469
at Acquisition Services on June 24, 2016
http://hmg.oxfordjournals.org/
Dow
nloaded from

1 additional replicated WC probe (above). Generally, regressioncoefficients were reduced by 5–25% with adjustment, but 19/37of BMI-associated probes and 0/1 of theWC probes remained sig-nificant at P < 1 × 10⁻⁷. These results show that about half of theBMI–DNA methylation associations we report are independentof concurrent diabetes, and the others remain strongly asso-ciated even with adjustment for this condition.
Secondary Analysis 2: replication in adipose tissuesamples
The 37 BMI probes and 1 WC methylation probe that independ-ently replicated in FHS andGOLDNwere subjected to cross-tissueassociation study using adipose tissue DNA (Table 4). Replicationwas based on P-value only, because it was assumed that the dir-ection of effect of the same exposure on DNA methylation maydiffer in different tissue types. Twenty-eight of the 38 probespassed quality control (QC) inMultiple Tissue Human ExpressionResource (MuTHER), and of these, 18/28 (64%) were associatedwith BMI in adipose tissue at P < 1.9 × 10⁻³, including markersnear the previously identified CPT1A and ABCG1 loci, but also alarge number of novel adiposity-related loci, including LYS6GE,KDM2B, RALB, PRRL5, LGALS3BP, C7orf50, PBX1, EPB49 and BBS2.BBS2 [Bardet–Biedl syndrome (BBS) 2] is one of the BBS genes in-volved in cilia formation, cell movement and cell signaling. Auto-somal recessive variants in BBS2 are among those responsible forBBS, which is characterized by severe obesity and numerous de-velopmental aberrations. Overall, the results show wide cross-tissue agreement in BMI– and WC–methylation associations.
DiscussionOur study presents the first EWAS of adiposity traits in AfricanAmerican adults, demonstrating numerousmethylation variantsassociated with BMI and WC, including 37 CpG site associationsfor BMI and 1 additional association forWC that replicated in twoEuropean-ancestry cohorts. The ARIC results included sites inthree loci (near HIF3A, CPT1A and ABCG1) that have been previ-ously reported to be associated with BMI, insulin-related traitsand lipid subfractions (27,33,41,42), as well as a number ofnovel loci. This demonstrates to our knowledge the first cross-ethnic replication of methylation signals for BMI from theHM450K array. Further, the results show that despite differencesin blood cell type (GOLDN used CD4+ T cells, ARIC and FHS usedwhole blood), normalization approach [GOLDN used COMBATfollowed by polynomial regression normalization (43), FHS usedwateRmelon and Beta MIxture Quantile dilation (BMIQ) (44) andARIC used BMIQ] and some variation in the average age of the co-horts and specific covariate adjustments, there was general con-sistency of results across these large, independent EWAS studiesof adiposity traits. This is important because while epigeneticmodification in cancer etiology has been established for morethan a decade (45,46), identification of epigenetic patterns in-volved in cardiometabolic disease and its precursors (e.g. obesity)has yielded relatively few replicated loci (reviewed by Drong et al.)(7). There has been concern that the large potential for confound-ing in epigenetic studies would make successful replication diffi-cult. What is likely more important to successful replication ofadiposity associations is sample size; effect sizes observed inthis study were relatively small, with the marginal variance inmethylation beta value at individual CpG sites explained by a 1SD difference in BMI or WC ranging from 0.25 to 2.4%.
ARIC participants gained an average of 7 kg/m2 over the30-year period from age 25 to Visit 2. BMI change was associated
with eight different CpG sites, including the highly cited methy-lation variant near CPT1A, showing that numerous novel methy-lation loci identified in our study donot only index currentweightstatus or its correlates but may also be involved in changes inbody weight over time. Generally, we observed extensive overlapin the methylation associations for the three adiposity traits in-vestigated; of the 38 replicated CpG associations for BMI/WC, 4were shared by all 3 traits, and 27 were shared by BMI and WC(see Fig. 3 for a diagram of overlap across the 3 traits).
Significant obesity or weight gain/weight loss associationshave been reported for CpG methylation sites near SLC6A4 (47),MEST (48), NPY (49), POMC (49), PGC-1α and PDK4 (50). Existingstudies tend to be small (generally <200 subjects per group),which likely explains the lack of replication. Exceptions includereplicated methylation associations near POMC (20) and RXRA(21). None of these CpG sites from previously reported regionalor candidate gene association studies was significantly asso-ciated with BMI, WC or BMI change in the present analysis. Wealso did not replicate the methylation variants recently foundto change in response toweight loss (51) or increased physical ac-tivity (52). A recent genome-wide BMI methylation study con-ducted in 48 obese and 48 lean African American children didnot report associations at the CpG site level but indicated that dif-ferentially methylated regions with greater inter-individual vari-ance in methylation are enriched in obesity, as in cancer (25).
To date, the only prior EWAS to identify and robustly replicatemethylation variants associatedwith BMI is that of Dick et al. (27).That study reported methylation at three CpG sites in intron 1 ofHIF3A to be positively associated with BMI in both blood and adi-pose tissue DNA in European adults (27). Here, we replicate thepositive association for three of these probes in blood DNAfrom African Americans (cg22891070, cg16672562 and cg27146050)with BMI and between cg16672562 methylation and BMI change.As described previously by Dick et al. (27), these probes arewithin likely regulatory elements (open chromatin regions) andare potentially functional; moreover, methylation level wasinversely associated with HIF3A gene expression at one of thefive expression probes examined. HIF3A is a component ofthe hypoxia-inducible transcription factor (HIF) involved in thephysiological response to hypoxia but is also implicated in adipo-cyte differentiation (53) and is expressed in response to glucoseand insulin changes (54). However, we found that these HIF3Amethylation probes were not associated with BMI in either theFHS or the GOLDN study. The reason for this inconsistent replica-tion is unclear butmay relate to the greater obesity comorbidities(perhaps including inflammatory status) in ARIC (e.g. diabetes)and the original study population (over 50% of whom had a his-tory of myocardial infarction), when compared with the replica-tion cohorts in this analysis.
Our unbiased pathway analysis of the EWAS data shows thatover 100 biological pathways are significantly enriched formethylation association with BMI and WC, including thoseinvolved in lipid and energy metabolism, immune function, adi-pocyte, neuronal and chondrocyte differentiation and develop-ment, and many others. These results suggest that furtherwork in larger cohort studies may identify many additionalmethylation variants in associationwith adiposity and its relatedtraits. Many of the specific loci identified in this study are knownto be involved in lipid and lipoprotein metabolism, including theknown differentially methylated locus CPT1A (involved in mito-chondrial uptake of long-chain fatty acids and triglyceride me-tabolism) and ABCG1 (involved in macrophage cholesterol andphospholipids transport, and lipid homeostasis), as well as thenovel BMI-related methylation site near SREBF1, which gene
4470 | Human Molecular Genetics, 2015, Vol. 24, No. 15
at Acquisition Services on June 24, 2016
http://hmg.oxfordjournals.org/
Dow
nloaded from

Table 4. Replicated BMI CpG sites significantly associated in both leukocyte and adipose tissue DNA from 648 females in the MuTHER, in order of MuTHER P-valuea
CpG marker Nearest gene MuTHER regressioncoefficientb
Same directionas in blood?
MuTHERP-valuec
Function
BMIcg17560136 EPB49 0.00233 Yes 4.64E− 33 Erythrocyte membrane protein band 4.9: gene product essential for the maintenance of erythrocyte
shape and membrane stabilitycg04869770 PBX1 0.00222 Yes 8.53E− 25 Pre-B-cell leukemia transcription factor involved in pancreatic development and function, candidate
gene SNPs associated with obesity, variants may influence porcine adipose tissue fatty acidcomposition
cg25178683 LGALS3BP 0.00305 Yes 1.68E− 18 Lectin, galactoside-binding, soluble, 3 binding protein: a macrophage inflammatory marker, arterialexpression upregulated in response to obesity in animal models
cg01844514 ZNF862 0.00111 Yes 4.72E− 16 Zinc finger protein 862: protein coding gene of unknown function, may be involved in transcriptionalregulation
cg07136133 PRR5L −0.00392 Yes 7.85E− 15 Proline rich 5-like: regulates cytoskeleton organization and interacts with mTOR, a central controller ofcell growth, to increase apoptosis
cg06876354 RALB −0.00129 No 9.40E− 14 RAS-related small GTP-ase B: involved in a variety of cellular processes including gene expression andhas role in colorectal cancer oncogenesis
cg26033520 Intergenic Chr. 10 0.00244 Yes 5.29E− 12 Unknowncg08857797 VPS25 −0.00172 No 5.85E− 12 Vacuolar protein-sorting-associated protein 25: part of endosomal sorting complexes required for
transport protein, II (ESCRT-II) complex involved in endosomal transport and possibly genetranscription
cg06946797 Intergenic Chr. 16 −0.00145 Yes 2.09E− 09 Unknowncg04816311 C7orf50 −0.00152 No 2.27E− 09 Chromosome 7 open reading frame 50; unknown function, GWAS variants in this locus are associated
with lipid levels and longevitycg00574958 CPT1A −0.00032 Yes 3.40E− 08 Carnitine palmitoyltransferase-1A: involved in mitochondrial uptake of long-chain fatty acids and
triglyceride metabolism, previously associated with insulin-related DNA methylationcg13123009 LY6G6E 0.00072 Yes 1.18E− 07 Lymphocyte antigen-6 complex, locus G6E (pseudogene): one of LY6 genes located in the MHC class III
region, immune function, acute lymphoblastic leukemia, hematopoiesis, cell adhesioncg13708645 KDM2B 0.00184 Yes 1.74E− 07 Lysine K-specific demethylase 2B: a H3K36 histone demethylase, involved in cellular senescence, tumor
cell differentiation, part of a complex that represses preadipocyte differentiationcg26403843 RNF145 −0.00203 Yes 5.59E− 07 Ring finger protein 145: unknown functioncg00863378 BBS2 0.00113 Yes 7.21E− 07 BBS-2: member of the BBS gene family. BBS is an autosomal recessive disorder characterized by severe
obesity, developmental abnormalities and mental retardationcg09664445 KIAA0664 0.00077 Yes 9.84E− 06 Aka CLUH, clustered mitochondria homolog: regulates mitochondrial biogenesiscg18568872 ZNF710 0.00094 Yes 1.85E− 05 Zinc finger 710: protein-coding gene, function unknown, may be involved in transcriptional regulationcg15871086 Intergenic Chr. 10 0.00094 Yes 1.46E− 03 Unknown
WCcg17901584 DHCR24 0.00162 No 9.07E− 13 3-Beta-hydroxysterol delta-24-reductase: catalyzes reduction of sterol intermediates during final step of
cholesterol biosynthesis, biomarker of nonalcoholic hepatic steatosis, expression changes associatedwith weight loss after bariatric surgery
aThe MuTHER includes genome-wide DNA methylation data (Illumina HumanMethylation450 array) from abdominal subcutaneous adipose tissue collected from 648 female twins (39,40).bFixed-effects regression coefficient from linear mixed models (LMM), with probe DNA methylation beta value as the dependent variable and BMI as the primary independent variable, covariate adjusted for age, bisulfite conversion
concentration, bisulfite conversion efficiency and experimental batch (Beadchip) (fixed effects), and family relationship (twin-pairing) and zygosity (random effects).cReplication was based on P-value only because increased or decreasedmethylationmay differ by tissue type. Threshold for replication was set at P < 1.8 × 10⁻³ (0.05/28 tests). There were 37 BMI-associated CpGs and 1WC-associated
CpG carried forward for replication in adipose tissue, and 10 were removed in QC procedures in MuTHER cohort and not tested.
Hum
anMolecular
Genetics,2015,V
ol.24,No.15
|4471
at Acquisition Services on June 24, 2016 http://hmg.oxfordjournals.org/ Downloaded from

encodes a transcription factor that binds to the LDL receptor andother genes involved in sterol biosynthesis. Promoter variants inSREBF1 influence hepatic cholesterol and steatosis in rats (55) andwith diabetes traits in humans (56,57). Immune function and in-flammatory pathways are also strongly represented in our novelloci, including IL-12B, NFKBIL1, LY6G6E, SBNO2 (part of the IL-10anti-inflammatory signaling pathway) and LGALS3BP (lectin ga-lactoside-binding soluble 3 binding protein). LGALS3BP expres-sion was recently found to be one of a small group of geneswhose expression is strongly modulated throughout the arterialnetwork in response to obesity (58). This study together with ourfindings suggests how obesity-related methylation variantscould be useful as targets for cardiovascular disease treatmentand prevention. To move this work forward, the functional sig-nificance of themethylation variants discovered heremust be es-tablished and a determination made that they mediate therelationships of obesity to diabetes and CHD, rather than thatthey are downstream effects of the obesity-related disease.
In that regard, wewere interested inwhether the associationsidentified with adiposity traits were likely mediated by or other-wise dependent on the presence of diabetes, which conditionwas common in our study sample (26%), is strongly related toobesity and is associated with methylation variation (e.g. 26,59).Although in half of the sites, P-values were no longer genome-wide significant after covariate adjustment for prevalent dia-betes, all of the associations remained strong (P < 1 × 10⁻⁵), withan average change in regression coefficient of only 11.2%. Thus,while some adiposity-related methylation signals may be dueto underlying insulin resistance or diabetes, these results suggestthatmanymay be properly characterized as fundamentally obes-ity related. Longitudinal analysis of weight gain in individualswithout diabetes will confirm these findings.
Blood is an accessible and plentiful tissue for genomic ana-lysis in large studies, but there are two major concerns regardingits use in epigenetic studies of obesity and cardiometabolic con-ditions: biological relevance and confounding by cell type
differential. In terms of relevance, obesity may be characterizedas a defect in appetite/satiety regulation resulting in elevated cir-culating free fatty acids, leading to adipocyte differentiation tosequester the excess lipids. The most biologically relevant tissuetypes for the analysis of obesity-related gene expression (and,ergo, methylation) might therefore include the hypothalamus,liver and adipose tissue. It is encouraging that many of the sig-nals we detected in WBCs also replicated in adipose tissue. Notall did so, perhaps due to gender differences: MuTHER is 100%female while the studies using blood included both males andfemales. It has been shown that different tissues includingbrain, lung, thyroid, saliva and whole blood exhibit highly con-cordant age associations (60) and that smoking is associatedwith consistent AHRR methylation profiles in both lymphoblastsand pulmonarymacrophages (61). Such studies suggest thatDNAmethylation in blood can serve as a biomarker of methylation inother tissues, as found here.
Another concern regarding the use of blood in epigenetic epi-demiologic investigations is that it contains multiple cell types,each having a characteristic methylation profile, such that DNAmethylation associations with disease could be confounded bythe relative proportions of different cell types in the DNA sample(62). Indeed, mean methylation percent differed significantly be-tween blood cell types for over 70 000 of the CpG sites on theHM450 (63). This was less of a concern here in that there wasno association between WBC differential and obesity at Visit 1in ARIC (when measured differentials were available for the en-tire cohort). In addition, covariate adjustment for imputed WBCdifferentials did not substantially alter our EWAS results, andwe replicated our results in different tissue/cell types, both ofwhich procedures reduce the probability that the results aresolely due to confounding by cell type distribution.
Despite its disadvantages, an advantage of leukocytes forepigenetic studies of obesity is that adiposity and immunologicalactivation are strongly causally related. When individuals gainexcessive body fat, numerous changes in the immune system
Figure 3. Overlap in EWAS results for BMI, WC and BMI change in ARIC African American adults.
4472 | Human Molecular Genetics, 2015, Vol. 24, No. 15
at Acquisition Services on June 24, 2016
http://hmg.oxfordjournals.org/
Dow
nloaded from

occur, including increases inWBCs and alterations in the produc-tion of different leukocytes, including increases in neutrophils,mast cells, CD8+ T cells and some classes of monocytesand decreases in T regulatory cells and eosinophils. Thesechanges in immune cell distribution reduce the production ofanti-inflammatory IL-10 and increase the production of pro-inflammatory IL-6, IFNγ and tumor necrosis factor alpha(TNFα), among other cytokine changes (64). After substantialweight loss, leukocyte counts and differentials normalize, asseen following bariatric surgery (65), which suggests that weightgain and loss drive changes in low-grade inflammation and leuko-cyte cell types rather than the reverse. Thus, methylation signalsfound in blood may be potentially useful biomarkers of obesity-related inflammatory damage, as indicated by the manyinflammation-related loci identified in the current analysis.
The present study has a number of limitations, the most im-portant of which is the cross-sectional design, which does notallow for clear temporal relationships between predictor (e.g.BMI) and outcome (CpG-specific methylation) to be assessedand leaves open the potential for reverse causality. Studies in-cluding non-obese individuals with DNA methylation assess-ment at that time point with follow-up for incident obesity andDNA methylation changes at a later point would provide clarifi-cation on methylation variants that drive the development ofobesity as opposed to those that are affected by obesity. Second,gene expression data were not available in ARIC to confirm thefunctional relevance of the DNA methylation variation we haveidentified. However, the CPT1A, HIF3A and ABCG1 probes wereport have been found to influence gene expression in priorstudies (27,41).
The study also had numerous strengths, including a relativelylarge discovery sample, whichmay have been responsible for thelarger number of significant findings than has been reported pre-viously for BMI, a focus on African Americans, which is import-ant due to their higher burden of obesity and related conditionsbut poorer coverage by current EWAS studies, and control for nu-merous potential confounders and batch effects, including a testof potentially cis-acting SNPs in each of the methylation regionsfor association with BMI, and covariate adjustment for imputedcell type differentials. Other strengths include examinationof multiple adiposity traits, a relatively large replication sample(N = 3368) with additional replication in adipose tissue as well(N = 648), quantification of probe-specific measurement error/reliability and consideration of the role of diabetes in theassociations.
In conclusion, this study confirmed three previously identifiedmethylation loci suggested to be associated with obesity andrelated traits (CPT1A, ABCG1 and HIF3A) and identified numerousadditional novel loci harboring individual DNA methylation vari-ation inbothblood andadipose tissue that are associatedwith adi-posity traits in African American adults. Results were successfullyreplicated across studies despite variation in tissue type, ethnicityand analytic approaches. Experimental and longitudinal studydesigns, and larger multi-cohort analyses, are needed to assesscausalityand tomove thegrowingfield of epigenetic epidemiologytoward richer insight into the biology of obesity, as well as newtherapies to reduce or reverse its downstream effects on health.
Methods and ProceduresPopulation
The ARIC Study is a prospective cohort study of cardiovasculardisease risk in four US communities (31). Between 1987 and
1989, 7082men and 8710 women aged 45–64 years were recruitedfrom Forsyth County, North Carolina; Jackson, Mississippi (Afri-can Americans only); suburban Minneapolis, Minnesota; andWashington County, Maryland. The ARIC Study protocol was ap-proved by the institutional review board of each participatinguniversity. After written informed consent was obtained, includ-ing that for genetic studies, participants underwent a baselineclinical examination (Visit 1) and four subsequent follow-up clin-ical exams (Visits 2–5). At this time, DNA methylation data areavailable for African American members of the cohort only,and the present study comprises a cross-sectional analysis ofthese data. Specifically, a single DNA sample was chosen formethylation analysis for each subject, and BMI,WCand covariatedata detailed below were from the same study visit. For theseanalyses, all data come from Visit 2, except as noted below forphysical activity. In addition, self-reported weight at age 25 (col-lected only at Visit 1) was used to calculate weight change fromage 25 to Visit 2 as a measure of adulthood BMI change.
Measurements and questionnaires
Anthropometrics were taken with the subject wearing a scrubsuit and no shoes. BMI was calculated from measured weightand height (weight in kilograms/height in meters squared). WCwas measured at the level of the umbilicus using a flexibletape. WBC count was assessed by automated particle counterswithin 24 h after venipuncture in the local hospital hematologylaboratory. The reliability coefficient for theWBC countmeasure-ment was >0.96 (66). MeasuredWBC differentials were only avail-able for a subset at Visit 2 (N = 187), but these were used in theimputation of differential WBCs for the remaining subjects (seebelow for description). Questionnaires assessed education(coded as less than high school degree, high school degree orequivalent and greater than high school degree), current house-hold income, current cigarette smoking (coded as current, formerand never smoked), current alcohol consumption status (codedas current/former/never) andmedical history (67). Level of leisuretime physical activity was assessed at Visit 1 using the Baeckequestionnaire (68). Leisure time activity scores range in wholeand half increments from 1 to 5, with values <2 indicative ofphysical inactivity (69). Prevalent diabetes was defined as a fast-ing glucose level of ≥126 mg/dl (70), nonfasting glucose of≥200 mg/dl or a self-reported physician diagnosis of or treatmentfor diabetes.
Bisulfite conversion of DNA
Genomic DNA was extracted from peripheral blood leukocytesamples using the Gentra Puregene Blood Kit (Qiagen; Valencia,CA, USA) according to the manufacturer’s instructions (www.qiagen.com). Bisulfite conversion of 1 ug genomic DNAwas per-formed using the EZ-96 DNAMethylation Kit (DeepWell Format)(Zymo Research; Irvine, CA, USA) according to the manufac-turer’s instructions (www.zymoresearch.com). Bisulfite conver-sion efficiency was determined by PCR amplification of theconverted DNA before proceeding with methylation analyseson the Illumina platform using Zymo Research’s UniversalMethylated Human DNA Standard and Control Primers.
Illumina infinium methylation assay
The Illumina Infinium HumanMethylation450K Beadchip array(HM450K) (described by Sandoval et al.) (71) was used to measureDNA methylation (Illumina, Inc.; San Diego, CA, USA). The
Human Molecular Genetics, 2015, Vol. 24, No. 15 | 4473
at Acquisition Services on June 24, 2016
http://hmg.oxfordjournals.org/
Dow
nloaded from

platform detects methylation status of 473 788 CpG sites by se-quencing-based genotyping of bisulfite-treated DNA. Bisulfitetreatment converts only unmethylated cyosines to uracils, allow-ing for highlymultiplexed genotyping with single site resolution.The array covers 96% of CpG Islands (as well as CpG shores) and98.9% of RefSeq genes with a global average of 17.2 probes pergene region and has been shown to have high accuracy and reli-ability (72,73).
Bisulfite-converted DNA was used for hybridization on theHM450K BeadChip, following the Illumina Infinium HD Methyla-tion protocol (www.illumina.com). This consisted of a wholegenome amplification step followed by enzymatic end-pointfragmentation, precipitation and re-suspension. The re-sus-pended samples were hybridized to the complete set of bead-bound probes, followed by ligation and single-base extensionduring which a fluorescently labeled nucleotide is incorporatedand scanned. The degree of methylation is determined for eachCpG cytosine by measuring the amount of incorporated labelfor each probe. The intensities of the images were extractedusing Illumina GenomeStudio 2011.1, Methylation module 1.9.0software. The methylation score for each CpG was representedas a beta (β) value according to the fluorescent intensity ratio.Beta values may take any value between 0 (nonmethylated) and1 (completely methylated). Background subtraction was con-ducted with the GenomeStudio software using built-in negativecontrol bead types on the array.
Normalization
The HM450K uses two different probe types (I and II). Due to dif-ferences in design, probes using the Illumina Type II assay areless sensitive for the detection of extreme methylation values(i.e. 0 and 1) than the Type I assay and have greater average vari-ance between technical replicates (74). BMIQ (75) was used in thisanalysis to adjust the beta values of type 2 design probes into astatistical distribution characteristic of type 1 probes. BMIQhas been shown to more effectively reduce probe set bias andtechnical error across replicates compared with some otherpeak-based and quantitative normalization procedures (76). Anemerging conclusion is that in general, the improvements offeredby different normalization approaches are modest, with veryhigh concordance in association results across differentmethods(77). Further, in this study,we conducted all analyses at the singleprobe level, and therefore, any differences in probe type shouldnot strongly influence the results.
Quality control
Positive and negative controls and sample replicates were in-cluded on each 96-well plate assayed. After exclusion of controls,replicates and samples with integrity issues or failed bisulfiteconversion, a total of 2841 study participants had HM450K dataavailable for further QC analyses.We removed poor-quality sam-pleswith pass rate of <99%, that is, if the sample had at least 1%ofCpG siteswith detection P-value > 0.01 ormissing (N = 37), indica-tive of lower DNA quality or incomplete bisulfite conversion, andsampleswith a possible gendermismatch based on evaluation ofselected CpG sites on the Y chromosome (N = 2), leaving a total of2802 samples available for analysis. At the target level, weflaggedpoor-quality CpG sites with average detection P-value of >0.01and calculated the percentage of samples having detection P-value of >0.01 for each autosomal and X chromosome CpG site.There were 9399 autosomal and X chromosomal markers where
>1% of samples showed detection P-value of >0.01, and thesesites were excluded. In addition, we filtered 370 CpG sites onthe Y chromosomewith average detection P-value of >0.01, leav-ing a total of 473 788 CpG sites for analysis.
Technical error analysis
To obtain a measure of probe-specific technical error and thereliability of the methylation measures, technical replicateswere included for 130 samples (total n = 265 with 5 samples repli-cated 3 times), from which ICC coefficients for methylation betavalues were calculated for all probes (78). Further information onthe method is provided in the Supplementary Text.
Statistical analysis
Of the 2802 samples available after methylation QC, 705 did nothave complete covariate data needed for confounder adjustment,leaving a final sample size of N = 2097 (2096 with BMI and BMIchange data and 2097 with WC data). Mean, standard deviationand range, or frequencies, are provided to describe continuouslydistributed and categorical variables, respectively. Methylationdata were tested and reported in terms of beta values, rangingfrom 0 to 100%. While beta values have non-constant varianceacross different CpG sites, they have the clear advantage of repre-senting the percentage methylation for each site and are there-fore more easily interpretable than M values, which are the log2ratio of the intensities of the methylated versus unmethylatedprobes. Further, it has been shown that in large sample sizes asin ARIC, test statistics are similar for M and beta values (79).
Pathway analysisComplete methylation and phenotype data were first subjectedto pathway analysis for an a priori test of genomic pathway en-richment for the association of BMI orWCwithDNAmethylation.The Illumina 450 K probe annotation file contains (non-unique)mappings of 75% of the CpG sites to 21 160 genes, based uponthe closest gene to each methylation probe. Reflecting our pur-pose in detecting entire genomic pathways that are enrichedfor individually small methylation signals, and long-standingpractice in pathway analysis of GWAS SNP data, gene-levelmethylation signal measurements were first summarized byaveraging across all probes annotated to each gene (80). Biocon-ductor was used to assign genes to the GO domains (molecularfunction, cellular component and biological process), for a totalof 6700 GO pathways tested. Pathway enrichment methods thatare not resampling based have been shown to be highly anti-con-servative (81). We performed pathway testing while rigorouslycontrolling false positives by using the safeExpress R package(82), controlling for the same covariates as specified below. Weused the safeExpress test statistic D, which is a competitive statis-tic contrasting genes in each pathway versus the complement(82). For each GO domain, the output provided pathway globalstatistics and P-values, where correction for multiple compari-sons was performed using Benjamini–Hochberg FDR q-values(83). The FDR is relatively robust to positive correlation structures(84), which are often strong in pathway analysis and thus enableseffective multiple test correction in a manner that is not overlyconservative. FDR q < 0.05was considered statistically significant.
Association studyBatch effect adjustment is critical in the analysis of HM450K data,and ComBat is an Empirical Bayes method frequently used to
4474 | Human Molecular Genetics, 2015, Vol. 24, No. 15
at Acquisition Services on June 24, 2016
http://hmg.oxfordjournals.org/
Dow
nloaded from

adjust gene expression and other microarray data for potentialbatch effects (85). In preliminary analyses, we found very highconcordance in EWAS results for BMI with and without ComBatadjustment of the beta values in our linear mixed-effect regres-sion models (LMMs) to address batch effects, where batch effectwas accounted for by adding plate number (1–34) and chip rownumber (1–6) as fixed effects and chip number (1–244) as a ran-dom effect. Therefore, we used the simpler LMMwithout ComBatadjustment for subsequent analyses. We specified the regressionmodelswith probemethylation beta value as the dependent vari-able, andwith adiposity traits and all covariates as the independ-ent variables. We chose this approach because the technical (e.g.batch) effects we wished to adjust for pertain to the beta values,not to BMI, and also because in our study of older African Ameri-can adults, weight gain and obesity are long-standing character-istics of the participants over their lives,whichwepositmayhaveinfluences on DNA methylation (rather than being influencedby DNA methylation).
Cross-sectional LMM were tested using the R package lme4with methylation beta values as the dependent variable, andwith chip specified as a randomeffect and the following variablesspecified as fixed effects: standardized adiposity variable (BMI,WC and BMI change with mean = 0 and SD = 1), sex, age, studycenter, total WBC, education, household income, current cigar-ette smoking, current alcohol consumption, leisure time physicalactivity and 10 PCs from the Illumina Infinium HumanExomeBeadchip genotype array (86), to account for potential confound-ing by genetic ancestry. The regression models were furtheradjusted for leukocyte cell type proportions (neutrophils, lym-phocytes,monocytes and eosinophils) as additional fixed effects.Cell-type proportions were imputed using the algorithm devel-oped by Houseman (40), which utilizes the known cell type speci-ficity of methylation at selected CpG probes on the HM450 toimpute cell type proportions, and based on the measured differ-ential cell counts available for a subset of ARIC participants atVisit 2. The choice of covariates was based upon known or sus-pected confounding, as described in the directed acyclic graphpresented in Supplementary Material, Figure 1S. The Wald testwas applied to test the hypothesis that BMI, WC or BMI change(depending on the model tested) was associated with CpGmethylation.
Following standard practice in association analysis (87), mul-tiple test correctionswere used to control the family-wise error at0.05. Applying a standard Bonferroni correction for the 473 788CpG sites gives P < 1 × 10⁻⁷ as the significance threshold. Signifi-cant EWAS results for each trait were then filtered to removeknown cross-reactive probes and polymorphic CpGs (88).
A secondary analysis addressed whether the adiposity–methylation associations were independent of diabetes by in-cluding prevalent diabetes status (yes/no) in the above regressionmodel. To account for multiple comparisons, a Bonferroni-corrected P-value of < 1 × 10⁻⁷ was used as the threshold fordetermining whether CpG methylation remained significantlyassociated with adiposity independent of diabetes status.
Replication analysis
CpG sites with association P-values of <1 × 10⁻⁷ for BMI and WCwere carried forward for replication in 991 members of theGOLDN cohort (mean age = 49 years, mean BMI = 28 kg/m2,female = 52%, prevalent diabetes = 7.6%, ancestry = 100% Euro-pean-American, tissue = CD4 +T cells) and 2377 members of theFHS Offspring (mean age = 67 years, mean BMI = 28 kg/m2, %female = 56%, prevalent diabetes = 13.4%, ancestry = 100%
European-American, tissue =whole blood). Both studies utilizedblood DNA and the same HM450 platform for methylation ana-lysis as inARIC.Methylation assayswere performed at two differ-ent laboratories in the FHS and thus are considered as twoindependent cohorts for replication. Further details of the tworeplication cohorts are provided in the Supplementary Text.Given the different analytic strategies and blood cell types usedamong the discovery and replication studies (detailed in the Sup-plementary Text), the meta-analysis was conducted on P-values(not beta values) using a sample size-weighted method (Stouf-fer’s Z trend) that also incorporated the direction of the beta coef-ficients (89) and was implemented in R. For BMI, replication inblood DNAwas defined as consistent direction of the beta coeffi-cient in all four cohorts, and a Bonferroni-corrected meta-analysis P-value for the replication cohorts (FHS I, FHS II andGOLDN) of <0.05/76 or P < 6.6 × 10⁻⁴. For WC, replication wasonly available in the GOLDN cohort, and probe associationswere considered to have positively replicated based on consist-ency of the direction of effect and a Bonferroni-correctedP-value based on the number of probes tested (164 probes,0.05/164 = P < 3 × 10⁻⁴).
Test for confounding by cis-acting genetic variants
Methylation SNPs, defined as SNPs within probe sequences, werefiltered as stated earlier. As a more general means of excludingthe possibility that our results are confounded by cis-actingSNPs, we examined the 500-kb regions surrounding each of ourtop BMI-associatedmethylation probes to search for SNPassocia-tions with BMI using data from a recent large meta-analysis andreport the lowest P-values for each region. Thismeta-analysis ex-amined the association of >3.2 million SNPs (imputed using the1000 Genomes Project) with BMI in 39 144 men and women ofAfrican ancestry (38).
Cross-tissue replication
Concerns regarding tissue specificity of CpG site methylationand the relevance of peripheral blood leukocytes for obesitywere addressed in a secondary analysis by testing the associationof the replicated CpG probes identified for BMI (N = 37) and WC(N = 1) using adipose tissue DNA. The MuTHER containsgenome-wide DNA methylation data using the HM450 array insubcutaneous abdominal adipose tissue collected from 648 Euro-pean-ancestry female twins and singletons (97 MZ pairs, 162 DZpairs and 130 singletons) (39,40). The subjects had a mean age of∼60 years and a mean BMI of 26.6 kg/m2. Further details on theMuTHER cohort materials and methods are found in theSupplementary Text. The threshold for replication was set atBonferroni-corrected P < 1.9 × 10⁻³ (0.05/28 tests). There were 38BMI- or WC-associated CpGs carried forward for replication inadipose tissue, and 10 were removed in QC procedures inMuTHER cohort and not tested.
Supplementary MaterialSupplementary Material is available at HMG online.
AcknowledgementsThe authors thank the staff and participants of the ARIC studyand GOLDN for their important contributions. T.S. is holder ofan ERC Advanced Principal Investigator award. SNP genotyping
Human Molecular Genetics, 2015, Vol. 24, No. 15 | 4475
at Acquisition Services on June 24, 2016
http://hmg.oxfordjournals.org/
Dow
nloaded from

was performed by the Wellcome Trust Sanger Institute and Na-tional Eye Institute via NIH/CIDR.
Conflict of Interest statement. None declared.
FundingTheAtherosclerosis Risk in Communities study is carried out as acollaborative study supported by the National Heart, Lung, andBlood Institute (NHLBI) contracts (HHSN268201100005C, HHSN268201100006C, HHSN268201100007C, HHSN268201100008C,HHSN268201100009C, HHSN268201100010C, HHSN268201100011Cand HHSN268201100012C). Funding support for ‘Building onGWAS forNHLBI-diseases: theU.S. CHARGE consortium’was pro-vided by the National Institutes of Health (NIH) through theAmerican Recovery and Reinvestment Act of 2009 (ARRA)(5RC2HL102419). The work on the GOLDN study has been fundedby the National Institutes of Health (NIH) National Heart, Lung,and Blood Institute (NHLBI) (grant U01HL072524-04). The FHS isfunded by National Institutes of Health contract (N01-HC-25195). The laboratory work for this investigation was fundedby the Division of Intramural Research, National Heart, Lung,and Blood Institute, National Institutes of Health. The analyticalcomponent of this project was funded by the Division of Intra-mural Research, National Heart, Lung, and Blood Institute andthe Center for Information Technology, National Institutes ofHealth, Bethesda, MD. The MuTHER study was funded by theWellcome Trust; European Community’s Seventh FrameworkProgramme (FP7/2007-2013). The study also receives supportfrom the National Institute for Health Research (NIHR)-fundedBioResource, Clinical Research Facility and Biomedical ResearchCentre based at Guy’s and St Thomas’ NHS Foundation Trust inpartnership with King’s College London.
References1. Fan, S. andZhang, X. (2009) CpG islandmethylation pattern in
different human tissues and its correlationwith gene expres-sion. Biochem. Biophys. Res. Commun., 383, 421–425.
2. Armstrong, L. (2012) Epigenetic control of embryonic stemcelldifferentiation. Stem Cell Rev., 8, 67–77.
3. Dolinoy, D.C., Weidman, J.R., Waterland, R.A. and Jirtle, R.L.(2006) Maternal genistein alters coat color and protects Avymouse offspring from obesity by modifying the fetal epigen-ome. Environ. Health Perspect., 114, 567–572.
4. Shenker, N.S., Polidoro, S., van Veldhoven, K., Sacerdote, C.,Ricceri, F., Birrell, M.A., Belvisi, M.G., Brown, R., Vineis, P.and Flanagan, J.M. (2013) Epigenome-wide association studyin the European Prospective Investigation into Cancer andNutrition (EPIC-Turin) identifies novel genetic loci associatedwith smoking. Hum. Mol. Genet., 22, 843–851.
5. Baccarelli, A., Wright, R.O., Bollati, V., Tarantini, L., Litonjua,A.A., Suh, H.H., Zanobetti, A., Sparrow, D., Vokonas, P.S. andSchwartz, J. (2009) Rapid DNA methylation changes afterexposure to traffic particles. Am. J. Respir. Crit. Care Med.,179, 572–578.
6. Rakyan, V.K., Down, T.A., Balding, D.J. and Beck, S. (2011)Epigenome-wide association studies for common humandiseases. Nat. Rev. Genet., 12, 529–541.
7. Drong, A.W., Lindgren, C.M. and McCarthy, M.I. (2012) Thegenetic and epigenetic basis of type 2 diabetes and obesity.Clin. Pharmacol. Ther., 92, 707–715.
8. Lund, G. and Zaina, S. (2009) Atherosclerosis risk factors canimpose aberrant DNA methylation patterns: a tale of trafficand homocysteine. Curr. Opin. Lipidol., 20, 448–449.
9. Hotamisligil, G.S. (2010) Endoplasmic reticulum stressand the inflammatory basis of metabolic disease. Cell, 140,900–917.
10. Reaven, G.M. (1988) Banting lecture 1988. Role of insulinresistance in human disease. Diabetes, 37, 1595–1607.
11. Wang, Z., Shen, W., Withers, R. and Hemysfield, S. (2005)In Hemysfield, S., Lohman, T. and Wang, Z. (eds), HumanBody Composition. Human Kinetics, Champaign, Illinois,pp. 163–176.
12. Carey, V.J., Walters, E.E., Colditz, G.A., Solomon, C.G., Willett,W.C., Rosner, B.A., Speizer, F.E. and Manson, J.E. (1997)Body fat distribution and risk of non-insulin-dependent dia-betes mellitus in women. The Nurses’ Health Study.Am. J. Epidem., 145, 614–619.
13. Sasai, H., Sairenchi, T., Iso, H., Irie, F., Otaka, E., Tanaka, K.,Ota, H. and Muto, T. (2010) Relationship between obesityand incident diabetes in middle-aged and older Japaneseadults: the Ibaraki Prefectural Health Study. Mayo Clin. Proc.,85, 36–40.
14. Hubert, H.B., Feinleib, M., McNamara, P.M. and Castelli, W.P.(1983) Obesity as an independent risk factor for cardiovascu-lar disease: a 26-year follow-up of participants in the Fra-mingham Heart Study. Circulation, 67, 968–977.
15. Folsom, A.R., Stevens, J., Schreiner, P.J. and McGovern, P.G.(1998) Body mass index, waist/hip ratio, and coronary heartdisease incidence in African Americans and whites. Athero-sclerosis Risk in Communities Study Investigators.Am. J. Epidem., 148, 1187–1194.
16. Rexrode, K.M., Carey, V.J., Hennekens, C.H., Walters, E.E.,Colditz, G.A., Stampfer, M.J., Willett, W.C. and Manson, J.E.(1998) Abdominal adiposity and coronary heart disease inwomen. JAMA, 280, 1843–1848.
17. Rexrode, K.M., Buring, J.E. and Manson, J.E. (2001) Abdominaland total adiposity and risk of coronary heart disease inmen.Int. J. Obes. Relat. Metab. Disord., 25, 1047–1056.
18. Wilson, P.W., D’Agostino, R.B., Sullivan, L., Parise, H. and Kan-nel, W.B. (2002) Overweight and obesity as determinants ofcardiovascular risk: the Framingham experience. Arch. Intern.Med., 162, 1867–1872.
19. Calle, E.E., Rodriguez, C., Walker-Thurmond, K. and Thun, M.J. (2003) Overweight, obesity, and mortality from cancer in aprospectively studied cohort of U.S. adults. New Engl. J. Med.,348, 1625–1638.
20. Kuehnen, P., Mischke, M., Wiegand, S., Sers, C., Horsthemke,B., Lau, S., Keil, T., Lee, Y.A., Grueters, A. and Krude, H. (2012)An Alu element-associated hypermethylation variant ofthe POMC gene is associated with childhood obesity. PLoSGenet., 8, e1002543.
21. Godfrey, K.M., Sheppard, A., Gluckman, P.D., Lillycrop, K.A.,Burdge, G.C., McLean, C., Rodford, J., Slater-Jefferies, J.L.,Garratt, E., Crozier, S.R. et al. (2011) Epigenetic gene promotermethylation at birth is associatedwith child’s later adiposity.Diabetes, 60, 1528–1534.
22. Laird, P.W. (2010) Principles and challenges of genomewideDNA methylation analysis. Nat. Rev. Genet., 11, 191–203.
23. Almen, M.S., Jacobsson, J.A., Moschonis, G., Benedict, C.,Chrousos, G.P., Fredriksson, R. and Schioth, H.B. (2012)Genome wide analysis reveals association of a FTO genevariant with epigenetic changes. Genomics, 99, 132–137.
24. Bell, C.G., Finer, S., Lindgren, C.M., Wilson, G.A., Rakyan, V.K.,Teschendorff, A.E., Akan, P., Stupka, E., Down, T.A.,
4476 | Human Molecular Genetics, 2015, Vol. 24, No. 15
at Acquisition Services on June 24, 2016
http://hmg.oxfordjournals.org/
Dow
nloaded from

Prokopenko, I. et al. (2010) Integrated genetic and epigeneticanalysis identifies haplotype-specific methylation in theFTO type 2 diabetes and obesity susceptibility locus. PloSOne, 5, e14040.
25. Xu, X., Su, S., Barnes, V.A., DeMiguel, C., Pollock, J., Ownby, D.,Shi, H., Zhu, H., Snieder, H. and Wang, X. (2013) A genome-wide methylation study on obesity: differential variabilityand differential methylation. Epigenetics, 8, 522–533.
26. Toperoff, G., Aran, D., Kark, J.D., Rosenberg, M., Dubnikov, T.,Nissan, B., Wainstein, J., Friedlander, Y., Levy-Lahad, E., Gla-ser, B. et al. (2012) Genome-wide survey reveals predisposingdiabetes type 2-related DNA methylation variations inhuman peripheral blood. Hum. Mol. Genet., 21, 371–383.
27. Dick, K.J., Nelson, C.P., Tsaprouni, L., Sandling, J.K., Aissi, D.,Wahl, S., Meduri, E., Morange, P.E., Gagnon, F., Grallert, H.et al. (2014) DNA methylation and body-mass index: a gen-ome-wide analysis. Lancet, 383, 1990–1998.
28. Harris, M.I. (1990) Noninsulin-dependent diabetesmellitus inblack and white Americans. Diabetes Metab. Rev., 6, 71–90.
29. Brancati, F.L., Kao,W.H., Folsom, A.R., Watson, R.L. and Szklo,M. (2000) Incident type 2 diabetes mellitus in African Ameri-can and white adults: the Atherosclerosis Risk in Communi-ties Study. JAMA, 283, 2253–2259.
30. El-Sayed, A.M., Scarborough, P. and Galea, S. (2011) Ethnic in-equalities in obesity among children and adults in the UK: asystematic review of the literature. Obes. Rev., 12. e516–e534.
31. The ARIC Investigators. (1989) The Atherosclerosis Riskin Communities (ARIC) Study: design and objectives.Am. J. Epidemiol., 129, 687–702.
32. Houseman, E., Accomando, W., Koestler, D., Christensen, B.,Marsit, C., Nelson, H., Wiencke, J. and Kelsey, K. (2012) DNAmethylation arrays as surrogatemeasures of cellmixture dis-tribution. BMC Bioinf., 13, 86.
33. Hidalgo, B., Irvin, M.R., Sha, J., Zhi, D., Aslibekyan, S., Absher,D., Tiwari, H.K., Kabagambe, E.K., Ordovas, J.M. and Arnett, D.K. (2014) Epigenome-wide Association Study of Fasting Mea-sures of Glucose, Insulin, and HOMA-IR in GOLDN. Diabetes,63, 801–807.
34. Yvan-Charvet, L., Wang, N. and Tall, A.R. (2010) Role of HDL,ABCA1, and ABCG1 transporters in cholesterol efflux and im-mune responses. Arterioscler. Thromb. Vasc. Biol., 30, 139–143.
35. Peng, P., Wang, L., Yang, X., Huang, X., Ba, Y., Chen, X., Guo, J.,Lian, J. and Zhou, J. (2014) A preliminary study of the relation-ship between promoter methylation of the ABCG1, GALNT2and HMGCR genes and coronary heart disease. PloS one, 9,e102265.
36. Yashin, A.I., Wu, D., Arbeev, K.G. and Ukraintseva, S.V. (2010)Joint influence of small-effect genetic variants on humanlongevity. Aging, 2, 612–620.
37. Berisha, S.Z., Serre, D., Schauer, P., Kashyap, S.R. and Smith, J.D. (2011) Changes in whole blood gene expression in obesesubjects with type 2 diabetes following bariatric surgery: apilot study. PloS one, 6, e16729.
38. Monda, K.L., Chen, G.K., Taylor, K.C., Palmer, C., Edwards, T.L.,Lange, L.A., Ng, M.C.Y., Adeyemo, A.A., Allison, M.A., Bielak,L.F. et al. (2013) Ameta-analysis identifies new loci associatedwith body mass index in individuals of African ancestry. Nat.Genet., 45, 690–696.
39. Grundberg, E., Small, K.S., Hedman, A.K., Nica, A.C., Buil, A.,Keildson, S., Bell, J.T., Yang, T.-P., Meduri, E., Barrett, A. et al.(2012) Mapping cis- and trans-regulatory effects across mul-tiple tissues in twins. Nat. Genet., 44, 1084–1089.
40. Grundberg, E., Meduri, E., Sandling, J.K., Hedman, Å.K., Keild-son, S., Buil, A., Busche, S., Yuan, W., Nisbet, J., Sekowska, M.
et al. (2013) Global analysis of DNA methylation variation inadipose tissue from twins reveals links to disease-associatedvariants in distal regulatory elements. Am. J. Hum. Genet., 93,876–890.
41. Irvin, M.R., Zhi, D., Joehanes, R., Mendelson, M., Aslibekyan,S., Claas, S.A., Thibeault, K.S., Patel, N., Day, K., Waite Jones,L. et al. (2014) Epigenome-wide association study of fastingblood lipids in the genetics of lipid lowering drugs and dietnetwork study. Circulation, 130, 565–572.
42. Gagnon, F., Aissi, D., Carrie, A., Morange, P.E. and Tregouet,D.A. (2014) Robust validation of methylation levels associ-ation at CPT1A locus with lipid plasma levels. J. Lipid Res.,55, 1189–1191.
43. Absher, D.M., Li, X.,Waite, L.L., Gibson, A., Roberts, K., Edberg,J., Chatham, W.W. and Kimberly, R.P. (2013) Genome-wideDNA methylation analysis of systemic lupus erythematosusreveals persistent hypomethylation of interferon genes andcompositional changes to CD4+ T-cell populations. PLoSGenet., 9, e1003678.
44. Pidsley, R., CC, Y.W., Volta, M., Lunnon, K., Mill, J. and Schalk-wyk, L.C. (2013) A data-driven approach to preprocessingIllumina 450 K methylation array data. BMC Genomics.doi:10.1186/1471–2164-14-293.
45. Feinberg, A.P. and Tycko, B. (2004) The history of cancer epi-genetics. Nat. Rev. Cancer, 4, 143–153.
46. Herman, J.G. and Baylin, S.B. (2003) Gene silencing in cancerin association with promoter hypermethylation. NewEngl. J. Med., 349, 2042–2054.
47. Zhao, J., Goldberg, J. andVaccarino, V. (2013) Promotermethy-lation of serotonin transporter gene is associated withobesity measures: a monozygotic twin study. Int. J. Obes.,37, 140–145.
48. El Hajj, N., Pliushch, G., Schneider, E., Dittrich, M., Muller, T.,Korenkov, M., Aretz, M., Zechner, U., Lehnen, H. and Haaf, T.(2013) Metabolic programming of MEST DNA methylationby intrauterine exposure to gestational diabetes mellitus.Diabetes, 62, 1320–1328.
49. Crujeiras, A.B., Campion, J., Diaz-Lagares, A., Milagro, F.I.,Goyenechea, E., Abete, I., Casanueva, F.F. and Martinez, J.A.(2013) Association of weight regain with specificmethylationlevels in the NPY and POMC promoters in leukocytes of obesemen: a translational study. Regul. Pept., 186, 1–6.
50. Barres, R., Kirchner, H., Rasmussen, M., Yan, J., Kantor, F.R.,Krook, A., Naslund, E. and Zierath, J.R. (2013) Weight lossafter gastric bypass surgery in human obesity remodels pro-moter methylation. Cell Rep., 3, 1020–1027.
51. Moleres, A., Campion, J., Milagro, F.I., Marcos, A., Campoy, C.,Garagorri, J.M., Gomez-Martinez, S., Martinez, J.A., Azcona-Sanjulian, M.C. and Marti, A. (2013) Differential DNA methy-lation patterns between high and low responders to a weightloss intervention in overweight or obese adolescents: theEVASYON Study. FASEB J., 27, 2504–2512.
52. Ronn, T., Volkov, P., Davegardh, C., Dayeh, T., Hall, E., Olsson,A.H., Nilsson, E., Tornberg, A., Dekker Nitert, M., Eriksson, K.F.et al. (2013) A sixmonths exercise intervention influences thegenome-wide DNA methylation pattern in human adiposetissue. PLoS Genet., 9, e1003572.
53. Hatanaka, M., Shimba, S., Sakaue, M., Kondo, Y., Kagechika,H., Kokame, K., Miyata, T. and Hara, S. (2009) Hypoxia-inducible factor-3alpha functions as an accelerator of3T3-L1 adipose differentiation. Biol. Pharm. Bull., 32, 1166–1172.
54. Heidbreder, M., Qadri, F., Johren, O., Dendorfer, A., Depping,R., Frohlich, F., Wagner, K.F. and Dominiak, P. (2007)
Human Molecular Genetics, 2015, Vol. 24, No. 15 | 4477
at Acquisition Services on June 24, 2016
http://hmg.oxfordjournals.org/
Dow
nloaded from

Non-hypoxic induction of HIF-3alpha by 2-deoxy-D-glucoseand insulin. Biochem. Biophy. Res. Commun., 352, 437–443.
55. Pravenec, M., Kazdova, L., Landa, V., Zidek, V., Mlejnek, P., Si-makova, M., Jansa, P., Forejt, J., Kren, V., Krenova, D. et al.(2008) Identification of mutated Srebf1 as a QTL influencingrisk for hepatic steatosis in the spontaneously hypertensiverat. Hypertension, 51, 148–153.
56. Grarup, N., Stender-Petersen, K.L., Andersson, E.A., Jorgen-sen, T., Borch-Johnsen, K., Sandbaek, A., Lauritzen, T.,Schmitz, O., Hansen, T. and Pedersen, O. (2008) Associationof variants in the sterol regulatory element-binding factor 1(SREBF1) gene with type 2 diabetes, glycemia, and insulinresistance: a study of 15,734 Danish subjects. Diabetes, 57,1136–1142.
57. Bouchard-Mercier, A., Rudkowska, I., Lemieux, S., Couture, P.,Perusse, L. and Vohl, M.C. (2014) SREBF1 gene variationsmodulate insulin sensitivity in response to a fish oil supple-mentation. Lipids Health and Dis., 13, 152.
58. Padilla, J., Jenkins, N.T., Thorne, P.K., Martin, J.S., Rector, R.S.,Davis, J.W. and Laughlin, M.H. (2014) Identification of geneswhose expression is altered by obesity throughout the arter-ial tree. Physiol. Genomics, 46, 821–832.
59. Ribel-Madsen, R., Fraga, M.F., Jacobsen, S., Bork-Jensen, J.,Lara, E., Calvanese, V., Fernandez, A.F., Friedrichsen, M.,Vind, B.F., Hojlund, K. et al. (2012) Genome-wide analysis ofDNA methylation differences in muscle and fat from mono-zygotic twins discordant for type 2 diabetes. PloS One, 7,e51302.
60. Horvath, S. (2013) DNAmethylation age of human tissues andcell types. Genome Biol., 14, R115.
61. Monick, M.M., Beach, S.R., Plume, J., Sears, R., Gerrard, M.,Brody, G.H. and Philibert, R.A. (2012) Coordinated changesin AHRR methylation in lymphoblasts and pulmonarymacrophages from smokers. Am. J. Med. Genet. Part B, 159B,141–151.
62. Reinius, L.E., Acevedo, N., Joerink, M., Pershagen, G., Dahlen,S.E., Greco, D., Soderhall, C., Scheynius, A. and Kere, J. (2012)Differential DNA methylation in purified human blood cells:implications for cell lineage and studies on disease suscepti-bility. PloS One, 7, e41361.
63. Jaffe, A.E. and Irizarry, R.A. (2014) Accounting for cellular het-erogeneity is critical in epigenome-wide association studies.Genome Biol., 15, R31.
64. Carvalheira, J.B., Qiu, Y. and Chawla, A. (2013) Blood spotlighton leukocytes and obesity. Blood, 122, 3263–3267.
65. Dixon, J.B. andO’Brien, P.E. (2006) Obesity and thewhite bloodcell count: changes with sustained weight loss. Obes. Surg,,16, 251–257.
66. Nieto, F.J., Szklo, M., Folsom, A.R., Rock, R. and Mercuri, M.(1992) Leukocyte count correlates in middle-aged adults:the Atherosclerosis Risk in Communities (ARIC) Study.Am. J. Epidemiol., 136, 525–537.
67. The ARIC Investigators. (2008) ARIC Study Website. http://www2.cscc.unc.edu/aric/.
68. Baecke, J.A., Burema, J. and Frijters, J.E. (1982) A shortquestionnaire for the measurement of habitual physicalactivity in epidemiological studies. Am. J. Clin. Nutr., 36,936–942.
69. Meyer, A.M., Evenson, K.R., Couper, D.J., Stevens, J., Pereria,M.A. and Heiss, G. (2008) Television, physical activity, diet,and body weight status: the ARIC cohort. Int. J. Behav. Nutr.Phys. Act., 5, 68.
70. Expert Committee on the Diagnosis and Classification ofDiabetes Mellitus. (1997) Report of the expert committee on
the diagnosis and classification of diabetes mellitus. DiabetesCare, 20, 1183–1197.
71. Sandoval, J., Heyn, H., Moran, S., Serra-Musach, J., Pujana,M.A., Bibikova, M. and Esteller, M. (2011) Validation of aDNA methylation microarray for 450,000 CpG sites in thehuman genome. Epigenetics, 6, 692–702.
72. Bibikova, M., Barnes, B., Tsan, C., Ho, V., Klotzle, B., Le, J.M.,Delano, D., Zhang, L., Schroth, G.P., Gunderson, K.L. et al.(2011) High density DNA methylation array with single CpGsite resolution. Genomics, 98, 288–295.
73. Dedeurwaerder, S., Defrance, M., Calonne, E., Denis, H.,Sotiriou, C. and Fuks, F. (2011) Evaluation of the InfiniumMethylation 450 K technology. Epigenomics, 3, 771–784.
74. Dedeurwaerder, S., Desmedt, C., Calonne, E., Singhal, S.K.,Haibe-Kains, B., Defrance, M., Michiels, S., Volkmar, M.,Deplus, R., Luciani, J. et al. (2011) DNA methylation profilingreveals a predominant immune component in breastcancers. EMBO Mol. Med., 3, 726–741.
75. Teschendorff, A.E., Marabita, F., Lechner, M., Bartlett, T.,Tegner, J., Gomez-Cabrero, D. and Beck, S. (2013) A beta-mixture quantile normalization method for correctingprobe design bias in Illumina Infinium 450 k DNA methyla-tion data. Bioinformatics, 29, 189–196.
76. Marabita, F., Almgren, M., Lindholm, M.E., Ruhrmann, S.,Fagerstrom-Billai, F., Jagodic, M., Sundberg, C.J., Ekstrom,T.J., Teschendorff, A.E., Tegner, J. et al. (2013) An evaluationof analysis pipelines for DNA methylation profiling usingthe Illumina HumanMethylation450 BeadChip platform.Epigenetics, 8, 333–346.
77. Wu, M.C., Joubert, B.R., Kuan, P.F., Haberg, S.E., Nystad, W.,Peddada, S.D. and London, S.J. (2014) A systematic assess-ment of normalization approaches for the Infinium 450 Kmethylation platform. Epigenetics, 9, 318–329.
78. Bose, M., Wu, C., Pankow, J.S., Demerath, E., Bressler, J.,Fornage, M., Grove, M.L., Mosley, T., Hicks, C., North, K.E.et al. (2014) Evaluation of microarray-based DNA methyla-tion measurement using technical replicates: the Athero-sclerosis Risk in Communities (ARIC) Study. BMC Bioinf.,15, 312.
79. Zhuang, J., Widschwendter, M. and Teschendorff, A.E. (2012)A comparison of feature selection and classificationmethodsin DNA methylation studies using the Illumina Infiniumplatform. BMC Bioinf., 13, 59.
80. Sanders, A.D., Stevenson, C., Pearson, J., Burt, M., McGeoch,G., Hudson, B. and Eglinton, T.W. (2013) A novel pathway forinvestigation of colorectal symptoms with colonoscopy orcomputed tomography colonography. New Zealand Med. J.,126, 45–57.
81. Gatti, D.M., Barry, W.T., Nobel, A.B., Rusyn, I. andWright, F.A.(2010) Heading down the wrong pathway: on the influence ofcorrelationwithin gene sets. BMC Genomics. doi:10.1186/1471-2164-11-574.
82. Zhou, Y.H., Barry, W.T. and Wright, F.A. (2013) Empiricalpathway analysis, without permutation. Biostatistics, 14,573–585.
83. Benjamini, Y. and Hochberg, Y. (1995) Controlling the falsediscovery rate: a practical and powerful approach to multipletesting. J. Royal Statis. Soc. Series B, 57, 289–300.
84. Benjamini, Y. and Yekutieli, D. (2001) The control of the falsediscovery rate in multiple testing under dependency. Ann.Statis., 29, 1165–1188.
85. Johnson, W.E., Li, C. and Rabinovic, A. (2007) Adjusting batcheffects in microarray expression data using empirical Bayesmethods. Biostatistics, 8, 118–127.
4478 | Human Molecular Genetics, 2015, Vol. 24, No. 15
at Acquisition Services on June 24, 2016
http://hmg.oxfordjournals.org/
Dow
nloaded from

86. Grove, M.L., Yu, B., Cochran, B.J., Haritunians, T., Bis, J.C., Tay-lor, K.D., Hansen, M., Borecki, I.B., Cupples, L.A., Fornage, M.et al. (2013) Best practices and joint calling of the HumanEx-ome BeadChip: The CHARGE Consortium. PloS One, 8, e68095.
87. Duggal, P., Gillanders, E., Holmes, T. and Bailey-Wilson, J.(2008) Establishing an adjusted p-value threshold to controlthe family-wide type 1 error in genome wide associationstudies. BMC Genomics, 9, 516.
88. Chen, Y.A., Lemire, M., Choufani, S., Butcher, D.T., Grafodats-kaya, D., Zanke, B.W., Gallinger, S., Hudson, T.J. and Weks-berg, R. (2013) Discovery of cross-reactive probes andpolymorphic CpGs in the Illumina Infinium HumanMethyla-tion450 microarray. Epigenetics, 8, 203–209.
89. Whitlock, M.C. (2005) Combining probability from independ-ent tests: the weighted Z-method is superior to Fisher’sapproach. J. Evol. Biol., 18, 1368–1373.
Human Molecular Genetics, 2015, Vol. 24, No. 15 | 4479
at Acquisition Services on June 24, 2016
http://hmg.oxfordjournals.org/
Dow
nloaded from