epigenome-wide dna methylation analysis of small cell lung
TRANSCRIPT

RESEARCH Open Access
Epigenome-wide DNA methylation analysisof small cell lung cancer cell lines suggestspotential chemotherapy targetsJulia Krushkal1* , Thomas Silvers2, William C. Reinhold3, Dmitriy Sonkin1, Suleyman Vural1, John Connelly2,Sudhir Varma3, Paul S. Meltzer4, Mark Kunkel5, Annamaria Rapisarda2, David Evans2, Yves Pommier3 andBeverly A. Teicher6*
Abstract
Background: Small cell lung cancer (SCLC) is an aggressive neuroendocrine lung cancer. SCLC progression andtreatment resistance involve epigenetic processes. However, links between SCLC DNA methylation and drugresponse remain unclear. We performed an epigenome-wide study of 66 human SCLC cell lines using the IlluminaInfinium MethylationEPIC BeadChip array. Correlations of SCLC DNA methylation and gene expression with in vitroresponse to 526 antitumor agents were examined.
Results: We found multiple significant correlations between DNA methylation and chemosensitivity. A potentially importantassociation was observed for TREX1, which encodes the 3′ exonuclease I that serves as a STING antagonist in the regulationof a cytosolic DNA-sensing pathway. Increased methylation and low expression of TREX1 were associated with the sensitivityto Aurora kinase inhibitors AZD-1152, SCH-1473759, SNS-314, and TAK-901; the CDK inhibitor R-547; the Vertex ATR inhibitorCpd 45; and the mitotic spindle disruptor vinorelbine. Compared with cell lines of other cancer types, TREX1 had low mRNAexpression and increased upstream region methylation in SCLC, suggesting a possible relationship with SCLC sensitivity toAurora kinase inhibitors.We also identified multiple additional correlations indicative of potential mechanisms of chemosensitivity. Methylation of the3′UTR of CEP350 and MLPH, involved in centrosome machinery and microtubule tracking, respectively, was associated withresponse to Aurora kinase inhibitors and other agents. EPAS1methylation was associated with response to Aurora kinaseinhibitors, a PLK-1 inhibitor and a Bcl-2 inhibitor. KDM1Amethylation was associated with PLK-1 inhibitors and a KSP inhibitor.Increased promoter methylation of SLFN11 was correlated with resistance to DNA damaging agents, as a result of low or noSLFN11 expression. The 5′ UTR of the epigenetic modifier EZH2 was associated with response to Aurora kinase inhibitors anda FGFR inhibitor. Methylation and expression of YAP1 were correlated with response to an mTOR inhibitor. Among non-neuroendocrine markers, EPHA2 was associated with response to Aurora kinase inhibitors and a PLK-1 inhibitor and CD151with Bcl-2 inhibitors.(Continued on next page)
© The Author(s). 2020 Open Access This article is licensed under a Creative Commons Attribution 4.0 International License,which permits use, sharing, adaptation, distribution and reproduction in any medium or format, as long as you giveappropriate credit to the original author(s) and the source, provide a link to the Creative Commons licence, and indicate ifchanges were made. The images or other third party material in this article are included in the article's Creative Commonslicence, unless indicated otherwise in a credit line to the material. If material is not included in the article's Creative Commonslicence and your intended use is not permitted by statutory regulation or exceeds the permitted use, you will need to obtainpermission directly from the copyright holder. To view a copy of this licence, visit http://creativecommons.org/licenses/by/4.0/.The Creative Commons Public Domain Dedication waiver (http://creativecommons.org/publicdomain/zero/1.0/) applies to thedata made available in this article, unless otherwise stated in a credit line to the data.
* Correspondence: [email protected]; [email protected] Research Program, Division of Cancer Treatment and Diagnosis,National Cancer Institute, NIH, 9609 Medical Center Dr., Rockville, MD 20850,USA6Molecular Pharmacology Program, Division of Cancer Treatment andDiagnosis, National Cancer Institute, Bethesda, MD 20892, USAFull list of author information is available at the end of the article
Krushkal et al. Clinical Epigenetics (2020) 12:93 https://doi.org/10.1186/s13148-020-00876-8
(Continued from previous page)
Conclusions: Multiple associations indicate potential epigenetic mechanisms affecting SCLC response to chemotherapy andsuggest targets for combination therapies. While many correlations were not specific to SCLC lineages, several lineagemarkers were associated with specific agents.
Keywords: DNA methylation, Small cell lung cancer, Gene expression, Epigenetic regulation, Chemotherapy
IntroductionSmall cell lung cancer (SCLC) is a highly aggressive neu-roendocrine tumor prone to early metastasis, short sur-vival, and limited options for effective treatment [1–3].Despite an unmet need to identify new therapies, pro-gress in SCLC treatment has been hindered by rapidlyacquired resistance to therapy resulting in limited andtransient response to second and third line chemothera-peutic and immunotherapeutic agents [2]. Recently, theUS FDA approved the immunotherapy drugs atezolizu-mab, pembrolizumab, and nivolumab for the treatmentof recurrent SCLC [4].Genome studies have identified frequent somatic mo-
lecular alterations in SCLC cells including functional in-activation of TP53, RB1, and, less commonly, PTENtumor suppressor genes; copy number amplification ofMYC family genes MYC, MYCL1, and MYCN; mutationsin the EP300, CREBBP, and KMT2A (MLL) and KMT2D(MLL2) genes encoding histone-modifying proteins; in-activating mutations in NOTCH family genes; and com-mon loss of genomic regions containing FHIT andCDKN2A genes [2, 5–8]. Other genomic alterationsfound in SCLC specimens include somatic rearrange-ments of the TP73 gene and overexpression of CCND1,mutations in SLIT2 and EPHA7, and focal amplificationsof FGFR1 [5, 6]. Smoking-associated signatures in SCLCtumors have also been reported [9, 10].Recent molecular studies have established that SCLC
lineages fall into a number of distinct subtypes, currentlyreferred to as SCLC-A, SCLC-N, SCLC-Y, and SCLC-P,based on their differences in gene and protein expressionof transcriptional molecular neuroendocrine, non-neuroendocrine, or tuft cell-like lineage regulators ASCL1,NEUROD1, INSM1, YAP1, and POU2F3, and of theirdownstream molecular targets [2]. Whether these SCLCsubtypes respond differently to specific treatments andwhether patient tumors may represent a heterogeneousmix of SCLC lineages remains a subject of active investi-gation [2].There is a growing understanding that many changes as-
sociated with SCLC carcinogenesis may be driven by epi-genetic processes. Genes encoding several epigeneticfactors including histone acetyltransferases EP300 andCREBBP, and histone methyltransferases KMT2A andKMT2D are frequently mutated in SCLC tumors [2, 5, 6,11]. High expression of another histone methyltransferase
gene, EZH2, is a distinct feature of SCLC when comparedto normal lung tissue or other cancer categories [11]. Thetranscriptional master regulator, POU2F3, which definesthe tuft cell-like SCLC lineage [2, 12, 13], is epigeneticallysilenced in cervical cancer via hypermethylation of thePOU2F3 promoter [14], suggesting the possibility thatDNA methylation-mediated regulatory mechanisms couldplay a role in SCLC development and progression. A sur-vey of global methylation patterns in primary SCLC tu-mors and SCLC cell lines identified 73 potential genetargets enriched for binding sites of cell fate-specifyingtranscriptional factors [15].Despite growing evidence for the role of epigenetic
factors in SCLC cancer, understanding their influenceon tumor response to treatment remains limited. Earlierstudies of other cancer histologies have identified thera-peutically relevant DNA methylation biomarkers in thepromoter regions of MGMT, increased methylation ofwhich is beneficial for the response to alkylating thera-peutic agents and ionizing radiation in glioblastoma andcolorectal cancer, and of SLFN11, methylation of whichhas been associated with resistance to DNA damagingagents in a variety of cancer categories [16–22]. Insightinto epigenetic modulation of SCLC response to DNAdamaging agents was provided by the discovery of epi-genetic silencing of SLFN11 by EZH2 in the course ofcisplatin-etoposide therapy, which may lead to treatmentresistance or chemo-sensitive relapse [23]. Unfortu-nately, the role of epigenetic mechanisms in response toother agents and the effect of various epigenetic alter-ations on drug treatment response in SCLC remainlargely unknown.To provide insight into epigenetic factors which may influ-
ence the response of SCLC to treatment, an epigenome-wideDNA methylation analysis was performed. Methylation datawere analyzed to determine how epigenomic states of generegions, individual probes, and genes were associated withSCLC response to FDA-approved oncology drugs and about400 investigational agents. These epigenome analyses utilizeddrug response and transcriptional profiling data obtained inour earlier study [24], in which we identified a number ofgene transcripts and miRNAs associated with SCLC responseto treatment. In the current report, we describe the use ofhigh-density DNA methylation measures to identify epige-nomic regions and gene targets that were strongly associatedwith response to a variety of therapeutic agents.
Krushkal et al. Clinical Epigenetics (2020) 12:93 Page 2 of 28

MethodsDrug response measuresWe analyzed drug response measures obtained earlier inthe in vitro screen of 526 FDA-approved and investiga-tional agents using SCLC cell lines [24]. Sixty-six SCLCcell lines had both drug response information and DNAmethylation measures and were included in the analysisof Spearman correlation between probe or gene regionmethylation levels and median values of the log(IC50)measures of drug response among cell line replicates(Supplementary Table 1). Among 526 agents, 412 drugsshowed variability of response among the 66 SCLC celllines and were included in association analysis.Measurement of SCLC cell growth and drug response
measures and the steps for quality control (QC) were de-scribed in detail previously [24]. Briefly, each agent wastested at nine concentrations (10 μM to 1.5 nM, withDMSO concentration of 0.25%), after a 96-h incubationwith the cells. The statistical validity of the drug re-sponse dataset was evaluated by calculating the Z’ factorfor each plate in the assay, with Z’ > 0.5 considered tobe a high-quality assay. Concentration response datawere fit with a 4-parameter curve, and median IC50values for each agent were computed among cell linereplicates.
Methylation data processingMethylation measurements for all cell lines were gener-ated in a single batch using Illumina Infinium Methyla-tionEPIC BeadChip (Illumina, Inc). The absence ofbatch effects was confirmed by comparing clustering ofSCLC based on methylation data with that based ongene expression data.Methylation data were normalized, and beta and de-
tection p values were calculated using the minfi package[25] using default parameters, resulting in 866,091methylation probe measurements. Methylation probebeta-values for individual cell lines with detection pvalues ≥ 10−3 and the entire 1427 probes with mediandetection p ≥ 10−6 were excluded from analysis. Probesoverlapping with single nucleotide polymorphisms(SNPs) were filtered out according to the list of probemasking recommendations of Zhou et al. [26, 27]. Thefinal methylation dataset used in correlation analysiswith drug response and with gene expression hadmethylation beta-values for 760,637 probes that passedall filtering.
Epigenome-wide analysis of association of DNAmethylation with chemosensitivityIn order to compute gene region-averaged methylationbeta-values for the Infinium MethylationEPIC BeadChipdataset, we developed an R program which followed thealgorithm which had previously been developed by other
authors for the IMA software package [28] for the ana-lysis of Illumina 450K Infinium methylation array data.Briefly, we used the Infinium MethylationEPIC Bead-Chip annotation of each probe [29] according to theUCSC genome browser data to compute gene region-averaged methylation values for each of the followinggene regions: TSS1500 (200–1500 bases upstream of thetranscriptional start site, or TSS), TSS200 (0–200 basesupstream of the TSS), 5′UTR (within the 5′ untranslatedregion, between the TSS and the ATG start site), firstexon, gene body (between the ATG start site and thestop codon), and 3′UTR (within the 3′ untranslated re-gion, between the stop codon and poly A signal). Methy-lation of different gene regions was consideredseparately in association analyses and was not combined.The probes annotated as belonging to more than one re-gion and/or more than one gene were included in calcu-lation of average methylation values of each of theirrespective annotated gene regions. Statistical analysiswas performed using the R environment v. 3.5.3. Theresulting methylation values were computed for 108,795regions belonging to 26,239 genes, transcripts, andmiRNA listed in the Infinium MethylationEPIC Bead-Chip manifest annotation [29]. Chromosomal regions(cytoband) of each probe were identified according tothe UCSC genome annotation database for the hg19(GRCh37) assembly of the human genome based onprobe coordinates in the Infinium MethylationEPICBeadChip annotation [30].Spearman correlation analysis of methylation measures
with log(IC50) was performed for methylation beta-values of each individual methylation probe, and also formethylation values averaged among the probes withineach of the six gene regions (TSS1500, TSS200, 5′ UTR,first exon, gene body, and 3′ UTR). Sixty-six SCLC celllines, which had both drug response data and methyla-tion measures, were included in correlation analysis. Allanalyses described in this report included only SCLC celllines and did not include NSCLC or mesothelioma celllines. Significance of correlation of methylation of generegions with drug response was evaluated using theBenjamini-Hochberg adjustment procedure for false dis-covery rate (FDR) [17] using all p values from correl-ation tests of all 412 drug agents with variable drugresponse and 108,795 gene regions. For individualmethylation probes, we used a fixed threshold of p <9.42 × 10⁻⁸ for a single Illumina Infinium MethylationE-PIC BeadChip array methylation probe, according to re-cently published recommendations [31]. In addition, wealso compiled a broader list of top genes associated withdrug response by combining the probes satisfying amore liberal threshold of p < 5 × 10⁻⁷, in an analogywith previously reported criteria of 10−6 for Illumina450K array which had fewer probes than the Illumina
Krushkal et al. Clinical Epigenetics (2020) 12:93 Page 3 of 28

Infinium MethylationEPIC BeadChip array [32]. Werefer to the FDR-adjusted p values as pFDR and the ori-ginal p values prior to FDR adjustment as pO. Special at-tention was paid to the significant associations involvingthe upstream gene regions, which are most likely to con-tain the promoter regions and regulatory regions affect-ing gene expression and to individual probes located inthe upstream gene regions.The overlap between top results for different agents
and genes was visualized using Venn diagrams whichwere constructed with the help of the public online ver-sion of DisplayR [33].
Association of methylation of candidate genes withselected antitumor agentsIn addition to epigenome-wide analysis of association ofSCLC DNA methylation with drug response, we also fo-cused more closely on possible epigenetic mechanismsof response to 44 anticancer agents (SupplementaryTable 2). This list included agents that exhibited higherefficacy in subgroups of SCLC cell lines in the in vitrosingle agent screen, as well as agents with potentialpromise for activity against SCLC based on in vitro orpreclinical results from other studies or based on theirinclusion in SCLC clinical trials [24]. We examined asso-ciation of log(IC50) of these agents with methylation ofindividual probes and gene regions of 78 genes repre-senting drug-specific targets and 48 additional genes in-volved in drug target pathways (Supplementary Table 2).In addition, we analyzed association of methylation oflog(IC50) of each of the 44 agents with methylation ofindividual probes and gene regions of 159 protein-coding genes that included genes with relevance toSCLC lineage determination; SCLC lineage markers;genes that carry frequent mutations or genome alter-ations in SCLC; genes which are commonly inactivated,overexpressed, or epigenetically modified in SCLC tu-mors or in specific SCLC subtypes; as well as genes pre-viously reported as being involved in pathways leadingto SCLC pathogenesis; or those suggested as being rele-vant to SCLC response to chemotherapy [3, 5, 11, 13,15, 24, 34–39]. The list of these genes is provided in thelegend to Supplementary Table 2. Each candidate genewas represented by multiple probes and up to six generegions (TSS1500, TSS200, 5′UTR, first exon, genebody, and 3′UTR), which were analyzed independentlyfrom each other. The resulting correlation p values wereFDR adjusted by combining the results for all 44 agents,separately for 10,515 methylation probes in or near thecandidate genes and for 1376 gene regions in candidategenes. The adjustment for multiple testing and interpret-ation of the significance of the results derived from theanalysis of candidate genes and regions were done separ-ately and independently from the adjustment for
multiple testing and interpretation of significance in theanalysis at the epigenome-wide level, described above.The results obtained using these two approaches werepresented separately.
Association of DNA methylation with gene and miRNAexpression and correlation of transcripts with drugresponseWe examined how association of SCLC DNA methylationof individual probes and gene regions with drug responsemay be related to expression of genes and miRNAs lo-cated in the same genome regions. For this purpose, weused gene expression and miRNA measurements gener-ated and processed by an earlier study of our group [24],which generated transcript expression data using Affyme-trix GeneChip®Human Exon 1.0 ST Arrays (NCBI GEOaccession number GSE73160) and NanoString miRNA ex-pression measurements (NCBI GEO accessionGSE73161). Experimental and computational proceduresfor mRNA and miRNA data collection, processing, QC,data normalization, and adjustment for batch effects werereported previously [24, 38]. We used mRNA expressionmeasures normalized using Robust Multi-Array Average(RMA) and summarized at the whole transcript levelusing AROMA [40]; we also utilized miRNA data whichwere normalized and log2 + 1 transformed [24]. Expres-sion data for the total of 18,690 transcripts and 800 miR-NAs were adjusted separately for batch effects using theComBat function of the sva package [41]. The validity ofadjustment was confirmed by hierarchical sample cluster-ing using the hclust function of R v. 3.3.0. Pearson correl-ation was used to evaluate association of log2-transformednormalized expression values of each transcript and eachmiRNA with log(IC50) of each drug agent. In addition, weused Spearman correlation (Supplementary Table 1) toexamine how the methylation beta-values of each of thetop methylation probes and average methylation beta-values of gene regions associated with drug response werecorrelated with log2-transformed normalized expressionmeasures of genes and miRNAs located in the same gen-ome regions, based on Illumina Infinium MethylationE-PIC BeadChip microarray annotation according to theUCSC genome browser data. Here and below, ρ stands forSpearman correlation coefficient and r stands for Pearsoncorrelation coefficient.
Copy number dataIn cases when DNA methylation directly affects gene ex-pression without copy number changes, a negative asso-ciation between DNA methylation measures, mostcommonly in the upstream gene region, and gene ex-pression may be expected [42]. Gene copy number gaincommonly results in its overexpression, whereas copynumber loss could lead to lower expression levels. Copy
Krushkal et al. Clinical Epigenetics (2020) 12:93 Page 4 of 28

number events have been reported to result in positiveor negative correlations between DNA methylation andgene expression measures depending on the probe loca-tion, with positive correlations more common in thegene body [42]. To examine possible causes of positiveassociations between DNA methylation and gene expres-sion, we verified copy number information from theCancer Cell Line Encyclopedia (CCLE) resource at theBroad Institute [43, 44] for selected genes in which oneor more probes and/or gene regions were significantlyassociated with drug response in our data, and the sameprobes and/or gene regions were strongly positively cor-related with gene expression values. Thirty-three SCLCcell lines with available methylation, transcript expres-sion, miRNA expression, and drug response measure-ments in our dataset also had copy number dataavailable from CCLE. Gene level copy number data hadbeen generated by the CCLE Consortium using Affyme-trix 6.0 SNP arrays, with segmentation of normalizedlog2 ratios of the copy number estimates performedusing the circular binary segmentation algorithm [43,44].
Analysis of association of TREX1 expression andmethylation with drug response using data from otherresourcesDue to the absence of TREX1 gene expression measure-ments among the transcript clusters derived from theAffymetrix GeneChip®Human Exon 1.0 ST Array, forthis gene we used Affymetrix Human Genome U133Plus 2.0 microarray measurements (probe 34689_at)available from the CCLE legacy portal [22, 45] for the 36cell lines that were included both in our dataset and inthe CCLE data. These microarray measures had an ex-cellent correlation with TREX1 RNA-seq expressionmeasurements available from CCLE [43, 44] (Spearmancorrelation coefficient ρ ≥ 0.9135, Pearson r ≥ 0.9041, p≤ 3.80 × 10⁻²⁰ for all tests in SCLC cell lines and acrosscancer categories).For validation of drug sensitivity associations with
TREX1 methylation and expression, we analyzed correla-tions of molecular measurements with drug response in40 SCLC cell lines that had drug sensitivity data avail-able from the Genomics of Drug Sensitivity in Cancer(GDSC) dataset [46, 47] and TREX1 DNA methylationand gene expression measures available from CCLE. Theindependent TREX1 methylation dataset in CCLE wasgenerated using reduced representation bisulfite sequen-cing (RRBS). These data included the TREX1 promoterregion within 1 kb upstream of the TSS, promoter CpGclusters, and promoter CpG islands, as provided by theCCLE project [43] and described in detail in a recent re-port [44]. For TREX1 gene expression measures, we usedCCLE Affymetrix Human Genome U133 Plus 2.0
microarray data (probe 34689_at) [22, 45]. Drug sensitiv-ity measurements (GDSC1 and GDSC2 datasets) wereobtained from the Genomics of Drug Sensitivity in Can-cer (GDSC) resource [46, 47].
Association of methylation and gene expression withdrug response in relation to SCLC lineage classificationTo examine whether patterns of DNA methylation andtranscript expression that were significantly correlatedwith drug response were also associated with SCLClineage subgroups, we analyzed Spearman and Pearsoncorrelation of DNA methylation of individual probesand gene regions with expression of six lineage SCLCmarkers, ASCL1, ASCL2, NEUROD1, INSM1, YAP1, andPOU2F3 [2, 48]. We also used hierarchical clustering ofSCLC cell lines based on these six lineage markers toexamine whether patterns of DNA methylation and geneexpression in the genes of interest were different amongSCLC clusters. Clustering of SCLC cell lines accordingto their lineage marker expression was performed usingthe “average” (UPGMA) option of the hclust commandin the R environment based on Euclidian distances, withsubsequent annotation of SCLC cell line cluster assign-ments according to a previous report [2] when such an-notation was available.
ResultsBelow, we first present the results of the epigenome-wide association analysis of individual probes and generegions with all agents. We discuss the strongest associa-tions of methylation of individual probes with drug re-sponse. We further discuss whether those associationswere also in agreement with the correlations of methyla-tion of regions of the same genes with drug responseand whether such associations could be explained by theeffect of DNA methylation on gene expression. We alsohighlight some of the top correlations of gene regionswith drug response. In a separate section, we report theassociations of methylation of the probes and regions inthe candidate genes with response to candidate drugagents. We highlight their strongest correlations andalso discuss specific genes of particular biological inter-est. Detailed information about all significant associa-tions is provided in Supplementary Tables 3, 4, 5, 6, 7and 8. Additional details are provided in SupplementaryData 1, 2, 3 and 4.
Association of DNA methylation of probes and generegions with drug response at the epigenome-wide levelof significanceSpearman correlation analysis between the beta-valuesof methylation probes that passed QC and SNP filteringand log(IC50) of drug agents identified 294 strong corre-lations with p < 9.42 × 10⁻⁸; all of them had Spearman
Krushkal et al. Clinical Epigenetics (2020) 12:93 Page 5 of 28

correlation coefficient |ρ| > 0.6 (Supplementary Tables 3and 4). The summary of genes containing the top probecorrelations with drug agents (p < 10−8) is presented inTable 1. Table 2 provides the list of significant (pFDR <0.05) and nearly significant (pFDR < 0.1) gene regions as-sociated with drug response.The strongest probe correlation satisfied the
Bonferroni-adjusted threshold for multiple testing of EPICarray probes with 412 agents (pO < 2.29 × 10⁻¹⁰). It in-volved the probe cg13178916 in the body of SNED1 andresistance to the histone deacetylase (HDAC) inhibitor4SC-202 (ρ = 0.6927, pO = 1.16 × 10⁻¹⁰; Table 1). Due tosimilar mechanisms of action of various agents, their asso-ciations with DNA methylation are likely not independent,and the Bonferroni threshold is likely to be excessivelystringent. When using pO < 9.42 × 10⁻⁸, the probecg13178916, which had the range of beta-values from0.096 to 0.843, was also associated with microtubule-disruptive agents BAL-101553 and vinblastine (Supple-mentary Tables 3 and 4; Supplementary Data 1). Eventhough other SNED1 probes did not satisfy the signifi-cance threshold for multiple testing, 52 probes were asso-ciated with resistance to 4SC-202 with pO < 0.05,including 44 probes with pO < 0.01 (ρ ≥ 0.3197; Supple-mentary Data 2A). The probes cg10717312 andcg07644939, located immediately adjacent to cg13178916,were among the 7 probes most strongly associated with4SC-202 (pO < 5 × 10⁻⁵, ρ ≥ 0.4935; Supplementary Data1 and 2A). SNED1, a Sushi, Nidogen, and EGF-like Do-main 1 extracellular matrix protein, is associated with pro-gression and metastasis of mammary carcinomas and withpoor outcomes in ER−/PR− breast cancer [49]. Deletion ofthe chromosomal region 2q37.3 containing SNED1 is a re-curring event in cancer, and in ovarian cancer cell lines, itwas associated with resistance to the HDAC inhibitor vor-inostat [47]. Similar to 4SC-202, multiple SNED1 probeswere weakly associated with resistance to vorinostat (Sup-plementary Data 2B). Methylation of cg13178916 wasweakly positively associated with transcript expression(Spearman ρ = 0.2178; Table 1; Supplementary Table 4).Expression of the SNED1 transcript NM_001080437(Affymetrix cluster ID 2536071) was weakly but signifi-cantly associated with multiple HDAC inhibitors, althoughits association with resistance 4SC-202 and vorinostat wasweak and did not reach statistical significance (Supple-mentary Data 2C). The number of cell lines with SNED1deletion in our data was insufficient to derive any conclu-sions about its association with drug response or DNAmethylation (Supplementary Data 2D).Correlation of the probe cg00870242 in C8orf74,
which encodes an uncharacterized protein, with BIM-46187, an inhibitor of heterotrimeric G-protein signal-ing, was the second strongest among probes (pO = 6.47× 10⁻¹⁰, ρ = − 0.6721; Table 1; Supplementary Tables 2,
3 and 4). In total, 4 probes in C8orf74 were associatedwith response to BIM-46187 with pO < 9.42 × 10⁻⁸
(Supplementary Table 3; Supplementary Data 2D).C8orf74 regions were also significantly (pFDR = 0.0145for the 5′ UTR and first exon) or nearly significantly(pFDR = 0.053 for TSS200) associated with response toBIM-46187 (ρ < − 0.645, Table 2).Correlation of TREX1 methylation with sensitivity to R-
547 was the third strongest association among probes (pO= 9.39 × 10⁻¹⁰, ρ < − 0.6674; Table 1; Fig. 1; SupplementaryTables 3 and 4; Supplementary Data 3 and 4). TREX1,which encodes the 3′ exonuclease I (DNase III), is upregu-lated after treatment of malignant cells with several cat-egories of DNA damaging agents or after UV lightexposure [50–52]. TREX1 has been associated with cancercell sensitivity to DNA-damaging agents and with DNA re-pair or DNA degradation in apoptotic cells after drug ex-posure [50–52]. Using pO < 9.42 × 10⁻⁸, multiple TREX1probes were associated with the CDK inhibitor R-547; theAurora kinase inhibitors AZD-1152, SCH-1473759, SNS-314, and TAK-901; the Vertex ATR inhibitor Cpd 45,which affects the DNA damage response pathway; andvinorelbine which disrupts the mitotic spindle (Table 1;Supplementary Tables 3 and 4). Increased methylation ofTREX1 regions was negatively associated with sensitivity toR-547, TAK-901, and the Vertex ATR inhibitor Cpd 45(pFDR < 0.1; Table 2; Figs. 1 and 2). Methylation of the firstexon of TREX1 was associated with response to digoxin,the kinesin spindle protein (KSP) inhibitor ARRY-520(isomer B), and the KSP/Eg5 inhibitor ARQ-621 whenusing a less stringent threshold of pFDR < 0.15 (− 0.5999≤ ρ≤ − 0.5811, 1.02 × 10⁻⁷ ≤ pO ≤ 3.12 × 10⁻⁷, 0.1112 ≤ pFDR≤ 0.1396; Supplementary Table 5). Methylation of theupstream regions and gene body was strongly negativelyassociated with TREX1 expression (Spearman ρ = − 0.350,pO = 0.0394 for TSS1500; ρ = − 0.692, pO = 4.14 × 10⁻⁶
for TSS200; ρ = − 0.842, pO = 2.23 × 10⁻¹⁰ for the 5′UTR;ρ = − 0.825, pO = 1.07 × 10⁻⁹ for exon 1; and ρ = − 0.779,pO = 3.54 × 10⁻⁸ for the gene body). Methylation of the 3′UTR was not associated with expression (ρ = − 0.037, pO =0.8348). As a corollary to the strong negative correlationbetween methylation of most of the TREX1 regions andexpression, increased TREX1 expression was stronglyassociated with resistance to many agents, e.g., digoxin,ARQ-621, SNS-314, R-547, AZD-1152, vinorelbine, SCH-1473759, TAK-901, Vertex ATR inhibitor Cpd 45,and ARRY-520 isomer B (0.440 ≤ r ≤ 0.582, 0.0002 ≤ pO≤ 0.0107; several correlations are presented in Fig. 1).Associations of TREX1 promoter methylation and ex-
pression with log(IC50) of vinorelbine were validated inSCLC cell lines from the CCLE and GDSC datasets (−0.6506 ≤ Spearman ρ ≤ − 0.4275, 0.0006 ≤ pO ≤ 0.0207 forsignificant correlations of various measures of TREX1promoter methylation and log(IC50) of vinorelbine from
Krushkal et al. Clinical Epigenetics (2020) 12:93 Page 6 of 28

Table
1Individu
alge
nesandge
nomeregion
scontaining
multip
lege
neswhich
containe
dmethylatio
nprob
eswith
thestrong
estSpearm
ancorrelations
(p<10
−8 )with
log(IC50)of
antitum
oragen
ts
Age
ntInhibitor
catego
ryAssociated
gene
sChrom
osom
allocatio
nHighe
st|ρ|for
prob
emethylatio
nvs
log(IC50)
Lowestpfor
prob
emethylatio
nvs
log(IC50)
Highe
st|r|
for
transcrip
texpression
vslog(IC50)
Lowestpfor
transcrip
texpression
vslogIC50
Highe
st|ρ|for
transcrip
texpression
vsprob
emethylatio
n
Lowestpfor
transcrip
texpression
vsprob
emethylatio
n
Transcrip
twith
lowestpfor
expression
vslog(IC50)
4SC-202
HDAC
SNED
12q
37.3
0.6927
1.16
×10
−10
0.1492
0.2281
0.2178
0.0789
NM_001080437
(SNED
1)
BIM-46187
Pan-G-protein
C8orf74
8p23.1
−0.6721
6.47
×10
−10
R-547
CDK
TREX
13p
21.31
−0.6674
9.39
×10
−10
CT-32228
LPAAT-β
STK3
92q
24.3
0.6620
1.43
×10
−9
−0.0575
0.6438
−0.1757
0.1581
NM_013233
(STK39)
Pyrvinium
pamoate
FBXL18
7p22.1
0.6612
1.51
×10
−9
0.0083
0.9471
−0.0427
0.7333
NM_024963
(FBXL18)
Digoxin
KLHL26
19p1
3.11
0.6606
1.58
×10
−9
0.0266
0.8309
0.2699
0.0284
NM_018316
(KLHL26)
Astex
FGF
inhibitor
FGFR
TRIM
24q
31.3
0.6580
1.94
×10
−9
0.0143
0.9085
−0.1558
0.2117
NM_015271
(TRIM2)
ENMD-2076
Aurorakinase
NRP
110p1
1.22
0.6566
2.14
×10
−9
0.1231
0.3212
0.3968
0.0010
NM_003873
(NRP1)
Olaparib
PARP1
LHX4
1q25.2
0.6559
2.26
×10
−9
0.0803
0.5184
0.4303
0.0003
NM_033343(LHX4)
Dep
sipe
ptide
HDAC
VWF
12p1
3.31
−0.6535
2.70
×10
−9
−0.1586
0.1999
0.3311
0.0066
NM_000552(VWF)
Tamoxifen
SERM
CABIN1
22q1
1.23
0.6510
3.26
×10
−9
−0.0575
0.6437
−0.2398
0.0525
NM_012295
(CAB
IN1)
SNS-314
Aurorakinase
TPM3
1q21.3
0.6507
3.34
×10
−9
0.1638
0.1854
0.0760
0.5441
NM_152263
(TPM
3)
ENMD-2076
Aurorakinase
FOXN
314q3
1.3
−0.6500
3.52
×10
−9
0.0638
0.6081
−0.0538
0.6677
NM_001085471
(FOXN
3)
Dep
sipe
ptide
HDAC
FYN
6q21
−0.6490
3.78
×10
−9
−0.1180
0.3415
−0.0357
0.7762
NM_002037
(FYN
)
XL-888
HSP-90
ETV6,
RNU6-19
P12p1
3.2
−0.6474
4.25
×10
−9
0.2387
0.0518
−0.2837
0.0210
NM_001987(ETV6)
Dep
sipe
ptide
HDAC
MTERF
D3
12q2
3.3
−0.6468
4.43
×10
−9
0.1686
0.1725
−0.3133
0.0104
NM_001033050
(MTERFD3)
ARQ
-197
c-Met
TRIM
24q
31.3
0.6498
4.73
×10
−9
−0.0801
0.5228
−0.1558
0.2117
NM_015271
(TRIM2)
TAK-901
Aurorakinase
TREX
13p
21.31
−0.6457
4.81
×10
−9
Flavop
irido
lCDK
ATP
13A3
3q29
−0.6434
5.68
×10
−9
0.1702
0.1685
−0.4160
0.0005
NM_024524
(ATP13A3)
YK-4-279
ERG
TRIM
24q
31.3
0.6426
6.00
×10
−9
−0.1094
0.3782
−0.1558
0.2117
NM_015271
(TRIM2)
Krushkal et al. Clinical Epigenetics (2020) 12:93 Page 7 of 28
Table
1Individu
alge
nesandge
nomeregion
scontaining
multip
lege
neswhich
containe
dmethylatio
nprob
eswith
thestrong
estSpearm
ancorrelations
(p<10
−8 )with
log(IC50)of
antitum
oragen
ts(Con
tinued)
Age
ntInhibitor
catego
ryAssociated
gene
sChrom
osom
allocatio
nHighe
st|ρ|for
prob
emethylatio
nvs
log(IC50)
Lowestpfor
prob
emethylatio
nvs
log(IC50)
Highe
st|r|
for
transcrip
texpression
vslog(IC50)
Lowestpfor
transcrip
texpression
vslogIC50
Highe
st|ρ|for
transcrip
texpression
vsprob
emethylatio
n
Lowestpfor
transcrip
texpression
vsprob
emethylatio
n
Transcrip
twith
lowestpfor
expression
vslog(IC50)
R-547
CDK
GIGYF
22q
37.1
0.6424
6.09
×10
−9
−0.1255
0.3114
−0.1350
0.2798
NM_001103147
(GIGYF2)
R-547
CDK
SP2
17q2
1.32
0.6407
6.88
×10
−9
0.2484
0.0427
0.1529
0.2203
NM_003110
(SP2)
ZIP-301
TRIM
24q
31.3
0.6406
6.93
×10
−9
−0.0669
0.5905
−0.1558
0.2117
NM_015271
(TRIM2)
TAK-960
analog
PLK-1
FGF13
Xq26.3
0.6396
7.42
×10
−9
−0.0133
0.9151
0.3407
0.0051
NM_004114
(FGF13)
Digoxin
SLC1
6A6,
ARS
G17q2
4.2
0.6389
7.83
×10
−9
−0.1918
0.1199
−0.3055
0.0126
NM_014960
(ARSG)
SC-1
Ras-GAP
WT1
11p1
3−0.6377
8.50
×10
−9
−0.3245
0.0074
0.5277
5.28
×10
-6NM_024424
(WT1)
Dep
sipe
ptide
HDAC
AHSG
3q27.3
−0.6374
8.66
×10
−9
−0.0101
0.9356
0.0429
0.7323
NM_001622
(AHSG
)
ONX-0912
Proteasome
HRN
BP3
17q2
5.3
−0.6368
9.06
×10
−9
GSK-461364
PLK-1
NRP
110p1
1.22
0.6367
9.09
×10
−9
0.2571
0.0357
0.3968
0.0010
NM_003873
(NRP1)
SB-590885
BRAF
LOH12
CR1
12p1
3.2
−0.6364
9.31
×10
−9
−0.1878
0.1280
−0.0711
0.5705
NM_058169
(LOH12CR
1)
Flavop
irido
lCDK
CYP1
9A1
15q2
1.2
0.6360
9.54
×10
−9
0.1601
0.1955
0.1494
0.2313
NM_031226
(CYP19A1)
Show
narethestrong
estcorrelations
with
drug
respon
se,for
gene
sor
combine
dge
neregion
swith
atleaston
eprob
esatisfyingp O
<10
−8forSp
earm
ancorrelationbe
tweenmethy
latio
nbe
ta-value
san
dlog(IC50
).Amon
gmultip
letran
scrip
tsmatchingthesamege
ne,the
best
matchingtran
scrip
twas
iden
tifiedby
finding
allA
ffym
etrix
tran
scrip
tswith
matchingge
nena
mes
andby
selectingthemostsign
ificant
tran
scrip
tfrom
Spearm
ancorrelationbe
tweenlog 2
oftran
scrip
texpression
andmethy
latio
nof
each
prob
ewith
inthege
ne/gen
eregion
that
hadbe
enassociated
with
log(IC50
)of
that
agen
twith
p O<5×10
−7.W
ealso
prov
idethe
NCBI
orEn
sembl
IDof
thetran
scrip
twith
amatchingge
nena
methat
hadthemostsign
ificant
Pearsoncorrelationbe
tweenlog2
oftran
scrip
texpression
with
log(IC50
)of
theag
ent.Fo
rthosege
neregion
swhe
reprob
eswith
p O<5×10
−7wereassign
edto
multip
lege
nesin
theInfin
ium
Methy
latio
nEPICBe
adChipman
ifest
anno
tatio
n[29]
accordingto
theUCSC
geno
mean
notatio
n,theou
tput
summaryformultip
lege
neswas
combine
d,as
show
nin
theGen
eRe
gion
scolumnfortheregion
scombining
ETV6
andRN
U6-19Pou
tput
andSLC1
6A6an
dARSGou
tput.A
nexpa
nded
listof
gene
san
dcombine
dge
nomeregion
scontaining
multip
lege
nes,each
with
atleaston
emethy
latio
nprob
esatisfyingp O
<9.42
×10
−8,isprov
ided
inSu
pplemen
tary
Table4.
Correlatio
nresults
oflog 2
ofexpression
ofthemoststrong
lycorrelated
tran
scrip
twith
prob
emethy
latio
nan
dwith
log(IC50
)areprov
ided
forthosege
nesthat
hadmatchingtran
scrip
tda
tain
theAffym
etrix
Gen
eChip®Hum
anExon
1.0ST
Array.
ClusterID
tran
scrip
tclusterID
fortheAffym
etrix
Gen
eChip®Hum
anExon
1.0ST
Array,ρ
Spearm
ancorrelationcoefficient,r
Pearsoncorrelationcoefficient,C
DKcyclin-dep
ende
ntkina
se,H
DAChiston
ede
acetylase,
LPAAT-βlysoph
osph
atidicacid
acyltran
sferase-β,
PLK-1po
lo-like
kina
se1,
SERM
selectiveestrog
enreceptor
mod
ulator
Krushkal et al. Clinical Epigenetics (2020) 12:93 Page 8 of 28

Table
2Gen
eregion
swith
FDR-adjusted
pvalueforSpearm
ancorrelations
ofaveragege
neregion
methylatio
nwith
log(IC50)of
antitum
oragen
ts<0.1
Age
ntInhibitor
catego
ryAssociated
gene
Gen
eregion
Cytob
and
Num
berof
prob
esin
gene
region
ρforaverage
region
methylatio
nvs
log(IC50)
p FDRfor
averageregion
methylatio
nvs
log(IC50)
Highe
st|r|
for
expression
vslog(IC50)
Lowestp
for
expression
vslog(IC50)
Highe
st|ρ|for
expression
vsregion
methylatio
n
Lowestpfor
expression
vsaverageregion
methylatio
n
Transcrip
twith
lowestpfor
expression
vslog(IC50)
ABT-348
Aurora
kinase
CEP3
50UTR3
1q25.2
10.6096
0.0953
0.0270
0.8281
−0.1887
0.1292
NM_014810
(CEP350)
ABT-737
Bcl-2
TCER
G1L
UTR3
10q2
6.3
6−0.6251
0.0787
−0.5740
3.81
×10
−7
0.6026
8.64
×10
−8
NM_174937
(TCERG
1L)
AZD
-1152
Aurora
kinase
MLPH
UTR3
2q37.3
10.6148
0.0905
0.3014
0.0132
0.5396
2.94
×10
-6NM_024101
(MLPH)
BAL-101553
Tubu
linfragm
enter
STARD
3UTR3
17q1
25
0.6154
0.0905
0.0754
0.5440
−0.0173
0.8900
NM_006804
(STARD
3)
BI-2536
PLK-1
MLPH
UTR3
2q37.3
10.6172
0.0905
0.2486
0.0425
0.5396
2.94
×10
-6NM_024101
(MLPH)
BIA
GSK-3
TTC1
5TSS200
2p25.3
40.6138
0.0905
−0.1191
0.3372
−0.1668
0.1807
NM_016030
(TTC15)
BIM-46187
Pan-G-
protein
C8orf74
UTR5
8p23.1
1−0.6721
0.0145*
BIM-46187
Pan-G-
protein
C8orf74
Exon
18p
23.1
1−0.6721
0.0145*
BIM-46187
Pan-G-
protein
C8orf74
TSS200
8p23.1
3−0.6459
0.0530
Dep
sipe
ptide
HDAC
MTERF
D3
Gen
ebo
dy12q2
3.3
1−0.6468
0.0530
0.1686
0.1725
−0.3133
0.0104
NM_001033050
(MTERFD3)
Flavop
irido
lCDK
SEC1
1CTSS1500
18q2
1.32
40.6180
0.0905
0.0731
0.5566
0.5476
1.95
×10
-6NM_033280
(SEC11C)
GSK-461364
PLK-1
LOC1
0012
8568
Gen
ebo
dy19p1
3.3
200.6267
0.0787
Sapanisertib
mTO
RSP
G20
UTR5
13q1
3.3
280.6252
0.0787
−0.3122
0.0101
−0.5423
2.55
×10
−6
NM_001142295
(SPG
20)
Ivacaftor
MIF
TSS200
22q1
1.23
60.6144
0.0905
−0.2685
0.0280
−0.4318
0.0003
NM_002415
(MIF)
Ivacaftor
RPUSD
2Exon
115q1
5.1
40.6127
0.0913
−0.0729
0.5575
−0.0908
0.4683
NM_152260
(RPU
SD2)
ONX-0912
Proteasome
CYP1
1B2
Gen
ebo
dy8q
24.3
1−0.6078
0.0992
−0.1414
0.2536
0.1705
0.1711
NM_000498
(CYP11B2)
R-547
CDK
GIGYF
2TSS1500
2q37.1
40.6354
0.0639
−0.1255
0.3114
−0.1525
0.2215
NM_001103147
(GIGYF2)
R-547
CDK
KCNH6
UTR5
17q2
3.3
40.6409
0.0607
0.0677
0.5861
0.1664
0.1818
NM_030779
(KCN
H6)
R-547
CDK
TREX
1Exon
13p
21.31
9−0.6119
0.0913
Krushkal et al. Clinical Epigenetics (2020) 12:93 Page 9 of 28

Table
2Gen
eregion
swith
FDR-adjusted
pvalueforSpearm
ancorrelations
ofaveragege
neregion
methylatio
nwith
log(IC50)of
antitum
oragen
ts<0.1(Con
tinued)
Age
ntInhibitor
catego
ryAssociated
gene
Gen
eregion
Cytob
and
Num
berof
prob
esin
gene
region
ρforaverage
region
methylatio
nvs
log(IC50)
p FDRfor
averageregion
methylatio
nvs
log(IC50)
Highe
st|r|
for
expression
vslog(IC50)
Lowestp
for
expression
vslog(IC50)
Highe
st|ρ|for
expression
vsregion
methylatio
n
Lowestpfor
expression
vsaverageregion
methylatio
n
Transcrip
twith
lowestpfor
expression
vslog(IC50)
R-547
CDK
TREX
1UTR5
3p21.31
6−0.6109
0.0913
SC-1
Ras-GAP
WT1
UTR3
11p1
31
−0.6372
0.0639
−0.3245
0.0074
0.4004
0.0009
NM_024424
(WT1)
SCH-1473759
Aurora
kinase
ITPA
UTR3
20p1
31
−0.6110
0.0913
0.0138
0.9115
−0.0562
0.6537
NM_033453
(ITPA)
SNS-314
Aurora
kinase
CEP3
50UTR3
1q25.2
10.6280
0.0787
−0.0704
0.5713
−0.1887
0.1292
NM_014810
(CEP350)
TAK-901
Aurora
kinase
TREX
1Exon
13p
21.31
9−0.6231
0.0796
TAK-901
Aurora
kinase
TREX
1UTR5
3p21.31
6−0.6088
0.0969
TAK-960
analog
PLK-1
GLYATL1
TSS1500
11q1
2.1
20.6164
0.0905
0.1228
0.3223
0.4304
0.0003
NM_080661
(GLYATL1)
Vertex
ATR
inhibitorCpd
45
ATR
TREX
1Exon
13p
21.31
9−0.6244
0.0787
Vertex
ATR
inhibitorCpd
45
ATR
TREX
1UTR5
3p21.31
6−0.6182
0.0905
Correlatio
nresults
oflog 2
ofexpression
ofthemoststrong
lycorrelated
tran
scrip
twith
gene
region
methy
latio
nan
dwith
log(IC50
)areprov
ided
forthosege
nesthat
hadmatchingtran
scrip
tda
tain
theAffym
etrix
Gen
eChip®Hum
anExon
1.0ST
Array.N
umbe
rof
prob
esin
gene
region
prov
ides
thenu
mbe
rof
prob
esan
notatedby
theIllum
inaInfin
ium
Methy
latio
nEPICBe
adChipman
ifest
anno
tatio
n[18]
accordingto
theUCSC
geno
mebrow
seras
belong
ingto
apa
rticular
gene
region
;methy
latio
nbe
ta-value
sof
allsuchprob
eswerecombine
dto
compu
tetheaverag
eregion
methy
latio
nvalue.
pFDRpvaluead
justed
forfalsediscov
eryrate,
accoun
tingforall4
12drug
agen
tswith
varia
bledrug
respon
sean
d10
8,79
5ge
neregion
s*p
FDR<0.05
ρSp
earm
ancorrelationcoefficient,r
Pearsoncorrelationcoefficient,A
TRataxia
telang
iectasia
andRa
d3-related
protein,
CDKcyclin-dep
ende
ntkina
se,G
SK-3
glycog
ensyntha
sekina
se3,
PLK-1po
lo-like
kina
se1
Krushkal et al. Clinical Epigenetics (2020) 12:93 Page 10 of 28

Fig. 1 (See legend on next page.)
Krushkal et al. Clinical Epigenetics (2020) 12:93 Page 11 of 28

both GDSC1 and GDSC2; Pearson r = 0.6245, pO =0.0006 for correlation between TREX1 expression andvinorelbine response from GDSC2; data not shown).Consistent with association with vinorelbine, TREX1promoter methylation and expression were correlatedwith other antimitotic agents including vinblastine, vin-cristine, and paclitaxel in SCLC lines from both GDSC1and GDSC2 datasets (for multiple promoter methylationmeasures, − 0.7236 ≤ ρ ≤ − 0.4196, 0.0001 ≤ pO ≤ 0.0262;for expression, 0.3553 ≤ r ≤ 0.5186, 0.0061 ≤ pO ≤ 0.0362;data not shown).GDSC included data for the Aurora kinase inhibitors
ZM447439, tozasertib, and alisertib (MLN-8237). Aliser-tib/MLN-8237 was also included in our dataset, and itsactivity was associated with increased methylation of allTREX1 regions other than the 3′UTR (pO ≤ 0.0231), al-though they did not reach statistical significance afteradjustment for multiple testing at the epigenome-widelevel and accounting for all agents. The strongest associ-ations with alisertib sensitivity in our data were observedfor TSS200, 5′UTR, first exon, and gene body (− 0.5676≤ ρ ≤ − 0.4995, 6.70 × 10⁻⁷ ≤ pO ≤ 1.96 × 10− 5; data notshown). Methylation of 11 TREX1 probes (out of 19total; Supplementary Data 3) in our data was also
associated with sensitivity to MLN-8237 but did notreach significance after adjustment for multiple testing(− 0.5837 ≤ ρ ≤ − 0.4235, 2.70 × 10⁻⁷ ≤ pO ≤ 0.0004; datanot shown). Consistent with our data, several TREX1promoter methylation measures and TREX1 expressionwere associated with alisertib sensitivity in GDSC2 (e.g.,− 0.4996 ≤ ρ ≤ − 0.4292, 0.0178 ≤ pO ≤ 0.0590 for pro-moter CpG island methylation; r = 0.4365, pO = 0.0258for expression). In GDSC1, TREX1 promoter methyla-tion was associated with sensitivity to tozasertib andZM447439 (− 0.5739 ≤ ρ ≤ − 0.4468, 0.0007 ≤ pO ≤0.0326 for the methylation measures most strongly asso-ciated with both agents), and expression was associatedwith sensitivity to tozasertib (r = 0.5805, pO = 0.0023).These correlations in multiple datasets suggest thatTREX1 methylation and expression are associated withSCLC response to Aurora kinase inhibitors, antimitoticagents, and a number of additional drug categories.Supplementary Table 4 provides a gene level summary
for 182 gene-drug correlations for those genes in ourdataset that had one or more probes with pO < 9.42 ×10⁻⁸. It also summarizes matching transcript correlationwith methylation probes in or near these genes that sat-isfied a less stringent criterion of pO < 5 × 10⁻⁷.
(See figure on previous page.)Fig. 1 Scatterplots of TREX1 DNA methylation, transcript expression, and measures of SCLC drug sensitivity. a Methylation of the TSS200 region vslog(IC50) of TAK-901. Horizontal scale represents the average methylation beta-value among the probes in the TREX1 TSS200 region, whereas thevertical scale represents the log(IC50) values of TAK-901. b Methylation of the 5′UTR region vs log(IC50) of TAK-901. Horizontal scale representsthe average methylation of the TREX1 5′UTR region, and the vertical scale represents the log(IC50) values of TAK-901. c Methylation of the 5′UTRregion of TREX1 vs TREX1 expression. Horizontal scale represents the average methylation of the TREX1 5′UTR region, whereas the vertical scalerepresents the log2-transformed TREX1 expression measures. d TREX1 expression vs log(IC50) of TAK-901. Horizontal scale represents the log2-transformed TREX1 expression values, and the vertical scale represents the log(IC50) values of TAK-901. e TREX1 expression vs log(IC50) of R-547.Horizontal scale represents the log2-transformed TREX1 expression values, and the vertical scale represents the log(IC50) values of R-547. fMethylation of the probe cg27340749 vs log(IC50) of R-547. Horizontal scale represents the average methylation of the cg27340749, which isjointly annotated as being the 5′UTR and first exon of TREX1. The vertical scale represents the log(IC50) values of R-547. ρ, Spearman correlationcoefficient. r, Pearson correlation coefficient. The original p values (pO) are provided for respective Spearman and Pearson correlation analyses
Fig. 2 Venn diagram presenting agents from Table 2 associated with gene regions of multiple genes and/or genes from Table 2, regions ofwhich were associated with multiple agents with pFDR < 0.1. Drug names are provided in blue font, whereas the names of associated genes areprovided in italic black font. Circle sizes are proportionate to the number of associated genes. Overlapping regions show genes associated withmultiple agents or agents associated with multiple genes. The full list of gene region-agent associations with pFDR < 0.1 including additionalsingle gene-single agent associations is provided in Table 2
Krushkal et al. Clinical Epigenetics (2020) 12:93 Page 12 of 28

Spearman correlations of 1180 methylation probes satis-fied pO < 5 × 10⁻⁷, with |ρ| > 0.57, and 519 gene-drugcorrelations included genes with probes with pO between9.42 × 10−8 and 5 × 10⁻⁷ (data not shown). Some ofthese less significant results may be of biological interest.For example, methylation of the probe cg17159843 inthe TSS200 of ERBB2 was associated with resistance tothe BET bromodomain inhibitor, (+)-JQ1 (ρ = 0.5757,pO = 4.25 × 10⁻⁷; data not shown). Methylation ofcg17159843 was negatively correlated with expression ofthe ERBB2 transcript NM_001005862 (ρ = − 0.4963, p =2.25 × 10⁻⁵), and increased ERBB2 expression was asso-ciated with sensitivity to JQ1 (Pearson r = −0.3112, p =0.0104). TSS200 and the first exon of ERBB2 were alsostrongly associated with log(IC50) of JQ1 (ρ = 0.5195and 0.5345, pO = 3.79 × 10⁻⁶ and 7.84 × 10⁻⁶, respect-ively), however, not statistically significant after adjust-ment for multiple testing of all 108,795 gene regions and412 agents (pFDR ≥ 0.23). Upregulated expression ofERBB2 was previously associated with acquired multi-drug resistance in SCLC [53, 54]. HER2-positive(HER2+) breast cancer cells were sensitive to JQ1, andBET bromodomain inhibitors may alleviate acquired re-sistance of HER2+ breast cancer cells to lapatinib [55].Combinations of BET inhibitors with other agents in
SCLC with increased ERBB2 expression may be a poten-tial way to overcome drug resistance. Indeed, addition ofthe BET inhibitor MK-8628 increased the killing ofSCLC lines in combination with etoposide or topotecanin a study of triple drug combinations [38].Table 2 provides the list of gene regions associated
with log(IC50) with pFDR < 0.1 at the epigenome-widelevel (with Spearman |ρ| > 0.607). Figure 2 provides aVenn diagram of the subset of these associations withpFDR < 0.1 that involved multiple agents per gene ormultiple genes per agent. An expanded list of regionsthat satisfied a less stringent criterion of pFDR < 0.15 atthe epigenome-wide level (with |ρ| ≥ 0.579) is providedin Supplementary Table 5. As discussed above, TREX1regions were associated with multiple agents. The 3′UTR of MLPH and CEP350 was also associated withmultiple agents with pFDR < 0.1 (Fig. 3; SupplementaryFigure 1). The 3′UTR of MLPH was associated with theAurora kinase inhibitor AZD-1152 and the polo-like kin-ase (PLK) inhibitor BI-2536. The 3′UTR of CEP350 wasassociated with ABT-348, which inhibits multiple ki-nases including Aurora kinases [56], and the Aurora kin-ase inhibitor SNS-314 (ρ ≥ 0.610). At pFDR < 0.15, the 3′UTR of both MLPH and CEP350 was associated withthe PLK-1 inhibitor TAK-960, MLPH was associated
Fig. 3 Venn diagram presenting candidate gene-drug associations from Table 3 based on individual probes, with pFDR < 0.1. Drug names areprovided in blue font, whereas the names of associated genes are provided in italic black font. The size of the circles is proportionate to thenumber of associated genes. Overlapping regions show genes associated with multiple agents or agents associated with multiple genes
Krushkal et al. Clinical Epigenetics (2020) 12:93 Page 13 of 28

with the Aurora kinase inhibitor SCH-1473759, andCEP350 with a TAK-960 analog (ρ ≥ 0.587; Supplemen-tary Table 5; Supplementary Figure 1). Association ofTREX1, MLPH, and CEP350 methylation with multipleAurora kinase inhibitors is notable, as Aurora kinase in-hibitors were highly effective against SCLC cell lines andinduced a partial response in SCLC patients in a clinicalstudy [24, 57]. Associations with MLPH and CEP350may be based on functional interactions, as regulatoryroles of Aurora kinases include mitotic regulation ofmicrotubule interactions, mitotic spindle assembly, andcentrosome maturation [58, 59].MLPH, melanophilin, has a role as a microtubule plus-
end tracking protein and interacts with microtubule plusend-binding protein EB1, which is involved in spindlesymmetry in mitosis [60–62]. CEP350, centrosomal pro-tein 350, is a putative substrate of Aurora kinases as a partof centrosomal maturation machinery [59]. While themethylation of the 3′UTR regions of MLPH and CEP350was strongly associated with drug response, its biologicalconsequences require further investigation, as each regionwas represented by a single probe. Methylation of the 3′UTR of MLPH was strongly positively associated withMLPH expression (ρ = 0.5396, pO = 2.94 × 10⁻⁶). The 3′UTR of CEP350 was very weakly negatively associatedwith its expression (ρ = − 0.1887, pO = 0.1227; Supple-mentary Table 5).
Association of methylation of probes and regions incandidate genes with drug responseAnalysis of the association of methylation probes and re-gions in candidate genes with 44 antitumor agents listedin Supplementary Table 2 revealed 29 probe-drug asso-ciations involving 18 genes and 16 agents with pFDR <0.1 (Spearman |ρ| > 0.516|). The summary of these asso-ciations at the gene level, representing 24 gene-drug as-sociations, is provided in Table 3 and Fig. 3.Supplementary Tables 6 and 7 provide expanded lists ofgene-drug and probe-drug associations involving probeswith pFDR < 0.15 (|ρ| ≥ 0.481).Associations of the probe cg08937075 in EPAS1, which
encodes the hypoxia-inducible factor 2α (HIF2α), withthe Aurora kinase inhibitors AMG-900 and SNS-314and of cg09637363 in CCND1 with the Aurora A kin-ase/tyrosine kinase inhibitor ENMD-2076 had pFDR <0.05 (Table 3; Supplementary Table 7). Multiple otherprobes in both genes had strong correlations with theseagents (Supplementary Table 7). The probe cg08937075in the EPAS1 body was significantly associated with re-sponse to AMG-900 not only when testing among can-didate genes, but also at the epigenome-wide levelamong all Illumina EPIC array probes (pO = 1.68 × 10⁻⁸,ρ = 0.6278; Supplementary Table 3; Supplementary Fig-ure 2). In total, 13 probes in the body of EPAS1,
upstream of that gene, or in the 3′UTR had modest orstrong correlations with resistance to AMG-900 (Supple-mentary Data 2D). Among candidate drug-gene associa-tions, EPAS1 probes had FDR < 0.1 in associations withsix agents (Table 3, Fig. 3), including resistance to Aur-ora kinase inhibitors AMG-900, SNS-314, and MLN-8237; multiple kinase inhibitor including Aurora kinaseABT-348, and the PLK-1 inhibitor GSK-461364 (0.5165≤ ρ ≤ 0.6278), and sensitivity to the Bcl-2 inhibitor ABT-737 (ρ = − 0.5204). EPAS1 gene regions were not signifi-cantly associated with drug response (the strongest cor-relation, with etoposide, had pFDR = 0.509, ρ = 0.4122;data not shown). Methylation of EPAS1 probes whichwere associated with drug response was significantlypositively correlated with EPAS1 expression (ρ = 0.6800,pO = 3.39 × 10⁻¹⁰ for cg08937075), and both methyla-tion of EPAS1 probes and EPAS1 expression had thesame direction of associations with drug response (Table3; Supplementary Figure 2), which suggests that EPAS1expression may be regulated by mechanisms other thanDNA methylation. While EPAS1 expression is associatedwith response to the KSP/Eg5 inhibitor ARQ-621 [24],however, the correlation of EPAS1 methylation with re-sponse to that agent was weak (ρ ≤ 0.2147 for differentregions), was in same direction as that for gene expres-sion, and did not reach statistical significance. We didnot find any association of EPAS1 copy number withprobe methylation, transcript expression, or response tothe Aurora kinase inhibitors AMG-900 and SNS-314(Spearman ρ and Pearson r < 0.2; data not shown), andthe molecular basis for the association between methyla-tion of EPAS1 probes and drug response remainsunclear.CCND1, encoding cyclin D1, is overexpressed in some
SCLC tumors [5]. The probes in its upstream region andgene body had the opposite directions of associationwith drug response and with CCND1 expression (Sup-plementary Table 7). The probes cg09637363 andcg19964454 in its body were associated with sensitivityto the Aurora kinase inhibitors ENMD-2076, AS-703569, SCH-1473759, CYC-116, and MLN-8237 (−0.5777 ≤ ρ ≤ − 0.4855, 0.0391 ≤ pFDR ≤ 0.1366; Supple-mentary Table 7). Methylation of both probescg09637363 and cg19964454 was strongly positively as-sociated (ρ = 0.5972 and 0.5617, pO = 1.20 × 10⁻⁷ and9.24 × 10−7, respectively; data not shown) with expres-sion of one of the two CCND1 transcripts with availabledata, NM_053056 (Affymetrix cluster ID 3338192). Thesignificance of the positive correlation of the probes inthe gene body with expression is unclear, although it isconsistent with a report of multiple positive correlationsof some gene body probes with expression in the CancerGenome Atlas (TCGA) data [42, 63]. Expression of theCCND1 transcript 3338192 was modestly associated
Krushkal et al. Clinical Epigenetics (2020) 12:93 Page 14 of 28

Table
3Candidate
gene
swith
methylatio
nprob
esthat
hadcorrelations
with
log(IC50)of
cand
idateantitum
oragen
tssatisfyingp F
DR<0.1
Age
ntInhibitor
catego
ryAssociated
gene
Locatio
nHighe
st|ρ|for
prob
emethylatio
nvs
log(IC50)
Lowestp F
DRfor
prob
emethylatio
nvs
log(IC50)
Highe
st|r|
for
transcrip
texpression
vslog(IC50)
Lowestpfor
transcrip
texpression
vslogIC50
Highe
st|ρ|for
transcrip
texpression
vsprob
emethylatio
n
Lowestpfor
transcrip
texpression
vsprob
emethylatio
n
Transcrip
twith
lowestpfor
expression
vslog(IC50)
ABT-348
Aurora
kinase
EPAS1
2p21
0.5548
0.0515
0.3638
0.0025
0.6800
3.39
×10
−10
NM_001430(EPAS1)
ABT-737
Bcl-2
DLL3
19q1
3.2
0.5506
0.0515
−0.4139
0.0005
−0.4426
0.0002
NM_016941(DLL3)
ABT-737
Bcl-2
FHIT
3p14.2
−0.5502
0.0515
0.1830
0.1382
−0.3164
0.0097
ENST00000468189
(FHIT)
ABT-737
Bcl-2
KIT
4q12
−0.5391
0.0580
−0.5372
2.77
×10
−6
0.5426
2.52
×10
−6
NM_000222(KIT)
ABT-737
Bcl-2
EPAS1
2p21
−0.5204
0.0937
−0.0501
0.6873
0.2638
0.0324
NM_001430(EPAS1)
AMG-900
Aurora
kinase
EPAS1
2p21
0.6278
0.0052*
0.3966
0.0009
0.6800
3.39
×10
−10
NM_001430(EPAS1)
AS-703569
Aurora
kinase
CCND1
11q1
3.3
−0.5568
0.0515
−0.3614
0.0027
0.5972
1.20
×10
−7
NM_053056
(CCN
D1)
BEZ-235
mTO
RAKT1
14q3
2.33
−0.5370
0.0604
0.2562
0.0363
−0.3499
0.0040
NM_001014432
(AKT1)
BI-2536
PLK-1
KIF24
9p13.3
0.5403
0.0580
0.1740
0.1591
0.0689
0.5828
NM_194313(KIF24)
CYC
-116
Aurora
kinase
EZH2
7q36.1
0.5456
0.0515
−0.0162
0.8966
−0.1156
0.3554
NM_004456(EZH
2)
ENMD-2076
Aurora
kinase
CCND1
11q1
3.3
−0.5777
0.0391*
−0.4201
0.0004
0.5972
1.20
×10
−7
NM_053056
(CCN
D1)
ENMD-2076
Aurora
kinase
ALK
2p23.2
−0.5551
0.0515
0.0036
0.9768
0.2331
0.0597
NM_004304(ALK)
ENMD-2076
Aurora
kinase
EPHA2
1p36.13
0.5233
0.0876
−0.2090
0.0897
−0.3787
0.0017
NM_004431(EPH
A2)
ENMD-2076
Aurora
kinase
RGS7
1q43
0.5191
0.0948
0.4887
2.72
×10
−5
0.7412
1.11
×10
−12
NM_002924(RGS7)
GSK-461364
PLK-1
EPAS1
2p21
0.5165
0.0994
0.3554
0.0032
0.6800
3.39
×10
−10
NM_001430(EPAS1)
Sapanisertib
mTO
RIGF1R
15q2
6.3
0.5262
0.0798
−0.0889
0.4744
−0.1369
0.2730
NM_000875(IG
F1R)
MLN
-8237
Aurora
kinase
EPAS1
2p21
0.5462
0.0515
0.3245
0.0074
0.6800
3.39
×10
−10
NM_001430(EPAS1)
Olaparib
PARP1
SEMA3B
3p21.31
0.5264
0.0798
−0.0815
0.5120
0.0907
0.4687
NM_004636
(SEM
A3B)
SNS-314
Aurora
kinase
EPAS1
2p21
0.5880
0.0322*
0.3434
0.0044
0.6800
3.39
×10
−10
NM_001430(EPAS1)
SNS-314
Aurora
kinase
EZH2
7q36.1
0.5464
0.0515
−0.0444
0.7215
−0.1156
0.3554
NM_004456(EZH
2)
TAK-901
Aurora
kinase
ZNF423
16q1
2.1
−0.5360
0.0604
−0.1859
0.1319
0.5773
3.88
×10
−7
NM_015069
(ZNF423)
Krushkal et al. Clinical Epigenetics (2020) 12:93 Page 15 of 28

Table
3Candidate
gene
swith
methylatio
nprob
esthat
hadcorrelations
with
log(IC50)of
cand
idateantitum
oragen
tssatisfyingp F
DR<0.1(Con
tinued)
Age
ntInhibitor
catego
ryAssociated
gene
Locatio
nHighe
st|ρ|for
prob
emethylatio
nvs
log(IC50)
Lowestp F
DRfor
prob
emethylatio
nvs
log(IC50)
Highe
st|r|
for
transcrip
texpression
vslog(IC50)
Lowestpfor
transcrip
texpression
vslogIC50
Highe
st|ρ|for
transcrip
texpression
vsprob
emethylatio
n
Lowestpfor
transcrip
texpression
vsprob
emethylatio
n
Transcrip
twith
lowestpfor
expression
vslog(IC50)
TAK-960
PLK-1
KIF24
9p13.3
0.5571
0.0515
0.2285
0.0630
0.0689
0.5828
NM_194313(KIF24)
TAK-960
PLK-1
MYC
8q24.21
0.5432
0.0540
−0.1537
0.2143
0.2652
0.0314
NM_002467(M
YC)
Salinom
ycin
Apo
ptotic
FGFR2
10q2
6.13
−0.5334
0.0650
−0.3237
0.0075
0.6785
3.84
×10
−10
NM_000141(FGFR2)
Salinom
ycin
Apo
ptotic
KIF3B
20q1
1.21
−0.5202
0.0937
0.1938
0.1162
−0.4576
0.0001
NM_004798(KIF3B)
Listed
arethege
ne-drugcorrelations
forcand
idatege
nesin
which
oneor
moreprob
esha
dp F
DR<0.1forSp
earm
ancorrelationwith
agen
tslistedin
Supp
lemen
tary
Table2.
Supp
lemen
tary
Table6prov
ides
thelistof
cand
idatege
ne-drugpa
irssatisfyingaless
strin
gent
crite
rionof
p FDR<0.15
.The
listof
individu
alprob
esan
dtheirindividu
alpvalues
areprov
ided
inSu
pplemen
tary
Table7
p FDR,FDR-ad
justed
pvalue,
accoun
tingformultip
letestingof
10,515
methy
latio
nprob
esin
orne
arcand
idatege
nesan
d44
agen
tslistedin
Supp
lemen
tary
Table2.
*pFD
R<0.05
ρSp
earm
ancorrelationcoefficient,r
Pearsoncorrelationcoefficient
Krushkal et al. Clinical Epigenetics (2020) 12:93 Page 16 of 28

with SCLC sensitivity to the same agents which were as-sociated with the probes cg09637363 and cg19964454(Pearson correlation with transcript expression − 0.4201≤ r ≤ − 0.3015, 0.0004 ≤ p ≤ 0.0131 for ENMD-2076,AS-703569, SCH-1473759, CYC-116, and MLN-8237;data not shown). In contrast to the probes in the bodyof CCND1, the probes cg01406280, cg11190277, andcg19209049 in the TSS1500 were associated with resist-ance to the Aurora kinase inhibitor ENMD-2076, a dualPI3K/mTOR inhibitor BEZ-235, and the PLK inhibitorBI-2536 (0.4811 ≤ ρ ≤ 0.5484, 0.0515 ≤ pFDR ≤ 0.1484).Methylation of the TSS1500 probes was negatively asso-ciated with expression of the CCND1 transcript 3338192(e.g., ρ = − 0.3569, p = 0.0032 for cg01406280; data notshown). Expression of that transcript was associated withsensitivity to all three agents (− 0.4291 ≤ r ≤ − 0.2298,0.0004 ≤ p ≤ 0.0614). Negative association betweenTSS1500 probes and expression of the transcript3338192 suggests a possible regulatory role of methyla-tion of the upstream region of CCND1.In contrast, the second CCND1 transcript (Affymetrix
cluster ID 3380065) was not associated with any of theabove agents or with methylation of the probes corre-lated with these agents (Pearson |r| and Spearman |ρ| ≤0.2, p ≥ 0.1). Therefore, possible associations betweenCCND1 methylation and drug response could be medi-ated by the transcript 3338192. Analysis of the possibleeffect of CCND1 copy number on these associations didnot provide conclusive results as only one cell line withavailable copy number data, DMS 114, had a high-levelamplification of CCND1.Analysis of association of regions of candidate genes
with 44 agents identified five gene-drug pairs involvingfour genes which had pFDR < 0.1, with Spearman ρ ≥0.51 (Table 4). All associations indicated increased drugresistance for higher methylation of the respective generegions. Two associations, of the TSS1500 of PTGFRNwith the dual PI3K/mTOR inhibitor BEZ-235 (dactoli-sib) and of the KDM1A body with the PLK-1 inhibitorTAK-960, had pFDR < 0.05. Methylation of the regions ofthree out of four genes (PTGFRN, KDM1A, and MDM2)listed in Table 4 was significantly negatively associatedwith expression of their transcripts (− 0.4786 ≤ Spear-man ρ ≤ − 0.2436, 4.81 × 10⁻⁵ ≤ pO ≤ 0.0487). This mayindicate a negative regulatory effect of DNA methylationon transcript expression. Accordingly, increased expres-sion of these three genes was associated with sensitivityto the agents listed in Table 4 (− 0.4017 ≤ Pearson r ≤ −0.2325, 0.0008 ≤ pO ≤ 0.0752). Supplementary Table 8provides an expanded list of associations between generegions and drug response satisfying pFDR < 0.15.Methylation of the body of KDM1A, which encodes ly-
sine demethylase 1A (LSD1), an epigenetic histonemodifier, was significantly associated with resistance to
the PLK-1 inhibitor TAK-960 (Spearman ρ = 0.5486,pFDR = 0.0352; Table 4). Using a less stringent threshold(pFDR < 0.15), it was also associated with resistance toanother PLK-1 inhibitor GSK-461364, and to the KSPinhibitor SB-743921 (ρ = 0.4619 and 0.4722, respectively;pFDR = 0.1347 for both agents, Supplementary Table 8).Methylation of the KDM1A body was significantlynegatively correlated with expression of its transcriptwith Affymetrix cluster ID 2325002 (NCBI locus IDNM_001009999; Spearman ρ = − 0.2436, p = 0.0487;Table 4), and increased KDM1A transcript expressionwas weakly correlated with sensitivity to TAK-960 (Pear-son r = − 0.2325, p = 0.0583; Table 4). LSD1 is overex-pressed in SCLC and is the target of selective LSD1inhibitors which are currently being pursued in the clin-ical setting [2, 3]. LSD1 directly regulates the transcrip-tion of PLK-1 [64], which could suggest a potentialmolecular mechanism of association between increasedmethylation and reduced expression of KDM1A and re-sistance to PLK-1 inhibitors.All other gene region associations with pFDR < 0.1 in-
volved upstream regions. Methylation of the TSS1500 ofPTGFRN was significantly associated with resistance tothe dual PI3K/mTOR inhibitor BEZ-235 (ρ = 0.5565, pFDR= 0.0352; Table 4). PTGFRN, a frequently mutated gene inSCLC, encodes the prostaglandin receptor F2 inhibitorthat inhibits the binding of prostaglandin F2α to its recep-tor [5]. In agreement with the correlation of the TSS1500region, the probe cg08361238 in that region was also asso-ciated with BEZ-235 (ρ = 0.5040, pFDR = 0.1184; Supple-mentary Table 7). Methylation of the TSS1500 ofPTGFRN was significantly negatively correlated with ex-pression of the PTGFRN transcript NM_020440 (clusterID 2353717; ρ = − 0.4786, p = 4.81 × 10⁻⁵). Accordingly,increased expression of that transcript was associated withsensitivity to BEZ-235 (Table 4).Methylation of the TSS200 of MDM2 was associated
with resistance to Bcl-2 inhibitors ABT-263 (Navitoclax)and ABT-737, with ρ = 0.52 and pFDR = 0.0617 for bothagents (Supplementary Table 8). The probe cg04667586in the TSS200 and the gene body was also associatedwith log(IC50) of ABT-263 (ρ = 0.5070, pFDR = 0.1184;Supplementary Table 7). TSS200 was significantly nega-tively associated with expression of the MDM2 tran-script NM_002392 (cluster ID 3421300, r = − 0.4269, p= 0.0004), which was correlated with sensitivity to bothBcl-2 inhibitors (ρ = − 0.4017, p = 0.0008 for ABT-263and r = − 0.3867, p = 0.0012 for ABT-737). WhileMDM2 inhibitors alone were not effective in the in vitroscreens of SCLC cell lines [24, 38] and TP53 is nearlyuniversally inactivated in SCLC [3, 5], surprisingly, thecombination of the MDM2 inhibitor JNJ-27291199 withetoposide and carboplatin resulted in enhanced cytotox-icity against SCLC cell lines [38].
Krushkal et al. Clinical Epigenetics (2020) 12:93 Page 17 of 28

Table
4Correlatio
nsin
cand
idatege
neregion
swith
log(IC50)of
cand
idateantitum
oragen
tsthat
satisfiedp F
DR<0.1
Age
ntInhibitor
catego
ryGen
eRegion
Cytob
and
Num
berof
prob
esin
gene
region
ρforaverage
region
methylatio
nvs
log(IC50)
p FDRforaverage
region
methylatio
nvs
log(IC50)
Highe
st|r|
for
expression
vslog(IC50)
Lowestpfor
expression
vslog(IC50)
Highe
st|ρ|for
expression
vsregion
methylatio
n
Lowestpfor
expression
vsaverageregion
methylatio
n
Transcrip
twith
lowestpfor
expression
vslog(IC50)
ABT-263
Bcl-2
MDM2
TSS200
12q1
57
0.5234
0.0617
−0.4017
0.0008
−0.4269
0.0004
NM_002392
(MDM2)
ABT-737
Bcl-2
MDM2
TSS200
12q1
57
0.5287
0.0617
−0.3867
0.0012
−0.4269
0.0004
NM_002392
(MDM2)
BEZ-235
mTO
RPT
GFR
NTSS1500
1p13.1
50.5565
0.0352*
−0.2189
0.0752
−0.4786
4.81
×10
−5
NM_020440
(PTG
FRN)
Sapanisertib
mTO
RIGFB
P5TSS1500
2q35
50.5107
0.0896
0.2969
0.0147
0.2035
0.1013
NM_000599
(IGFBP5)
TAK-960
PLK-1
KDM1A
Gen
ebo
dy1p
36.12
110.5486
0.0352*
−0.2325
0.0583
−0.2436
0.0487
NM_001009999
(KDM1A)
Num
berof
prob
esin
gene
region
prov
ides
thenu
mbe
rof
prob
esan
notatedby
theIllum
inaInfin
ium
Methy
latio
nEPICBe
adChipman
ifest
anno
tatio
n[18]
accordingto
theUCSC
geno
mebrow
seras
belong
ingto
apa
rticular
gene
region
;methy
latio
nbe
ta-value
sof
allsuchprob
eswerecombine
dto
compu
tetheaverag
eregion
methy
latio
nvalue.
Correlatio
nresults
oflog 2
ofexpression
ofthemoststrong
lycorrelated
tran
scrip
twith
gene
region
methy
latio
nan
dwith
log(IC50
)areprov
ided
forthosege
nes.p F
DR,p
valuead
justed
forfalsediscov
eryrate,accou
ntingformultip
letestingof
1376
cand
idatege
neregion
san
d44
agen
tslistedin
Supp
lemen
tary
Table2.
*pFD
R<0.05
ρSp
earm
ancorrelationcoefficient,r
Pearsoncorrelationcoefficient
Krushkal et al. Clinical Epigenetics (2020) 12:93 Page 18 of 28

Methylation of the TSS1500 of IGFBP5, which encodesan endogenous IGF1R inhibitor and is expressed at lowlevels in the POU2F3-regulated tuft cell-like SCLC sub-type and at high levels in the subtype with high ASCL1expression [12, 13], was associated with resistance to themTOR inhibitor INK-128 (sapanisertib; ρ = 0.5107, pFDR= 0.0896; Table 4). This association may not be medi-ated by IGFBP5 transcription, as methylation of theTSS1500 region of IGFBP5 was weakly positively associ-ated with expression of the IGFBP5 transcript NM_000599 (cluster ID 2598828), which was not significant(ρ = 0.2035, p = 0.1013; Table 4). Using less stringentcriterion of pFDR < 0.15, methylation of IGFBP5 was alsoassociated with resistance to another mTOR inhibitor,BEZ-235, and with Aurora kinase inhibitors ENMD-2076, SNS-314, and MLN-8237 (0.4549 ≤ ρ ≤ 0.4881,Supplementary Table 8). Neither individual probes norgene regions of either IGF1R or POU2F3, the productsof which are involved in regulatory cascades downstreamor upstream of IGFBP5 [12, 13], were strongly associatedwith any agents.The probes cg25627144 and cg18124721 in the
TSS200 of the DLL3 (delta-like ligand 3) gene and theentire TSS200 region were associated with the Bcl-2 in-hibitor ABT-737 (ρ = 0.5506 and 0.4850, pFDR = 0.0515and 0.1366 for probes; ρ = 0.4762, pFDR = 0.1260 forTSS200; Table 3, Supplementary Tables 6, 7 and 8), andcg25627144 was also associated with another Bcl-2 in-hibitor, ABT-263 (ρ = 0.4926, pFDR = 0.1282; Supple-mentary Table 7). DLL3, encoding a Notch pathwayregulator and a promising clinical target in SCLC treat-ment, is upregulated in ASCL1-high SCLC tumors; incontrast, DLL3 expression is diminished in RB wild-typetumors and in SCLC tumors not expressing neuroendo-crine markers [2, 3, 39]. Methylation of all DLL3 probeswas significantly negatively associated with expression ofthe DLL3 transcript, NM_016941 (cluster ID 3833122; ρ= − 0.4426, p = 0.0002 for the strongest association). Ex-pression of that transcript was associated with sensitivityto ABT-737 (r = 0.4139, p = 0.0005). Association oflower DLL3 methylation and increased expression withsensitivity to Bcl-2 inhibitors suggest that the use of theBcl-2 inhibitors in the ASCL1-high SCLC lineage maybe considered. While methylation of individual probesand of the upstream region (TSS200 and TSS1500) ofASCL1 was modestly positively correlated with ABT-737, this association was not significant after adjustmentfor multiple testing (ρ ≤ 0.3687, pO ≥ 0.0023, pFDR ≥0.4024 for probes; ρ = 0.2862, pO = 0.0198, pFDR ≥0.4024 for the TSS200). Response to ABT-737 was asso-ciated with multiple genes (Tables 3 and 4; Supplemen-tary Tables 6, 7 and 8), indicating that it may involve acomplex interplay of factors and may not be limited tospecific SCLC lineages.
Despite this and other modest non-significant correla-tions, methylation of master SCLC lineage regulatorsASCL1, NEUROD1, and POU2F3 [2] was not signifi-cantly associated with any agents after adjustment formultiple testing. Further examination of SCLC lineagedrivers [2, 3] showed that methylation of the probecg20782778 in the body of YAP1 (encoding yes-associated protein 1 which regulates the Hippo pathway[2, 65]) was associated with resistance to the mTOR in-hibitor rapamycin; ρ = 0.4904, pO = 2.91 × 10⁻⁵, pFDR =0.1282; Supplementary Tables 6 and 7. Methylation ofthat probe was negatively correlated with expression ofthe YAP1 transcript NM_001130145 (cluster ID3346453; ρ = − 0.4549, p = 0.0001; Supplementary Table6), which was weakly negatively associated withlog(IC50) of rapamycin (r = − 0.2218, p = 0.0712). Weobserved additional associations in the same direction ofthe probe cg20782778 in the gene body and of the up-stream regions of YAP1 with resistance to other mTORinhibitors; however, they did not reach statistical signifi-cance after adjustment for multiple testing (ρ = 0.4345,pO = 0.0003, pFDR = 0.2215 for cg20782778 andlog(IC50) of MK-8669; ρ = 0.4128, pO = 0.0006, pFDR =0.2253 between TSS1500 and log(IC50) of sapanisertib;data not shown). Our results suggest an association be-tween decreased YAP1 methylation, increased YAP1transcription, and increased sensitivity to mTOR inhibi-tors. They are in agreement with a report that theYAP1-high SCLC subtype may be sensitive to mTOR in-hibitors [65]. That study also found an association be-tween increased expression of another Hippo pathwayregulator, TAZ, and rapamycin sensitivity in SCLC [65].In our data, associations of TAZ methylation and expres-sion with rapamycin sensitivity were in the same direc-tion as those for YAP1, but weaker. Methylation ofTSS200 of TAZ was weakly associated with resistance torapamycin (ρ = 0.2890, pO = 0.0186), in the same direc-tion as that of YAP1. TAZ expression was weakly associ-ated with log(IC50) of rapamycin in the same directionas that of YAP1 (r = − 0.2813, p = 0.0211).Amplification and overexpression of MYC, which en-
codes c-Myc, has been associated with SCLC sensitivityto Aurora kinase inhibitors and with a loss of neuroen-docrine markers and the ASCL1-negative andNEUROD1-positive lineage of SCLC [2, 5, 8, 10], includ-ing an inverse correlation between MYC and ASCL1 ex-pression in this dataset [24]. In contrast to MYC,expression of MYCL1 is elevated in ASCL1-high SCLCtumors [2]. In our dataset, multiple probes in the bodiesof MYC and MYCL1 and in the upstream region and thebody of MYCN showed modest associations (0.4060 ≤|ρ| ≤ 0.5432) with multiple agents. While some of thesecorrelations were not significant after adjustment formultiple testing (8.68 × 10⁻⁵ ≤ pO ≤ 0.0006, pFDR ≥
Krushkal et al. Clinical Epigenetics (2020) 12:93 Page 19 of 28
0.1657; data not shown), MYC probes cg08526705 andcg00163372 were associated with resistance to the PLK-1 inhibitor TAK-960 (statistically significant forcg08526705 in the body of MYC and TAK-960, ρ =0.5432, pO = 2.45 × 10⁻⁵, pFDR = 0.0540; Table 3, Sup-plementary Tables 6 and 7) and to Aurora kinase inhibi-tors SCH-1473759 and GSK-461364, consistent withearlier studies of SCLC and with interaction of Aurorakinase A with c-Myc [8, 10, 58]. In MYCL1, cg00295382was associated with TAK-960, and in MYCN,cg06520300 and cg17360299 were associated with resist-ance to the Wnt inhibitor salinomycin (VS-507), andcg04609952 was associated with sensitivity to the mTORinhibitor MK-8669. In agreement with individual probes,methylation of the 5′UTR region of MYCN was corre-lated with resistance to VS-507 (salinomycin; ρ = 0.4552,pO = 0.0001, pFDR = 0.1406; Supplementary Table 8).MYC, MYCL1, and MYCN are recurrently amplified inSCLC [8, 66], which results in their overexpression andcould potentially increase their methylation measures.Consistent with the effect of MYC amplification, allMYC probes associated with drug response were posi-tively correlated with expression of the MYC transcriptNM_002467, including some statistically significant as-sociations (ρ = 0.2652, p = 0.0314 for cg00163372; Table3). Intriguingly, the probe cg00295382 of MYCL1 andthe 5′UTR of MYCN were significantly negatively asso-ciated with gene expression (ρ = − 0.6744, p = 5.37 ×10⁻¹⁰ for cg00295382 of MYCL1 and ρ = − 0.4603, p =0.0001 for the 5′UTR of MYCN). Accordingly, expres-sion of the MYCN transcript NM_005378 (Affymetrixcluster ID 3349293) was associated with sensitivity tosalinomycin (ρ = − 0.2376, p = 0.0529; SupplementaryTable 8), in the opposite direction from the 5′UTRmethylation. The 5′UTR of MYCN contains importantregulatory elements for promoter activity in neuroblast-oma [67]. This suggests a possibility that while MYCNamplification may have the main effect on MYCN over-expression, in some cases methylation of its 5′UTR mayaffect its expression in SCLC and influence the responseto salinomycin.Methylation of probes in the non-neuroendocrine
lineage marker EPHA2 [5], predominantly in the up-stream regions, was associated with resistance to Aurorakinase inhibitors ENMD-2076, SCH-1473759, and TAK-901, and the PLK-1 inhibitor GSK-461364 (0.4869 ≤ ρ ≤0.5233, 0.0876 ≤ pFDR ≤ 0.1343; Table 3, SupplementaryTables 6 and 7). Consistent with association of individ-ual EPHA2 probes, methylation of its TSS200 was asso-ciated with resistance to ENMD-2076, SCH-1473759,and TAK-901 (0.4549 ≤ ρ ≤ 0.4893, 0.1163 ≤ pFDR ≤0.1406; Supplementary Table 8). Methylation of allEPHA2 probes and of the TSS200 region were negativelycorrelated with EPHA2 transcript expression (NM_
004431, cluster ID 2397948; ρ = − 0.3832, pO = 0.0015for TSS200; Supplementary Table 8). Association ofEPHA2 expression with log(IC50) of each Aurora kinaseinhibitor was very weak but negative for all agentsENMD-2076, SCH-1473759, and TAK-901 (r ≥ −0.2090, p ≥ 0.0897; Supplementary Table 8), suggestingthat cell lines with higher EPHA2 expression and a ten-dency for lower EPHA2 methylation were slightly moresensitive to these agents.The 3′UTR of the non-neuroendocrine lineage marker
CD151 [5] was associated with sensitivity to Bcl-2 inhibi-tors ABT-263 and ABT-737 (ρ = − 0.4651 and − 0.4809,pFDR = 0.1347 and 0.1260, respectively; SupplementaryTable 8). Consistent with this association, the probecg24508095 in the 3′UTR was associated with sensitivityto ABT-737 (ρ = − 0.4809, pO = 4.37 × 10⁻⁵, pFDR =0.1484; Supplementary Table 7). While the role of the 3′UTR is unclear, its methylation was weakly negativelyassociated with expression of the CD151 transcript NM_004357 (cluster ID 3316344; ρ = − 0.2970, p = 0.0154),and increased CD151 expression was associated with re-sistance to both agents (r = 0.3781, p = 0.0016 for ABT-263; r = 0.4266, p = 0.0003 for ABT-737; SupplementaryTable 8).In recent studies, gene and protein expression of
SLFN11 have emerged as significant predictors of SCLCresponse to DNA-damaging agents including topoisom-erase I and II inhibitors, PARP inhibitors, and platinumcompounds [3, 23, 24, 38, 68–71]. The SLFN11 proteinis epigenetically silenced by EZH2 via H3K27me3 his-tone methylation, leading to resistance to a combinedtherapy of etoposide and a platinum compound [23].While association of SLFN11 expression with sensitivityto DNA-damaging agents in this dataset was highly sig-nificant [24, 38], correlations of methylation of SLFN11probes and regions with drug response had pFDR > 0.1.The strongest associations of SLFN11 probes and re-gions, with pFDR < 0.15, are listed in Supplementary Ta-bles 6, 7 and 8. These include correlations ofmethylation of the gene body with sensitivity to BMN-673 (talazoparib), teniposide, and topotecan (− 0.4871 ≤ρ ≤ − 0.4617, 0.1163 ≤ pFDR ≤ 0.1347; SupplementaryTable 8). In addition, methylation of the upstream re-gions and of the body of SLFN11 was associated with avariety of topoisomerase inhibitors and PARP inhibitorswith pFDR > 0.15, including correlations of topotecan,teniposide, and talazoparib with the 3′UTR, and correla-tions of the 3′UTR and gene body with etoposide, MK-4827, olaparib, and PF-01367338 or rucaparib (− 0.4436≤ ρ ≤ − 0.4110, pFDR ≥ 0.1731).Interestingly, methylation of the probes in the up-
stream regions was associated with drug resistance,whereas probes in the body and the 3′UTR of SLFN11were associated with sensitivity to DNA damaging
Krushkal et al. Clinical Epigenetics (2020) 12:93 Page 20 of 28

agents. For example, cg18108623 in the TSS1500 had ρ= 0.4989 and 0.4811 for teniposide and topotecan, re-spectively, whereas cg18124488 in the gene body had ρ= − 0.4871 with topotecan (0.1251 ≤ pFDR ≤ 0.1484; Sup-plementary Table 7). We also observed many modestnon-significant associations of methylation of probes inthe TSS1500 and TSS200 upstream regions with resist-ance, and of probes in the gene body and 3′UTR withsensitivity to teniposide, talazoparib, etoposide, topote-can, olaparib, MK-4827, and PF-01367338 (− 0.4638 ≤ ρ≤ − 0.4002 for probes in the gene body and the 3′UTR,0.4079 ≤ ρ ≤ 0.4679 for probes in the 5′UTR; pFDR ≥0.1657; data not shown). Despite multiple associations ofprobes in the body and in the 3′UTR with sensitivity toDNA-damaging agents, methylation of the gene bodywas very strongly positively correlated with expression ofthe SLFN11 transcript NM_001104587 (cluster ID3753500, ρ = 0.7475, p = 5.61 × 10⁻¹³). In contrast,methylation of the probes cg03668718, cg18108623, andcg18608369 in the TSS1500 and TSS200 was not onlyassociated with resistance to DNA-damaging agents, butit was also strongly negatively associated with transcriptexpression (− 0.7134 ≤ ρ ≤ − 0.6129, 1.80 × 10⁻¹¹ ≤ pO ≤4.50 × 10⁻⁸ for probes; ρ = − 0.6403, pO = 7.07 × 10⁻⁹
for TSS1500; ρ = − 0.6935, pO = 1.09 × 10⁻¹⁰ forTSS200; selected examples are shown in SupplementaryFigure 3 A-F). The SCLC-A lineage [2] had an increasednumber of cell lines with higher methylation of theSLFN11 TSS200 region (Supplementary Figure 3G). Ourresults suggest that methylation of the SLFN11 upstreamregions but not of its gene body or the 3′UTR maydownregulate its expression, increasing drug resistance.They are consistent with our earlier analysis of NCI-60cell lines, which did not include SCLC, that showed theeffect of methylation of these and additional SLFN11probes in the CpG island in the upstream promoter re-gion on resistance to platinum drugs [20].EZH2, commonly overexpressed in SCLC, is involved
in upregulation of DNA methyltransferases, increasedmethylation, and epigenetic silencing of SLFN11 [3, 23].The 5′UTR of EZH2 and several probes in that regionwere associated with resistance to the Aurora kinase in-hibitors AMG-900, CYC-116, and SNS-314, and to theFGFR inhibitor BGJ-398 (0.4634 ≤ ρ ≤ 0.4988, 2.64 ×10⁻⁵ ≤ pO ≤ 2.08 × 10⁻⁶, 0.1094 ≤ pFDR ≤ 0.1247 for the5′UTR region; Fig. 4; Supplementary Table 8; informa-tion about individual probes is provided in Supplemen-tary Data 2D). At the epigenome-wide level, the 5′UTRwas associated with resistance to the lysophosphatidicacid acyltransferase-β inhibitor CT-32228 (ρ = 0.5813,pO = 3.08 × 10⁻⁷, pFDR = 0.1396; Supplementary Table 5;Supplementary Figure 4). No other EZH2 regions wereassociated with drug response. The role of methylationof the 5′UTR is unclear because it was positively
associated with transcript expression (NM_004456, clus-ter ID 3078348), and EZH2 expression was not associ-ated with response to any of these agents (|r| < 0.15;Supplementary Tables 5 and 8).BCL2 is one of the most highly differentially methyl-
ated genes in SCLC, with variable methylation and ex-pression among SCLC subtypes; by contrast, it isepigenetically silenced in normal lung tissue [11]. Withinits gene body, several probes showed different directionsof association with response to Bcl inhibitors GX15-070and ABT-737 and the Aurora A kinase/tyrosine kinaseinhibitor ENMD-2076 in the analysis of candidate genesand preselected agents, and one probe showed a trendfor association with the CDK inhibitor R-547 at theepigenome-wide level (Supplementary Data 2D and Sup-plementary Tables 6 and 7).
DiscussionOur study did not pre-select any DNA methylationprobes. We analyzed probes with high-quality measuresbased on the detection p values and filtered out theprobes overlapping with SNPs [26, 27]. After filtering, allthe remaining probes were included in computation ofgene region-averaged methylation values. We reportedall top probes and all gene regions that were strongly as-sociated with drug response and satisfied the significancethresholds. Our analyses were performed at the epige-nome level and also for candidate genes and drug agentsrelevant to SCLC pathogenesis and potential treatment.Alternative approaches previously employed in severalanalyses of other cancer cell line methylome datasets in-cluded prioritization and selection of probes based ontheir proximity to the location of genes, promoter re-gions, and CpG islands, and/or association with tran-script expression, and the focus on gene-averaged orpromoter region-averaged methylation measures [19,44]. The application of different analytical approaches tolarge epigenome datasets may help find novel targetsthrough different prioritization and ranking of the sig-nificant results, and it may help provide additional waysfor validation of the findings. Our analysis of TREX1showed that while our novel initial findings of associ-ation of gene expression and drug response with DNAmethylation measures were based on all probes and generegions without prior pre-selection, these associationswere validated by the correlations of the CCLE andGDSC data which were based on promoter-enrichedmethylation measures.Our study focused on significant associations of DNA
methylation-based measures in probes and gene regionswith drug response. We further explored whether suchassociations could be explained by the strength and thedirection of the correlations of DNA methylation withgene expression. The genes most likely to have the direct
Krushkal et al. Clinical Epigenetics (2020) 12:93 Page 21 of 28
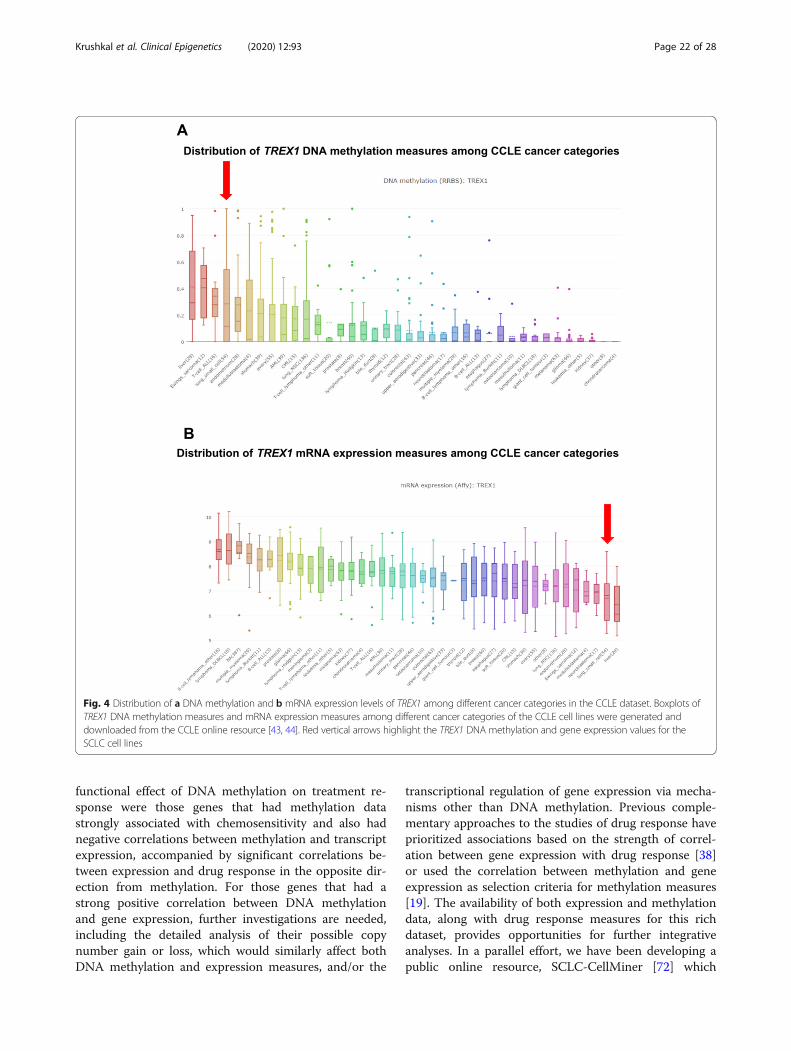
functional effect of DNA methylation on treatment re-sponse were those genes that had methylation datastrongly associated with chemosensitivity and also hadnegative correlations between methylation and transcriptexpression, accompanied by significant correlations be-tween expression and drug response in the opposite dir-ection from methylation. For those genes that had astrong positive correlation between DNA methylationand gene expression, further investigations are needed,including the detailed analysis of their possible copynumber gain or loss, which would similarly affect bothDNA methylation and expression measures, and/or the
transcriptional regulation of gene expression via mecha-nisms other than DNA methylation. Previous comple-mentary approaches to the studies of drug response haveprioritized associations based on the strength of correl-ation between gene expression with drug response [38]or used the correlation between methylation and geneexpression as selection criteria for methylation measures[19]. The availability of both expression and methylationdata, along with drug response measures for this richdataset, provides opportunities for further integrativeanalyses. In a parallel effort, we have been developing apublic online resource, SCLC-CellMiner [72] which
Fig. 4 Distribution of a DNA methylation and b mRNA expression levels of TREX1 among different cancer categories in the CCLE dataset. Boxplots ofTREX1 DNA methylation measures and mRNA expression measures among different cancer categories of the CCLE cell lines were generated anddownloaded from the CCLE online resource [43, 44]. Red vertical arrows highlight the TREX1 DNA methylation and gene expression values for theSCLC cell lines
Krushkal et al. Clinical Epigenetics (2020) 12:93 Page 22 of 28

integrates various molecular measurements for SCLCcell lines including whole exome sequencing, gene ex-pression, miRNA expression, methylation, and copynumber data, along with drug response information pre-sented as drug activity. This resource will allow users toquery and visualize the correlations for genes of interest.Our association analysis of DNA methylation with cell
line response to chemotherapy agents elucidated verystrong associations of TREX1 methylation and expres-sion with SCLC sensitivity to Aurora kinase inhibitors,antimitotic agents, a CDK inhibitor, and an ATR inhibi-tor. DNase III, which is encoded by TREX1, generatessingle-stranded DNA (ssDNA) during resolution ofchromatin bridges under telomere crisis in malignantcells, and this TREX1 activity has been proposed to playa role in chromothripsis [73, 74]. TREX1 is also involvedin the maintenance of immune tolerance to self-DNA ofthe cytosolic DNA-sensing pathway, acting in an oppos-ing manner to the STING regulator [75]. The absence ofTREX1 or inactivating mutations in TREX1 result in theupregulation of the cGAS-STING-mediated type I inter-feron response and systemic inflammation [76]. Theseroles of TREX1 may provide an explanation for the asso-ciation of TREX1 methylation and expression with re-sponse to Aurora kinase inhibitors, agents targetingmicrotubule assembly, and with a CDK inhibitor, asthese agents interfere with different aspects of cell cycle,mitosis, and cell proliferation. Association of TREX1methylation with SCLC response to the ATR inhibitorCpd45 may be consistent with the previously reportedTREX1 upregulation in cancer cells in response to DNAdamaging agents and to UV light, and roles in sensitivityand response to DNA-damaging agents, DNA repair,and/or DNA degradation after drug treatment [50–52],including degradation of ssDNA fragments by TREX1and TREX1 interaction with PARP1 (poly(ADP-ribose)polymerase-1) in response to DNA damage [77, 78].SCLC cell lines had among the highest TREX1 methy-
lation and among the lowest TREX1 expression in theCCLE (Fig. 4), suggesting the possibility that low TREX1in SCLC may lead to vulnerability, increasing SCLC sus-ceptibility to treatment by Aurora kinase inhibitors.Therefore, TREX1 may represent a novel molecularmarker or target in SCLC.Our analysis of DNA methylation measures and drug
response utilized SCLC cell line data. Previous studieshave shown that SCLC cell lines have higher overallDNA methylation than do primary tumors [11]. The ab-sence of primary tumor samples is a limitation of ourstudy. Despite reported methylation differences betweenthe cell lines and primary tumor data and the lack of pa-tient specimens in our analysis, associations identified inour study using cell line data, including those forTREX1, suggest novel therapeutic targets for potential
clinical use. A broader intriguing question is whetherTREX1 would be a useful molecular target for treatmentof other cancers. A combined analysis of breast cancerpatients in the METABRIC (Molecular Taxonomy ofBreast Cancer International Consortium) cohort sug-gested a lower survival probability in patients with di-minished TREX1 expression [77]. However, thedifferences in patient survival in that combined datasetcould also be attributed to other molecular differencesamong various breast cancer subtypes. By contrast, ana-lysis of a BRCA1-deficient, p53-deficient geneticallyengineered mouse model of triple negative breast cancer(TNBC) and analysis of TNBC cell lines showed that ac-tivation of the cGAS/STING pathway within the tumorincreased the efficacy of PARP inhibitors through tumorcell response and increased immune activation in thetumor microenvironment, with more profound benefitsin homologous recombination repair-deficient tumorcells [79]. Similarly, the STING pathway is activated inSCLC tumor cells in response to PARP inhibition andCHK1 inhibition [80]. These observations provide anadditional argument that TREX1, an antagonist of theSTING-activated molecular pathway, may present an at-tractive target in SCLC treatment and possibly in othercancer categories.Lineage-specific differentiation of SCLC tumors based
on expression of several master regulators [2] has previ-ously been associated with distinct methylation patterns[11, 15]. While many associations of SCLC methylationpatterns with drug response were not specific to particu-lar SCLC lineages in our dataset, several lineage-specificassociations, e.g., that of YAP1 methylation and expres-sion with rapamycin confirming the results from an earl-ier study [65], and methylation and expression of DLL3,which is upregulated in ASCL1-high tumors, with Bcl-2inhibitors were identified. Among non-neuroendocrinelineage markers, methylation of EPHA2 was associatedwith Aurora kinase inhibitors and a PLK-1 inhibitor,whereas that of CD151 was associated with Bcl-2inhibitors.We did not observe any strong association pattern be-
tween methylation and expression of TREX1 regionswith SCLC lineage categories. Methylation of TREX1TSS1500 and TSS200 regions was weakly associated withASCL1 expression (Pearson r = − 0.309, pO = 0.0117 forTSS200), whereas TREX1 expression was weakly associ-ated with NEUROD1 expression (r = − 0.368, pO =0.02953). Interestingly, whereas c-Myc directly upregu-lates expression of Aurora kinase genes and promotes aneuroendocrine-low subtype of SCLC which is sensitiveto Aurora kinase inhibitors [10, 57], the expression ofTREX1 was not associated with transcriptional levels ofeither MYC, MYCL, or MYCN (|r| < 0.13), even thoughmethylation of the 5′UTR and the first exon of TREX1
Krushkal et al. Clinical Epigenetics (2020) 12:93 Page 23 of 28

was weakly associated with MYC expression (r = 0.328and 0.326, pO = 0.0076 and 0.0072, respectively; data notshown).DNA methylation in SCLC has been reported to be
strongly associated with EZH2 expression [11]. Decreasedmethylation of the 5′UTR of EZH2 and lower EZH2 ex-pression were more common in SCLC cell lines from sub-types other than SCLC-A (Supplementary Figure 4C andD). Considering that no other EZH2 regions were associ-ated with drug response or with SCLC lineage differenti-ation, and that methylation of the 5′UTR and EZH2expression were positively correlated, interpretation of theassociations of the 5′UTR requires further biological in-vestigation. We observed correlations between EZH2expression and expression of YAP1 (transcript cluster ID3346453; r = − 0.397, pO = 0.0010), MYCN (2470838; r =0.328, pO = 0.0071) and, most strongly, MYC (3115504; r= − 0.512, pO = 1.098 × 10⁻⁵), which suggest a potentialmechanism linking expression of SCLC master lineageregulators and epigenetic pathways of lineage differenti-ation; however, these correlations do not provide evidencethat this mechanism could involve the methylation of theEZH2 promoter region.Consistent with earlier analyses of the NCI-60 cell
lines [19, 20] and with growing evidence for the roleof epigenetic mechanisms in SLFN11 inactivation [21,69, 81], we found that increased methylation of theSLFN11 promoter was negatively correlated withSLFN11 expression and increased resistance of SCLClines to DNA-damaging agents (Supplementary Figure3). Association of SCLC promoter methylation withgene expression and with drug sensitivity are inagreement with the findings of He et al. [82], whoshowed that increased methylation of the SLFN11promoter in colorectal cancer cell lines and primarytumors led to downregulation of SLFN11 expression,increased tumor resistance to cisplatin, and decreasedthe 5-year overall patient survival and 5-yearprogression-free survival.Our study utilized a large comprehensive dataset of
methylation measures derived from the IlluminaInfinium MethylationEPIC BeadChip array, whichsubstantially increased the density of available methy-lation measures for SCLC compared with data fromearlier SCLC studies which utilized lower densitymeasures [11, 15]. We analyzed a large set of drugscreening measures and genome-wide transcript andmiRNA expression measures. We conducted a com-prehensive analysis of association of pre-treatmentSCLC methylation and expression with response tomultiple approved and investigational chemotherapyagents. We focused on the gene targets identified bystrong associations of methylation signals with drugresponse as the primary biological leads.
Our findings of methylation signals correlated withdrug response confirmed multiple previously identifiedSCLC associations with drug response from gene expres-sion studies, e.g., those for SLFN11 and YAP1. Severalgenes, e.g., EPAS1 (HIF2A), EZH2, and BCL2, that werepreviously suggested to be involved in SCLC drug re-sponse based on their expression, protein activity, drugaction, and/or distinct methylation patterns in SCLC[11, 23, 24, 83, 84] showed complex patterns of associa-tions between methylation and expression (EPAS1 andEZH2) or between methylation and drug response(BCL2). This suggests that the expression and activity oftheir products may be affected by other factors inaddition to DNA methylation. We observed a number ofcorrelations which involved candidate therapy agentsthat had been previously identified in earlier studieswhich used in vitro data, animal models, and clinicaldata. We report multiple associations between suchagents and genetic methylation markers, which couldpotentially be utilized to stratify SCLC patients for ther-apy response. We also report multiple novel associationsof gene methylation with drug responses. These resultssuggest new therapeutic targets and drug combinationsfor SCLC treatment which may be beneficial for specificepigenetic tumor landscapes. Some of the newly discov-ered associations, e.g., those for TREX1, may suggest po-tential novel direct drug targets in tumors with residualTREX1 expression, and also add to the accumulatingbody of evidence about the importance of upregulationof the cGAS/STING pathway in treatment of cancer pa-tients [79, 80, 85]. Similarly, other associations reportedin our study may suggest novel therapy targets, indicatepotential broader molecular pathways of interest, andprovide biomarkers for patient stratification. Due to thedynamic nature of DNA methylation and expression,and rapid acquisition of chemoresistance by SCLC cellsin response to treatment, it would be important to con-tinue future investigations of drug response by compar-ing pre- and post-treatment DNA methylation andexpression levels and to further analyze the dynamic na-ture of DNA methylation, expression, alternative spli-cing, and post-transcriptional modifications that maydrive the chemoresistance of tumor cells.
ConclusionsWe completed a comprehensive analysis of a large SCLCDNA methylation dataset and examined associations ofde novo DNA methylation with response to 526 chemo-therapeutic agents. Our analysis of methylation dataconfirmed previously known association results betweengene expression and drug response for several knowngenes, e.g., between SLFN11 and DNA damaging agentsand between YAP1 and rapamycin. We discovered mul-tiple novel associations which suggest potential targets
Krushkal et al. Clinical Epigenetics (2020) 12:93 Page 24 of 28

for single agent treatment and drug combination therap-ies. Methylation and expression of TREX1 were associ-ated with response to multiple drug categories, whichmay suggest a possible mechanism of vulnerability toAurora kinase inhibitors for SCLC, which has lowTREX1 expression compared to other cancer categories.These associations also suggest that targeting TREX1may provide important therapeutic benefits in thoseSCLC tumors which have residual TREX1 expression.
Supplementary informationSupplementary information accompanies this paper at https://doi.org/10.1186/s13148-020-00876-8.
Additional file 1: Supplementary Table 1. SCLC cell lines used incorrelation analysis of methylation, transcript and miRNA expression, anddrug response data.
Additional file 2: Supplementary Table 2. List of selected singleagents, their target genes and additional genes potentially involved intheir response, which were examined in detailed DNA methylationanalysis.
Additional file 3: Supplementary Table 3. List of methylation probeswith the strongest correlations with log(IC50) measure of drug response,which satisfied the Spearman correlation pO < 9.42 × 10⁻⁸ in theepigenome-wide analysis of all antitumor agents.
Additional file 4: Supplementary Table 4. Gene level summary formethylation probe-drug correlations involving at least one methylationprobe with pO < 9.42 x 10⁻⁸ in the epigenome-wide analysis of all antitu-mor agents.
Additional file 5: Supplementary Table 5. Gene regions with FDRadjusted p-value pFDR < 0.15 for Spearman correlations of average generegion methylation with log(IC50) of antitumor agents in the epigenome-wide analysis of all antitumor agents.
Additional file 6: Supplementary Table 6. Candidate genes withmethylation probes that had correlations with log(IC50) of candidateantitumor agents satisfying pFDR < 0.15.
Additional file 7: Supplementary Table 7. List of methylation probesin candidate genes which satisfied the FDR adjusted p-value pFDR < 0.15for Spearman correlations with log(IC50) measure of response to thecandidate agents listed in Supplementary Table 2.
Additional file 8: Supplementary Table 8. Correlations of candidategene regions with log(IC50) of candidate antitumor agents that satisfiedpFDR < 0.15.
Additional file 9: Supplementary Data 1. Methylation beta-valuesand Illumina EPIC array annotation of probes which passed QC and filter-ing and are located within or adjacent to the SNED1 gene.
Additional file 10: Supplementary Data 2. A. Associations ofmethylation beta-values of individual probes in the SNED1 gene withlog(IC50) of the HDAC inhibitor 4SC-202 (NSC 759905). B. Associations ofmethylation beta-values of individual probes in SNED1 with log(IC50) ofthe HDAC inhibitor vorinostat (NSC 701852). C. Associations of SNED1transcript expression with response to HDAC inhibitors. D. Additional in-formation about associations of probes in selected genes.
Additional file 11: Supplementary Data 3. Methylation beta-valuesand Illumina EPIC array annotation of probes which passed QC and filter-ing and are located within or adjacent to the TREX1 gene.
Additional file 12: Supplementary Data 4. Average methylation ofTREX1 gene regions.
Additional file 13: Supplementary Figure 1. Scatterplots of CEP350DNA methylation and measures of SCLC drug sensitivity. A. Methylationof the 3’UTR region of CEP350 vs log(IC50) of ABT-348. Horizontal scalerepresents average methylation beta-values of the 3’UTR of CEP350,whereas the vertical scale represents the log(IC50) values. B. Methylation
of the 3’UTR region of CEP350 vs log(IC50) of TAK-901. Horizontal scalerepresents the average methylation beta-values of the CEP350 3’UTR re-gion, whereas the vertical scale represents the log(IC50) values of TAK-901.
Additional file 14: Supplementary Figure 2. Scatterplots of EPAS1probe DNA methylation, transcript expression, and log(IC50) of AMG-900.A. Methylation of the EPAS1 probe cg08937075 vs log(IC50) of AMG-900.Horizontal scale represents methylation beta-values, whereas the verticalscale represents the log(IC50) values. B. Methylation of the EPAS1 probecg08937075 vs expression of the EPAS1 transcript 2480383. Horizontalscale represents the methylation beta-values, whereas the vertical scaleshows the log2-transformed gene expression.
Additional file 15: Supplementary Figure 3. A-F. Scatterplots ofSLFN11 probe and region DNA methylation, transcript expression, anddrug response. Plotted are methylation beta-values, log2-transformed ex-pression of the SLFN11 transcript 3753500, and log(IC50) measures ofdrug response. G. Methylation of the TSS200 of SLFN11 (vertical sidebar)plotted against the heatmap of SCLC cell line clustering based on expres-sion of the SCLC lineage marker genes. In the heatmap, rows representSCLC cell lines, whereas columns represent log2-transformed expressionof NEUROD1, ASCL1, ASLC2, INSM1, YAP1, and POU2F3. For those cell linesthat had previously reported SCLC lineage subtype classification [2], theirlineage subtype assignments are listed with their cell line names in thevertical right column of row labels.
Additional file 16: Supplementary Figure 4. A. Scatterplot of DNAmethylation (horizontal scale) of the 5’UTR of EZH2 vs log(IC50) of ABT-348 (vertical scale). B. Scatterplot of DNA methylation of the 5’UTR ofEZH2 (horizontal scale) vs log(IC50) of ABT-348 CT-32228 (vertical scale). C.Methylation of the 5’UTR of EZH2 (vertical sidebar) plotted against theheatmap of SCLC cell line classification based on lineage marker expres-sion. D. EZH2 expression (vertical sidebar) plotted against the heatmap ofSCLC cell line clustering based on expression of the SCLC lineage markergenes. In the heatmap, rows represent SCLC cell lines, whereas columnsrepresent log2-transformed expression of NEUROD1, ASCL1, ASLC2, INSM1,YAP1, and POU2F3. For those cell lines that had previously reported SCLClineage subtype classification [2], their lineage subtype assignments arelisted with their cell line names in the vertical right column of row labels.
AbbreviationsAML: Acute myeloid leukemia; ATR: Ataxia telangiectasia and Rad3-relatedprotein; ASCL1: Achaete-scute homolog 1; CDK: Cyclin-dependent kinase;CEP350: Centrosomal protein 350; DLL3: Delta-like ligand 3; DMSO: Dimethylsulfoxide; FDR: False discovery rate; GEO: Gene Expression Omnibus; GSK-3: Glycogen synthase kinase 3; HDAC: Histone deacetylase; HIF2α: Hypoxia-inducible factor 2α; KSP: Kinesin spindle protein; LSD1: Histone-modifyingprotein lysine demethylase 1A; LPAAT-β: Lysophosphatidic acidacyltransferase-β; METABRIC: Molecular Taxonomy of Breast CancerInternational Consortium; MLPH: Melanophilin; NCI: National Cancer Institute;NEUROD1: Neurogenic differentiation factor 1; QC: Quality control;PARP1: Poly(ADP-ribose) polymerase-1; pFDR: FDR-adjusted p value; PLK: Polo-like kinase; pO: p value prior to FDR adjustment; SCLC: Small cell lung cancer;SNP: Single nucleotide polymorphism; TSS: Transcriptional start site;SNED1: Sushi, nidogen and EGF like domains 1; UCSC: University of California,Santa Cruz; UTR: Untranslated region; YAP1: Yes-associated protein 1
AcknowledgementsWe thank the editor, Dr. Carmen Jerónimo, and anonymous reviewers fortheir helpful suggestions which improved the manuscript. We are grateful toDrs. Yingdong Zhao and Lisa McShane (Biometric Research Program, NCI) forcritical reading of this manuscript. We thank Dr. Hari Sankaran (BiometricResearch Program, NCI) for helpful discussions.The views expressed in this article are the personal opinions of the authorsand do not necessarily reflect policy of the US National Cancer Institute.
Authors’ contributionsBAT conceived the study, oversaw the completion and coordination ofexperimental and computational work and their integration with prior drugscreening studies, and selected pharmacological agents for detailed analysis.JK performed bioinformatic analyses including QC of methylation and
Krushkal et al. Clinical Epigenetics (2020) 12:93 Page 25 of 28

expression data, computation of region-specific methylation levels, and ana-lyzed statistical correlations between SCLC probe and gene methylation, ex-pression, and drug sensitivity. SulV performed bioinformatic analysis ofdistribution of DNA methylation values and carried out online database ana-lysis of gene synonyms for integration of methylation, gene expression, anddrug response data. DS participated in bioinformatic analysis of copy numbervariation and expression data of top gene hits. MK performed bioinformaticdata integration with the NCI Small Cell Lung Cancer Project. JK and BAT se-lected molecular components of drug target pathways and drafted themanuscript. JK, DS, WCR, YP, and BAT participated in the biological interpret-ation of the study results. TS carried out the processing and QC of drugscreening data and their integration into this study. DE oversaw the drugscreening effort. JC performed DNA extraction and QC. AR oversaw the ex-perimental effort of SCLC cell line growth and sample preparation for expres-sion and methylation analyses and drug screen. SudV, PSM, WCR, and YPparticipated in generation, QC, and normalization of methylation data and invalidation of the study findings. All authors edited the manuscript and readand approved its final version.
FundingThis project has been funded in whole or in part with federal funds from theNational Cancer Institute, National Institutes of Health, under Contract No.HHSN261200800001E. The content of this publication does not necessarilyreflect the views or policies of the Department of Health and HumanServices, nor does mention of trade names, commercial products, ororganizations that imply endorsement by the US Government. This researchwas supported [in part] by the Intramural Research Program of the NIH,National Cancer Institute, Center for Cancer Research (Z01 BC 006150). Thisresearch was supported [in part] by the Developmental TherapeuticsProgram in the Division of Cancer Treatment and Diagnosis of the NationalCancer Institute.
Availability of data and materialsMethylation data for the 760,637 filtered probes which passed the QC anddid not overlap with single nucleotide variants, average methylation valuesfor all gene regions, the drug and compound response data, and transcriptand miRNA expression measures adjusted for batch effects are available fromthe NCI Small Cell Lung Cancer Project site [86]. DNA methylation andtranscript and miRNA expression data are also available from NCBI GEO(accession numbers GSE145156, GSE73160, and GSE73161, respectively).
Ethics approval and consent to participateNot applicable.
Consent for publicationNot applicable. All authors concur with publication of this manuscript.
Competing interestsThe authors declare that they have no competing interests.
Author details1Biometric Research Program, Division of Cancer Treatment and Diagnosis,National Cancer Institute, NIH, 9609 Medical Center Dr., Rockville, MD 20850,USA. 2Molecular Pharmacology Group, Leidos Biomedical Research, Inc.,Frederick National Laboratory for Cancer Research, Frederick, MD 21702, USA.3Developmental Therapeutics Branch, Center for Cancer Research, NationalCancer Institute, NIH, Bethesda, MD 20892, USA. 4Genetics Branch, Center forCancer Research, National Cancer Institute, Bethesda, MD 20892, USA. 5DrugSynthesis and Chemistry Branch, Division of Cancer Treatment and Diagnosis,National Cancer Institute, Bethesda, MD 20892, USA. 6MolecularPharmacology Program, Division of Cancer Treatment and Diagnosis,National Cancer Institute, Bethesda, MD 20892, USA.
Received: 6 February 2020 Accepted: 26 May 2020
References1. Govindan R, Page N, Morgensztern D, Read W, Tierney R, Vlahiotis A, et al.
Changing epidemiology of small-cell lung cancer in the United States overthe last 30 years: analysis of the surveillance, epidemiologic, and end resultsdatabase. J Clin Oncol. 2006;24:4539–44.
2. Rudin CM, Poirier JT, Byers LA, Dive C, Dowlati A, George J, et al. Molecularsubtypes of small cell lung cancer: a synthesis of human and mouse modeldata. Nat Rev Cancer. 2019;19:289–97.
3. Gazdar AF, Bunn PA, Minna JD. Small-cell lung cancer: what we know, whatwe need to know and the path forward. Nat Rev Cancer. 2017;17:725–37.
4. National Cancer Institute list of drugs approves for lung cancer. Availablefrom: https://www.cancer.gov/about-cancer/treatment/drugs/lung.Accessed: 20 Sept 2019.
5. George J, Lim JS, Jang SJ, Cun Y, Ozretic L, Kong G, et al. Comprehensivegenomic profiles of small cell lung cancer. Nature. 2015;524:47–53.
6. Peifer M, Fernandez-Cuesta L, Sos ML, George J, Seidel D, Kasper LH, et al.Integrative genome analyses identify key somatic driver mutations of small-cell lung cancer. Nat Genet. 2012;44:1104–10.
7. Thomas A, Pommier Y. Small cell lung cancer: time to revisit DNA-damagingchemotherapy. Sci Transl Med. 2016;8:346 fs12.
8. Bragelmann J, Bohm S, Guthrie MR, Mollaoglu G, Oliver TG, Sos ML. Familymatters: how MYC family oncogenes impact small cell lung cancer. CellCycle. 2017;16:1489–98.
9. Pleasance ED, Stephens PJ, O'Meara S, McBride DJ, Meynert A, Jones D,et al. A small-cell lung cancer genome with complex signatures of tobaccoexposure. Nature. 2010;463:184–90.
10. Mollaoglu G, Guthrie MR, Bohm S, Bragelmann J, Can I, Ballieu PM, et al.MYC drives progression of small cell lung cancer to a variantneuroendocrine subtype with vulnerability to Aurora kinase inhibition.Cancer Cell. 2017;31:270–85.
11. Poirier JT, Gardner EE, Connis N, Moreira AL, de Stanchina E, Hann CL, et al.DNA methylation in small cell lung cancer defines distinct disease subtypesand correlates with high expression of EZH2. Oncogene. 2015;34:5869–78.
12. Huang YH, Klingbeil O, He XY, Wu XS, Arun G, Lu B, et al. POU2F3 is amaster regulator of a tuft cell-like variant of small cell lung cancer. GenesDev. 2018;32:915–28.
13. Pozo K, Minna JD, Johnson JE. Identifying a missing lineage driver in asubset of lung neuroendocrine tumors. Genes Dev. 2018;32:865–7.
14. Zhang Z, Huettner PC, Nguyen L, Bidder M, Funk MC, Li J, et al. Aberrantpromoter methylation and silencing of the POU2F3 gene in cervical cancer.Oncogene. 2006;25:5436–45.
15. Kalari S, Jung M, Kernstine KH, Takahashi T, Pfeifer GP. The DNA methylationlandscape of small cell lung cancer suggests a differentiation defect ofneuroendocrine cells. Oncogene. 2013;32:3559–68.
16. Brown R, Curry E, Magnani L, Wilhelm-Benartzi CS, Borley J. Poisedepigenetic states and acquired drug resistance in cancer. Nat Rev Cancer.2014;14:747–53.
17. Fahrer J, Kaina B. O6-methylguanine-DNA methyltransferase in the defenseagainst N-nitroso compounds and colorectal cancer. Carcinogenesis. 2013;34:2435–42.
18. Heyn H, Esteller M. DNA methylation profiling in the clinic: applications andchallenges. Nat Rev Genet. 2012;13:679–92.
19. Reinhold WC, Varma S, Sunshine M, Rajapakse V, Luna A, Kohn KW et al. TheNCI-60 methylome and its integration into CellMiner. Cancer Res. 2017;77:601-612.
20. Nogales V, Reinhold WC, Varma S, Martinez-Cardus A, Moutinho C, Moran S,et al. Epigenetic inactivation of the putative DNA/RNA helicase SLFN11 inhuman cancer confers resistance to platinum drugs. Oncotarget. 2016;7:3084–97.
21. Murai J, Thomas A, Miettinen M, Pommier Y. Schlafen 11 (SLFN11), arestriction factor for replicative stress induced by DNA-targeting anti-cancertherapies. Pharmacol Ther. 2019;201:94–102.
22. Barretina J, Caponigro G, Stransky N, Venkatesan K, Margolin AA, Kim S, et al.The Cancer Cell Line Encyclopedia enables predictive modelling ofanticancer drug sensitivity. Nature. 2012;483:603–7.
23. Gardner EE, Lok BH, Schneeberger VE, Desmeules P, Miles LA, Arnold PK,et al. Chemosensitive relapse in small cell lung cancer proceeds through anEZH2-SLFN11 axis. Cancer Cell. 2017;31:286–99.
24. Polley E, Kunkel M, Evans D, Silvers T, Delosh R, Laudeman J et al. Small celllung cancer screen of oncology drugs, investigational agents, and gene andmicroRNA expression. J Natl Cancer Inst. 2016;108:djw122.
25. Aryee MJ, Jaffe AE, Corrada-Bravo H, Ladd-Acosta C, Feinberg AP, HansenKD, et al. Minfi: a flexible and comprehensive Bioconductor package for theanalysis of Infinium DNA methylation microarrays. Bioinformatics. 2014;30:1363–9.
Krushkal et al. Clinical Epigenetics (2020) 12:93 Page 26 of 28

26. Zhou W, Laird PW, Shen H. Comprehensive characterization, annotation andinnovative use of Infinium DNA methylation BeadChip probes. Nucleic AcidsRes. 2017;45:e22.
27. Zhou W, Laird PW, Shen H. Illumina EPIC array methylation hg38 maskingannotation. Available from: http://zwdzwd.github.io/InfiniumAnnotation.Accessed: 17 Sept 2018.
28. Wang D, Yan L, Hu Q, Sucheston LE, Higgins MJ, Ambrosone CB, et al. IMA:an R package for high-throughput analysis of Illumina's 450K Infiniummethylation data. Bioinformatics. 2012;28:729–30.
29. Illumina Infinium MethylationEPIC BeadChip Product Files. 2014. Availablefrom: https://support.illumina.com/array/array_kits/infinium-methylationepic-beadchip-kit/downloads.html. Accessed: October 17, 2018.
30. UCSC genome annotation database for the February 2009 assembly of thehuman genome (hg19, GRCh37 Genome Reference Consortium HumanReference 37 (GCA_000001405.1)). Available from: http://hgdownload.cse.ucsc.edu/goldenPath/hg19/database/. Accessed: May 23, 2018.
31. Mansell G, Gorrie-Stone TJ, Bao Y, Kumari M, Schalkwyk LS, Mill J, et al.Guidance for DNA methylation studies: statistical insights from the IlluminaEPIC array. BMC Genomics. 2019;20:366.
32. Rakyan VK, Down TA, Balding DJ, Beck S. Epigenome-wide association studiesfor common human diseases. Nature reviews Genetics. 2011;12:529–41.
33. DisplayR online software. Available from: https://app.displayr.com. Accessed:4 June 2019.
34. Park JW, Lee JK, Sheu KM, Wang L, Balanis NG, Nguyen K, et al.Reprogramming normal human epithelial tissues to a common, lethalneuroendocrine cancer lineage. Science. 2018;362:91–5.
35. Blanco R, Iwakawa R, Tang M, Kohno T, Angulo B, Pio R, et al. A gene-alterationprofile of human lung cancer cell lines. Hum Mutat. 2009;30:1199–206.
36. Pozo K, Minna JD, Johnson JE. Corrigendum: identifying a missing lineagedriver in a subset of lung neuroendocrine tumors. Genes Dev. 2018;32:1266.
37. Liu H, Peng J, Bai Y, Guo L. Up-regulation of DLL1 may promote thechemotherapeutic sensitivity in small cell lung cancer. Zhongguo Fei Ai ZaZhi. 2013;16:282–8.
38. Teicher BA, Silvers T, Selby M, Delosh R, Laudeman J, Ogle C, et al. Small celllung carcinoma cell line screen of etoposide/carboplatin plus a third agent.Cancer Med. 2017;6:1952–64.
39. Sonkin D, Vural S, Thomas A, Teicher BA. Neuroendocrine negative SCLC ismostly RB1 WT and may be sensitive to CDK4/6 inhibition BioRxiv; 2019.
40. Bengtsson H, Simpson K, Bullard J, Hansen K. aroma.affymetrix: an Rframework for analyzing small to large Affymetrix data sets in boundedmemory. Tech Report 745 Department of Statistics, University of California,Berkeley 2008.
41. Leek JT, Johnson WE, Parker HS, Jaffe AE, Storey JD. The sva package forremoving batch effects and other unwanted variation in high-throughputexperiments. Bioinformatics. 2012;28:882–3.
42. Sun W, Bunn P, Jin C, Little P, Zhabotynsky V, Perou CM, et al. Theassociation between copy number aberration, DNA methylation and geneexpression in tumor samples. Nucleic Acids Res. 2018;46:3009–18.
43. CCLE Cancer Cell Line Encyclopedia. Available from: http://www.broadinstitute.org/ccle. Accessed: 6 August 2018.
44. Ghandi M, Huang FW, Jane-Valbuena J, Kryukov GV, Lo CC, McDonald ER3rd, et al. Next-generation characterization of the Cancer Cell LineEncyclopedia. Nature. 2019;569:503–8.
45. CCLE Cancer Cell Line Encyclopedia data download site for RNA-seq RPKMexpression data. Available from: https://portals.broadinstitute.org/ccle/data fileCCLE_DepMap_18q3_RNAseq_RPKM_20180718.gct. Accessed: 6 August 2018.
46. Genomics of drug sensitivity in cancer release 8.0 data download site.Available from: http://www.cancerrxgene.org/downloads. Accessed:September 26, 2019.
47. Iorio F, Knijnenburg TA, Vis DJ, Bignell GR, Menden MP, Schubert M, et al. Alandscape of pharmacogenomic interactions in cancer. Cell. 2016;166:740–54.
48. Sonkin D, Thomas A, Teicher BA. Are neuroendocrine negative small celllung cancer and large cell neuroendocrine carcinoma with WT RB1 twofaces of the same entity? Lung Cancer Management. 2019;https://doi.org/10.2217/lmt-2019-0005.
49. Naba A, Clauser KR, Lamar JM, Carr SA, Hynes RO. Extracellular matrixsignatures of human mammary carcinoma identify novel metastasispromoters. Elife. 2014;3:e01308.
50. Christmann M, Tomicic MT, Aasland D, Berdelle N, Kaina B. Three primeexonuclease I (TREX1) is Fos/AP-1 regulated by genotoxic stress and
protects against ultraviolet light and benzo(a)pyrene-induced DNA damage.Nucleic Acids Res. 2010;38:6418–32.
51. Tomicic MT, Aasland D, Nikolova T, Kaina B, Christmann M. Human threeprime exonuclease TREX1 is induced by genotoxic stress and involved inprotection of glioma and melanoma cells to anticancer drugs. BiochimBiophys Acta. 1833;2013:1832–43.
52. Wang CJ, Lam W, Bussom S, Chang HM, Cheng YC. TREX1 acts in degradingdamaged DNA from drug-treated tumor cells. DNA Repair (Amst). 2009;8:1179-89.
53. Minami T, Kijima T, Kohmo S, Arase H, Otani Y, Nagatomo I, et al.Overcoming chemoresistance of small-cell lung cancer through stepwiseHER2-targeted antibody-dependent cell-mediated cytotoxicity and VEGF-targeted antiangiogenesis. Sci Rep. 2013;3:2669.
54. Minami T, Kijima T, Otani Y, Kohmo S, Takahashi R, Nagatomo I, et al. HER2as therapeutic target for overcoming ATP-binding cassette transporter-mediated chemoresistance in small cell lung cancer. Mol Cancer Ther. 2012;11:830–41.
55. Stuhlmiller TJ, Miller SM, Zawistowski JS, Nakamura K, Beltran AS, Duncan JS,et al. Inhibition of lapatinib-induced kinome reprogramming in ERBB2-positive breast cancer by targeting BET family bromodomains. Cell Rep.2015;11:390–404.
56. Glaser KB, Li J, Marcotte PA, Magoc TJ, Guo J, Reuter DR, et al. Preclinicalcharacterization of ABT-348, a kinase inhibitor targeting the aurora, vascularendothelial growth factor receptor/platelet-derived growth factor receptor,and Src kinase families. J Pharmacol Exp Ther. 2012;343:617–27.
57. Tang A, Gao K, Chu L, Zhang R, Yang J, Zheng J. Aurora kinases: noveltherapy targets in cancers. Oncotarget. 2017;8:23937–54.
58. Willems E, Dedobbeleer M, Digregorio M, Lombard A, Lumapat PN, RogisterB. The functional diversity of Aurora kinases: a comprehensive review. CellDiv. 2018;13:7.
59. Sardon T, Pache RA, Stein A, Molina H, Vernos I, Aloy P. Uncovering newsubstrates for Aurora A kinase. EMBO Rep. 2010;11:977–84.
60. Wu XS, Tsan GL, Hammer JA 3rd. Melanophilin and myosin Va track themicrotubule plus end on EB1. J Cell Biol. 2005;171:201–7.
61. Tamura N, Draviam VM. Microtubule plus-ends within a mitotic cell are‘moving platforms’ with anchoring, signalling and force-coupling roles.Open Biol. 2012;2:120132.
62. Bruning-Richardson A, Langford KJ, Ruane P, Lee T, Askham JM, Morrison EE.EB1 is required for spindle symmetry in mammalian mitosis. PLoS One.2011;6:e28884.
63. Spainhour JC, Lim HS, Yi SV, Qiu P. Correlation patterns between DNAmethylation and gene expression in the Cancer Genome Atlas. CancerInform. 2019;18:1176935119828776.
64. Dalvi PS, Macheleidt IF, Lim SY, Meemboor S, Muller M, Eischeid-Scholz H,et al. LSD1 Inhibition attenuates tumor growth by disrupting PLK1 mitoticpathway. Mol Cancer Res. 2019;17:1326–37.
65. Horie M, Saito A, Ohshima M, Suzuki HI, Nagase T. YAP and TAZ modulatecell phenotype in a subset of small cell lung cancer. Cancer Sci. 2016;107:1755–66.
66. Dammert MA, Bragelmann J, Olsen RR, Bohm S, Monhasery N, Whitney CP,et al. MYC paralog-dependent apoptotic priming orchestrates a spectrum ofvulnerabilities in small cell lung cancer. Nat Commun. 2019;10:3485.
67. Inge TH, Casson LK, Priebe W, Trent JO, Georgeson KE, Miller DM, et al.Importance of Sp1 consensus motifs in the MYCN promoter. Surgery. 2002;132:232–8.
68. Pietanza MC, Waqar SN, Krug LM, Dowlati A, Hann CL, Chiappori A, et al.Randomized, double-blind, phase II study of temozolomide in combinationwith either veliparib or placebo in patients with relapsed-sensitive orrefractory small-cell lung cancer. J Clin Oncol. 2018;36:2386–94.
69. Allison Stewart C, Tong P, Cardnell RJ, Sen T, Li L, Gay CM, et al. Dynamicvariations in epithelial-to-mesenchymal transition (EMT), ATM, and SLFN11govern response to PARP inhibitors and cisplatin in small cell lung cancer.Oncotarget. 2017;8:28575–87.
70. Murai J, Feng Y, Yu GK, Ru Y, Tang SW, Shen Y, et al. Resistance to PARPinhibitors by SLFN11 inactivation can be overcome by ATR inhibition.Oncotarget. 2016;7:76534–50.
71. Lok BH, Gardner EE, Schneeberger VE, Ni A, Desmeules P, Rekhtman N, et al.PARP inhibitor activity correlates with SLFN11 expression and demonstratessynergy with temozolomide in small cell lung cancer. Clin Cancer Res. 2017;23:523–35.
Krushkal et al. Clinical Epigenetics (2020) 12:93 Page 27 of 28

72. Tlemsani C, Pongor L, Girard L, Roper N, Elloumi F, Varma S et al. SCLC_CellMiner: Integrated genomics and therapeutics predictors of small celllung cancer cell lines based on their genomic signatures. bioRxiv. 2020.https://doi.org/10.1101/2020.03.09.980623.
73. Maciejowski J, Li Y, Bosco N, Campbell PJ, de Lange T. Chromothripsis andkataegis induced by telomere crisis. Cell. 2015;163:1641–54.
74. Maciejowski J, de Lange T. Telomeres in cancer: tumour suppression andgenome instability. Nat Rev Mol Cell Biol. 2017;18:175–86.
75. Li T, Chen ZJ. The cGAS-cGAMP-STING pathway connects DNA damage toinflammation, senescence, and cancer. J Exp Med. 2018;215:1287–99.
76. Yan N. Immune diseases associated with TREX1 and STING dysfunction. JInterferon Cytokine Res. 2017;37:198–206.
77. Erdal E, Haider S, Rehwinkel J, Harris AL, McHugh PJ. A prosurvival DNAdamage-induced cytoplasmic interferon response is mediated by endresection factors and is limited by Trex1. Genes Dev. 2017;31:353–69.
78. Miyazaki T, Kim YS, Yoon J, Wang H, Suzuki T, Morse HC 3rd. The 3'-5' DNAexonuclease TREX1 directly interacts with poly(ADP-ribose) polymerase-1(PARP1) during the DNA damage response. J Biol Chem. 2014;289:32548–58.
79. Pantelidou C, Sonzogni O, De Oliveria TM, Mehta AK, Kothari A, Wang D,et al. PARP Inhibitor efficacy depends on CD8(+) T-cell recruitment viaintratumoral STING pathway activation in BRCA-deficient models of triple-negative breast cancer. Cancer Discov. 2019;9:722–37.
80. Sen T, Rodriguez BL, Chen L, Corte CMD, Morikawa N, Fujimoto J, et al.Targeting DNA damage response promotes antitumor immunity throughSTING-mediated T-cell activation in small cell lung cancer. Cancer Discov.2019;9:646–61.
81. Tang SW, Thomas A, Murai J, Trepel JB, Bates SE, Rajapakse VN, et al.Overcoming resistance to DNA-targeted agents by epigenetic activation ofSchlafen 11 (SLFN11) expression with class I histone deacetylase inhibitors.Clin Cancer Res. 2018;24:1944–53.
82. He T, Zhang M, Zheng R, Zheng S, Linghu E, Herman JG, et al. Methylationof SLFN11 is a marker of poor prognosis and cisplatin resistance incolorectal cancer. Epigenomics. 2017;9:849–62.
83. Cancer Therapeutics Response Portal v. 2.0 Available from: https://portals.broadinstitute.org/ctrp/. Accessed: 5 July 2018.
84. Genomics of drug densitivity in cancer. Available from: http://www.cancerrxgene.org/. Accessed: 5 July 2018.
85. Della Corte CM, Sen T, Gay CM, Ramkumar K, Diao L, Cardnell RJ et al. STINGpathway expression identifies NSCLC with an immune-responsivephenotype. J Thorac Oncol. 2020;15:777-91.
86. NCI Small Cell Lung Cancer Project site. Available from: http://sclccelllines.cancer.gov. Accessed: 25 Sept 2019.
Publisher’s NoteSpringer Nature remains neutral with regard to jurisdictional claims inpublished maps and institutional affiliations.
Krushkal et al. Clinical Epigenetics (2020) 12:93 Page 28 of 28