epistasis in the expression of relevant traits in cassava...
TRANSCRIPT
Cach et al. 1 Epistasis in cassava
Epistasis in the expression of relevant traits in cassava (Manihot 1
esculenta Crantz) for sub-humid conditions. 2
3
Nguyen Thi Cach1, J.C. Perez2, J.I. Lenis2, F. Calle2, N. Morante2, 4
and H. Ceballos2,3. 5
6
7
N.T. Cach. Hue University of Agriculture and Forestry. 24 Phuong Hung Street, Hue 8
City, Vietnam. 9
J.I. Lenis, J.C. Perez, N. Morante, F. Calle and H. Ceballos (). International Center 10
for Tropical Agriculture (CIAT). Cali, Colombia. Apartado Aéreo 6713, Cali, Colombia. 11
e-mail: [email protected] Telephone (57-2) 445-0125, FAX (57-2) 445-0073 12
H. Ceballos. Universidad Nacional de Colombia. Carrera 32, Chapinero vía 13
Candelaria. Palmira, Colombia 14
15
16
Acknowledgemens 17
The technical assistance of Drs. B. Li and R. Macchiavelli for the statistical analysis of 18
the within family variation is greatly appreciated. Any mistake in the analysis, however, 19
is solely responsibility of the authors. This research was conducted with resources 20
provided by the Ministry of Agriculture and Rural Development of Colombia. 21
22
Running Title: Epistasis in cassava 23

Cach et al. 2 Epistasis in cassava
Abstract 1
There is limited knowledge on the inheritance of agronomic traits in cassava and the 2
importance of epistasis for most crops. A nine-parent diallel study was conducted in 3
sub-humid environments. Thirty clones were obtained from each F1 cross. Each clone 4
was represented by six plants, which were distributed in three replications at two 5
locations. Therefore the same 30 genotypes of each F1 cross were planted in the three 6
replications at the two locations. Analysis of variance suggested significant genetic 7
effects for all variables analyzed (reaction to thrips, fresh root and foliage yields, harvest 8
index, dry matter content, and root dry matter yield). Significant epistatic effects were 9
observed for all variables, except harvest index. Dominance variance was always 10
significant except for dry matter content and dry matter yield. Additive variance was 11
significant only for reaction to thrips. Results suggested that dominance plays an 12
important role in complex traits such as root yield. The significance of epistasis can help 13
to understand the difficulties of quantitative genetics models and QTLs in satisfactorily 14
explaining phenotypic variation in traits with complex inheritance. Significant epistasis 15
would justify the production of inbred parental lines to fix favorable allele combinations 16
in the production of hybrid cassava cultivars. 17
18
19
20
21
22
23
Cach et al. 3 Epistasis in cassava
Introduction 1
Cassava (Manihot esculenta Crantz), along with maize, sugarcane, and rice constitute 2
the most important sources of energy in the diet of most tropical countries of the world. 3
Cassava is the fourth most important basic food after rice, wheat and maize and is a 4
fundamental component in the diet of million of people (FAO/FIDA, 2000). Scott et al. 5
(2000) estimated that for the 1995-97 period, annual production of cassava was about 6
165.3 million tons, with a value of approximately 8.8 billion dollars ($US). 7
8 Little progress in understanding the inheritance of agronomic traits in cassava has been 9
achieved. Few articles regarding the inheritance of quantitative traits have been 10
published (Easwari et al. 1995; Easwari and Sheela 1998; Losada 1990). Cassava is 11
perhaps unique in that a molecular map has been already developed (Cortes et al, 12
2002; Fregene et al. 1997; Jorge et al. 2000; 2001; Mba et al. 2001; Okogbenin and 13
Fregene, 2003) but it is complemented with limited traditional genetics knowledge. 14
Cassava is also an interesting crop because its vegetative propagation allows the 15
estimation of within-family genetic variation and, indirectly, the relative importance of 16
epistatic effects. Genetic studies analyzing the importance of epistatic effects are not 17
very common, particularly in annual crops. 18
19
Accurate measurement of epistatic effects for complex traits, such as yield, is difficult 20
and expensive. Reports in the literature on the relevance of epistasis are not as 21
frequent as those estimating additive and dominance variances or effects and generally 22
take advantage of the vegetative multiplication that some species offer (Comstock et al. 23
1958; Foster and Shaw 1988; Isik et al. 2003; Rönnberg-Wästljung, and Gullberg 1999; 24
Cach et al. 4 Epistasis in cassava
Rönnberg-Wästljung et al. 1994; Stonecypher and McCullough 1986). In many cases 1
these reports are on forest trees. Because of the complexities of these analyses and the 2
costs involved, reports in the literature related to epistatic effects are frequently based 3
on a limited number of genotypes. 4
5
Holland (2001) published a comprehensive review on epistasis and plant breeding. 6
Several cases of significant epistasis have been reported in self- (Brim and Cockerham, 7
1961; Busch et al. 1974; Gravois, 1994; Hanson and Weber, 1961; Pixley and Frey, 8
1991; Orf et al., 1999) and cross-pollinated (Ceballos et al.,1998; Eta-Ndu and 9
Openshaw, 1999; Lamkey et al., 1995; Melchinger et al., 1986; Wolf and Hallauer, 10
1997) crops. According to Holland (2001) finding significant epistasis seems to be 11
easier in self- than in cross-pollinated species and in designs based in the contrasts of 12
means rather than the analysis of variances. 13
14
The objective of this study was to analyze the within-family variation in a diallel study 15
conducted in two sub-humid environments and to assess the relative importance of 16
additive, dominance, and epistatic genetic effects on the expression of several relevant 17
traits of cassava. 18
19
20 Materials and methods 21
A diallel mating design was used to generate F1 crosses among 9 parents. Inbreeding 22
level of parental lines was considered zero because no self-pollination has been 23
involved in cassava breeding and crosses among related clones are generally avoided. 24
Cach et al. 5 Epistasis in cassava
Kawano et al. (1978) provided evidence that cassava is a highly heterozygous species. 1
Controlled pollinations were performed following the standard procedures described by 2
Kawano (1980). Many parental clones were initially involved but the parents ultimately 3
used (as well as the number of parents involved) were those that allowed for as 4
balanced a set of crosses as possible. Botanical seed were germinated and grown in a 5
screen house until the seedlings were two-months old, when they were transplanted to 6
the field at CIAT experimental station in Palmira, Valle del Cauca, Colombia. F1 plants 7
were grown in the field for ten months. Among the many genotypes (> 30) from a given 8
F1 cross, 30 were randomly chosen for this study based solely on their capacity to 9
produce at least six vegetative cuttings. Each of these stakes was planted in one of 10
three replications at one of two locations. 11
12
Trials were planted during July 2001 in two sub-humid locations in Colombia (Cach et 13
al. 2005). A randomized complete block design was used. The evaluation was similar to 14
a split-plot design. Each replication contained 36 main plots, one for each of the 36 F1 15
crosses of the diallel. Each F1 cross was, therefore, randomly allocated within each 16
replication. Main plots contained eight rows with seven plants per row. The first and last 17
rows and the first and last plant within each row were filled with border plants. The rest 18
of the plot (6x5= 30 subplots) was used to plant the experimental material. The 30 19
clones constituting each F1 cross were planted together in the respective main plots of 20
each replication. The experimental design, therefore, offered two types of error: (a) 21
associated with the main plots or F1 averages, and (b) the error associated with the sub-22
Cach et al. 6 Epistasis in cassava
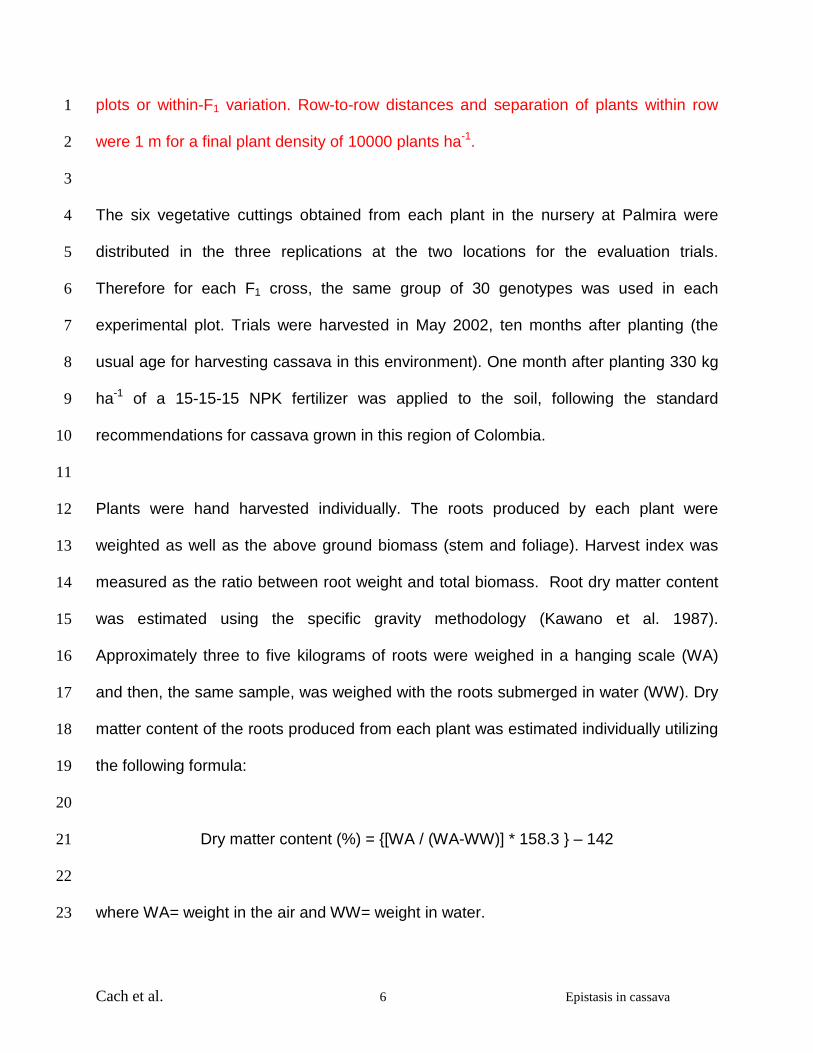
plots or within-F1 variation. Row-to-row distances and separation of plants within row 1
were 1 m for a final plant density of 10000 plants ha-1. 2
3
The six vegetative cuttings obtained from each plant in the nursery at Palmira were 4
distributed in the three replications at the two locations for the evaluation trials. 5
Therefore for each F1 cross, the same group of 30 genotypes was used in each 6
experimental plot. Trials were harvested in May 2002, ten months after planting (the 7
usual age for harvesting cassava in this environment). One month after planting 330 kg 8
ha-1 of a 15-15-15 NPK fertilizer was applied to the soil, following the standard 9
recommendations for cassava grown in this region of Colombia. 10
11
Plants were hand harvested individually. The roots produced by each plant were 12
weighted as well as the above ground biomass (stem and foliage). Harvest index was 13
measured as the ratio between root weight and total biomass. Root dry matter content 14
was estimated using the specific gravity methodology (Kawano et al. 1987). 15
Approximately three to five kilograms of roots were weighed in a hanging scale (WA) 16
and then, the same sample, was weighed with the roots submerged in water (WW). Dry 17
matter content of the roots produced from each plant was estimated individually utilizing 18
the following formula: 19
20
Dry matter content (%) = {[WA / (WA-WW)] * 158.3 } – 142 21
22
where WA= weight in the air and WW= weight in water. 23
Cach et al. 7 Epistasis in cassava
1
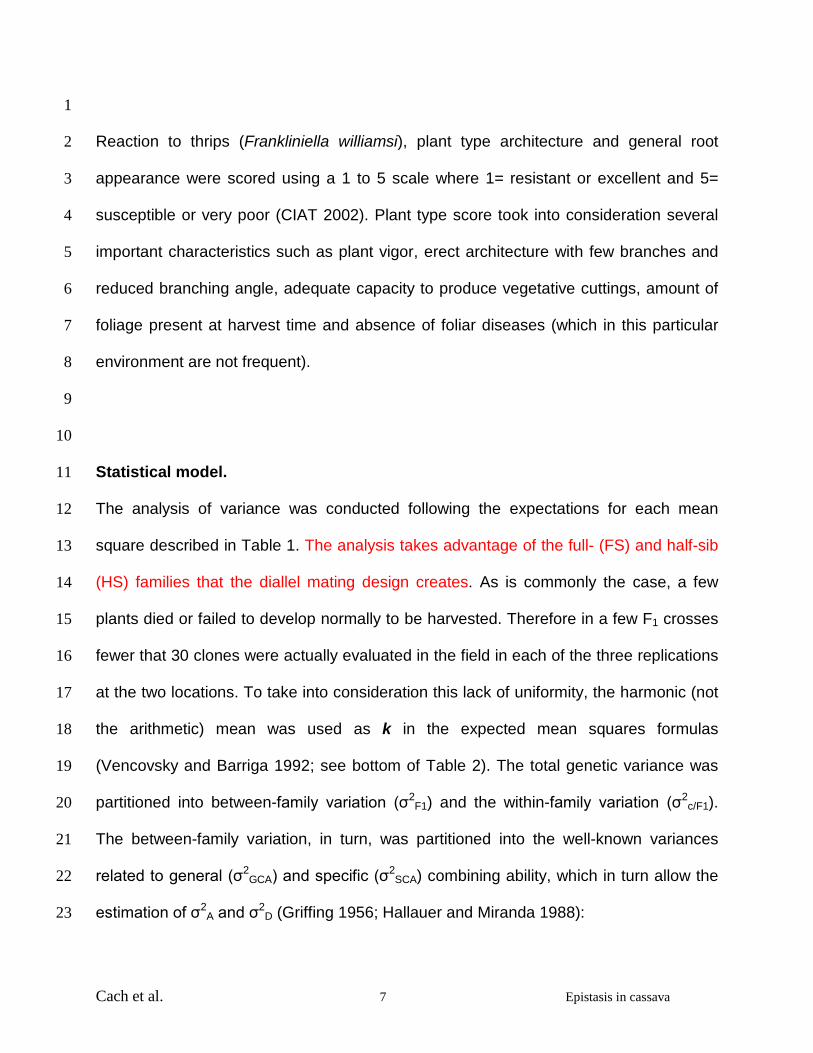
Reaction to thrips (Frankliniella williamsi), plant type architecture and general root 2
appearance were scored using a 1 to 5 scale where 1= resistant or excellent and 5= 3
susceptible or very poor (CIAT 2002). Plant type score took into consideration several 4
important characteristics such as plant vigor, erect architecture with few branches and 5
reduced branching angle, adequate capacity to produce vegetative cuttings, amount of 6
foliage present at harvest time and absence of foliar diseases (which in this particular 7
environment are not frequent). 8
9
10
Statistical model. 11
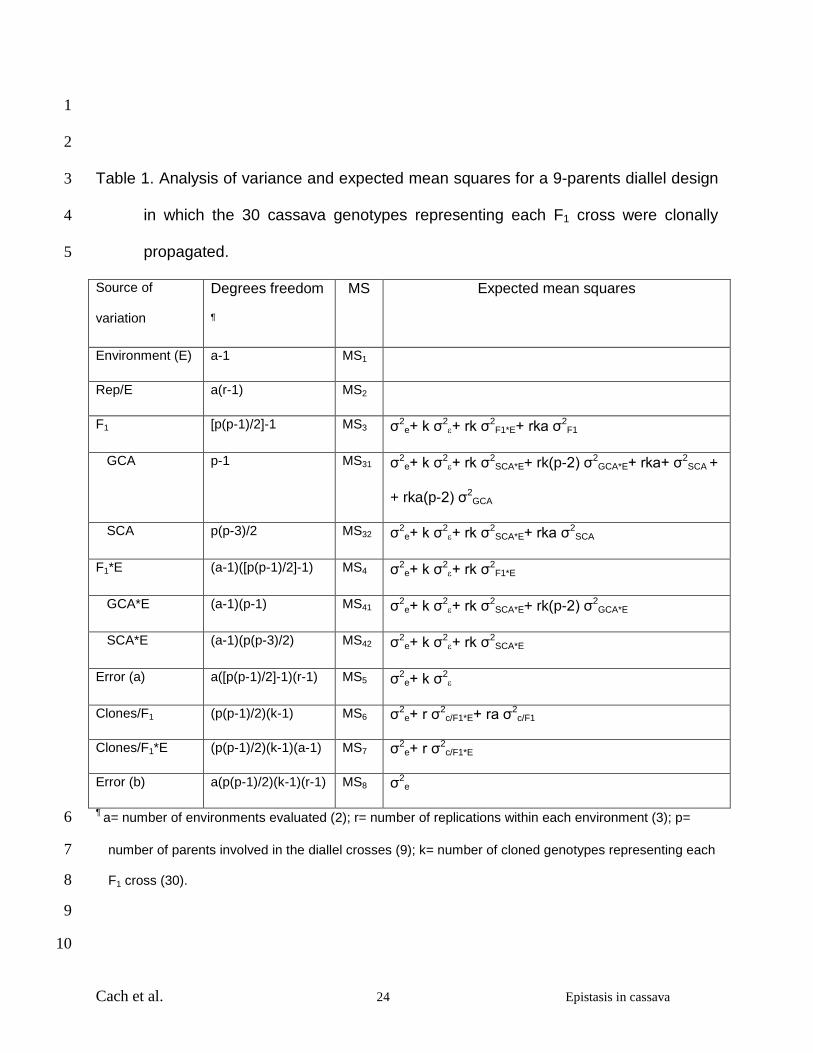
The analysis of variance was conducted following the expectations for each mean 12
square described in Table 1. The analysis takes advantage of the full- (FS) and half-sib 13
(HS) families that the diallel mating design creates. As is commonly the case, a few 14
plants died or failed to develop normally to be harvested. Therefore in a few F1 crosses 15
fewer that 30 clones were actually evaluated in the field in each of the three replications 16
at the two locations. To take into consideration this lack of uniformity, the harmonic (not 17
the arithmetic) mean was used as k in the expected mean squares formulas 18
(Vencovsky and Barriga 1992; see bottom of Table 2). The total genetic variance was 19
partitioned into between-family variation (σ2F1) and the within-family variation (σ2
c/F1). 20
The between-family variation, in turn, was partitioned into the well-known variances 21
related to general (σ2GCA) and specific (σ2
SCA) combining ability, which in turn allow the 22
estimation of σ2A and σ2
D (Griffing 1956; Hallauer and Miranda 1988): 23
Cach et al. 8 Epistasis in cassava
1
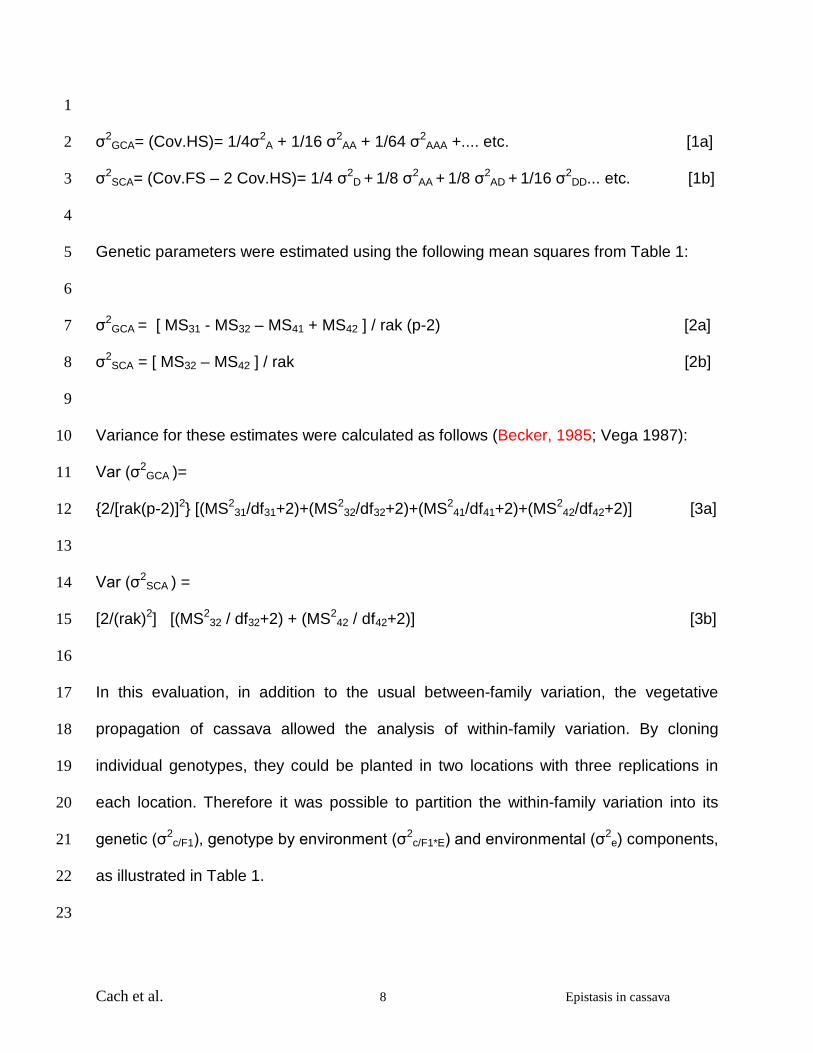
σ2GCA= (Cov.HS)= 1/4σ2
A + 1/16 σ2AA + 1/64 σ2
AAA +.... etc. [1a] 2
σ2SCA= (Cov.FS – 2 Cov.HS)= 1/4 σ2
D + 1/8 σ2AA + 1/8 σ2
AD + 1/16 σ2DD... etc. [1b] 3
4
Genetic parameters were estimated using the following mean squares from Table 1: 5
6
σ2GCA = [ MS31 - MS32 – MS41 + MS42 ] / rak (p-2) [2a] 7
σ2SCA = [ MS32 – MS42 ] / rak [2b] 8
9
Variance for these estimates were calculated as follows (Becker, 1985; Vega 1987): 10
Var (σ2GCA )= 11
{2/[rak(p-2)]2} [(MS231/df31+2)+(MS2
32/df32+2)+(MS241/df41+2)+(MS2
42/df42+2)] [3a] 12
13
Var (σ2SCA ) = 14
[2/(rak)2] [(MS232 / df32+2) + (MS2
42 / df42+2)] [3b] 15
16
In this evaluation, in addition to the usual between-family variation, the vegetative 17
propagation of cassava allowed the analysis of within-family variation. By cloning 18
individual genotypes, they could be planted in two locations with three replications in 19
each location. Therefore it was possible to partition the within-family variation into its 20
genetic (σ2c/F1), genotype by environment (σ2
c/F1*E) and environmental (σ2e) components, 21
as illustrated in Table 1. 22
23

Cach et al. 9 Epistasis in cassava
The within-family analysis allows estimation of the relative importance of epistatic 1
effects. In the absence of epistasis the following equation holds true (Hallauer and 2
Miranda 1988): 3
σ2c/F1 – 3 Cov FS + 4 Cov HS ≈ 0 [4] 4
5
Therefore, a test statistics for the significance of epistatic variance can be constructed 6
by using estimates of the parameters on the left side of the equation. The variance for 7
this test statistic is expected to be large (Hallauer and Miranda, 1988) because of the 8
complexity of this linear function. The variance was estimated following the principles 9
established in Lynch and Walsh (1998) and Isk et al. (2003), as follows: 10
11
Var (Test)= Var [σ2c/F1 – 3 (σ2
SCA + 2 σ2GCA) + 4 σ2
GCA] 12
= Var [σ2c/F1 – 3 σ2
SCA - 6 σ2GCA + 4 σ2
GCA] 13
= Var [σ2c/F1 – 3 σ2
SCA - 2 σ2GCA] 14
= Var (σ2c/F1) + Var (3 σ2
SCA) + Var (2 σ2GCA) – 6 Cov (σ2
c/F1, σ2 SCA) - 15
4 Cov (σ2c/F1, σ2
GCA) + 12 Cov. (σ2SCA , σ2
GCA) [5] 16
17
However, since Cov (σ2c/F1, σ2
SCA) =0 and 4 Cov (σ2c/F1, σ2
GCA) = 0, the formula can be 18
simplified: 19
20
Var (Test)= Var (σ2c/F1)+ 9 Var (σ2
SCA)+ 4 Var (σ2GCA)+ 12 Cov (σ2
SCA , σ2GCA) [6] 21
22
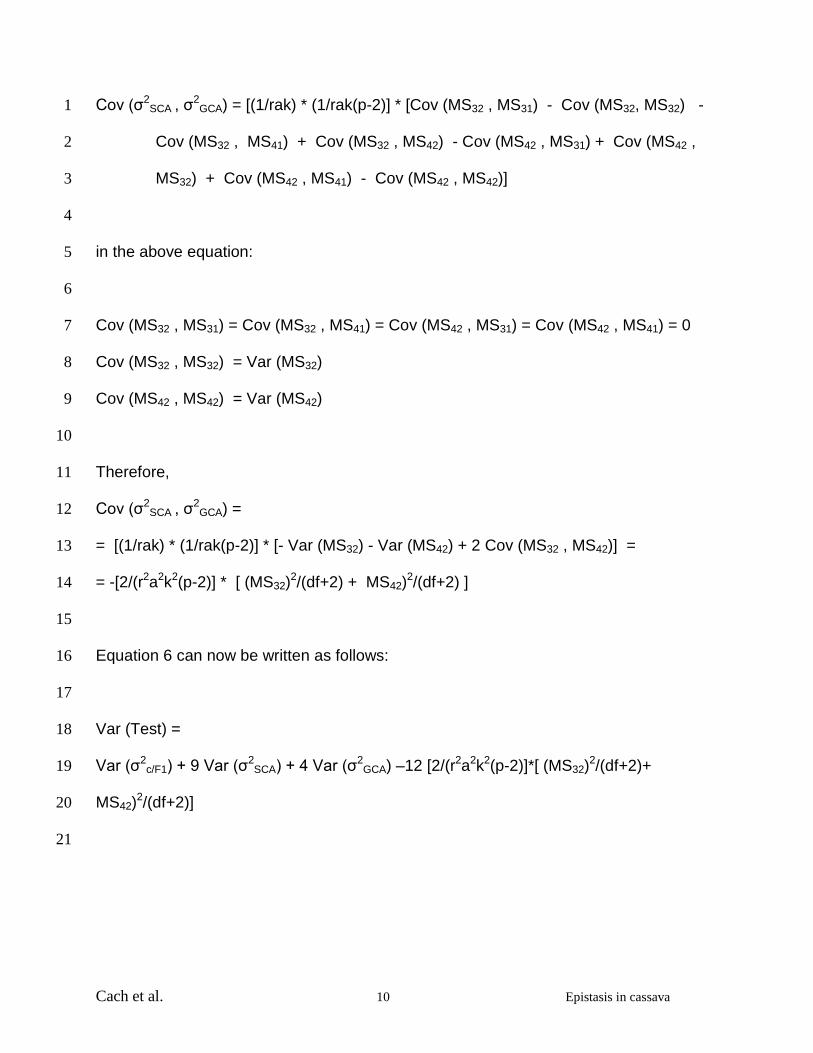
The last term in the equation can be estimated as: 23
Cach et al. 10 Epistasis in cassava
Cov (σ2SCA , σ2
GCA) = [(1/rak) * (1/rak(p-2)] * [Cov (MS32 , MS31) - Cov (MS32, MS32) - 1
Cov (MS32 , MS41) + Cov (MS32 , MS42) - Cov (MS42 , MS31) + Cov (MS42 , 2
MS32) + Cov (MS42 , MS41) - Cov (MS42 , MS42)] 3
4
in the above equation: 5
6
Cov (MS32 , MS31) = Cov (MS32 , MS41) = Cov (MS42 , MS31) = Cov (MS42 , MS41) = 0 7
Cov (MS32 , MS32) = Var (MS32) 8
Cov (MS42 , MS42) = Var (MS42) 9
10
Therefore, 11
Cov (σ2SCA , σ2
GCA) = 12
= [(1/rak) * (1/rak(p-2)] * [- Var (MS32) - Var (MS42) + 2 Cov (MS32 , MS42)] = 13
= -[2/(r2a2k2(p-2)] * [ (MS32)2/(df+2) + MS42)2/(df+2) ] 14
15
Equation 6 can now be written as follows: 16
17
Var (Test) = 18
Var (σ2c/F1) + 9 Var (σ2
SCA) + 4 Var (σ2GCA) –12 [2/(r2a2k2(p-2)]*[ (MS32)2/(df+2)+ 19
MS42)2/(df+2)] 20
21

Cach et al. 11 Epistasis in cassava
The estimates of σ2GCA and σ2
SCA additive and dominance variances but these 1
estimates are biased upward because they contain portions of epistatic variances 2
(Equations 1a and 1b). 3
4
The analysis of between-family variation was published elsewhere (Cach et al. 2005). In 5
that article genetic effects, rather than genetic variances, were of interest and they were 6
considered fixed effects. In the present study, however, the analysis of within-family 7
variance and the relative importance of epistatic effect are of prime interest. All effects, 8
therefore, were considered random and normally distributed. The 30 genotypes 9
representing each F1 cross are clearly a random sample of all possible genotypes that 10
could possibly be derived from the respective parents. The only criterion defining which 11
genotype would be used was the capacity to produce six stakes in an environment 12
different from the target environment where the evaluation was conducted. The parents 13
involved in this study were among a group of 25-30 clones characterized by their 14
adaptation to sub-humid conditions: long periods without rain, tolerance or resistance to 15
insect and arthropod pests typical for these environments (particularly thrips and 16
different species of mites), and a frequent susceptibility to foliar diseases (because they 17
are not common in this kind of environment). Eight of the parents evaluated come from 18
CIAT’s cassava-breeding project in Colombia and the remaining clone was a cultivar 19
released many years ago in Thailand. These parents are considered to be part of a 20
reference population of clones adapted to the sub-humid, lowland, tropical environment. 21
22

Cach et al. 12 Epistasis in cassava
The actual nine parents eventually included were those that allowed for a balanced set 1
of progenies for the study. Therefore, the main criterion for the selection of the parental 2
lines was their capacity to flower and produce adequate samples of botanical seed from 3
many different crosses. It is difficult to assess the impact (if any) of this selection 4
because crossings are made in the mid-altitude valleys environment where CIAT 5
headquarters are located, but the evaluation was conducted in a completely different 6
environment. This is important because the flowering habit, which profoundly affects 7
plant architecture vary drastically from one environment to the other. A non-branching, 8
erect type in the sub-humid environment may be bushy and flower profusely at Palmira. 9
Because of this situation it can be assumed that the effect of selection of parents at 10
Palmira had a neutral impact on the general performance of the progenies selected and 11
evaluated for this study. 12
13
The analysis of variance for the between-family variation follows the method 4 proposed 14
by Griffing (1956). The usual assumptions for Method 4 analysis are: regular diploid 15
behavior during meiosis; absence of cytoplasmic effects; linkage equilibrium, relatives 16
are random members of a specified population and, because of the vegetative 17
propagation of cassava, negligible C-effects (Libby and Jund, 1962). In the case of 18
cassava, C-effects would result from differences in the physiological/sanitary status 19
between F1 mother plants and/or among the six stakes used to clone each genotype 20
and these differences would be confounded with the environmental and/or genotype x 21
environment interactions components of variation. Since the F1 plants from which the 22
six stakes were taken had been grown in Palmira under excellent management 23
Cach et al. 13 Epistasis in cassava
practices, differences (if any) in the physiological/sanitary status of these vegetative 1
cuttings are reasonably expected to be small and negligible. 2
3
4
Results 5
The coefficients of variability indicated that the experimental error involved in this study 6
was relatively low. Results, therefore are reliable and the precision of the analysis, 7
acceptable (Cach et al. 2005). The two locations used in the evaluation showed 8
statistical differences only for foliage yield and harvest index (Table 2). On the other 9
hand statistical differences among crosses were found for all the variables analyzed. 10
With the exception of the plant type score, the crosses by environment interactions were 11
also significant. GCA mean squares were significant for all variables except harvest 12
index (Table 2). SCA mean squares were also significant for all variables except harvest 13
index and dry matter yield. 14
15
Since individual clone data has been included, the degrees of freedom involved are 16
considerably larger (Table 2) than those reported in the between family analysis (Cach 17
et al. 2005). In every case, within-family genetic variation (σ2c/F1) was statistically 18
significant. The interaction between environment and the within-family genetic variation 19
also proved to be statistically significant. From the mean squares presented in Table 2 20
the estimates for σ2A, σ2
D, and the test for epistasis were obtained as described above. 21
22
Cach et al. 14 Epistasis in cassava
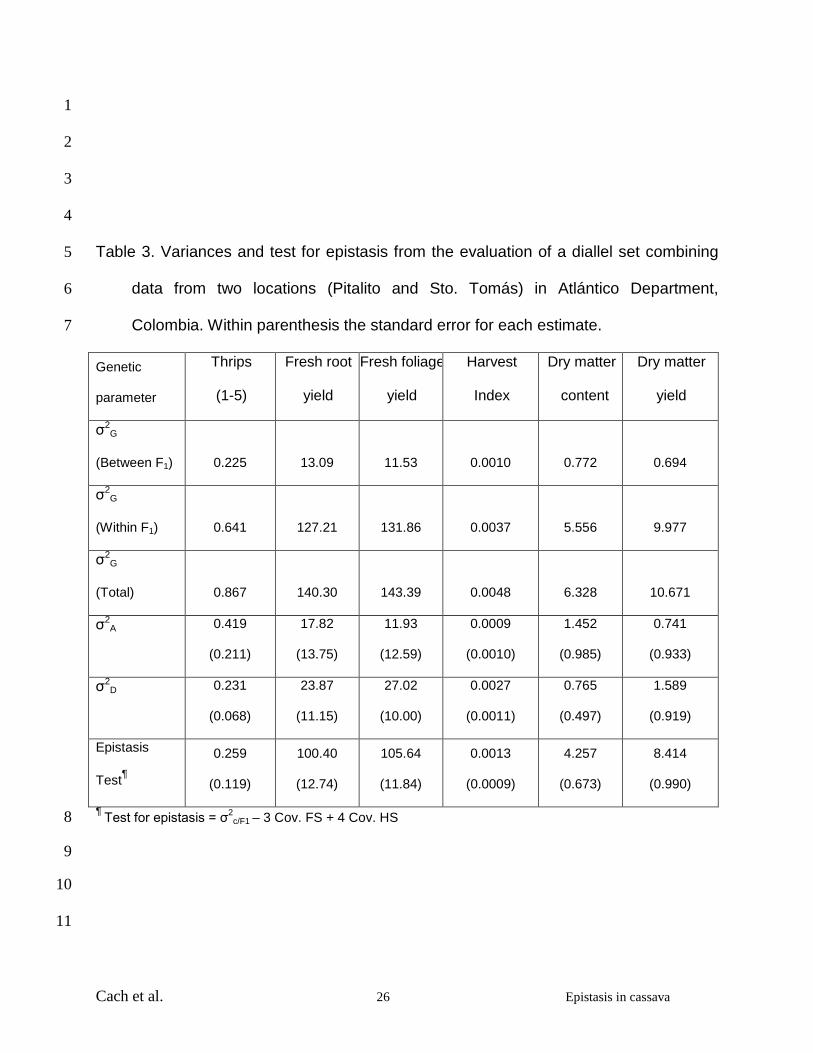
Variance components were considered important if the standard errors were less than 1
half of the component estimates (Isik et al. 2003). The estimate for σ2D was larger than 2
that for σ2A for fresh root and foliage yields, harvest index and dry matter yield and 3
smaller for reaction to thrips and dry matter content (Table 3). Epistasis was highly 4
significant for all variables (test values > two times the value of their respective standard 5
errors) except harvest index (Table 3). 6
7
8
Discussion 9
Based on the magnitude of the estimates for between- and within-family genetic 10
variances, a large proportion of the genetic variability (79-93%) remained as within 11
family variation (Table 3). These results agree with observations during the selection in 12
evaluation trials where large numbers of crosses among elite parental lines are 13
represented by several clones. As expected, the lowest within-family variation (79% of 14
total genetic variance) was measured for a relatively simply inherited trait such as the 15
reaction to thrips (Bellotti 2002), which showed the only statistically significant additive 16
variance. The tolerance/resistance in outstanding parents transmitted to the progeny 17
tended to accentuate differences among families and reduce the variability among sister 18
clones. A similar situation was observed in a similar study for the mid-altitude valleys 19
environment (Pérez et al., 2005). However, it is clear that a considerable within-family 20
variation still remained even for the reaction to thrips. On the other hand, complex traits 21
such as root and foliage yields showed a larger partitioning of the total genetic variance 22
Cach et al. 15 Epistasis in cassava
(> 90%) into the within-family variation, suggesting that there were, comparatively, 1
smaller differences in the breeding values of the progenitors. 2
3
The within-family variation suggested not only important genetic effects, but also 4
significant genotype-by-environment variation for all variables analyzed. This interaction 5
implies that reliable selection can only be made when enough planting material for 6
replicated trials at more than one location, has been produced. In practice, this means 7
the third or fourth stage in the selection process (Ceballos et al., 2004). One alternative 8
for overcoming this problem would be to modify the clonal evaluation trials (first stage in 9
the selection process), which currently is conducted as an unreplicated trial at a single 10
location, with seven plants per genotype (Ceballos et al., 2004). The total number of 11
plants per genotype can be raised to eight so that two trials, at two different locations, 12
and with four plants per genotype at each location can be planted. Although the costs 13
related to this change are large, and the logistic complications considerable, the data 14
provided by this experiment (and other similar studies) suggest that they may be 15
justifiable. 16
17
Dominance effects were very important for thrips, harvest index and root and foliage 18
yields, with variance estimates significantly different from zero (estimates two times or 19
more the size of the respective standard error). Only the score for thrips and dry matter 20
content showed larger estimates for the additive compared with the dominance variance 21
(Table 3). This highlights the importance of heterosis in cassava breeding for many 22
Cach et al. 16 Epistasis in cassava
relevant traits, which in turn justifies the implementation of a reciprocal recurrent 1
selection scheme for cassava genetic improvement. 2
3
Epistatic effects were significant for all variables, except harvest index, based on the 4
test for epistasis (Table 3). It was surprising to see the size and generalized significance 5
of epistatic effects. In many cases reported in the literature, epistatic effects may have 6
been large but failed to reach statistical significance, in part, because of the size of the 7
standard errors typical for complex linear functions (Hallauer and Miranda 1988; Hinze 8
and Lamkey, 2003; Holland, 2001). In this study, however, this was not the case. To a 9
large extent this may be the result of the large size of this experiment, which resulted in 10
large degrees of freedom for the overall analysis, including the number of clones within 11
family and the number of replications and environments employed. However, the large 12
and frequent epistasis found in this study may also be the result of the evolutionary 13
history of this species that can multiply both sexually or clonally. It is feasible that 14
cassava has evolved to take advantage of favorable gene combinations resulting from 15
dominance and epistatic relationships by fixing them through the vegetative mode of 16
reproduction. The results of this study reveal the limitation of most quantitative genetic 17
studies based on the assumption of negligible epistasis. These results would also help 18
to explain the difficulties in finding QTLs that satisfactorily explain the phenotypic 19
variation observed in complex traits such as yield (Kao and Zeng 2002). 20
21
The phenotypic clonal selection used for cassava breeding takes advantage of the 22
vegetative reproduction of the crop. In selecting outstanding clones all genetic effects 23

Cach et al. 17 Epistasis in cassava
(additive, dominance and epistatic) are exploited (Ceballos et al., 2004; Mullin and Park, 1
1992). However, the current recurrent selection system lacks the capacity to direct 2
genetic improvement in such a way that the frequency of favorable (within or between 3
loci) genetic combinations is maximized. To achieve this, special efforts to design 4
parental clones that produce better crosses are required. 5
6
CIAT has recently introduced modifications that allow for the estimation of GCA effects 7
in early stages of the selection process (Ceballos et al., 2004). This, in turn, allows the 8
implementation of the Backward GCA Selection described by Mullin and Park in 1992. 9
Results from this study suggest that this approach would be ideal for traits such as the 10
reaction to thrips given the importance of GCA effects and the comparatively low 11
relevance of dominance and epistatic effects. For complex traits such as fresh-root 12
yield, however, the prevalence of non-additive effects suggested by this study, would 13
require a different approach. The development of clones specifically designed for their 14
utilization as parents in breeding nurseries would be one alternative that offers 15
interesting advantages. Introduction of inbreeding in these parental clones would 16
facilitate the gradual and consistent assembly of favorable gene combinations, which in 17
the current system occur just by chance. Inbreeding would also facilitate the reduction 18
of the genetic load of this crop, which is expected to be relatively large at this point in 19
time. 20
21
One major constraint for the introduction of inbreeding in cassava is the time required 22
for it. The production of doubled haploids through anther or microspore culture is an 23
Cach et al. 18 Epistasis in cassava
interesting approach that would reduce the time required to obtain homozygous 1
genotypes. This, in turn, will maximize the exploitation of dominance and epistatic 2
genetic variation, which have been found to be significant in this study. CIAT is currently 3
executing a project financed by the Rockefeller Foundation to develop the protocol for 4
the production of doubled-haploids in cassava. 5
6
7
8
9
10
11
12
13
14
15
16
17
18
19
20
21
22
23
Cach et al. 19 Epistasis in cassava
References 1
Becker WA, 1985. Manual of quantitative genetics (Fourth Edition). Academic 2
Enterprises, Pullman, Washington. pp. 95-96. 3
Bellotti AC, 2002. Arthropod pests. In: Cassava: biology, production and utilization 4
(Hillocks RJ, Thresh JM, and Bellotti AC eds). CABI Publishing. Wallingford New 5
York, pp 209-235. 6
Brim CA, Cockerham CC, 1961. Inheritance of quantitative characters in soybeans. 7
Crop Sci. 1:187-190. 8
Busch RH, Janke JC, Frohberg RC, 1974. Evaluation of crosses among high and low 9
yielding parents of spring wheat (Triticum aestivum L.) and bulk prediction of line 10
performance. Crop Sci. 14:47-50. 11
Cach NT, Lenis JI, Perez JC, Morante N, Calle F, Ceballos H, 2005. Inheritance of 12
agronomically relevant traits in cassava (Manihot esculenta Crantz) for sub-humid 13
conditions. Plant Breeding (in press). 14
Ceballos, H, Pandey S, Narro L, Perez JC. 1998. Additive, dominance, and epistatic 15
effects for maize grain yield in acid and non-acid soils. Theor. Appl. Genet. 96:662-16
668. 17
CIAT, 2002. Annual report from IP3 project: Improved Cassava for the Developing 18
World. CIAT, Apdo Aéreo 6713, Cali, Colombia. 19
Comstock RE, Kelleher T, Morrow EB, 1958. Genetic variation in an asexual species, 20
the garden strawberry. Genetics 43:634-646. 21

Cach et al. 20 Epistasis in cassava
Cortes DF, Reily K, Okogbenin E, Beeching JR, Iglesias C and Tohme J, 2002. 1
Mapping wound-response genes involved in post-harvest physiological deterioration 2
(PPD) of cassava (Manihot esculenta Crantz). Euphytica 128:47-53. 3
Easwari Amma, CS, Sheela MN, Thankamma Pillai PK, 1995. Combining ability 4
analysis in cassava. J. Root Crops 21(2):65-71. 5
Easwari Amma CS, Sheela MN, 1998. Genetic analysis in a diallel cross of inbred lines 6
of cassava. Madras Agric. J. 85(5,6):264-268. 7
Eta-Ndu JT, Openshaw SJ, 1999. Epistasis for grain yield in two F2 populations of 8
maize. Cop Sci. 39:346-352. 9
FAO / FIDA, 2000. La economía mundial de la yuca. Hechos, tendencias y 10
perspectivas. Fondo Internacional de Desarrollo Agrícola. Organización de las 11
Naciones Unidas para la Agricultura y la Alimentación. Roma, Italy. 12
Foster GS, Shaw, DV. 1988. Using clonal replicates to explore genetic variation in a 13
perennial plant species. Theor. Appl. Genet. 76:788-794. 14
Fregene M, Angel F, Gomez G, Rodriguez F, Chavarriaga P, Roca W, Tohme J, 15
Bonierbale M, 1997. A molecular genetic map of cassava. Theor. Appl. Genet. 16
95:431-441. 17
Griffing B, 1956. Concept of general and specific combining ability in relation to diallel 18
crossing systems. Australian J. Biol. Sci. 9:463-93. 19
Gravois KA, 1994. Diallel analysis of head rice percentage, total milled rice percentage, 20
and rough rice yield. Crop Sci. 34:42-45 21
Hallauer AR, Miranda Fo. JB, 1988. Quantitative Genetics in Maize Breeding. Second 22
Edition. Iowa State University Press. USA., pp 45-114. 23
Cach et al. 21 Epistasis in cassava
Hanson WD, Weber CR, 1961. Resolution of genetic variability in self-pollinated species 1
with an application to the soybean. Genetics 46:1425-1434. 2
Holland, JB, 2001. Epistasis and plant breeding. Plant Breeding Reviews 21: 27-92 3
Isik F, Li B, Frampton J, 2003. Estimates of additive, dominance and epistatic genetic 4
variances from a clonally replicated test of loblolly pine. Forest Science 49(1): 77-88. 5
Jorge V, Fregene M, Duque MC, Bonierbale MW, Tohme J, Verdier V, 2000. Genetic 6
mapping of resistance to bacterial blight disease in cassava (Manihot esculenta 7
Crantz). Theor. Appl. Genet. 101:865-872. 8
Jorge V, Fregene M, Velez CM, Duque MC, Tohme J, Verdier V, 2001. QTL analysis of 9
field resistance to Xanthomonas axonopodis pv manihotis in cassava. Theor. Appl. 10
Genet. 102:564-571. 11
Kao CH, Zeng ZB, 2002. Modeling epistasis of quantitative trait loci using Cockerham's 12
model. Genetics. 160(3):1243-61. 13
Kawano K, 1980. Cassava. In: Hybridization of Crop Plants (Fehr WR and Hadley HH 14
eds.) ASA, CSSA. Madison, pp 225-233. 15
Kawano K, Gonçalvez Fukuda WM, Cenpukdee U, 1987. Genetic and environmental 16
effects on dry matter content of cassava root. Crop Sci. 27:69-74. 17
Lamkey KR, Schnicker BJ, Melchinger AE, 1995. Epistasis in an elite maize hybrid and 18
choice of generation for inbred line development. Crop Sci. 35:1272-1281. 19
Libby WJ, Jund E, 1962. Variance associated with cloning. Heredity 17:533-540. 20
21 Losada V. T, 1990. Cruzamentos dialélicos em mandioca (Manihot esculenta Crantz). 22
(Ph.D. dissertation). Piracicaba, SP, Brazil. Escola Superior de Agricultura Luiz de 23
Queiroz. Universidade de São Paulo.. 180 p. 24

Cach et al. 22 Epistasis in cassava
Lynch M, Walsh B, 1998. Genetics and analysis of quantitative traits (Sinauer 1
Associates) pp. 558-563 (Chapter 18) and pp. 813-816 (Appendix 1). 2
Mba REC, Stephenson P, Edwards K, Melzer S, Mkumbira J, Gullberg U, Apel K, Gale 3
M, Tohme J, Fregene M, 2001. Simple sequence repeat (SSR) markers survey of 4
the cassava (Manihot esculenta Crantz) genome: towards an SSR-based molecular 5
genetic map of cassava. Theor. Appl. Genet. 102:21-31. 6
Melchinger AE, Geiger HH, Schnell FW, 1986. Epistasis in maize (Zea mays L.). 2. 7
Genetic effects in crosses among early flint and dent inbred lines determined by 8
three methods. Theor. Appl. Genet. 72:231-239. 9
Okogbenin E, Fregene M, 2003. Genetic mapping of QTLs affecting productivity and 10
plant architecture in a full-sib cross from non-imbred parents in cassava (Manihot 11
esculenta Crantz). Theor. Appl. Genet. 107:1452-1462. 12
Orf JH, Chase K, Adler FR, Mansur LM, Lark KG, 1999. Genetics of soybean agronomic 13
traits: II. Interactions between yield quantitative trait loci in soybean. Crop Sci. 14
39:1652-1657. 15
Pérez JC, Ceballos H, Jaramillo G, Morante N, Calle F, Arias B, Bellotti AC, 2005. 16
Epistasis in cassava (Manihot esculenta Crantz) adapted to mid-altitude valley 17
environment. Crop Sci. (in press). 18
Pixley KV, Frey KJ, 1991. Combining ability for test weight and agronomic traits of oat. 19
Crop Sci. 31:1448-1451. 20
Rönnberg-Wästljung AC, Gullberg U, 1999. Genetics of breeding characters with 21
possible effects on biomass production in Salix viminalis (L.). Theor Appl Genet 22
98:531-540. 23
Cach et al. 23 Epistasis in cassava
Rönnberg-Wästljung, AC, Gullberg U, Nilsson C, 1994. Genetic parameters of growth 1
characters in Salix viminalis grown in Sweden. Can. J. For. Res. 24:1960-1969. 2
Scott GJ, Rosegrant MK, Ringler C, 2000. Global projections for root and tuber crops to 3
the year 2020. Food Policy 25:561-597. Salix viminalis grown in Sweden. Can. J. 4
For. Res. 24:1960-1969. 5
Stonecypher RW, McCullough RB, 1986. Estimates of additive and non-additive genetic 6
variance from a cloneal diallel of Douglas-fir Pseudotsuga menziesii (Mirb.) Franco. 7
In: Proc Int Union For Res Org, Join Mtg Working Parties Breed Theor, Prog Test, 8
Seed Orch. Williamsburg/VA. Publ by NCSU-Industry Coop Tree Imp Pgm, pp 211-9
227 10
Vega O. PC,1987. Introducción a la teoría de genética cuantitativa. Universidad Central 11
de Venezuela Press. Caracas. 12
Vencovsky R, Barriga P, 1992. Genética Biométrica no Fitomelhoramento. Sociedade 13
Brasileira de Genética. Ribeirão Preto, Brasil. 486 pp. 14
Wolf DP, Hallauer AR, 1997. Triple test cross analysis to detect epistasis in maize. Crop 15
Sci. 37:763-770. 16
17 18 19
20
21
22
23
24
Cach et al. 24 Epistasis in cassava
1
2
Table 1. Analysis of variance and expected mean squares for a 9-parents diallel design 3
in which the 30 cassava genotypes representing each F1 cross were clonally 4
propagated. 5
Source of
variation
Degrees freedom
MS Expected mean squares
Environment (E) a-1 MS1
Rep/E a(r-1) MS2
F1 [p(p-1)/2]-1 MS3 σ2e+ k σ2
ε+ rk σ2F1*E+ rka σ2
F1
GCA p-1 MS31 σ2e+ k σ2
ε+ rk σ2SCA*E+ rk(p-2) σ2
GCA*E+ rka+ σ2SCA +
+ rka(p-2) σ2GCA
SCA p(p-3)/2 MS32 σ2e+ k σ2
ε+ rk σ2SCA*E+ rka σ2
SCA
F1*E (a-1)([p(p-1)/2]-1) MS4 σ2e+ k σ2
ε+ rk σ2F1*E
GCA*E (a-1)(p-1) MS41 σ2e+ k σ2
ε+ rk σ2SCA*E+ rk(p-2) σ2
GCA*E
SCA*E (a-1)(p(p-3)/2) MS42 σ2e+ k σ2
ε+ rk σ2SCA*E
Error (a) a([p(p-1)/2]-1)(r-1) MS5 σ2e+ k σ2
ε
Clones/F1 (p(p-1)/2)(k-1) MS6 σ2e+ r σ2
c/F1*E+ ra σ2c/F1
Clones/F1*E (p(p-1)/2)(k-1)(a-1) MS7 σ2e+ r σ2
c/F1*E
Error (b) a(p(p-1)/2)(k-1)(r-1) MS8 σ2e
¶ a= number of environments evaluated (2); r= number of replications within each environment (3); p= 6
number of parents involved in the diallel crosses (9); k= number of cloned genotypes representing each 7
F1 cross (30). 8
9
10

Cach et al. 25 Epistasis in cassava
Table 2. Mean squares from the analysis of variance in a diallel set from nine parents 1
combining data from two locations (Pitalito and Sto. Tomás) in Atlántico 2
Department, Colombia. 3
Source of
variation df
Thrips
score
Fresh root
yield
Fresh
foliage yield
Harvest
Index
Dry matter
content
Dry matter
yield
1-5 t ha-1 t ha-1 0-1 % t ha-1
Environm. (E) 1 32.6NS 8901.1 NS 191775.7** 7.331* 3370.0 NS 2508.4 NS
Rep/E 4 36.4 2010.0 6273.0 0.595 608.3 361.2
F1 35 39.3** 3206.1** 2896.3** 0.262** 192.8** 222.6*
GCA 8 136.0** 8516.3 NS 7535.6 NS 0.587 NS 612.2* 537.2 NS
SCA 27 10.6** 1632.7** 1521.6** 0.166** 68.6 NS 129.3 NS
F1*E 35 2.0 NS 1040.1** 989.8** 0.093** 65.6** 108.2**
GCA*E 8 5.1** 2371.1** 2966.1** 0.228** 162.0** 257.9**
SCA*E 27 1.1 NS 645.8 NS 404.3** 0.053* 37.1** 63.9 NS
Error (a) 140 1.2 442.2 477.8 0.031 18.8 37.6
Clones/F1 1014 4.2** 1005.7** 985.0** 0.029** 41.5** 80.3**
Clones/F1*E 1014 0.4** 242.4** 193.8** 0.007** 8.2** 20.5**
Error (b) 3789 0.3 175.5 126.9 0.006 5.8 14.7
Overall error 3929 0.3 185.0 139.4 0.007 6.3 15.6
k¶ 27.6 27.6 27.6 27.6 27.5 27.5
¶ Harmonic mean for numbere of genotypes within F1 families. 4
5
6
7
8
9
Cach et al. 26 Epistasis in cassava
1
2
3
4
Table 3. Variances and test for epistasis from the evaluation of a diallel set combining 5
data from two locations (Pitalito and Sto. Tomás) in Atlántico Department, 6
Colombia. Within parenthesis the standard error for each estimate. 7
Genetic
parameter
Thrips
(1-5)
Fresh root
yield
Fresh foliage
yield
Harvest
Index
Dry matter
content
Dry matter
yield
σ2G
(Between F1) 0.225 13.09 11.53 0.0010 0.772 0.694
σ2G
(Within F1) 0.641 127.21 131.86 0.0037 5.556 9.977
σ2G
(Total) 0.867 140.30 143.39 0.0048 6.328 10.671
σ2A 0.419
(0.211)
17.82
(13.75)
11.93
(12.59)
0.0009
(0.0010)
1.452
(0.985)
0.741
(0.933)
σ2D 0.231
(0.068)
23.87
(11.15)
27.02
(10.00)
0.0027
(0.0011)
0.765
(0.497)
1.589
(0.919)
Epistasis
Test
0.259
(0.119)
100.40
(12.74)
105.64
(11.84)
0.0013
(0.0009)
4.257
(0.673)
8.414
(0.990)
¶ Test for epistasis = σ2c/F1 – 3 Cov. FS + 4 Cov. HS 8
9
10
11

Cach et al. 27 Epistasis in cassava
1