eprevention in the americas a survey on the status of … · related use among healthcare workers...
TRANSCRIPT

ePrevention in the Americas
A survey on the status of ICT access and health-related use among healthcare workers from selected
countries
Survey conducted by the ePrevention in Latin America and the Caribbean Project
Directed by Dr. Véronique Inès Thouvenot, Head of the WeObservatory
Report prepared by Dr. Lilia Perez-Chavolla, ICT Advisor, WeObservatory
Data collection and organization by Mrs. Lady Murrugarra, Coordinator e-Prevention, and Dr. Salim
Mohanna - Coordinator Physician
August 2014

ii
TABLE OF CONTENTS
INTRODUCTION ..................................................................................................................... 1
SURVEY RESULTS ................................................................................................................... 3
ICT access ......................................................................................................................................... 4
Mobile cellular telephone service ................................................................................................................. 6
Payphone use ......................................................................................................................................................... 7
Internet service ...................................................................................................................................................... 7
Use of ICT for healthcare contact and information retrieval ................................................ 8
ICT use (mobile phone or internet) for contacting a healthcare center ..................................... 8
Ease with which survey participants were able to contact their health center ........................ 9
Use of ICT (mobile phone or internet) to receive health information ...................................... 10
Provision of health information through radio and television ..................................................... 11
Interest in receiving health information in their local language.................................................. 11
Health information retrieved: Quality and topic preferences ............................................ 12
Type of health information obtained from healthcare centers .................................................... 12
Topics of interest for future distance education courses ................................................................ 13
CONCLUSIONS ..................................................................................................................... 15
Annex……………………………………………………………………………………………………………………………16
Photos…………………………………………………………………………………………………………………………..17
LIST OF FIGURES
Figure 1: Profile of survey respondents ............................................................................................................... 2
Figure 2: Country of origin and number of survey respondents per country ................................... 2
Figure 3: Respondents' professional background ........................................................................................... 3

iii
Figure 4: Status of ICT access by service, gender and location ............................................................... 5
Figure 5: Profile of respondents’ access to mobile cellular service ........................................................ 6
Figure 6: Profile of respondents’ access to payphone service .................................................................. 7
Figure 7: Profile of respondents’ access to residential internet service ................................................ 8
Figure 8: Respondents who use ICTs to contact their health center, by profession (%) .............. 9
Figure 9: Respondents who expressed facing difficulty when contacting their health center,
by profession (%) ................................................................................................................................... 10
Figure 10: Respondents who received health information via ICT, by age (%) ............................. 11
Figure 11: Type of information respondents obtain from their health centers ............................. 13
Figure 12: Health topics of interest for future distance education courses .................................... 14

1
INTRODUCTION
Under the sponsorship of the Millennia2025 Foundation Women and Innovation, PuF and Connecting
Nurses, ePrevention in Latin America and the Caribbean, one of the projects currently highlighted in
the Women Observatory for eHealth (WeObservatory), conducted a survey of healthcare workers
(HCW) and health related personnel during an ePrevention session held in the Province of Cajamarca,
Peru, in January 20141. The survey sought to collect data on the access to and use of information and
communication technologies (ICT) among healthcare personnel in the Andean region—Bolivia,
Colombia, Ecuador, Peru, and Venezuela—to assess the role ICTs currently play or could play in the
near future in the provision of health information for prevention, rapid response, and emergency care
in case of disaster.
The survey collected data on the level of access to mobile cellular telephone services—both in its
prepaid and postpaid modalities—, as well as to internet and payphone services among the
respondents. Regarding ICT usage, the survey gathered information on whether the participants used
ICTs to contact their healthcare center, any difficulties faced when contacting such centers, their use
of ICTs to seek or receive health information, and the type of information they usually get from their
healthcare centers. Finally, with respect to communication preferences, the survey asked the
participants about their interest in receiving health information—either through internet or mobile
phones—in their local language, their opinion regarding the usefulness of health information
currently provided by their local radio and television channels, as well as the health topics they would
be interested in receiving distance education on.
The ePrevention project received responses from 404 survey participants 2 , of whom 73% were
women. The respondents’ median age was 43 years old. Of those respondents who provided
information about their area of residence, the vast majority (93%) lived in urban areas, while only five
1
http://www.millennia2015.org/files/files/M25_WeObs_Projets/Millennia2025_WeO_ePrevencion_La_Cajamarca_San_
Benito_Programa_2014.pdf
http://www.millennia2015.org/files/files/M25_WeObs_Projets/Millennia2025_WeO_ePrevencion_La_Cajamarca_San_
Benito_2014.pdf
2 A total of 415 responses were received. Three records were eliminated because the respondents failed to
provide the gender information required for this analysis; eight additional records were identified as repeated
entries.

2
per cent did so in rural areas, and the remaining two per cent reported having residences in both
rural and urban areas3 (see Figure 1).
Figure 1: Profile of survey respondents
Although the focus of the survey was on collecting information from HCWs and health-related personnel from the Andean region (88% of the participants), the ePrevention survey also obtained information from HCWs from other Latin American countries, Italy and the United States (11%). Of the 20 countries represented in the survey, Peru had the largest contingent, with 78% of the participants. Figure 2 summarizes the origin and number of respondents per country that participated in the survey.
Figure 2: Country of origin and number of survey respondents per country4
3 These percentages exclude entries for three survey respondents who did not provide information about their
area of residence.

3
As illustrated in Figure 3 below, the professional background of the respondents was varied; while 62% of the participants could be classified as healthcare workers (nursing, general medicine, obstetrics, health promotion, and technical medical professionals), the background of 37% of the respondents was in related areas, ranging from psychology, biology and social work to education, engineering and informatics.
Figure 3: Respondents' professional background
SURVEY RESULTS
The survey results are divided into three sections: (1) ICT access includes results for survey questions
on the respondents’ ownership of mobile cellular telephones, subscription to residential internet
service, as well as use of payphone service; (2) Use of ICT for healthcare contact and information
retrieval provides results for questions referring to the participants’ use of ICTs (mobile phone and/or
internet service) to contact their healthcare center; the ease with which this contact usually takes
place; the use of ICTs (mobile phone or internet) to receive health information; the participants’
experience regarding the diffusion of health information through traditional media, such as radio and
television, as well as the participants’ interest in receiving health information in their own local
language. Finally, the third section, Health information retrieved: Quality and topic preferences,
analyzes replies to open-ended questions that enquired about the type of health information survey
participants usually obtain from their healthcare centers and the topics they would be interested in
getting distance education courses on in the future, identifying trends.
4 The totals in Figure 2 include only the records for those respondents who provided information about their
gender.
4
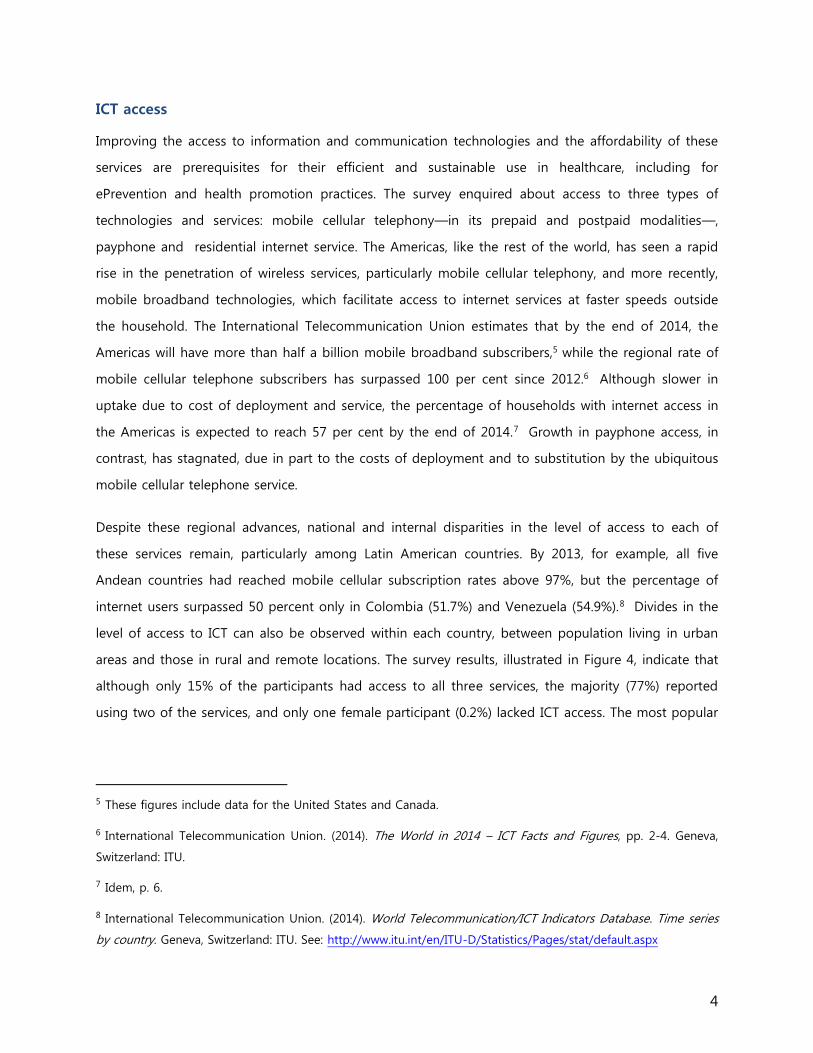
ICT access
Improving the access to information and communication technologies and the affordability of these
services are prerequisites for their efficient and sustainable use in healthcare, including for
ePrevention and health promotion practices. The survey enquired about access to three types of
technologies and services: mobile cellular telephony—in its prepaid and postpaid modalities—,
payphone and residential internet service. The Americas, like the rest of the world, has seen a rapid
rise in the penetration of wireless services, particularly mobile cellular telephony, and more recently,
mobile broadband technologies, which facilitate access to internet services at faster speeds outside
the household. The International Telecommunication Union estimates that by the end of 2014, the
Americas will have more than half a billion mobile broadband subscribers,5 while the regional rate of
mobile cellular telephone subscribers has surpassed 100 per cent since 2012.6 Although slower in
uptake due to cost of deployment and service, the percentage of households with internet access in
the Americas is expected to reach 57 per cent by the end of 2014.7 Growth in payphone access, in
contrast, has stagnated, due in part to the costs of deployment and to substitution by the ubiquitous
mobile cellular telephone service.
Despite these regional advances, national and internal disparities in the level of access to each of
these services remain, particularly among Latin American countries. By 2013, for example, all five
Andean countries had reached mobile cellular subscription rates above 97%, but the percentage of
internet users surpassed 50 percent only in Colombia (51.7%) and Venezuela (54.9%).8 Divides in the
level of access to ICT can also be observed within each country, between population living in urban
areas and those in rural and remote locations. The survey results, illustrated in Figure 4, indicate that
although only 15% of the participants had access to all three services, the majority (77%) reported
using two of the services, and only one female participant (0.2%) lacked ICT access. The most popular
5 These figures include data for the United States and Canada.
6 International Telecommunication Union. (2014). The World in 2014 – ICT Facts and Figures, pp. 2-4. Geneva,
Switzerland: ITU.
7 Idem, p. 6.
8 International Telecommunication Union. (2014). World Telecommunication/ICT Indicators Database. Time series
by country. Geneva, Switzerland: ITU. See: http://www.itu.int/en/ITU-D/Statistics/Pages/stat/default.aspx

5
mix of services was postpaid mobile phone and internet service (38%), followed by those who
preferred the prepaid modality and internet service (24%).
Figure 4: Status of ICT access by service, gender and location
Since most of the survey participants are urban women, it is not surprising that 59% of those
reporting access to the three services belong to this group, followed by urban men (34%). Of the
respondents with access to only one of the services, urban women prevailed once again, with at least
50% of the respondents.
Although the survey did not ask about the affordability of ICT services, information on the use of pre-
and postpaid mobile phone service among the respondents provides as a proxy for this technology.
The prepaid modality offers consumers a relatively more affordable service option and freedom from
long-term contracts. Under this “pay-as-you-go” modality, the consumer purchases credit in advance
of service use, which is applied to cover the cost of calls made or texts sent and received. In contrast,

6
under the postpaid modality, subscribers sign a mobile connection contract for a fixed term, face
penalties for early cancellation, and are billed monthly for mobile service even if their service use is
minimal. Interestingly, of the 13 urban women in the survey who had access only to mobile phone
service, a higher percentage subscribed to the postpaid modality (71%) than to prepaid (50%),
despite the fact that the latter tends to be more affordable.
Mobile cellular telephone service
As illustrated in Figure 5, subscriptions to mobile cellular telephone service among the survey
respondents neared 100%, reflecting the high penetration rates of the region. This percentage,
however, includes non-unique subscribers, as 8% of the respondents indicated using both prepaid
and postpaid mobile telephony.
Figure 5: Profile of respondents’ access to mobile cellular service
Mobile phone subscriptions were most prevalent among urban respondents (88%), and women
(72%), reflecting the general profile of the survey participants.
Only 17 respondents (4%) indicated not having access to mobile phone service. Of these 17, 71%
were urban women and 18% urban men.
7
The postpaid modality was the most commonly used by those respondents with mobile phone
subscriptions (51%).
Nevertheless, affordability still constitutes a barrier to access in rural areas. Among rural
respondents, the prepaid modality was more commonly used (7%) than postpaid (4%). More
importantly, 12% of them indicated not being subscribed to mobile cellular telephone service at
all. The subgroup with the highest percentage of non-subscribers to mobile cellular telephony
was rural women, with 15%.
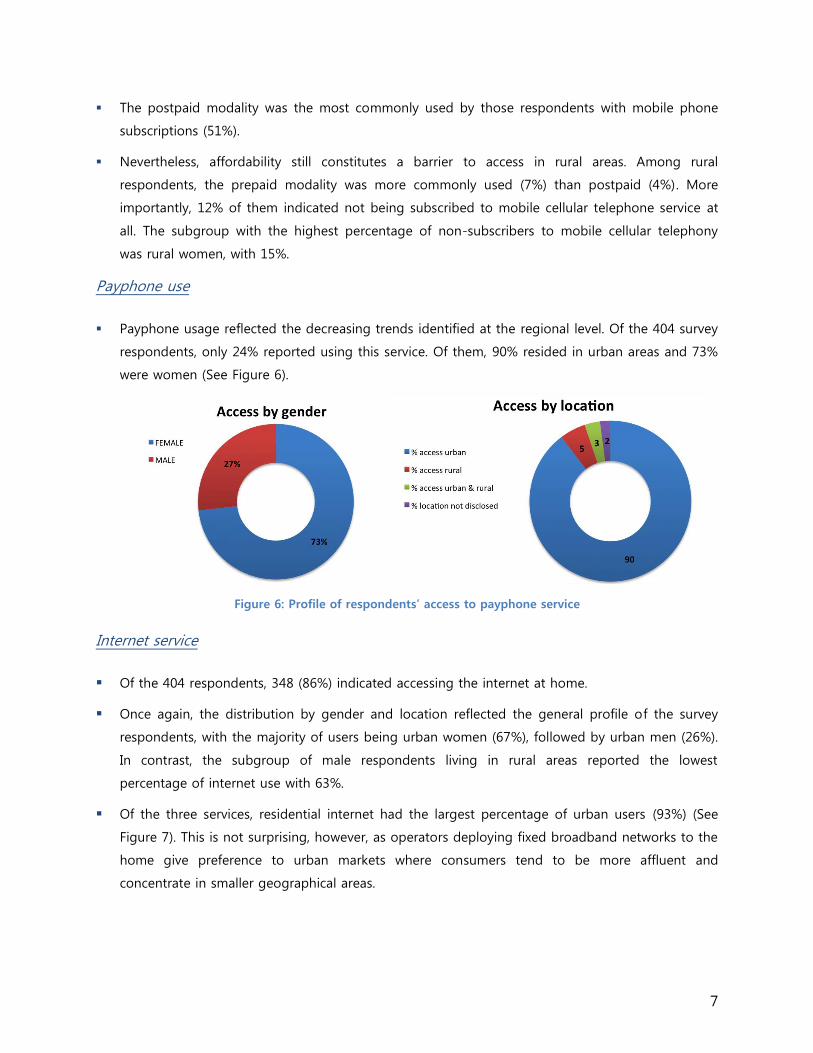
Payphone use
Payphone usage reflected the decreasing trends identified at the regional level. Of the 404 survey
respondents, only 24% reported using this service. Of them, 90% resided in urban areas and 73%
were women (See Figure 6).
Figure 6: Profile of respondents’ access to payphone service
Internet service
Of the 404 respondents, 348 (86%) indicated accessing the internet at home.
Once again, the distribution by gender and location reflected the general profile of the survey
respondents, with the majority of users being urban women (67%), followed by urban men (26%).
In contrast, the subgroup of male respondents living in rural areas reported the lowest
percentage of internet use with 63%.
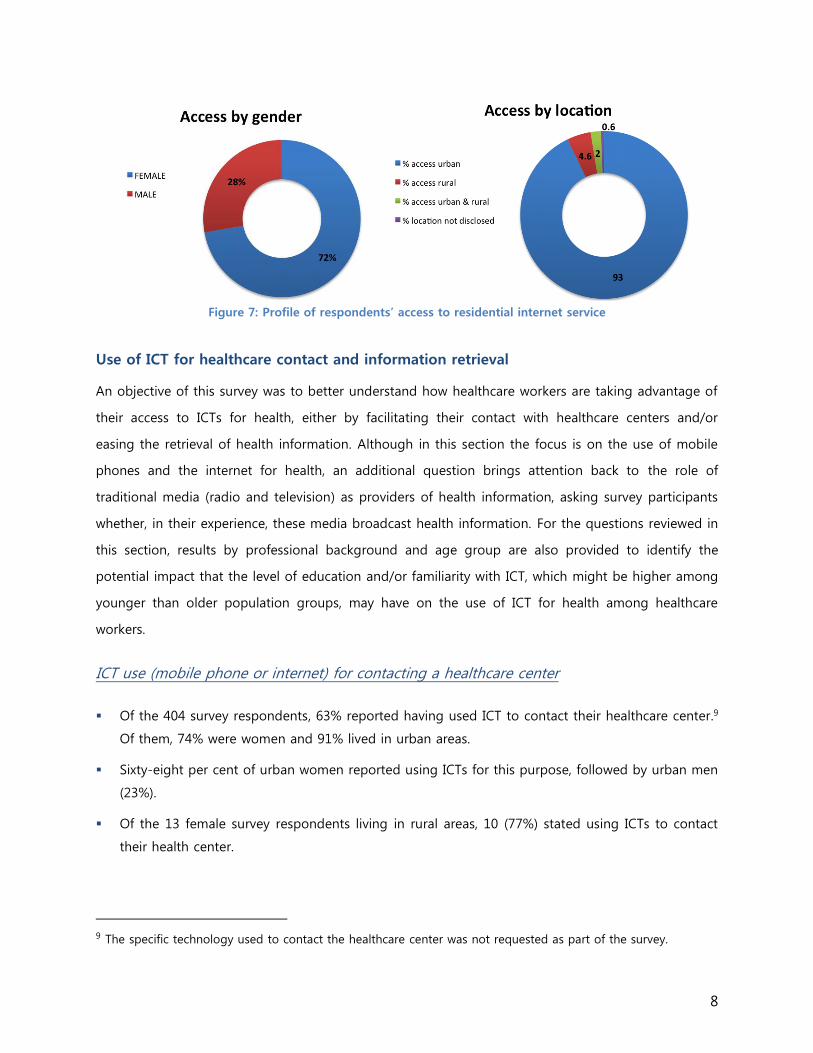
Of the three services, residential internet had the largest percentage of urban users (93%) (See
Figure 7). This is not surprising, however, as operators deploying fixed broadband networks to the
home give preference to urban markets where consumers tend to be more affluent and
concentrate in smaller geographical areas.
8
Figure 7: Profile of respondents’ access to residential internet service
Use of ICT for healthcare contact and information retrieval
An objective of this survey was to better understand how healthcare workers are taking advantage of
their access to ICTs for health, either by facilitating their contact with healthcare centers and/or
easing the retrieval of health information. Although in this section the focus is on the use of mobile
phones and the internet for health, an additional question brings attention back to the role of
traditional media (radio and television) as providers of health information, asking survey participants
whether, in their experience, these media broadcast health information. For the questions reviewed in
this section, results by professional background and age group are also provided to identify the
potential impact that the level of education and/or familiarity with ICT, which might be higher among
younger than older population groups, may have on the use of ICT for health among healthcare
workers.
ICT use (mobile phone or internet) for contacting a healthcare center
Of the 404 survey respondents, 63% reported having used ICT to contact their healthcare center.9
Of them, 74% were women and 91% lived in urban areas.
Sixty-eight per cent of urban women reported using ICTs for this purpose, followed by urban men
(23%).
Of the 13 female survey respondents living in rural areas, 10 (77%) stated using ICTs to contact
their health center.
9 The specific technology used to contact the healthcare center was not requested as part of the survey.

9
Based on their professional background, nurses, the subgroup with the highest number of survey
respondents, had the highest number of participants using ICTs to contact their health center
(37%). Nevertheless, when looking only at the percentage of ICT users for each profession,
primary doctors reported the highest level of use: Of the 62 primary doctors who participated in
the survey, 74.2% had contacted their health center using mobile phones or the internet (See
Figure 8).
Figure 8: Respondents who use ICTs to contact their health center, by profession (%)
In terms of age, 68% of those within the 30-39 and 40-49 years old subgroups reported using
ICTs for this purpose. These two age subgroups represented each 30% of all the survey
respondents who stated using ICTs to contact their health center.
Ease with which survey participants were able to contact their health center
Nearly one third of the survey respondents (30%) indicated having faced difficulties when
contacting their healthcare center.
Women (67%) and those living in urban areas (92%) stated having faced the most difficulty. Yet,
as a subgroup, of all the 294 women that participated in the survey, only 28% expressed facing
difficulties, compared to 36% of all the male respondents.
Among the professional subgroups, social workers had the highest percentage of respondents
facing difficulties in this area (70%). Based in the total number of survey respondents, however,
nurses had the highest percentage, with 25% of them expressing having had difficulty contacting

10
their health care center (See Figure 9). In contrast, only one per cent of the respondents with a
technical background expressed facing difficulties in this respect.
Figure 9: Respondents who expressed facing difficulty when contacting their health center,
by profession (%)
Regarding age, of all the respondents, those between 40 and 49 years old indicated facing the
most difficulty, with 32%. Interestingly, those in the 20-29 and in the 60+ subgroups had the least
number of respondents who had trouble contacting their health center, with 7% each out of the
404 survey respondents, implying that, at least in this respect, age might not be a contributing
factor to the problem.
Use of ICT (mobile phone or internet) to receive health information
Of the 404 survey participants, 61% received health information through their mobile phone or
the internet. Of them, 75% were women and 92% lived in urban areas.
Of the 273 women living urban areas, 63% used ICTs for this purpose, compared to only 23% of
the 99 urban male respondents.
Although only 13 women from rural areas participated in the survey, this subgroup of
respondents had the highest proportion of ICT users for this purpose, with 70% of them receiving
health information via ICT. This high level of use might be due to the lack of local resources for
health information, but the survey does not provide more information in this respect.

11
Of all the respondents, nurses, once again, reported the highest level of ICT use, with 32%. By
professional subgroup, however, the OB-GYNs topped the list, as 28 out of the 35 Gynecologists
participating in the survey (80%) received health information via ICT. On the other hand, only 26%
of the subgroup of educators indicated using their ICTs for this purpose.
Age did not seem to be an impediment for the use of ICT to receive health information. At least
half of the respondents within each of the age subgroups received health information through
their ICTs (See Figure 10).
Figure 10: Respondents who received health information via ICT, by age (%)
Provision of health information through radio and television
Of the 404 survey participants, 69% asserted that radio and television broadcasts provided health
information to the population. Of them, 75% were women and 93% lived in urban areas.
With the exception of those respondents with a background in Engineering or IT, more than half
of the respondents within each of the other professional subgroups agree that these traditional
media provide health information. In fact, 9 out of the 10 social workers who participated in the
survey thought so.
Similarly, at least 67% of the respondents within each age subgroup agreed that TV and radio
provided health information. Among them, the 60+ group topped the list, with 76% of the
respondents agreeing to this statement.
Interest in receiving health information in their local language

12
Not surprisingly, 95% of the survey participants showed interest in receiving health information in
their local language. At least 92% of the respondents in each of the subgroups for gender,
location, profession and age indicated being interested.
Health information retrieved: Quality and topic preferences
This last section presents the responses to open-ended questions enquiring about the type of
information survey participants usually obtain from their healthcare centers and the type of health
topics they would like to see covered in distance education courses. The participants’ replies to the
first question were classified under nine different topical areas, ranging from the key topic of interest
for this survey, health prevention and promotion, to health strategies, capacity building and statistics.
Replies to the second question were classified under 12 topical areas, to provide as much detail as
possible on the health areas that healthcare workers participating in the survey considered important
to keep abreast of or not sufficiently covered through other educational means.
Type of health information obtained from healthcare centers
Of the 404 survey respondents, 323 (80%) replied to this question.
Being an open-ended question, the participants’ responses were not uniform. Of those replying
to this question, 81% provided a list of the health topics they had received information or
training on, as well as resources, such as brochures and statistics, they had obtained from their
healthcare centers.
The remaining 61 respondents (19%), however, interpreted the question differently, focusing on
the quality of health information provided by the healthcare centers. Of this latter group, 32
(52%) indicated that they did not obtain health information at all from such centers, while the
other 29 (48%) commented that they did not find value in obtaining health information from their
healthcare center because such it was perceived as being either dated, scarce, or too general.
Figure 11 illustrates the distribution of participants’ responses by topic. Of the 262 participants
who listed the type of health information obtained from their health centers, 145 (55%)
mentioned prevention and promotion as the main area of health for which they obtained
information, resources and/or training. This is not surprising, as the topic of the conference from
which the survey respondents were selected was on the topic of ePrevention.

13
Figure 11: Type of information respondents obtain from their health centers
In terms of prevention, the respondents showed particular interest in obtaining information on
communicable diseases (CDs), especially on tuberculosis, dengue and HIV AIDS (24%). This
interest also motivated them to seek training, resources (epidemic bulletins, statistics and
brochures) and information to keep abreast of research and scientific developments.
Only 7% of the respondents indicated having received information on non-communicable
diseases (NCDs). Yet, as shown below, this not due to lack of interest in the topic. It is possible
that because of their nature and their prevalence among the population of the countries where
the survey respondents are from, communicable diseases are given priority for capacity building
and information sharing activities at health centers, over chronic diseases.
Topics of interest for future distance education courses
Figure 12 summarizes the 12 categories under which the respondents’ replies to this question
were classified. All 404 participants replied to this question, and only one of them stated having
no interest in receiving distance education on health topics.
Once again, communicable diseases and prevention and promotion activities were at the top of
the list of topics of interest, with 38% and 18% of the responses, respectively.
When compared to the health areas listed in the previous question, the participants’ replies show
a much wider breadth of interests, ranging from community health to non-communicable

14
diseases, and from maternal, neonatal and children health to emergency care and alternative
medicine.
Several respondents expressed the need to receive training on health issues relating to
adolescents, in particular to their sexual behavior. This topic crossed several of the categories
included in Figure 11, from prevention (HIV) and promotion activities, family medicine (family
planning), MNCH (youth pregnancy, for example), to mental health and nutrition (child obesity).
Figure 12: Health topics of interest for future distance education courses
The need and interest of the respondents in receiving training, is clearly shown in the large
percentage of participants under the “Other/any topic” category. To many of them, the mere
opportunity of receiving training on health topics was considered valuable.
Finally, it is encouraging to see that a few of the respondents (3%) expressed interest in receiving
further training on the use of ICT for health, be it eHealth, mHealth or telemedicine.

15
CONCLUSIONS
With a penetration rate of 96% among survey participants, mobile cellular telephony provides the
best platform for implementing ePrevention strategies among healthcare workers in the Andean
region. This survey provides evidence of the willingness and interest of health professionals to use
ICTs to seek health information and build their capacity to address key health issues affecting their
countries.
Although none of the survey questions referred to affordability of ICT services directly, the relatively
higher level of prepaid service uptake among the few survey respondents living in rural areas seems
to indicate that the cost of ownership and service remains a barrier to ICT access and use for this
population. Moreover, since only a limited number of HCWs living in rural areas participated in the
survey, it is difficult to evaluate the impact that reduced access to ICT services might have on their
ability to obtain health information and implement ePrevention practices. Further research on this
population group is needed.
One limitation of the survey is that while it enquired about the difficulties HCWs faced when
contacting their health center, it failed to ask about the specific nature of such difficulties—technical
problems with the use of ICTs, lack of personnel at the health center or of some other factor.
Consequently, even though the survey results indicate the existence of a barrier, they did not provide
sufficient information to identify potential areas for improvement.
Finally, divergences in the replies to the two open-ended questions in the survey shed light on the
existence of a gap between the type of health information currently being provided at healthcare
centers, and the health areas which the HCWs, through their day-to-day activities, have identified as
concerns and needs of the communities where they practice. ICTs, through eHealth /mHealth /
telemedicine and distance education activities can help bridge this gap.
16
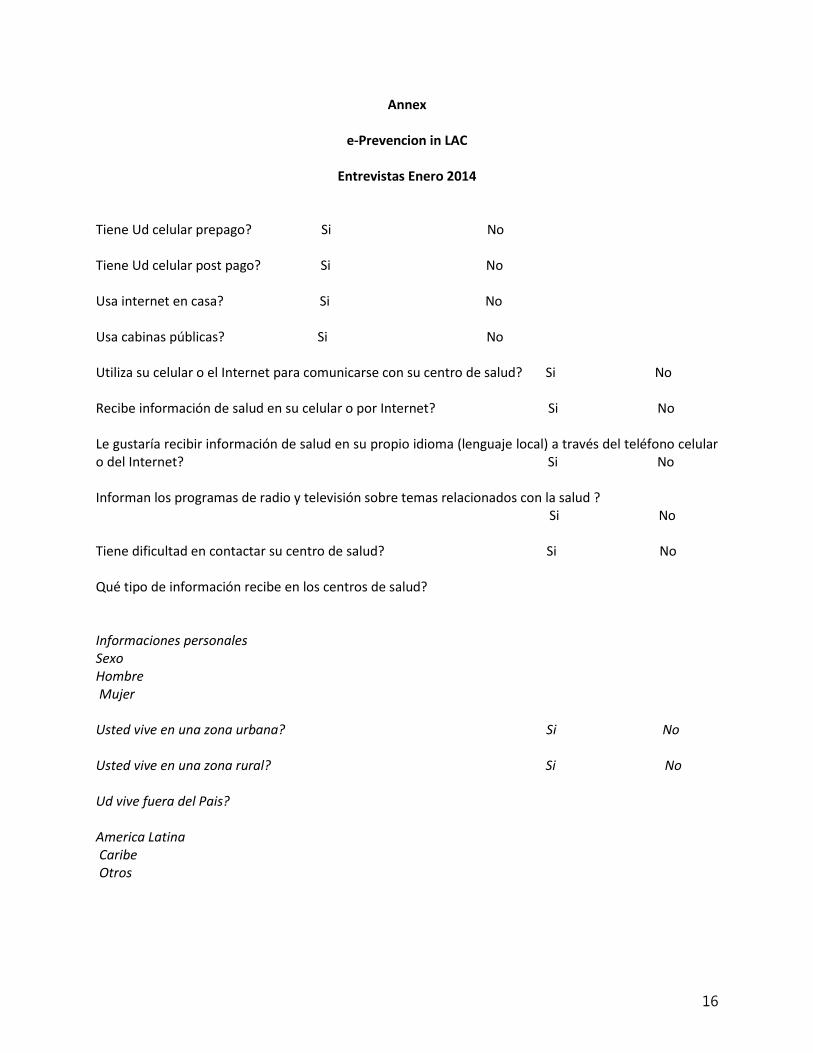
Annex
e-Prevencion in LAC
Entrevistas Enero 2014 Tiene Ud celular prepago? Si No Tiene Ud celular post pago? Si No Usa internet en casa? Si No Usa cabinas públicas? Si No Utiliza su celular o el Internet para comunicarse con su centro de salud? Si No Recibe información de salud en su celular o por Internet? Si No Le gustaría recibir información de salud en su propio idioma (lenguaje local) a través del teléfono celular o del Internet? Si No Informan los programas de radio y televisión sobre temas relacionados con la salud ? Si No Tiene dificultad en contactar su centro de salud? Si No Qué tipo de información recibe en los centros de salud? Informaciones personales Sexo Hombre Mujer Usted vive en una zona urbana? Si No Usted vive en una zona rural? Si No Ud vive fuera del Pais? America Latina Caribe Otros
17
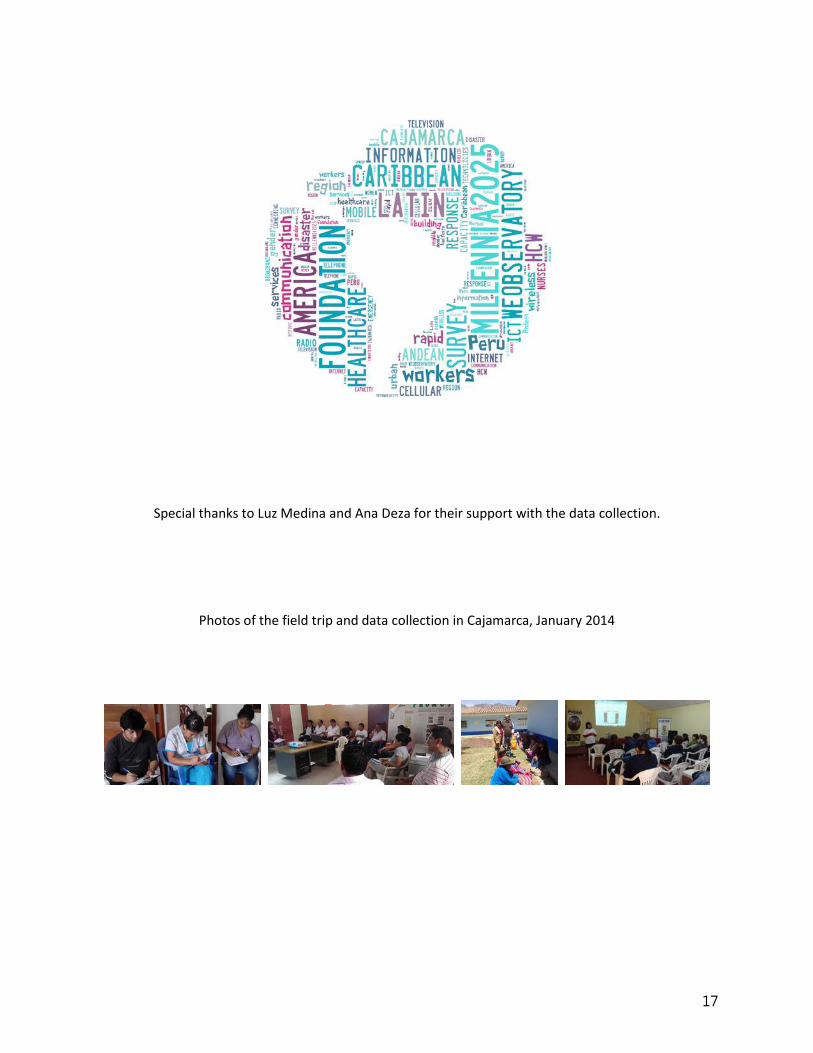
Special thanks to Luz Medina and Ana Deza for their support with the data collection.
Photos of the field trip and data collection in Cajamarca, January 2014