epubs.surrey.ac.ukepubs.surrey.ac.uk/844682/1/ethesis 2017_kirsty sheph… · web viewpredictors...
TRANSCRIPT

1
Predictors of response to Systems Training for Emotional Predictability and Problem Solving (STEPPS) for the treatment
of Borderline Personality Disorder
Kirsty Shepherd
Submitted for the Degree of
Doctor of Psychology(Clinical Psychology)
School of PsychologyFaculty of Health and Medical Sciences
University of SurreyGuildford, SurreyUnited KingdomSeptember 2017

2
Statement of Originality
This thesis and the work to which it refers are the results of my own efforts. Any ideas, data, images, or text resulting from the work of others (whether published or unpublished) are fully identified as such within the work and attributed to their originator in the text. This thesis has not been submitted in whole or in part for any other academic degree or professional qualification.
Name: Kirsty Shepherd

3
Overview
Borderline Personality Disorder (BPD) is a heterogeneous diagnosis which encapsulates a
wide range of symptom presentations. There are now a number of effective treatments for
BPD but individuals vary in their response to these different treatments. Understanding
people’s suitability to treatment would be beneficial in targeting and individualising BPD
treatment efforts. This thesis aimed to explore the BPD related predictors of treatment
response. Part one of this portfolio presents a narrative review of predictors of BPD
treatment outcomes. BPD severity, symptoms and subgroups predictors were included in this
review. Findings support previous reports that people with more severe BPD show larger
improvements following treatment, although there was a tendency for this to occur in more
skills-based treatments compared with reflective treatments. The findings on symptom level
predictors were varied and would benefit from replication. Subgroup research is still in its
early stages but findings suggest an important role of internal and external coping styles. Part
two presents an empirical paper investigating predictors of response to Systems Training for
Emotional Predictability and Problem Solving (STEPPS). Severity of BPD was examined as
a predictor of outcomes alongside each of the 9 DSM symptom criteria for BPD. Findings
are discussed in relation to the different methods of managing missing data. Severity was
found to be predictive of response. When severity was broken down into its symptom level
sub-parts, identity disturbance and dissociation were the most reliable predictors of response
to STEPPS.
A summary of my clinical experience during training and a list of assignments completed are
also documented.

4
Table of ContentsContents
Acknowledgements………………………………………………… 5
Research Part 1: Literature Review………………………………….6
Appendix to the Literature Review………………….………………102
Research Part 2: Empirical Paper……………………………………103
Appendices to the Empirical Paper………………………………….163
Part 3: Summary of Clinical Experience…………………………… 229
Part 4: Table of Assessments Completed During Training………… 231

5
Acknowledgements
I would like to thank my fellow trainee psychologists involved in the development and data
collection on the wider STEPPS research project, who have helped me in so many ways. The
advice and guidance from both my internal and external supervisor have been invaluable
throughout this entire project. I also want to thank all the people who participated in the
research and took time to share their thoughts and experiences of their time in STEPPS,
along with the facilitators and STEPPS coordinators who agreed to take part in the research
and made the project possible. I would like to thank Dr Mary Zanarini for allowing me to use
her self-report version of the Zanarini Rating Scale of Borderline Personality Disorder. My
cohort, members of my PPD group and course staff have always been there for advice and
encouragement and I will be ever grateful. Finally, I would like to thank my husband, who
has been patient, understanding and supportive over the past three years and who never
doubted my abilities even when I did.

6
Research Part 1
Literature Review
A systematic review evaluating severity, symptoms and subgroups of
borderline personality disorder as predictors of psychological therapy
outcomes.
Word Count: 7,980

7
Abstract
The diagnosis of Borderline Personality Disorder (BPD) includes a heterogeneous
array of clinical presentations, varying on demographics, comorbidities, symptom
profiles and severity of symptoms. Individuals with BPD show similar heterogeneity
when it comes to treatment response. Research into predictors of treatment response
has examined how these individual differences relate to treatment outcomes.
The aim of this review was to evaluate the current research into predictors of
outcome following psychological treatment, specifically looking at predictors related
to the BPD diagnosis and symptoms. A literature search was conducted using
EBSCO and WebofScience which identified 22 papers. The predictors in these
papers could be categorised under three headings: severity of BPD, symptoms of
BPD and subgroups of BPD. Results confirm that those with more severe BPD show
greater improvements to treatment. This pattern was more consistently observed in
skills based and CBT groups compared to more reflective therapies. Each DSM-IV-
TR symptom criteria for BPD was examined separately. Impulsivity and suicidal
tendencies failed to predict treatment outcomes. There was little consistency between
the other symptoms ability to predict treatment outcomes. By examining subgroups
as predictors of treatment outcome there emerged some preliminary evidence for the
importance of internalising and externalising styles in subgroups of BPD.
Limitations included varied treatment approaches, length of treatment, measures used
and treatment setting which makes direct comparisons difficult. Difficulties with the
exploratory nature and frequent post hoc analysis are also discussed. In terms of
future research there was a general need for replication studies in this area of
research.
8
Introduction
Borderline Personality Disorder (BPD) is characterised by dysregulation of emotion
and unstable interpersonal patterns along with impulsive and self-destructive
behaviours. Despite being relatively uncommon (estimates of 1.16%; Stone, 2006)
there is an incongruently high body of research into BPD which likely represents the
significant challenges associated with its treatment and high prevalence in mental
health settings (Widiger & Weissman, 1991). Complexity of treating BPD is
confounded by high rates of attempted (60-70%) and completed suicide (8-10%)
(Oldman, 2006). The substantial rates of comorbidity in people with BPD also
contribute to its complexity, with multiple diagnoses being the rule rather than the
exception (Zimmerman & Mattia, 1999).
BPD is a heterogeneous condition encompassing a variety of presentations (APA,
2001). The Diagnostic and Statistical Manual (DSM-IV-TR; APA, 2000) outlines
nine criteria for BPD, to reach diagnosis a person is required to meet five or more of
these criteria, allowing for over 150 different symptom profiles (Sanislow et al.,
2002). The World Health Organization's (WHO) International Classification of
Diseases (ICD-10) takes a different approach and refers to “Emotionally Unstable
Personality Disorder”. This review will use the DSM-IV-TR criteria as this is used
by the majority of the research reviewed. Diagnosis of BPD in DSM-5 (APA, 2013)
has not radically changed meaning findings from these papers can largely be applied
to DSM-5.
While some have argued that the heterogeneity of symptomatology in people with
BPD makes the diagnosis invalid (Tyrer, 1999) others have sought to understand the
origin of this diversity. Many indices and characteristics, including severity

9
dimensions (Asnaani, Chelminski, Young, & Zimmerman, 2007), interpersonal
styles (Wright, Hallquist, Beeney, & Pilkonis, 2013), affective reactivity (Kopala-
Sibley, Zuroff, Russell, Moskowitz, & Paris, 2012) and psychopathy (Newhill, Eack,
& Mulvey, 2009), have been examined with the aim of understanding the
heterogeneous presentation found within BPD. No sufficient explanation has been
identified for the assortment of presentations categorised under this single diagnosis.
Some researchers therefore suggest that the varied presentations in BPD could be
more accurately represented with subcategorises rather than a single diagnosis
(Oldham, 2006; Sanislow et al., 2002, Digre, Reece, Johnson, & Thomas, 2009;
Andión et al., 2011). These researchers are investigating the possibility that the
observed heterogeneity in BPD follows patterns and can be organised into more
reliable categorises than a unidimensional diagnosis.
Although once assumed untreatable, since the 1990’s many effective treatments have
emerged. Linehan (1993) published Dialectic Behavioural Therapy for BPD and
since then the number of therapies for BPD has expanded rapidly (Bateman &
Fonagy, 2004; Blum, Pfohl, John, Monahan, & Black, 2002; Clarkin, Yeomans, &
Kernberg, 2006; Kellogg & Young, 2004). Psychological therapy remains the front
line treatment for BPD (Stoffers et al., 2012).
Despite significant improvements in treatments available, response to treatment also
shows heterogeneity, for example Bohus et al. (2004) found that while 50% of
participants made clinically significant improvements following DBT, there were
50% who did not. It has been suggested 40% of people diagnosed with BPD who
request therapy may not benefit from it (Lana & Fernandez-San Martin, 2013).

10
Predicting who is likely to respond to the various treatment options would help
clinicians tailor and target treatments.
Research has examined how individual differences in people with BPD relate to
treatment outcomes, however there are a large number of individual differences
found in the BPD population. Individuals naturally vary in demographics and the
number and type of comorbid diagnoses. Research into the predictive power of
demographic variables and comorbidities has been reviewed (Barnicott et al., 2012).
Thirty three studies were identified, almost all failed to find a significant association
between treatment outcomes and demographics or comorbidities. The same review
(Barnicott et al., 2012) evaluated papers examining severity of BPD as a predictor of
outcome. This variable was found to be related to outcomes with higher baseline
severity predicting larger improvements.
While severity appears to be associated with some of the variance in treatment
outcomes (Barnicott et al., 2012), we know that looking at BPD as a homogeneous
group is likely to mask some key differences within this group. A sufficient body of
research now exists which looks at the separate BPD symptoms and their association
with treatment outcomes (Yen, Johnson, Costello, & Simpson, 2009). Research into
differential treatment response from subgroups of BPD is also starting to emerge
(Nesci, 2009; Eurelings-Bontekoe, Peen, Noteboom, Alkema & Dekker, 2012;
Altieri, 2011; Digre et al., 2009).
Aims and Rationale
Severity of BPD has been identified as a useful variable in predicting treatment
outcome (Barnicott et al., 2012). This finding would benefit from replication. Five

11
additional papers on severity and outcomes which have emerged since 2012 and
warrant review. Research that breaks down BPD severity into separate symptoms has
reached a degree which allows for a review of preliminary findings. The research
into the subgroups of BPD may also provide useful means of breaking down the
severity variable to provide information about predictors of treatment response and
help identify important areas for future research. The aims of this review are:
To review research into severity of BPD as a predictor of outcome.
To review research examining symptoms of BPD, as defined by the DSM-IV-
TR, as predictors of outcome.
To review research examining differential treatment response of identified
subgroups of BPD.
Method
Paper Identification
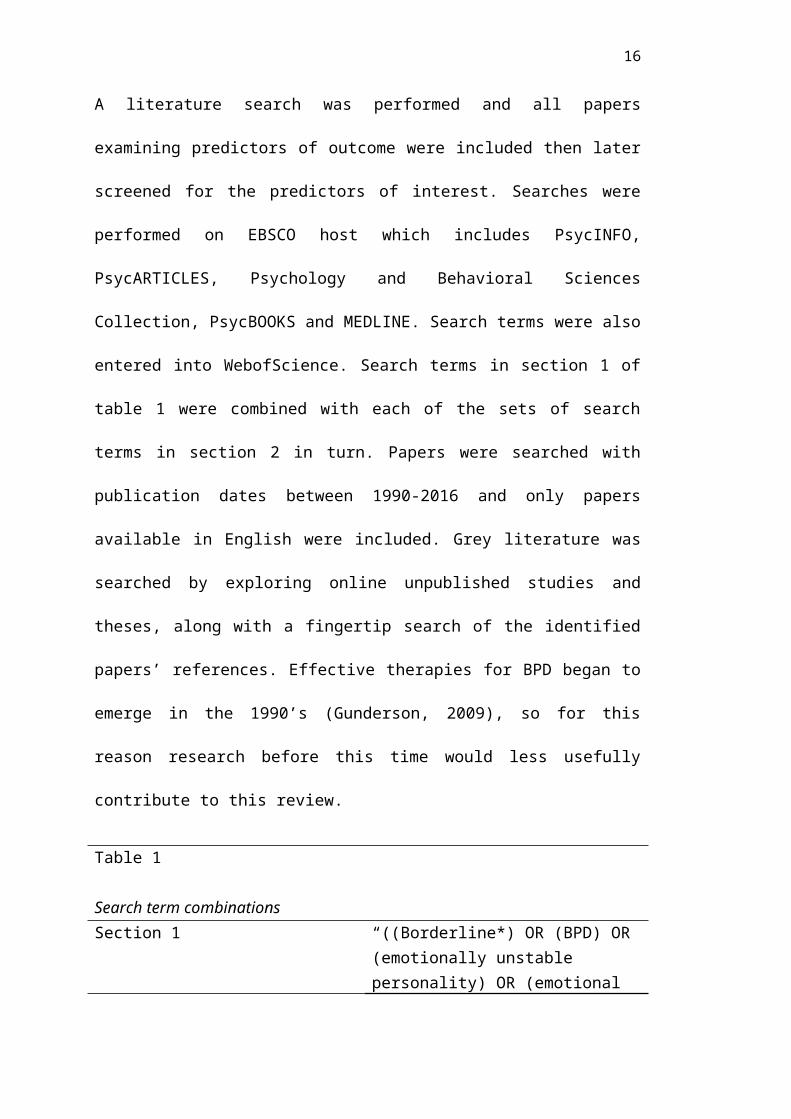
A literature search was performed and all papers examining predictors of outcome
were included then later screened for the predictors of interest. Searches were
performed on EBSCO host which includes PsycINFO, PsycARTICLES, Psychology
and Behavioral Sciences Collection, PsycBOOKS and MEDLINE. Search terms
were also entered into WebofScience. Search terms in section 1 of table 1 were
combined with each of the sets of search terms in section 2 in turn. Papers were
searched with publication dates between 1990-2016 and only papers available in
English were included. Grey literature was searched by exploring online unpublished
studies and theses, along with a fingertip search of the identified papers’ references.

12
Effective therapies for BPD began to emerge in the 1990’s (Gunderson, 2009), so for
this reason research before this time would less usefully contribute to this review.
Table 1
Search term combinationsSection 1 “((Borderline*) OR (BPD) OR
(emotionally unstable personality) OR (emotional intensity disorder) OR (impulsive type))”
Section 2 “AND ((treatment OR therapy) AND (response OR predict*))”
“AND (precit*) AND (outcome*)”
“AND ((precit*) AND (treatment outcome OR response))”
“AND ((treatment OR therapy) AND (effect*))”
“AND ((treatment OR therapy) AND (modulators))”
The search process identified 747 articles, 171 duplicates were excluded leaving 576
articles for screening. The titles of all 576 papers were screened. 279 were excluded
for not being relevant to the topic under review on the basis of the title (for example
when the focused on a diagnosis other than BPD or articles reporting medication
trials); if the suitability of the paper could not be judge from the title then it was
included at this stage. 297 abstracts were then screened to identify papers on
predictors of outcome with treatment for BPD. This excluded 233 further articles.
The remaining 64 full texts were screened using the inclusion and exclusion criteria
outlined below along with two papers from searching the grey literature and an
additional 6 from reviewing the reference lists of useful papers. 49 were excluded for

13
not meeting the inclusion criteria (see figure 1 for a full breakdown). The final
number for review was 23, and quality was assessed using the Specialist Unit for
Review Evidence (SURE, 2013). This was selected as it provides an amalgamation
of the Critical Appraisals Skills Program (CASP, 2017) and NICE Public Health
Methods Manual (2012) that covered key areas of critique. A qualitative review of
quality was performed using the SURE and the resulting critique is summarised in
table 3.

14
Figure 1: Prisma diagram (Moher, Liberati, Tetzlaff, & Altman, 2009) of systematic
search process
Articles identified through electronic database search N= 747
Articles for title screening N= 576
Exclusion of duplicates N= 171
Articles excluded following title screen N= 279
Articles for abstract screening N= 297
Articles for full text screening N= 64
Articles excluded following abstract screen N= 233
Articles excluded following full text screen N= 49
Reasons for exclusion:Not predictor of outcome study N=10Unavailable in English N=2Predictor not targeted N=18Review study N=1Predictors of response to hospitalisation N=4Adolescent participants N=4Predictors of natural prognosis N=2Treatment not targeting BPD N=2Non-BPD participant group N=4Predictors of dropout N=1Study protocol N=1
Articles included in review N= 23
Grey literature search N= 2
Review of references of key papers N= 6
15
Inclusion
Studies reporting quantitative findings using Randomised Controlled Trials
(RCTs), Naturalistic and Observational studies. A significant proportion of
the research comes from uncontrolled studies. These will be accepted as, at
this early stage of research, associations are key contributors to understanding
predictors of outcome.
Studies using participants either with a diagnosis of BPD, subthreshold BPD
or clinician judged BPD. Formal diagnosis of BPD using DSM criteria will
not be required as studies using sub-threshold BPD often have higher
ecological validity and are more representative of the BPD sample seen in
clinical practice (Bos, van Wel, Appelo, & Verbraak, 2011).
As the variable most consistently found to be related to treatment outcomes
(severity) is specifically related to the degree and content of the BPD
diagnosis only studies including predictor variables which specifically relate
to BPD content were targeted. Target variables fell into one of three
categories:
o Severity, defined by either BPD severity or global severity of
symptoms and measured on a quantitative scale
o Variables relating to the BPD criteria as defined by DSM-IV-TR:
frantic efforts to avoid abandonment, unstable interpersonal
relationships, identity disturbance, impulsivity, suicidal ideation and
deliberate self harm (DSH), affective instability, emptiness, problems
with anger and dissociative symptoms.
16
o Subgroups of BPD. Any reference to subgroup will be used as there is
no current agreement on the subgroups of BPD.
Studies including psychological and talking therapies with a primary aim of
treating BPD. Treatments of varied durations will be included as will both
group and individual therapies. Targeting any one form, duration or type of
therapy at this stage would restrict the richness of data for review.
Studies examining outcomes of BPD or associated general psychopathology
Studies including participants over the age of 18
Exclusion
Studies with participants whose primary diagnosis is not BPD
Studies not examining predictors of outcome
Studies including predictor variables not falling into the three categories
outlined above (factors relating to BPD diagnosis), including demographics,
comorbidities and other characteristics related to BPD including childhood
trauma, executive functioning and mentalisation. Although these are
important variables, including the full array of BPD features was beyond the
scope of this review so symptom variables were restricted to those outlined
by the DSM-IV-TR.
Studies which do not examine psychological therapy including
hospitalisation.
Treatments targeting other primary diagnoses and pharmacological studies.
Studies examining prognosis of BPD as opposed to treatment specific
outcomes. Research examining the natural course of BPD will be excluded as

17
variables predicting treatment response will not necessarily be the same as
those predicting naturally occurring changes.
Studies not examining outcomes of BPD or associated general
psychopathology
Participants under the age of 18
Studies not available in English.
Results
Results are grouped and presented under three headings relating to BPD severity,
symptoms and subgroups depending on the type of predictor variable being studied.
This allows these different predictor variables to be summarised, compared and
critiqued together.
Twenty three studies are reviewed, all papers report quantitative results relating to
how BPD related variables predict treatment outcomes. Eleven RCTs (Arntz, Stupar-
Rutenfrans, Bloo, van Dyck & Spinhoven. 2015; Bateman & Fonagy, 2013; Bellino,
Bozzatello, & Bogetto, 2015; Black, Allen, John, Pfohl, McCormick & Blum., 2009;
Bos et al., 2011; Davidson, Tyrer, Norrie, Palmer, & Tyrer, 2010; Giesen-Bloo et al.,
2006; Gratz, Dixon-Gordon & Tull., 2014; Lenzeweger, Clarkin, Levy, Yeomans &
Kernberg, 2012; Spinhoven, Giesen-Bloo, van Dyck & Arntz, 2008; Verheul, Van
Den Bosch, Koeter, De Ridder, Stijnen & Brink, 2003), ten naturalistic observation
studies (Altieri, 2011; Black, Blum, McCormick & Allen, 2013; Digre et al., 2009;
Eurelings-Bontekoe et al., 2012; Hull, Clarkin & Kakuma, 1993; Kleindienst et al.,
2011; Nesci., 2009; Ryle & Golynkina, 2000; Sparapani, 2014; Yen et al., 2009) and
two controlled studies were identified (Bohus et al, 2004; Meares, Stevenson &
Comerford, 1999). Some studies examined both severity and symptom level

18
predictors (Bohus et al., 2004; Ryle & Golynkina, 2000; Bellino et al., 2015). The
severity and symptom level results are summarised separately under the different
subsections. Eleven studies examine severity predictors (Black et al., 2009; Black et
al., 2013; Bellino et al., 2015; Bohus et al, 2004; Bos et al., 2011; Bateman &
Fonagy, 2013; Giesen-Bloo et al., 2006; Gratz et al., 2014, Meares et al., 1999; Ryle
& Golynkina, 2000; Spinhoven et al., 2008) twelve examine symptom level
predictors (Arntz et al., 2015; Bellino et al., 2015; Bohus et al, 2004; Hull et al.,
1993; Davidson, Tyrer, Norrie, Palmer, & Tyrer, 2010; Gratz et al., 2014;
Kleindienst et al., 2011; Lenzeweger, et al., 2012; Ryle & Golynkina, 2000;
Sparapani, 2014; Verheul et al., 2003; Yen et al., 2009) and four BPD subgroups
(Altieri, 2011; Digre et al., 2009; Eurelings-Bontekoe et al., 2012; Nesci, 2009).
A variety of treatment approaches were studied including DBT (Altieri, 2011),
Cognitive Analytic Therapy (CAT) (Ryle & Golynkina, 2000), Systems Training for
Emotional Predictability and Problem Solving (STEPPS) (Black et al., 2009),
Mentalisation Based Therapy (MBT) (Bateman & Fonagy, 2013), Interpersonal
Psychotherapy (IPT) (Bellino et al., 2015), Psychodynamic therapies (Meares et al.,
1999) and Schema therapy (Giesen-Bloo et al., 2006). Participants were all adults
with mean ages within late twenties and early thirties. Six studies had only female
participants (Bohus et al., 2004; Gratz et al., 2014; Hull et al., 1993; Kleindienst et
al., 2011; Verheul et al., 2003; Yen et al., 2009), although females dominated across
all studies. Studies were conducted in a range of countries including the Netherlands
(Giesen-Bloo et al., 2006), Australia (Nesci, 2009), the U.K (Ryle & Golynkine,
2000), the U.S (Black et al. 2009), Germany (Bohus et al., 2004) and Italy (Bellino et
al., 2015) (see table 2 for additional details).

19
BPD Severity
The predictor variable most frequently studied was severity of BPD. Barnicot et al.
(2012) included a review of severity papers. Six are reviewed again. Since this time
the evidence has almost doubled, with five additional papers published which
warrant incorporation. Of eleven, seven found higher baseline severity predicted
greater improvements following treatment (Meares et al., 1999; Giesen-Bloo et al.,
2006; Black et al., 2009; Bos et al., 2011; Black et al., 2013; Gratz et al., 2014;
Bellino et al., 2015). One study found baseline severity to predict poorer outcomes
(Ryle & Golynkina, 2000) and three found severity had no predictive power over
outcome (Bohus et al., 2004; Spinhoven, Giesen-Bloo, van Dyck, & Arntz, 2008;
Bateman & Fonargy, 2013).
Three RCTs using dimensional measures of severity found that higher baseline
severity predicts larger improvements following treatment of BPD (Black et al.,
2009; Bos, van Wel, Appelo, & Verbraak, 2011; Giesen-Bloo et al., 2006) alongside
two uncontrolled trial (Black, Blum, McCormick, & Allen, 2013; Bellino et al.,
2015).
Two of the RCTs examined STEPPS treatment (Black et al., 2009; Bos et al., 2011).
Black et al. (2009) found higher baseline Zanarini Rating Scale for BPD (ZAN-BPD;
Zanarini, 2003) scores predicted significantly larger improvements on the ZAN-BPD
and higher baseline Borderline Evaluation of Severity over Time (BEST, Blum,
Pfohl, John, Monahan & Black, 2002) scores predicted larger improvements on the
BEST. In one of the higher quality studies, Bos et al. (2011) found baseline severity
was significantly related to increased improvements in scores on the Symptom

20
Checklist-90-R (SCL-90-R; Derogatis & Savitz, 2000) and BPD symptom severity
(BPD-40 score).
Regression to the mean (Barnett, van der Pols, & Dobson, 2005) could explain why
participants with higher baseline scores demonstrate greater reductions following
treatment. However the findings by Bos et al. (2011) cannot be explained by
regression to the mean as the authors found a differential effect of severity on
participants within the treatment and control conditions. Only one study (Spinhoven,
Giesen-Bloo, van Dyck, & Arntz, 2008), using a dimensional measure of severity
(final Borderline Personaity Disorder-Severity Index [BPD-SI] score; Arntz et al.,
2003), found severity to be unrelated to outcome. However when entered into a
regression model predicting reliable change severity contributed to the variance in
scores.
Ryle and Golynkina (2000) was the only study to find a negative association between
baseline severity and treatment outcome. This study divided participants into
improved and unimproved groups based on whether they still reached diagnostic
criteria for BPD at the end of CAT. BPD DSM Index Severity was significantly
higher in the unimproved group than the improved group with a medium effect size
of r=.31. Other studies defined severity as the number of BPD DSM criteria met
(Meares et al., 1999; Bohus et al., 2004; Bateman & Fonargy, 2013; Gratz et al.,
2014). Two did not find a predictive effect of the number of criteria on outcome
(Bohus et al., 2004; Bateman & Fonargy, 2013), one found an initial predictive effect
which did not hold up at follow-up (Gratz et al., 2014) and one found higher number
of DSM-III criteria at baseline predicted greater reductions on number of criteria at
the end of treatment (Meares et al., 1999).
21
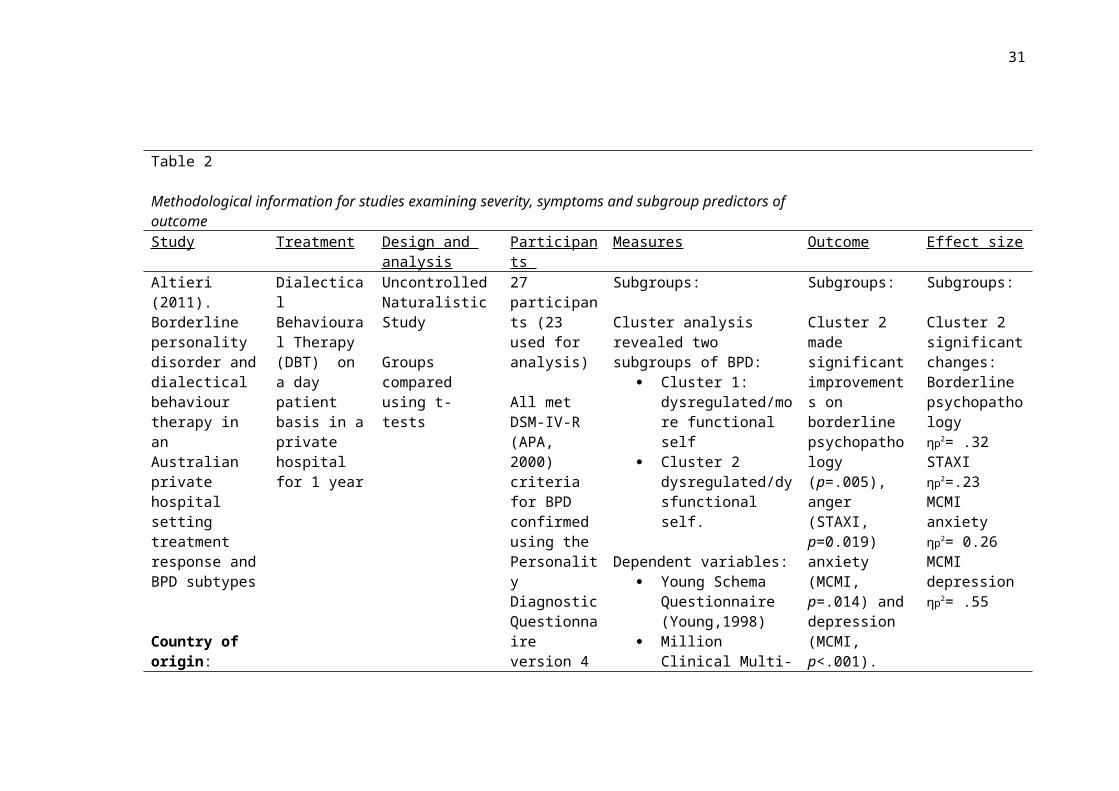
Table 2
Methodological information for studies examining severity, symptoms and subgroup predictors of outcomeStudy Treatment Design and
analysisParticipants Measures Outcome Effect size
Altieri (2011). Borderline personality disorder and dialectical behaviour therapy in an Australian private hospital setting treatment response and BPD subtypes
Country of origin: Australia
Dialectical Behavioural Therapy (DBT) on a day patient basis in a private hospital for 1 year
Uncontrolled Naturalistic Study
Groups compared using t-tests
27 participants (23 used for analysis)
All met DSM-IV-R (APA, 2000) criteria for BPD confirmed using the Personality Diagnostic Questionnaire version 4 (PDQ-4) (Hyler, 1994)
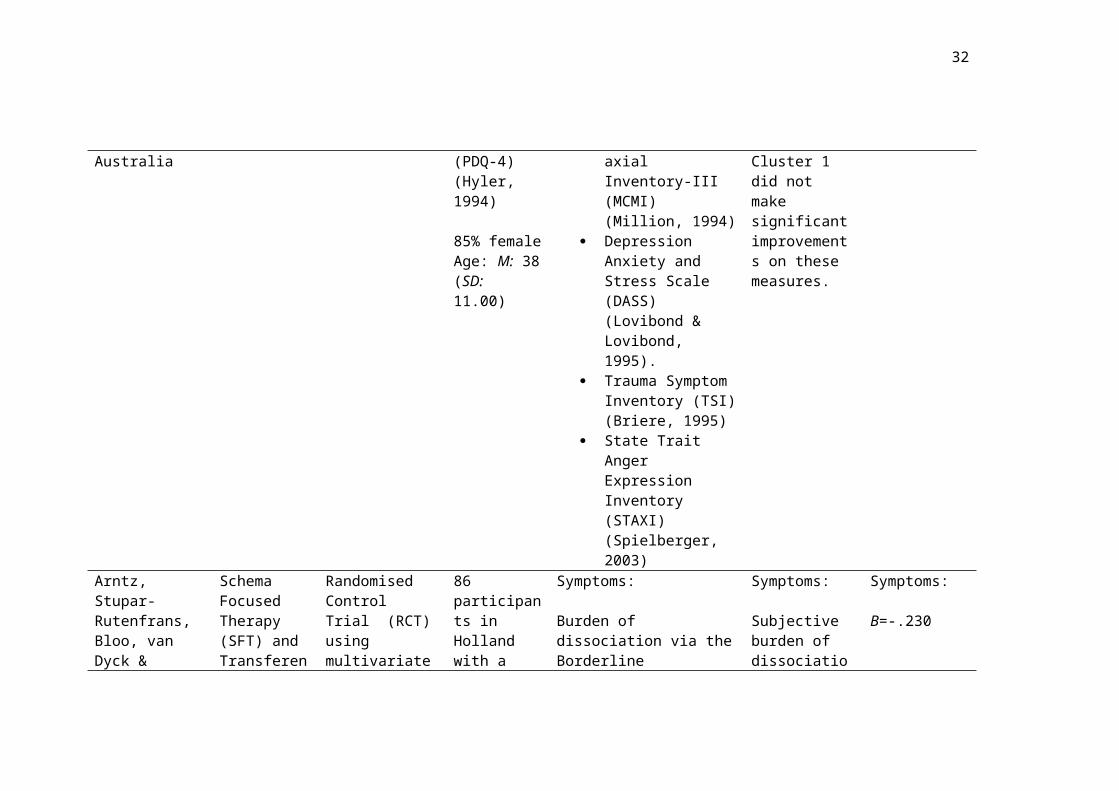
85% femaleAge: M: 38 (SD: 11.00)
Subgroups:
Cluster analysis revealed two subgroups of BPD:
Cluster 1: dysregulated/more functional self
Cluster 2 dysregulated/dysfunctional self.
Dependent variables: Young Schema
Questionnaire (Young,1998)
Million Clinical Multi-axial Inventory-III (MCMI) (Million, 1994)
Depression Anxiety and Stress Scale (DASS) (Lovibond & Lovibond, 1995).
Trauma Symptom Inventory (TSI) (Briere, 1995)
Subgroups:
Cluster 2 made significant improvements on borderline psychopathology (p=.005), anger (STAXI, p=0.019) anxiety (MCMI, p=.014) and depression (MCMI, p<.001). Cluster 1 did not make significant improvements on these measures.
Subgroups:
Cluster 2 significant changes:Borderline psychopathology ηp2= .32STAXI ηp2=.23MCMI anxiety ηp2= 0.26MCMI depressionηp2= .55

22
State Trait Anger Expression Inventory (STAXI) (Spielberger, 2003)
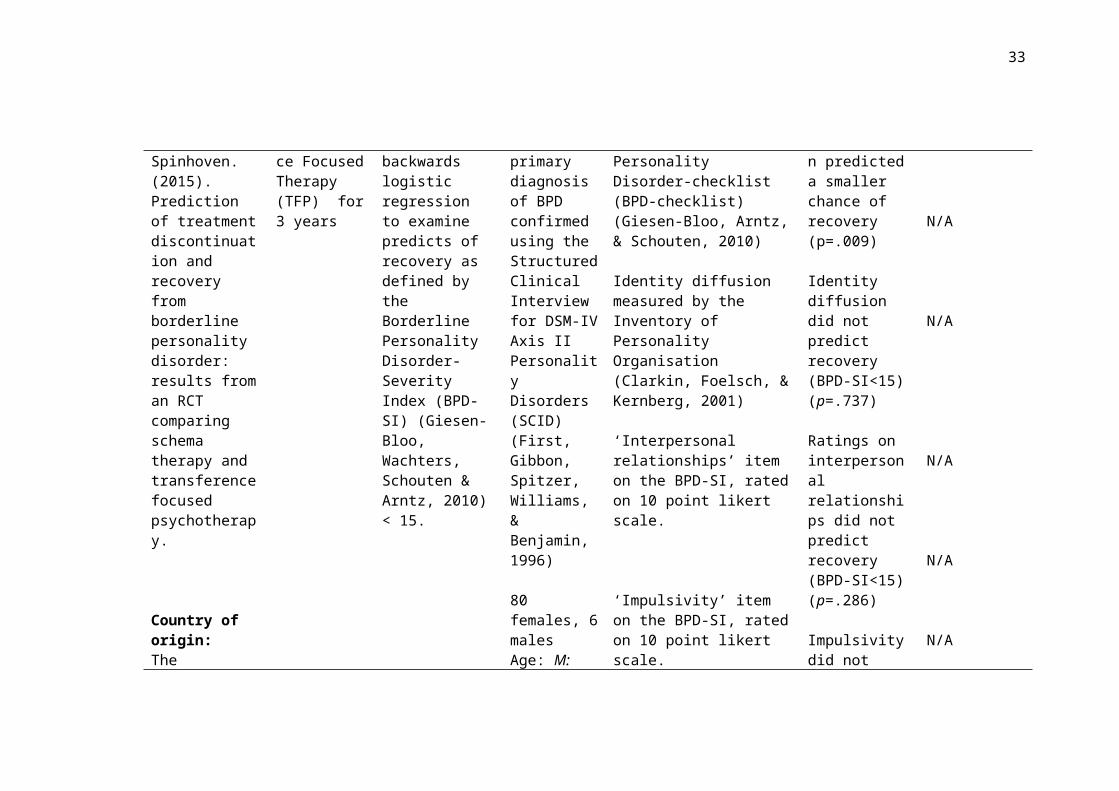
Arntz, Stupar-Rutenfrans, Bloo, van Dyck & Spinhoven. (2015). Prediction of treatment discontinuation and recovery from borderline personality disorder: results from an RCT comparing schema therapy and transference focused psychotherapy.
Country of origin:The Netherlands
Schema Focused Therapy (SFT) and Transference Focused Therapy (TFP) for 3 years
Randomised Control Trial (RCT) using multivariate backwards logistic regression to examine predicts of recovery as defined by the Borderline Personality Disorder-Severity Index (BPD-SI) (Giesen-Bloo, Wachters, Schouten & Arntz, 2010) < 15.
86 participants in Holland with a primary diagnosis of BPD confirmed using the Structured Clinical Interview for DSM-IV Axis II Personality Disorders (SCID) (First, Gibbon, Spitzer, Williams, & Benjamin, 1996)
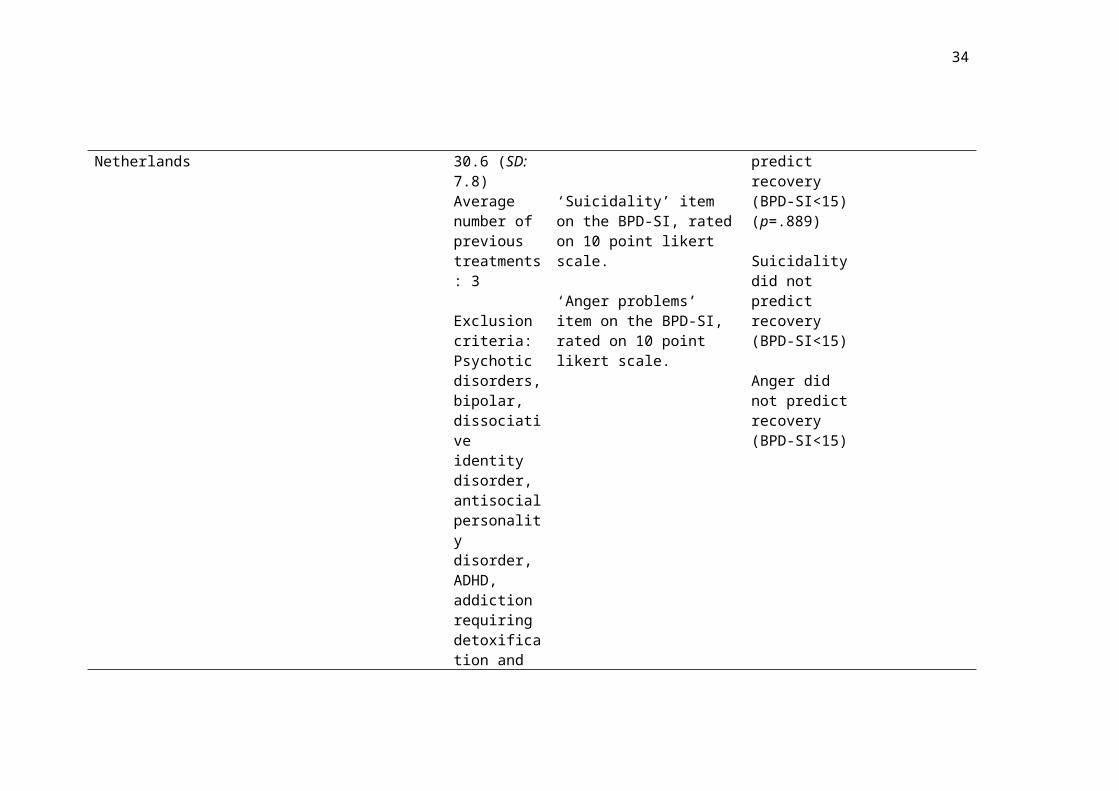
80 females, 6 malesAge: M: 30.6 (SD: 7.8)Average number of previous
Symptoms:
Burden of dissociation via the Borderline Personality Disorder-checklist (BPD-checklist) (Giesen-Bloo, Arntz, & Schouten, 2010)
Identity diffusion measured by the Inventory of Personality Organisation (Clarkin, Foelsch, & Kernberg, 2001)
‘Interpersonal relationships’ item on the BPD-SI, rated on 10 point likert scale.
‘Impulsivity’ item on the BPD-SI, rated on 10 point likert scale.
‘Suicidality’ item on the BPD-SI, rated on 10 point likert scale.
Symptoms:
Subjective burden of dissociation predicted a smaller chance of recovery (p=.009)
Identity diffusion did not predict recovery (BPD-SI<15)(p=.737)
Ratings on interpersonal relationships did not predict recovery (BPD-SI<15) (p=.286)
Impulsivity did not predict recovery (BPD-SI<15) (p=.889)
Symptoms:
Β=-.230
N/A
N/A
N/A
N/A

23
treatments: 3
Exclusion criteria: Psychotic disorders, bipolar, dissociative identity disorder, antisocial personality disorder, ADHD, addiction requiring detoxification and learning disability.
‘Anger problems’ item on the BPD-SI, rated on 10 point likert scale.
Suicidality did not predict recovery (BPD-SI<15)
Anger did not predict recovery (BPD-SI<15)
N/A
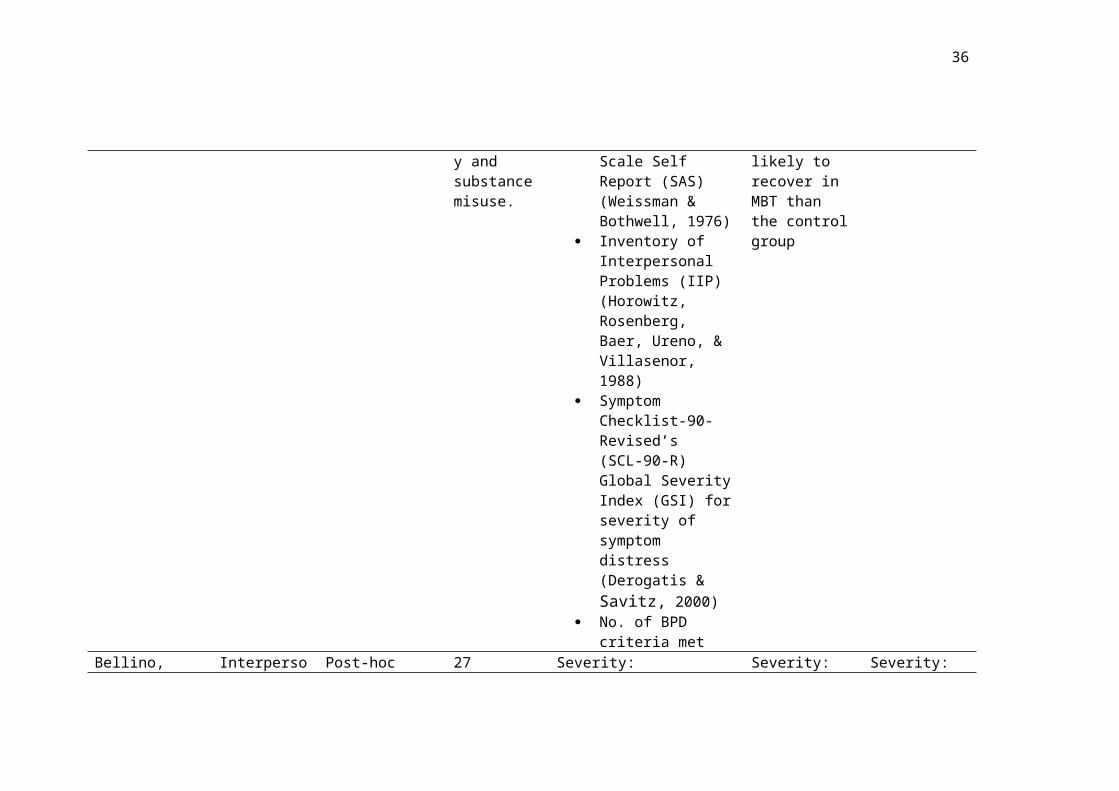
Bateman & Fonagy (2013). Impact of clinical severity on outcomes of mentalisation-based treatment for borderline personality disorder.
Country of
Mentalisation-Based Treatment (MBT)
Control condition: structured clinical management
Treatment for
RCT, secondary analysis of data.
Mixed effects regression models and linear regression
134 participants, referred following a recent crisis incident
MBT N= 71Control N= 63
BPD diagnosis confirmed
Severity:
Primary outcome measure was absence of crisis episode (suicide, self-harm or hospital admission
Global Assessment of Functioning (GAF) (APA, 2000)
Beck Depression Inventory (BDI)
Severity:
None of the severity criteria measured predicted outcome in a regression model as a main effect or interaction.
However those
Severity:
Non-significant effect
r= .277* for GSI above the mean

24
origin:The U.K
1.5 year using the SCID
Exclusion criteria: antisocial personality and substance misuse.
(Beck, Ward, Mendelson, Mock, & Erbaugh, 1961)
Social Adjustment Scale Self Report (SAS) (Weissman & Bothwell, 1976)
Inventory of Interpersonal Problems (IIP) (Horowitz, Rosenberg, Baer, Ureno, & Villasenor, 1988)
Symptom Checklist-90- Revised’s (SCL-90-R) Global Severity Index (GSI) for severity of symptom distress (Derogatis & Savitz, 2000)
No. of BPD criteria met
who had above the median scores on the GSI were more likely to recover in MBT than the control group
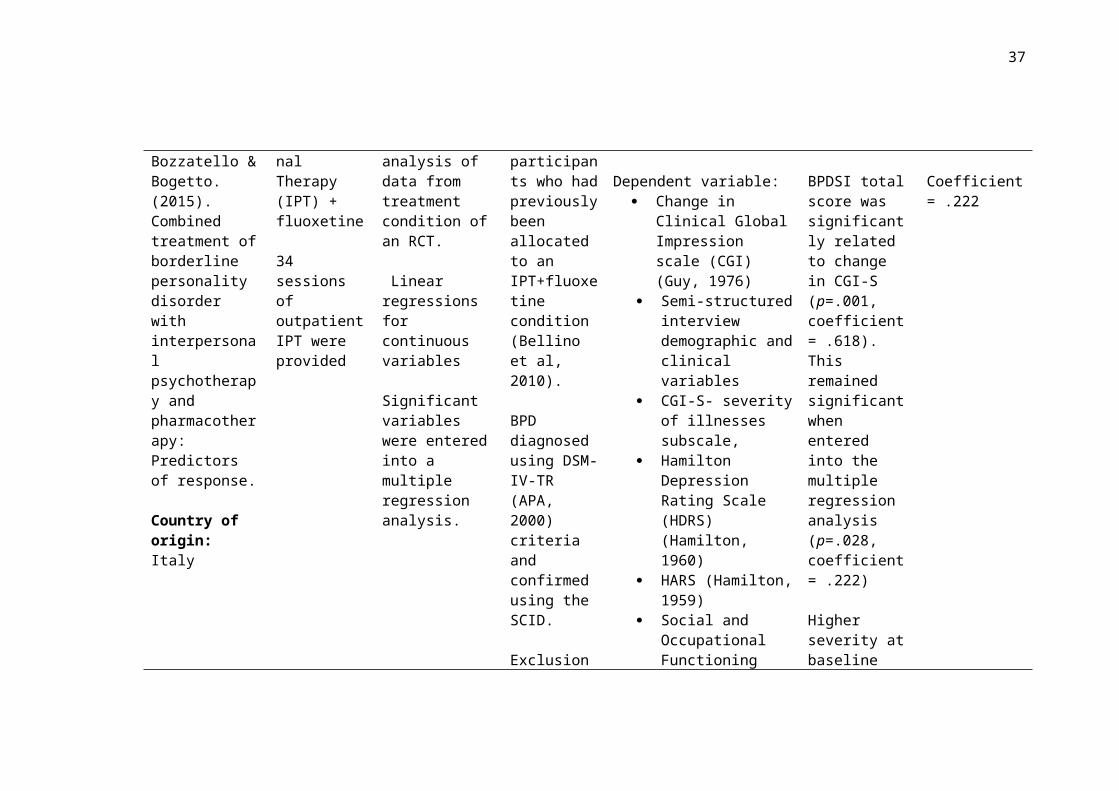
Bellino, Bozzatello & Bogetto. (2015). Combined treatment of borderline personality disorder with interpersonal
Interpersonal Therapy (IPT) + fluoxetine
34 sessions of outpatient IPT were provided
Post-hoc analysis of data from treatment condition of an RCT.
Linear regressions for continuous variables
27 participants who had previously been allocated to an IPT+fluoxetine condition (Bellino et al, 2010).
Severity:
Dependent variable: Change in Clinical
Global Impression scale (CGI) (Guy, 1976)
Semi-structured interview
Severity:
BPDSI total score was significantly related to change in CGI-S (p=.001, coefficient= .618
Severity:
Coefficient= .222

25
psychotherapy and pharmacotherapy: Predictors of response.
Country of origin:Italy
Significant variables were entered into a multiple regression analysis.
BPD diagnosed using DSM-IV-TR (APA, 2000) criteria and confirmed using the SCID.
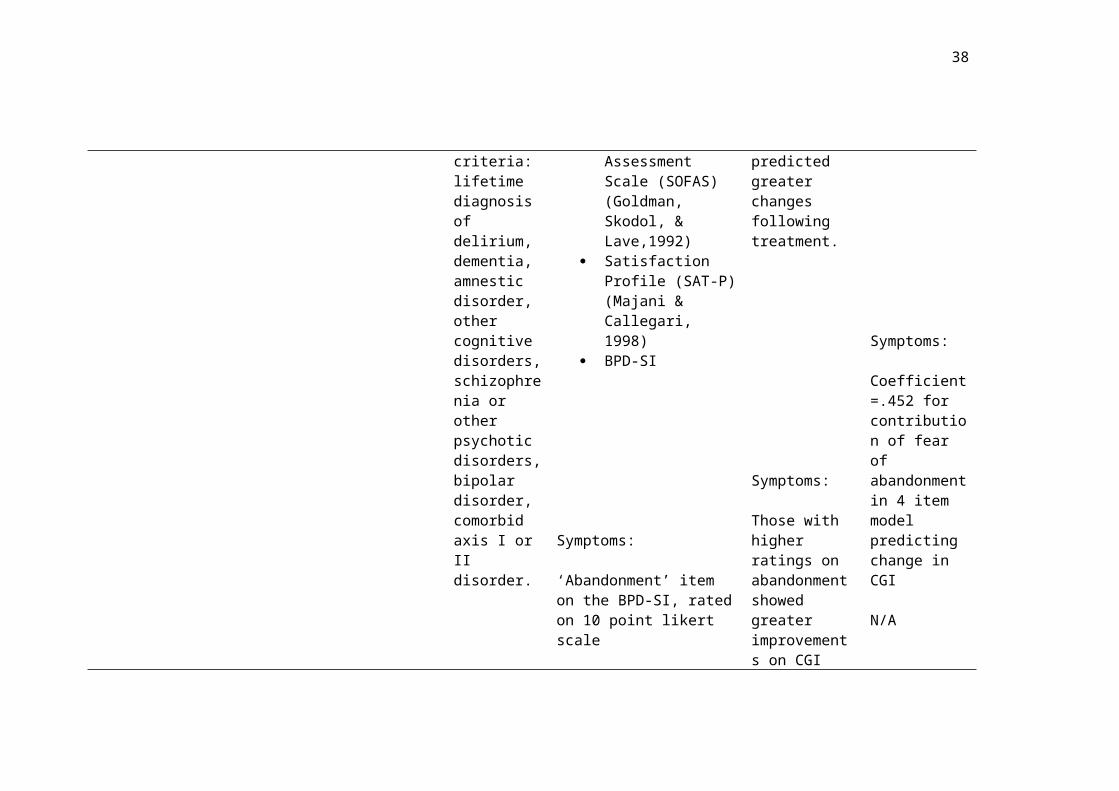
Exclusion criteria: lifetime diagnosis of delirium, dementia, amnestic disorder, other cognitive disorders, schizophrenia or other psychotic disorders, bipolar disorder, comorbid axis I or II disorder.
demographic and clinical variables
CGI-S- severity of illnesses subscale,
Hamilton Depression Rating Scale (HDRS) (Hamilton, 1960)
HARS (Hamilton, 1959)
Social and Occupational Functioning Assessment Scale (SOFAS) (Goldman, Skodol, & Lave,1992)
Satisfaction Profile (SAT-P) (Majani & Callegari, 1998)
BPD-SI
Symptoms:
‘Abandonment’ item on the BPD-SI, rated on 10 point
). This remained significant when entered into the multiple regression analysis (p=.028, coefficient= .222)
Higher severity at baseline predicted greater changes following treatment.
Symptoms:
Those with higher ratings on abandonment
Symptoms:
Coefficient=.452 for

26
likert scale
‘Interpersonal relationships’ item on the BPD-SI, rated on 10 point likert scale.
‘Identity’ item on the BPD-SI, rated on 10 point likert scale.
‘Impulsivity’ item on the BPD-SI, rated on 10 point likert scale.
showed greater improvements on CGI score (p=.001)
Ratings on interpersonal relationships did not predict improvements on CGI score (p=.548).
Higher ratings on identity at baseline predicted greater improvements on CGI score (p=.003).
Ratings on impulsivity did not predict improvements on CGI score (p=.114).
contribution of fear of abandonment in 4 item model predicting change in CGI
N/A
Multiple Regression Coefficient=.307 for contribution of identity in 4 item model predicting change in CGI
N/A

27
‘Parasuicidal behaviour’ item on the BPD-SI, rated on 10 point likert scale.
‘Affective instability’ item on the BPD-SI, rated on 10 point likert scale.
‘Emptiness’ item on the BPD-SI, rated on 10 point likert scale.
‘Outbursts of anger’ item on the BPD-SI, rated on 10 point likert scale.
‘Paranoid ideation’ item on the BPD-SI, rated on 10 point likert scale.
Parasuicidal beahviour was not predictive of change in CGI score (p=.304)
Higher affective instability scores predicted greater improvements on CGI score (p=.030)
Emptiness did not predict change in CGI score (p=.266)
Outbursts of anger did not predict change in CGI score
Paranoid ideation significant at the linear regression (p=.080 but was not predictive of change in CGI
N/A
Coefficient=.242 for contribution of affective instability in 4 item model predicting change in CGI
N/A
N/A
N/A

28
score at the multiple regression analysis.
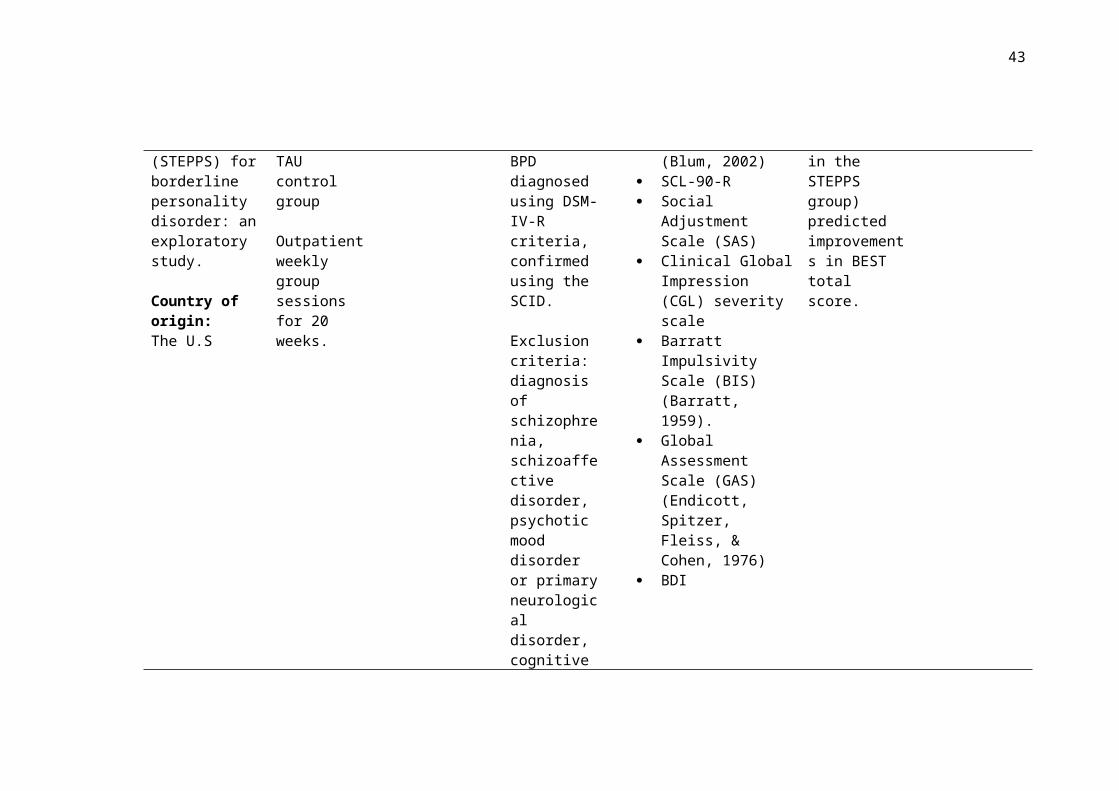
Black, Allen, John, Pfohl, McCormick & Blum. (2009). Predictors of response to Systems Training for Emotional Predictability and Problem Solving (STEPPS) for borderline personality disorder: an exploratory study.
Country of origin:The U.S
System’s Training for Emotional Predictability and Problem Solving (STEPPS) treatment plus Treatment as usual (TAU)
TAU control group
Outpatient weekly group sessions for 20 weeks.
RCT
Multiple regression models and multiple logistic regression analyses with predictor by treatment group interactions
164 participants randomly allocated to treatment groups
STEPPS + TAU N= 92TAU N= 72
85% female
BPD diagnosed using DSM-IV-R criteria, confirmed using the SCID.
Exclusion criteria: diagnosis of schizophrenia, schizoaffective disorder,
Severity:
Baseline ratings from Zanarini Rating Scale
for borderline personality disorder (ZAN-BPD) (Zanarini, 2003)
Borderline Evaluation of Severity Over Time(BEST) (Blum, 2002)
SCL-90-R Social Adjustment
Scale (SAS) Clinical Global
Impression (CGL) severity scale
Barratt Impulsivity Scale (BIS) (Barratt, 1959).
Global Assessment Scale (GAS) (Endicott, Spitzer, Fleiss, & Cohen, 1976)
BDI
Severity:
Greater baseline ZAN-BPD was associated with improvements on the ZAN-BPD
Greater baseline BEST score (and being in the STEPPS group) predicted improvements in BEST total score.
Severity:
Odds ratio for ZAN-BPD as a baseline predictor= .80

29
psychotic mood disorder or primary neurological disorder, cognitive impairments, current substance abuse or dependency or previous participation in STEPPS.
Black, Blum, McCormick & Allen. (2013). Systems Training for Emotional Predictability and Problem Solving (STEPPS) group treatment for offenders with borderline personality disorder.
Country of origin:The U.S
STEPPS treatment
Weekly group sessions for 20 weeks.
Naturalistic Observation study with secondary analysis of data.
Linear mixed effects model
77 offender participants from the US
BPD diagnosis using DSM-IV-R criteria
14 male63 female
Age: M: 31.4 (SD: 8.6)
Severity:
BEST BDI Positive and Negative
Affect Schedule (PANAS) (Watson & Clark, 1994)
Data on additional clinical variables such as self-harm ad suicide attempts collected
Severity:
Higher baseline severity (BEST) predicted larger improvements following STEPPS on the BEST (t=-4.89, p<.001)
Severity:
r= 0.492*

30
Bohus et al. (2004) Effectiveness of inpatient dialectic behavioural therapy for borderline personality disorder: a controlled trial.
Country of origin:Germany
DBTN=31
3-month inpatient program including individual and group therapy.
Control group: waiting list controlN=19
No between group differences on measured demographics and comorbidities
Controlled Trial
Predictor variables were tested using discriminate analysis method and non-parametric hierarchical classification.
Jacobson’s criterion b for clinical relevant change (Jacobson & Truax, 1991) is used.
50 participants
BPD diagnosed using the SCID for DSM-IV Axis II
Participants were required to have at least one suicide attempt or two acts of self-harm within the last two years.
All participants female
Age: M: 29.1 (SD: 7.2) DBT group M: 29.5 (SD: 5.4) Control group
Exclusion
Severity:
No of DSM criteria met
Symptoms:
Predictor variables Lifetime Parsuicide
Count (LPC) (Linehan & Comtois, 1994)
SCL-90-R Hamilton Anxiety
Scale (HARS) State-Trait-Anxiety
Inventory (STAI) (Spielberger, Gorsuch, & Lushene, 1970)
Hamilton Depression Scale (HDRS)
State Trait-Anger Inventory (STAXI)
Dissociations Experiences Scale (DES) (Bernstein & Putnam, 1986)
Global Assessment of
Severity:
No effect was found for the number of DSM criteria met on any outcome measure.
Symptoms:
In the DBT group the initial IIP score was positively correlated with improvements in IIP
Initial scores on STAXI was positively correlated with improvements on the STAXI in both DBT and waitlist control group
Initial scores on the DES were
Severity:
no effect found
Effect sizes not reported and insufficient data provided to calculate.
31
criteria: lifetime diagnosis of schizophrenia, bipolar I disorder, current substance abuse or learning disability. Living over 250 miles from inpatient unit
Functioning Scale (GAF)
IIP
positively correlated with improvements on the DES for both the DBT group and the waitlist control group
Bos, van Wel, Appelo & Verbraak. (2011). Effectiveness of Systems Training for Emotional Predictability and Problem Solving (STEPPS) for borderline personality problems in a ‘real-world’ sample: moderation by diagnosis or
STEPPS treatment plus adjunctive
Outpatient weekly group sessions for 20 weeks.
TAU control group
RCT
Linear mixed model interactions
168 participants
STEPPS N=84Age: M: 33.5 (SD: 8.2)88.1% female
TAU N= 84Age: M: 31.7 (SD: 9.7)85.7% female
Subthreshold participants included
Severity:
Personality Diagnostic Questionnaire (PDQ)
SCID SCL-90 Borderline Personality
Disorder checklist-40 (BPD-Checklist -0)
World Health Organisation’s Quality of Life Assessment (WHOQLA) (Trompenaars,
Severity:
The effectiveness of STEPPS vs TAU did not differ on the basis of DSM-IV diagnosis of BPD.
However there was a differential effect for the STEPPS treatment on the basis of severity
Severity:
d= .445* for SCL-90 outcome
d= .405* for BPD-40 outcome
32
severity?
Country of origin:The Netherlands
Exclusion criteria: did not speak Dutch, cognitively impaired, less than 18 or presented with immediate danger to self or others.
Masthoff , Van Heck, Hodiamont , & De Vries, 2005).
for SCL-90 (F=8.3, p= 0=.005) and BPD-40 (F=6.9, p= .010). Those with more severe symptoms showed a better response to STEPPS than TAU.
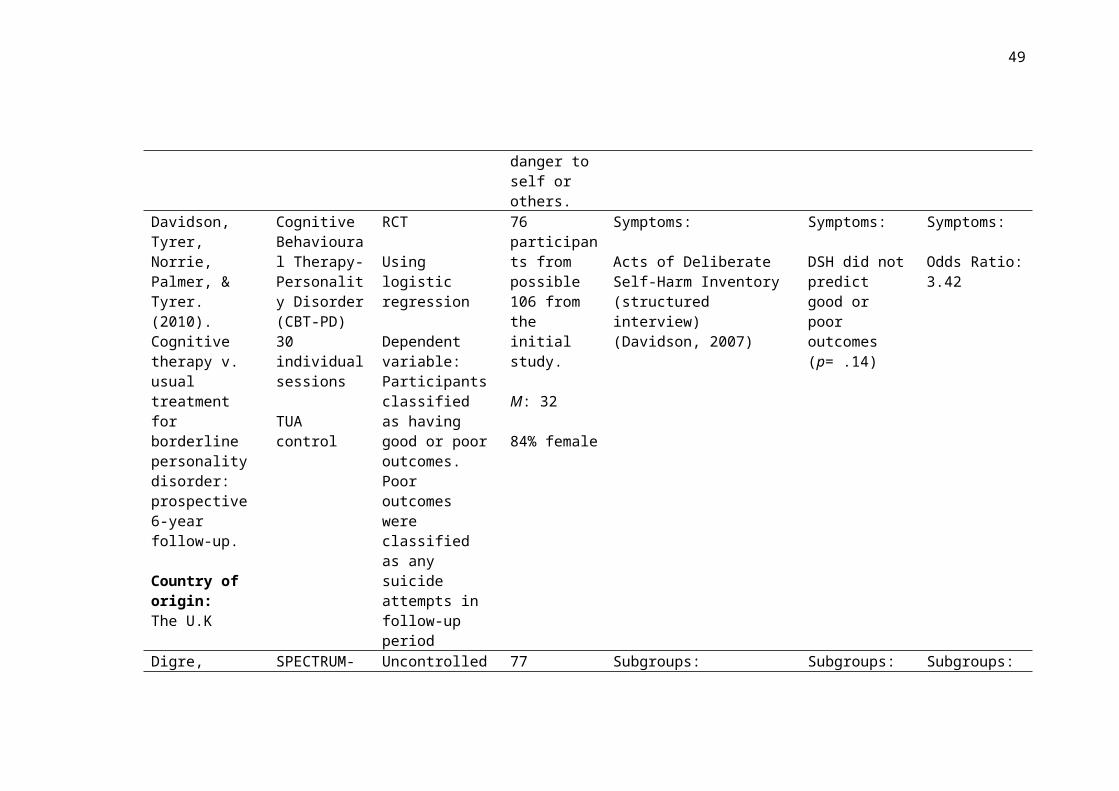
Davidson, Tyrer, Norrie, Palmer, & Tyrer. (2010). Cognitive therapy v. usual treatment for borderline personality disorder: prospective 6-year follow-up.
Country of origin:The U.K
Cognitive Behavioural Therapy-Personality Disorder (CBT-PD) 30 individual sessions
TUA control
RCT
Using logistic regression
Dependent variable:Participants classified as having good or poor outcomes. Poor outcomes were classified as any suicide attempts in follow-up period
76 participants from possible 106 from the initial study.
M: 32
84% female
Symptoms:
Acts of Deliberate Self-Harm Inventory (structured interview) (Davidson, 2007)
Symptoms:
DSH did not predict good or poor outcomes (p= .14)
Symptoms:
Odds Ratio: 3.42
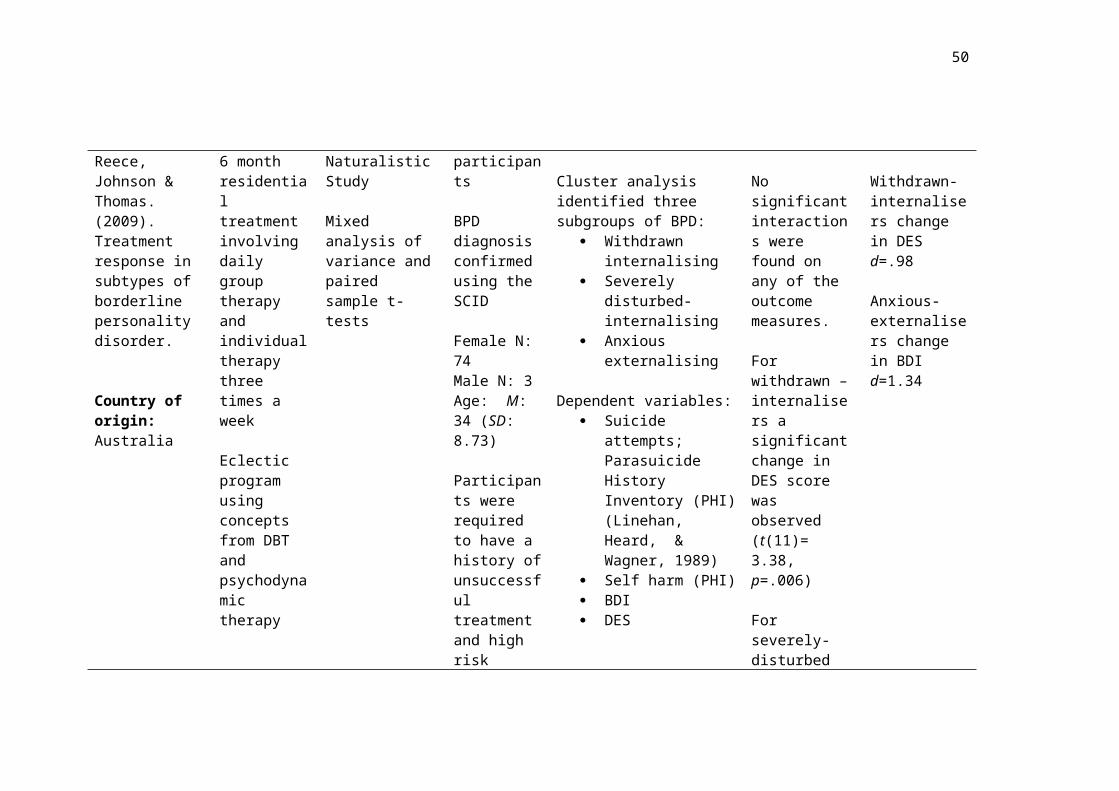
Digre, Reece, Johnson & Thomas. (2009).
SPECTRUM- 6 month residential
Uncontrolled Naturalistic Study
77 participants
BPD diagnosis
Subgroups:
Cluster analysis identified
Subgroups:
No significant
Subgroups:
Withdrawn-
33
Treatment response in subtypes of borderline personality disorder.
Country of origin:Australia
treatment involving daily group therapy and individual therapy three times a week
Eclectic program using concepts from DBT and psychodynamic therapy
Mixed analysis of variance and paired sample t-tests
confirmed using the SCID
Female N: 74Male N: 3Age: M: 34 (SD: 8.73)
Participants were required to have a history of unsuccessful treatment and high risk status for admission
Exclusion criteria: limited English, acute mental illness, unable to manage own medication or accessing disability services.
three subgroups of BPD: Withdrawn
internalising Severely disturbed-
internalising Anxious externalising
Dependent variables: Suicide attempts;
Parasuicide History Inventory (PHI) (Linehan, Heard, & Wagner, 1989)
Self harm (PHI) BDI DES
interactions were found on any of the outcome measures.
For withdrawn –internalisers a significant change in DES score was observed (t(11)= 3.38, p=.006)
For severely-disturbed internalisers there was no significant improvements on all outcome measures
For anxious-externalisers a significant change was revealed for BDI score (t(25)= 6.82, p<.001)
internalisers change in DES d=.98
Anxious-externalisers change in BDI d=1.34
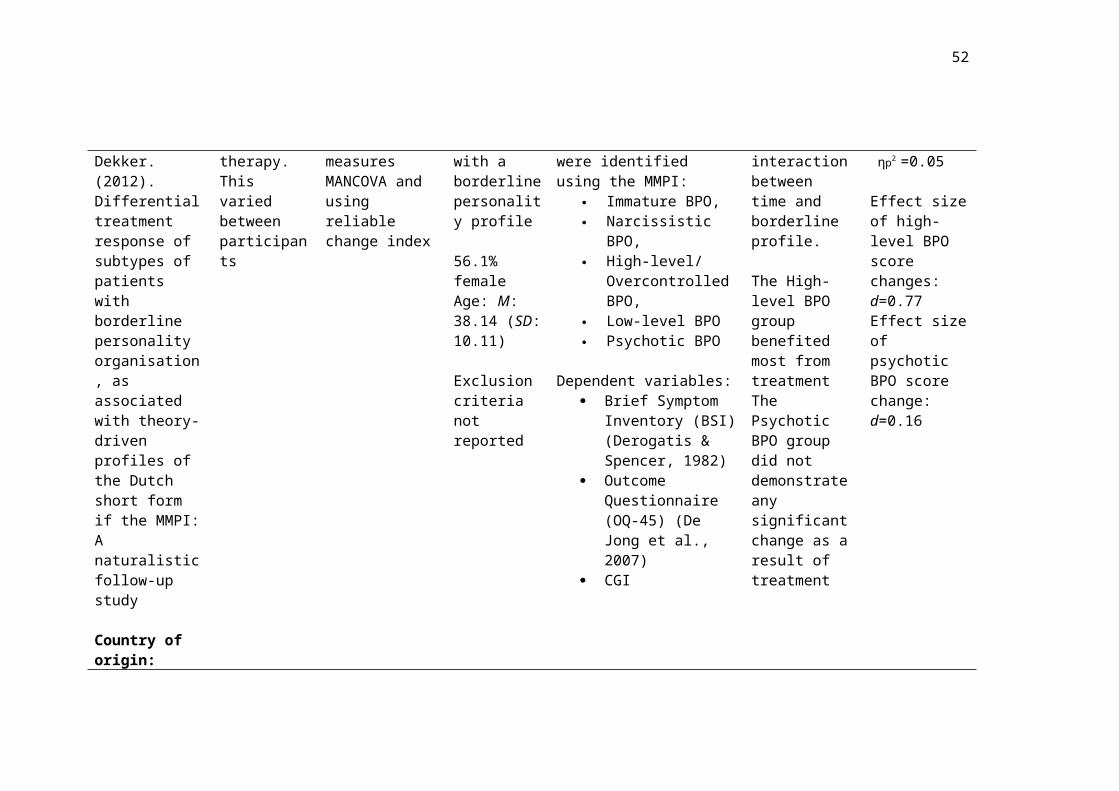
Eurelings- Supportive Naturalistic 2,062 Subgroups: Subgroups: Subgroups:
34
Bontekoe, Peen, Noteboom, Alkema & Dekker. (2012). Differential treatment response of subtypes of patients with borderline personality organisation, as associated with theory-driven profiles of the Dutch short form if the MMPI: A naturalistic follow-up study
Country of origin:The Netherlands
treatment, psychotherapy and family therapy. This varied between participants
Follow-Up Study
Repeated measures MANCOVA and using reliable change index
participants
Diagnosed with a borderline personality profile
56.1% femaleAge: M: 38.14 (SD: 10.11)
Exclusion criteria not reported
Five Borderline Personality Organisations (BPO) were identified using the MMPI:
Immature BPO, Narcissistic BPO, High-level/
Overcontrolled BPO, Low-level BPO Psychotic BPO
Dependent variables: Brief Symptom
Inventory (BSI) (Derogatis & Spencer, 1982)
Outcome Questionnaire (OQ-45) (De Jong et al., 2007)
CGI
There was a significant (p<.01) interaction between time and borderline profile.
The High-level BPO group benefited most from treatmentThe Psychotic BPO group did not demonstrate any significant change as a result of treatment
Interaction effect size: ηp2 =0.05
Effect size of high-level BPO score changes: d=0.77Effect size of psychotic BPO score change:d=0.16
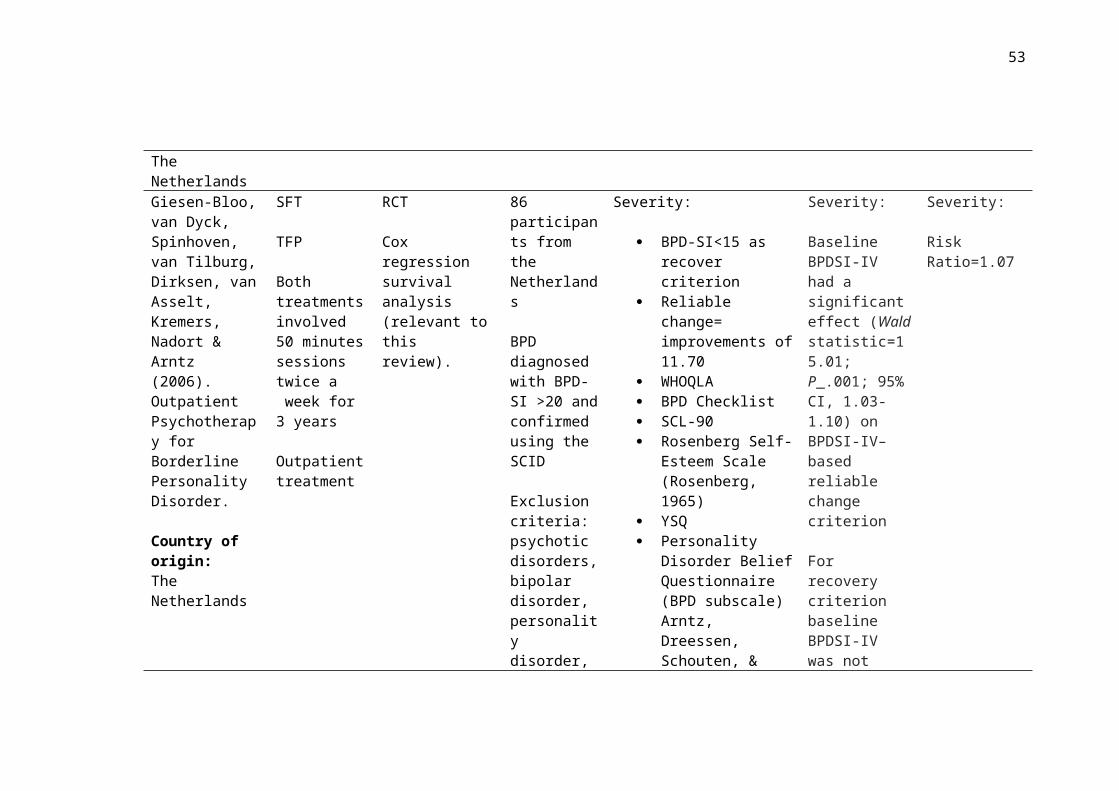
Giesen-Bloo, van Dyck, Spinhoven, van Tilburg, Dirksen, van Asselt, Kremers, Nadort & Arntz (2006). Outpatient Psychotherapy for Borderline
SFT
TFP
Both treatments involved 50 minutes sessions twice
RCT
Cox regression survival analysis (relevant to this review).
86 participants from the Netherlands
BPD diagnosed with BPD-SI >20 and confirmed
Severity:
BPD-SI<15 as recover criterion
Reliable change= improvements of 11.70
WHOQLA BPD Checklist
Severity:
Baseline BPDSI-IV had a significant effect (Waldstatistic=15.01; P_.001; 95% CI, 1.03-1.10) on
Severity:
Risk Ratio=1.07

35
Personality Disorder.
Country of origin:The Netherlands
a week for 3 years
Outpatient treatment
using the SCID
Exclusion criteria: psychotic disorders, bipolar disorder, personality disorder, ADHD, addiction requiring detoxification and learning disability.
SFT N=44Age: M: 31.70 (SD: 8.9)90.9% female
TFP N= 42Age: M: 29.45 (SD: 6.5)95.2% female
SCL-90 Rosenberg Self-
Esteem Scale (Rosenberg, 1965)
YSQ Personality Disorder
Belief Questionnaire (BPD subscale) Arntz, Dreessen, Schouten, & Weertman, 2004)
IPO Defence Style
Questionnaire (DSQ) (Andrews, Pollock, & Stewart, 1989)
BPDSI-IV–based reliable changecriterion
For recovery criterion baseline BPDSI-IV was not significant(p=.38).
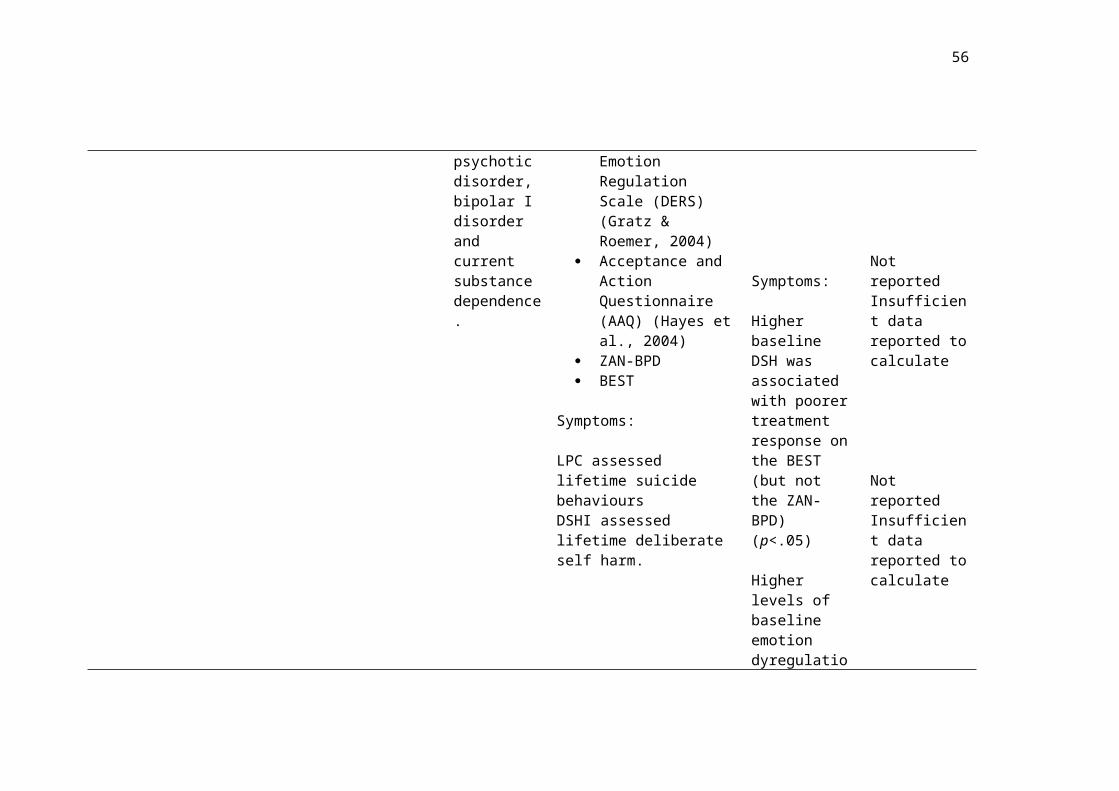
Gratz, Dixon-Gordon & Tull. (2014). Predictors of treatment
Emotion Regulation Group Therapy (ERGT) +TAU
RCT, secondary analysis of data.
Multilevel
61 participants
Age: M: 32.5 (SD: 10.9)
Severity:
SCID Diagnostic Interview
Severity:
Higher baseline emotion
Severity:
Not reported Insufficient data
36
response to an adjunctive emotion regulation group therapy for deliberate self-harm among women with borderline personality disorder.
Country of origin:The U.S
90 minute group outpatient sessions for 14 weeks
Control condition: TAU waiting list
modelling approach (piecewise linear model)
ERGT N=31TAU N=30
Included subthreshold BPD population
Participants were required to have at least one episode of DSH in the past six months
Exclusion criteria: diagnosis of psychotic disorder, bipolar I disorder and current substance dependence.
for DSM-IV Personality Disorders (DIPD-IV) (Zanarini, Frankenburg, Sickel, & Young, 1996)
LPC Deliberate Self-Harm
Inventory (DSHI) (Gratz, 2001)
Treatment History Interview (THI; Linehan & Heard, 1987)
Self-Harm Inventory (SHI) (Sansone, Wiederman, & Sansone, 1998)
Difficulties in Emotion Regulation Scale (DERS) (Gratz & Roemer, 2004)
Acceptance and Action Questionnaire (AAQ) (Hayes et al., 2004)
ZAN-BPD BEST
Symptoms:
LPC assessed lifetime suicide behavioursDSHI assessed lifetime
dysregulation and more BPD criteria met (DIPD-IV) predicted greater improvements in BPD symptoms.
Symptoms:
Higher baseline DSH was
reported to calculate
Not reported Insufficient data
37
deliberate self harm.
Emotion regulation measured by DERS
associated with poorer treatment response on the BEST (but not the ZAN-BPD) (p<.05)
Higher levels of baseline emotion dyregulation predicted greater improvements in BPD symptoms (ZAN-BPD) (p<.05)
reported to calculate
Not reported Insufficient data reported to calculate
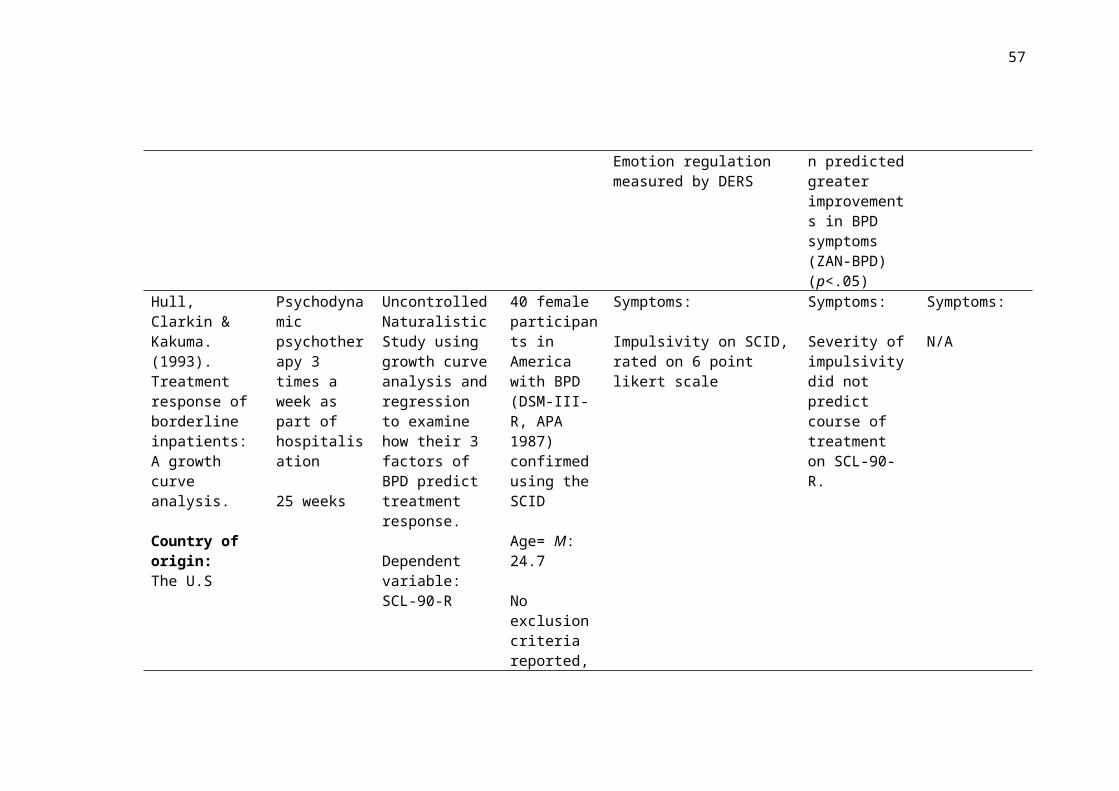
Hull, Clarkin & Kakuma. (1993). Treatment response of borderline inpatients: A growth curve analysis.
Country of origin:The U.S
Psychodynamic psychotherapy 3 times a week as part of hospitalisation
25 weeks
Uncontrolled Naturalistic Study using growth curve analysis and regression to examine how their 3 factors of BPD predict treatment response.
Dependent variable: SCL-90-R
40 female participants in America with BPD (DSM-III-R, APA 1987) confirmed using the SCID
Age= M: 24.7
No exclusion criteria reported, inclusion
Symptoms:
Impulsivity on SCID, rated on 6 point likert scale
Symptoms:
Severity of impulsivity did not predict course of treatment on SCL-90-R.
Symptoms:
N/A
38
criteria appears to be admission to the hospital ward for BPD.
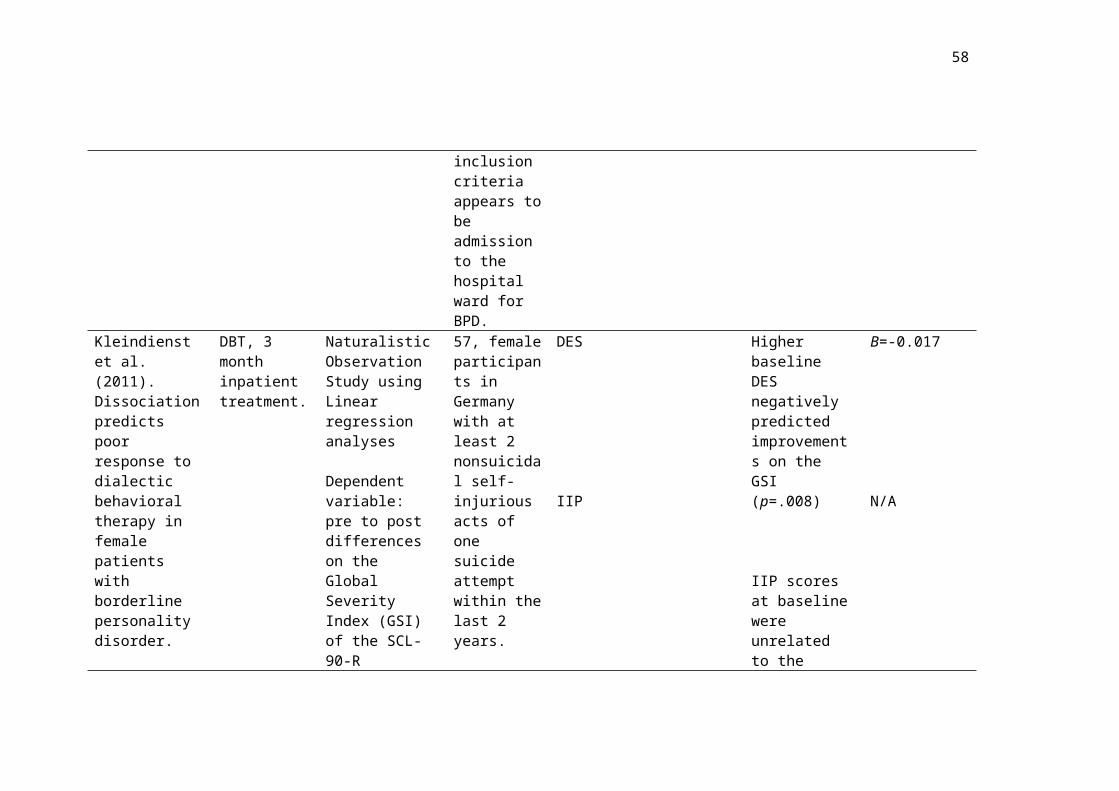
Kleindienst et al. (2011). Dissociation predicts poor response to dialectic behavioral therapy in female patients with borderline personality disorder.
Country of origin:Germany
DBT, 3 month inpatient treatment.
Naturalistic Observation Study using Linear regression analyses
Dependent variable:pre to post differences on the Global Severity Index (GSI) of the SCL-90-R
DESIIP
57, female participants in Germany with at least 2 nonsuicidal self-injurious acts of one suicide attempt within the last 2 years.
BPD diagnosed, confirmed via the SCID
Exclusion criteria: diagnosis of schizophrenia, bipolar, learning disability or current substance
DES
IIP
Higher baseline DES negatively predicted improvements on the GSI (p=.008)
IIP scores at baseline were unrelated to the changes in GSI scores
Β=-0.017
N/A

39
abuse and not living within a 250 mile radius of treatment centre
Lenzeweger, Clarkin, Levy, Yeomans & Kernberg. (2012). Predicting domains and rates of change in borderline personality disorder.
Country of origin:The U.S
TFP, DBT and Supportive Psychotherapy
1 year
Post-hoc analysis of data from RCT to examine domains and rates of change in BPD.
Individual growth curve was calculated, these slope values acted as the dependent variable. Forward stepping multiple linear regression examined predictors of outcome
58 participants who met DSM criteria for BPD confirmed using the International Personality Disorder Examination.
54 femaleAge: M: 30.5 (SD: 6.92)
Symptoms:
Negative Affect measured by the Multidimensional Personality Questionnaire (MPO) (Tellegen, 1982)
Identity diffusion measured by the IPO
Symptoms:
Lower initial levels of negative affect were associated with more rapid clinical improvements in the anger/aggression change domain (p=.014)
Higher baseline identity diffusion was associated with more rapid rates of clinical improvements in the global functioning/social adjustment domain of change (p=.006)
Symptoms:
r=0.30
r= -0.36

40
Aggression measured via the MPQ
Lower initial levels of aggression were associated with more rapid clinical improvements in the anger/aggression change domain (p=.035)
r=.25
Meares, Stevenson & Comerford, (1999). Psychotherapy with borderline patients: A comparison between treated and untreated cohorts.
Country of origin:Australia
Interpersonal psychodynamic psychotherapy (IP)
Outpatient Individual therapy for one hour, twice a week over 12 months.
Control: waiting list with treatment as usual.
Controlled Trial
Multiple regression analysis
60 participants, 30 in treatment condition and 30 in control
BPD diagnosed using DSM-III-R
Treatment resistant sample
Age (treatment condition): M: 29.4 (SD: 7.9)
Severity:
Independent variables Number of DSM-III
criteria for BPD met 27 point scale on BPD
criteria rated by clinicians
Dependent variable Change in number of
DSM-III criteria for BPD met
Severity:
Change in DSM score was dependent on baseline number of DSM-III criteria (p=.03). Individuals with higher DSM baseline scores demonstrated greater reductions, independent of treatment group.
Severity:
Insufficient data to calculate and not reported in paper

41
Age (control condition): M: 32.9 (SD: 7.8)
Nesci. (2009). Identification and clinical utility of subgroups of borderline personality disorder.
Country of origin:Australia
SPECTRUM- 6 month residential treatment involving daily group therapy and individual therapy three times a week Eclectic program using concepts from DBT and psychodynamic therapy.
Uncontrolled Naturalistic Study
Wilcoxon Signed Ranked tests
61 participants
BPD diagnosis confirmed using the SCID
Female N: 60Male N:1Age: M: 33.41 (SD: 8.20)
Participants were required to have a history of unsuccessful treatment and high risk status for admission
Exclusion criteria: BPD not primary diagnosis
Subgroups:
Cluster analysis identified two subgroups of BPD:
Self good/self bad Self good/other bad
Dependent variables: Internal, Personal and
Situational Attribution Questionnaire (Kinderman & Bentall, 1996)
BDI Revised Ways of
Coping Checklist (Vitaliano, et al., 1985)
DES PHI Affective Control
Scale (Williams, Chambless, & Ahrens, 1997)
Subgroups:
Self good/ other bad (externalisers) improved on BDI
Self good/self bad (internalisers) improved on BDI, PHI (self harm), PHI (suicide attempt), affect control scale (anxiety and depression)
Subgroups:
Self good/other bad BDI: r= -.54
Self good/self bad BDI: r= -.52PHI (self harm) r= -.33PHI (suicide attempt) r=-.35Affect control Anxiety r=-.55Affect control depression r=-.53
Ryle & Golynkina,
Cognitive Analytic
Uncontrolled Naturalistic Study
27 participants Severity: Severity: Severity:

42
(2000). Effectiveness of time-limited cognitive analytic therapy of borderline personality disorder: Factors associated with outcome.
Country of origin:U.K
Therapy (CAT)
28 sessions
Outpatient, individual treatment
Chi-squared analysis comparing baseline features of the improved vs. the unimproved groups.
BPD diagnosed (on basis of Personality Assessment Schedule; PAS, Tyrer, Alexander,& Ferguson, 1987). High rates of comorbidity. Inner city, British population.
Male N: 11Female N: 16Age: M: 34.3 (SD: 7.5)
14 taking psychotropic medication6 abusing alcohol 10 used illicit substances3 overdosed during treatment
Predictor variables:
Independently developed measure of severity of BPD features.
BDI SCL-90-R IIP Social Questionnaire
(SC) (Corney, Clare, & Fry, 1982)
Self-harm and hospitalisation following overdose in past year and at any time from recorded histories
Dependent variable: Classification of
improved or unimproved on the basis of whether participants still met criteria for diagnosis based on the PAS.
14 participants were classified as ‘improved’ and 13 as ‘unimproved’
Those in the unimproved group had significantly (p=.015) higher mean scores on severity ratings of DSM features of BPD.
r= .310*not reported in the paper but calculated from χ2 value and N
43
Symptoms:
Impulsivity rated on the PAS
Self-cutting, self-poisoning, hospitalisation after overdose recorded from recorded histories.
Symptoms:
Baseline impulsivity did not differ between the improved and unimproved groups
Self cutting either in the past year (p= .011) or at any time( p=.002) was significantly associated with the unimproved group compared to the improved group
Symptoms:
N/A
Self cutting in the past year associated with unimproved group, χ2 =6.54, r= .49*
Self-cutting at any time associated with unimproved group, χ2= 13.35, r= .70*
Sparapani (2014). Moderators of treatment outcome in dialectical behavior therapy: the role of emotion
DBT for 1 year Naturalistic Observation Study using regression analyses to examine the impact of self related emotion
30 participants in America aged 19-54
Diagnostic data unavailable
Symptoms:
Emotion regulation measured using the DERS
Symptoms:
Those initially indicated elevated DERS scores had higher final ratings of
Symptoms:
β=397

44
regulation and impulsivity.
Country of origin:The U.S
dysregulation on final reported BPD symptoms.
Dependent variable: brief self-report measure of BPD, 12 item measure of BPD was developed for tracking progress during treatment.
Age: M: 30.79 (SD: 9.68)87% female
Exclusion criteria: cognitive disability or psychotic symptoms that would interfere with treatment.
emptiness (p=.041)
Spinhoven,Giesen-Bloo, van Dyck & Arntz. (2008). Can assessors and therapists predict the outcome of long-term psychotherapy in borderline personality disorder?
Country of origin:The Netherlands
SFT
TFP
Both treatments involved 50 minutes sessions twice a week for 3 years
RCT
Recovery criteria was set at BPD-SI<15
Jacobson’s reliable change index was also used (reduction of 11.70).
Hierarchical multiple regression and logistical regression analyses
71 participants from the NetherlandsSFT N= 36Age: M: 31.17 (SD: 8.07)91.7% female
TFP N= 35Age: M: 29.46 (SD: 6.59)94.3% female
BPD diagnosed and BPD-SI score
Severity:
Predictor variables: BPD-SI Global Severity Index
(GSI) SCL-90
Dependent variable: BPD-SI
Assessments occurred every 3 months over a 3 year period
Severity:
Baseline severity did not predict end of treatment BPDSI score however when entered into a regression model to predict reliable change it did contribute to predicting some of the variance in scores.
Severity:
t=.20 for BPD-SI baseline severity in a model predicting BPD-SI at end of treatment with an R²=0.23

45
were calculated. <20
Exclusion criteria: psychotic disorders, bipolar disorder, dissociative identity disorder, antisocial personality disorder, ADHD, addiction requiring detox and learning disabilities.
Verheul, Van Den Bosch, Koeter, De Ridder, Stijnen & Brink, (2003). Dialectic behaviour therapy for women with borderline personality disorder.
DBTN= 27
Weekly individual sessions and weekly skills-training group sessions.
12 months
RCT
General Linear Mixed Models were calculated with baseline severity, treatment condition and time entered into the model and interactions were
58 participants within 40-km of Amsterdam.
BPD diagnosed using the SCID for DSM-IV Axis II
Symptoms:
Parasuicide behaviours and DSH measured at baseline, 11, 22, 33, 44 and 52 weeks using section of the BPD-SI
LPC at baseline, 22 and 52 weeks.
Symptoms:
There was a significantly (p=.029) better response to treatment from those in the higher-severity participant group.
Symptoms:
d= .59*

46
Country of origin:The Netherlands
Control group: usual treatment including clinical management.N=31
analysed.
Participants were categorised into two groups:
Higher severity
Lower severity
On the basis of number of self-mutilating acts.
All participants female
Age: M: 34.9 (SD: 7.7)
Exclusion criteria include:Bipolar diagnosis, psychotic disorder, insufficient Dutch language and cognitive impairments
DBT was superior to TAU for patients in the high severity group but not for those in the lower severity group.
Yen, Johnson, Costello & Simpson. (2009). A 5-day dialectic behavior therapy partial hospital program for women with borderline personality disorder: predictors of
DBT, 5-day inpatient hospital program.
Naturalistic follow-up study examining the predictive power of each of the DSM-IV BPD criteria.
Regression analysis
Dependent
50 female participants in the U.S, who met full criteria for BPD, confirmed using the SCID.
Exclusion criteria:
Symptoms:
Endorsement of ‘fear of abandonment’ BPD symptom
Endorsement of ‘unstable relationship’ BPD symptom
Symptoms:
Frantic efforts to avoid abandonment predicted less improvements on measures of hopelessness
Those who endorse unstable
Symptoms:
Lack of frantic efforts to avoid abandonment as a predictor of change in BHS score β= 0.37
Unstable relationships as

47
outcome from a 3-month follow-up study.
Country of origin:The U.S
variables: BDI Beck
Hopelessness Scale (BHS) (Beck at al., 1974)
DES STAXI BSI Self Injury
Questionnaire (adapted from PHI)
diagnosis of schizophrenia, bipolar disorder, cyclothymic disorder, substance dependence, learning disability.
Additional demographics such as age not reported.
Endorsement of ‘identity disturbance’ BPD symptom
Endorsement of ‘impulsivity’ BPD symptom
Endorsement of ‘self-injury’ BPD symptom
Endorsement of ‘affective
relationships were significantly less likely to self harm during follow-up than those who did not endorse unstable relationships
Unstable identity predicts less improvements in general psychopathology (BSI score)
Endorsing impulsiveness predicted significantly more improvements in anger (p<.01).
Self-injury did not predict any of the outcome measures.
Affective
a predictor of change in self-harm, Wald=7.0
Lack of unstable identity as a predictor of change in BSI score β= 0.35
Impulsivity as a predictor of change in STAXI score β= 0.41
N/A
N/A

48
instability’ BPD symptom
Endorsement of ‘emptiness’ BPD symptom
Endorsement of ‘anger’ BPD symptom
Endorsement of ‘dissociation’ BPD symptom
instability was not predictive of any of the measured outcomes
Those who endorsed emptiness showed greater improvements on measures of dissociation (p<.01), depression (p<.05) and general psychopathology (p<.01)
Anger did not predict any of the measured outcomes
Dissociation did not predict any of the measured outcomes
Emptiness as a predictor of DES: β=0.34Emptiness as a predictor of BDI: β=0.30Emptiness as a predictor of BSI: β=0.40
N/A
N/A
Key: SPECTRUM: Australian treatment based on DBT and psychodynamic principles
49
DBT: Dialectical Behavioural TherapySFT: Schema Focused TherapyTFP: Transference Focused TherapyMBT: Mentalisation Based TherapyIPT: Interpersonal TherapySTEPPS: Systems Training for Emotional Predictability and Problem SolvingCBT-PD: Cognitive Behavioural Therapy for Personality Disorder
ERCT: Emotion Regulation Group TherapyIP: Interpersonal psychodynamic psychotherapyCAT: Cognitive Analytic Therapy
RCT: Randomised Controlled TrialN: Number of participantsTAU: Treatment as usual DSH: Deliberate self-harmSD: Standard deviationM: Mean
Table 3
Outcome information for studies examining severity, symptoms and subgroups as predictors of outcome
Study Strengths Weaknesses
Altieri (2011). Borderline personality disorder and dialectical behaviour therapy in an Australian private hospital setting treatment response and BPD subtypes
Reported effect sizes
Good ecological validity
Used a BPD outcome measure
Larger improvements in Cluster 2 can be explained through regression to the mean.
Cluster 1 only included 5 participants which is a small group to perform accurate comparisons
No examination of interaction effect to examine group differences due to small sample size and non-parametric statistical methods
Uncontrolled study so cause and effect cannot be
50
inferred
Small sample size and under representation of males with BPD
Arntz, Stupar-Rutenfrans, Bloo, van Dyck & Spinhoven. (2015). Prediction of treatment discontinuation and recovery from borderline personality disorder: results from an RCT comparing schema therapy and transference focused psychotherapy.
Study designed on need for replication
IIT analyses conducted
Participants were randomly allocated to treatment conditions
High risk of type 1 error and no adjusted significance value. Authors argue that with an adjusted value and this sample size only ‘unrealistically’ powerful predictors would survive analysis.
No follow-up reported
Post-hoc analysis of data, predictors constructed from available data.
Use of recovery criteria may have masked more subtle changes. Especially considering average baseline BPD-SI score= 33.97.
Bateman & Fonagy (2013). Impact of clinical severity on outcomes of mentalisation-based treatment for borderline personality disorder.
Primary aim of research to examine severity on outcomes.
No significant pre-treatment differences between groups
Random allocation of participants to treatment group
Trial was not powered to examine moderating variables.
Not measure of social or personal adaptation
No specific measure of mentalisation was used
Participants were referred following a crisis incident; this sample may not be a representative

51
Less than 10% of data missing
ITT analyses conducted
An adjusted significance value (0.01) was used to protect against type 1 error due to high number of analyses.
of people with BPD in general.
Bellino, Bozzatello & Bogetto. (2015). Combined treatment of borderline personality disorder with interpersonal psychotherapy and pharmacotherapy: Predictors of response.
Primary aim of the study to examine predictors of outcome
Participants randomly allocated to treatment conditions (in this study on those allocated to treatment condition were included)
Small sample size (N=22 in final analyses)
Uncontrolled trial so cause and effect cannot be inferred
Comorbid diagnoses was an exclusion criteria which reduces the representativeness of the sample as comorbidities are the norm as opposed to the exception. This limits generalisability.
High risk of type 1 error due to the explorative nature of this research
No ITT analyses was conducted
The dependent variable is a subjective measure of improvement completed by a clinician, it is also not BPD specific which could mask certain changes.
Use of single items may affect the power of the analysis. This reduces the variance which will
52
restrict any correlation coefficients.
Black, Allen, John, Pfohl, McCormick & Blum. (2009). Predictors of response to Systems Training for Emotional Predictability and Problem Solving (STEPPS) for borderline personality disorder: an exploratory study.
1 year follow- up included
Randomised allocation to treatment condition
Reasonably high participant numbers
Controlled study with TAU comparison group
Post hoc analyses, not all relevant variables were assessed
49% of participants assigned to STEPPS did not attend at least half of the STEPPS sessions.
Results could be explained through regression to the mean
High discontinuation rate
Limited number of male participants so the findings cannot be generalised to males with BPD.
Due to exploratory nature of the study there was a high risk of type 1 error due to high number of analyses and no adjusted p-value.
Black, Blum, McCormick & Allen. (2013). Systems Training for Emotional Predictability and Problem Solving (STEPPS) group treatment for offenders with borderline personality disorder.
High ecological validity with ‘real-world’ application of STEPPS
Uncontrolled study which means causality could not be inferred
47% attrition rates
Findings cannot be generalised to non-offender populations on the basis of this study alone. Males were also under represented in the sample
53
High risk of type 1 error due to large number of analyses
No follow-up reported
Treatment allocation was not randomised
Authors of paper have invested interest as developers of STEPPS.
Bohus et al. (2004) Effectiveness of inpatient dialectic behavioural therapy for borderline personality disorder: a controlled trial.
Included a control group for comparison.
Applied a Bonferroni correction to calculate an adjusted significance value.
Intent to treat analyses were calculated.
No between group differences on measured demographics and comorbidities
Participants were not randomised into treatment conditions.
Participants groups were unequal.
Drop out from DBT was 22.0% which is higher than what NICE suggests is acceptable (20%).
Unequal baseline number of BPD criteria met. Significantly fewer criteria met by the DBT group.
The abstract does not refer to any testing of predictor variables (so could easily be missed).
Many of the reported effects could be explained through regression to the mean.
Bos, van Wel, Appelo & Verbraak. (2011). Effectiveness of Systems
Ecological validity of sample being representative of the clinical practice
No information on comorbidities

54
Training for Emotional Predictability and Problem Solving (STEPPS) for borderline personality problems in a ‘real-world’ sample: moderation by diagnosis or severity?
including sub-threshold participants
Equal number of participants in treatment conditions
Participants were randomly allocated to treatment conditions using a block randomisation procedure using sealed envelopes.
ITT analyses calculated
Groups did not differ significantly on baseline characteristics
Differential treatment effects means results cannot be explained by regression to the mean
Controlled for number of treatment contacts
Ecologically valid TAU control group
Males under-represented (although less than in other studies) so cannot generalise to males with BPD
TAU control group open to clinician selection bias
Davidson, Tyrer, Norrie, Palmer, & Tyrer. (2010). Cognitive therapy v. usual treatment for borderline personality disorder: prospective 6-year follow-up.
6-year follow up study
ITT analysis
Missing data managed through
Self-report of DSH
Under-representative of males with most participants being female

55
imputation
Reasonably high response rate (72%).
Controlled study
Participants randomised into treatment groups
No information on comorbidities or medication.
Digre, Reece, Johnson & Thomas. (2009). Treatment response in subtypes of borderline personality disorder.
Used an Bonferroni adjusted significance value (p=0.017)
Effect sizes are calculated and reported
Good ecological validity
Used pre-existing data which removes any control over the variables gathered.
It was a secondary aim of the study to look at treatment outcomes
Uncontrolled study so cause and effect cannot be inferred.
Unrepresentative sample as only included treatment resistant, high risk individuals
Under representation of males with BPD so findings can’t be generalised to males
Participants varied in their length of stay in treatment which could impact treatment outcomes
No BPD specific measure was used which may mean important changes to BPD presentation
56
were missed
Performed t-test after finding no significant analysis of variance interactions
Eurelings-Bontekoe, Peen, Noteboom, Alkema & Dekker. (2012). Differential treatment response of subtypes of patients with borderline personality organisation, as associated with theory-driven profiles of the Dutch short form if the MMPI: A naturalistic follow-up study
Large sample size
Relatively equal numbers of males and females so findings can be generalised to both males and females.
Consistent reporting of effect size and strong focus on effect size
Theoretically driven hypotheses.
Study also examined participant well-being as an outcome
Treatments received varied between participants
Uncontrolled trail so no cause and effect can be inferred about the treatment effect
No BPD specific outcome measure if used.
Giesen-Bloo, van Dyck, Spinhoven, van Tilburg, Dirksen, van Asselt, Kremers, Nadort & Arntz (2006). Outpatient Psychotherapy for Borderline Personality Disorder.
Assessment occurred at regular three month intervals
An adaptive biased urn procedure was used for randomisation to ensure balanced participant numbers across sites.
Groups did not differ on baseline measures of sociodemographics
Examining severity as a predictor of outcome was not a primary aim of this study.
Research assistants generally did not remain blinded to allocated treatment conditions.
No natural course or TAU control group
57
Power analyses are calculated and reported
An ITT approach was used
Gratz, Dixon-Gordon & Tull. (2014). Predictors of treatment response to an adjunctive emotion regulation group therapy for deliberate self-harm among women with borderline personality disorder.
Primary aim of study to examine predictors of outcome
Participants randomly allocated to treatment conditions
ITT analysis calculated
Post hoc analysis
Small sample size and associated risk of type 2 error
Large number of analyses increased the risk of type 1 error, however due to the risk of type 2 error due to small sample size the authors decided not a adjust the p value.
The authors suggest behavioural measures could have benefited
The study only included female participants which means the findings cannot be generalised to males with BPD
Effect size not reported
Hull, Clarkin & Kakuma. (1993). Treatment response of borderline inpatients: A growth curve analysis.
It was a primary aim of the study to identify features associated with outcomes.
Hypotheses were theoretically driven.
Unclear about validity of independent measure which was developed from the SCID by the authors.
Uncontrolled study so cannot infer cause and
58
Growth curve analysis examined rates and domains of change which captures the dynamic nature of change
Good ecological validity
effect
All participants were females meaning findings cannot be generalised to males with BPD.
No BPD dependent variable was used which could mask certain changes.
Relied on self-report measures rather than objective measures of symptoms
Many symptoms were combined to create factor variables (2 and 3 not discussed in this review). These could not be included as they cannot be compared to other studies.
Reasonably small sample size.
Many treatment components were included in hospitalisation so it is unclear which component (or which combination) produced change.
No follow-up
Kleindienst et al. (2011). Dissociation predicts poor response to dialectic behavioral therapy in female patients with borderline personality disorder.
Theory driven study with theoretically driven hypothesis and design.
Effect sizes reported
Ecological validity high due to
Unrepresentative participant group as it only includes females so the findings cannot be generalised to males with BPD.
23% drop-out

59
naturalistic nature of study
Prospective design of a controlled study
No BPD specific outcome measure was used
Uncontrolled study so cannot infer cause and effect
Strict inclusion criteria which limits representativeness of sample used
Lenzeweger, Clarkin, Levy, Yeomans & Kernberg. (2012). Predicting domains and rates of change in borderline personality disorder.
The predictors identified were based on two theoretical models
Participants were randomly allocated to treatment groups (although combined in this analysis).
Growth curve analysis examined rates and domains of change, the authors argue this better captures the dynamic nature of change than comparing baseline and end point measures.
Included 1-year follow-up
Relatively small sample size, especially for principle component analysis.
3 different treatment groups were examined as a single group (however treatment group was added as a covariate).
Males were under represented in the sample.
By using component analysis to identify their own domains of change it makes it difficult to compare the results of this study to other predictors of outcome studies.
Meares, Stevenson & Comerford, (1999). Psychotherapy with borderline patients: A comparison between treated and untreated cohorts.
Rating of DSM criteria as used in this study has been found reliable.
Acceptable drop-out rate (16%)
Equal participant numbers in control
Participants were not randomised into treatment or control conditions, leaving the groups open to bias.
Unequal baseline DSM scores with the control group having lower scores.

60
and treatment conditions Effect size not reported and insufficient data to calculate
Most of the therapists were still in training
No information provided on participant’s gender so can’t assume generalisability across genders.
Nesci. (2009). Identification and clinical utility of subgroups of borderline personality disorder.
Reported effect sizes
Good ecological validity
No examination of interaction effect to examine group differences due to small sample size and non-parametric statistical methods
Uncontrolled study so cause and effect cannot be inferred
Small sample size and non-normal distributed data
Unrepresentative sample as only included treatment resistant, high risk individuals
Under representation of males with BPD so findings can’t be generalised to males
No BPD specific measure was used which may mean important changes to BPD presentation were missed
Ryle & Golynkina, (2000). Effectiveness of time-limited
It was a primary aim of the study to identify features associated with
Uncontrolled study so cause and effect cannot be

61
cognitive analytic therapy of borderline personality disorder: Factors associated with outcome.
outcomes.
Assessments occurred at 6 months after therapy and 18 months.
18 participants attended the 18 month follow-up.
Relatively similar numbers of male and female participants- increasing representativeness of the participant group.
inferred.
Independently developed measure of BPD symptom severity which had not been validated or checked for reliability. Emptiness was not included in the severity rating due to lack of inter-rater reliability.
Dichotomous data categories on the basis of not meeting diagnostic criteria, this strict criterion might mask more subtle changes.
The unimproved group include participants which made no improvements and those who made some improvements.
Large no. of variables, which increases the risk of type 1 error.
Reasonably small sample size.
No effect sizes reported
Most of the therapists were still in training.
Sparapani (2014). Moderators of treatment outcome in dialectical behavior therapy: the role of emotion regulation and impulsivity.
Limited number of exclusion criteria which increases the representativeness of the variability amongst BPD population.
Small sample size limits generalisability and increases type 1 error
High number of analyses (72 regressions) with a significance value of .05 increases risk of type 1

62
Effect sizes reported
Ecological validity high due to naturalistic nature of study
error- four of the ten significant results identified would be expected by chance alone.
Participants varied in the amount of time they spent in treatment
Self-developed dependent variable measure which was not checked for validity or reliability in peer reviewed research, no norms available.
Uncontrolled study so cause and effect cannot be inferred
Unpublished study so not peer reviewed
Measures used were restricted to those used in therapy, important variables may have been missed
Spinhoven,Giesen-Bloo, van Dyck & Arntz. (2008). Can assessors and therapists predict the outcome of long-term psychotherapy in borderline personality disorder?
No significant between group differences at baseline (bar no. of axis I diagnoses)
Even participant numbers between groups that were randomised
Used ITT analyses
Under representation of male participants so findings cannot be generalised to males with BPD.
Examining the effect of severity of BPD on treatment outcome was not a primary aim of the study; severity was included as a covariate.
High number of independent variables for the participant numbers included.
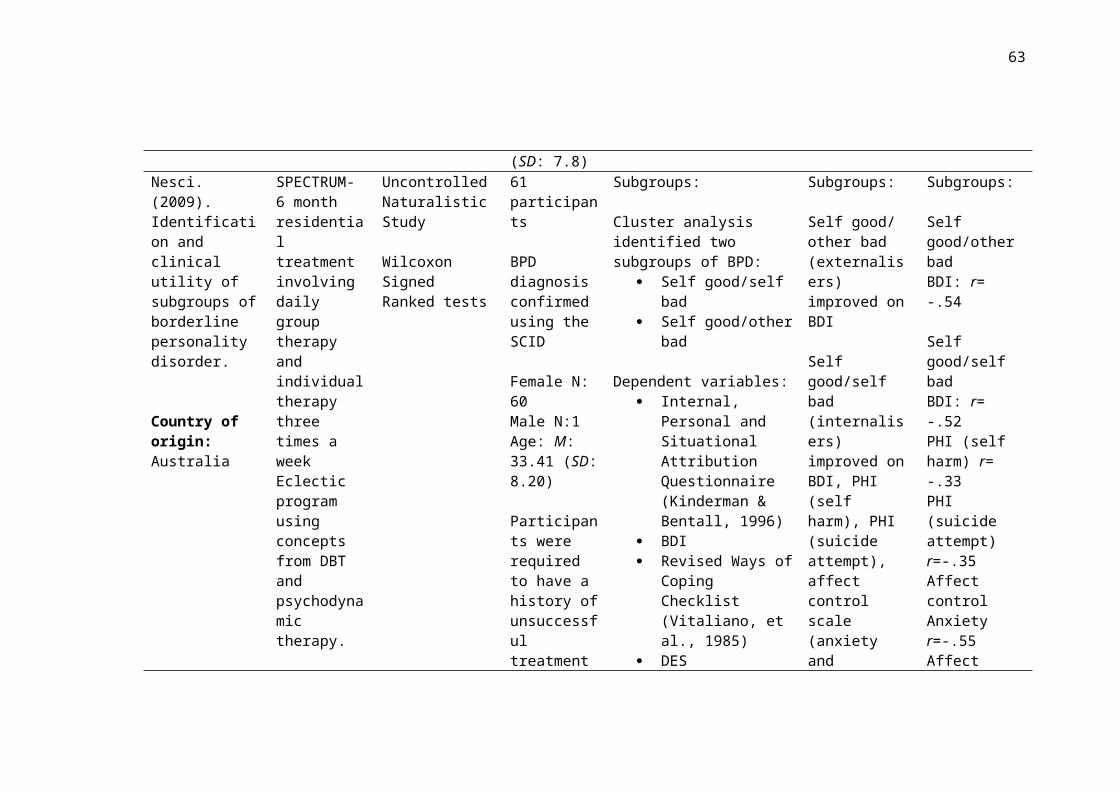
63
Verheul, Van Den Bosch, Koeter, De Ridder, Stijnen & Brink, (2003). Dialectic behaviour therapy for women with borderline personality disorder.
Specific aim to examine effect of baseline severity.
Participants were randomly allocated to treatment conditions.
81% completed final assessment.
An adjusted significance value was used by applying a Bonferroni correction due to skewed distributions of BPD-SI and LPC.
Intent to treat (ITT) analysis was performed.
Severity was defined by DSH as opposed to BPD severity of no. of criteria met. The groups did not differ on BPD-SI score suggesting the severity of their BPD symptoms were not being studied in this paper.
Lower- and higher- severity groups were split using the median self-mutilating acts this led to unequal ranges of these acts. There was a range of 0-14 number of self-mutilating acts in the lower-severity group and a range of 14-1000 in the higher severity group.
Authors report it is unlikely the research assistant remained blind to participants’ treatment conditions.
Risk of the Hawthorne effect through greater enthusiasm of therapists for DBT over TAU.
Yen, Johnson, Costello & Simpson. (2009). A 5-day dialectic behavior therapy partial hospital program for women with borderline personality disorder: predictors of outcome from a 3-month follow-up study.
3 month follow-up included
Hypothesis driven on the basis of examining predictive power of different BPD symptoms to avoid under representing variability of BPD.
94% completed all assessments.
Longer follow-up would be beneficial
All participants were females meaning findings cannot be generalised to males with BPD.
Most participants engaged in additional therapy or medication use, these may act as extraneous variables.

64
Ecological validity from using follow-up in a ‘real-world’ setting.
A adjusted significance value was adopted to protect against type 1 error (p<.01)
Reported effect sizes
No comparison group was used
The authors do not explicitly state how they measured BPD symptoms. Symptoms were “endorsed” by participants, assumedly on the basis of the SCID which is the only measure of BPD used.
No BPD specific outcome measure was used which may mask BPD specific changes.
Relatively small effect sizes

65
Critique. The majority of studies using dimensional measures of BPD found
severity to be predictive of larger improvements over a range of treatments. Although
some of these findings can be accounted for by regression to the mean, the findings
of Bos et al. (2011) cannot, suggesting a genuine effect. The predictive effect of
severity was less consistent when defined by number of diagnostic criteria. However
there was more variability in the treatment approaches in the studies using number of
criteria. In Bos et al. (2011), 41.1% of the high severity group (based on BPD-40
score) did not reach BPD diagnosis suggesting that while diagnosis and severity are
related, there are considerable number of people with severe BPD symptoms that do
not reach diagnostic criteria. The results of Bos et al. (2011) suggest that dimensional
measures provide more accurate measurement of severity without over-reliance on
diagnosis.
A common limitation (Bohus et al., 2004; Black et al., 2013; Bos et al., 2011) and a
particular criticism of Black et al. (2009) is high discontinuation rates. Only 51%
participants in Black et al.’s (2009) treatment condition completed more than half of
STEPPS sessions. This risks positively biasing results by only including participants
who had a positive enough experience of therapy to remain in treatment. Controlling
for baseline scores would have been beneficial in these analyses. A strength of many
of the papers is their use of intent to treat analyses (Spinhoven et al., 2008; Giesen-
Bloo et al., 2006; Bohus et al., 2004; Bos et al., 2011; Gratz et al., 2014; Bateman &
Fonargy, 2013). However the frequent use of multiple analyses increased the risk of
Type 1 error in many studies (Black et al., 2009; Black et al., 2013; Gratz et al.,
2014; Bellino et al., 2015).
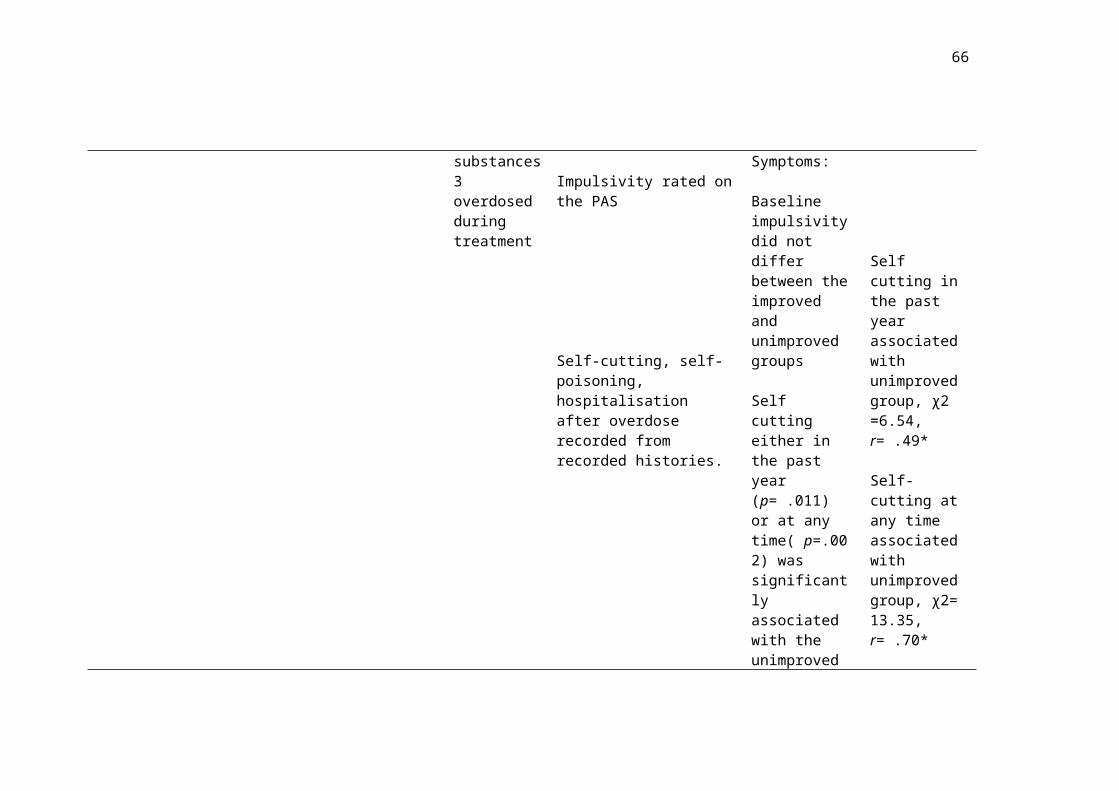
66
Alongside definitions of severity, studies also varied on the outcome measures used
which makes comparisons difficult. Two studies did not use a BPD-specific measure
(Bohus et al., 2004; Bellino et al., 2015) and instead used general severity scales or
axis-I related measures (e.g. Beck Depression Inventory [BDI]; Beck & Steer, 1984).
Although these are useful for measuring distress, only using these measures to
examine BPD treatments may not reveal the full extent of the changes made. Ryle
and Golynkina (2000) developed their own measure of BPD severity. This had not
been statistically validated, nor had reliability been established which reduced the
strength of their findings as they are not based on an established measure. This may
have contributed to this being the only study which found severity to be negatively
related to improvements. It is also important to consider how different aspects of
BPD are measured. Mentalisation is not measured, even by Bateman and Fonagy
(2013) who examine outcomes of MBT.
It is also useful to consider the treatment modalities examined. As outlined in the
methodology, no treatment modality has a sufficient body of research to warrant a
review of its own. In turn, this review includes a range of treatments varying in
structure, approach, intensity and aims which undoubtedly impact on who benefits
from treatment. Despite these difference, there was a trend towards studies
evaluating skills based groups (DBT, STEPPS, ERGT) finding a predictive effect of
severity whereas the more reflective therapies (CAT, MBT, Transference Focused
Psychotherapy (TFP)) did not find higher baseline severity predicting large
improvements. Gratz et al. (2014) suggests that CBT based interventions may be
more suited to severely affected individuals due to the structured approach and focus
on skill implementation in comparison to more psychodynamic approaches which

67
require higher functioning to benefit from less directive treatment. Nine studies
roughly followed this trend (Ryle & Golynkina, 2000; Spinhoven et al., 2008;
Giesen-Bloo et al., 2006; Black et al., 2009; Bos et al., 2011; Black et al., 2013;
Bateman & Fonagy, 2013; Gratz et al., 2014; Bellino et al., 2015), two went against
(Bohus et al., 2004; Meares et al., 1999). Further research comparing skills based
with more reflective therapies would be beneficial.
Severity does not account for all the variance observed in treatment response. The
impact of different symptoms of BPD may also be important in predicting treatment
responses. Understanding the symptom level predictors could help identify
individuals most likely to benefit from certain treatments.
BPD Symptoms
Yen et al. (2009) argue that to assume homogeneity within a sample of BPD is to
under represent the variety of presentations within this population. One way to
reduce the assumption of homogeneity when studying predictors of outcome is to
examine each of the BPD criteria separately.
Twelve papers (Hull et al., 1993; Ryle & Golynkina, 2000; Verheul et al., 2003;
Bohus et al., 2004; Yen et al., 2009; Davidson et al., 2010; Kleindienst et al., 2011;
Lenzeweger, et al., 2012; Sparapani, 2014; Gratz et al., 2014; Arntz et al., 2015;
Bellino et al., 2015) examine symptoms of BPD and how they relate to treatment
outcomes. This section will review research on each BPD criterion in turn providing
a summary of findings followed by a critique of research methodology.
Fear of abandonment. Yen et al. (2009) found those without fear of
abandonment made significantly larger improvements on levels of hopelessness only

68
(Beck’s Hopelessness Scale [BHS]; Beck, Weissman, & Lester, 1974), with a small-
medium effect size (R2 =.22). Unfortunately this was the only study examining the
impact of fear of abandonment on hopelessness; repetition would be required in
order to confirm this preliminary finding.
Bellino et al. (2015) examined fear of abandonment using the BPD-SI. They found
those with higher ‘fear of abandonment’ ratings showed significantly more
improvements on the Clinical Global Impression scale (CGI, Guy, 1976) following
IPT plus fluoxetine. In Bellino et al.’s (2015) multiple regression model, fear of
abandonment demonstrated a moderate-large effect size (p=.001, coefficient= .452).
Of four variables contributing to the multiple regression, ‘fear of abandonment’ had
the largest effect size.
With only two studies conducted in different countries, finding different results,
using different outcome measures, it would be entirely speculative to attempt to draw
any conclusions on the impact of abandonment fears at this stage.
Unstable relationships. Three studies found that ‘unstable relationships’ did
not predict outcomes on measures of general psychopathology (Yen et al, 2009;
Kleindienst et al., 2011; Bellino et al., 2015) but others found an impact on more
specific measures. It was not surprisingly that baseline Inventory of Interpersonal
Problems (IIP; Horowitz, Rosenberg, Baer, & Ureno, 1988) scores were positively
correlated with improvements on the IIP following DBT (Bohus et al., 2004) as
baseline scores account for a degree of variance in end of treatment scores. Given it
is a wide-ranging assessment of a variety of interpersonal behaviours the IIP does not
necessarily measure instability in relationships. For these reasons the conclusions
which can be drawn are limited. Yen et al. (2009) found significantly lower rates of
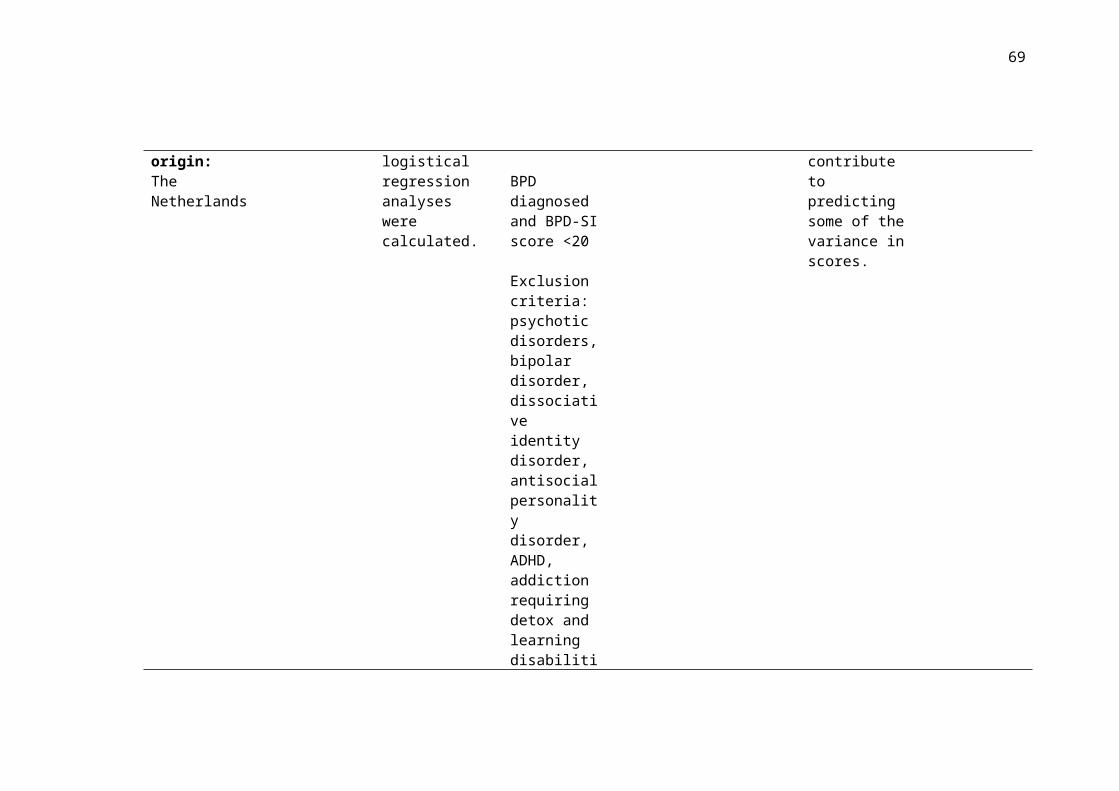
69
self harm after treatment in those who had endorsed the unstable relationships
symptom (p<.01, Wald= 7.0); however the authors note that they only measured
experience of unstable relationships at the start of treatment so could not rule out the
possibility that changes to relationships was what impacted on levels of self harm.
When Schema Therapy and TFP were examined unstable interpersonal relationships
(measured by the BPD-SI) did not predict recovery rates (BPD-SI<15) (Arntz,
Stupar-Rutenfrans, Bloo, van Dyck, & Spinhoven, 2015). This was the only study
which used a BPD-specific outcome measure.
Two studies examining skills-based treatment (Yen et al., 2009; Bohus et al., 2004)
found a positive relationship between unstable relationships and outcomes. Two
interpersonally based treatments (Bellino et al., 2015; Arntz et al., 2015) did not find
this effect suggesting unstable relationships are more influential in skills based
groups. This is based on very few studies. Replication would provide further clarity
on this hypothesis.
Identity disturbance. Yen et al. (2009) found that unstable identity predicted
significantly lower improvements in general psychopathology (Brief Symptom
Inventory score [BSI]; Derogatis & Melisaratos, 1983) with a small-medium effect
size (p<.01, R2=.27). Two other studies found unstable identity predicted
significantly higher rates of improvements in global functioning/ social adjustment
domain with a medium effect size (Pearson’s coefficient=-.36, Lenzenweger,
Clarkin, Levy, Yeomans, & Kernberg, 2011) and in CGI (Bellino et al., 2015,
medium effect size, multiple regression coefficient= 0.307).

70
One possible explanation for the different results could be that the DBT treatment
(Yen et al., 2009) was a 5-day treatment whereas the other studies examined longer-
term treatments. It is possible that in the short-term identity disturbance limits
improvements but over longer-term treatments people with identity disturbance
shower greater improvement. This is conceivable given the important contribution of
the therapeutic relationship to recovery (Clarkson, 2003) if someone has particular
difficulties with sense of self then they may be more suited to a longer treatment
where they can build a trusting and effective therapeutic relationship. Arntz et al.
(2015) found baseline identity disturbance was not predictive of treatment outcome.
However, Arntz et al. (2015) had a strict recovery criteria (BPD-SI<15) which could
mask more subtle changes and might account for the lack of significant effect of
identity disturbance in this study.
Impulsivity. Only Yen et al. (2009) found a (small) effect of impulsivity
(p<.01, R2=.17). Participants with higher levels of impulsivity demonstrated greater
improvements in their anger (State-Trait Anger Expression Inventory [STAXI];
Spielberger, 1999) suggesting there could be an aspect of this DBT treatment which
participants with higher impulsivity found particularly useful in applying to their
difficulties with anger.
Others did not find baseline impulsivity to significantly impact on treatment outcome
over five treatment modalities (Psychodynamic psychotherapy, Hull et al., 1993;
CAT, Ryle & Golynkina, 2000; IPT, Bellino et al., 2015; Schema Therapy and TFP,
Arntz et al., 2015). It is possible that DBT, which is well structured and skills
focused, is more suited to create changes in people with higher levels of impulsivity
than these, more psychodynamic and interpersonally based treatments.

71
Suicidal or self-harm behaviours. Most studies examining suicidal or self-
harm behaviours found this criterion did not predict outcomes over a range of
treatments (DBT, Yen et al., 2009; IPT, Bellino et al., 2015; Schema therapy and
TFP, Arntz et al., 2015; CBT Davidson et al., 2010).
Ryle and Golynkina (2000) found that ‘unimproved’ participants who had undergone
time limited CAT had significantly higher baseline deliberate self harm (recent and
lifelong). This study had a small sample size and did not report effect sizes. The
unimproved group may also be a slightly misleading category as this group included
participants who made no change and those who made some change but still met
criteria for BPD. The authors created dichotomous groups by categorising
participants as ‘improved’ or ‘unimproved’. Studying improvements as a continuous
variable would be more transparent and would reveal more subtle changes.
Verheul et al. (2003) defined severity according to degree of self-mutilating acts. In
contrast to the other studies reviewed, Verheul et al. (2003) found higher severity at
baseline to significantly predict greater improvements following DBT.
Affective instability. Studies examining affective instability found
contradictory results. In Bellino et al. (2015) affective instability predicted change in
severity of symptoms (CGI) with a small-medium effect size (multiple regression
coefficient= .242). In Gratz et al. (2014) difficulties in emotion regulation (the
Difficulties in Emotion Regulation Scale [DERS]; Gratz & Roemer, 2004) predicted
improvements in ZAN-BPD following ERGT.
Yen et al. (2009) found no effect of affective instability on any outcome measure
following DBT. Lenzenweger et al. (2012) examined how symptoms cluster and

72
change over time by performing a growth curve analysis using data from their RCT
on DBT, TFP, and Supportive Dynamic Psychotherapy. They found that lower levels
of negative affect predicted significantly higher rates of change in the domain of
anger/aggression with a medium-large effect size (Pearson’s coefficient= .48;
Lenzenweger et al., 2012). There are important differences between negative affect
and affective instability, it is likely that the study by Lenzenweger et al. (2012)
measured a different predictor variable to those specifically examining affective
instability.
Finally, an unpublished study (Sparapani, 2014) found emotion regulation difficulties
to be significantly related to a number of BPD domains but baseline scores on the
DERS only moderated final emptiness scores (R2=.206) but in the opposite direction
than predicted, with higher baseline DERS predicting higher emptiness scores
following DBT (β=397). Due to the contradictions in findings, affective instability
would benefit from further examination before reliable conclusions can be drawn.
Emptiness. Bellino et al. (2015) found no effect while Yen et al. (2009)
found that higher baseline emptiness scores significantly predicted greater
improvements on depression (BDI), dissociation (the Dissociative Experience Scale
[DES]; Bernstein-Carlson & Putnam, 1986) and general psychopathology (BSI).
These studies examined different therapies so it is possible that DBT (Yen et al.,
2009) is more suited to people with high levels of emptiness than IPT (Bellino et al.,
2015). One hypothesis, suggested by Yen et al. (2009), concerned the importance of
the mindfulness component of DBT on emptiness. Another is that the intensive social
component of the 5-day DBT treatment provided a more validating experience for

73
reducing symptoms of emptiness than the individual treatment in Bellino et al.
(2015).
The representativeness of Yen et al.’s (2009) sample is worth considering. Of their
50 participants, all but three endorsed emptiness (using the Structured Clinical
Interview for DSM-IV Axis II Personality Disorders [SCID] First et al., 1996).
Although the authors report that these three participants had a sufficiently varied set
of baseline symptoms, statistically three is not an ideal comparison group size which
calls into question the reliability of the results.
Yen et al. (2009) noted that emptiness is often neglected in research on BPD
treatment. Emptiness is a core symptom of BPD (DSM-IV-R, 2000). It is related to
multiple areas of psychosocial morbidity (Ellison, Rosenstein, Chelminski,
Dalrymple, & Zimmerman, 2015) and has the highest association with suicidal
ideation of the BPD criteria (Klonsky, 2008), for this reason emptiness warrants
further study.
Inappropriate anger. Higher baseline anger predicted significantly greater
improvements in anger following DBT (Bohus et al., 2004). Lenzenweger et al.
(2012) found a large effect (Pearson’s coefficient= .44) of higher baseline aggression
predicting higher rates of change in the domain of anger/aggression. Anger and
aggression, although frequently coinciding, are separate concepts so it is
questionable how neatly this variable maps onto the BPD symptom of anger. While
the findings in Bohus et al. (2004) could be explained through regression to the
mean, the findings of Lenzenweger et al. (2012) were reached through growth curve
and principle component analysis which takes a more dynamic look at the changes
occurring. However Lenzenweger et al.’s (2012) findings were based on only 58

74
participants which is lower than recommended for statistical techniques based on
principles of factor analysis.
Dissociative or paranoid experiences. Bohus et al. (2004), reports that higher
baseline DES scores predicted greater improvements on the DES following DBT.
However this pattern of improvement was also observed in the waiting list control
group suggesting findings could be assigned to a regression to the mean.
Bellino et al. (2015) and Yen et al. (2009) did not find that levels of dissociation
predicted outcomes on their set of dependent variables. Kliendienst et al. (2011)
found that higher baseline dissociation was related to significantly smaller
improvements on the Global Severity Index (GSI) (β=-.017). Arntz et al. (2015) was
the only study to use a BPD specific measure and found that dissociation (BPD-SI)
predicted a smaller chance of recovery (effect size of β=.030).
Kliendienst et al. (2011) suggest that dissociation during treatment disrupts learning
which leads to smaller improvements; however the findings are inconclusive. Further
evidence is required to understand the impact of dissociation on treatment.
Critique. Research into the predictive value of BPD symptoms is still
relatively sparse. Five studies were uncontrolled (Hull et al., 1993; Ryle &
Golynkina, 2000; Yen et al., 2009; Kleindienst et al., 2011; Sparapani, 2014)
meaning we cannot assume that the observed effects would not have occurred
without the intervention. Five studies (Bohus et al., 2004; Lenzeweger et al., 2012;
Gratz et al., 2014; Arntz et al., 2015; Bellino et al., 2015) used data from previous
efficacy research to examine predictors of outcome. These studies operate by
performing exploratory analysis to examine whether any baseline variables predict

75
the observed outcomes. This post hoc approach increases the risk of important
variables being missed as baseline variables have already been decided upon and
may not be based on theoretical considerations, or in some cases variables may be
conveniently constructed from whichever measures were used in the original RCT.
The power of post-hoc analyses are lower than a priori analyses which is a limitation
of many of the papers reviewed.
Kliendienst et al. (2011) was theoretically designed on the basis of dissociation
disrupting learning. Lenzenweger et al. (2012) identified predictor variables on the
basis of two models of BPD (neurobehavioural model; Depue & Lenzenweger, 2005,
and a psychodynamic object relation model; Kernberg, 1984). A number of the
studies do not provide a clear rationale for their choice of predictor variables (Bohus
et al., 2004; Ryle & Golynkina, 2000; Gratz et al., 2014; Bellino et al., 2015).
One study chose predictor variables on the basis of past research with the aim of
replication (Arntz et al., 2015) however most of the research was exploratory and, in
turn, a large amount of analyses were performed with multiple variables and outcome
measures. This increases the risk of Type 1 error. While two studies adopted an
adjusted significance value to protect against Type 1 error (Yen et al., 2009; Bohus et
al., 2004), others did not make this adjustment (Gratz et al., 2014; Bellino et al.,
2015; Arntz et al., 2015). Gratz et al. (2014) did not adjust their significance value
due to their small sample size and associated risk of Type 2 error, while this seems a
necessary measure it still leaves opens the risk of Type 1 error. Arntz et al. (2015)
also opted not to adjust their p-value due to their sample size. Bellino et al. (2015)
acknowledged the higher risk of Type 1 error in their initial regression analyses but
claimed this risk was not as high when the multiple regression was calculated which

76
accounts for multicollinearity and multiple tests, although this is a reasonable
argument conclusions should be interpreted with caution.
Another limitation is that only four studies used a BPD-specific measure (Artnz et
al., 2015; Ryle & Golynkina, 2000; Gratz et al., 2014; Sparapani, 2014). As therapy
targets BPD, important changes may be missed without an appropriate BPD measure.
Arntz et al. (2015) employed the BPD-SI and Ryle and Golynkina (2000) used the
PAS (Tyrer, Alexander, & Ferguson, 1987) but both used a recovery level cut-off to
create dichotomous variables which might have led to more subtle changes being
missed.
The lack of research aimed at replicating results makes it difficult to compare
findings. At this stage, there is insufficient evidence to draw reliable conclusions
about any single treatment modality but it is likely that different individuals will be
suited to different treatment approaches. Replication studies with theoretically driven
hypotheses are needed to drive this research area forward.
BPD Subgroups
Research suggests that severity of BPD is useful in predicting response to treatment.
Acknowledging the limited research and high number of variables, no single
symptom proves a consistent predictor of outcome. Researchers have begun looking
at potential subgroups of BPD (Sanislow et al., 2002; Zittel, Bradley, & Weston,
2006; Digre et al., 2009; Bradley, Zittel & Western, 2005). One study found that a
three factor model of BPD provided a better fit than BPD as a unidimensional
concept (Andión et al., 2011).

77
Four studies examined how subgroups of BPD predict treatment outcomes (Digre et
al., 2009; Nesci, 2009; Altieri, 2011; Eurelings-Bontekoe, Peen, Noteboom, Alkema
& Dekker, 2012). Unfortunately each of these examines different groupings of BPD,
again demonstrating the need for replication in this area. Three studies took place in
Australia (Digre et al., 2009; Nesci, 2009; Altieri, 2011) and one in the Netherlands
(Eurelings-Bontekoe, 2012). Two are unpublished studies examining how subgroups
respond to DBT based treatments (Nesci, 2009; Altieri, 2011). One examines the
response of three subgroups to SPECTRUM (an Australian DBT based treatment)
(Digre et al., 2009) and the final study looks at treatment response of five subgroups
to a variety of treatments (Eurelings-Bontekoe, 2012).
Using cluster analysis Nesci (2009) identified two subgroups: self-good/self-bad
group and self-good/other-bad group, differing on their attribution of negative
events. The external attributors (self-good/other-bad) showed only significant
improvements in depression following DBT. The internal attributors (self-good/self-
bad) demonstrated significant improvements on a number of measures (including
depression, self-harm and suicide attempts).
Altieri (2011) identified two subgroups using two-step cluster analysis (cluster 1:
dysregulated/ more functional self and cluster 2: dysregulated/ defective self) with
participants in the second cluster presenting with more severe symptoms in all BPD
domains. Following DBT, Altieri (2011) found participants in cluster 2 made a
number of significant improvements (STAXI, Million Clinical Multi-axial Inventory-
III [MCMI; Millon, 1994], MCMI Borderline Personality pathology, MCMI
Depression and Anxiety Scales) which were not made by cluster 1. However it seems
possible that these findings could be explained by regression to the mean or the

78
severity effect discussed earlier in this review. Cluster 1 only included five
participants which limits the representativeness of this comparison group, this also
makes it almost impossible to find a significant result or to determine a precise effect
size. Neither Nesci (2009) nor Altieri (2011) performed interaction analyses to
examine group difference; Nesci (2009) assigned this to their small sample size and
use of non-parametric tests.
Digre et al. (2009) examined response to SPECTRUM, an Australian treatment based
on DBT principles. Using cluster analysis, they identified three subgroups:
withdrawn-internalising, severely disturbed-internalising and anxious-externalising.
Despite time by cluster interactions (2x3 ANOVA) being non-significant for any
outcome measure, the authors performed paired sample t-tests for each measure
within each cluster. They justified this because of the low participant numbers in
each cluster and subsequent low power. While this is a useful exploration of the data,
the non-significant ANOVA greatly reduces the conviction of subsequent findings.
Participants in the withdrawn-internalising group demonstrated significant changes
in DES scores (d=.98, large effect), the anxious-externalising group showed
significant changes in BDI scores (d=1.34, large effect) but no significant changes
were observed in the severely disturbed-internalising group.
Eurelings-Bontekoe et al. (2012) identified five subgroups of Borderline Personality
Organisation (BPO) based on profile interpretation of the Minnesota Multiphasic
Personality Inventory (MMPI; Hathaway & McKinley, 1943): Immature BPO,
Narcissistic BPO, High-level/ Overcontrolled BPO, Low-level BPO and Psychotic
BPO. Using a repeated-measures mixed MANCOVA the authors found the High-
level BPO group benefited most from treatment whereas the Psychotic BPO group

79
did not demonstrate significant change. The Psychotic BPO group was identified as
having the most severe symptoms. In this sense the findings contradict Altieri (2011)
who found the most severe group made the largest improvements. However these
groups vary on more than severity of symptoms which makes direct comparison of
these findings impractical.
Critique. Externalising groups in both Nesci (2009) and Digre et al. (2009)
demonstrated changes primarily in depression symptoms following DBT based
treatments. For externalising participants, DBT produced improvements in mood and
other depression features.
Eurelings-Bontekoe, Luyten, Remijsen, et al. (2010) identified High level BPO
participants, who showed the largest improvements, as internalisers and Psychotic
BPO participants (no significant change) as externalisers. Nesci (2009) also found
that their internalising group (self-good/self-bad) demonstrated more improvements
than the externalising group (self-good/other-bad). Digre et al. (2009) found both
internalisers and externalisers made improvements (on the DES and BDI
respectively) but found severely-disturbed-internalisers did not benefit from
treatment.
Digre et al. (2009) recruited participants classified as severe cases or treatment
resistance which might account for why they identified a severely disturbed-
internalizing group unlike Eurelings-Bontekoe et al. (2012). However considering
Eurelings-Bontekoe et al. (2012) had participant numbers of 2,062 compared with
Digre et al.’s (2009) 77, it seems unlikely that they missed all severe or treatment
resistant participants. Digre et al. (2009) point out that while the subgroups identified
in these research papers may be statistically relevant it does not necessarily mean

80
they will translate to clinical relevance. Three of these four studies examined similar
treatment approaches (DBT) which aided comparison, however the grouping of
participants into different subgroups creates problems for comparison. For example,
the severely disturbed internalisers from Digre et al. (2009) may have been grouped
with the other internalisers in Nesci (2009) or in the High-level, overcontrolled BPO
group in Eurelings-Bontekoe et al. (2012).
Discussion
Findings summary
The results echo those of Barnicott et al. (2012) in finding that baseline severity of
BPD is associated with greater improvements following psychological treatment. It
appears this result cannot be always be accounted for by regression to the mean (Bos
et al., 2011). There are a number of difficulties evaluating research into severity
including the range of severity and outcome measures used and the array of treatment
modes studied which makes direct comparisons unfeasible. Despite these difficulties,
there was a trend towards studies evaluating skills based groups (DBT, STEPPS,
ERGT) finding higher severity being associated with larger outcomes while studies
evaluating more reflective therapies (MBT, TFP, CAT) did not observe this effect.
Fear of abandonment was found to be particularly important for predicting treatment
outcomes following IPT (Bellino et al., 2015). Findings from Yen et al. (2009)
suggest that identity disturbance might be problematic for shorter term therapy and
people with identity disturbances might be more suited to longer term treatments
(Lenzenweger et al., 2011; Bellino et al., 2015). Impulsivity and DSH did not
reliably predict outcomes (Ryle & Golynkina., 2000; Bellino et al., 2015; Arntz et
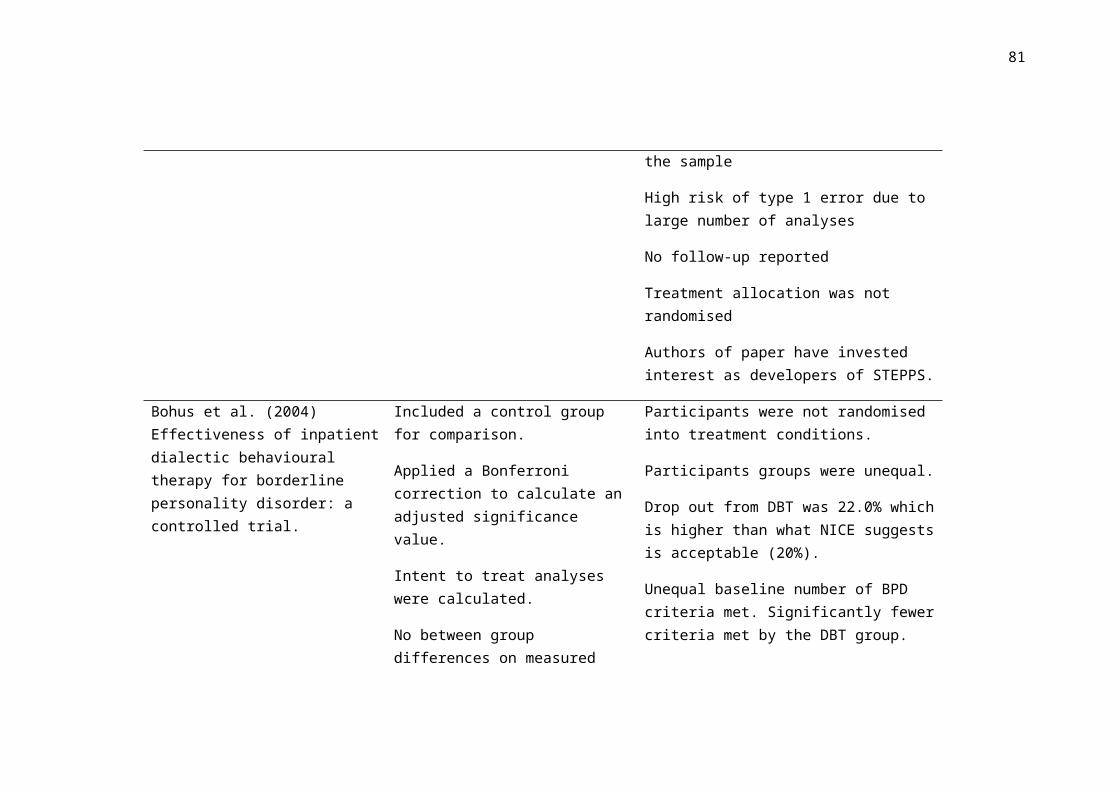
81
al., 2015; Yen et al., 2009). Results were mixed for affective instability. Emptiness
was identified as an understudied symptom. Yen et al. (2009) alone found emptiness
to be related to multiple improvements following brief intensive therapy however
this finding would benefit from replication.
The findings on individual symptoms were varied and inconsistent; this is not
surprising considering the varied treatment types, outcome measures and variable
measures. Replication studies examining the predictive value of BPD symptoms
would be beneficial to increase the reliability of the findings. The available research
does not reveal clear relationships between particular symptoms and treatment type.
Unstable relationships appeared more predictive for DBT groups than interpersonal
treatments however more research is needed to reveal potential patterns. There was a
general pattern of symptom based predictors being less able to predict change in
more interpersonally based treatments. It seems feasible that this reflects the different
foci of these treatments. The symptom based measures used in a large proportion of
this research may be less suited to measuring changes in these more reflective
therapies.
The treatment responses of subgroups of BPD suggest that people with more
internalising tendencies were more likely to show improvements compared to
externalising individuals. This finding did not appear to apply to more severely-
disturbed internalisers but may suggest an important dimension when understanding
the heterogeneous treatment response of people with BPD.
The need for replication is a theme throughout this area of research. Further research
looking at the associations between symptoms and treatment outcomes would help
clarify which findings in the existing literature are robust and emerge across different
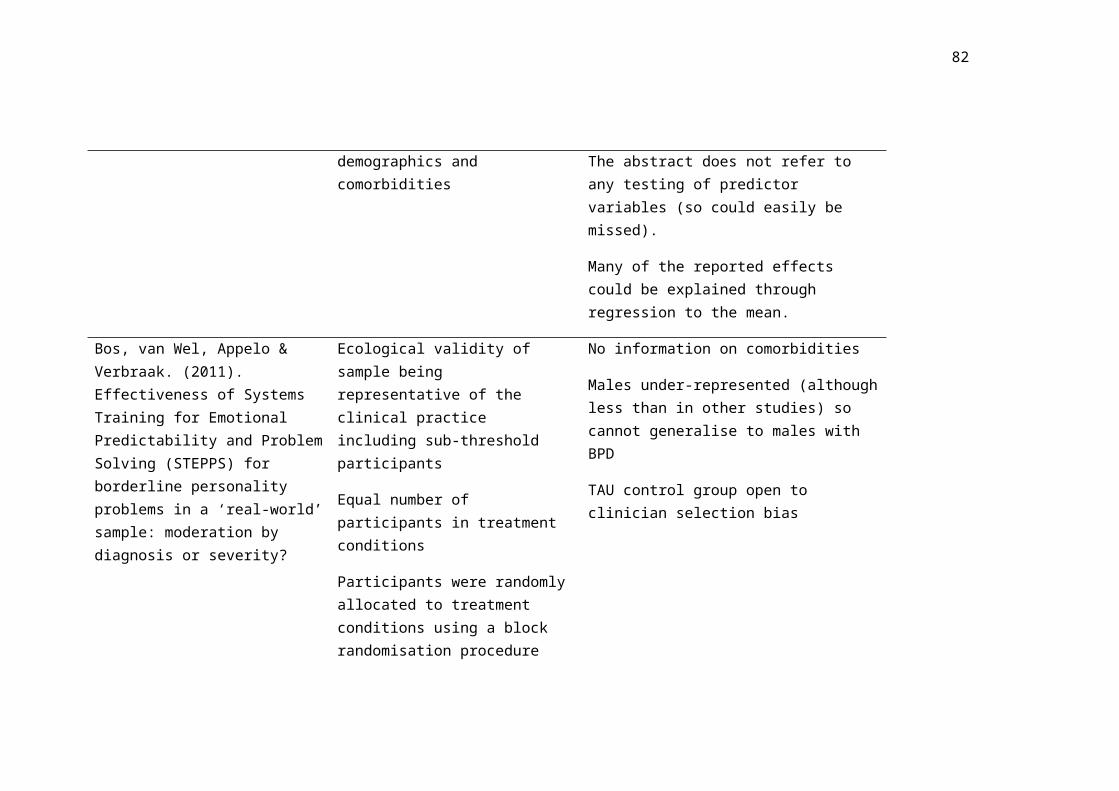
82
participant groups and which are accidental findings or specific to the particular
group being studied.
Strengths and Limitations
One limitation which extends across a large proportion of the research is the
representativeness of research samples. Despite previous claims that BPD is more
common in females (DSM-IV-TR, 2000) equal numbers of males and females with
BPD has since been suggested (Grant et al., 2008). The majority of participants in
BPD research are female meaning females are disproportionately represented. For
this reason, findings cannot be assumed to apply to males.
Another common limitation was the exploratory nature of much of the research,
especially in studies using post hoc analyses. These studies often include a large
number of analyses increasing the risk of Type 1 error. There were a limited number
of studies accounting for this with adjusted significance values, often due to small
sample sizes and associated risk of Type 2 error. This is a difficult pay off when
there is a lack of power from limited sample sizes. Research would benefit from
theoretically driven hypotheses on which variables are selected which would help
reduce the risk of Type 1 error due to fewer analyses.
Uncontrolled studies are frequently used in this field of research, although more
controlled studies are required to establish a causal relationship, the uncontrolled
studies have a benefit of good ecological validity. More studies would benefit from
extending their follow-up period to ensure findings are maintained over time.
Limitations of the current review and areas for future research

83
No review could cover all individual differences found in populations of people with
BPD. Factors which could modify treatment outcomes are as limited as the
components of the person undertaking treatment. For this reason future research
investigating predictors of treatment response should draw on psychological theories
of BPD and factors contributing to its maintenance. Many variables are bound to be
important to treatment response, including mentalisation, childhood trauma, and
attachment style were not covered but would be interesting avenues for future
reviews. Trans-diagnostic individual differences or societal factors may be equally or
even more helpful in predicting treatment outcomes and provide interesting avenues
for future research.
This review selected papers which examine treatment response as defined by changes
in quantitative measures of BPD or related general psychopathology. However other
ways of defining treatment response, including qualitative feedback from participants
or measures of quality of life may reveal different predictor variables. This would be
another interesting area for future research.
Inconsistent findings are expected when one takes into account the large number of
individual and therapeutic differences naturally occurring in the reviewed research.
In addition, research took place in a range of different countries with different
healthcare systems. However the research demonstrates good ecological validity
which reflects what is observed in real-life practice. In order to gain a more precise
understanding of how individual differences relate to treatment outcomes more
tightly controlled studies would be beneficial to control for extraneous variables.
The severity findings highlight a potential area of missed treatment. People with less
severe BPD benefit less from treatment. Clinicians may find this lower-severity

84
group harder to treat. It might be necessary to re-consider the treatment needs of
individuals with less severe BPD. Without this we run the risk of only treating BPD
up to a certain level, leaving many people with lower, but significant, difficulties
without viable treatment options. A criticism of the current review is the inability to
form recommendations about symptom level predictors but it is hoped that further
research will provide clarity. In terms of subgroups, it might be advisable for
clinicians to consider the impact of coping and blame attribution style and recognise
different needs of these individuals. Again, it is hoped that future research will
provide further information resulting in clearer recommendations for clinicians.
Conclusion
In conclusion, this review has found confirmatory evidence that baseline severity of
BPD is predictive of better treatment outcomes, especially in skills based treatments
such as STEPPS. This review has begun to look at how different symptoms relate to
treatment outcomes and has found preliminary evidence for the importance of
internalising and externalising styles in subgroups of BPD on treatment outcomes.
Replication is invaluable at this stage, with preliminary findings emerging but in
desperate need of replication. While severity is a reasonably well established
predictor of treatment response (although further replication is welcomed) research
which breaks down this variable into its parts would make a valuable contribution to
demystifying the current findings relating to symptom and subgroup level predictors.
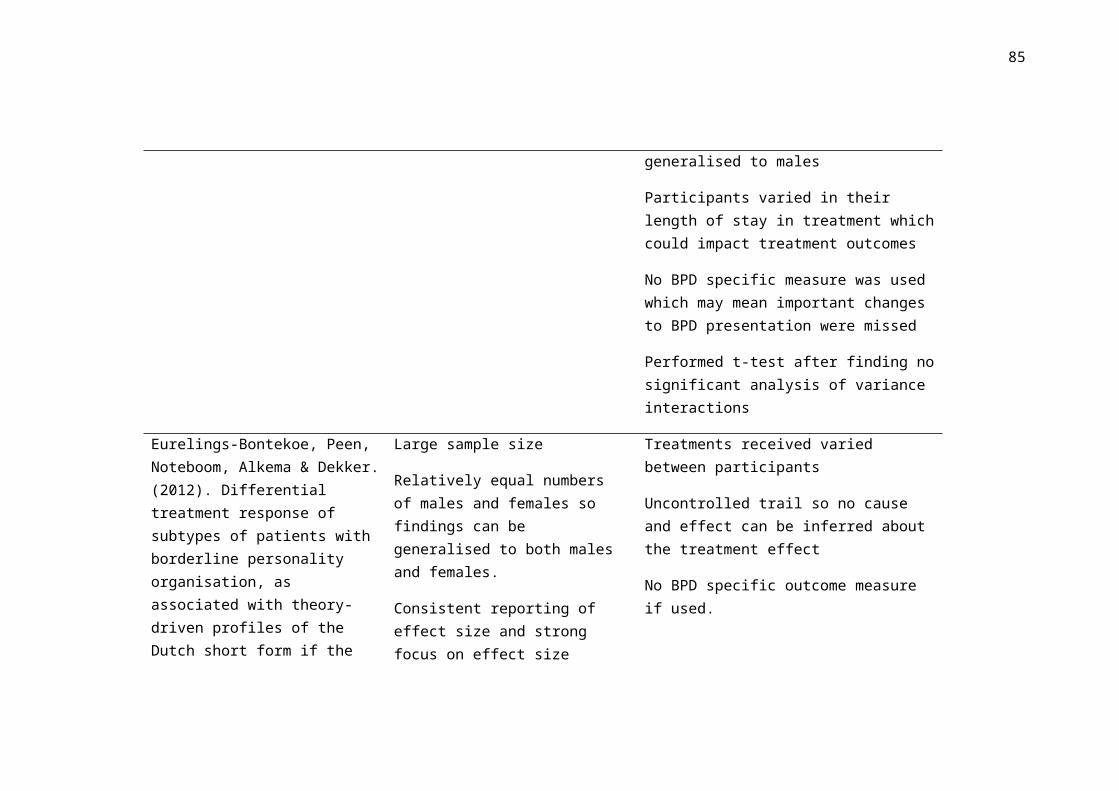
85
References
Altieri, P. (2011). Borderline personality disorder and dialectical behaviour therapy
in an Australian private hospital setting treatment response and BPD
subtypes. (Unpublished doctoral thesis). RMIT University, Melbourne,
Australia.
American Psychiatric Association. (1987). Diagnostic and Statistical Manual of
Mental Disorders,3rd ed, Text Revision (DSM-III-R). Washington, DC:
APA.
American Psychiatric Association. (2000). Diagnostic and Statistical Manual of
Mental Disorders, 4th ed, Text Revision (DSM-IV-TR). Washington, DC:
APA.
American Psychiatric Association. (2001). Practice guideline for the treatment of
patients with borderline personality disorder. The American Journal of
Psychiatry 158(10 Suppl), 1-52.
American Psychiatric Association. (2013). Diagnostic and statistical manual of
c mental disorders (5th ed.). Washington, DC: APA.
Andión. Ó., Ferrer, M., Gancedo, B., Calvo, N., Barral, C., Torrubia, R., & Casas, M.
(2011). Confirmatory factor analysis of borderline personality disorder
symptoms based on two different interviews: The Structured Clinical
Interview for DSM-IV Axis II disorder and the Revised Diagnostic Interview
for Borderlines. Psychiatry Research, 190, 304-308.

86
Andrews, G., Pollock, C., & Stewart, G. (1989). The determination of defense style
by questionnaire. Arch Gen Psychiatry, 46, 455-460.
Arntz, A., Dreessen, L., Schouten, E., & Weertman, A. (2004). Beliefs in personality
disorders: a test with the Personality Disorder Belief Questionnaire. Behav
Res Ther, 42, 1215-1225.
Arntz, A., Stupar-Rutenfrans, S., Bloo, J., van Dyck, R., & Spinhoven, P. (2015).
Prediction of treatment discontinuation and recovery from borderline
personality disorder: Results from an RCT comparing schema therapy and
transference focused psychotherapy. Behaviour Research and Therapy, 74,
60-71. doi:10.1016/j.brat.2015.09.002
Arntz, A., van den Hoorn, M., Cornelis, J., Verheul, R., van den Bosch, L.M.C., &
de Bie, A.J.H.T. (2003). Reliability and validity of the borderline personality
disorder severity index. Journal of Personality Disorders, 17, 45–59.
Asnaani, A., Chelminski, I., Young, D., & Zimmerman, M. (2007). Heterogeneity of
borderline personality disorder: do the number of criteria met make a
difference? Journal of Personality Disorder, 21(6), 615-625.
Barnett, A. G., van der Pols, J. C., & Dobson, A. J. (2005). Regression to the mean:
what it is and how to deal with it. International Journal of Epidemiology,
34(1), 215, 220.
Barnicot, K., Katsakou, C., Bhatti, N., Savill, M., Fearns, N., & Priebe, S. (2012).
Factors predicting the outcome of psychotherapy for borderline personality
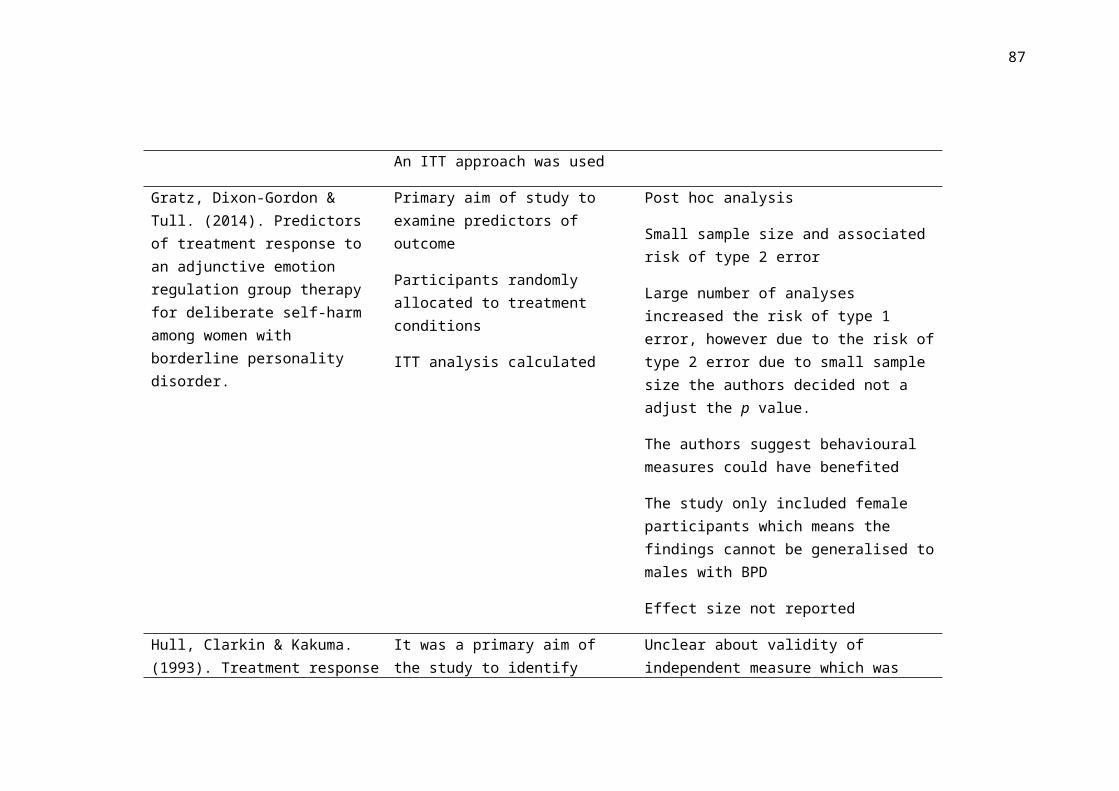
87
disorder: A systematic review. Clinical Psychology Review, 32(5), 400-412.
doi:10.1016/j.cpr.2012.04.004
Barratt E. Anxiety and impulsiveness related to psychomotor efficiency. (1959).
Percept Mot Skills. 9, 191– 198
Bateman, A. W., & Fonagy, P. (2004). Psychotherapy for borderline personality
disorder: Mentalization-based treatment of BPD. Oxford: Oxford University
Press.
Bateman, A., & Fonagy, P. (2013). Impact of clinical severity on outcomes of
mentalisation-based treatment for borderline personality disorder. The British
Journal of Psychiatry, 203(3), 221-227. Retrieved from
http://search.ebscohost.com/login.aspx?direct=true&AuthType=ip,shib&db=
psyh& AN=2013-32050-013&site=ehost-live&custid=s4121186
Beck, A. T., & Steer, R. A. (1984). Internal consistencies of the original and revised
Beck Depression Inventories. Journal of Clinical Psychology, 40, 1365–67.
Beck A, Ward CH, Mendelson M, Mock J, Erbaugh J. (1961). An inventory for
measuring depression. Arch Gen Psychiatry, 4, 561–71.
Beck, A. T., Weissman, A., Lester, D., et al. (1974). The measurement of pessimism:
The Hopelessness Scale. Journal of Consulting and Clinical Psychology, 42,
861–5.
Bellino, S., Bozzatello, P., & Bogetto, F. (2015). Combined treatment of borderline
personality disorder with interpersonal psychotherapy and pharmacotherapy:

88
Predictors of response. Psychiatry Research, 226(1), 284-288.
doi:10.1016/j.psychres.2014.12.064
Bernstein-Carlson, E. B., & Putnam, F. W. (1986). Development, reliability, and
validity of a dissociation scale. The Journal of Nervous and Mental Disease,
174, 727–5.
Black, D. W., Allen, J., St. John, D., Pfohl, B., McCormick, B., & Blum, N. (2009).
Predictors of response to systems training for emotional predictability and
problem solving (STEPPS) for borderline personality disorder: An
exploratory study. Acta Psychiatrica Scandinavica, 120(1), 53-61.
doi:10.1111/j.1600-0447.2008.01340.x
Black, D. W., Blum, N., McCormick, B., & Allen, J. (2013). Systems training for
emotional predictability and problem solving (STEPPS) group treatment for
offenders with borderline personality disorder. Journal of Nervous and Mental
Disease, 201(2), 124-129. doi:10.1097/NMD.0b013e31827f6435
Blum, N., Pfohl, B., John, D. S., Monahan, P., & Black, D. W. (2002). STEPPS: a
cognitive-behavioral systems-based group treatment for outpatients with
borderline personality disorder-a preliminary report. Comprehensive
Psychiatry, 43(4), 301-310.
Bohus, M., Haaf, B., Simms, T., Limberger, M. F., Schmahl, C., Unckel, C., et al.
(2004). Effectiveness of inpatient dialectical behavioral therapy for borderline
personality disorder: A controlled trial. Behaviour Research and Therapy, 42(5),
487-499. Retrieved from http://search.proquest.com/docview/71738013?
accountid=17256

89
Bos, E. H., van Wel, E. B., Appelo, M. T., & Verbraak, J. P. M. (2011).
Effectiveness of systems training for emotional predictability and problem
solving (STEPPS) for borderline personality problems in a ‘real-world’
sample: Moderation by diagnosis or severity? Psychotherapy and
Psychosomatics, 80(3), 173-181. doi:10.1159/000321793
Bradley, R., Zittel Conklin, C., & Western, D. (2005). The borderline personality
diagnosis in adolescents: gender differences and subtypes. Journal of Child
Psychology and Psychiatry, 46(9), 1006-1019.
Briere, J. (1995). Trauma Symptom Inventory. USA: Psychological Assessment
Resources, Inc.
British Psychological Society. (2011). Response to the American Psychiatric
Association: DSM-5 Development. Leicester: The British Psychological
Society.
Clarkin, J. F., Yeomans, F. E., & Kernberg, O. F. (2006). Psychotherapy of
Borderline Personality Disorder Focusing on Object Relations. Washington,
DC: American Psychiatric Publishing.
Clarkin, J. F., Foelsch, P. A., & Kernberg, O. F. (2001). The Inventory of Personality
Organization. White Plains, NY: The Personality Disorders Institute,
Department of Psychiatry, Weill College of Medicine of Cornell University.
Clarkson, P. (2003). The therapeutic relationship (2nd ed.). Philadelphia: Whurr
Publishers.

90
Corney, R. H., Clare, A. W., & Fry, J. (1982). The development of a self-report
questionnaire to identify social problems—A pilot study. Psychological
Medicine, 12, 903–909.
Critical Appraisal Skills Programme. (2017). CASP Systemic Review Checklist.
[online]. Available at: http://www.casp-uk.net/checklists. Accessed: 21st
September 2017.
Davidson, K. M. (2007). Cognitive Therapy for Personality Disorders: A Guide for
Clinicians. Second Edition. Routledge.
Davidson, K. M., Tyrer, P., Norrie, J., Palmer, S. J., & Tyrer, H. (2010). Cognitive
therapy v. usual treatment for borderline personality disorder: prospective 6-
year follow-up. The British Journal of Psychiatry, 197, 456-462.
De Jong, K., Nugter,M. A., Polak,M. G.,Wagenborg, J. E. A.,
Spinhoven, P., & Heiser, W. J. (2007). The Outcome Questionnaire
(OQ–45) in a Dutch population: A cross-cultural validation.
Clinical Psychology and Psychotherapy, 14, 288–301.
Depue, R. A., & Lenzenweger, M. F. (2005). A neurobehavioral model of
personality disturbance. In M. F. Lenzenweger & J. F. Clarkin (Eds.), Major
theories of personality disorder (2nd ed.) (pp. 391–453). New York, NY:
Guilford Press.
Derogatis LR, & Melisaratos N. (1983). The Brief Symptom Inventory: An
introductory report. Psychological Medicine, 13, 595–605.

91
Derogatis, L.R. & Savitz, K.L. (2000). The SCL-90-R and the Brief Symptom
Inventory (BSI) in Primary Care In: M.E.Maruish, ed. Handbook of
psychological assessment in primary care settings, Volume 236 Mahwah,
NJ: Lawrence Erlbaum Associates, pp 297-334.
Derogatis, L. R., & Spencer, P. M. (1982). BSI administration and
procedures manual I. Baltimore, MD: Clinical Psychometric
Research.
Digre, E. I., Reece, J., Johnson, A. L., & Thomas, R. A. (2009). Treatment response
in subtypes of borderline personality disorder. Personality and Mental
Health, 3(1), 56-67. doi:10.1002/pmh.64
Ellison, W. D., Rosenstein, L., Chelminski, I., Dalrymple, K., & Zimmerman, M.
(2015).The clinical significance of single feature of borderline personality
disorder: anger, affective instability, impulsivity, and chronic emptiness in
psychiatric outpatients. Journal of Personality Disorders, 30(2), 261-270.
Endicott, J., Spitzer, R. L., Fleiss, J. L., & Cohen, J. (1976). The Global Assessment
Scale: a procedure for measuring overall severity of psychiatric disturbance.
Arch Gen Psychiatry, 33, 766–771.
Eurelings-Bontekoe, E. H. M., Luyten, P., Remijsen, M., & Koelen, J. A. (2010).
Association between personality organization as assessed by theory driven
profiles of Dutch Short Form of MMPI and self-reported structural
personality pathology. Journal of Personality Assessment, 92, 599–609.

92
Eurelings-Bontekoe, E. Peen, J., Noteboom, A., Alkema, M., & Dekker, J. (2012).
Differential treatment response of subtypes of patients with borderline
personality organization, as assessed with theory-driven profiles of the dutch
short form of the MMPI: A naturalistic follow-up study. Journal of
Personality Assessment, 94(4), 380-392. doi:10.1080/00223891.2012.674995
First, M. D., Spitzer, R. L., Gibbon, M., et al. (1996). Structured Clinical Interview
for DSM-IV Axis II Personality Disorders (SCID-II). 2. New York:
Biometrics Research Department, New York State Psychiatric Institute.
Giesen-Bloo, J. H., Wachters, L. M., Schouten, E., & Arntz, A. (2010). The
borderline personality disorder severity index-IV: psychometric evaluation
and dimensional structure. Personality and Individual Differences, 49, 136-
141.
Giesen-Bloo, J., Arntz, A., & Schouten, E. (2006). The borderline personality
checklist: Psychometric evaluation and factorial structure in clinical and
nonclinical samples. In J. Giesen-Bloo (Ed.), Crossing borders: Theory,
assessment and treatment in borderline personality disorder. (pp. 85-101).
Maastricht: Universitaire Pers.
Goldman, H. H., Skodol, A. E., & Lave, T. R. (1992). Revising Axis V for DSM-
IV:areviewof measures of social functioning. American Journal of
Psychiatry, 149, 1148–1156.
Goodman, M., Patil, U., Steffel, L., Avedon, J., Sasso, S., Triebwasser, J., & Stanley,
B. (2010). Treatment utilization by gender in patients with borderline
personality disorder. Journal of Psychiatric Practice, 16(3), 155-63.

93
Grant, B. F., Chou, S. P., Goldstein, R. B., Huang, B., Stinson, F. S., Saha, T. D., et
al. (2008). Prevalence, correlates, disability, and comorbidity of DSM-IV
borderline personality disorder: results from the wave 2 national
epidemiologic survey on alcohol and related conditions. Journal of Clinical
Psychiatry, 69(4), 533-545.
Gratz, K. L. (2001). Measurement of deliberate self-harm: Preliminary data on the
Deliberate Self-Harm Inventory. Journal of Psychopathology and Behavioral
Assessment. 23, 253–263.
Gratz, K. L., Dixon-Gordon, K., & Tull, M. T. (2014). Predictors of treatment
response to an adjunctive emotion regulation group therapy for deliberate self-
harm among women with borderline personality disorder. Personality
Disorders: Theory, Research, and Treatment, 5(1), 97-107.
doi:10.1037/per0000062
Gratz, K. L., & Roemer, L. (2004). Multidimensional assessment of emotion
regulation and dysregulation: Development, factor structure, and
initial validation of the difficulties in emotion regulation scale. Journal of
Psychopathology & Behavioral Assessment, 26, 41–54.
Gunderson, J. G. (2009). Borderline personality disorder: ontogeny of a diagnosis.
American Journal of Psychiatry, 166(5), 530-539.
Guy, W. (1976). Clinical Global Impression (C.G.I.). ECDEU Assessment Manual
for Psychopharmacology. National Institute of Mental Health, US Dept
Health, Education, and Welfare Publication (ADM): Rockville (MD), pp.76–
338.

94
Hathaway, S. R., & McKinley, J. C. (1943). The Minnesota
Multiphasic Personality Inventory. Minneapolis: University of
Minnesota Press.
Hamilton, M. (1959). The assessment of anxiety states by rating. British Journal of
Medical Psychology , 32, 50.
Hamilton, M. (1960). A rating scale for depression. Journal of Neurology,
Neurosurgery & Psychiatry, 23, 56–62.
Hayes, S. C., Strosahl, K., Wilson, K. G., Bissett, R. T., Pistorello, J., Toarmino, D.,
& McCurry, S. M. (2004). Measuring experiential avoidance: A preliminary
test of a working model. The Psychological Record, 54, 553–578.
Horowitz, L. M., Rosenberg, S. E., Baer, B. A., & Ureno, G. (1988). Inventory of
interpersonal problems: psychometric properties and clinical applications.
Journal of Consulting and Clinical Psychology, 56, 885–892.
Hull, J. W., Clarkin, J. F., & Kakuma, T. (1993). Treatment response of borderline
inpatients - a growth curve analysis. Journal of Nervous and Mental Disease,
181(8), 503-509. doi:10.1097/00005053-199308000-00005
Hyler, S.E. (1994). Personality diagnostic questionnaire. New York: New York State
Psychiatric Institute.
Jacobson, N. S., & Truax, P. (1991). Clinical significance: a statistical approach to
defining meaningful change in psychotherapy research. Journal of Consulting
and Clinical Psychology, 59(1), 12-19.

95
Kellogg, S.H., & Young, J. E. (2006). Schema therapy for borderline personality
disorder. Journal of Clinical Psychology, 62, 445-458.
Kernberg, O. F. (1984). Severe personality disorders. New Haven, CT: Yale.
Kinderman, P., & Bentall, R. P. (1996). A new measure of causal locus: The internal,
personal and situational attributions questionnaire. Personality and Individual
Differences, 20, 261-264.
Kleindienst, N., Limberger, M. F., Ebner-Priemer, U. W., Keibel-Mauchnik, J., Dyer,
A., Berger, M., et al. (2011). Dissociation predicts poor response to dialectial
behavioral therapy in female patients with borderline personality disorder.
Journal of Personality Disorders, 25(4), 432-447.
Klonsky, D. (2008). What is emptiness? Clarifying the 7th criterion for borderline
personality disorder. Journal of Personality Disorders, 22(4), 418-426.
Kopala-Sibley, D. C., Zuroff, D. C., Russell, J. J., Moskowitz, D. S., & Paris, J.
(2012). Understanding heterogeneity in borderline personality disorder:
differences in affective reactivity explained by the traits of dependency and
self-criticism. Journal of Abnormal Psychology, 121(3), 680-691.
Lana, F., & Fernandez-San Martin, M. I. (2013). To what extent are specific
psychotherapies for borderline personality efficacious? A systematic review
of published randomised controlled trials. Actas Espanolas de Psiquiatria,
41(4), 242- 252.
Lenzenweger, M. F., Clarkin, J. F., Levy, K. N., Yeomans, F. E., & Kernberg, O. F.
(2012). Predicting domains and rates of change in borderline personality
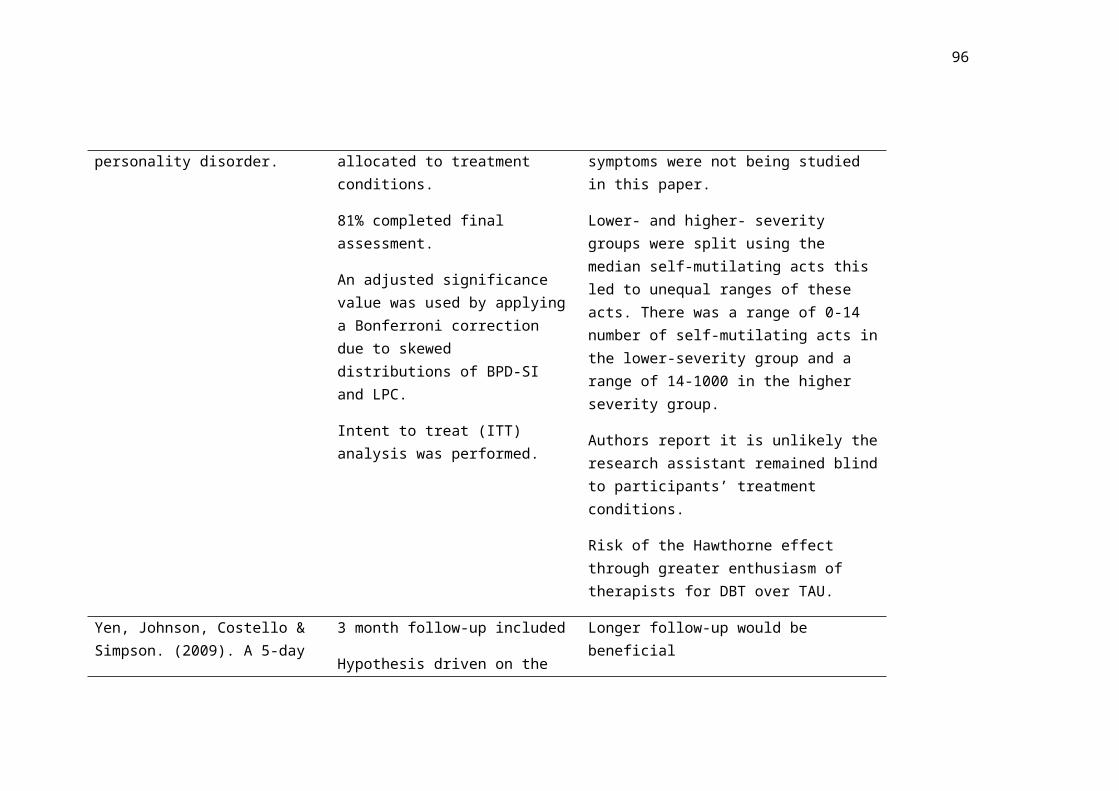
96
disorder. Personality Disorders: Theory, Research, and Treatment, 3(2), 185-
195. doi:10.1037/a0025872
Linehan, M. M. (1993). Cognitive behavioral treatment of borderline personality
disorder. New York: Guilford Press.
Linehan, M.M., & Comtois, K.A. (1994). Lifetime Parasuicide Count. Seattle, WA:
University of Washington. (Unpublished manuscript).
Linehan, M. M. & Heard, H. L. (1987). Treatment history interview (THI).
University of Washington; Seattle, WA: Unpublished measure.
Linehan, M. M., Heard, H. L., & Wagner, A. (1989). Parasuicide history interview:
Complete assessment of parasuicide behavior. Seattle, WA: University of
Washington.
Lovibond, S.H. & Lovibond, P.F. (1995). Manual for the Depression, Anxiety and
Stress Scales (2nd ed). Sydney: University of New South Wales.
Majani, G. & Callegari, S. (1998). SAT-P Satisfaction Profile. Soddisfazione
Soggettiva e Qualità Della Vita. Erickson, Trento (IT).
Meares, R., Stevenson, J., & Comerford, A. (1999). Psychotherapy with borderline
patients: A comparison between treated and untreated cohorts. The Australian
and New Zealand Journal of Psychiatry, 33(4), 467-472.
Millon, T. (1994). Manual for the MCMI-III. Mineapolis: National Computer
Systems.

97
Moher, D., Liberati, A., Tetzlaff, J., & Altman. D. G. (2009). Preferred reporting
items for systematic reviews and meta-analyses: The PRISMA statement.
PLoS Medicine, 6(7): e1000097. doi: 10.1371/journal.pmed1000097
Nesci, J. B. B. (2009). Identification and clinical utility of subgroups of borderline
personality disorder. (Unpublished doctoral thesis). RMIT University,
Melbourne, Australia.
Newhill, C. E., Eack, S. M., & Mulvey, E. P. (2009). Violent behaviour in borderline
personality. Journal of Personality Disorders, 23(6), 541-554.
National Institute for Health and Care Excellence. (2012). Methods for the
development of NICE public health guidance (third edition). London:
National Institute for Health and Care Excellence (NICE).
Norcross, J. C., & Wampold, W. E. (2011). What works for whom: tailoring
psychotherapy to the person. Journal of Clinical Psychology, 67, 127-132.
Oldman, J. M. (2006). Borderline personality disorder and suicidality. The American
Journal of Psychiatry, 163(1), 20-26.
Rosenberg , M. (1965). Society and the Adolescent Self-image. Princeton, NJ:
University Press.
Ryle, A., & Golynkina, K. (2000). Effectiveness of time-limited cognitive analytic
therapy of borderline personality disorder: Factors associated with outcome.
British Journal of Medical Psychology, 73, 197-210.
doi:10.1348/000711200160426

98
Sanislow, C. A., Grilo, C. M., Morey, L. C., Bender, D. S., Skodol, A. E.,
Gunderson, J. G... McGlashan, T. H. (2002). Confirmatory Factor Analysis of
DSM-IV Criteria for Borderline Personality Disorder: Findings from the
Collaborative Longitudinal Personality Disorders Study. The American
Journal of Psychiatry, 159(2), 284-290.
Sansone, R. A, Wiederman, M. W., & Sansone, L. A. (1998). The Self-Harm
Inventory (SHI): Development of a scale for identifying self-destructive
behaviors and borderline personality disorder. Journal of Clinical
Psychology. 54, 973–983.
Spielberger, CD. (1999). State-Trait Anger Expression Inventory. Odessa, FL:
Psychological Assessment Resources.
Spielberger, C. D., Gorsuch, R. L., & Lushene, R. E. (1970). STAI Manual. Palo
Alto, California: Consulting Psychologists Press.
Sparapani, E. M. (2015). Moderators of treatment outcome in dialectical behavior
therapy: The role of emotion regulation and impulsivity. ProQuest Information
& Learning). Dissertation Abstracts International: Section B: The Sciences and
Engineering, 76 (1-) Retrieved from http://search.ebscohost.com/login.aspx?
direct=true&AuthType=ip,shib&db=psyh&AN=2015-99140-405&site=ehost-
live&custid=s4121186
Spinhoven, P., Giesen-Bloo, J., van Dyck, R., & Arntz, A. (2008). Can assessors and
therapists predict the outcome of long-term psychotherapy in borderline
personality disorder? Journal of Clinical Psychology, 64(6), 667-686.
doi:10.1002/jclp.20466

99
Stoffers, J. M., Voellm, B. A., Ruecker, G., Timmer, A., Huband, N., & Lieb, K.
(2012). Psychological therapies for people with borderline personality
disorder. Cochrane Database of Systematic Reviews, (8),
CD005652.doi:10.1002/14651858.CD005652.pub2
Stone, M. H. (2006). Management of borderline personality disorder: a review of
psychotherapeutic approaches. World Psychiatry, 5(1), 15-20.
Specialist Unit for Review Evidence (SURE: 2013). Retrieved from
http://www.cardiff.ac.uk/specialist-unit-for-review-evidence
Tellegen, A. (1982). Multidimensional Personality Questionnaire
manual. Minneapolis, MN: University of Minnesota Press.
Trompenaars, F. J., Masthoff, E. D., Van Heck, G. L., Hodiamont, P. P., & De Vries,
J. (2005). Content validity, construct validity, and reliability of the
WHOQOL-Bref in a population of Dutch adult psychiatric outpatients. Qual
Life Res, 14, 151–160.
Tyrer, P. (1999). Borderline personality disorder: a motley diagnosis in need of
reform. The Lancet, 354, 2095-2096.
Tyrer, P., Alexander, J., & Ferguson, B. (1987). In P. Tyrer (Ed.), Personality
disorders: diagnosis, management and course (pp. 43–62). London: Wright.
Verheul, R., van, d. B., Koeter, M. W. J., de Ridder, Maria A. J., Stijnen, T., & van,
d. B. (2003). Dialectical behaviour therapy for women with borderline
personality disorder: 12-month, randomised clinical trial in the netherlands. The
British Journal of Psychiatry, 182(2), 135-140. doi:10.1192/bjp.182.2.135

100
Vitaliano, P. P., Russo, J., Carr, J. E., Maiuro, R. D., & Becker, J. (1985). The ways
of coping checklist: Revision and psychometric properties. Multivariate
Behavioral Research, 20, 3-26.
Watson, D. & Clark, L. A. (1994). The PANAS- Manual for the positive and
negative affect schedule-expanded form. Iowa City: The University of Iowa.
Weissman, M. M., & Bothwell, S. (1976). Assessment of social adjustment by
patient self-report. Arch Gen Psychiatry, 33, 1111–5.
Widiger, T. A., & Weissman, M. M. (1991). Epidemiology of borderline personality
disorder. Hospital and Community Psychiatry, 42(10), 1015-1021.
Williams, K. E., Chambless, D. L., & Ahrens, A. (1997). Are emotions frightening?
An extension of the fear of fear construct. Behavior Research and Therapy,
35, 239-248.
World Health Organisation. (1992). The ICD-10 classification of mental and
behavioural disorders: clinical descriptions and diagnostic guidelines.
Geneva, World Health Organization.
Wright, A. G. C., Hallquist, M. N., Beeney, J. E., & Pilkonis, P. A. (2013).
Borderline personality pathology and the stability of interpersonal problems.
Journal of Abnormal Psychology, 122(4), 1-16.
Yen, S., Johnson, J., Costello, E., & Simpson, E. B. (2009). A 5-day dialectical
behavior therapy partial hospital program for women with borderline personality
disorder: Predictors of outcome from a 3-month follow-up study. Journal of
Psychiatric Practice, 15(3), 173-182. doi:10.1097/01.pra.0000351877.45260.70

101
Young, J.E. (1998). Young Schema Questionnaire (short form). New York:
Cognitive Therapy Centre.
Zanarini, M. C. (2003). Zanarini rating scale for borderline personality disorder
(ZAN-BPD): A continuous measure of DSM-IV borderline psychopathology.
Journal of Personality Disorder, 17(3), 233-242.
Zanarini, M. C., Frankenburg, F. R., Sickel, A. E., & Young, L. (1996). Diagnostic
interview for DSM-IV personality disorders. Boston, MA: McLean Hospital.
Zimmerman, M., & Mattia, J. I. (1999). Axis I diagnostic comorbidity and borderline
personality disorder. Comprehensive Psychiatry, 40(4), 245-252.
doi:http://dx.doi.org/10.1016/S0010-440X(99)90123-2
Zittel Conklin, C., Bradley, R., & Western, D. (2006). Affect regulation in
Borderline Personality Disorder. The Journal Nervous and Mental Disease,
194(2), 69-77.

102
Appendix A. Guidelines for authors from Clinical Psychology Review
Removed for ethesis
103
Research Part 2
Predictors of response to Systems Training for Emotional Predictability and Problem Solving (STEPPS) for the treatment of Borderline
Personality Disorder
Word Count: 9,994
Abstract

104
Background: Systems Training for Emotional Predictability and Problem Solving
(STEPPS) has proven useful in the treatment of Borderline Personality Disorder
(BPD). Researchers have begun to examine how individual differences relate to
treatment outcomes in this client group. Severity has been the most consistent
predictor of treatment outcome identified so far. However, BPD is a heterogeneous
diagnosis incorporating a large variety of presentations and symptom profiles. This
research examined the predictive influence of severity as a unidimensional construct
before breaking this variable down by BPD symptom and examining the predictive
influence of each criterion on STEPPS outcomes.
Method: Quantitative, naturalistic data was collected from STEPPS groups across the
South East of England. Baseline measures of overall and symptom level severity
were examined and weekly measures of BPD severity were used to measure
treatment response.
Results: Missing data from drop-out was high. Two approaches to managing missing
data were explored and analyses were run using both; similarities and differences are
discussed. Participants made significant improvements following treatment.
Regression analyses demonstrated an overall effect of severity on outcomes but only
when a deletion approach to missing data was used. Dissociation was the most
reliable symptom level predictor of outcome.
Conclusion: Results are discussed in the context of techniques for management of
missing data. Significant predictors, severity, dissociation and identity disturbance
are discussed in relation to the existing literature. Limitations are discussed along
with recommendations for future research.
Introduction
105
Borderline Personality Disorder (BPD) is a diagnosis which encompasses a wide
range of presentations differing in severity, symptom combination and symptom
severities (American Psychiatric Association [APA], 2001). An overview of these
symptoms can be found in table 1. Individuals with BPD do not only vary in their
symptom presentation but also in their response to treatment (Lana & Fernandez-San
Martin, 2013). Identifying factors which predict treatment response would be
beneficial to our understanding of treatment suitability and help us individualise
treatments. One way of examining this is to investigate whether any of the individual
characteristics of the people entering treatment can be used to predict the variance in
treatment outcomes. Researchers have begun to examine BPD-related predictors of
outcome. This study aims to contribute to this body of research and extend the
existing findings about predictors of outcomes for Systems Training for Emotional
Predictability and Problem Solving (STEPPS; Harvey, Black, & Blum, 2010).
Although BPD is relatively uncommon in the general population (1.16%, Stone,
2006) there are incongruently higher numbers of individuals with BPD in mental
health services, with a prevalence of 15% within inpatients (Widiger & Weissman,
1991), and suicide rates significantly higher than the general population (Pompili,
Girardi, Ruberto, & Tatarelli, 2005). BPD is often synonymous with high risk to self
and has historically been considered difficult to treat (Stone, 2006). This can result in
high levels of emotional distress due to repeated crises (National Institute for Health
and Care Excellence [NICE], 2009). Treatment of BPD incurs a significant cost to
the NHS and prevalence of BPD is associated with additional costs to social services
and wider society (NICE, 2009).
Table 1

106
Symptoms of BPD and definitions provided by the Diagnostic and Statistical Manual- Version four-text revised (2000).
Symptom Definition
Avoids abandonment Frantic efforts to avoid real or imagined abandonment
Unstable relationships A pattern of unstable and intense interpersonal relationships characterized by alternating between extremes of idealization and devaluation
Identity disturbance Markedly and persistently unstable self image or sense of self
Impulsivity Impulsivity in at least two areas that are potentially self damaging
Suicidal or Self-Mutilative Behaviours
Recurrent suicidal behaviour, gestures, or threats, or self mutilating behaviour
Affective Instability Affective instability due to a marked reactivity of mood
Inappropriate Anger Inappropriate, intense anger or difficulty controlling anger
Emptiness Chronic feelings of emptiness
Dissociation/Stress-Related Paranoid Ideation
Transient, stress related paranoid ideation or severe dissociative symptoms
A large systematic review of psychotherapeutic treatment of BPD was conducted by
the Cochrane centre (Stoffers et al., 2012) which concluded that there was evidence
for the beneficial effects of psychological treatment for BPD, particularly for
Dialectic Behavioural Therapy (DBT; Linehan, 1993), but a definite need for further
research into these treatments. Other treatments with a reviewed evidence base
included Mentalisation Based Therapy (MBT; Bateman & Fonagy, 2004), Schema
Focused Therapy (SFT; Kellogg & Young, 2006) and Systems Training for
Emotional Predictability and Problem Solving (STEPPS; Harvey et al., 2010) which
is a skills based group program designed to help with emotion regulation. According
to the self-determination theory (SDT; Ryan, 2005), skills based groups, such as

107
STEPPS, provide alleviation from distress by directly teaching people with BPD the
skills they failed to acquire during normal development due to environmental
deficits. These skills are necessary to manage stress or get our basic psychological
needs met. STEPPS has produced good outcomes using a relatively short-term
treatment program (Bos, Bas van Wel, Appelo & Verbraak, 2011). Considering the
ever-increasing demands on NHS finances and resources, the increased interest in
short-term treatments for BPD such as STEPPS is understandable. These treatments
are not only more cost effective but may have an advantage over longer term
treatments in dealing with the high attrition rates observed in individuals with BPD
(Hopwood, 2006).
Despite a number of effective talking therapies for BPD, the degree to which
individuals benefit from treatment still varies significantly. For example, Bohus et al.
(2004) examined a short-term DBT program and found that while 50% of their
participants made clinically significant improvements, the other 50% did not. A more
recent study predicted that as many as 40% of people diagnosed with BPD who
request treatment may not benefit from it (Lana & Fernandez-San Martin, 2013).
Bos et al. (2011) found that 65.4% of participants showed reliable change following
STEPPS treatment and 21.2% also made clinically significant change. While this is a
respectable level of improvement, there remained 34.6% of participants who did not
make reliable improvements, demonstrating that some people with BPD are more
suited to STEPPS than others. Understanding what underlies this suitability and, in
turn, who is most suited to STEPPS would be practically, financially and ethically
advantageous.

108
As a diagnostic category, BPD incorporates a wide array of individual differences
which might lead us to expect variations in the degree to which people respond to
treatment. There have been a number of non-BPD specific client factors which have
been identified as influencing treatment suitability, including coping style (Beutler &
Moos, 2003), resistance potential (Beutler et al., 1991), motivation and intelligence
(Luborsky, Auerbach, Chandler, Cohen, & Bachrach, 1971) and attachment (Levy,
Meehan, Temes, & Yeomans, 2011). Alongside the typical range of demographic
and severity variables found within psychiatric diagnoses, individuals with BPD also
present with an assortment of co-morbid diagnoses which are the rule rather than the
exception in this population (Zimmerman & Mattia, 1999).
Within the available literature on predictors of treatment outcome for BPD, few
consistent predictors have been identified, with demographics and co-morbid
diagnoses failing to predict response (Barnicot et al., 2012). The most consistent
predictor of treatment response identified thus far is severity of BPD (Barnicot et al.,
2012). Research demonstrates that participants with more severe BPD symptoms
prior to treatment show greater improvements (Black, Blum, McCormick, & Allen,
2013; Gratz, Dixon-Gordon, & Tull, 2014; Black et al., 2009; Bos et al., 2011). Gaw
and Beutler (1995) discussed problem severity and its relationship with motivational
distress. These authors suggest that subjective distress can motivate people to seek
and engage in treatment to reduce distress whereas those with lower severity may
feel more ambivalence towards change. This could provide an explanation for why
more severely affected individuals shower greater improvements from treatment.
Further replication of this effect of severity in different settings would be beneficial.
109
Within this overarching severity variable, the BPD diagnosis catalogues a wide range
of presentations which all meet Diagnostic and Statistical Manual-Text Revised, 4th
Edition (DSM-IV-TR, 2000, APA) criteria. Nine BPD criteria are outlined in the
DSM (see table 1). To reach diagnosis a person is required to meet five or more of
these criteria, allowing for over 150 different symptom profiles (Sanislow et al.,
2002). This huge variety of symptom profiles creates huge diversity in the
presentations and experiences of people with BPD.
Due to the significant heterogeneity in the symptoms of people with BPD and the
varied severities of each of these symptoms, it is useful to look at the influence of
each symptom separately in order to understand the contribution of each on the
variability in treatment response. As BPD is such a varied concept in and of itself,
using an overall severity score runs the risk of masking important individual
differences, which may account for differences in treatment response.
Following research examining naturally occurring changes in BPD symptoms over
time, Zanarini et al. (2007) proposed that symptoms fall into two categories: acute
symptoms which emerge during specific and acute periods of illness and have a
faster rate of remission and temperamental symptoms which are more enduring
features of BPD. Zanarini et al. (2007) argue that primarily treating acute symptoms
could be to the detriment of the psychosocial functioning of individuals with BPD
which is closely linked with temperamental symptoms.
Some researchers have examined the predictive power of different BPD symptoms
on treatment outcome. This pool of research is inconsistent in its selection of the
symptoms it examines, methodological design, treatment modality and measures
used. Unsurprisingly, the findings are equally inconsistent (Bohus et al., 2004;

110
Kleindienst et al., 2011; Arntz, Stupar-Rutenfrans, Bloo, van Dyck, & Spinhoven,
2015; Gratz et al., 2014; Black et al 2009; Yen, Johnson, Costello, & Simpson,
2009). In addition, few studies have examined all BPD symptoms within the same
study. One study which did examine the predictive power of each of the DSM-IV-TR
(APA, 2000) criteria was conducted by Yen et al. (2009). The authors identified that
higher emptiness ratings predicted greater improvements following a 5-day DBT
program which they suggest could be due to the intense social component of this 5-
day group treatment, however this finding does require replication. Emptiness is
classified as a temperamental symptom making it interesting that it is predictive of
outcomes in such a short-term treatment. These authors also note that identity
disturbance might be problematic for shorter term therapy, however it is unclear, at
this stage, how short-term a treatment would need to be for identity disturbance to be
problematic, as this 5-day treatment is particularly short for a BPD treatment.
Identity disturbance is considered an acute symptom so can be expected to show
faster rates of improvements. Two studies examining longer-term treatments
(Lenzeweger, Clarkin, Levy, Yeomans & Kernberg, 2012; Bellino, Bozzatello &
Bogetto, 2015) found higher baseline identity disturbance to be predictive of larger
improvements following treatment. Two studies examining DBT found unstable
relationships to be related to greater improvements (Bohus et al., 2004; Yen et al.,
2009) which fit with its positioning as an acute symptom, although one study failed
to replicate this finding (Kleindienst et al., 2011) meaning it would benefit from
further investigation. Impulsivity and deliberate self harm have not reliably predicted
outcomes (Bellino et al., 2015; Arntz et al., 2015; Yen et al., 2009) or have been
related to poorer outcomes (Ryle & Golynkina., 2000; Gratz et al., 2014). Despite
deliberate self-harm (DSH) being a symptom which changes most readily in

111
community samples, in treatment baseline DSH does not predict more generalised
improvements in BPD or general psychopathology. Further research in this area
could enhance our understanding of who is suited to which treatment as it is likely
that individuals with different presentations may require different treatment strategies
(Livesley, 2012). Despite repeated findings that BPD severity predicts STEPPS
outcome (Black et al., 2013; Black et al., 2009; Bos et al., 2011) researchers have not
yet examined the impact of the different BPD symptoms on STEPPS outcomes.
In the current study predictors of outcome were examined using a measure of BPD at
the beginning of treatment and a weekly measure of symptom change to identify
factors predicting improvements in BPD following STEPPS.
The research begins by looking to replicate the finding that severity of BPD, as a
unidimensional construct, is a useful predictor of treatment outcome using STEPPS
treatment within NHS England settings. The BPD diagnosis was then broken down
into its separate DSM-IV-TR defined symptoms to examine the predictive influence
of each of the individual symptoms on treatment response. None of the existing
research on symptom level predictors has examined STEPPS treatment and there are
inconsistencies in the research using other treatment models so there is a degree of
exploration in this area of the research, however hypotheses were developed based
on the findings from other skills based treatments (largely DBT).
Hypotheses:
1. There will be a statistically significant improvement in BPD symptoms, from
the start to the end of treatment.

112
2. Greater overall symptom severity at the start of treatment will predict
significantly greater BPD symptom improvements following STEPPS.
3. Symptoms of emptiness, identity disturbance and unstable relationships
severity will be related to significantly greater improvements. Impulsivity and
suicidal/self harm behaviours will not predict treatment outcome.
Severity has been found to be predictive of STEPPS outcomes, this study makes the
logical next step of deconstructing and dissecting the ‘severity’ variable into its
individual symptoms to predict STEPPS outcomes. It is hoped that this will add to
our understanding of how different individuals with BPD respond to STEPPS. In
turn, it is hoped that this will move us closer towards an understanding of treatment
suitability which could ultimately contribute to reduced costs from unsuccessful or
unsuited treatment and provide clients with the best opportunity for positive
treatment outcomes.
Method
Design
A quantitative longitudinal naturalistic design was used to explore treatment
response using data from National Health Service (NHS) STEPPS treatment groups1.
1This research project is one third of a larger research project on STEPPS treatment. Two other research projects (URN: 6338462 and URN: 6339971) utilised the same participant group of STEPPS group members to answer different research questions. Materials were developed together and disseminated only once. A full list of measures collected across all three projects can be found in appendix B, highlighting the time point when they were collected and a list of measures used by each of the projects can be found in appendix C. Data collection was divided equally between each of the researchers as was data entry. All data analysis and written work was done individually for each separate research project.
113
Quantitative outcome measures were taken over three time points (repeated
measures): T1 (session 2), T2, (session 10) and T3 (session 20). Data was explored
using quantitative statistical analyses.
The dependent variable was change in BPD symptomatology measured using the
Borderline Evaluation of Symptoms over Time (BEST; Blum, Pfohl, John, Monahan
& Black, 2002) total score which was taken weekly over the 20 week program.
Predictor variables were measured using the Zanarini BPD self-report measure
(ZAN-BPD) (Zanarini & Frankenburg, 2008). The following variables were defined:
Severity of BPD, measured using ZAN-BPD total score,
Individual symptom severity using the ZAN-BPD individual item scores.
Participants
85 participants were recruited across three mental health NHS trusts in the south of
England. All members of STEPPS treatment groups over participating sites were
invited to take part in the study between March 2016 and December 2016.
Participants gave written informed consent to partaking in the research, according to
the procedure approved by South East Coast, Surrey Research Ethics Committee,
and were made aware that they could withdraw from the study at any time.
Five participants (5.9%) withdrew from the study and their data was destroyed. Data
from three participants were removed as they were missing all independent variable
data, and a further six were removed as they were missing all outcome variable data,
leaving a final sample of 71 (see CONSORT diagram in figure 1). Initial power
calculations stipulated that for an effect size of 0.8 with a ‘Linear multiple regression:
fixed model, R2 increase’ between 55-77 participants were required. Attrition rates
114
from previous research (Barnicot, Katsakou, Marougka, & Priebe, 2011) and
discussions with group facilitators were used to make estimations around attrition.
Unfortunately a number of the sites within the study experienced a higher than
expected rate of attrition which reduced the number of participants for the study. Of
the final 71, 46 attended up to or beyond session 15. 35.2% dropped out of treatment
before session 15 and were classified as non-completers. Differences between
completers and non-completers are explored in the results. This attrition rate was
higher than the 25% observed in the 2011 systematic review and meta-analysis of
drop-out from BPD psychotherapy (Barnicot et al., 2011) but is close to the attrition
rate of 36% observed in a preliminary study of STEPPS treatment within the U.K
(Harvey et al., 2010).
Figure 1: CONSORT Diagram showing number of participants at different stages of
the study.

115
Participant ages ranged from 18-58 (mean: 31.94, median: 30). 90.1% were female
and 85.9% reported having a formal diagnosis of BPD. Different NHS Trusts used a
number of methods for assessing suitability for treatment and BPD diagnosis
including standardised measures and clinical interviews. 15.5% of participants were
undergoing an additional therapy during this time, alongside a few participants
engaged in family therapy and CBT, most reported attending ‘psychotherapy’ which
made it difficult to be certain of the range of interventions participants were engaged
in. 7% of participants had engaged with a previous STEPPS treatment but only 1.4%
had previously completed STEPPS. These confounding variables were entered into
statistical analyses to examine any potential bias. See table 2 for further details on
demographics.
Table 2: Table of demographics for participant who completed measures at date collection time points
T1 T2 T3
N 71 36 30
Age in years
(SD)
31.94
(10.78)
38.00
(11.15)
35.22
(14.04)
Gender
Female
Male
90.1%
9.9%
83.3%
16.7%
80.0%
20%
The inclusion criteria for this study matched the inclusion criteria for being accepted
into a STEPPS treatment group. These criteria were as follows: being over the age of
18, having a diagnosis of BPD or BPD traits, motivation and ability to work with a
group and to complete homework tasks. Group members were assessed for treatment
suitability using clinical interviews and standardised assessment measures by group

116
facilitators. Participants were counted as “completers” if they attended to at least
session 15 of a possible 20 sessions; Black et al. (2009) suggest 15 sessions of
STEPPS is the threshold for optimal improvements. The STEPPS program allows
participants to miss a maximum of three sessions, however the data suggested that
this is not consistently followed as 16.9% of participants had data missing from three
consecutive weeks but then continued with treatment. In order to maximise
participant numbers and to work in line with what was being observed in clinical
practice, these participants were included in analyses.
Exclusion criteria also match those of the STEPPS group which prevents the
inclusion of participants with severe self-harm, eating difficulties or substance
misuse behaviours as well as significant risk of violence.
Data collection tools
Measure of dependent variable. The BEST (Blum et al., 2002) was used to
measure change in BPD symptoms (appendix D). The BEST measures BPD severity
and is sensitive to clinical change. It was developed for use within the STEPPS
treatment program and is routinely administered during each session. It is a 15 item
self-report measure which has demonstrated moderate test retest reliability (r=.62)
and high internal consistency (Cronbach Alpha 0.86) with individuals with BPD
about to undergo STEPPS treatment (Pfhol et al., 2009). The internal consistency
from this sample is taken from T1 BEST scores. Items 13-15 on the BEST are
positively worded while all other items are negatively worded, to correct for this,
these items were reverse scored prior to calculating Cronbach’s Alpha. The
Cronbach’s Alpha coefficient for this sample was 0.82, demonstrating good internal
consistency. Pfhol et al. (2009) found a baseline mean of 38.7. In this study,

117
participants had a mean T1 BEST score of 45.77, with higher scores indicating more
severe BPD. Each of the 15 items is rated on a scale of 1-5 and an equation is
provided for calculating a BEST total score. In this study, the BEST was completed
by each participant at each session they attended; these were collected during the
course of the program at T1, T2 and T3.
Measure of predictor variables. All predictor variables within this study are
related to BPD symptomatology and, as such, can be measured using different
dimensions of the Zanarini rating scale of Borderline Personality Disorder (ZAN-
BPD) self-report version (Zanarini & Frankenburg, 2008). The ZAN-BPD is a 9 item
questionnaire which was designed to map on to the 9 DSM-IV-TR (APA, 2000)
criteria for BPD. A self-report version of the ZAN-BPD was published in 2008
(Zanarini & Frankenburg, 2008, see appendix E), this measure was selected as it
reduced facilitator burden as it could be given directly to participants to complete.
The ZAN-BPD provides a severity score for each of the BPD criteria on a likert scale
from 0-4; these scores are summed to provide a total severity score. Higher scores
indicate more severe symptoms. This measure was used to assess all the independent
variables in this study, this was designed to avoid participant burden in light of this
study being only one third of a larger STEPPS research project and to minimise the
number of measures participants were asked to complete. This was done to reduce
the impact on treatment engagement and reduce the number of participants dropping
out of the research trial. This appeared to have been effective as only 5.9% of
participants left the research trial. The ZAN-BPD has demonstrated high convergent
validity with the interview version (median .70) and demonstrated good internal
consistency (.84). The test-retest reliability was in the excellent range (>.75)

118
(Zanarini, Weingeroff, Frankenburg, & Fitzmaurice, 2015). Within this study the
ZAN-BPD had a Cronbach’s alpha of 0.64. This is lower than ideal. It is possible
that the high heterogeneity within the BPD diagnosis led to a violation of Cronbach’s
alpha’s assumption of unidimensionality. Some have suggested that BPD can be
better understood as multiple subgroups rather than a unidimensional construct
(Andión et al., 2011) which may have led to the violation of the assumption of
unidimensionality. Kline (1999) states that when dealing with psychological
constructs values below 0.7 can be expected due to diversity in the constructs being
measured.
ZAN-BPD total score was used as a measure of BPD severity as a predictor of
outcome. Separate items of the ZAN-BPD were used to provide a measure of each of
the nine separate symptoms of BPD as outlined by the DSM-IV-TR (APA, 2000).
Predictor variables were measured at T1.
Covariate variables. Additional variables which could influence outcomes
were measured as covariates; these were identified through discussions with STEPPS
facilitators, consultation with graduates of STEPPS treatment and reviewing the
research literature. These variables were measured using a demographics sheet
provided at T1 (appendix F). Information was gathered on additional treatments,
previous engagement in STEPPS or other forms of treatment, BPD diagnosis and
years since receiving diagnosis. Individual groups were coded for, in order to explore
differences caused by variations in group related factors. Although the manualised
nature of STEPPS should reduce some of this variation it was still deemed important
to account for facilitator style, therapeutic relationship and group dynamics which
may vary between sites and individual groups.

119
Additional demographic details were not included as covariates as a previous review
on predictors of treatment outcomes for BPD found demographics such as age and
gender to be unrelated to outcomes (Barnicot et al. 2012).
Description of treatment program
STEPPS is a 20 week group program (see appendix G for a breakdown of STEPPS
content). The treatment is for outpatients with BPD or traits of BPD. The program is
based on CBT principles and is a skills based group which consists of three
components, psychoeducation around BPD, emotional management skills and
behavioural management skills (Black, Blum, Pfohl, & John, 2004).
14 STEPPS groups were recruited from over the south of England. Facilitators of the
program were Clinical Psychologists, Assistant Psychologists, Counselling
Psychologists, Occupational Therapists, Mental Health Nurses, Social Workers and
Therapy Assistants. All group facilitators attended some form of supervision with
65.8% of facilitators attending STEPPS specific supervision. 34.2% did not specify
the type of supervision but reference was made to peer and group supervision,
debrief and reflection sessions. 26.3% of facilitators stated that they had undergone
STEPPS training. These arrangements were in place to ensure adherence to the
treatment model. Collection of this general information about the groups for use as
covariates in the regression analyses was discussed with and agreed by the South
East Coast Research Ethics Committee (see details in appendix H). Information
about supervision and training arrangements and professional composition of
facilitator teams was recorded (see appendix I). No identifiable information was
gathered about individual facilitators, and they were not participants in this research.
120
As such, it was agreed that consent did not need to be gained for collection of this
information.
Procedure
A more detailed breakdown of the procedure, which was provided to group
facilitators, can be found in appendix J:
STEPPS is a manualised program so the group sessions and routine data
collection were expected to be similar across trusts which allowed for
combined data analysis
Researchers attended the introductory session of each group to provide
potential participants with information about the project as well as a written
information sheet (appendix K). Researchers also delivered to each service
T1, T2 and T3 pre-prepared measures at this time in case of a situation where
researchers were unable to attend a data collection point.
Participants were given a week to look over the information sheet and
consider their participation. Researchers attended session 2 to gather
informed consent (appendix L) from those who wished to participate and took
the T1 measures (see appendix B for measures collected at each stage of the
research, including those from the larger research trial). In relevance to this
study, the ZAN-BPD was an additional measure to what is routinely gathered
during STEPPS and was gathered at T1 after consent was given. During the
consent procedure, participants were asked if they would like to be entered
into a prize draw for one of three Amazon vouchers, if they wished to be
entered they were asked to provide a contact email or home address.

121
Participants were assigned a unique research number, known only to the
research team. Each pack of additional measures had a site code and
participant number attached. A key of participant codes was kept on a secure
drive which was password protected for researchers to identify any
participant who wished to withdraw from the study.
Researchers attended sessions at T2 and T3 to collect the additional measures
from group members participating in the study and photocopied the routinely
collected (BEST) measures. All data was anonymised on site so no
identifiable information was taken off-site.
On the six occasions where researchers were unable to attend a data
collection session the group facilitators placed the box with the additional
measures in the group room for participants to complete and return to the
box. The measures were in labelled envelopes for participants to complete.
These were collected by a researcher at the next available date. Lead
facilitators were consulted prior to agreeing to participate in the research and
agreed to make the box of measures available to participants in the case of a
researcher not being able to attend a data collection time point.
Group facilitators made the routinely collected data (BEST measures)
available to researchers; these were photocopied and anonymised on site.
Originals were left at the service.
Measures were stored securely at the University of Surrey. Data from
participants who withdrew their consent during the duration of group was
destroyed.
Participants who requested a copy of the results were sent a summary report
including information from all three studies upon completion of the project.

122
Ethics
The research was sponsored by the University of Surrey Research Integrity and
Governance Office and was approved by the NHS Multi-Site Research Ethics
Committee (appendix M). R&D approval was gained from each of the NHS trusts
partaking in the research (appendix N). Participant numbers were used to ensure
participant confidentiality. Data was held in accordance with the Data Protection Act,
1998 (Gov.uk, 2015).
Analytic Strategy
Weekly BEST measures were taken for each participant over the 20 week program.
A median BEST total score was taken from the first half of the program (week 1-10)
and a median from the second half of the program (week 11-20). A median score was
selected as it is less biased by extreme scores (bad week or stressful session or
natural fluctuation) (Manikandan, 2011). After the data was cleaned and examined
through descriptive statistics, the reliability of measures were established using
Cronbach’s Alpha and comparisons between completers and non-completers were
statistically explored using t-tests.
Hypothesis 1: T-tests were performed to examine change over the course of
treatment along with reliable change and clinically significant change (Jacobson &
Truax, 1991).
To examine predictors of treatment outcome, the first stage was to determine which
of the T1 predictors or covariates showed any relationship to change on the BEST.
This was done by looking at correlations between variables.

123
The dependent variable for regression analyses was to be BEST Median 2. BEST
Median 1 would be entered into the first step of the regression to account for
participants’ scores at the start of treatment. If predictor variables were too highly
correlated with BEST Median 1(moderate to strong correlation), resulting in
multicollinearity, then a BEST Change score (BEST Median 2 subtracted from
BEST Median 1) could be used as an alternative dependent variable.
Hypothesis 2: Hypothesis 2 would be tested by entering ZAN-BPD total score from
T1 into a regression model predicting the variance in BEST outcomes.
Hypothesis 3: Regression models would be produced to examine which T1 variables
were jointly predictive of BEST outcome. Predictors which had demonstrated a
relationship with either BEST Change or BEST Median 2 would be entered into the
models.
Non-significant contributors would be dropped from the model using a criteria of
p>0.2, to identify the simplest model which predicts the largest amount of variance.
A cut-off of 0.2 was chosen to avoid the removal of important variables which are
controlled for within the model (Kirkwood & Sterne, 2003). Statistical analysis was
completed using SPSS (IBM Corp., 2015).
Additional data
Qualitative data was gathered alongside the quantitative data outlined above. The
responses to the qualitative questions were not deemed to contribute towards
answering the research questions. This information was analysed and can be found in
appendix V. Participants’ answers were often very brief and respondents did not
focus on what aspects of themselves made them suitable or unsuitable to STEPPS

124
and often focused on what they enjoyed or did not enjoy instead. The categories
which emerged from the content analysis did not address the research question which
is why it is not included in the main report. Follow up data was also gathered but
due to a low response rate that would have decreased the power of the analyses, this
data was not included in the analyses. A descriptive exploration of this data can be
found in appendix W.
Results
The results are based on the analysis of 71 participants. The data was cleaned
through examination of maximum and minimum values and the range to identify any
values entered in error, these were corrected using the original data files. No data
was excluded at this stage.
Missing Data
One participant was missing three ZAN-BPD subscores (1.4% of the independent
variable). Little’s MCAR test was performed to check the assumption that this
missing data occurred at random, this test was not significant (chi squared= 10.95,
df= 6, p=.10) demonstrating that the missing data was likely to have occurred at
random. This allowed for the use of Expectation Maximisation (Dempster, Laird, &
Rubin, 1977) to replace these missing values2.
Missing values were much higher across the dependent variable. Median 1 from the
first half of the STEPPS program had 0% missing data, Median 2 had 32.4% missing
data. This reflects participant’s gradual drop out of treatment across the 20 week
program.
2 Analyses were repeated with deletion of this participant and results did not significantly differ.

125
An important statistical decision focused on how to manage this high rate of missing
data. One approach was to use pairwise deletion, this retains the precision but
reduces participant numbers and, in turn, the power of analyses. Some authors have
argued that if there is adequate power for testing hypotheses then deletion is
preferable (Cheema, 2014). Expectation Maximisation (EM) provides another
approach to coping with missing data. This method is based on the assumption that
the data is truly missing at random. Little’s MCAR test confirmed that the missing
BEST data did occur at random; however, Gelman and Hill (2007) query whether
missing data can genuinely be missing at random or whether missingness will
depend on unexamined variables. There are strong arguments for estimating missing
data even when the amount of data missing is large and when data is missing due to
attrition (Graham, 2009). It is argued that this increases the power of analyses and
can protect against biasing from selective drop-out. To manage the pros and cons
associated with these different methods, analyses were conducted first using the
deletion approach and then conducted again following EM with a full estimated
dataset. Results from the two approaches are compared and considered within the
discussion3.
Descriptive Statistics
Descriptive statistics were calculated for each of the independent variables measured
via the ZAN-BPD (total score and individual symptom scores) and on the two BEST
Median scores and the BEST Change score.
Table 3. Table of descriptive statistics of BEST scores (dependent variables)
3 Intent to treat analyses were also performed. Using ITT approach no predictors made significant contributions to understanding the variance in Median 2 given participants’ scores at Median 1. This was likely due to the high rate of drop-out and conservative statistical approach.

126
N Mean SD Skewness Kurtosis BEST Median 1 71 44.08 9.86 -.185 .317BEST Median 2 48 38.10 11.18 -.556 -.047BEST Change score 48 4.79 9.06 -.857 2.018BEST Median 1 post EM 71 43.60 9.02 -.344 .279BEST Median 2 post EM 71 39.96 10.41 -.495 .091BEST Change post EM 71 3.64 8.45 -.495 1.048
Table 4. Descriptive statistics of ZAN-BPD scores (Predictor variables)
N Mean SD Skewness Kurtosis
ZAN-BPD total score 71 20.66 5.47 -.192 -.128
ZAN-BPD Anger 71 2.35 1.04 -.370 -.197
ZAN-BPD Affective instability 71 3.01 0.96 -.916 .480
ZAN-BPD Emptiness 71 2.70 1.02 -.368 -.588
ZAN-BPD Identity disturbance 71 2.46 1.19 -.304 -.831
ZAN-BPD DSH 71 1.70 1.44 .273 -1.271
ZAN-BPD Impulsivity 71 2.06 1.32 -.106 -1.017
ZAN-BPD Dissociation 71 2.63 1.11 -.316 -.992
ZAN-BPD Fear of abandonment 71 1.96 1.33 .080 -1.174
ZAN-BPD Relationship instability 71 1.77 1.23 .163 -1.030
Tests of normality. Z scores were calculated from Skewness and Kurtosis
values and compared to a 1.96 criteria to establish whether these values were
significant (at .05 level). See appendix O and P for further details.
Visual inspection of histograms and boxplots (appendix O and P) suggest that most
of the data was normally distributed enough for parametric testing; the one exception
was DSH. Where necessary, a non-parametric equivalent was used when exploring
this variable.
Change over course of treatment

127
To test hypothesis 1 t-tests were used to compare scores at the start and end of
treatment. There was a statistically significant reduction from Median 1 (M: 44.08) to
Median 2 (M: 38.10) in BEST scores, t= 3.66, df= 47, p=.001. This change remained
significant to the same degree when using the full estimated sample (t=3.63, df=70,
p=.001), supporting the hypothesis that there would be a significant improvement in
BPD symptoms over the course of treatment. Reliable change index (RCI) (Jacobson
& Traux, 1991) was calculated using the full sample (N=71) as this is a better
estimate of the population tendency. The RCI was 10.61. The mean change did not
reach a level which would be categorised as a reliable improvement. Only 25% of
those who had a BEST change score (N=48) made a positive change of this degree
and only 18.31% of the full estimated sample. No participants made clinically
significant change (using criterion A: 25.25) (Jacobson & Traux, 1991) in either
sample.
Comparisons of completers and non-completers
Participants who attended STEPPS up to and beyond session 15 were sent follow-up
questionnaires (see appendix W for further information) and, as such, were
pragmatically classified as completers. 46 participants attended to at least session 15,
compared to 25 who dropped out before session 15. Comparisons of these groups
were examined to explore any significant between group differences. An alternative
cut-off point for completers (session 18), based on STEPPS criteria of a maximum of
3 sessions that can be missed, was also calculated and can be found in appendix Q.
Cut-off at session 15 was used as it more closely matched the procedure for
administering follow-up questionnaires.
128
Completers were compared to non-completers on each of the T1 measures using t-
tests (except DSH which was compared using Mann Whitney U test). The only
variable which the groups significantly differed on was emptiness. There was a
significant difference in the scores of completers (M= 2.52, SD= 1.049) and non-
completers (M=3.04, SD=0.89; t= 2.09, df= 69, p=.04) with non-completers having
significantly higher emptiness scores at T1. The magnitude of this difference (mean
difference= .518, 95% CI: .025 to 1.012) was moderate (eta squared=.06) according
to Cohen’s 1988 criteria.
Correlations between predictor and dependent variables
Relationships between independent variables and BEST dependent variables (BEST
Median 2 and BEST Change score) were explored through correlation statistics and
are summarised in table 5 and 6 (further information and correlation with covariates
can be found in appendix R). Spearman’s rho is reported. The variables identified for
entering into the regression analyses did not differ from when Pearson’s correlations
were used for continuous variables so Spearman’s rho is reported throughout for
consistency and clarity. Separate calculations were completed for the pairwise
deletion sample and the full estimated sample. These statistics were run to identify
the variables which show a relationship with the dependent BEST variables and
filters down which would be entered into the subsequent regression models.
Using the pairwise deletion sample the only confounding variable with a significant
correlation with BEST Change was psychiatric inpatient service usage (p=.008).
None of the confounding variables had a significant relationship with BEST Median
2 (see appendix R for covariate correlations).

129
ZAN-BPD total score had a significant relationship with BEST Median 2 (p=.037).
Dissociation significantly correlated with BEST Median 2 (p=.003). Identity
disturbance significantly correlated with BEST Change score (p=.016) as did
Relationship instability (p=.048).
Using the full estimated sample, again, the only confounding variable with a
significant correlation was psychiatric inpatient service usage with BEST Change
(p=.009) (appendix R). Looking at the predictor variables ZAN-BPD total score had
a significant relationship with BEST Median 2 (p=.017). Emptiness significantly
correlated with BEST Median 2 (p=.024) as did Dissociation (p=.001) and
Relationship instability significantly correlated with BEST Change score (p=.039).

130
Table 5: Inter-correlation matrix for severity and symptom variables with BEST dependent variables using pairwise deletion sample N=48
BESTMed1N=48
BESTMed2N=48
BESTChangN=48
ZanTotal
N=48
ZanAngerN=48
ZanAffectN=48
ZanEmptiN=48
ZanIdentiN=48
ZanDSHN=48
ZanImpulsN=48
ZanDissocN=48
BESTMed1 N=48
1.000 .557** .217 .735** .315* .409** .213 .343* .434** .522** .440**
BESTMed2 EMN=48
1.000 -.618** .302* .148 .059 .130 -.051 .127 .219 .423**
BESTChang EMN=48
1.000 .228 .110 .176 -.068 .346* .259 .142 -.166
ZanTotalN=48 1.000 .504** .530** .267 .506** .514** .572** .648**
ZanAngerN=48 1.000 .335** -.051 -.095 -.004 .321* .222
ZanAffectN=48 1.000 .212 -.014 .138 .365* .209
ZanEmptiN=48 1.000 .409** -.158 .001 .335*
ZanIdentiN=48 1.000 .442** .063 .273
ZanDSHN=48 1.000 .313* .136
ZanImpuls N=48 1.000 .309*
ZanDissocN=48 1.000
ZanAband N=48ZanRelatiN=48Correlations using the pairwise deletion sample (N=48). Spearman’s rho is reported. The variables identified for entering into the regression analyses did not differ when Pearson’s correlations were used for continuous variables so Spearman’s rho is reported throughout the table. Correlation in bold were examined to establish severity and symptom level predictors with a relationship with either BEST Median 2 or BEST Change scores for entering into regression models
Key:
BESTMed2: BEST Median 2 score from second half of treatment (pairwise deletion sample)BESTChang: BEST Change score (pairwise deletion sample)BESTMed2 EM: BEST Median 2 score from second half of treatment (Full estimated sample)BESTChang EM: BEST Change score (Full estimated sample)
* Correlation is significant at the 0.05 level** Correlation is significant at the 0.01 level
ZanTotal: ZAN-BPD total score from T1ZanAnger: ZAN-BPD Anger symptom score from T1ZanAffect: ZAN-BPD Affect symptom score from T1ZanEmpti: ZAN-BPD Emptiness symptom score from T1ZanIdentu: ZAN-BPD Identity disturbance symptom score from T1ZanDSH: ZAN-BPD Deliberate self harm symptom score from T1ZanImpuls: ZAN-BPD Impulsivity symptom score from T1ZanDissoc: ZAN-BPD Dissociation symptom score from T1ZanAband: ZAN-BPD Fear of abandonment symptom score from T1ZanRelati: ZAN-BPD Relationship instability symptom score from T1

131
Table 6: Inter-correlation matrix for severity and symptom variables with BEST dependent variables, using the full estimate sample N=71
BESTMed1N=71
BESTMed2N=71
BESTChangN=71
ZanTotal
N=71
ZanAngerN=71
ZanAffectN=71
ZanEmptiN=71
ZanIdentiN=71
ZanDSHN=71
ZanImpulsN=71
ZanDissocN=71
ZanAbandN=71
ZanRelatiN=71
BESTMed1 N=71
1.000
.557** .217 .601
**.276*
.302*
.301*
.378**
.372**
.376**
.367**
.198
.309**
BESTMed2 EMN=71
1.000
-.572**
.282*
.124 .112
.268*
.181
.114 .122 .38
3**.058 .022
BESTChang EMN=71
1.000 .201 .17
6 .024 -.062
.159
.223 .200 -.12
3.039
.246*
ZanTotalN=71
1.000
.464**
.475**
.299*
.417**
.591**
.575**
.559**
.459**
.647**
ZanAngerN=71
1.000
.313**
-.046
-.118
.046
.258*
.179
.091
.517**
ZanAffectN=71
1.000
.130
-.082
.226 .210 .16
3.131
.411**
ZanEmptiN=71
1.000
.420**
-.019 .003 .36
5**-.16
3-.01
0
ZanIdentiN=71
1.000
.234*
.007 .329**
.081 .055
ZanDSHN=71
1.000
.453**
.105
.268* .230
ZanImpuls N=71
1.000
.149
.093
.243*
ZanDissocN=71
1.000
.182
.283*
ZanAband N=71
1.000
.371**
ZanRelatiN=71
1.000

132
Regression Models
Variables which correlated with either BEST Change or BEST Median 2 were
entered into the regression models reported in tables 7-10. The following sections
outline these regression models. Preliminary analyses were conducted to ensure no
violation of the assumptions of normality, linearity, multicollinearity and
homoscedasticity (see appendix S for details and line and scatterplots for each of the
regressions). Only one participant had an inpatient psychiatric admission at T1 which
was statistically identified as a significant outlier so this case was removed from all
regression analyses.
Severity models. To test hypothesis 2 a simple regression model was used.
BEST Change score was used as the dependent variable as ZAN-BPD total score and
BEST Median 1 were highly correlated (r2=.601, n=71, p<.001) meaning entering
both of these variables into the same regression model was not meaningful as it
violated assumptions of multicollinearity. ZAN-BPD total score was entered into a
simple linear regression to predict BEST Change. In this model (reported in table 7)
T1 severity explained 10.8% the variance observed in BEST Change score, F(1, 45)=
5.47, p=.024. Severity, measured via the ZAN-BPD total score, had a positive,
medium sized coefficient with BEST Change score, r=.329 n=48, p= .024. Severity
significantly contributed to a model predicting improvements in BPD symptoms
following STEPPS, supporting hypothesis 2 using the pairwise deletion sample.

133
Table 7: Results of a Regression model predicting BEST Change scres using ZAN-BPD total score with the pairwise deletion sampleLinear Model: Severity Predictor Sample: Pairwise Deletion SampleVariable R 2 B (SE) Standardised
coefficient Beta
t Significance p value
ZAN-BPD Total score
.108 .511 (.219)
.329 2.338 .024
R² .108 F 5.465Adjusted R² .088 p (F-statistic) .024Standard Error of Estimates
8.06
When the estimated full sample was used, the model using ZAN-BPD total score
(reported in table 8) no longer reached significant in predicting the variance in BEST
Change score, F(1, 45)= 3.08, p=.084). In this sample ZAN-BPD total score and
BEST Change had a small positive correlation that was not significant, r=.208, n=71,
p=.084. When the full estimated sample was used hypothesis 2 was no longer
supported.
Table 8: Results of a regression model predicting BEST Change score using ZAN-BPD total score with the estimated full sampleLinear Model: Severity Predictor Sample: Estimated Full SampleVariable R 2 B (SE) Standardised
coefficient Beta
t Significance p value
ZAN-BPD Total score
.043 .311 (.177)
.208 1.756 .084
R² .043 F 3.08Adjusted R² .029 p (F-statistic) .084Standard Error of Estimates
7.99
Scatterplots of the significant severity model found with the pairwise deletion sample
and the non-significant severity model using with full estimated sample can be seen
in figure 2 with data points more concentrated in the full estimated sample
demonstrating a stronger relationship between the variables with this sample.

134
Symptom models. To test hypothesis 3 symptom variables which had
demonstrated a relationship with either BEST Change score or BEST Median 2 in
the correlation analyses were entered into a regression model predicting BEST
Median 2. An alternative approach involving adding all 9 symptom predictors is
explored in appendix T.
BEST Median 1 was entered at Step 1, explaining 45.7% of the variance in BEST
Median 2. Unstable relationships, dissociation and identity disturbance were then
entered in Step 2. Unstable relationships did not significantly contribute to the model
(p=.229); however, removal of this item resulted in a slightly lower R² value so
unstable relationships remained in the final model (reported in table 9) but did not
make a unique contribution. The final model predicted 59.2% (F(4, 42)=15.23,
p<.001) of the variance in Median 2 scores. Dissociation, identity disturbance and
unstable relationships explained an additional 13.5% of the variance in BEST
Median 2 after controlling for BEST Median 1. In the final model, both identity
. Scatter plots of the severity model using the pairwise deletion sample (left) and the

135
disturbance and dissociation made statistically significant contributions, with the
identity disturbance recording a higher beta value (beta=-.320, p=.005) than
dissociation (beta=.302, p=.010). Eigenvalues were examined and each predictor had
most of its variance loading onto different dimensions which demonstrated no
multicollinearity (see appendix U). Hypothesis 3 predicted that identity disturbance,
unstable relationships and emptiness would predict outcomes. Of these three, only
identity disturbance significantly contributed to this model so the results were
inconsistent with hypothesis 3. Higher identity disturbance led to lower scores
following treatment when taking into account scores at T1, whereas dissociation was
associated with higher scores following treatment when taking into account T1
scores.
Table 9: Results of a regression model predicting BEST Median 2 using BEST Median 1 and symptom predictors with the pairwise deletion sample
Hierarchical Model: Symptom Predictors
Sample: Pairwise Deletion Sample
Variable R 2 B (SE) Standardised coefficient Beta
t Significance p value
Step 1 of regression
BEST Median 1
.457 .822 (.134)
.710 6.111
<.001
Identity Disturbance
-.3.025
(1.021)
-.320 -2.96
4
.005
Dissociation 3.037 (1.121
)
.302 2.710
.010
Step 2 of regression
Unstable Relationships
.592-1.177 (.965)
-.130 -1.21
9
.229
Full model statistics
R²Adjusted R²Standard Error of Estimates
.592
.5537.511
Fp (F-statistic)Step 2 R² Change
15.23<.001.135
136
Using the estimated full sample, variables which had correlated with either BEST
Change score or BEST Median 2 were entered into a regression model (unstable
relationships, emptiness and dissociation) along with BEST Median 1. Non-
significant contributors, with p>0.2, were removed, one at a time, starting with the
variable with the highest p value. Removing emptiness the variance explained by the
model remained at 49.7%. Removing unstable relationships (second highest p value)
reduced the variance explained to 46.7% so the final model (reported in table 10)
included BEST Median 1, unstable relationships and dissociation F(3, 66)=21.70,
p<.001. Both BEST Median score 1 (beta=.634, p<.001) and dissociation (beta=.223,
p=.024) were significant contributors to this model, although unstable relationships
was approaching significant (p=.052). In terms of hypothesis 3, neither emptiness or
identity disturbance were found to predict outcomes using this sample. Unstable
relationships also did not make a significant contribution to the model predicting
outcomes, going against the hypothesis.
Table 10: Results of a regression model predicting BEST Median 2 using BEST Median 1 and symptom predictors with the full estimated sample
Hierarchical Model: Symptom Predictors
Sample: Estimated Full Sample
Variable R 2 B (SE)
Standardised coefficient
Beta
t Significance p value
Step 1 of regression
BEST Median 1
.436 .745 (.116)
.634 6.422 <.001
Dissociation 2.092 (.905)
.223 2.311 .024
Step 2 of regression
Unstable Relationships
.497 -1.576 (.795)
-.187 -1.981 .052
Full model statistics
R²Adjusted R²Standard Error of Estimates
.497
.4747.6
Fp (F-statistic)Step 2 R² Change
21.70<.001.061

137
Scatterplots of the symptom model found with the pairwise deletion sample and the
model using with full estimated sample can be seen in figure 3 showing a similar
sped and strength of relationship across both samples.
Discussion
It was hypothesised that there would be an improvement in BPD symptoms over the
course of STEPPS treatment. This hypothesis was supported with a statistically
significant improvement in BEST scores. However these improvements were not
large enough to be classified as a reliable change or clinically significant change
(Jacobson & Truax, 1991). Hypothesis 2 predicted that greater BPD severity, as
measured by the ZAN-BPD total score, would predict greater improvements. When
then pairwise deletion sample was used for the regression then this hypothesis was
supported, however when the full estimated sample was used severity no longer
significantly predicted improvements. Finally, hypothesis 3 predicted that symptoms
of emptiness, unstable relationships and identity disturbance would predict
improvements. Neither of the samples fully supported this hypothesis but when the
pairwsie sample was used identity disturbance significantly predicted outcomes. As
predicted, neither impulsivity nor DSH significantly predicted outcomes.
Figure 3. Scatter plots of the symptom model using the pairwise deletion sample (left) and the full estimated sample (right)

138
Findings supported the hypothesis that there would be a significant improvement in
BPD symptoms over the course of treatment; however, only 25% of participants
made reliable improvements (Jacobson & Truax, 1991). The percentage meeting
reliable change in this study was much lower than the 65.4% found in previous
research examining STEPPS treatment (Bos et al., 2011); however these authors
calculated reliable change on the basis of a measure of general psychopathology
(Symptom Checklist-90; Arrindell & Ettema, 2003) rather than their measure of
BPD. In the current study STEPPS was not used as an augmentation therapy as
consistently or in the same way as in other studies (only 15.5% of participants were
receiving additional therapy although many received other supportive treatment such
as care coordination) so the results cannot be easily compared to studies in which
participants were also receiving individual therapy. This may have contributed,
somewhat, to the lower rates of statistically reliable change observed in this study
compared to rates in other research (Bos et al., 2011).
Previous research has found severity to be predictive of larger improvements
following STEPPS treatment (Black et al., 2009; Black et al., 2013; Bos et al., 2011);
this study replicated this finding, with ZAN-BPD total score predicting change in
BEST score when pairwise deletion was used, however not when the full estimated
sample was used. The amount of variance explained by severity in these past papers
is not clearly reported. This is unfortunate as it would be beneficial to be able to
compare the different contributions of severity in each of these studies. The
observation that individuals with more severe BPD at T1 demonstrated larger
improvements could be a result of a regression to the mean effect. However, if this
was the case, it would be expected that a similar effect would be observed when

139
using the estimated full sample as EM reduces the precision of the data and
regression to the mean is more noticeable with increased measurement error (Barnett,
van der Pols & Dobson, 2005). Bos et al. (2011) proposed that the observed effect of
severity could not be assigned to a regression to the mean in their study as this was
only observed in those assigned to the STEPPS treatment condition. This suggests a
true effect of severity on treatment outcomes. This would provide evidence for the
theory by Gaw and Beutler (1995) that more severely affected individuals can benefit
from motivational distress which can increase engagement with treatment. A
replication of the current study with a randomised design would reduce the impact of
regression to the mean and provide further clarity on the effect of severity.
The finding that severity predicts better outcomes in this skills-based treatment
suggests that teaching skills that failed to develop during childhood (Ryan, 2005) is a
useful way to treat BPD. Some studies examining more reflective treatments (MBT
and CAT) have not found this effect of severity on outcomes (Ryle & Golynkina,
2000; Bateman & Fonagy, 2013). The self determination theory states that reflective
therapies work by providing acceptance and validation so that a person can continue
with their development and naturally obtain these missing skills (Ryan, 2005).
However this pattern of skills-based groups finding a predictive effect of baseline
severity but reflective treatments failing to find this effect, might suggest that more
severely affected individuals benefit more from being directly taught missing coping
strategies rather than allowing them to develop naturally. This is speculative at this
stage and controlled research trials examining the differential effect of severity on
different treatment approaches would be required to provide clarity on this.

140
Despite missing data being a wide-spread problem in psychological research,
statistical methods of imputing or estimating missing data are not commonly used
(Cheema, 2014; Graham, 2009). In this study there were a number of differences
between findings when the non-manipulated, pairwise deletion sample was used
compared to the estimated full sample dataset. One of these differences was that
when a full sample dataset was examined, the effect of severity was no longer
observed. Previous studies which observed the effect of severity on STEPPS
outcome (Black et al., 2009; Black et al., 2013) do not report having imputed missing
data from participants who dropped out of treatment. It is possible that these results
may not have held if a full sample was imputed. Excluding participants who do not
complete treatment can risk biasing results so that conclusions are drawn which are
not reflective of the STEPPS population as a whole. By considering the full sample,
it might be possible to draw more cautious, and possibly more accurate, conclusions
about the predictive power of severity on treatment outcomes. One study which
found baseline severity to be related to larger improvements following STEPPS,
completed by Bos et al. (2011), used intention to treat analyses where pre-treatment
scores were carried forward. They continued to find a significant effect of baseline
severity, although estimated differences were smaller using this approach. It is also
worth noting that the sample size was considerably larger than the current study and
their percentage of participants not receiving their allotted treatment was lower,
which increases the power of their analyses to pick up this effect of severity even
when using the conservative ITT approach. The lower power in this study could lead
to smaller effects being missed when using more conservative approaches.

141
There are a number of possible explanations for the different results observed when
using these two samples. It is first worth questioning whether the sample of
participants who completed treatment was biased by selective drop-out. Completers
differed from non-completers on T1 symptoms of emptiness but on no other T1 trait
(including severity). Emptiness has been shown to be related to more psychosocial
impairments than other BPD symptoms (Ellison, Rosenstein, Chelminski,
Dalrymple, & Zimmerman, 2016). Emptiness has also been related to feelings of
hopelessness (Klonsky, 2008) these factors may have increased the likelihood of
drop-out. Previous research has found baseline impulsivity to be predictive of
attrition from STEPPS (Black et al., 2009) but this study did not replicate this
finding. Future research which examines whether emptiness reliably predicts attrition
from STEPPS would be of value. If this was confirmed this could indicate an
important target group for efforts in treatment retention, who may require additional
psychosocial support or work targeting feelings of hopelessness or may be better
suited to an alternative therapy.
Foster and Fang (2004) argue that the only way to reliably establish the best model
for statistically managing attrition is to understand the missing data mechanism.
These authors highlight how attrition is linked with individual characteristics and this
relationship is never so complex as in intervention-based research. This has led some
to question the plausibility of the missing at random assumption (Raykov & West,
2015; Potthoff, Tudor, Pieper, & Hasselblad, 2006). There are a huge number of
other variables which were not examined in this study which may have differed
between completers and non-completers. It is therefore feasible that some of the

142
additional, unexamined variables could have a moderating effect on severity in those
participants who ended treatment early.
Another reasonable hypothesis is that it is a purely statistical effect being observed.
EM increases the power of statistical analyses by increasing the sample size,
however, in doing so it reduces the precision of analyses by decreasing the reliability
of the data. EM can increase the risk of Type 2 error. Excluding participants who
drop-out can also bias estimations of parameters as well as reducing statistical power
(Kang, 2013). This trade-off may be the leading, or only, contributor to the different
results observed in this paper.
It is also important not to neglect the possibility that the results observed here are a
random effect related to this specific sample and would not be observed in
replication. Or, of course, there is always a reasonable likelihood that it is a
combination of these factors, and others beyond. However it raises an interesting
question, not only for our understanding of how severity relates to STEPPS treatment
outcomes, but also a more general appreciation and recognition of the impact of our
statistical decision-making when dealing with missing data. Future research
examining the role of severity in predicting STEPPS outcomes with management of
missing data through estimation likelihood and a larger sample size to provide better
precision in estimating effects would be interesting to pull apart these results.
When symptom level predictors were examined in the non-estimated sample,
dissociation and identity disturbance were significantly able to predict variance in
scores at the end of treatment, given where they were at the start of treatment, by an
extra 12%. It was hypothesised that identity disturbance would be related to
outcomes but dissociation was an unexpected finding. This suggests that the

143
prevalence of these symptoms at the beginning of treatment could give some
indication towards a person’s suitability to STEPPS treatment. After taking into
account BEST scores at the beginning of treatment, participants with lower
dissociation had better BEST scores at the end of treatment (lower scores) and those
with higher scores on identity disturbance demonstrated lower scores at the end of
treatment when taking into account their scores at the beginning of treatment.
Previous studies have found mixed results in relation to identity disturbance, Yen et
al. (2009) found that identity disturbance predicted fewer improvements following
DBT, however Lenzenweger et al. (2012) and Bellino et al. (2015) found identity
disturbance to predict higher rates of improvement. Yen et al. (2009) examined a
very short DBT treatment. It is possible that this short-term treatment was not suited
to individuals with higher rates of identity disturbance. STEPPS is also a relatively
short-term treatment in terms of BPD therapies, however the results of this study
might suggest that 20 weeks is sufficient to engage individuals with identity
disturbance, although this is suggested cautiously at this stage, as this finding was not
replicated using the full estimation sample. It is possible that the group format of
STEPPS benefits individuals with more severe identity disturbance by being
facilitative of improvements in this more readily changeable symptom.
When the estimated full sample dataset was examined, and after controlling for
BEST scores at the start of treatment, only unstable relationships and dissociation
were left in the final model and, of the two, only dissociation made a significant
contribution. Dissociation was the only symptom predictor that contributed to
regression models with both the deletion approach and the full estimated sample,
suggesting this is a more robust finding of this study. The theory of structural

144
dissociation of personality (Van der Hart, Nijenhuis, Steele, & Brown, 2004) claims
that dissociated self-states occur when personality is divided into an emotional part
and an apparently normal part of the personality. The apparently normal part of the
personality attempts to avoid the emotional part through detachment and numbing or
dissociation (Mosquera, Gonzalez, & Leeds, 2014). Arntz et al. (2015) found
dissociation predicted smaller change of recovery in Schema Therapy and
Transference Focused Therapy. Kliendienst et al. (2011) examined DBT and found
that lower dissociation scores were related to better treatment outcomes. They
suggest that this is because higher rates of dissociation interrupt learning during
treatment. Individuals with BPD with dissociative symptoms show disrupted
emotional-learning compared to BPD participants without dissociative symptoms
(Ebner-Priemer et al, 2009). In this study, participants who made larger
improvements in STEPPS had lower dissociation scores. It is possible that
participants with higher rates of this chronic and robust BPD symptom will
experience more dissociative states, which may inhibit their ability to process or
internalise the content of STEPPS to the same degree. If further research confirmed
this hypothesis, implications for clinicians would evolve around management of
dissociation within treatment or providing grounding training prior to treatment
commencement.
Emptiness and unstable relationships were both found to correlate with outcomes
when using the full estimated sample. However, when entered into regression
models, neither made significant contributions. These findings do not support the
hypothesis that emptiness and unstable relationships would be predictive of greater
improvements, although it is possible that their effects are mediated through some of

145
the other symptoms. The evidence for this may be stronger for unstable relationships,
which did not make a significant contribution to either of the symptom models but
remained a non-significant predictor in both, as removing it reduced the strength of
the models. Neither impulsivity nor suicidal/self harm behaviours were related to
outcomes, which supports the hypothesis that these symptoms would not predict
outcomes. In considering Zanarini et al.’s (2007) classifications of symptoms, one
may have predicted that acute symptoms, which show faster rates of remission,
would be more predictive of outcomes. However this would assume that therapy acts
by speeding up naturally occurring remission. It would be interesting, in future, to
use an outcome measure which looks at the rates of change in the different symptoms
rather than only looking at an overall BPD severity.
Findings from this study would benefit from replication, however if the findings
were found to be reliable over replication studies there are a number of useful
clinical applications to consider. Emptiness was found to be a predictor of treatment
drop-out, this may highlight a helpful subgroup of people with BPD to target for
treatment retention efforts. The finding that dissociation predicts poorer outcomes
suggests that clinically individuals with high rates of dissociation may benefit from
preliminary work to help them manage dissociative states, for example through
grounding techniques, to prevent dissociation from disrupting learning. As
individuals with less severe BPD make less improvements this may highlight a
subsection of people with BPD who may require a different approach or focus of
intervention. This would allow for continued recovery. Finally, it is hoped that this
research highlights the importance of considering the different methods of managing
missing data. It is hoped that an implication of this research would be that future

146
researchers would consider the impact of their statistical decisions about managing
missing data and the biases this can introduce.
Limitations of this study include it being non-randomised, so we are unable to
conclude whether similar outcomes would have been observed in individuals who
were not receiving STEPPS treatment. Without an element of manipulation, cause
and effect cannot be inferred. A controlled study would also reduce the risk of
assigning regression to the mean as clinical change. Despite exhausting all available
avenues within the time-frame of this study, the participant numbers are relatively
small, which limits the generalisability of the findings. Representativeness of the
sample can also be called into question as the majority of participants were female
and recent estimates contradict the previously held belief that BPD is more common
amongst females (Grant et al., 2008). Replication with larger participant numbers
within NHS settings would be desirable. Statistically, it would have been beneficial
to control for the effect of individual group difference, however participant numbers
were too low to include each group as a nominal variable into a regression. There
were some inter-group differences in degrees of supervision and training, which
raises questions of treatment fidelity. Tighter controls for reducing these group
differences would be beneficial. A statistical limitation of the current study is the
high risk of Type 1 error due to the large amount of analyses. A Bonferroni
correction for the correlation analyses was considered however due to the relatively
low sample size and associated risk of Type 2 error this was not applied. A larger
sample size would have permitted this protection against Type 1 error.
Both the independent and dependent variables in this study were based on participant
self report. This was designed to reduce burden on group facilitators and potentially

147
allow for higher participant recruitment. There is always an element of subjective
self-report bias in using such measures. Objective measures from a professional
working with the participants would be desirable to corroborate participant self-
report wherever possible in future studies. Covariates were taken into consideration
and factored into analyses where appropriate. However, not all covariates could be
examined and it is possible that key variables may have been missed, such as
medication use. Only one dependent variable measure was used which was a
symptom measure of BPD. Using only this measure may have masked changes in
other domains. The STEPPS literature also highlights changes in quality of life and
general psychopathology (Bos et al., 2011). If, as Zanarini et al. (2007) suggest,
temperamental symptoms interfere more with psychosocial functioning, we might
expect to see more evidence of an effect of these symptoms if a measure of quality of
life was adopted rather than symptom based measures.
Follow-up data was sought and gathered but unfortunately there was a low response
rate, so including this data in the regressions would have drastically reduced the
power of the analyses. Descriptive statistics on the responses received can be found
in appendix W. A higher rate of follow-up data which allowed for further statistical
analysis would be desirable to explore whether any improvements were maintained
following the end of STEPPS.
The variables in this study were based on the DSM-IV-TR (2000) criteria. Although
the DSM-5 (2013) has kept the same criteria, meaning the symptoms studies here are
still relevant to this new manual, an alternative set of diagnostic criteria (Oldham,
2015) were suggested in the appendices of DSM-5. This highlights how other
symptoms and variables may be important in understanding BPD and treatment

148
suitability. It would be beneficial for future studies to continue exploring new
variables and their influence on treatment response. Black and Blum (2017) suggest
factors which could contribute to people’s suitability for STEPPS. These included
feeling they cannot learn new skills or feeling the only way things can change is if
others around them change. Individual variables such as sense of autonomy or
flexible thinking could contribute to the heterogeneous treatment outcomes observed.
The self-determination theory (Ryan, 2005) argues that autonomy is a defining
feature of BPD which suggests this could be an interesting feature to explore.
Another limitation of this study was the lack of information on participants who
dropped out of STEPPS; it would have been beneficial to gather information from
participants who dropped out of treatment on their reasons for finishing treatment
early.
Qualitative data was collected alongside quantitative data with questions designed to
allow space for participants to provide contextual information or share their views on
their suitability to STEPPS. However, in practice, these responses did not contribute
to answering the research question so are reported in appendix V. Wording of these
questions could have benefited from further review as certain terms provided a large
amount of crossover of answers. For example, the use of ‘suitability’ and ‘relevant’.
Further development of these questions may have produced data which contributed
to our understanding of treatment suitability and explored participants’ experiences
of STEPPS.
Despite these limitations, the findings of the current study extend the research on the
predictors of treatment response in STEPPS and make a first step towards breaking
down the heterogeneous ‘severity’ factors in relation to predicting STEPPS

149
outcomes. Strengths of the current study lie in its ecological validity, as data was
gathered from real-life STEPPS groups within NHS settings across different trusts.
The use of multiple methods of managing missing data was an advantage as it
allowed exploration of the different results from these two statistical approaches. It
has been useful to consider the potential bias which can occur when participants who
drop out of treatment are excluded from statistical analysis. Findings which are based
only on participants who complete treatment should not be generalised to the wider
participant populations which enter into treatment. The significant findings relating
to severity and identity disturbance should be interpreted with caution as, at this
stage, they only apply to the subset of participants who completed treatment. The
results from this study have highlighted a number of areas for future research, which
could provide important information on factors influencing the outcomes of therapy
for individuals with BPD. This study has made a first step towards understanding
how the presence of different BPD symptoms relates to STEPPS treatment outcomes.
References

150
Alesiani, R., Boccalon, S., Giarolli, L., Blum, N., & Fossati, A. (2014). Systems
training for emotional predictability and problem solving (STEPPS): program
efficacy and personality features as predictors of drop-out- an Italian study.
Comprehensive Psychiatry, 55, 920-927.
American Psychiatric Association. (1994). Diagnostic and Statistical Manual of
Mental Disorders, 4th ed, (DSM-IV). Washington, DC: APA.
American Psychiatric Association. (2000). Diagnostic and Statistical Manual of
Mental Disorders, 4th ed, Text Revision (DSM-IV-TR). Washington, DC:
APA.
American Psychiatric Association. (2001) Practice Guideline for the treatment of
patients with borderline personality disorder. Washington DC: American
Psychiatric Association.
American Psychiatric Association. (2013). Diagnostic and statistical manual of
eaddasfmental disorders (5th ed.). Washington, DC: APA.
Andión. Ó., Ferrer, M., Gancedo, B., Calvo, N., Barral, C., Torrubia, R., & Casas, M.
(2011).Confirmatory factor analysis of borderline personality disorder
symptoms based on two different interviews: The Structured Clinical
Interview for DSM-IV Axis II disorder and the Revised Diagnostic Interview
for Borderlines. Psychiatry Research, 190, 304-308.
Arntz, A., Stupar-Rutenfrans, S., Bloo, J., van Dyck, R., & Spinhoven, P. (2015).
Prediction of treatment discontinuation and recovery from borderline
personality disorder: Results from an RCT comparing schema therapy and

151
transference focused psychotherapy. Behaviour Research and Therapy, 74,
60-71. doi:10.1016/j.brat.2015.09.002
Arrindell, W. A., & Ettema, J. H. M. (2003). SCL-90. Symptom Checklist; Lisse:
Swets Test Publishers.
Barnett, A. G., van der Pols, J. C., & Dobson, A. J. (2005). Regression to the mean:
what it is and how to deal with it. International Journal of Epidemiology,
34(1), 215-220.
Barnicot, K., Katsakou, C., Bhatti, N., Savill, M., Fearns, N., & Priebe, S. (2012).
Factors predicting the outcome of psychotherapy for borderline personality
disorder: A systematic review. Clinical Psychology Review, 32(5), 400-412.
doi:10.1016/j.cpr.2012.04.004
Barnicot, K., Katsakou, C., Marougka, S., & Priebe, S. (2011). Treatment completion
in psychotherapy for borderline personality disorder: a systematic review and
meta-analysis. Acta Psychiatrica Scandinavica, 123(5), 327-338.
Bateman, A. W., & Fonagy, P. (2004). Psychotherapy for borderline personality
disorder: Mentalization-based treatment of BPD. Oxford: Oxford University
Press.
Bellino, S., Bozzatello, P., & Bogetto, F. (2015). Combined treatment of borderline
personality disorder with interpersonal psychotherapy and pharmacotherapy:
Predictors of response. Psychiatry Research, 226(1), 284-288.
doi:10.1016/j.psychres.2014.12.064
152
Beutler, L. E., Engle, D., Mohr, D., Daldrup, R. J., Bergan, J., Meredith, K., &
Merry, W. (1991). Predictor of differential response to cognitive,
experiential, and self-direct psychotherapeutic procedures. Journal of
Consulting and Clinical Psychology, 59(2), 333-340.
Beutler, L. E., & Moos, R. H. (2003). Coping and coping styles in personality and
treatment planning: introduction to the special series. Journal of Clinical
Psychology, 59(10), 1045-1047.
Black, D. W., Allen, J., John, D. S., Pfohl, B., McCormick, B., & Blum, N. (2009).
Predictors of response to systems training for emotional predictability and
problem solving (STEPPS) for borderline personality disorder: An exploratory
study. Acta Psychiatrica Scandinavica, 120(1), 53-61. doi:10.1111/j.1600-
0447.2008.01340.x
Black, D. W., Blum, N., Pfohl, B., & John, D. (2004). The STEPPS group treatment
program for outpatients with borderline personality disorder. Journal of
Contemporary Psychotherapy, 34(3), 193-210.
Black, D. W., Blum, N., McCormick, B., & Allen, J. (2013). Systems training for
emotional predictability and problem solving (STEPPS) group treatment for
offenders with borderline personality disorder. Journal of Nervous and Mental
Disease, 201(2), 124-129. doi:10.1097/NMD.0b013e31827f6435

153
Black, D. W., & Blum, N. S. (2017). Systems Training for Emotional Predictability
and Problem Solving for Borderline Personality Disorder: Implementing
STEPPS around the Globe. New York: Oxford University Press.
Blum, N., Pfohl, B., John, D., Monahan, P., & Black, D.W. (2002). STEPPS: A
Cognitive-Behavioural Systems-Based Group Treatment for Outpatients with
Borderline Personality Disorder-A Preliminary Report. Comprehensive
Psychiatry, 43(4), 301-310.
Bohus, M., Haaf, B., Simms, T., Limberger, M. F., Schmahl, C., Unckel, C., et al.
(2004). Effectiveness of inpatient dialectical behavioral therapy for borderline
personality disorder: A controlled trial. Behaviour Research and Therapy, 42(5),
487-499. Retrieved from http://search.proquest.com/docview/71738013?
accountid=17256
Bos, E. H., van Wel, E. B., Appelo, M. T., & Verbraak, J. P. M. (2011).
Effectiveness of systems training for emotional predictability and problem
solving (STEPPS) for borderline personality problems in a ‘real-world’
sample: Moderation by diagnosis or severity? Psychotherapy and
Psychosomatics, 80(3), 173-181. doi:10.1159/000321793
Cheema, J. R. (2014). Some general guidelines for choosing missing data handling
methods in educational research. Journal of Modern Applied Statistical
Methods, 13(2), 53-75.
Cohen, J. (1988). Statistical Power Analysis for the Behavioral Sciences. New York,
NY: Routledge Academic.

154
Cronbach, L. J., & Furby, L. (1970). How we should measure ‘change’, or should
we? Psychological Bulletin, 74(1), 68-80.
Dempster, A. P., Laird, N. M., & Rubin, D. B. (1977). Maximum likelihood from
incomplete data via the EM algorithm. Journal of the Royal Statistical
Society, Series B, 39(1), 1-38.
Ebner-Priemer, U. W., Mauchnik, J., Kliendienst, N., Schmahl, C., Peper, M.,
Rosenthal, M. Z., ... Bohus, M. (2009). Emotional learning during
dissociative states in borderline personality disorder. Journal of Psychiatry
and Neuroscience, 34(3), 214-222.
Ellison, W. D., Rosenstein, L., Chelminski, I., Dalrymple, K., & Zimmerman, M.
(2015). The clinical significance of single feature of borderline personality
disorder: anger, affective instability, impulsivity, and chronic emptiness in
psychiatric outpatients. Journal of Personality Disorders, 30(2), 261-270.
Foster, E. M., & Fang, G. Y. (2004). Alternative methods for handling attrition: an
illustration using data from the fast track evaluation. Evaluation Review,
28(5), 434-464.
Gaw, K. F., & Beutler, L. E. (1995). Integrating treatment recommendations. In
Beutler, L. E. & Berren, M. R. (Eds.), Integrative Assessment of Adult
Personality (280-319). New York: Guildford Press.
Gelman, A., & Hill, J. (2007). Missing-data imputation. In Gelman, A., & Hill, J.
(Eds.), Data Analysis using Regression and Multilevel/ Hierarchical Models
(529-543). New York: Cambridge University Press.

155
Ghasemi, A., & Zahediasl, S. (2012). Normality tests for statistical analysis: a guide
for non-statisticians. International Journal of Endocrinology and Metabolism,
10(2), 486-489.
Gov.uk. (2015). Data protection - GOV.UK. [online] Available at:
https://www.gov.uk/data-protection/the-data-protection-act
Graham, J. W. (2009). Missing data analysis: making it work in the real world.
Annual Review of Psychology, 60, 549-576.
Grant, B. F., Chou, S. P., Goldstein, R. B., Huang, B., Stinson, F. S., Saha, T. D., …
Ruan, J. (2008). Prevalence, correlates, disability and comorbidity of DSM-
IV borderline personality disorder: results from the wave 2 national
epidemiologic survey on alcohol and related conditions. Journal of Clinical
Psychiatry, 69(4), 533-545.
Gratz, K. L., Dixon-Gordon, K., & Tull, M. T. (2014). Predictors of treatment
response to an adjunctive emotion regulation group therapy for deliberate self-
harm among women with borderline personality disorder. Personality
Disorders: Theory, Research, and Treatment, 5(1), 97-107.
doi:10.1037/per0000062
Harvey, R., Black, D., & Blum, N. (2010). Systems Training for Emotional
Predictability & Problems Solving (STEPPS) in the United Kingdom: A
Preliminary Report. Journal of Contemporary Psychotherapy, 40, 225-232.
Hopwood, C. J. (2006). Brief treatments for borderline personality. Clinical
Psychology and Psychotherapy, 13, 269-283.

156
IBM Corp. Released 2015. IBM SPSS Statistics for Windows, Version 23.0.
Armonk, NY: IBM Corp.
Jacobson, N. S., & Truax, P. (1991). Clinical significance: a statistical approach to
defining meaningful change in psychotherapy research. Journal of Consulting
and Clinical Psychology, 59(1), 12-19.
Kang, H. (2013). The prevention and handling of missing data. Korean Journal of
Anesthesiology, 64(5), 402-406.
Kellogg, S.H., & Young, J. E. (2006). Schema therapy for borderline personality
disorder. Journal of Clinical Psychology, 62, 445-458.
Kirkwood, B. R., & Sterne, A. C. (2003). Medical Statistics (2nd ed.). Oxford:
Blackwell.
Kleindienst, N., Limberger, M. F., Ebner-Priemer, U. W., Keibel-Mauchnik, J., Dyer,
A., Berger, M., et al. (2011). Dissociation predicts poor response to dialectial
behavioral therapy in female patients with borderline personality disorder.
Journal of Personality Disorders, 25(4), 432-447.
Kline, P. (1999). A Handbook of Psychological Testing, 2nd ed. London: Routledge.
Klonsky, D. (2008). What is emptiness? Clarifying the 7th criterion for borderline
personality disorder. Journal of Personality Disorders, 22(4), 418-426.
Lana, F., & Fernandez-San Martin, M. I. (2013). To what extent are specific
psychotherapies for borderline personality efficacious? A systematic review
of published randomised controlled trials. Actas Espanolas de Psiquiatria,
41(4), 242- 252.

157
Lenzenweger, M. F., Clarkin, J. F., Levy, K. N., Yeomans, F. E., & Kernberg, O. F.
(2012). Predicting domains and rates of change in borderline personality
disorder. Personality Disorders: Theory, Research, and Treatment, 3(2), 185-
195. doi:10.1037/a0025872
Levy, K. N., Meehan, K. B., Temes, C. M., & Yeomans, F. E. (2011). Attachment
theory and research: implication for psychodynamic psychotherapy. In Levy,
R. A., Ablon, J. S., Kächele, H (Eds.), Psychodynamic psychotherapy
research: Evidence-based practice and practice-based evidence (401-416).
London: Humana Press.
Linehan, M. M. (1993). Cognitive behavioral treatment of borderline personality
disorder. New York: Guilford Press.
Livesley, J. W. (2012). Moving beyond specialist therapies for borderline personality
disorder: the importance of integrated domain-focused treatment.
Psychodynamic Psychiatry, 40(1), 47-74.
Luborsky, L., Auerbach, A. H., Chandler, M., Cohen. J., & Bachrach, H. M. (1971).
Factors influencing the outcome of psychotherapy: a review of qualitative
research. Psychological Bulletin, 75(3), 145-185.
Manikandan, S. (2011). Measures of central tendency: median and mode. Journal of
Pharmacology and Pharmacotherapuetics, 2(3), 214-215.
Mosquera, D., Gonzalez, A., & Leeds, A. M. (2014). Early experience, structural
dissociation, and emotional dysregulation in borderline personality disorder:
the role of insecure and disorganised attachment. Borderline Personality and
Emotional Dysregulation, 1(15), 1-8.

158
National Institute for Health and Care Excellence. (2009). Borderline personality
disorder: treatment and management. London: The British Psychological
Society and The Royal College of Psychiatrists.
Oldham, J. M. (2015). The alternative DSM-5 model for personality disorders. World
Psychiatry, 14(2), 234-236.
Pfohl, B., Blum, N., St John, D., McCormick, B., Allen, J., & Black, D. W. (2009).
Reliability and validity of the borderline severity over time (BEST): a self
rated scale to measure severity and change in persons with borderline
personality disorder. Journal of Personality Disorders, 23(3), 281-293.
Pompili, M., Girardi, P., Ruberto, A., & Tatarelli, R. (2005). Suicide in borderline
personality disorder: A meta-analysis Nordic Journal of Psychiatry, 59(5), 319-
324.
Potthoff, R. F., Tudor, G. E., Pieper, K. S., & Hasselblad, V. (2006). Can one assess
whether missing data are missing at random in medical studies? Statistical
Methods in Medical Research, 15, 213-234.
Raykov, T., & West, B. T. (2015). On enhancing plausibility of the missing at
random assumption in incomplete data analyses via evaluation of response-
auxiliary variable correlations. Structural Equation Modeling, 22(3), 429-
438.
Ryan, R. M. (2005). The developmental line of autonomy in the etiology, dynamics
and treatment of borderline personality disorder. Developmental and
Psychopathology, 17, 987-1006.

159
Ryle, A., & Golynkina, K. (2000). Effectiveness of time-limited cognitive analytic
therapy of borderline personality disorder: Factors associated with outcome.
British Journal of Medical Psychology, 73, 197-210.
doi:10.1348/000711200160426
Sanislow, C. A., Grilo, C. M., Morey, L. C., Bender, D. S., Skodol, A. E.,
Gunderson, J. G... McGlashan, T. H. (2002). Confirmatory Factor Analysis of
DSM-IV Criteria for Borderline Personality Disorder: Findings from the
Collaborative Longitudinal Personality Disorders Study. The American Journal
of Psychiatry, 159(2), 284-290
Stoffers, J. M., Voellm, B. A., Ruecker, G., Timmer, A., Huband, N., & Lieb, K.
(2012). Psychological therapies for people with borderline personality
disorder. Cochrane Database of Systematic Reviews, (8),
CD005652.doi:10.1002/14651858.CD005652.pub2
Stone, M. H. (2006). Management of borderline personality disorder: a review of
psychotherapeutic approaches. World Psychiatry, 5(1), 15-20.
Van der Hart, O., Nijenhuis, E., Steele, K., & Brown, D. (2004). Trauma-related
dissociation: concept clarity lot and found. Australian and New Zealand
Journal of Psychiatry, 38(11/12), 906-914.
Widiger, T. A., & Weissman, M. M. (1991). Epidemiology of borderline personality
disorder. Hospital and Community Psychiatry, 42(10), 1015-1021.
Yen, S., Johnson, J., Costello, E., & Simpson, E. B. (2009). A 5-day dialectical
behavior therapy partial hospital program for women with borderline personality

160
disorder: Predictors of outcome from a 3-month follow-up study. Journal of
Psychiatric Practice, 15(3), 173-182. doi:10.1097/01.pra.0000351877.45260.70
Zanarini, M. C., Frankenburg, F. R., Reich, D. B., Silk, K. R., Hudson, J. I., &
McSweeney, L. B. (2007). The subsyndromal phenomenology of borderline
personality disorder: a 10-year follow-up study. The American Journal of
Psychiatry, 146(6), 929-935.
Zanarini, M. C., & Frankenburg, F. R. (2008). Zanarini Rating Scale for Borderline
Personality Disorder: Self-report version (ZAN-BPD: SRV). Belmont, MA:
McLean Hospital.
Zanarini, M. C., Weingeroff, J. L., Frankenburg, F. R., & Fitzmaurice, G. M. (2015).
Development of the self-report version of the Zanarini rating scale for
borderline personality disorder. Personality and Mental Health, 9, 243-249.
Zimmerman, M., & Mattia, J. I. (1999). Axis I diagnostic comorbidity and borderline
personality disorder. Comprehensive Psychiatry, 40(4), 245-252.
doi:http://dx.doi.org/10.1016/S0010-440X(99)90123-2
161
List of Appendices
Appendix A: Journal Guidelines for Authors
Appendix B: Measures and time points when they were collected
Appendix C: Breakdown of shared data and data unique to each study
in the wider STEPPS project
Appendix D: The Borderline Evaluation of Severity over Time
Appendix E: The Zanarini rating scale of Borderline Personality Disorder (ZAN-BPD) self report version
Appendix F: Demographics and Service Usage Questionnaire
Appendix G: Details of STEPPS Session Content
Appendix H: Details of ethical review discussion on collecting group
information relating to facilitation
Appendix I: Information on facilitator profession, training and supervision
Appendix J: Detailed Protocol for Facilitators
Appendix K Information sheet provided to participants prior to consent to
treatment
Appendix L: Consent form
Appendix M: Copy of letter of Ethical Approval
Appendix N: Copies of R&D Approvals
Appendix O: Independent Variables: Test of normality, Boxplots
and Histograms
Appendix P:Dependent Variables: Test of normality, Boxplots
and Histograms
Appendix Q: Comparisons of completers and non-completers
Appendix R: Preliminary Investigations of Relationships with dependent variables
Appendix S: Regression analysis additional information
Pg. 165
Pg. 166
Pg. 167
Pg. 168
Pg. 169
Pg. 170
Pg. 171
Pg. 173
Pg. 181
Pg. 184
Pg. 186
Pg. 196
Pg. 203
Pg. 209
Pg. 212
Pg. 213
Pg. 216
Pg. 174
Pg. 177

162
Appendix T: Exploring regression with all 9 symptom measures
Appendix U: Eigen values of symptom level predictors
Appendix V: Content Analysis
Appendix W: Descriptive statistics of follow-up data
Pg. 222
Pg. 223
Pg. 224
Pg. 228
163
Appendices
Appendix A: Journal Guidelines for Authors
Removed for ethesis

164
Appendix B: Measures and time points when they were collected
Table 11. Measures and time points when they were collected
Session 1
Session 2 (T1)
Session 10 (T2)
Session 20 (T3)
Every week
Information sheet Consent form Demographics Quality of Life questionnaire Group Session Rating Scale ZAN-BPD BEST Filter questionnaire Skills monitoring card Service usage questionnaire
165
Appendix C: Breakdown of shared data and data unique to each study in the wider STEPPS project
Table 12: Data used by each of the three projectsUsed by MeasuresAll three studies BEST scores (weekly)
Demographic data (T1)Service usage (T1)
Study 1. Predictors of BPD-specific outcomes (this study)
ZAN-BPD (T1)
Study 2. Mechanisms of change Group Session Rating Scale (T1, T2, T3)Skills monitoring card (weekly)ZAN-BPD (T1 and T3)
Study 3. Predictors of Quality of life outcomes
Quality of Life questionnaire (T1, T2, T3) Service usage (T2, T3)Group Session Rating Scale (T1, T2, T3)ZAN-BPD (T1 and T3)Filter questionnaire (T1 and T3)

166
Appendix D: The Borderline Evaluation of Severity over Time (BEST; Blum, Pfohl, John, Monahan & Black, 2002)
Removed for ethesis

167
Appendix E: The Zanarini rating scale of Borderline Personality Disorder (ZAN-BPD) self report version (Zanarini & Frankenburg, 2008)
Removed for ethesis
168
Appendix F: Demographics and Service Usage Questionnaire
Site code Participant code
Demographic Information
1. Age: .............
2. Do you have a diagnosis of Borderline Personality Disorder (BPD) / Emotionally Unstable Personality Disorder (EUPD)? (please circle)
YES / NO
If so, how many years ago were you given this diagnosis ...............................
3. Are you currently undertaking any other form of psychological therapy (apart from STEPPS)? (please circle)
YES / NO
If so, which therapy? .............................................................................................
4. Have you started a STEPPS treatment programme before? (please circle)YES / NO
If yes, how many times? .................
If yes, how many STEPPS treatment programmes have you completed? …………….
5. Have you previously undertaken any other forms of psychological therapies (other than STEPPS)? (please circle)
YES / NO
If so, which therapy? ......................................................................
Service Usage Questionnaire
1) During the last 7 days how many contacts have you had with the following:
Services Number of contactsA) Telephone call to the Mental Health Line/Crisis LineB) A and EC) Crisis Team/ Home Treatment Team D) Inpatient psychiatric hospital E) Inpatient general hospital (e.g. physical health symptoms
as a result of self-harm)
2) Have there been incidents of self-harm during this period? (Please circle) YES / NO
If YES, please state an approximate number of incidences.............................................

169
Appendix G: Details of STEPPS Session Content
Every week the BEST scale, Emotional Intensity Continuum and Skills Monitoring Card are completed and reviewed prior to the individual session content.
Week Lesson/skill Content1. Introduction to Group &
awareness of illness. Awareness of BPD Goals for STEPPS Introduction to the ‘Emotional Intensity
Continuum’ Introduction to the reinforcement team
2. Filters Introduction to filters Completion of filter questionnaire (Pre) Common negative filters How to challenge filters Common helpful filters
Emotional Management Skills3. Distancing What is distancing?
How do you use distancing? Relaxation
4. Communicating, Part 1 What is communicating? Communicating thoughts, emotions &
physical sensations How to communicate feelings Relaxation
5. Communicating, Part 2 Review skills from last week Distance, then communicate worksheet
6. Challenging, Part 1 What does challenging mean? How do you challenge thoughts? Where do distorted thoughts come
from? Common thought distortions Challenging worksheet
7. Challenging, Part 2 Common myths about emotions Common thought distortions worksheet Distance, communicate then challenge
worksheet8. Challenging, Part 3 Review distance, communicate then
challenge worksheet9. Distracting, Part 1 What is distracting?
Distracting activities Positive affirmations and encouraging
statements Encouraging exercise Distracting, part 1 worksheet Distance, communicate, challenge,
distract worksheet10. Distracting, Part 2 Additional distraction techniques
Three relaxation strategies Imagery worksheet

170
Distance, communicate, challenge, distract worksheet
11. Managing problems, Part 1
What is the managing problems skill? Managing problems worksheet Distance, communicate, challenge,
distract & manage worksheet12. Managing problems, Part
2 ‘Letting go’ poem Visualisation worksheet Write your own visualisation script Distance, communicate, challenge,
distract worksheetBehavioural Management Skills13 Behaviour management Introduction to behaviour management
Behaviour management test14. Setting goals Setting lifestyle goals
Six steps to goal-setting Setting goals worksheet
15. Eating and sleeping Visualisation exercise Eating behaviours Healthy eating behaviours vs. eating
disordered behaviours Sleeping behaviours Sleep diary
16. Exercise, leisure & physical health
What is healthy exercise? Potential benefits of exercise &
exercise diary Leisure & leisure diary Pets Physical health & physical health diary
17. Abuse avoidance What is abuse avoidance? Abuse avoidance worksheet Avoiding abusive behaviours
worksheet Asking for help worksheet
18. Relationship behaviours, Part 1
Improving relationship skills Building and maintaining healthy
relationships Using your STEPPS skills to maintain
healthy relationships Warning signs of abusive or harmful
relationships Myths about relationship behaviours
19. Relationship behaviours, Part 2
Developing healthy boundaries Circle of support Filter questionnaire (post)
20. Wrapping it all up Course summary & group evaluation
171
Appendix H: Details of ethical review discussion on collecting group information relating to facilitation

172
Appendix I: Information on facilitator profession, training and supervision
173
Site code
No. of Facilitators and disciplines
Adherence to the model
01 2 facilitators Clinical Psychologists
Peer supervision was in place throughout with other STEPPS facilitators from another borough.
02 2 facilitators Clinical Psychologist Trainee Clinical
Psychologist
Monthly STEPPS supervision with facilitators in another borough to ensure adherence
Weekly reflection session between facilitators
03 2 facilitators
1 x senior mental health nurse (charge nurse, band 6)
1 x senior occupational therapist (band 6).
(Plus 1 x occupational therapist (band 5) observing as part of training)
2 day training in 2007 No supervision specifically for STEPPS
but supervision available via usual arrangements (ie: team supervision with a psychologist and individual clinical/managerial supervision).
04 3 facilitators Occupational Therapist Social Worker Assistant Psychologist
Weekly informal supervision pre and post STEPPS group for 30 minutes.
Formal supervision monthly x1 hour for each facilitator.
05 3 facilitators Counselling
Psychologist, OT Assistant Psychologist
Monthly supervision for facilitators
06 2 facilitators Senior clinical
psychologist Community
psychiatric nurse
Monthly group supervision led by consultant psychologist for all STEPPS facilitators. These supervision sessions cover usual supervision needs and also process issues, e.g., any changes in delivery/processes/outcome measures
07 3 facilitators CBT therapist Mental health social
worker Assistant psychologist
Regular STEPPS supervision was monthly which one member of the facilitation team would attend.
Weekly debrief sessions to discuss each group. This included observing fidelity to the model.
All facilitators were either experienced STEPPs facilitators/Trainers within the Trust or had attended one a one day training session provided by the Trust
08 3 facilitators Weekly supervision post- session

174
Appendix J Detailed Protocol for Facilitators
DETAILED PROTOCOL FOR FACILITATORS (Please read parts 1 and 2)Part 1: Facilitator tasks only (summary)
Prior to STEPPS group (optional)
If invitation letters are being sent to group members, the Participant Information Sheet could be included to give potential participants time to read about the study details.
Every session It would be helpful if group members are given time to complete the Skills Monitoring Card on a weekly basis as per the STEPPS protocol; group members could be prompted to do this when they complete the BEST form in each session.
Session 1 - Book the room for an extra 15 minutes, so that researchers will have time to talk to the group- Mention to the group that researchers will be coming at the end of the session to talk about a research study; it is up to group members if they want to stay.
Session 2 (T1) - Book the room for an extra 30 minutes, so that researchers will have time to collect consent forms and T1 measures- At the end of this session, the researchers will leave a cardboard box at the service base. The box will contain blank T2 and T3 measures for each study participant. Note: this box will only contain the additional measures that are not part of STEPPS. The standard STEPPS measures (BEST, Skills Monitoring Card, Filter Questionnaire) will be copied by the researchers so that the service or participants can keep the originals.
Session 9 (this may not be applicable to all groups)
- If participants have been keeping their own BEST forms and Skills Monitoring Cards (as opposed to the facilitators collecting them), please remind them to bring them all (weeks 2-9) to the session next week. - Remind group that the researchers will be attending the next session to collect T2 measures.
Session 10 (T2)
- Book the room for an extra 15 minutes, so that researchers will have time to collect the measures- Put the cardboard box in the group room at the start of the session. The box will contain envelopes clearly labelled with the participants’ names and “T2” – participants will need to complete the measures in the envelope at the end of this session or during the break. The researchers will collect these measures and the standard STEPPS measures when they come at the end of the session. - If the researchers are unable to attend on this date, please keep the completed measures in a secure place (e.g. with other group material) until the researchers are able to collect them.
Session 19 (this may not be applicable to all groups)
- If participants have been keeping their own BEST forms and Skills Monitoring Cards (as opposed to the facilitators collecting them), please remind them to bring them all (weeks 11-19) to the session next week. - Remind group that the researchers will be attending the next session.
Session 20 (T3)
- Book the room for an extra 15 minutes, so that researchers will have time to collect the measures- Put the cardboard box in the group room at the start of the session. The box will contain envelopes clearly labelled with the participants’ names and “T3” – participants will need to complete the measures in the

175
envelope at the end of this session or during the break. The researchers will collect these measures and the standard STEPPS measures when they come at the end of the session. - If the researchers are unable to attend on this date, please keep the completed measures in a secure place (e.g. with other group material) until the researchers are able to collect them. Part 2: Full study protocol including researcher activities
Prior to STEPPS Group
FACILITATORS: Preliminary information about the study can be given to STEPPS group members before the start of treatment (e.g. at screening assessments or introductory sessions). It may be possible to include the participant information sheet for the study when sending out the group invitation letters to patients. (NB this step is optional and will differ depending on service protocol)
STEPPS session 1
FACILITATORS: At the start of the session, group facilitators will mention to the group that a researcher(s) will be coming to the end of the session to talk about the research study (this may take 10-15 minutes - please extend room bookings to allow for this). It is up to group members if they want to stay.
NB: it is important for the research that all STEPPS members are encouraged to complete a BEST form and a Skills Monitoring Card weekly (as per the STEPPS protocol) – Please encourage all group members to do this.
RESEARCHERS: At the end of the session a researcher(s) will arrive and give the group verbal information about the study as well as a participant information sheet. Participants can ask questions about the study, and may seek guidance from their care team or group facilitator about their participation after this session.
STEPPS session 2 (T1)
RESEARCHERS: Researcher(s) will attend the end of STEPPS session 2 (again, group members can decide whether to stay after the group and room bookings will need to be extended for approx. 15-30 minutes). Signed informed consent will be obtained from group members who wish to participate in the study. These individuals will also be asked to complete the following additional T1 measures:
- Survey – demographics and service use - Quality of Life questionnaire- Group Session Rating Scale- Zanarini (self-report)
RESEARCHERS: Participants will be coded as they provide informed consent and each participant will be allocated an envelope labelled with their code (T1 measures can be put straight into these envelopes and should not contain any identifying information). Data
176
from routine questionnaires will be extracted onto record forms which are also anonymised using this system (this may involve photocopying measures with identifying information omitted e.g. folded over). Anonymised data will be taken and stored at the University of Surrey. The routine data collected will be:
- BEST- Filter questionnaire- Skills monitoring card
FACILITATORS: At the end of STEPPS session 2, facilitators will be given a box containing additional measures for T2 and T3. The box will be labelled with a site code. Inside the box will be individual envelopes labelled with each participants name (i.e. those who have provided informed consent). This box will need to be stored on site until T2 (STEPPS session 10)
STEPPS session 9
FACILITATORS: It would be helpful if facilitators could remind participants to bring all their BEST questionnaires and skills monitoring cards from the course so far to the next session (assuming group members normally keep these measures themselves)
STEPPS session 10 (T2)
FACILITATORS: At the start of STEPPS session 10, facilitators will put out the box of additional measures they were provided with and remind participants to complete these, either during the break or after the group. Participants can find their envelope (it will have their name written on it) in the box and should return the completed questionnaires to the box in the same envelope. Participants will be asked to stay for approx. 10 minutes at the end of the session so that the researcher(s) can extract the data from the routine questionnaires (please adjust room booking times to allow for this)
RESEARCHERS: A researcher(s) will arrive at the end of this session to collect additional and routine measures. All measures will be anonymised on site; no identifyable data will be taken off site. Additional measures will be taken out of the named envelopes and placed into the corresponding coded envelopes. The additional measures collected at T2 are:
- Survey - service use- Zanarini (self-report)- Group Session Rating Scale- Quality of Life scale
The routine measures that will be copied are:- BEST (from weeks 2 – 10)- Skills monitoring card (from weeks 2 – 10)
Collected data will be taken to the University of Surrey to be stored.
STEPPS session 19
FACILITATORS: It would be helpful if facilitators could remind participants to bring all their BEST questionnaires and skills monitoring cards from the course so far to the next session (assuming group members normally keep these measures themselves), in addition to the filter questionnaire completed during this session.

177
STEPPS session 20 (T3)
FACILITATORS: At the start of STEPPS session 20, facilitators will put out the box of additional measures they were provided with and remind participants to complete these, either during the break or after the group. Participants can find their envelope (it will have their name written on it) in the box and should return the completed questionnaires to the box in the same envelope. Participants will be asked to stay for approx. 10 minutes at the end of the session so that the researcher(s) can extract the data from the routine questionnaires (please adjust room booking times to allow for this)RESEARCHERS: A researcher(s) will arrive at the end of this session to collect additional and routine measures. All measures will be anonymised on site; no identifyable data will be taken off site. Additional measures will be taken out of the named envelopes and placed into the corresponding coded envelopes. The additional measures collected at T3 are:
- Survey - service use and qualitative questions- Zanarini (self-report)- Group Session Rating Scale- Quality of Life scale
The routine measures that will be copied are:- BEST (from weeks 11 – 20)- Skills monitoring card (from weeks 11 – 20) - Filter questionnaire (routinely completed in session 19)
Collected data will be taken to the University of Surrey to be stored.
6-7 weeks after the end of the STEPPS group
RESEARCHERS: If participants requested to be contacted by post for the follow-up measures, these can be sent out six weeks after the end of the STEPPS group (i.e. two weeks before T4) with a letter indicating the date the measures should be completed. If participants requested to be contact by email to complete the follow-up measures online, an email can be sent out seven weeks after the end of the STEPPS group (i.e. one week before T4) reminding them to do so.
2 months after the end of the STEPPS group (T4)
PARTICIPANTS: Having been prompted by researchers, participants will be responsible for completing the follow-up measures at this time. If completing them by post they will need to send them back to the researchers (a stamped addressed envelope will have been provided with the measures). The follow-up measures to be completed are:
- BEST- Skills monitoring card- Measure of service use- Quality of Life scale
December 2016
This is the estimated end of the data collection period. After this time participants will no longer be able to withdraw from the study. At this time we will select winners for the prize draw and contact winning participants directly.
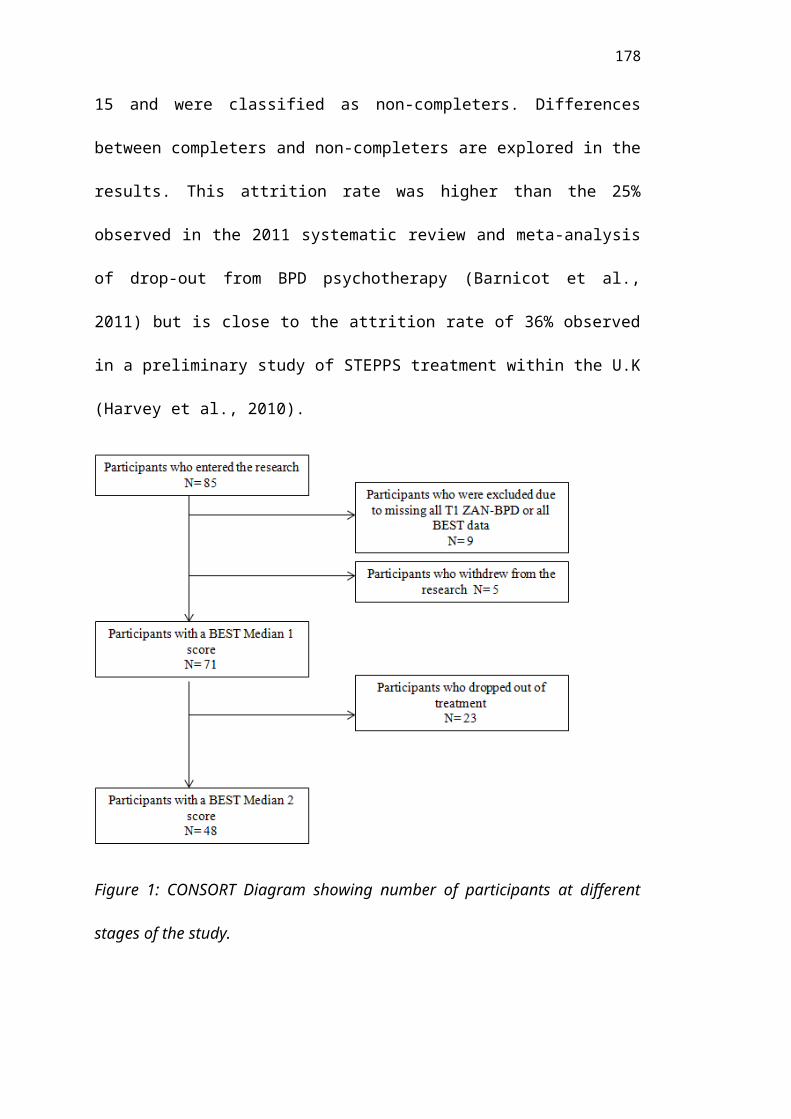
178
Appendix K: Information sheet provided to participants prior to consent to treatment
Participant Information Sheet (Version 4: 19/1/16)
Project title: Predictors of outcomes, predictors of quality of life and mechanisms of change in STEPPS
Introduction
We are three Trainee Clinical Psychologists studying at the University of Surrey. We would like to invite you to take part in a research project, which we are undertaking as part of our training (PsychD). Before you decide whether to participate, you need to understand why the research is being done and what it will involve for you. Please take the time to read the following information carefully and talk to others about the study if you wish (e.g.) your care coordinator.
What is the purpose of the study?
The NHS offer STEPPS (Systems Training for Emotional Predictability and Problem Solving) as a treatment option for people with a diagnosis of (or symptoms of) Borderline Personality Disorder (BPD). It is important that the NHS understands how this treatment works, who it works for, and whether any benefits are meaningful for those who receive it. This study aims to explore those questions by looking at group participants’ experiences throughout the treatment.
Why have I been invited to take part in the study?
Everyone who has been offered the STEPPS treatment program on which you are enrolled has been invited to take part in our research.
Do I have to take part?
No, you do not have to participate. There will be no adverse consequences in terms of your care or treatment if you decide not to participate. You can withdraw from this study at any time during the STEPPS treatment program without giving a reason and you can ask for your data to be withdrawn at any point before the end of data collection (we estimate this will be 30th December 2016). The data collection end date means that after that, the data will be entered into an analysis, and it will not be possible to withdraw your data. If you drop out of the research study but do not request your data to be withdrawn before 30th December 2016, the data may still be used.

179
What will my involvement require?
Participation in this research will not involve much input over and above what you would normally do as part of the STEPPS group treatment. This is because, if you consent, we will use answers to questionnaires that you would be filling in anyway. In addition, we have provided three additional questionnaires, which you will be asked to fill in at three time points (sessions 2, 10 and 20). You will be able to fill these when you attend the group session. We will collect follow-up questionnaires two months after the end of the group, to see whether there has been any further change in this time. On the consent form, there is space to provide either an email address or a postal address to receive these. One of the additional questionnaires asks for your feedback on your experience at the end of the treatment programme; it is possible that anonymised quotes from some questionnaires may be used in the write up of the research to illustrate feedback that was commonly given.
If you wish, we will also enter you into an optional prize draw – all participants will have the chance to win one of the following:
1x £25 Amazon voucher OR 2x £10 Amazon vouchers
Winners will be drawn in December 2016. If you have won we will contact you using the details you give us on the consent form.
What are the possible disadvantages or risks of taking part?
We do not anticipate any negative effects of participating in this research. However, we understand that some individuals may find it stressful to complete questionnaires, and may worry about the consequences of expressing negative feedback or criticism. If you experience any discomfort as a result of participating, you are encouraged to speak to your care coordinator or one of your group facilitators about your concerns.
What are the possible benefits of taking part?
Participating in this research may give you the opportunity to reflect on your progress through the group. In addition, we hope that your participation will contribute to improving how we deliver STEPPS in future.
Will my taking part in the study be kept confidential?
Yes. All of the information you give will be anonymised so that those reading reports from the research will not know who has contributed to it. Data will be stored securely in line with University of Surrey policy and personal data will be handled in accordance with the Data Protection Act (1998).
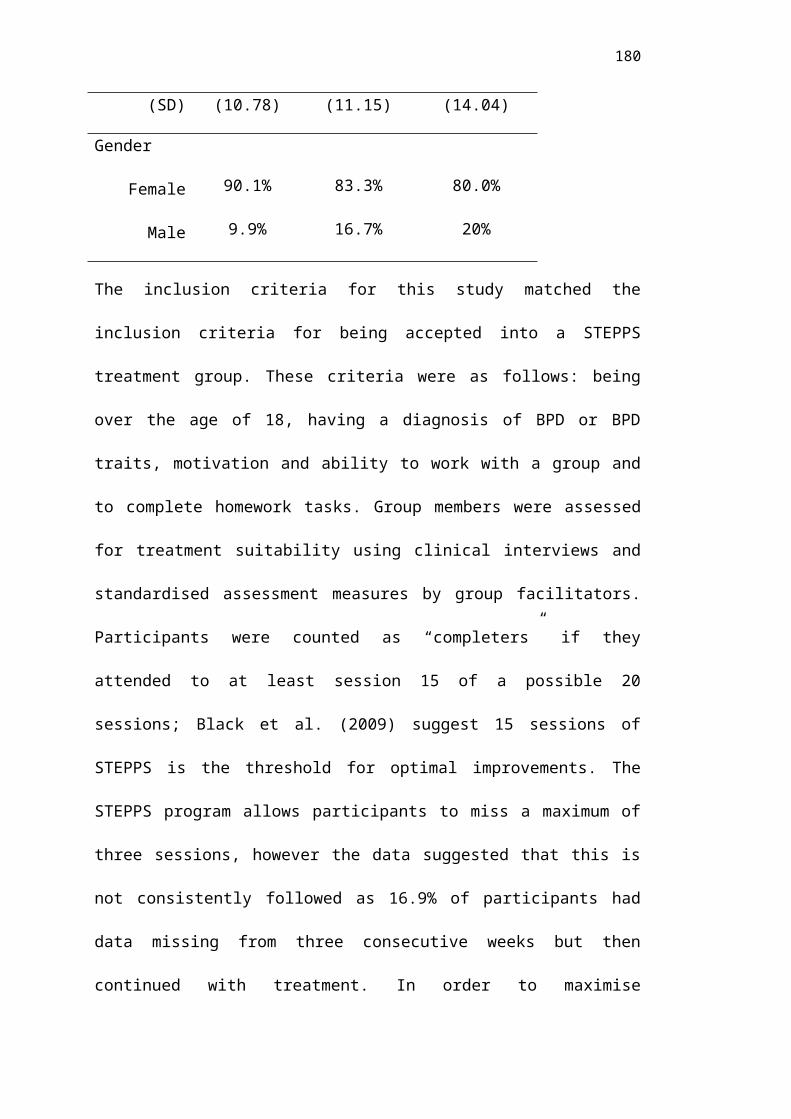
180
What happens when the research study stops?
We aim to complete data collection by December 2016, the results of the study will then be written up by December 2017. After this date, if you would like to receive a summary of the findings, please indicate this on the consent form. All anonymised data will be stored securely for a minimum of 10 years at the University of Surrey. Personal data (e.g. email or postal addresses provided on the consent form) will be destroyed when the study ends, in September 2017. As this research is being conducted as part of three students’ academic degrees (PsychD qualifications), anonymised results from the study may also be presented in other formats e.g. conferences, presentations, and research articles published in academic journals. No data would be published that could identify any individual.
Who is organising and funding the research?
This research is organised by the University of Surrey. It is not funded as it is part of the requirements of our doctoral qualification to complete a research project.
What if there is a problem? (Contact details of researcher)
Any complaint or concern about any aspect of the way you have been dealt with during the course of the study will be addressed. You may contact any of the following people (we cannot guarantee immediate response):
NAME (student): EMAIL NAME (supervisor): EMAIL
If you wish to contact someone outside the research team:
NAME (JOB DESCRIPTION) EMAIL:
If you do not have access to email you can leave us a message on the following mobile number:
STEPPS research team mobile:
Who has reviewed the project?
This study has been reviewed and received a favourable ethical opinion from South East Coast - Surrey Research Ethics Committee.
Thank you for taking the time to read this Information Sheet.
Appendix L: Consent form

181
Consent Form (Version 3: 4/12/2015)
Title of project: Predictors of outcomes, predictors of quality of life and mechanisms of change in STEPPS
I have read and understood the Information Sheet provided (version 4, 19/1/2016). I have been given a full explanation by the researchers of the nature, purpose, location and likely duration of the study, and of what I will be expected to do. I have been given the opportunity to ask questions on all aspects of the study.
I agree to comply with any instruction given to me during the study and to co-operate fully with the researchers. I shall inform them (or a member of my care team) immediately if I experience any negative effects to my wellbeing as a result of my participation.
I consent to my questionnaire responses, as outlined in the accompanying information sheet, being used for this research, which will be written up as part of PsychD Clinical Psychology qualifications for three students; this may include quotes from my feedback sheet at the end of the STEPPS treatment. I understand that all personal data relating to volunteers is held and processed in the strictest confidence, and in accordance with the Data Protection Act (1998). All data will be anonymised and no identifiable data will be shared with anyone outside my care team.
I understand that I am free to withdraw from the study at any time, and can request for my data to be withdrawn from the study, until 30 th December 20164, without needing to justify my decision and without prejudice.
I agree to complete follow-up questionnaires two months after the end of the group (please provide either an email address or a postal address on the next page to receive these)
I confirm that I have read and understood the above and freely consent to participating in this study. I have been given adequate time to consider my participation and agree to comply with the instructions and restrictions of the study.
I would like to be entered into the prize draw (if you win, we will use the contact details you have provided on the next page)
I would like a summary of the results of the study (if yes, we will use the contact details you have provided on the next page)
4 Please note this is an estimated date, which represents the proposed end of data collection and the start of data analysis.

182
Name of participant (BLOCK CAPITALS) ......................................................
Signed...................................................... Date......................................................
Name of researcher/person taking consent………………………………………….
Signed.................................................... Date……………………………………..
Contact details for follow up questionnaires (also for prize draw and summary of results if you have opted in for these)
Please provide either an email address or a postal address (If you provide an email address we will ask you to complete the follow up questionnaires online. If you provide a postal address we will send you paper copies of the follow up questionnaires with a stamped addressed envelope to return them to us):
Name………………………………………………………………………………………
…………
Email address:
……………………………………………………………………………………..
Postal address:
…………………………………………………………………………………………
Appendix M: Copy of letter of Ethical Approval

183
184

185

186

187

188
189

190

191

192
193
Appendix N: Copies of R&D Approvals

194

195

196
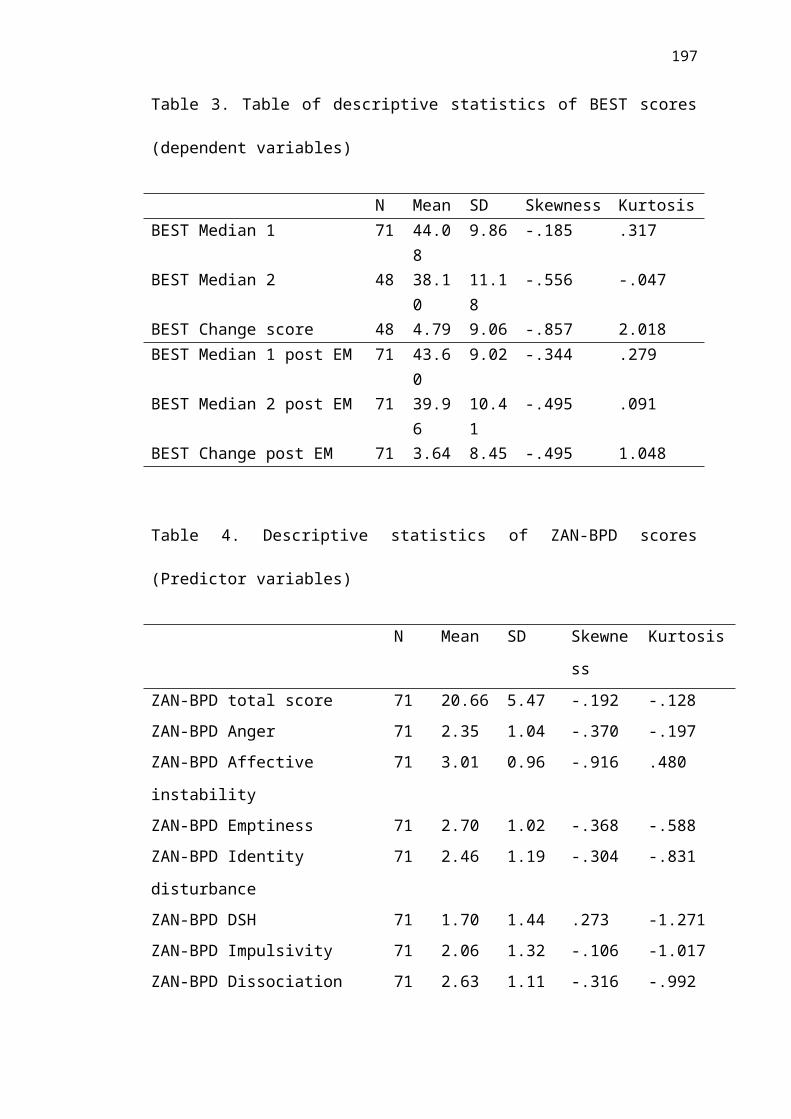
197

198

199

200
Appendix O: Independent Variables: Test of normality, Boxplots and Histograms
ZAN-BPD measure of affect instability was significantly negatively skewed, demonstrating that scores clustered around the high end. All other Z scores demonstrated no significant skew. Self-harm and suicidal behaviours and efforts to avoid abandonment subscales indicated significant kurtosis demonstrating a relatively flat distribution of scores.
Ghasemi and Zahediasl (2012) argue that the Shapiro-Wilk test of normality is a more accurate measure of normality as it has better power than the Kolomogorov-Smirnov. Due to the relatively low sample size in this study, the Shapiro-Wilk test of normality is reported. Only the ZAN-BPD total score (p=0.705) was normally distributed. Boxplots identified some outliers, however these were not identified as extreme outliers (more than three box lengths from the edge of the box) and 5% trimmed means did not vary largely from the full mean value suggesting these scores were not biased by outliers.
Table 13: Z scores for skewness and kurtosis
Skewness SE of Skew
Skew Z score
Kurtosis
SE of Kurtosis
Kurtosis Z score
ZanTotal-0.192 0.285
-0.673684211 -0.128 0.563 -0.22735
ZanAnger-0.37 0.285
-1.298245614 -0.197 0.563 -0.34991
ZanAffect-0.916 0.285
-3.214035088 0.48 0.563 0.852575
ZanEmpti -0.368 0.285 -1.29122807 -0.588 0.563 -1.0444ZanIdenti
-0.304 0.285-
1.066666667 -0.831 0.563 -1.47602ZanDSH 0.273 0.285 0.957894737 -1.271 0.563 -2.25755ZanImpulsi
-0.106 0.285-
0.371929825 -1.017 0.563 -1.80639ZanDissoc -0.316 0.285 -1.10877193 -0.992 0.563 -1.76199ZanAbandon 0.08 0.285 0.280701754 -1.174 0.563 -2.08526ZanRelation 0.163 0.285 0.571929825 -1.03 0.563 -1.82948ZanDisturbRelate
-0.017 0.285-
0.059649123 -0.648 0.563 -1.15098ZanBehDysreg 0.056 0.285 0.196491228 -1.022 0.563 -1.81528ZanAffectDysreg
-0.618 0.285-
2.168421053 0.61 0.563 1.083481

201

202

203
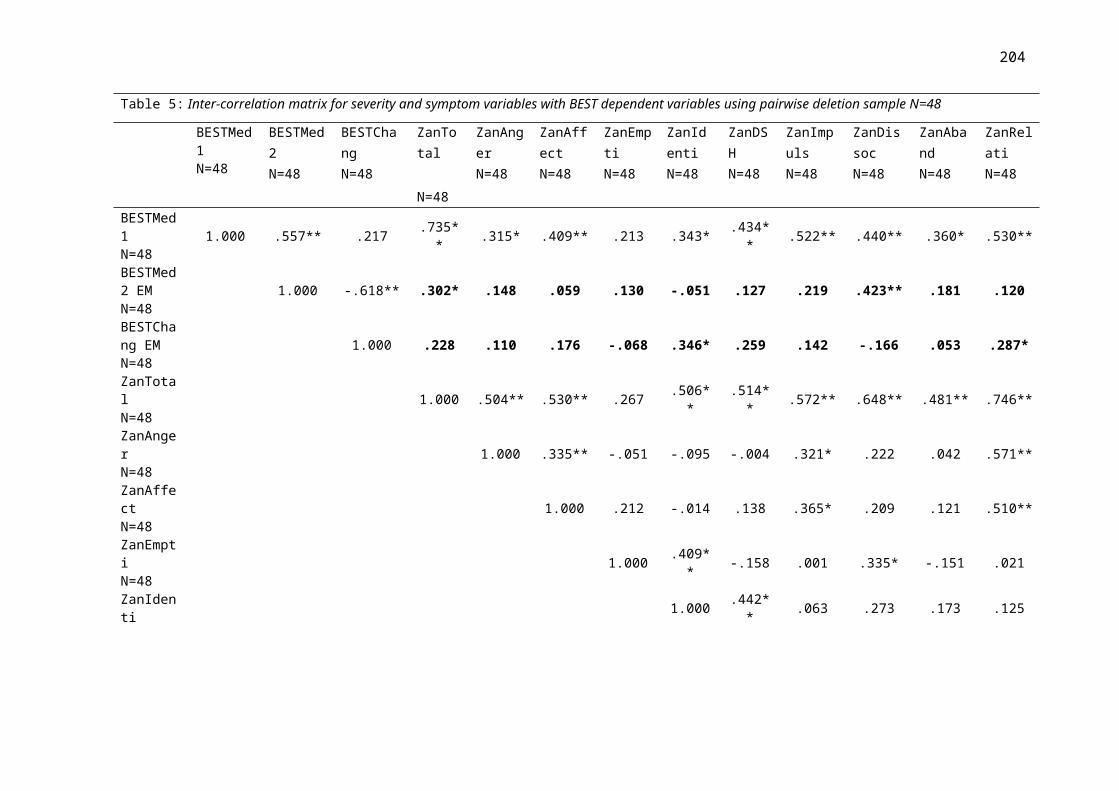
204

205

206
Appendix P: Dependent Variables: Test of normality, Boxplots and Histograms
Dependent Variables: Skewness and Kurtosis
48 participants had a BEST Change score, demonstrating that they attended at least one session in both the first and second half of treatment. Z scores were calculated from Skewness and Kurtosis values and compared to a 1.96 criteria to establish whether these values were significant (at 0.05 level).
BEST Change score was significantly negatively skewed, demonstrating that change scores were clustered around the high end. Z scores for BEST Change also indicated significant positive kurtosis demonstrating a tail-heavy distribution of scores. The significant Shapiro-Wilk value for the BEST Change score demonstrated that this score was not normally distributed (p=0.02), however BEST Median 2 score was normally distributed (p=.20).
Despite some skew and kurtosis in these variables, assumptions for regression analyses rely to residuals being normally distributed rather than raw scores. Histograms were examined and they suggested a reasonably normal distribution of data. Boxplots identified some outliers in BEST scores, however these were not identified as extreme outliers (more than three box lengths from the edge of the box) and 5% trimmed means did not vary largely from the full mean value suggesting these scores were not biased by outliers.
Table 14. Test of Normality

207
Tests of Normality
Kolmogorov-Smirnova Shapiro-Wilk
Statistic df Sig. Statistic df Sig.
BESTMedian1 .072 71 .200* .989 71 .797
BESTMedian2 .088 48 .200* .968 48 .205
BESTChange .129 48 .044 .940 48 .016
Table 15: Z scores of skewness and kurtosis
Skewness
SE of Skewness
Z score of Skew Kurtosis
SE of Kurtosis
Z score of Kurtosis
BESTMedian1
-0.185 0.285
-0.6491228
07 0.317 0.563 0.563055062BESTMedian2
-0.556 0.343
-1.6209912
54 -0.047 0.674 -0.069732938BESTChange
-0.857 0.343
-2.4985422
74 2.018 0.674 2.994065282Histograms and Boxplots
Figure 11. Histogram of BEST Change score
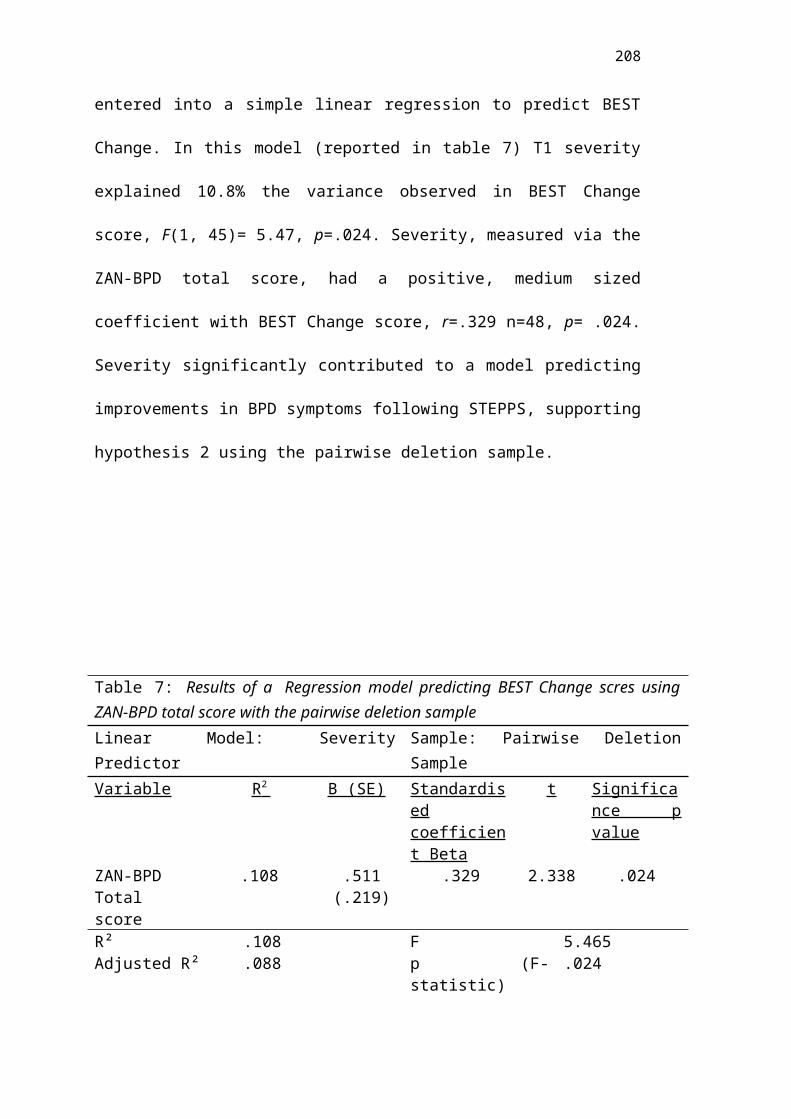
208
Figure 12. Boxplot of BEST Change score
Figure 13. Boxplot of BEST Median 2

209
Appendix Q: Comparisons of completers and non-completers
Alternative cut-off (session 18)
STEPPS criteria for dropout includes missing a consecutive three sessions, by this definition anyone who attended up to session 18 would be classified as completing treatment (unfortunately many groups did not stick to this criteria and allowed participants to attend following three consecutively missed sessions). 40 participants attended to, at least, session 18, compared to 31 who dropped out before session 18. Comparisons of these groups were examined to explore any significant between group differences.
Completers were compared to non-completers on each of the baseline measures using t-tests (except DSH which was compared using Mann Whitney U test). Using this criterion for drop-out, the groups did not significantly differ on any of the baseline measures tested.
Figure 14. Histogram of BEST Median 2

210
Appendix R: Preliminary Investigations of Relationships with dependent variables
Table 16: Confounding Covariates
Pairwise deletion sample N=48
BEST Median 2 BEST Change
Confounding variables
Age -0.050 (p=0.741) -0.104 (p=0.486)
Years since diagnosis -0.017 (p=0.910) -0.074 (p=0.627)
No. STEPPS groups started 0.200 (p=0.177) -0.154 (p=0.300)
No. STEPPS groups completed 0.038 (p=0.799) -0.109 (p=0.467)
Service usage: Crisis team 0.039 (p=0.798) 0.158 (p=0.300)
Service usage: A&E 0.108 (p=0.480) 0.093 (p=0.543)
Service usage: Home treatment 0.061 (p=0.693) 0.122 (p=0.425)

211
team
Service usage: Psychiatric inpatient 0.108 (p=0.479) -0.391* (p=0.008)
Service usage: General inpatient -0.038 (p=0.803) 0.170 (p=0.265)
No. DSH 0.134 (p=0.373) 0.080 (p=0.597)
Estimated full sample N=71
BEST Median 2 BEST Change
Confounding variables
Age -0.019 (p=0.877) -0.036 (p=0.769)
Years since diagnosis -0.070 (p=0.570) 0.026 (p=0.832)
No. STEPPS groups started 0.127 (p=0.293) -0.067 (p=0.580)
No. STEPPS groups
completed
0.015 (p=0.900) -0.079 (p=0.518)
Service usage: Crisis team 0.048 (p=0.704) 0.064 (p=0.615)
Service usage: A&E 0.085 (p=0.505) 0.032 (p=0.803)
Service usage: Home
treatment team
0.047 (p=0.714) 0.054 (p=0.670)
Service usage: Psychiatric
inpatient
0.082 (p=0.519) -0.325* (p=0.009)
Service usage: General
inpatient
0.018 (p=0.890) 0.033 (p=0.795)
No. DSH -0.009 (p=0.940) 0.233 (p=0.058)
Continuous confounding covariates were correlated with BEST Change score and BEST Median 2 score (BEST dependent variables) to examine any relationship between these variables prior to entering them into regression analyses. There was very little variation in participant’s service usage at baseline and scores were not normally distributed. Scatterplots were generated to examine possible relationships between baseline variables and BEST dependent variables. Only baseline admission to psychiatric hospital at baseline was significantly related to dependent variables. However only one participant had this kind of admission and it was later statistically identified as an outlier.
Categorical baseline variables were also examined to explore their relationship with the BEST dependent variables. T-tests were used to explore differences in BEST dependent variables between the following baseline variable groups; presence of diagnosis, engagement in other treatment and previous engagement in STEPPS. None of these showed significant group differences. However, it is worth noting that there were very unequal numbers between these group. Very few participants were

212
without a BPD diagnosis, only 6 participants were partaking in current additional therapy and only two participants had previously engaged in STEPPS. None of these variables were entered into the regression analyses.
A one-way analysis of variance was conducted to examine differences between the individual STEPPS groups. A total of 14 different groups were included into the final sample, sites 1 and 11 were removed from the analysis as each only had one participant with a BEST Change score. Levene’s test for homogeneity of variance was significant indicating that this assumption was violated, for this reason Welch’s F is reported. Welch’s F= 1.869 (p=0.17) demonstrating that BEST Change score did not significantly differ between groups.
When the estimated full sample (N=71) was examined, there was a significant negative correlation between the number of inpatient psychiatric treatment admissions and BEST Change score (r= -.391, p=0.008).
Predictor variables
Each predictor variable was individually correlated with BEST dependent variables. Scatter plots were generated to examine relationships between variables.
The relationship between BPD severity (ZAN-BPD total score) and BEST dependent variables were investigated using Pearson product-moment correlation coefficient. There was a medium, positive correlation between BPD severity and BEST Change score, r=0.371, n=48, p= 0.009. There was also a medium, positive correlation between BPD severity and BEST Median 2, r=0.330, n=48, p= 0.022. Both of these correlations demonstrated that more severe BPD was associated with greater improvements following treatment. Positive correlations were also observed with the estimated full sample were used (BPD severity and BEST Change score: r=0.247, n=71, p= 0.038. BPD severity and BEST Median 2: r=0.343, n=71, p= 0.003).
Relationships between individual BPD symptoms and BEST dependent variables were investigated using Spearman’s rho. Identity disturbance demonstrated a medium positive correlation, rho= 0.346, n=48, p=0.016, with BEST Change score, with higher scores in identity disturbance associated with larger improvements on the BEST following treatment. Relationship instability also reached statistical significance when correlated with BEST Change score, rho= 0.287, n=48, p=0.048. This was a small to medium positive correlation demonstrating that higher relationship instability scores were associated with larger changes in BEST score. Dissociation demonstrated a medium positive correlation, rho= 0.423, n=48, p=0.003, with BEST Median 2 score, with higher scores in dissociation associated with larger BEST Median 2 score (at the end of treatment). High baseline dissociation was related to higher BPD scores at the end of treatment.
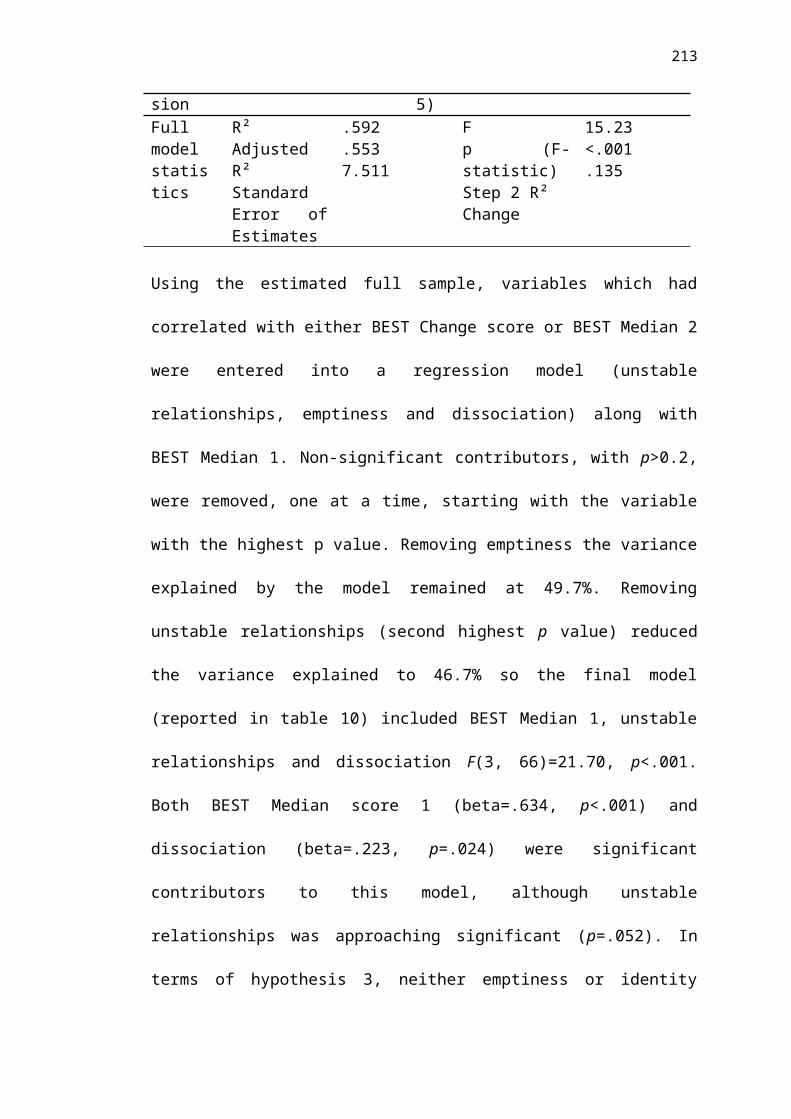
213
No other symptom level measure was significantly correlated with BEST dependent variables. None of the symptom level predictors correlated with each other with a value>0.7 so these variables could be entered into the same regression model without violating assumptions.
When the estimated full sample was examined, emptiness demonstrated a small positive correlation, rho= 0.268, n=71, p=0.024, with BEST Median 2, with higher scores in emptiness associated with higher scores at the end of treatment. Dissociation demonstrated a medium positive correlation, rho= 0.383, n=71, p=0.001, with BEST Median 2, with higher scores on dissociation associated with higher scores at the end of treatment. When symptoms were correlated with BEST Change score, relationship instability also reached statistical significance, rho= 0.246, n=71, p=0.039. This was a small positive correlation demonstrating that higher relationship instability scores were associated with larger changes in BEST score.
Appendix S: Regression analysis additional information
Preliminary analyses were conducted to ensure no violation of the assumptions of normality, linearity, and homoscedasticity.
An outlier was identified by examining a regression scatterplot (below). One participant indicated an inpatient admission at baseline. This was further explored using Mahalanobis distance values, the value for this participant was 62.02 which greatly exceeded the critical value of 13.82 for a regression with two independent variables. For this reason, this participant’s data was removed from all subsequent regression analyses.
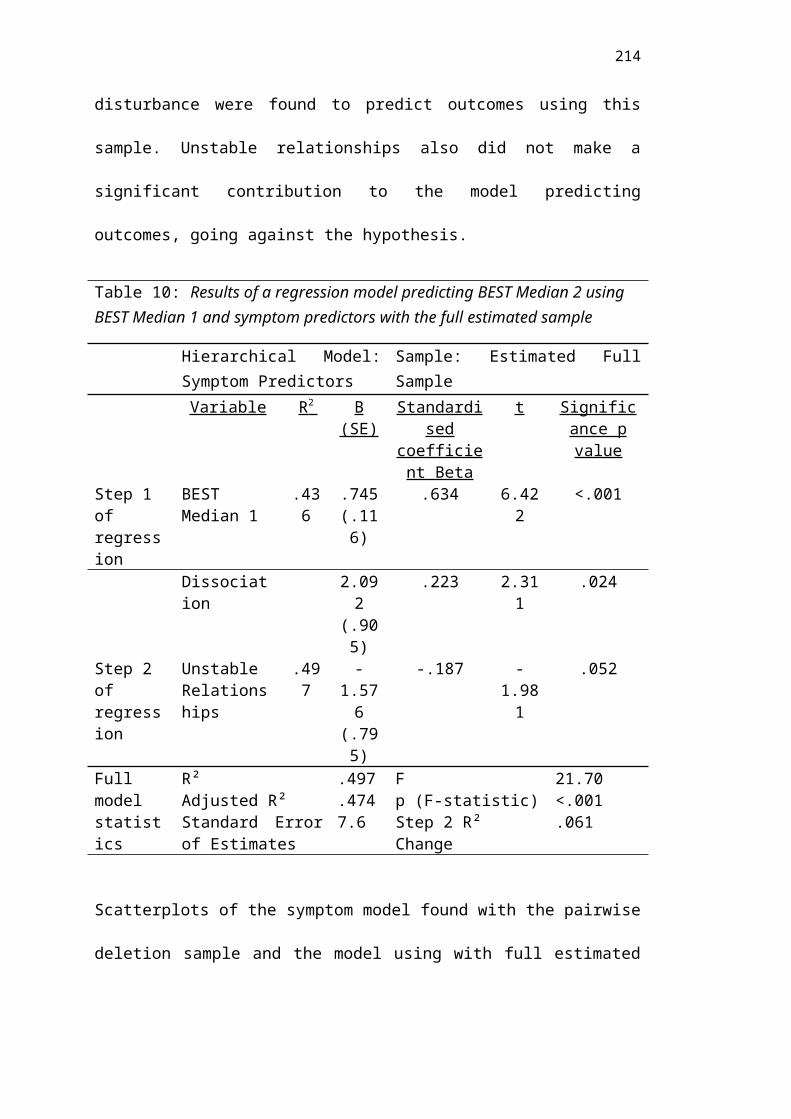
214
Collinearity diagnostics
Tolerance values below 0.10 and VIF values above 10.0 are considered a violation of assumptions of multicollinearity.
Figure 15. Scatterplot of Regression with BEST Change score
Table 17. Collinearity diagnostics of regression modelsPairwise Deletion Sample
Model Collinearity StatisticsSeverity Model Tolerance VIF
ZanTotal 1.000 1.000Symptom Model
BEST Median 1 1.000 1.000
BEST Median 1ZanIdenti
ZanDissocZanRelation
.719
.833
.783
.859
1.3091.2001.2771.164
EM full SampleModel Collinearity Statistics
Severity Model Tolerance VIF
ZanTotal 1.000 1.000Symptom Model
BEST Median 1 1.000 1.000BEST Median 1
ZanDissocZanRelation
.783
.816
.861
1.2771.2251.162

215
Assumptions of normality, linearity, and homoscedasticity
Severity Model using pairwise deletion
No cases had standardised residuals over 3.0 or below -3.0. Mahalanobis distance values did not exceed criteria.

216
Severity Model using EM full sample
No cases had standardised residuals over 3.0 or below -3.0. Mahalanobis distance values did not exceed criteria.
Figure 16. PP Plot of severity regression standardised residuals of BEST Change score from pairwise deletion sample
Figure 17. Scatterplot of severity predicotors of BEST Change score with pairwise deletion sample
217
Symptom regression using pairwise deletion sample
One case had standardised residuals below -3.0 however Cook’s maximum distance value (.535) does not suggest this value would have an undue influence on the results based on Tabachnick and Fidell’s criteria of score over 1 being problematic. Mahalanobis distance values did not exceed criteria.
Figure 19. Scatterplot of severity predictors for BEST Change score with EM sample
Figure 18. PP Plot of severity regression standardised residuals of BEST Change score from EM sample

218
Symptom regression using EM full sample
One case had standardised residuals over 3.0 however Cook’s maximum distance value (.198) does not suggest this value would have an undue influence on the results. Mahalanobis distance values did not exceed criteria.
Figure 20. PP Plot of symptom regression standardised residuals of BEST Median 2 from pairwise deletion sample
Figure 21. Scatterplot of symptom predictors with BEST Median 2 from pairwise deletion sample
219
Appendix T: Exploring regression with all 9 symptom measures.
An alternative approach to the symptom level regression analysis would have been to enter all 9 variables into a regression model and work through, removing those which did not significantly contribute to the model. However, this method would have
Figure 23. Scatterplot of symptom predictors with BEST Median 2 from EM sample
Figure 22. PP Plot of symptom regression standardised residuals of BEST Median 2 from EM sample
220
statistically required a larger number of participants to enter all 9 nine variables into a single model. Despite this limitation, this approach was also explored, the approach produced a model with the same variables. When all 9 symptoms are entered into a regression model it remained that only identity disturbance and dissociation made significant contributions to the model as demonstrated in the table below.
Table 18: Regression using all 9 symptom level predictors
Model
Unstandardized
Coefficients
Standardized
Coefficients
t Sig.
95.0% Confidence
Interval for B
B
Std.
Error Beta
Lower
Bound
Upper
Bound
1 (Constant) 3.267 5.764 .567 .574 -8.342 14.877
BESTMedian1 .782 .127 .676 6.154 .000 .526 1.038
2 (Constant) 6.147 6.234 .986 .331 -6.497 18.790
BESTMedian1 .893 .155 .772 5.744 .000 .578 1.208
ZanAnger -1.722 1.438 -.161 -1.198 .239 -4.639 1.194
ZanAffect -1.420 1.396 -.122 -1.017 .316 -4.252 1.412
ZanEmpti .188 1.409 .017 .133 .895 -2.669 3.045
ZanIdenti -3.399 1.203 -.360 -2.826 .008 -5.839 -.960
ZanDSH -.768 .985 -.099 -.780 .440 -2.766 1.229
ZanImpulsi .680 1.050 .079 .648 .521 -1.449 2.809
ZanDissoc 2.891 1.196 .287 2.418 .021 .466 5.315
ZanAbandon .680 .998 .080 .681 .500 -1.345 2.705
ZanRelation -.327 1.218 -.036 -.268 .790 -2.796 2.143
Appendix U: Eigen values of symptom level predictors
Table 19: Eigen values for regression model with symptom level predictors using the pairwise deletion sample

221
Collinearity Diagnosticsa
Mode
l
Dimensio
n
Eigenvalu
e
Conditio
n Index
Variance Proportions
(Constant
)
BESTMedian
1
ZanIden
ti
ZanDisso
c
ZanRelatio
n
1 1 1.977 1.000 .01 .01
2 .023 9.335 .99 .99
2 1 4.517 1.000 .00 .00 .01 .01 .01
2 .266 4.121 .00 .00 .12 .00 .77
3 .110 6.396 .02 .01 .73 .34 .18
4 .086 7.267 .17 .05 .11 .63 .01
5 .021 14.694 .80 .94 .03 .02 .03
a. Dependent Variable: BESTMedian2
Table 20: Eigen values for regression model with symptom level predictors using the EM full sample
Collinearity Diagnosticsa
Model Dimension Eigenvalue
Condition
Index
Variance Proportions
(Constant) BESTMedian1 ZanDissoc ZanRelation
1 1 1.980 1.000 .01 .01
2 .020 10.024 .99 .99
2 1 3.667 1.000 .00 .00 .01 .02
2 .226 4.032 .02 .01 .04 .95
3 .089 6.402 .09 .04 .92 .00
4 .018 14.141 .89 .95 .03 .04
a. Dependent Variable: BESTMedian2
Appendix V: Content Analysis
Qualitative data was gathered from participants to gather information on their perceptions of their suitability for STEPPS treatment.
222
Description of qualitative data collection
Quantitative and qualitative data collection occurred in parallel but qualitative data was only collected at T3. It was intended that a convergent mixed methods framework (Fetters, Curry & Creswell, 2013) would be used to integrate quantitative data from questionnaire measures and qualitative data from open ended feedback questions on participants’ views on their suitability for STEPPS treatment. Although the design would not have been strictly a mixed method as both quantitative and qualitative data were analysed using quantitative analyses, the mixed methods framework was considered a helpful framework for integrating these findings. Qualitative data was gathered alongside quantitative in order to elaborate and contextualise quantitative findings in relation to the participants’ experiences. Qualitative data was gathered through written feedback questions asking about participants’ views about their suitability to treatment.
Measure
Qualitative feedback
An additional qualitative feedback form was administered at T3 to gather supportive qualitative data which could act to disambiguate quantitative results. These questions focused on participants views of their suitability for STEPPS treatment and would be subjected to quantitative content analysis.
Plan for analysis
Separate analyses of the quantitative and qualitative data sets were conducted. Integration of qualitative and quantitative data was to occur through merging these results. Findings were intended to be integrated within the discussion through narrative using a weaving approach for reporting the findings with a commentary on how these data sets relate.
To incorporate and examine participant’s perceptions about their membership in STEPPS treatment qualitative data was gathered through questionnaires asking participants about their views on their own suitability for STEPPS and its relevance to them. Quantitative content analysis was used to reduce the qualitative data gathered from the feedback questions given to participants into themes and categories. An inductive approach was taken with a procedure following that outlined by Elo & Kyngäs (2008). Through examination of the manifest content and substantive features of the text, units of code were extracted and refined. The first stage of the analysis involved open coding of the data, where responses were very broad and varied this information was then collapsed into distinct categories of related content. As additional themes emerged, codes were added to capture these until an exhausted list of categorise were created.
Code book for Content Analysis

223
1. Suitability to treatment (1: Yes, 2: No, 3: Partially/mixed)2. Why suited (1: readiness/stage of change, 2: structured and organised format,
3:long time frame, 4: valuing shared experience, 5: increased understanding, 6:helping others, 7: facilitators, 8:tracking progress, 9: relevant content, 10: skills and techniques (e.g. filters), 11: in-depth, 12: made improvements/ found helpful)
3. Why not suited (1: difficult hearing others’ problems, 2:relaxation, 3: group setting, 4: felt different to others, 5:relationships with other groups members, 6: too short 7: some content irrelevant)
4. Was all content relevant to you (1: Yes, 2: No)5. Aspects not relevant (1: insufficient relaxation, 2:relationships with others, 3:
unspecified, 4: drugs and alcohol, 5: goal setting, 6: work/leisure balance, 7: lifestyle, 8: abuse in relationships, 9: other people’s experiences)
Results
Qualitative data was collected from 42 participants who completed treatment, responses were varied in content and the amount of information provided. As qualitative data was limited, themes were formed around the questions participants answered. Small combinations of words and short phrases were clustered into content categories. A second coder rated 48% of the data, inter-coder reliability was established using Krippendorff's alpha and is presented for each item below each table. Table 1 presents the answers from a closed question and data from open-ended questions are presented in tables 2, 3 and 4. The code book for scoring during the content analysis and sample scoring can be found below.
Table 21. Suitability to treatmentUnit of code Number of responsesYes 34No 2Partly/ mixed 6Krippendorff's alpha coefficient from inter-rating: 1.00
81% of participants who completed treatment and completed the qualitative questionnaires perceived themselves as being suited to STEPPS treatment. Only two participants who completed treatment felt that they were not suited to STEPPS.
Table 22. Why suitedCategories Including Number of responsesReadiness to change Felt ready/ right time 3Program factors Structure/ organisation/ format
Long time frame/ In-depth/ Tracking progress
7
Facilitators 3

224
Group Valuing other group members/ shared experience/ Helping others
7
Content Understanding diagnosis/ experiences/ self Relevant content/ made sense Skills based/ techniques
15
Unspecified 5Krippendorff's alpha: 0.71
There were a number of varied reasons why people felt they were suited to STEPPS, these fell largely into five broad categories; readiness to change, program factors, facilitators, group and content. A final category was included to capture answers which did not specify a reason for suitability. The most popular reasons for feeling suited to STEPPS related to relevant content which helped people understand their diagnosis better. Other popular reasons included feeling suited to the structure and benefiting from working within a group with shared experiences.
Table 23. Why not suitedCategories Including Number of responsesContent Content irrelevant 1Experience of group Difficult hearing others’
problems/ Felt different to others/ No relationships with other group members/ Group setting
3
Format Too short /Disruptive group 1Krippendorff's alpha: 1.00
There were much fewer answers to why participants felt treatment was not suited to them reflecting the fewer participants who felt unsuited to treatment. These answers largely focused on participant’s struggling with attending therapy in a group.
Table 24. Aspects not relevantCategories Including Number of responsesSpecific aspect of group content
Including drug and alcohol misuse/ abuse etc
9
Group Other people’s experiences 1Unspecified 2None 19Krippendorff's alpha: 1.00
45% of participants who completed the questionnaires felt that all aspects of STEPPS were relevant to them. This is fewer than the 81% of participants that felt that STEPPS was well suited to them demonstrating that some participants still experienced STEPPS as well suited despite not relating to all aspects of the treatment

225
program. The aspects which participants identified as not relevant to them largely related to a specific aspect of treatment such as work on addiction or coping with abuse. This is to be expected from a group which is designed to cover a wide array of topics which address different participants’ difficulties.
Discussion
Data from the content analysis came only from those who attended treatment to session 20. The majority of these participants felt that STEPPS was suited to them. Future research which gathered qualitative feedback data from both completers and participants who dropped out of treatment early would be interesting to compare the views of these two groups. It is possible that this may generate further hypotheses about participant’s suitability to treatment
A number of the reasons why participants felt STEPPS was suited to them included having a shared experience with other groups members, understanding more about their diagnosis and experiences and feeling the content was relevant to them.
Appendix W: Descriptive statistics of follow-up data
Follow-up questionnaires were sent out to all participants who had attended past session 15 and who had indicated on their consent form that they were happy to

226
receive follow-up questionnaires. Questionnaires were sent either in the post or electronically via Qualtrics (2017). 51 participants were sent follow-up questionnaires, 47.06% responded, providing 24 completed and returned measures. Due to this low response rate the follow-up data was not used in the main analysis.
Of these 24, 91.7% were female. Ages ranged from 19-55. The mean BEST score at follow-up was 37.25 (SD= 15.32) and ranged from 14.0 to 67.0. This follow-up BEST mean was lower than the mean BEST score at the end of treatment from the pairwise deletion sample (38.10) however this sample only represents a small sub-sample who were motivated to complete follow-up measures. It is possible that this sample may be positively biased with participants with positive experiences more likely to complete follow-up measures. Examination of the BEST histogram (below) shows a normal distribution with a clustering of scores around the lower end. This could demonstrate how participant’s scores remained low following treatment, however any firm conclusions would require a larger sample size for confirmation.
Part 3 – Summary of Clinical Experience
Summary of clinical placement experience from November 2014 – September 2017
227
YEAR 1: Adult Mental Health (November 2014 – September 2015): Split placement
Setting: Split placement: Rehabilitation and Recovery Service and Improving Access to Psychological Therapies
Clients and presenting difficulties: Working age adults (aged 18 – 65 years). Within the Rehab and Recovery team I worked with severe and enduring mental health problems. I largely worked with clients with psychosis but Comorbid diagnoses included generalised anxiety, hoarding disorder and depression, borderline personality disorder and bipolar disorder. Within the IAPT placements I worked with working age adults (aged 18 – 65 years) with mild to moderate mental health problems. Presentations of clients I worked with included depression, social anxiety, post-traumatic stress disorder and trichotillomania.
Main models used: CBT, Compassion focused therapy, narrative approach.
Modes and types of work: Direct individual work, indirect work, consultation, joint working with other professionals, assessment, group formulation with staff team and teaching to staff.
YEAR 2: Children and Adolescents (October 2015 – March 2016): Split placement
Setting: Split placement across Child and Adolescent Mental Health Service: Access Team and The Youth Support Team
Clients and presenting difficulties: Children and adolescents (aged up to 18 years) with moderate to severe mental health problems. Presentations of clients included depression, social anxiety, ASD, challenging behavior, OCD and emerging psychosis.
Main models: CBT, systemic and IPT.
Modes and types of work: Direct individual work, family work, neuropsychological assessments, consultation, joint working with other professionals, presentation and training to staff.
YEAR 2: Older Adults (April 2016 – September 2016)

228
Setting: Split placement across a Dementia Assessment Service, Living Well with Dementia team and an Older Adults Assessment and Treatment team
Clients and presenting difficulties: Older adults (aged 65 + years plus one working age adult with early onset dementia) affected by dementia and/or mental health problems. Presentations included depression, anxiety, early onset dementia and difficulties associated with dementia.
Main models: CBT, systemic, psychodynamic and neuropsychological models.
Modes and types of work: Direct work with individuals and families, indirect work with and staff teams, group facilitation, neuropsychological assessment, case presentation and teaching, joint working and neuropsychological assessments.
YEAR 3: Specialist placement: Eating Disorders (October 2016 – March 2017)
Setting: Split placement across Adult Outpatient Eating Disorders and Adolescent Inpatient Eating Disorders.
Clients and presenting difficulties: Adults (aged 18 + years) with eating disorders. I worked with individuals with bulimia nervosa and anorexia nervosa. Comorobid diagnoses included anxiety, depression, agoraphobia and bipolar disorder as well as emerging personality disorder in adolescent services.
Main models: CBT, Compassion focused therapy and systemic.
Modes and types of work: Direct work with adults and adolescents, assessment, group facilitations with adults and adolescents, supervision of undergraduate psychologists work and teaching presentation.
YEAR 3: Learning Disabilities (April 2017 – September 2017)
Setting: Community Team for People with Learning Disabilities
Clients and presenting difficulties: Adults (aged 18+ years) with learning disabilities. I worked with individuals with ASC, physical health difficulties, challenging behavior and difficulties with self-esteem.

229
Main models: CBT, psychodynamic, systemic and neuropsychological
Modes and types of work: Direct work with individuals, indirect work with family and staff members, consultation, neuropsychological assessment and PBS.
Part 4; PSYCHD CLINICAL PROGAMMETABLE OF ASSESSMENTS COMPLETED DURING TRAINING
Year I AssessmentsASSESSMENT TITLE
WAIS WAIS Interpretation (online assessment)Practice Report of Clinical Activity
Compassion Focused Therapy assessment & formulation of a male in his forties with anxiety and hoarding behaviours
Audio Recording of Clinical Activity with Critical Appraisal
Critical Appraisal of Audio Recording of an intervention session of CBT for depression with a male in his late twenties.
Report of Clinical Activity N=1
Case Report of a Cognitive Behavioural assessment, formulation and intervention for depression with a male in his late twenties.
Major Research Project Literature Survey
Literature Survey of Individual Characteristics Predictive of Outcome in Short-Term Therapy for Borderline Personality Disorder.
Major Research Project Proposal
Effect of severity and subtypes of Borderline Personality Disorder on response to STEPPS treatment
Service-Related Project Service evaluation of former inpatients’ perspectives on contributors to a positive inpatient ward environment
Year II AssessmentsASSESSMENT TITLE
Report of Clinical Activity
Case Report of an Interpersonal Therapy assessment, formulation and intervention for an adolescent female with depression.
PPLD Process Account Personal and Professional Learning Groups Process AccountPresentation of Clinical Activity
Case presentation of a psychodynamically informed formulation, intervention and consultation of early onset dementia in a lady in her mid fifties.
Year III Assessments ASSESSMENT TITLE
Major Research Project Literature Review
A systematic review evaluating severity, symptoms and subgroups of borderline personality disorder as predictors of psychological therapy outcomes.
Major Research Project Empirical Paper
Predictors of response to Systems Training for Emotional Predictability and Problem Solving (STEPPS) for the treatment of Borderline Personality Disorder
Final Reflective Account On becoming a clinical psychologist: A retrospective, developmental, reflective account of the experience of training:

230
The person and the psychologistReport of Clinical Activity – Formal Assessment
A neuropsychological assessment for dementia with a lady in her late 70s