epubwu institutional repository - core.ac.ukcore.ac.uk/download/pdf/16272007.pdf · epubwu...
TRANSCRIPT

ePubWU Institutional Repository
Wolfgang Briglauer
The Impact of Regulation and Competition on the Adoption of Fibre-BasedBroadband Services: Recent Evidence from the European Union MemberStates
Paper
Original Citation:Briglauer, Wolfgang (2013) The Impact of Regulation and Competition on the Adoption ofFibre-Based Broadband Services: Recent Evidence from the European Union Member States.Working Papers / Research Institute for Regulatory Economics, 17. Forschungsinstitut fürRegulierungsökonomie, WU Vienna University of Economics and Business, Vienna.
This version is available at: http://epub.wu.ac.at/3942/Available in ePubWU: August 2013
ePubWU, the institutional repository of the WU Vienna University of Economics and Business, isprovided by the University Library and the IT-Services. The aim is to enable open access to thescholarly output of the WU.
http://epub.wu.ac.at/

The Impact of Regulation and Competition on the Adoption of Fibre-Based
Broadband Services: Recent Evidence from the European Union Member States
Wolfgang Briglauer*
This draft: July 2013
* Wolfgang Briglauer is a research assistant at the Research Institute for Regulatory Economics,
Vienna University of Economics and Business (WU), Heiligenstädter Straße 46-48, A-1190 Vienna,
Austria. Contact: T: ++43/(0)1/31336/5898, Email: [email protected].
Keywords
Next-generation telecommunications networks, regulation, competition, adoption, network effects

[2]
Abstract
Fibre deployment of next-generation high-speed broadband networks is considered to be a decisive
development for any information-based society, yet investment activities and especially the adoption
of fibre-based broadband services take place only very gradually in most countries. This work employs
static and dynamic model specifications and identifies the most important determinants of the adoption
of fibre-based broadband services with recent panel data from the European Union member states for
the years from 2004 to 2012.
The results show that the more effective previous broadband access regulation is, the more negative
the impact on adoption, while competitive pressure from mobile networks affects adoption in a non-
linear manner. It appears that the approach of strict cost-based access regulation embedded in the EU
regulatory framework is at odds with the targets outlined in the European Commission’s “Digital
Agenda”. Finally, we also find evidence for substantial network effects underlying the adoption
process.

[1]
1 Introduction
The traditional (“first-generation” copper- or coax-based) broadband networks appear to be outdated
and it has become necessary to speed up these networks in recent years to account for the growing
demand for bandwidth/connection speed. According to “Nielsen’s law”, the broadband connection
speed increases every year by 50% (FTTH Council Europe 2012, p. 12). Next-generation fibre-based
access (NGA) networks deployed on the ground provide much more bandwidth capacity. As these
networks represent a general purpose technology, they are expected to induce significant productivity
improvements and growth across major economic sectors such as health, electricity and transport (e.g.
Czernich et al. 2011). However, substituting the traditional infrastructure with fibre-optic networks
also involves high risks and massive investment volumes.1
The demand in terms of adoption (penetration) and supply-side activities in terms of investment in
fibre-based network infrastructure (coverage) vary significantly in an international comparison. Most
European countries lag far behind the leading Asian fibre nations (such as Japan, Korea, Taiwan and
Hong Kong), but also behind the development in the US (Briglauer and Gugler 2013). As regards
NGA adoption within Europe, Northern and Eastern European economies are leading by a large
margin with NGA household adoption levels between ~10% (Denmark and Latvia) and ~26%
(Lithuania) at the end of 2011. Exceptional cases are Belgium and Luxembourg, where the focus on
less expensive NGA deployment technologies has facilitated adoption levels of ~45% and ~85%,
respectively. However, most of the other European countries still show NGA adoption levels (far)
below 5%, including all the major Western and Southern European economies.2
Europe’s gap in NGA deployment was recognized by the European Commission (EC) and explicitly
addressed in its “Digital Agenda”, which specifies goals in terms of high-speed broadband coverage
1 The total investments in nationwide NGA deployment (coverage) depend inter alia on the network topology
employed and the targeted coverage levels and amount to billions of euros (wik consult 2008).
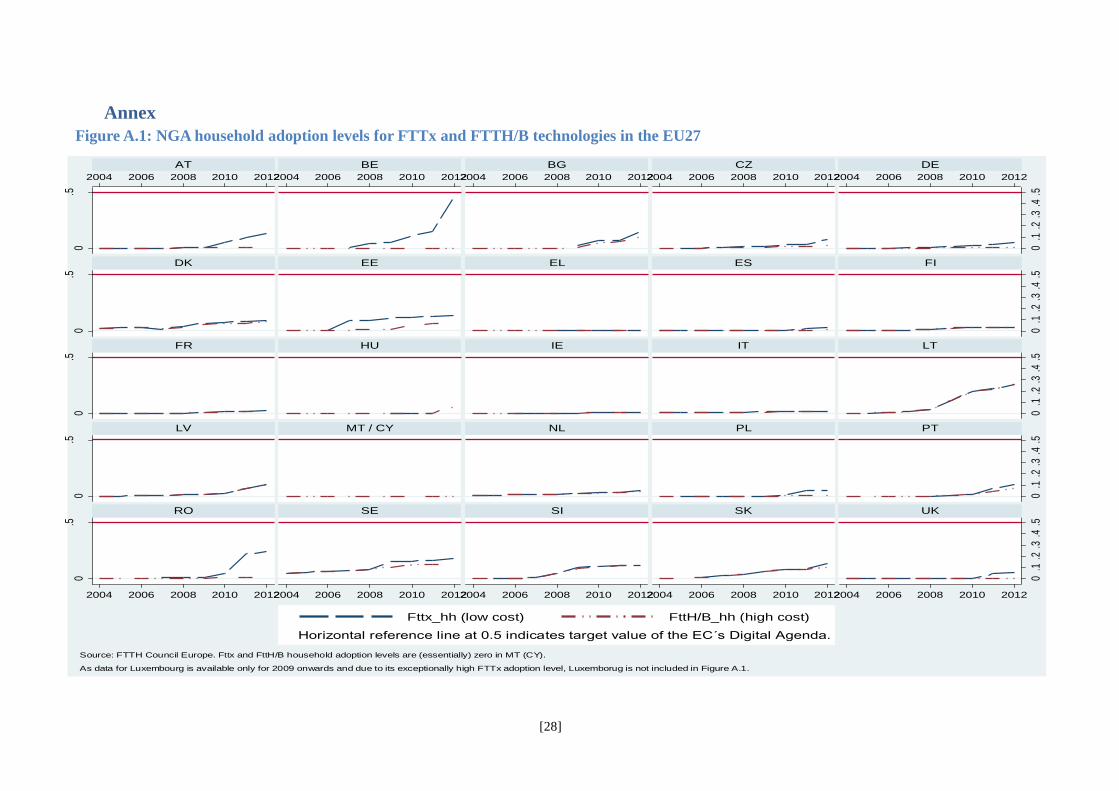
2 See Figure A.1 in the Annex, which reports time-series plots for high- and low-cost NGA deployment
scenarios for the EU27 countries.

[2]
and penetration.3 In achieving these goals, one of the most controversial regulatory issues in Europe
(and elsewhere) is whether the emerging NGA infrastructure should be subjected to sector-specific ex
ante access regulation. Former – mostly state-owned – telecommunications monopolists
(“incumbents”) argue that sector-specific ex ante regulation would be detrimental to dynamic
efficiency in terms of investment incentives and infrastructure innovation. Instead, it would be
sufficient to rely on market mechanisms and infrastructure-based competition in particular.
Conversely, alternative operators that are dependent on access regulation (“service-based competitors”
or “entrants”) as well as some national regulatory authorities (NRAs) fear the rise of NGA networks as
another upcoming monopolistic infrastructure and that incumbent firms or other alternative NGA
infrastructure operators would gain an essential and long-lasting competitive (“first-mover”)
advantage, which implies the need to have appropriate ex ante regulation in place. Regulatory-induced
service-based competition would also have an immediate effect on static efficiency in terms of lower
prices and hence on the adoption of (new) communications technologies on the demand side.
Based on an unbalanced panel of the EU27 member states for the years from 2004 to 2012, this paper
addresses the following research questions: (i) What is the impact of broadband access regulations on
NGA adoption? (ii) How does infrastructure-based competition stemming from wireless (mobile)
networks influence the extent of NGA adoption? (iii) To what extent is NGA adoption driven by
diffusion dynamics such as network effects or consumer inertia? This paper represents the first attempt
to quantify econometrically the determinants of NGA adoption with recent EU27 country-level data. A
multiplicity of static and dynamic model specifications and a broad set of control variables serve as
important robustness checks. Furthermore, we argue that there is no endogeneity problem in terms of
reverse causality in the empirical specification, which relates first-generation broadband demand- and
supply-side factors to second-generation NGA markets and services.
3 The Digital Agenda “seeks to ensure that, by 2020, (i) all Europeans have access to much higher internet
speeds of above 30 Mbps and (ii) 50% or more of European households subscribe to internet connections
above 100 Mbps” (European Commission 2010a, p. 19). Whereas the target in (i) refers to a coverage level
of 100%, the target in (ii) is related to a minimum household adoption level subject to quality characteristics
that can be realized only with NGA technologies.

[3]
The remainder of the paper is organized as follows. First, we review the recent and most relevant
contributions in the empirical literature in section 2. Section 3 briefly provides the necessary
background information on the technical context of NGA networks. Section 4 then describes basic
hypotheses concerning the role of sector-specific regulation and competition as well as the other main
cost and demand factors. Section 5 describes our data set. Section 6 presents the empirical
specification and the underlying identification strategy. Section 7 discusses the main empirical results.
To conclude, section 8 summarizes and contains some final remarks.
2 Empirical evidence
The empirical literature related to the impact of broadband access regulations and competition can be
divided into three broad categories: (i) quantitative analysis focusing on the impact on investment; (ii)
quantitative analysis focusing on the impact on adoption (penetration); and (iii) qualitative analysis
with a focus on penetration or investment. The latter appears to be most meritorious in the case of too
few observations in which quantitative analysis cannot provide reliable guidance. However, we think
that the availability of NGA-related data is sufficient now to allow robust statistical analysis.
Accordingly, in this section we focus on quantitative studies only and do not review the literature
related to qualitative studies.4 When reviewing the quantitative literature, one has to be aware of the
heavily interest-driven nature of the discussion and of the fact that a large number of contributions
represent directly industry-sponsored work. Therefore, our literature review also excludes industry-
sponsored work that has not been published in peer-reviewed academic journals.
Regarding the impact of regulation on investment (i), Jung et al. (2008), who use US data for the years
from 1997 to 2002, find that infrastructure competition increases the investment incentives while
mandatory access obligations at best have a weak effect on the investment of infrastructure operators.
Recent work with data from EU countries exhibits similar results: Grajek and Röller (2011) investigate
the relationship between regulation and total investment in the telecommunications industry. Their
study is among the few that explicitly account for the endogeneity problem of regulation and
4 A comprehensive overview of qualitative studies can be found in Berkman Center (2010, pp. 121–136). Our
review also excludes a number of recent quantitative studies in which the data are based on surveys (e.g.
Sunada et al. 2011) and that do not consider inter alia the role of regulation and competition.

[4]
investment. Investment is quantified therein rather broadly by the tangible fixed assets of
telecommunications operators and, thus, does not explicitly refer to broadband or NGA deployment.
Wallsten and Hausladen (2009) are the first to estimate the effects of broadband access regulation on
NGA deployment. They find that countries where broadband access regulation is more effective
experience lower fibre deployment. However, they use data for the years from 2002 to 2007, which
only cover the NGA roll-out in its very early stage and the authors do not capture the investment
dynamics. Briglauer et al. (2013) investigate the determinants and dynamics of NGA investment with
for yearly data from 2005 to 2011. They find that stricter previous broadband access regulation has a
negative impact on NGA deployment, while competitive pressure from cable and mobile networks
affects NGA deployment in a non-linear manner.
Regarding the literature on the impact of regulation on adoption (ii), there are several contributions
related to broadband markets, but no NGA-related studies. Using US data from 2001 to 2004, Denni
and Gruber (2007) find that infrastructure-based competition has a positive impact on broadband
diffusion in the longer term, whereas regulatory-induced service-based competition has a positive
impact only if the number of service-based entrants is not too large. Non-US-based work mainly refers
to OECD country-level data. Bouckaert et al. (2010) examine the determinants of broadband
penetration for the years from 2003 to 2008. They find that infrastructure-based competition has a
positive impact on broadband penetration, whereas service-based competition is an impediment to
penetration. Lee et al. (2011) analyse the determinants of broadband diffusion for the years from 2000
to 2008. With respect to unbundling obligations, the authors find a positive and significant effect on
the speed of diffusion. They admit, however, that unbundling might have a negative impact on long-
term investment and the broadband saturation level. Cava-Ferreruela and Alabau-Munoz (2006) find
that infrastructure-based competition has a significant and positive impact on broadband penetration,
whereas unbundling has no significant effect for data from 2000 to 2002. Finally, some contributions
refer to data from European countries. Distaso et al. (2006) analyse EU-related data from 2001 to 2004
and find that infrastructure-based competition is the main driver of broadband take-up and plays a
more important role than service-based competition, especially in the longer term. Höffler (2007)
examines data for sixteen Western European countries for the years from 2000 to 2004. He concludes

[5]
that broadband deployment was predominantly triggered by infrastructure-based competition, with
service-based competition playing a secondary role.
Summarizing, the majority of the empirical literature suggests that infrastructure-based competition
has a positive impact on both investment and penetration. In turn, the evidence regarding service-
based competition relying on broadband access regulations tends to be negatively related to
investment activities, while the impact on broadband adoption seems to be less clear. To the best of the
author’s knowledge, there is no empirical work that examines the impact of regulation and competition
on NGA adoption. This paper intends to fill this gap.
3 Industry background
Historically, first-generation networks of incumbent operators deployed twisted copper-wire pairs to
overcome the last mile (“local loop”) to the subscriber in order to provide narrow bandwidth voice
telephony services (POTS/ISDN) only. Many decades later, they were made capable of supporting
broadband services by means of digital subscriber line (DSL) transmission technology. However, due
to technical reasons, the bandwidth of DSL technologies is limited. In order to realize the NGA
characteristic bandwidth, it is necessary to shorten the length of the copper-based local loops by
placing the DSL transmission equipment closer to the retail customers’ premises, e.g. in the cabinets
that house distribution frames (“fibre to the cabinet” – FTTC). In the remaining copper-wire line of the
last mile, the latest DSL transmission technology is used. This solution can provide bandwidths of 20
Mbit/s to 100 Mbit/s. In addition to upgrading first-generation copper-wire (DSL) networks in the
local loop, the roll-out of high-speed communications networks might also be realized by upgrading
cable (coax) television networks, which is referred to as “fibre to the last amplifer”, which provides
bandwidths up to 150 Mbit/s. Similar or even higher bandwidths (above 100/150 Mbit/s) can be
achieved if optical fibre is extended to or into the building (“fibre to the building” – FTTB). Only the
remaining wiring inside the building relies on conventional copper wires. If the optical line is directly
connected to the individual home (“fibre to the home” – FTTH), this would be the most future-proof
technological solution, as it enables nearly unlimited bandwidth (RTR 2010, pp. 189–191; Briglauer
2012, pp. 2-3).

[6]
FTTx stands for a family of technologies that includes all the NGA scenarios described above. As
such, it differs from a more narrow definition that refers to cost-intensive FTTH/B technologies.5
During the relevant analysis period (2004 to 2012), mobile broadband access has already been
facilitated by 3G+ technologies (GPRS, EDGE, UMTS and HSDPA). Moreover, the industry expects
long-term evolution (LTE) to enable transmission rates similar to wireline NGA (FTTx) scenarios in
the near future. However, LTE is still in the test phase and the aforementioned mobile broadband
standards are far from achieving FTTx-specific bandwidth levels. Therefore, mobile broadband is not
considered to be a relevant (second-generation) NGA technology in the empirical analysis.
4 Hypotheses
From the empirical literature, one can infer that there is a common understanding that both demand-
side and supply-side factors have an influence on the adoption of fibre-based broadband services.
Furthermore, most studies implicitly refer to a direct and positive relationship between investment
(coverage) and adoption (penetration). Clearly, network coverage is a pre-condition for the successful
adoption of NGA services and therefore the higher the available infrastructure stock, the higher the
potential subscriber base (Wallsten and Hausladen 2009; Bouckaert et al. 2010).6 This section
identifies the determinants of NGA investment and adoption and sets out corresponding hypotheses,
which are aligned with the underlying research questions. Sections 4.1 and 4.2 focus on regulation and
competition as the main explanatory variables that directly impact on the supply side, i.e. NGA
investment. Likewise, cost conditions will shift the supply curve but also exert an indirect impact on
NGA adoption (section 4.3). Finally, the adoption process will be directly influenced by diverse
demand-side factors and network effects (section 4.4). However, the demand will also be related to
regulation and competition, which affect prices and quality and thus indirectly the adoption of NGA
services.
5 Because the length of FTTH/B lines is longer compared with other FTTx technologies and thus services a
much smaller customer base in the local loop, the average investment per FTTH/B connection is
disproportionately higher (wik consult, 2008).
6 In our panel data set, Pearson’s bivariate correlation coefficients for FTTx coverage and FTTx adoption are
0.7014 and 0.6982 in terms of connections per household and per capita, respectively.

[7]
4.1 Regulation
NGA regulations will be defined and imposed by NRAs only in future decisions or, if already
implemented, the effectiveness of these decisions still remains to be seen (Cullen International 2011,
Tables 4, 9 and 10). It can be argued, however, that past regulation in first-generation broadband
markets has clearly shaped the expectations for NGA regulations. This has been recently confirmed in
NGA-relevant recommendations of the EC as well as in previous court decisions.7 In EU member
states basically three kinds of ex ante (cost-based) access regulations are imposed on first-generation
broadband markets since the beginning of market liberalization in 1997/1998: (i) alternative operators
can rent the local loop from the incumbent operator (“unbundling”). (ii) service-based entrants may
also offer retail broadband services by purchasing “bitstream” as a wholesale input from the
incumbent operator but at a more service-based level of the value chain. Finally, (iii) “resale” means
that access-seeking service providers receive and resell a wholesale input of the incumbent operator
with virtually no scope for technological product differentiation (RTR 2010, pp. 176, 179).
On the one hand, stricter wholesale access regulations increase service-based competition at the retail
level in terms of lower broadband prices, exerting a positive impact on the demand side.8 On the other
hand, tight regulation of existing broadband access infrastructure most likely, as mentioned above,
creates corresponding expectations about the future regulation of NGA access infrastructure that
decrease the investment incentives of (potential) infrastructure operators for the following: (i)
imposing cost-oriented access prices for bottleneck inputs typically reduces profits or precludes excess
profits of the regulated firm, which results in asymmetric distribution of the expected profits and,
therefore, in a lower net present value of investment projects (Valetti 2003). Furthermore, access
7 The NGA recommendation of the European Commission (2010b) as well as former draft versions clearly
indicate that the EC is very much determined to extend its cost-based regulatory approach to the emerging
NGA communications infrastructure. The reader is also referred to the earlier decision of the German
Government to exempt the incumbent operator (Deutsche Telekom AG) from wholesale access obligations
to its new infrastructure (FTTC) network (“regulatory holidays”). The EC, however, took Germany to court
over this legal provision in 2007, which finally decided against it in 2009 (C-424/07).
8 Lower first-generation broadband prices do not necessarily imply higher levels of adoption of second-
generation NGA services. Section 5.2.3 outlines the potential impact of broadband prices in more detail as
well as our underlying hypotheses.

[8]
regulation typically ignores (ii) the opportunity costs of real options (Guthrie 2009) and the fact that
(iii) risks were distributed asymmetrically among regulated incumbent and entrant operators.
Therefore, (iv) regulation reduces not only the investment incentives of regulated infrastructure
operators but also those of potential entrant infrastructure operators who benefit from a risk-free
option due to mandatory access obligations asymmetrically imposed on the incumbent operator
(Pindyck 2007). Finally, pending decisions on NGA regulations have already led to substantial
regulatory uncertainty, which constitutes another investment impediment. According to Nitsche and
Wiethaus (2011), who model the effects of different regulatory regimes on NGA investment, a regime
of less intense access regulations or regulatory holidays would have the most positive effects on
investment, whereas the EU standard of strict cost-based access regulation turns out to be inferior.9
Summarizing, we expect that ex ante sector-specific regulation in the form of mandatory access
regimes has a negative impact on NGA investment and hence indirectly also on the adoption of NGA
services. Higher levels of regulatory-induced service-based competition, however, might also have an
opposite effect via lowering prices, which would increase demand and NGA adoption.
4.2 Competition
Telecommunications, by all means, have become one of the most dynamic and competitive industries
since the beginning of the EU liberalization process. Likewise, recent and future investment in NGA is
driven by infrastructure-based competition, most notably from mobile networks (“intermodal”), which
“threaten” first-generation (copper and cable) networks and services. The so-called phenomenon of
fixed-to-mobile substitution has already been quite intense with respect to narrowband voice telephony
services at the beginning of NGA deployment (around 2005) and has become increasingly important
until now, not only regarding voice telephony but also more and more to broadband services.10
9 See also Briglauer and Gugler (2013), who evaluate NGA deployment and adoption in different
geographical areas (Asia, the EU and the US) in view of the underlying regulatory approaches with a
particular focus on the investment incentives embedded in the current EU regulatory framework.
10 The average EU mobile broadband penetration of all users (PCs/laptops and handheld devices) is about 41%,
whereas the EU average fixed broadband penetration is 27.7% (including basic and high-speed connections)
as of January 2012. Regarding the number of subscribers, fixed-to-mobile substitution is even more
pronounced: whereas the average EU number of mobile subscribers increased constantly up to 127% by the

[9]
With respect to the potential impact of intermodal competition on NGA investment, one first has to
distinguish the following opposing effects (Aghion et al. 2005): On the one hand, competitive markets
bear incentives for innovative investment in view of temporary market power rents that can be
captured (the “escape competition effect”), leading to a positive relation between intermodal
competition and NGA investment. Indeed, the deployment of NGA networks can be seen as the “last
chance” for traditional wireline infrastructure operators to escape successfully from broadband
competition stemming from mobile networks with innovative and high-bandwidth-demanding NGA
services that cannot be realized by means of mobile broadband technologies in the foreseeable future.
On the other hand, intense intermodal competition in terms of pronounced fixed-to-mobile substitution
will eventually reduce the potential rents and, thus, increasingly counteract NGA investment because
operators will no longer be able to appropriate the necessary profits from NGA investment (the
“Schumpeterian” effect).
Second, one has to consider the “replacement effect” (Arrow 1962), according to which new NGA
investment would “cannibalize” quasi-monopolistic profits from old first-generation infrastructure
services, increasing the opportunity costs and thus reducing the incentive to invest.11
The replacement
effect appears to be of practical relevance, as most EU27 member states have well-established first-
generation infrastructure in view of both network coverage and recent and foreseeable advances in
wireline DSL/cable technology standards. As a result, conventional broadband services enjoy broad
consumer acceptance in most EU member states, which also establishes non-negligible switching costs
on the consumers’ side and hinders migration to the new technology unless its incremental benefits are
large and transparent enough for consumers (Grajek and Kretschmer 2009, p. 241).
In summary, we expect a non-linear relationship between NGA investment and the intensity of
infrastructure-based (intermodal) competition from mobile networks. An increase in the intensity of
intermodal competition might have – in the same manner as regulatory-induced service-based
end of 2011, the average number of fixed-line connections has decreased significantly in recent years. All
the data are available from the EC’s Digital Agenda Scoreboard website: http://ec.europa.eu/digital-
agenda/en/scoreboard.
11 See Bourreau et al. (2010) for a more general description of the replacement effect in the communications
industry.

[10]
competition – a positive impact on the adoption of NGA services, i.e. on the demand side, as
infrastructure-based competition enhances services12
and reduces the average broadband price level.
With respect to the replacement effect, we expect that a higher diffusion of first-generation broadband
(intramodal) connections leads to a lower adoption rate of second-generation NGA services.
4.3 Cost factors
The civil engineering and construction costs related to digging represent by far the most relevant cost
drivers for NGA deployment. As these cost factors are largely fixed and sunk costs, one can expect
that the average deployment costs will decrease with the number of broadband/NGA subscribers
(“economies of density”; wik consult 2008). Furthermore, these deployment costs will crucially
depend on largely time-invariant topographic and demographic characteristics, such as urbanization,
population or household density and housing structure, in particular, the number of multi-dwelling
units (FTTH Council Europe 2012, pp. 24–25).
Relevant legal and institutional factors, such as regulations on capital costs, rights of way and digging
or other allowances and technical standards, local availability and reusability of ducts and dark fibre or
NGA-specific state aid policies, also show hardly any variation with respect to the relevant time frame.
4.4 Demand factors
The demand depends on the average price for high-speed broadband services, the overall market size
in terms of total communications expenditure and consumer wealth in general. Consumers with higher
average communications expenditures can be regarded as having greater affinity with information and
communications technologies (ICT), which might result in higher levels of NGA adoption (FTTH
Council Europe 2012, p. 42). The demand for NGA services is also driven by a variety of consumer
preferences, referring to the overall affinity with ICT, conventional Internet usage and usage intensity
of high-speed broadband services. Consumers’ needs are furthermore determined by their average
education levels, since higher levels of education improve e-literacy skills, which considerably
12
Whereas the main merits of regulation and service-based competition refer to lower prices, including pricing
innovations and customer care, infrastructure-based competition also has the technical potential to enhance
services via quality innovation.

[11]
increases the utility derived from NGA technologies. Also, more highly educated people tend to be
more prone to adopting and experimenting with new ICT (Kiiski and Pohjola 2002, p. 302).
Finally, one has to consider network effects as a special type of externality underlying the NGA
adoption process, in case the number of subscribers (and/or producers) has an impact on the
consumers’ utility (firms’ profit) (Shy 2010). In general, increases in the adoption rates also lead to
increases in the usage intensity of the respective services (Grajek and Kretschmer 2009, p. 240).
Consumers’ utility can be related to the possibility of communicating with one another at the consumer
level either directly, e.g. via different “Web 2.0” platforms, or indirectly, in the case of network effects
occuring at different producer levels. For instance, the more users subscribe to (high-speed) Internet
services, the more specific content and related applications will be programmed, which increases the
consumers’ utility and willingness to adopt such (NGA) services. The same is true for the development
of related hardware and electronic equipment. Furthermore, it is likely that the NGA adoption process
is subject to learning spillovers, inasmuch as the value added of NGA services appears to be a priori
unknown to potential consumers, whose valuation inter alia depends on the information gathered by
the already-existing subscriber base (Grajek 2010, p. 133). Operators simply benefit from the network
size, since an increase in the total number of subscribers lowers the average costs significantly in view
of the NGA network topology and thus increases the profits.
All the network effects described above give rise to a self-propelling endogenous growth process,
which suggests that the contemporaneous and previous NGA adoption rates are positively related: the
higher the existing subscriber base, the higher the potential network benefits.
5 Data and variables
The empirical specification is based on the following data sources. The “EU Progress Report”
provides yearly data for all the relevant wholesale broadband access regulations. Our second main
source is the database of FTTH Council Europe, which includes the annual numbers of connected
NGA lines for all the EU27 member states. EUROSTAT/COCOM provides data on the total
population, education, Internet usage and ICT labour costs as well as the housing structure. We use the
International Telecommunications Union (ITU) data to measure intermodal infrastructure competition

[12]
and Quantum-Web tariff data as a representative measure of the average broadband price that is related
to the first-generation infrastructure. Finally, data from the World Bank provide us with the GDP per
capita, the European Intelligence Unit (EIU) with measures of labour and wage costs and the
percentage of people living in urban areas and EUROMONITOR with telecommunications revenues
and the number of households and Internet users.
As the data availability differs by variable, we use an unbalanced panel data set of EU27 countries for
the time range from 2004 to 2011 for yearly data on our independent variables and from 2005 to 2012
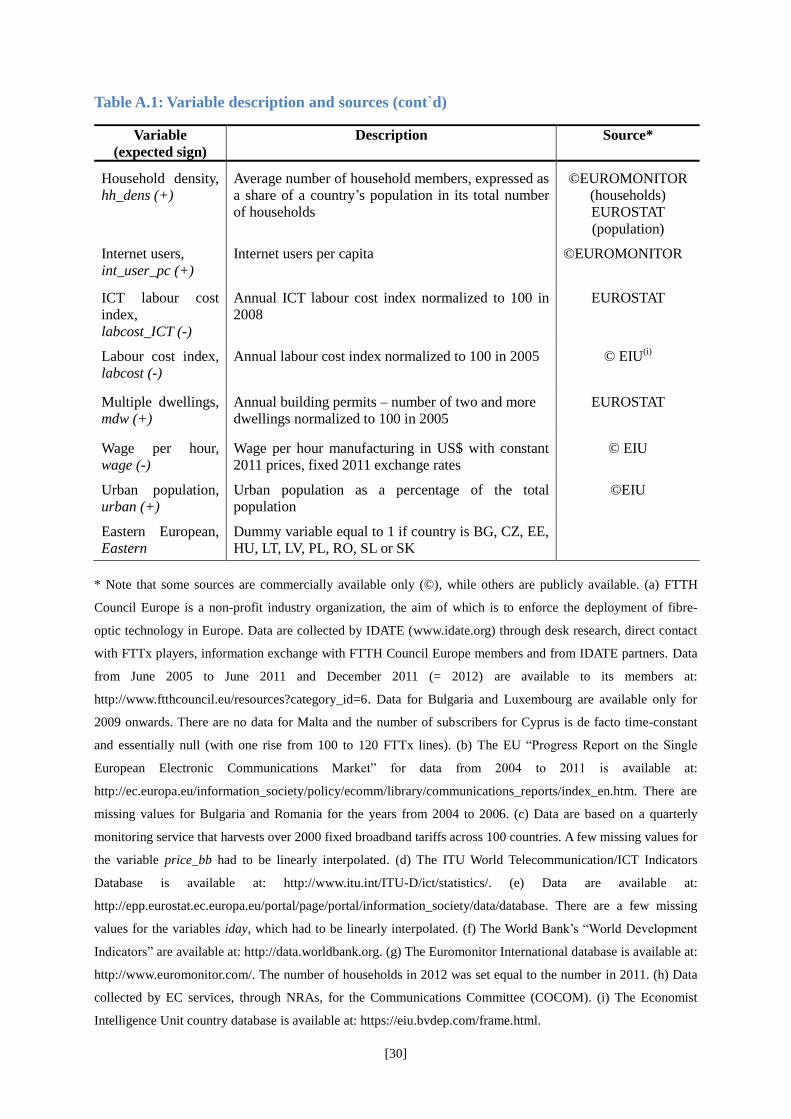
for yearly data on our dependent variable. All the variable definitions, expected signs and sources as
well as summary statistics are listed in detail in the Annex in Tables A.1 and A.2, respectively.
5.1 Dependent variable
The dependent variable, FTTx_hh, measures adoption as the actual number of NGA connections
divided by a country’s total number of households.13
In line with the description in section 3, the
relevant wireline NGA/FTTx technologies include FTTH/B/C and fibre to the last amplifier. The
dependent variable represents the number of households exhibiting sufficient willingness to pay and
actively using one of the FTTx-based (NGA) services under a commercial contract.
5.2 Independent variables
The independent variables can be divided into the following categories: (i) regulation, (ii)
infrastructure-based competition, (iii) prices and (iv) cost and demand controls.
5.2.1 Regulation
The regulation variable, reg_bb, measures the lines actively used by service-based competitors as the
share of the total regulated wholesale broadband lines (including unbundling, bitstream and resale)
related to the total retail broadband lines. Therefore, this variable not only includes all the relevant
13
The other metric commonly used refers to per capita terms. Both measures have their strengths and
weaknesses. Adoption in per capita terms refers to both business and residential users, whereas household
penetration omits business customers. However, household subscription data seem to be the more correct
measure as fixed-wireline (NGA) connections are typically related to a single household but not to an
individual subscriber (as is the case for wireless subscriptions). Hence, we prefer household data, but – as it
will be shown – the estimates are robust to the alternative specification in per capita terms.

[13]
wholesale broadband access regulations as outlined in section 4.1, but also provides an immediate
measure of their effectiveness.14
We expect a negative sign of reg_bb, as we also control for the
opposed price effect of service-based competition (section 5.2.3)
Furthermore, we argue that access regulations, reg_bb, imposed on the “old” network infrastructure
typically many years ago, are exogenous with respect to the deployment of the “new” NGA
infrastructure and the adoption of NGA services. At the same time, previous regulation on broadband
markets is a rather reasonable – and in fact the best – proxy for (expected) NGA regulation, inasmuch
as reg_bb represents the most relevant remedial measures within the EU regulatory framework.
5.2.2 Competition
The main form of infrastructure-based competition related to first-generation infrastructure services
stems from mobile networks. The variable fms states the share of fixed landlines in the total number of
fixed landlines and mobile subscriptions and hence expresses the extent of fixed-to-mobile
substitution, fms, in a country. This variable is expected to exhibit a non-linear relationship and its net
impact depends on the relative importance of the escape competition and Schumpeterian effect.
bb_lines_hh measures a country’s diffusion of first-generation (copper and coax) broadband
connections and services and, therefore, it directly captures the replacement effect and is expected to
exert a negative impact on NGA adoption on average. The variable cable measures the share of
broadband coax lines run by cable entrants, which represent the main intramodal competitors of the
incumbent´s broadband DSL services. Because we can directly control for the relevant (intramodal)
replacement effect, fms solely reflects the escape competition and Schumpeterian effect.
14
As a consequence, we do not have to rely on broadly defined indices, dummy-based scorecards or other
proxies, which are commonly used in the related literature but hardly related to fixed broadband wholesale
access regulations (such as the OECD regulatory index for the telecoms sector). The “Polynomics
Regulation Index 2012” (Zenhäusern et al. 2012) is the most related to the EU regulatory framework, but it
is available only up to 2010 and captures only the formal aspects of regulation and not its effectiveness.
However, certain access regulations imposed by NRAs might exist on paper for years without any real effect
on the relevant markets. In contrast, our measure incorporates the actual market effectiveness of ex ante
regulations by linking these to the corresponding market outcomes (the same argument in favour of
effectivity-based measures can be found in Bacache et al. (2012) or Briglauer et al. (2013)).

[14]
5.2.3 Prices
As outlined in sections 4.1 and 4.2, the net impact of regulation and competition on NGA adoption is
apriori undetermined, since regulatory-induced service-based competition influences prices and thus
adoption on the demand side but it also negatively affects NGA investment on the supply side, which
decreases NGA adoption. Likewise, a high level of infrastructure-based competition brings down
broadband prices but, beyond a certain level, also deteriorates NGA investment. In order to isolate the
direct supply-side effects of the competition and regulation variables, one has to account for the
market outcome that is related to first-generation competition by controlling for the average broadband
price level, price_bb. The net impact of the variable price_bb on NGA adoption is determined by the
following effects: (i) in the case that first- and second-generation broadband services are substitutes,
an increase in price_bb shifts demand and increases NGA adoption; (ii) to the extent that price_bb
stands as a proxy for NGA prices, an increase in price_bb will decrease NGA adoption alongside the
demand curve (own-price effect); (iii) if price_bb stands as a proxy for a general broadband price level
that reflects the supply determinants, such as the number of intramodal competitors and first-
generation network topology or the extent of public broadband subsidies, a decrease in price_bb
increases NGA adoption due to more favourable market conditions. Also, a lower broadband price
level increases the customer base that might eventually be migrated to NGA services and hence
increases NGA adoption. Since the definition and the quality characteristics of the broadband price
variable, price_bb, are distinctively different from representative NGA services, we assume that the
effects in (iii) dominate the other effects and thus expect a negative sign of price_bb.
5.2.4 Cost controls
We use the following measures for the demographic and topographic cost factors: Whereas urban_pop
reflects different cost structures due to varying shares of rural and densely populated areas, hh_dens
represents a country’s average household size and therefore a measure of the housing structure. The
yearly number of building permissions of multiple dwelling units, mdw, provides another measure of
household structure.

[15]
We use the following measures for NGA construction costs: whereas lab_cost represents an annual
labour cost index, lab_cost_ICT gives an annual labour cost index that is related to ICT industries and
wage measures manufacturing costs per hour.
5.2.5 Demand controls
The total telecommunications revenues normalized to households, telco_rev_hh, act as a proxy for the
ICT market size and, thus, for the overall willingness to pay for broadband/NGA services in a country.
GDP_pc_pp measures income effects. Furthermore, we include the variable iday, which provides the
share of the population that uses the Internet frequently, to cover NGA-relevant consumer tastes. The
number of Internet users per capita, int_user_pc, represents another proxy for the overall ICT affinity
within a country. The educational level, edu, is measured as the percentage of the adult population that
has completed at least upper-secondary education.
Network effects are considered by adding the lagged dependent variable, Fttx_hh(t-1), as a right-hand-
side variable to the empirical specification. Fttx_hh(t-1) measures the installed subscriber base and thus
the aggregate demand in the previous period.
6 Empirical specification
We employ a two-fold empirical specification strategy: In section 6.1 we first specify a simplified
static reduced-form model which enables comparative static analysis. The latter appears to be of prime
importance for policy makers and in view of the first two research questions. In section 6.2 we more
realistically consider a market which is not in equilibrium and explicitly account for an endogenous
adoption process which primarily addresses the third research question.
6.1 The “static” adoption model
As can be inferred from the literature review in section 2, some studies focus on broadband
penetration, i.e. demand, while others focus on investment, i.e., the supply of broadband/NGA
connections. Only a few empirical studies explicitly identify broadband/NGA supply and/or demand
or outline the underlying reduced-form approach. Our static baseline specification refers to a reduced-
form model in which demand is expressed in terms of NGA household adoption (in logs),

[16]
ln(FTTx_hh).15
Imposing the equilibrium condition (demand = supply) eliminates the endogenous
NGA-related price variable and yields the following econometric reduced-form specification:16
(1) ititi
titititiit
t
hhlinesbbfmsfmsbbreghhFttx
][
___)_ln(
)1(
)1(4)1(2
3)1(2)1(10
Z
Equation (1) depends on the main variables of interest, i.e., regulation and competition, in state i in
year t, as well as on a vector of demand and cost controls (Zi(t-1)). Note that Zi(t-1) also contains a
measure of the average broadband price level, price_bb, which explicitly controls for the competitive
outcome in first-generation broadband markets, allowing the estimation of the direct supply-side effect
of regulation and competition. εit represents the additive error term and θi country-specific effects.
Equation (1) includes lagged values of all the exogenous variables.17
6.2 The “dynamic” diffusion model
Any adoption process is inherently dynamic, most notably, due to network effects or consumer inertia.
The vast majority of the related empirical literature finds that (ICT) adoption processes are best
described through S-shaped (logistic or Gompertz) functional curves that represent different versions
of an exponential growth model, which ultimately converges to a certain saturation level.18
However,
even in fibre-leading European countries, the NGA adoption processes are still in their early phase and
far from being close to the inflection points. In particular, one can infer from Figure A.1 that almost all
the EU27 states are far from the adoption target defined in the EC’s Digital Agenda. Therefore, NGA
adoption can be approximated by a simple exponential growth model which relates NGA adoption (in
logs), ln(FTTx_hhit), to a linear time trend, [t], which is added to equation (1).
15
A log transformation helps to stabilize the series of our dependent variable. In order to formally test for
stationarity, we perform “Im–Pesaran–Shin” and “Fisher-type” unit-roots tests which are designed for
unbalanced panels. Including fixed effects (and time trends), these tests rejected the null hypothesis that all
panels contain unit roots for all the variables used in our static (and dynamic) model specifications.
16 For similar static broadband adoption specifications see inter alia Bouckaert et al. (2010), Cava-Ferreruela
and Alabau-Munoz (2006), Distaso et al. (2006) or Wallsten and Hausladen (2009).
17 With an insufficient number of observations one would run the risk of overfitting the data. The lagged
specification in equation (1) allows the full employment of the available panel data set.
18 For recent and ICT-related diffusion studies see e.g. Grajek and Kretschmer (2009), Czernich et al. (2011) or
Lee et al. (2011).

[17]
Equation (2) below represents another dynamic extension of the baseline specification in equation (1)
in which the lagged dependent variable, ln(FTTx_hhi(t-1)), is included as a right-hand side variable
(instead of the linear time trend, t). The coefficient α1 allows to measure the importance of network
effects that give rise to an endogenous adoption process if 0 < α1 < 1. (1 - α1) measures the constant
“speed of diffusion”, λ, which comes from a Gompertz model of adoption (Kiiski and Pohjola 2002,
pp. 299–300). λ is expressed as the percentage of the gap between the long-run (desired or target)
stock of NGA subscribers and the subscribers in the previous period that is closed each period (Kiiski
and Pohjola 2002; Andres et al. 2010).19,20
(2) ittiiti
titititiit
hhFttx
hhlinesbbfmsfmsbbreghhFttx
)_ln(
___)_ln(
)1(1)1(
)1(4)1(2
3)1(2)1(10
Z
6.3 Identification
The desire to measure causation and to avoid endogeneity in spite of the reliance on non-experimental
data is the key concern in empirical economics (Wooldridge 2002, p. 421; Cameron and Trivedi 2005,
p. 715). We argue, first of all, that endogeneity in the form of reverse causality is effectively
eliminated as we assess the impact of demand- and supply-side determinants related to first-generation
broadband markets on emerging second-generation NGA markets; hence, we can hardly imagine that
the current NGA adoption influences, for instance, the previous regulation on broadband markets that
was implemented by NRAs typically many years ago. However, this line of reasoning might not be as
compelling in view of all the other explanatory variables. Therefore, we also perform standard
Granger causality tests (Granger, 1969) to reinforce the above argumentation on statistical grounds.
The results, which are reported in Table A.3 in the Annex, indeed indicate that there is no bidirectional
19
Let Fttx_hhit* denote the desired long-run stock of NGA subscribers; then, the Gompertz model of diffusion
specifies the rate of change as )__(ln(_/1/_ )1(
*
tiititit hhFttxhhFttxhhFttxthhFttx .
20 For the sake of clarity, we drop the cross-sectional index in the remainder of the paper. Again all exogenous
right-hand side variables are lagged for the reason given in footnote17. Moreover, assuming that adoption
decisions at a particular point in time do not depend on contemporaneous but on the last period’s conditions
makes also sense in view of the dynamic specification in equation (2), as consumers’ adoption process will
typically be related to switching costs, which might become reinforced in the case when long-term retail
broadband contracts exist.

[18]
causality. Second, we control for potential endogeneity due to unobserved and time-invariant
heterogeneity by including fixed effects (θi) at the country level. Third, by lagging the explanatory
variables, NGA adoption is related to pre-determined values of the independent variables. Whereas
lagging explanatory variables only mitigates endogeneity problems due to time-variant heterogeneity
in the static model (equation (1)), pre-determinedness, or sequential exogeneity, is reasonable for
dynamic panel models such as the diffusion model in equation (2) (Wooldridge 2002, pp. 299-300).
7 Empirical results21
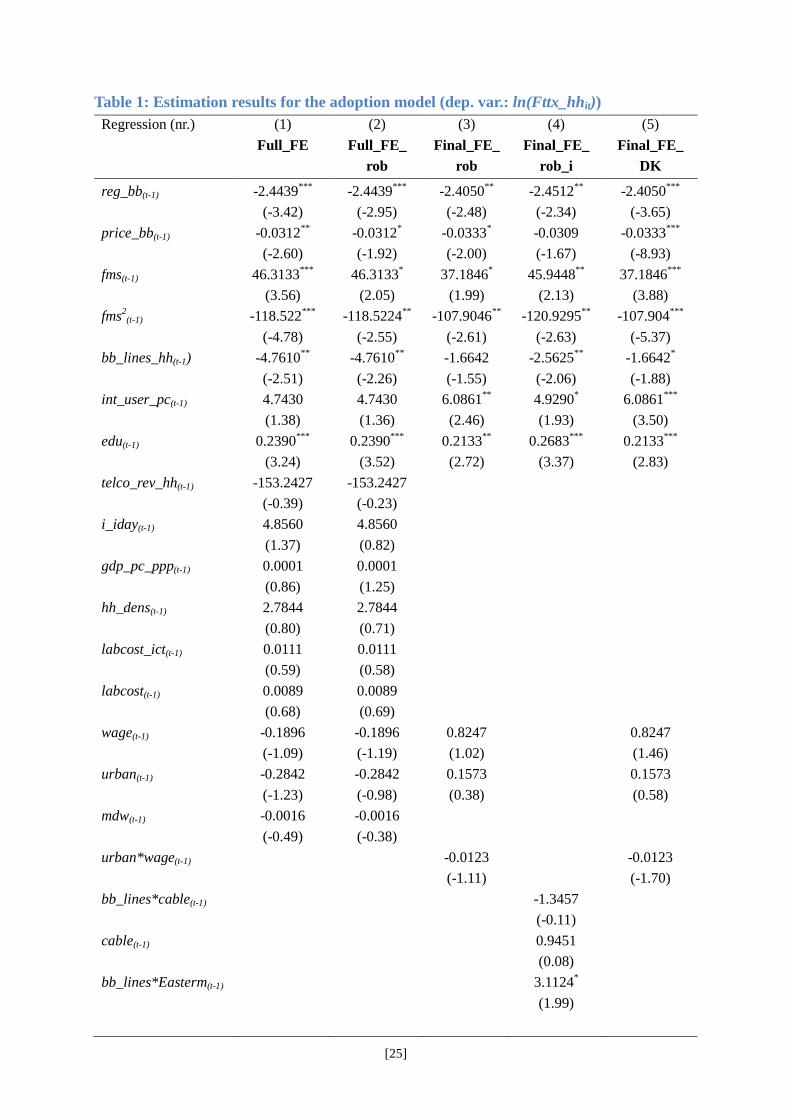
Table 1 shows the main results using fixed-effects (“FE”) regressions to estimate our static
specification in equation (1).22
Regression (1) reports the FE estimates for the model specification that
contains all the demand and cost controls (“Full”) as described in sections 5.2.4 and 5.2.5. The F-test
(F_θ) following regression (1) shows that country-level FEs are significant, implying that pooled OLS
would produce inconsistent estimates if the FEs are correlated with the independent variables.
Regression (1) reports t-statistics assuming that the errors in equation (1) are i.i.d., which might induce
misleading inference as well. Therefore, one has to control for both serial correlation and any arbitrary
form of heteroskedasticity by calculating robust standard errors. For short panels (T ≤ 8 in our case),
this strategy is preferred to modelling a specific error correlation structure (Cameron and Trivedi 2005,
p. 725). Regression (2) contains FE estimates for the full model based on robust standard errors
(“rob”). Note, however, that robust standard errors still assume that there is no contemporaneous
correlation across the panel units. Typically, spatial dependence is unlikely to exist at the country level
with short time series. However, Pesaran’s test of cross-sectional independence does not provide
unambiguous evidence for all the “final” FE models in Table 1 and Table 2. Regression (5) therefore
reports the “Driscoll–Kraay” standard errors (“DK”), which are assumed to be heteroskedastic,
21
STATA 12.1 is used to estimate the regressions.
22 FE specifications are clearly preferable to random effects in view of our observational data set.
Conceptually, our analysis focuses on the EU27 member states, which represent a particular set of rather
homogenous countries and cannot be considered as a random sample drawn from the population of all
countries. Empirically, a heteroskedastic- and cluster-robust Hausman test strongly rejects the random
effects model (the Sargan–Hansen test statistic is 71.025) on the grounds that the RE estimates will be
inconsistent.

[19]
autocorrelated up to some lag and possibly correlated between the panels (Driscoll and Kraay 1998;
Hoechle 2007).
In regressions (3) to (5), we eliminate all except the significant demand controls (int_user_pc(t-1), edu(t-
1)) and the least insignificant cost controls (wage(t-1), urban(t-1)). As it can be seen, the basic structure of
the coefficients for the main variables remains effectively unchanged throughout regressions (1) to (5),
which reassures us that those estimates are largely robust to alternative selections of control variables.
The demand controls int_user_pc(t-1) and edu(t-1) are statistically significant with the expected signs and
appear to capture ICT affinity and e-literacy best, respectively, as essential preconditions for the usage
of high-speed broadband services. The cost controls wage(t-1) and urban(t-1) are insignificant and the
latter variable also has an unexpected sign in regressions (1) and (2). Whereas insignificant cost
estimates appear to be primarily due to country FEs (low within variation), the unexpected sign of
urban(t-1) might be attributed to two opposing effects. First, in densely populated areas, NGA
deployment can serve more customers at the same time, thus reducing the costs for a single fibre
connection (economies of density). Second, however, the total digging costs are much higher in urban
areas, where construction activities become more labour-intensive. We therefore include the
interaction term urban*wage(t-1) in regressions (3) to (5) to capture this relationship. Indeed, urban(t-1)
then shows the expected sign and its impact on NGA adoption decreases with increases in the wage
level, wage(t-1), in regressions (3) to (5).
Overall, we refer to regressions (3) to (5) as final regressions (“Final”) as these are the most efficient
specifications. When comparing regression (3) with regression (5), one finds that imposing “Driscoll–
Kraay” standard errors substantially increases the significance levels. However, as the estimator is
based on an asymptotic theory, we have to consider the results with caution in view of our short panel
and thus treat the estimation results of model “Final_FE_rob” in regression (3) as the preferred ones.
Regarding the main variables of interest, one first finds a significant and non-linear relationship with
respect to our infrastructure-based competition variable, fms(t-1) and fms2
(t-1), for all the FE regressions.
The maximum of the non-linear relationship informs us about the optimal competitive market
conditions for NGA adoption. For instance, one can infer from the corresponding coefficient estimate

[20]
that a share of ~17.2% and 19.5% of fixed landlines is optimal in regression (3) in Table 1 and
regression (6) in Table 2 (including the time trend), respectively. The grand mean of fms(t-1) is ~26.88%
and thus above this optimal value, which means that the escape competition effect still dominates the
Schumpeterian effect and fixed-to-mobile substitution has exerted a positive impact on NGA adoption
in the past. However, increasing competition from mobile networks brought the average value of this
variable close to its optimum during the analysis period with )2004(fms = 0.3317 and )2011(fms =
0.2314.23
The coefficient of the variable bb_lines_hh(t-1) is negative and significant in regressions (1), (2) and (5)
but not in regression (3) which provides unclear evidence as regards the replacement effect. In
regression (4) we therefore examine the replacement effect in greater detail by testing potentially
relevant interaction effects. As the replacement effects refers to both DSL and cable connections, we
first test whether there is a differential effect with respect to these forms of intramodal competition by
including an additional interaction term, bb_lines*cable(t-1), in regression (4) in Table 1. As the
corresponding coefficient is insignificant (as well as the coefficient of the main effect, cable(t-1)), we
conclude that there is no differential impact and the replacement effect comes equally from both types
of fixed broadband infrastructure. This result appears to be reasonable in view of the rather similar
quality and price characteristics of intramodal coax and copper/DSL broadband retail services. Second,
the replacement effect might be subject to a differential effect with respect to extent of broadband
infrastructure in the individual member states. Most notably, one can safely assume that the lack of
well established first generation broadband infrastructure in Eastern European transition economies
pushed migration towards NGA services in those countries and simultaneously opened up an
opportunity for operators to directly deploy NGA infrastructure at much lower opportunity cost
(Briglauer and Gugler 2013). And, in fact, regression (4) shows that the coefficient of bb_lines_hh(t-1)
is now significant as well as the interaction term bb_lines_hh*Eastern(t-1). Moreover, the negative
marginal effect of the first generation broadband for the average European member state is more than
23
It is interesting to contrast this result with the finding of Briglauer et al. (2013), who measure mobile
competition in a different way (based on survey data for the years from 2005 to 2010) but also find that
competition stemming from mobile networks has increased but is well below its optimum value on average.

[21]
offset, if we control for the group of Eastern European member states. This implies that the
replacement effect is of relevance only in the non-Eastern European Union member states which
typically exhibit well-established first generation broadband infrastructure.
Finally, we find a coefficient of the regulatory variable, reg_bb(t-1), which is estimated in the quite
narrow range of -2.4050 to -2.4512 for all the FE regressions in Table 1 and significantly negative
throughout all the estimations (including those in Table 2). This strongly supports our hypothesis
outlined in section 4.1 that the more effective access regulation is, the more negative is the impact on
the adoption of NGA services. The average estimate of the coefficient of reg_bb(t-1) (~ -2.42) in
regressions (1) to (5) implies that an increase in regulatory intensity of 10 percentage points leads to a
decrease in NGA adoption of 21.49% ([=exp(-2.42*0.1)-1]*100). Evaluated at the grand mean, which
represents the average EU27 member state, this implies an average decrease from 0.05147 to ~0.04041
NGA lines per household.
The average broadband price variable, price_bb(t-1), is negative and significant in all FE regressions
from which we infer that the price variable mainly stands proxy for a general broadband price level as
presumed in section 5.2.3. If we drop price_bb(t-1) from the regressions, the coefficient of reg_bb(t-1)
increases throughout in absolute terms (e.g., from ~-2.405 to ~-2.535 in regression (3)), which shows
that the price effect is opposed to the negative effect of regulation on NGA investment. However, since
this increase is not substantial, we infer that the negative direct impact of regulation on supply-side
investment activities dominates the price effect on the demand side.
(Table 1 about here)
Table 2 contains the estimation results of the dynamic specification for the “final” diffusion models.
Regression (6) first reports the results for the exponential growth model that includes a linear time
trend, t. As expected the coefficient is positive, indicating diffusion effects, and significant at the 10%
level. Overall, the other coefficient estimates are not changed substantially when compared with the
“final” specifications of the static adoption model in Table 1. We also estimate regression (6) as two-
way FEs by including year dummies instead of the linear time trend. However, the year dummies are
jointly insignificant (the F-statistic is 0.92; not reported in Table 2) and hence their inclusion would

[22]
result in less efficient estimates. Regression (7) shows that the coefficient estimates remain virtually
unchanged if we normalize our dependent variable with respect to the total population (“pop”) instead
of the total number of households.24
Regression (8) includes the lagged dependent variable, ln(Fttx_hh(t-1)), as an additional regressor in
order to control for endogenous growth in terms of network effects. Estimating regression (8) by
means of an ordinary FE estimator would yield inconsistent and biased results, since the lagged
dependent variable and the error terms would be correlated (Nickell 1981). The usual way to work
around this source of endogeneity is applying GMM estimators. However, a weakness of GMM
estimators is that their properties only hold for a large number of cross-sectional units (n ≤ 27 in our
case). Monte Carlo evidence supports the LSDVC estimator, which proves to be (much) more efficient
than various instrumental variable-type estimators when n is small (Kiviet 1995). Bruno (2005a,b)
developed a bias-corrected LSDV estimator (“LSDVC”) for unbalanced panel data. Although the basic
structure of the LSDVC estimation results in regression (8) is still similar to that of the previous
regressions, the focus here is on the coefficient of the lagged dependent variable, ln(Fttx_hh(t-1)), which
is highly significant and substantial (α1 = 0.7056). This gives us an initial indication of the relevance
of the network effects underlying. However, a high value of α1 is not necessarily due to true state
dependency as it might be also the result of correlation with unobserved heterogeneity (θi) or error
dynamics in a static model. Fortunately, it can be shown that OLS and FE estimators are likely to be
biased in opposite directions in autoregressive models (Bond 2002). Whereas OLS leads to upward
biased estimates of α1, since the values of the lagged dependent variable are positively correlated with
the omitted country fixed effects, FE estimates are downward biased for small T. Hence, if the
dynamic model in equation (2) is correctly specified, the true estimate of α1 capturing state
dependency is between OLS and FE estimates. And, in fact, comparing the respective coefficient
estimates in regressions (8) to (10), one can infer that the LSDVC estimate for α1 lies nicely within the
interval [0.5682; 0.7800]. Even if we refer to the lower bound, we can thus safely conclude that a
causal mechanism via the last period and hence substantial network effects exist which autonomously
push the adoption of new ICT services, as outlined in section 4.4. The speed of diffusion (λ = 1 -
24
The same result holds for the static adoption models in Table 1 (results are available upon request).

[23]
0.7056) suggests that it will take around 6.5 years to close 90% of the gap between the average
number of NGA connections per household (0.05147) and the Digital Agenda’s target value (0.5).
Also, note that speed of diffusion is significantly greater than zero for all values of λ[0.5682;
0.7800], which confirms that migration to NGA services is indeed subject to some non-negligible
switching costs on the side of the consumers.25
(Table 2 about here)
8 Summary and final remarks
This work identifies the effects of sector-specific ex ante regulation and infrastructure competition on
the adoption of NGA services in Europe using a static and dynamic model specification with recent
panel data from the EU27 member states. As opposed to the related literature, the econometric
specification explicitly addresses the endogeneity problem mainly by relating NGA adoption to
regulation and competition in preceding broadband markets.
The results indicate firstly that NGA adoption is negatively influenced by the extent and effectiveness
of the wholesale broadband access regulation that is imposed on the incumbent’s first-generation DSL
infrastructure. Also, it should be pointed out that the impact of regulation is quite substantial.
Accordingly, the goals of the EC’s Digital Agenda seem to be at odds with the sector-specific EU
regulatory framework, which intends to expand strict cost-based access regulation to the emerging
NGA infrastructure and corresponding NGA wholesale access services. Realizing the targets of the EC
to reach 50% adoption with 100 Mbit/s high-speed Internet connections by 2020 becomes much more
unlikely if the prime importance is attached to high-cost FTTH/B deployment scenarios (Briglauer and
Gugler 2013). Secondly, competition stemming from mobile networks affects NGA adoption in a non-
linear way, as expected. With respect to the time frame of our analysis, the positive impact of the
escape competition effect dominates the Schumpeterian effect. Thirdly, we also found evidence of a
replacement effect underlying the first-generation broadband infrastructure, which appears to be of
25
This is also confirmed by a recent survey of the European Commission (2012, p. 60) which shows that a
majority of EU citizens are not willing to switch to high-speed broadband services due to (i) lack of
awareness of potential benefits, (ii) lack of experience with new services and (iii) expected price level of
NGA services.

[24]
particular relevance in the “old” EU member states with well established infrastructure and might
become even reinforced in the future in view of the potential of new DSL and coax technologies.
Finally, our dynamic specification suggests that substantial network effects give rise to an endogenous
NGA adoption process. As this process exhibits high growth potential, the adoption target of the EC
appears to be still feasible time wise, if one refers to a broad NGA definition and if NGA adoption is
not endangered by shocks on the demand or supply side or by wrong policy incentives.
It should be noted once again that the intention of this paper is neither to identify the demand or
supply related to NGA adoption and deployment, respectively, which is a task of future research. In
view of the dynamic interaction of supply and demand, a proverbial chicken-and-egg situation gives
rise to a coordination problem: it is not clear a priori whether there has to be demand for new,
attractive and bandwidth-hungry services in advance in order to enforce the deployment of new
communications infrastructure or whether those services and applications will automatically evolve
after the necessary infrastructure has been put in place. Internet history indicates that the development
of content and applications usually follows infrastructure deployment, e.g. there would be none of the
Web 2.0 services and social platforms available in a world with narrowband dial-up Internet
infrastructure. This view suggests that the goals of the EC’s Digital Agenda can be reached best if
NGA deployment is primarily driven by the supply side, either by means of US-like deregulatory
approaches or via favorable competitive market conditions, as indicated by our results and the vast
majority of the previous and broadband-related literature.
[25]
Table 1: Estimation results for the adoption model (dep. var.: ln(Fttx_hhit))
Regression (nr.) (1) (2) (3) (4) (5)
Full_FE Full_FE_
rob
Final_FE_
rob
Final_FE_
rob_i
Final_FE_
DK
reg_bb(t-1) -2.4439***
-2.4439***
-2.4050**
-2.4512**
-2.4050***
(-3.42) (-2.95) (-2.48) (-2.34) (-3.65)
price_bb(t-1) -0.0312**
-0.0312* -0.0333
* -0.0309 -0.0333
***
(-2.60) (-1.92) (-2.00) (-1.67) (-8.93)
fms(t-1) 46.3133***
46.3133* 37.1846
* 45.9448
** 37.1846
***
(3.56) (2.05) (1.99) (2.13) (3.88)
fms2
(t-1) -118.522***
-118.5224**
-107.9046**
-120.9295**
-107.904***
(-4.78) (-2.55) (-2.61) (-2.63) (-5.37)
bb_lines_hh(t-1) -4.7610**
-4.7610**
-1.6642 -2.5625**
-1.6642*
(-2.51) (-2.26) (-1.55) (-2.06) (-1.88)
int_user_pc(t-1) 4.7430 4.7430 6.0861**
4.9290* 6.0861
***
(1.38) (1.36) (2.46) (1.93) (3.50)
edu(t-1) 0.2390***
0.2390***
0.2133**
0.2683***
0.2133***
(3.24) (3.52) (2.72) (3.37) (2.83)
telco_rev_hh(t-1) -153.2427 -153.2427
(-0.39) (-0.23)
i_iday(t-1) 4.8560 4.8560
(1.37) (0.82)
gdp_pc_ppp(t-1) 0.0001 0.0001
(0.86) (1.25)
hh_dens(t-1) 2.7844 2.7844
(0.80) (0.71)
labcost_ict(t-1) 0.0111 0.0111
(0.59) (0.58)
labcost(t-1) 0.0089 0.0089
(0.68) (0.69)
wage(t-1) -0.1896 -0.1896 0.8247 0.8247
(-1.09) (-1.19) (1.02) (1.46)
urban(t-1) -0.2842 -0.2842 0.1573 0.1573
(-1.23) (-0.98) (0.38) (0.58)
mdw(t-1) -0.0016 -0.0016
(-0.49) (-0.38)
urban*wage(t-1) -0.0123 -0.0123
(-1.11) (-1.70)
bb_lines*cable(t-1) -1.3457
(-0.11)
cable(t-1) 0.9451
(0.08)
bb_lines*Easterm(t-1) 3.1124*
(1.99)

[26]
Constant -13.2967 -13.2967 -32.4730 -27.6838***
-32.4730*
(-0.65) (-0.51) (-1.16) (-4.48) (-2.06)
Adjusted R2 0.658 0.713 0.715 0.714
R2_o 0.0520 0.0520 0.0900 0.1865
R2_w 0.7399 0.7399 0.7315 0.7310 0.7315
F 23.1167 48.0826 24.9222 29.6084 17728.08
F_θ 8.4553
RMSE 0.9561 0.8756 0.8781 0.8695
Observations 172 172 175 174 175
Regressions (1) to (5) include country-specific fixed effects (FE), which are not reported. The t-statistics in
parentheses are based on panel robust standard errors in regressions (2) to (5). Indeed, a Wooldridge test for
autocorrelation indicates that there is first-order autocorrelation in the data. Likewise, a Wald test for groupwise
heteroskedasticity clearly rejects the null hypothesis of a constant variance. Regression (5) employs “Driscoll–
Kraay” standard errors (“DK”), whereby the autocorrelation structure has a lag length of
m(T)=floor[4(T/100)^(2/9)], which turned out to be robust to alternative lag specifications.
* p < 0.10,
** p < 0.05,
*** p < 0.01.

[27]
Table 2: Estimation results for the “Final” diffusion model (dep. var.: ln(Fttx_hhit))
Regression nr. (6) (7) (8) (9) (10)
Final_FE
_rob_t
Final_FE
_rob_pop_t
Final_
LSDVC
Final_LDV
_rob
Final_OLS
_rob
lnFttx_hh(t-1) 0.7056***
0.5682***
0.7800***
(8.82) (6.60) (10.58)
reg_bb(t-1) -2.3515***
-2.3608***
-2.1195***
-2.1849**
-0.9706
(-2.99) (-2.99) (-2.83) (-2.47) (-1.71)
price_bb(t-1) -0.0270 -0.0274 -0.0243***
-0.0262**
-0.0167*
(-1.58) (-1.60) (-2.70) (-2.37) (-1.84)
fms(t-1) 45.0935**
44.9592**
18.0557* 19.8921
* 2.5754
(2.27) (2.26) (1.90) (1.98) (0.38)
fms2
(t-1) -115.5386**
-115.5528**
-39.9050**
-47.8787* -3.9925
(-2.75) (-2.73) (-2.08) (-1.95) (-0.32)
bb_lines_hh(t-1) -4.9070* -4.9498
* -1.0464 -1.1389 0.3124
(-1.99) (-2.01) (-0.72) (-1.27) (0.48)
int_user_pc(t-1) 5.1423**
5.0215**
2.0246 3.3042**
0.1498
(2.14) (2.11) (0.91) (2.65) (0.18)
edu(t-1) 0.1577**
0.1581**
0.0338 0.0608 0.0044
(2.22) (2.22) (0.50) (0.95) (0.34)
urban(t-1) 0.1094 0.1164 -0.0107 -0.0334 -0.0194
(0.31) (0.33) (-0.04) (-0.12) (-1.65)
wage(t-1) 0.9914 1.0140 -0.0699 -0.1204 -0.0873
(1.40) (1.43) (-0.11) (-0.20) (-1.49)
urban*wage(t-1) -0.0161 -0.0164 0.0002 0.0005 0.0011*
(-1.57) (-1.60) (0.02) (0.05) (1.74)
t 0.4268* 0.4325
*
(1.71) (1.73)
Constant -25.0351 -26.3051 -4.0605 0.6330
(-1.07) (-1.12) (-0.25) (0.39)
Adjusted R2 0.731 0.732 0.817 0.884
R2_o 0.0226 0.0173 0.5627
R2_w 0.7482 0.7493 0.8296
F 26.5819 26.7343 83.5753 134.2713
RMSE 0.8530 0.8532 0.6550 0.7938
Observations 175 175 162 162 162
The t-statistics in parentheses are based on panel robust standard errors in regressions (6) to (7) and (9) to (10).
The LSDVC standard errors in regression (8) are bootstrapped based on 100 iterations with bias correction
initialized by the Arellano and Bond estimator for estimates up to order O(1/T).
* p < 0.10,
** p < 0.05,
*** p < 0.01.
[28]
Annex
Figure A.1: NGA household adoption levels for FTTx and FTTH/B technologies in the EU27
0.1
.2.3
.4.5
0.1
.2.3
.4.5
0.1
.2.3
.4.5
0.1
.2.3
.4.5
0.1
.2.3
.4.5
0.5
0.5
0.5
0.5
0.5
2004 2006 2008 2010 20122004 2006 2008 2010 20122004 2006 2008 2010 20122004 2006 2008 2010 20122004 2006 2008 2010 2012
2004 2006 2008 2010 20122004 2006 2008 2010 20122004 2006 2008 2010 20122004 2006 2008 2010 20122004 2006 2008 2010 2012
AT BE BG CZ DE
DK EE EL ES FI
FR HU IE IT LT
LV MT / CY NL PL PT
RO SE SI SK UK
Fttx_hh (low cost) FttH/B_hh (high cost)
Horizontal reference line at 0.5 indicates target value of the EC´s Digital Agenda.
Source: FTTH Council Europe. Fttx and FttH/B household adoption levels are (essentially) zero in MT (CY).
As data for Luxembourg is available only for 2009 onwards and due to its exceptionally high FTTx adoption level, Luxemborug is not included in Figure A.1.

[29]
Table A.1: Variable description and sources
Variable
(expected sign)
Description Source*
Dependent variable(s)
FTTx connections
per household,
Fttx_hh
(Fttx_pop)
Number of households connected by FTTx
technologies normalized to a country’s total number
of households
(normalized to total population)
©FTTH Council
Europe(a)
Main explanatory variables
Extent of
broadband access
regulation,
reg_bb (-)
Share of regulated lines (local loop unbundling,
bitstream, resale) to total retail broadband lines
(minus cable entrant lines)
EU Progress Report(b)
Broadband price,
price_bb (?/-)
Average monthly cost of capped/uncapped residential
fixed broadband for 1 Mbps–10 Mbps in euros
excluding VAT. Tariffs are a weighted average of
representative stand-alone products of incumbent and
entrant operators whose accumulative subscribers are
over 90% of each country’s total broadband market
©Quantum-Web
Limited(c)
Broadband lines,
bb_lines_hh (-)
Number of total retail broadband lines (DSL and
coax) as a share of the total number of subscribed
households
EU Progress Report
©EUROMONITOR
(households)
Fixed-to-mobile
substitution,
fms (+(levels)
- (squared term))
Share of the total number of fixed landlines to the
total number of fixed lines and mobile subscribers.
Mobile-cellular telephone subscriptions include the
number of postpaid subscriptions and the number of
active prepaid accounts (which have been used
during the last three months). They exclude
subscriptions via data cards or USB modems. Fixed-
landlines refer to the number of active lines
connecting subscribers’ terminal equipment to the
PSTN
ITU(d)
Cable lines,
cable (?)
Number of total retail broadband cable lines run by
entrants as a share of the total retail broadband lines
EU Progress Report
Control variables
Education,
edu (+)
Percentage of the adult population (25–64 years old)
that has completed at least upper-secondary
education
EUROSTAT(e)
GDP per capita,
gdp_pc_ppp (+)
GDP per capita and PPP adjusted in current US$ World Bank(f)
Average revenue,
telco_rev_hh (+)
Total telecommunications revenues in mn US$ per
household with constant 2011 prices and fixed 2011
exchange rates
©EUROMONITOR(g)
Heavy Internet
users,
i_iday (+)
Share of the population using Internet services every
or almost every day
EUROSTAT/
COCOM(h)
[30]
Table A.1: Variable description and sources (cont`d)
Variable
(expected sign)
Description Source*
Household density,
hh_dens (+)
Average number of household members, expressed as
a share of a country’s population in its total number
of households
©EUROMONITOR
(households)
EUROSTAT
(population)
Internet users,
int_user_pc (+)
Internet users per capita ©EUROMONITOR
ICT labour cost
index,
labcost_ICT (-)
Annual ICT labour cost index normalized to 100 in
2008
EUROSTAT
Labour cost index,
labcost (-)
Annual labour cost index normalized to 100 in 2005 © EIU(i)
Multiple dwellings,
mdw (+)
Annual building permits – number of two and more
dwellings normalized to 100 in 2005
EUROSTAT
Wage per hour,
wage (-)
Wage per hour manufacturing in US$ with constant
2011 prices, fixed 2011 exchange rates
© EIU
Urban population,
urban (+)
Urban population as a percentage of the total
population
©EIU
Eastern European,
Eastern
Dummy variable equal to 1 if country is BG, CZ, EE,
HU, LT, LV, PL, RO, SL or SK
* Note that some sources are commercially available only (©), while others are publicly available. (a) FTTH
Council Europe is a non-profit industry organization, the aim of which is to enforce the deployment of fibre-
optic technology in Europe. Data are collected by IDATE (www.idate.org) through desk research, direct contact
with FTTx players, information exchange with FTTH Council Europe members and from IDATE partners. Data
from June 2005 to June 2011 and December 2011 (= 2012) are available to its members at:
http://www.ftthcouncil.eu/resources?category_id=6. Data for Bulgaria and Luxembourg are available only for
2009 onwards. There are no data for Malta and the number of subscribers for Cyprus is de facto time-constant
and essentially null (with one rise from 100 to 120 FTTx lines). (b) The EU “Progress Report on the Single
European Electronic Communications Market” for data from 2004 to 2011 is available at:
http://ec.europa.eu/information_society/policy/ecomm/library/communications_reports/index_en.htm. There are
missing values for Bulgaria and Romania for the years from 2004 to 2006. (c) Data are based on a quarterly
monitoring service that harvests over 2000 fixed broadband tariffs across 100 countries. A few missing values for
the variable price_bb had to be linearly interpolated. (d) The ITU World Telecommunication/ICT Indicators
Database is available at: http://www.itu.int/ITU-D/ict/statistics/. (e) Data are available at:
http://epp.eurostat.ec.europa.eu/portal/page/portal/information_society/data/database. There are a few missing
values for the variables iday, which had to be linearly interpolated. (f) The World Bank’s “World Development
Indicators” are available at: http://data.worldbank.org. (g) The Euromonitor International database is available at:
http://www.euromonitor.com/. The number of households in 2012 was set equal to the number in 2011. (h) Data
collected by EC services, through NRAs, for the Communications Committee (COCOM). (i) The Economist
Intelligence Unit country database is available at: https://eiu.bvdep.com/frame.html.
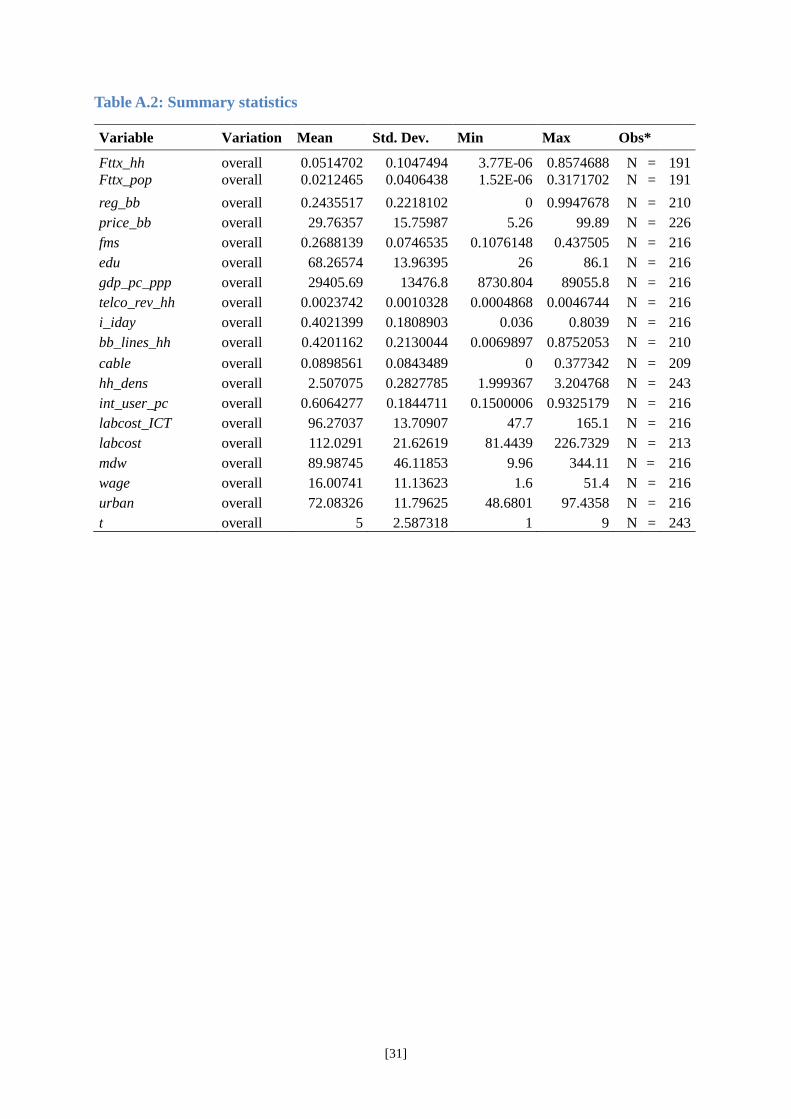
[31]
Table A.2: Summary statistics
Variable Variation Mean Std. Dev. Min Max Obs*
Fttx_hh overall 0.0514702 0.1047494 3.77E-06 0.8574688 N = 191
Fttx_pop overall 0.0212465 0.0406438 1.52E-06 0.3171702 N = 191
reg_bb overall 0.2435517 0.2218102 0 0.9947678 N = 210
price_bb overall 29.76357 15.75987 5.26 99.89 N = 226
fms overall 0.2688139 0.0746535 0.1076148 0.437505 N = 216
edu overall 68.26574 13.96395 26 86.1 N = 216
gdp_pc_ppp overall 29405.69 13476.8 8730.804 89055.8 N = 216
telco_rev_hh overall 0.0023742 0.0010328 0.0004868 0.0046744 N = 216
i_iday overall 0.4021399 0.1808903 0.036 0.8039 N = 216
bb_lines_hh overall 0.4201162 0.2130044 0.0069897 0.8752053 N = 210
cable overall 0.0898561 0.0843489 0 0.377342 N = 209
hh_dens overall 2.507075 0.2827785 1.999367 3.204768 N = 243
int_user_pc overall 0.6064277 0.1844711 0.1500006 0.9325179 N = 216
labcost_ICT overall 96.27037 13.70907 47.7 165.1 N = 216
labcost overall 112.0291 21.62619 81.4439 226.7329 N = 213
mdw overall 89.98745 46.11853 9.96 344.11 N = 216
wage overall 16.00741 11.13623 1.6 51.4 N = 216
urban overall 72.08326 11.79625 48.6801 97.4358 N = 216
t overall 5 2.587318 1 9 N = 243
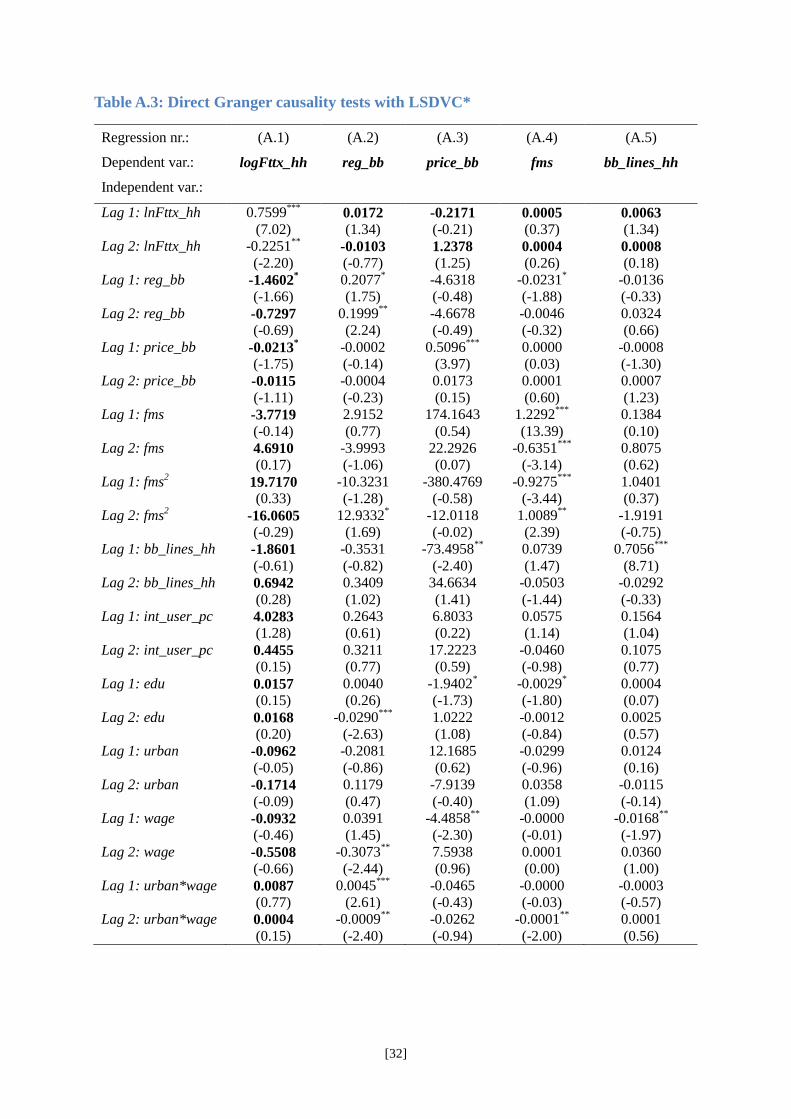
[32]
Table A.3: Direct Granger causality tests with LSDVC*
Regression nr.: (A.1) (A.2) (A.3) (A.4) (A.5)
Dependent var.: logFttx_hh reg_bb price_bb fms bb_lines_hh
Independent var.:
Lag 1: lnFttx_hh 0.7599***
0.0172 -0.2171 0.0005 0.0063
(7.02) (1.34) (-0.21) (0.37) (1.34)
Lag 2: lnFttx_hh -0.2251**
-0.0103 1.2378 0.0004 0.0008
(-2.20) (-0.77) (1.25) (0.26) (0.18)
Lag 1: reg_bb -1.4602* 0.2077
* -4.6318 -0.0231
* -0.0136
(-1.66) (1.75) (-0.48) (-1.88) (-0.33)
Lag 2: reg_bb -0.7297 0.1999**
-4.6678 -0.0046 0.0324
(-0.69) (2.24) (-0.49) (-0.32) (0.66)
Lag 1: price_bb -0.0213* -0.0002 0.5096
*** 0.0000 -0.0008
(-1.75) (-0.14) (3.97) (0.03) (-1.30)
Lag 2: price_bb -0.0115 -0.0004 0.0173 0.0001 0.0007
(-1.11) (-0.23) (0.15) (0.60) (1.23)
Lag 1: fms -3.7719 2.9152 174.1643 1.2292***
0.1384
(-0.14) (0.77) (0.54) (13.39) (0.10)
Lag 2: fms 4.6910 -3.9993 22.2926 -0.6351***
0.8075
(0.17) (-1.06) (0.07) (-3.14) (0.62)
Lag 1: fms2 19.7170 -10.3231 -380.4769 -0.9275
*** 1.0401
(0.33) (-1.28) (-0.58) (-3.44) (0.37)
Lag 2: fms2 -16.0605 12.9332
* -12.0118 1.0089
** -1.9191
(-0.29) (1.69) (-0.02) (2.39) (-0.75)
Lag 1: bb_lines_hh -1.8601 -0.3531 -73.4958**
0.0739 0.7056***
(-0.61) (-0.82) (-2.40) (1.47) (8.71)
Lag 2: bb_lines_hh 0.6942 0.3409 34.6634 -0.0503 -0.0292
(0.28) (1.02) (1.41) (-1.44) (-0.33)
Lag 1: int_user_pc 4.0283 0.2643 6.8033 0.0575 0.1564
(1.28) (0.61) (0.22) (1.14) (1.04)
Lag 2: int_user_pc 0.4455 0.3211 17.2223 -0.0460 0.1075
(0.15) (0.77) (0.59) (-0.98) (0.77)
Lag 1: edu 0.0157 0.0040 -1.9402* -0.0029
* 0.0004
(0.15) (0.26) (-1.73) (-1.80) (0.07)
Lag 2: edu 0.0168 -0.0290***
1.0222 -0.0012 0.0025
(0.20) (-2.63) (1.08) (-0.84) (0.57)
Lag 1: urban -0.0962 -0.2081 12.1685 -0.0299 0.0124
(-0.05) (-0.86) (0.62) (-0.96) (0.16)
Lag 2: urban -0.1714 0.1179 -7.9139 0.0358 -0.0115
(-0.09) (0.47) (-0.40) (1.09) (-0.14)
Lag 1: wage -0.0932 0.0391 -4.4858**
-0.0000 -0.0168**
(-0.46) (1.45) (-2.30) (-0.01) (-1.97)
Lag 2: wage -0.5508 -0.3073**
7.5938 0.0001 0.0360
(-0.66) (-2.44) (0.96) (0.00) (1.00)
Lag 1: urban*wage 0.0087 0.0045***
-0.0465 -0.0000 -0.0003
(0.77) (2.61) (-0.43) (-0.03) (-0.57)
Lag 2: urban*wage 0.0004 -0.0009**
-0.0262 -0.0001**
0.0001
(0.15) (-2.40) (-0.94) (-2.00) (0.56)

[33]
Granger causality tests with p-values of χ2-tests of joint significance of coefficients displayed
in bold in regressions (A.1) to (A.5):
Prob > χ2 (Lag 2) 0.0373**
0.3927 0.4437 0.8613 0.2300
Observations 126 126 125 127 126
Prob > χ2 (Lag 3) 0.0154**
0.8718 0.9641 0.7171 0.2836
Observations 111 112 111 112 112
* Since Granger causality tests require inclusion of lagged dependent variables, we had to use the LSDVC
specification (regression (8) in Table 2). In order to test for reverse causality we used all variables of the “final”
specification in regression (8). Predetermined explanatory variables are dated t-2 or earlier. The lower part of
Table A.3 shows the p-values for the Granger χ2-test once for inclusion of two lags and once for inclusion of
three lags (corresponding coefficient estimates and t-statistics for the latter case are not reported in Table A.3). In
regression (A.1) causation is established, since the coefficients of the independent variables (in bold) are jointly
significant (Prob > χ2(Lag 2) = 0.0373) in line with our baseline specifications in equations (1) and (2). For
regressions (A.2) to (A.5) the Granger causality χ2-statistics are insignificant for both Lag 2 and Lag 3,
suggesting that there are, as expected, no reverse causality patterns. t-statistics in parentheses, LSDVC standard
errors in regression (A.1) to (A.5) are bootstrapped based on 100 iterations.
* p < 0.10,
** p < 0.05,
*** p < 0.01
References
Aghion, P., Bloom, N., Blundell, R., Griffith, R., & Howitt, P. (2005). Competition and innovation: An
inverted-U relationship. Quarterly Journal of Economics, Vol. 120, 701-728.
Andres, L., Cuberes, D., Diouf, M., & Serebrisky, T. (2010). The diffusion of the internet: A cross-
country analysis. Telecommunications Policy, Vol. 34, 323-340.
Arrow, K. J. (1962). Economic Welfare and the Allocation of Resources to Invention. In R. R. Nelson,
The Rate and Direction of Economic Activity. New York: Princeton University Press.
Bacache, M., Bourreau, M., & Gaudin, G. (2012). Dynamic entry and investment in new
infrastructures: Empirical evidence from the Telecoms industry. Working paper, Telecom
ParisTech, Paris.
Berkman Center (2010). Next Generation Connectivity: A review of broadband Internet transitions and
policy from around the world. Final report, available at: http://cyber.law.harvard.edu/-
pubrelease/broadband/.
Bond, S. (2002). Dynamic Panel Data Models: A Guide to Micro Data Methods and Practice. Working
paper, centre for microdata methods and practice, CWP09/02.

[34]
Bouckaert, J., van Dijk, T., & Verboven, F. (2010). Access regulation, competition, and broadband
penetration: An international study. Telecommunications Policy, Vol. 34, 661-671.
Bourreau, M., Dogan, P., & Manant, M. (2010). A Critical Review of the Ladder of Investment
Approach. Telecommunications Policy, Vol. 34, 683-696.
Briglauer, W., & Gugler, K. (2013). The deployment and penetration of high-speed fiber networks and
services: Why are European member states lagging behind? Telecommunications Policy, DOI:
http://dx.doi.org/10.1016/j.telpol.2013.05.003.
Briglauer, W., Ecker, G., & Gugler, K. (2013). The impact of Infrastructure- and Service-based
Competition on the Deployment of Next Generation Access Networks: Recent Evidence from
the European Member States. Information Economics and Policy, DOI:
http://dx.doi.org/10.1016/j.infoecopol.2012.11.003.
Bruno G. (2005a). Approximating the bias of the LSDV estimator for dynamic unbalanced panel data
models. Economics Letters, Vol. 87, 361-366.
Bruno, G. (2005b). Estimation and inference in dynamic unbalanced panel-data models with a small
number of individuals. The Stata Journal, Vol. 5, 473-500.
Cameron, C., & Trivedi, P.K. (2005). Microeconometrics: Methods and Applications. Cambridge
University Press: Cambridge.
Cava-Ferreruela, I., & Albau-Munoz, A. (2006). Broadband Policy Assessment: A Cross-national
Empirical Analysis. Telecommunications Policy, Vol. 30, 445-463.
Cullen International (2011). Cross-Country Analysis April 2010. Brussels.
Czernich, N., Falck, O., Kretschmer, T., & Wößmann, L. (2011). Broadband Infrastructure and
Economic Growth. The Economic Journal, Vol. 121, 505-532.
Denni, M., & Gruber, H. (2007). The diffusion of broadband telecommunications in the U.S.
Communications and Strategies, Vol. 68, 139-157.
Distaso, W., Lupi, P., & Maneti, F.M. (2006). Platform competition and broadband uptake: theory and
empirical evidence from the European Union. Information Economics and Policy, Vol. 18, 87-
106.

[35]
Driscoll, J.C., & Kraay, A.C. (1998). Consistent covariance matrix estimation with spatially dependent
panel data. Review of Economics and Statistics, Vol. 80, 549-560.
European Commission (2010a). A Digital Agenda for Europe. COM(2010) 245, Brussels.
European Commission (2010b). Commission Recommendation of 20 September 2010 on regulated
access to Next Generation Access Networks (NGA). (2010/572/EU), Brussels.
European Commission (2012). Digital Agenda for Europe Scoreboard 2012. June 2012, Brussels,
available at: https://ec.europa.eu/digital-agenda/sites/digital-agenda/files/KKAH12001ENN-
PDFWEB_1.pdf.
FTTH Council Europe (2012). FTTH Business Guide. 3rd
edition, business committee, available at:
www.ftthcouncil.eu.
Grajek, M. (2010). Estimating network effects and compatibility: Evidence from the Polish mobile
market. Information Economics and Policy, Vol. 22, 130-143.
Grajek, M., & Kretschmer, T. (2009). Usage and diffusion of cellular telephony, 1998-2004.
International Journal of Industrial Organization, Vol. 27, 238-249.
Grajek, M., & Röller, L.H. (2012). Regulation and Investment in Network Industries: Evidence from
European Telecoms. Journal of Law and Economics, Vol. 55, 189-216.
Granger, C.W.J. (1969). Investigating causal relations by econometric models and cross-spectral
methods. Econometrica, Vol. 37, 424-438.
Guthrie, G. (2009). Real Options in theory and practice. New York: Oxford University Press.
Hoechle, D. (2007). Robust standard errors for panel regressions with cross-sectional dependence. The
Stata Journal, Vol. 7, 281-312.
Höffler, F. (2007). Costs and Benefits from Infrastructural Competition: Estimating Welfare Effects
from Broadband Access Competition. Telecommunications Policy, Vol. 31, 401-418.
Jung, I., Gayle, P.G., & Lehman, D.E. (2008). Competition and investment in telecommunications.
Applied Economics, Vol. 40, 303-313.
Kiiski, S., & Pohjola, M. (2002). Cross-country diffusion of the Internet. Information Economics and
Policy, Vol. 14, 297-310.

[36]
Kiviet, J. F. (1995). On bias, inconsistency and efficiency of various estimators in dynamic panel data
models. Journal of Econometrics, Vol. 68, 53-78.
Lee, S., Marcu, M., & Lee, S. (2011). An empirical analysis of fixed and mobile broadband diffusion.
Information Economics and Policy, Vol. 23, 227-233.
Nickell, S. (1981). Biases in dynamic models with fixed effects. Econometrica, Vol. 49, 1417-1426.
Nitsche, R., & Wiethaus, L. (2011). Access regulation and investment in next generation networks – A
ranking of regulatory regimes. International Journal of Industrial Organization, Vol. 29, 263-
272.
Pindyck, R.S. (2007). Mandatory Unbundling and Irreversible Investment in Telecom Networks.
Review of Network Economics, Vol. 6, 274-298.
RTR – Austrian Regulatory Authority for Broadcasting and Telecommunications (2010).
Communications report 2009. Vienna, available at: http://www.rtr.at/de/komp/alleBerichte.
Shy, Oz (2010). A short survey on network economics. Working paper no. 10-3, Federal Reserve Bank
of Boston.
Sunada, M., Noguchi, M., Ohashi, H., & Okada, Y. (2011). Coverage area expansion, customer
switching, and household profiles in the Japanese broadband access market. Information
Economics and Policy, Vol. 23, 12-23.
Valletti, T. (2003). The Theory of Access Pricing and Its Linkage with Investment Incentives.
Telecommunications Policy, Vol. 27, 659-675.
Wallsten, S., & Hausladen, S. (2009). Net Neutrality, Unbundling, and their Effects on International
Investment in Next-Generation Networks. Review of Network Economics, Vol. 8, Article 6.
wik consult (2008). The Economics of Next Generation Networks. Report commissioned by ECTA,
Bad Honnef.
Wooldridge, J. (2002). Econometric Analysis of Cross Section and Panel Data. MIT Press.
Zenhäusern, P., Schneider, Y., Berner, S., & Vaterlaus, S. (2012). Manual for the ‘Polynomics
Regulation Index 2012’ Data Set. Polynomics, Olten.