equal split in the informal market for group train travel · equal split in the informal market for...
TRANSCRIPT

Equal Split in the Informal Market for Group Train Travel
by Israel Waichman, Artem Korzhenevych, Till Requate
No. 1638 | July 2010

Kiel Institute for the World Economy, Düsternbrooker Weg 120, 24105 Kiel, Germany
Kiel Working Paper No.1638 | July 2010
Equal Split in the Informal Market for Group Train Travel
Israel Waichman, Artem Korzhenevych, and Till Requate
Abstract:
In this paper we make use of a unique dataset collected in the central train station of
Kiel, Germany. A group ticket is used by individual proposers who search for co-travelers to
share the ride with shortly before the train departure. The bargaining behavior resembles
the Ultimatum game to the extent that proposers request a fixed price for a shared ride and
potential co-travelers usually accept or reject the deal. We observe that the prevailing price
corresponds to the equal split of the ticket cost between the maximum possible number of
co-travelers. This result is remarkable because the positions of the bargaining parties are
hardly symmetric and the formation of the full group is not guaranteed. Using a simple
agent-based model we are able to identify some sufficient conditions leading to the observed
distribution of prices. Finally, we observed that the probability to accept an unusually high
offer is decreasing with the price and increasing when the offer is made right before the train
departure.
Keywords: natural field experiment; bargaining; focal point; equal split;
agent-based model
JEL classification: C78; C93; D74; D83
Israel Waichman
Department of Economics, University of Kiel
Olshausenstrasse 40
24098 Kiel, Germany
E-mail: [email protected]
Till Requate
Department of Economics, University of Kiel
Olshausenstrasse 40
24098 Kiel, Germany
E-mail: [email protected]
Artem Korzhenevych
Kiel Institute for the World Economy
Hindenburgufer 66
24105 Kiel, Germany
E-mail: [email protected]
____________________________________
The responsibility for the contents of the working papers rests with the author, not the Institute. Since working papers are of
a preliminary nature, it may be useful to contact the author of a particular working paper about results or caveats before
referring to, or quoting, a paper. Any comments on working papers should be sent directly to the author.
Coverphoto: uni_com on photocase.com

Equal Split in the Informal Market for GroupTrain Travel∗
Israel Waichman† Artem Korzhenevych‡ Till Requate§
This version: July 13, 2010
Abstract
In this paper we make use of a unique dataset collected in the central train station ofKiel, Germany. A group ticket is used by individual proposers who search for co-travelers toshare the ride with shortly before the train departure. The bargaining behavior resemblesthe Ultimatum game to the extent that proposers request a fixed price for a shared ride andpotential co-travelers usually accept or reject the deal. We observe that the prevailing pricecorresponds to the equal split of the ticket cost between the maximum possible number ofco-travelers. This result is remarkable because the positions of the bargaining parties arehardly symmetric and the formation of the full group is not guaranteed. Using a simpleagent-based model we are able to identify some sufficient conditions leading to the observeddistribution of prices. Finally, we observed that the probability to accept an unusually highoffer is decreasing with the price and increasing when the offer is made right before the traindeparture.
JEL Classification: C78; C93; D74; D83
Keywords: natural field experiment; bargaining; focal point; equal split;agent-based model
∗We are grateful to Reinhard Selten, Armin Falk, Werner Guth and the participants in theExperimental Economics seminars at the University of Bonn and at the Max-Planck Institutefor Economics in Jena for useful comments and discussion.†Department of Economics, University of Kiel, Olshausenstrasse 40, 24118 Kiel, Germany.
Email: [email protected]‡Kiel Institute for the World Economy, Hindenburgufer 66, 24105 Kiel, Germany. Email:
[email protected]§Department of Economics, University of Kiel, Olshausenstrasse 40, 24118 Kiel, Germany.
Email: [email protected]

1 Introduction
There is ample literature in experimental economics and psychology showing
that people often agree on equal-split solutions when bargaining for a common
surplus. Most of experiments reported in these studies focus on the Ultimatum
game and its different modifications (Guth et al., 2001; Falk et al., 2003), but
the equal-split phenomenon is also observed in many other bargaining games
(Green et al., 1967; Gachter and Riedl, 2005; Janssen, 2006). Although the
‘fairness’ argument was applied in some well-known studies (e.g. Guth et al.,
1982; Hoffman et al., 1994) to explain the common occurrence of the equal-split
outcome, this argument may be quite weak when the positions of the bargaining
parties are not symmetric, or when the players face uncertainty regarding the
gains of the other parties (Janssen, 2006). An alternative explanation is then
called for.
A very comprehensive account of alternative rules used in implicit and explicit
bargaining games is due to Schelling (1960). In particular, Schelling shows by
a variety of experiments that people are often able to coordinate their actions
and achieve mutual interests despite the multiplicity of possible strategies, and
do so even while being isolated from each other. The successful coordination
strategies concentrate on the outcomes that “enjoy prominence, uniqueness,
simplicity, precedent, or some rationale that makes them qualitatively different
from the continuum of possible alternatives” (Schelling, 1960, p.70). Schelling
refers to such outcomes at ‘focal points’.
A prominent focal point, appearing at multiple occasions in Schelling’s book,
but also in the variety of more recent papers, is the equal split of costs or benefits.
In most papers describing economic experiments equal split occurs under the
conditions of symmetry. For example, Janssen (2006) uses the examples of the
Nash bargaining game and of the Ultimatum game to show how the focal equal
split of the surplus emerges if the positions of the two players are symmetric or
1

subjectively perceived to be symmetric by the players.1
Some authors, however, suggest that equal split may preserve its prominence
also under less favorable conditions. For example, Green et al. (1967) describe a
two-person bargaining game, where the joint return from cooperation is higher
than the sum of individual returns without cooperation. One player suggests a
way to divide the joint payoff, and the other player can accept this cooperation
or reject it. An interesting finding in this situation is that departures from a
50-50 split of joint payoff are modest even in the trials where the individual
payoffs are substantially asymmetric. The authors interpret this finding as a
proof of the strength of the focal point principle.
In this study, we analyze the occurrence of the equal-split outcomes using a
unique dataset that we obtained by the observation of a real-world market. In
particular, we analyze the bargaining process in the informal market for group
train travel. The scene is the central train station of Kiel, Germany. One of
the features of the market is the obvious asymmetry between the participants,
which makes the results even more interesting.
The market we are looking at was born in 2001 with the introduction of
small-group tickets for regional trains in all federal states of Germany. Such a
ticket allows up to five people to ride together during one day within the area
of one or several neighboring states (the service area). The price of this ticket is
fixed irrespective of the actual number of people in the group. It is higher than
the price of a one-way ticket for the longest trip within the service area, but is
lower than the price of a round trip between some origin-destination pairs, which
makes it attractive also for individual use. These two features create an incentive
for a person planning a round trip (e.g. a daily commuter) to buy a group ticket
and invite other people (potential co-travelers) to share the ride in one direction
by contributing a certain part of the ticket price. Thus, a bargaining situation
1Janssen (2006) refers to Pull (2003) and Selten (2000) for the support of the claim thatthe players may perceive the Ultimatum game as symmetric.
2

is created, where a traveler in possession of a group ticket would approach other
travelers and request a fixed price for a shared ride, without surely knowing how
many co-travelers he/she will eventually find.
As a consequence, presently, the group ticket is widely used not only by the
organized groups traveling together and sharing the ticket price, but mainly by
individual proposers who search for co-travelers shortly before the train depar-
ture. The fact that potential co-travelers do not bargain, but usually accept or
reject the offer right away, resembles, to some extent, the Ultimatum bargaining
game.
We investigated the price-setting process in this market for six months, first
as detached observers and later as proposers. We find that the prevailing price
of a shared ride is lower than what seems to be the revenue maximizing price.
Furthermore, we observe that the prevailing price offer is based on the equal
division of the ticket cost by the maximum possible number of co-travelers. This
result is remarkable because the proposers obviously have more use of the ticket,
and full group formation is not always possible. We are able to show, by means
of a simple agent-based model, that the observed distribution of prices can be
replicated under two important conditions: if a large share of travelers base
their expectations upon the maximum (and most frequently observed) size of
the group, and if only few travelers have preferences against equal split in this
case of asymmetry between proposers and co-travelers. In addition, we show
that the probability to accept an unusually high offer is decreasing with the
price and is increasing when such offer is made right before the train departure.
This paper is organized as follows: The next section describes the informal
market for group train travel and the data collection. Section 3 presents the
results and also links the findings to the focal point theory. Section 4 presents
a simulation study of the market. Finally, Section 5 concludes.
3

2 The Informal Market for Group Train Travel
In this section, we briefly describe the informal market for group train travel
operating in Kiel central train station and also identify the conditions for such
a market to emerge. Then, we describe the data collection process, which con-
sists of two phases: the observation phase, where we have just documented the
transactions in the market, and the active participation phase, where we have
operated in the market, taking the role of proposers.
2.1 Characterization of the market
The so-called ‘Schleswig-Holstein ticket’ (SH-ticket) allows up to 5 people to
ride together in regional trains during one day within the area of the federal
German states of Schleswig-Holstein, Mecklenburg-Vorpommern and Hamburg.
Its price at 2008 (the year of observation) was e29. A single ticket from Kiel
to Hamburg (and the opposite way) costs e19.20, or e14.40 with a popular
rail discount card.2 These prices obviously create an incentive for a person
doing a round trip to rather buy a group ticket, than two single trip tickets (the
SH-ticket also allows to use the public transport in Hamburg without further
charge). It is then possible to recover some part of the ticket cost by sharing the
one-way3 ride with one or several (up to 4) other people. Some people indeed
use this opportunity by positioning themselves in the busy spot next to the
ticket-selling machines in Kiel central station and taking a role of a ‘proposer’
(a scheme of the station is given in Figure A.1 in the Appendix).
In this study, we are interested in the situation where the proposer offers a
fixed price for a shared ride, without surely knowing, how many co-travelers
he/she will find in the time left until the departure. In fact, 92% of our obser-
2For informed readers, it costs the same e14.40 with a ’Bahncard 25’ and with a ’Bahncard50’.
3There was no established market for group travel from Hamburg in the direction of Kielat the time of the experiment.
4

vations are of this kind. We are not interested in the cases where the price is
determined ex post by the ultimate number of co-travelers.
Typically, a proposer would approach other travelers with a question like
“Are you going to Hamburg?”. A traveler going that way may show interest
and ask for the price, after which he/she would have a possibility to agree,
reject, or try to bargain4. A person that agreed on the offered price stays with
the proposer, which means that any consequent potential co-travelers (we will
sometimes call them ’responders’ for short) are offered the same price.5 The
search continues for some time (on average 14 minutes), after which the group
proceeds to the train.
We can identify two general conditions needed for such sustainable market to
emerge. There must be a sufficiently large volume of travelers from the origin
station to a common destination, and there must be a preferably unique, easy to
find meeting point for bargaining at the origin station. These conditions are met
in Kiel, a city of 240.000 inhabitants, which is located 100 km north of Hamburg,
the second largest city in Germany. Kiel and Hamburg are the economic centers
of the two neighboring federal states6. The distance between the two is short
enough (80 minutes travel), such that many people regularly travel from Kiel
to Hamburg for work7 and leisure. Moreover, a feature of the local rail network
is that almost all connections from Kiel to any other major German city go
through Hamburg. Thus, the regional trains departing every hour are normally
well filled. The central station in Kiel is quite small and a natural meeting place
for any occasion exists between the Deutsche Bahn information desk8 and the
4Explicit requests to reduce the price are very rare, and all our observations of potentialco-traveler behavior are of yes-or-no type.
5An additional reason why price discrimination between co-travelers is not observed is thatmembers of the group sit close to each other (for the case of ticket control) and can see others’contributions.
6In fact, Hamburg is a city-state in itself. It has 1.8 mln inhabitants.7About 2.500 people from Hamburg regularly commute to work in Kiel, and about 3.700
commuters go in the opposite direction. (Federal Employment Agency data)8This is particularly amazing, because most people acting in the market perceive this
activity as illegal.
5

ticket-selling machines (see Figure A.1). The high number of travelers in one
direction (to Hamburg), together with the fact that there are many travelers
who make a round trip create a sustainable and flourishing market for group
travel by train. Indeed, there are individuals who spend the whole day just
traveling back and forth and collecting money from the co-travelers they are
able to find.
2.2 The observation phase
During May-June 2008 we observed the market in the central train station of
Kiel on weekdays from Monday through Thursday (a total of 19 different days)
each day looking at four train departures to Hamburg at 16:21, 17:21, 18:21,
and 19:21. We chose to observe the market in the afternoon of normal weekdays
mainly for two reasons. First, in a very busy hour (as on Fridays or weekends)
it may be not feasible to thoroughly trace the offers. Moreover, in busy times
competition between proposers may be intensive and the situation becomes
less a bargaining and more a market situation. Second, we planned to enter
the market as proposers at a later stage, offering prices much higher than the
usually observed. This would only be possible with few proposers in the market.
At each day, the observer arrived at the meeting point close to the automatic
ticket machines at 15:50 (half an hour before the train of 16:21 departs) and
stayed there until 19:21, documenting the arrival and departure time of pro-
posers, their gender, and the prices offered.9 It amounted to a total of 148 clear
observations of price offers, from which 11 cases were not strictly offers to take
co-travelers for a fixed price, but rather cost-sharing offers, as explained above.
The cases of rejected offers were not documented since it was impossible to
track every conversation and thus to differentiate between potential co-travelers
and people who travel to other destinations than Hamburg. It must be added
9Because we could only document the offers by staying very close to other people, andtried to avoid possible trouble, mobile phones were used to document the results.
6

that we were observing the market quite often before and also after this system-
atic study, and although the observed sample is of moderate size, its observed
properties are in line with our experience.
2.3 The active participation phase
The observation phase gave us interesting information about the proposers’
behavior, but not so much knowledge about the co-travelers. In order to get
some insights about co-travelers’ reaction to different price offers, we entered the
market as proposers. Initially, we aimed at revealing the otherwise essentially
unobserved demand for shared ride at prices higher than the highest frequently
observed price of e7. For this purpose we employed four research assistants
(three females and one male) to behave as proposers in the market.
The experimental procedure was as follows. The research assistants bought
the SH-ticket immediately upon arrival at the train station. They offered the
shared ride to Hamburg for a fixed price on the same weekdays and hours as in
the observation phase (Mo-Thu, 15:50-19:21). They documented the exact time
at which they made an offer to potential co-travelers and the gender of the po-
tential co-travelers. To motivate them to approach as many people as possible,
the research assistants could keep the money they had earned as proposers in
addition to their hourly salary. If the assistants found at least one person to join
them, they took a train to Hamburg. They did not provide information about
the experiment to the co-travelers at any point of time. The co-traveler could
only know that the proposer is traveling to Hamburg and would come back
later using the SH-ticket. In total, our research assistants entered the market
as proposers during 35 different days, between June’08 and October’08. The
length of test period for every price level is given in Table 1. It is worthwhile
to test such high prices, because they are still lower than a single-ticket prices
(with and without a discount).
7

Price offered 8 10 12 13 14 15 17 18Number of days 6 7 6 5 2 4 1 4
Table 1: Length of test period for different price levels
While we initially aimed at revealing the demand for travel using the SH-
ticket under the high prices, the collected results for price offers higher than
e10 are not directly comparable with the results for lower price offers. One
reason is that with prices higher than e10, we could only enter the market in
the absence of other proposers. Note that some of the potential co-travelers
have experience with the market, and they know the usual price offers. For
that reason, at high prices potential co-travelers are looking for a better offer.
A second reason is that, despite the monetary incentive, our research assistants
felt very uncomfortable in offering such high prices for a shared ride, and they
only approached people that subjectively did not embody a source of trouble
for them. Therefore, for prices higher than e10, we only aimed at finding the
price where the demand is equal to zero (i.e. when no traveler would be willing
to come with us).
3 Results
In this section we summarize the empirical findings. We start by analyzing
the proposer behavior as reflected by the inspection of the market. Then, we
describe our findings regarding the willingness of co-travelers to accept unusually
high price offers.
3.1 The observation phase
Table 2 presents the major characteristics of the market. It indicates that on
average a proposer waits for 14 minutes in the market, offers a shared ride
for an average price of e5.90, and an average of 3.2 responders agree to the
8

offer. In addition, 64% of the proposers are males, and only 5% are (looking)
older than 40 years. A fact important for our further analysis is that the most
frequent (56% of all cases) number of co-travelers coincides with the maximum
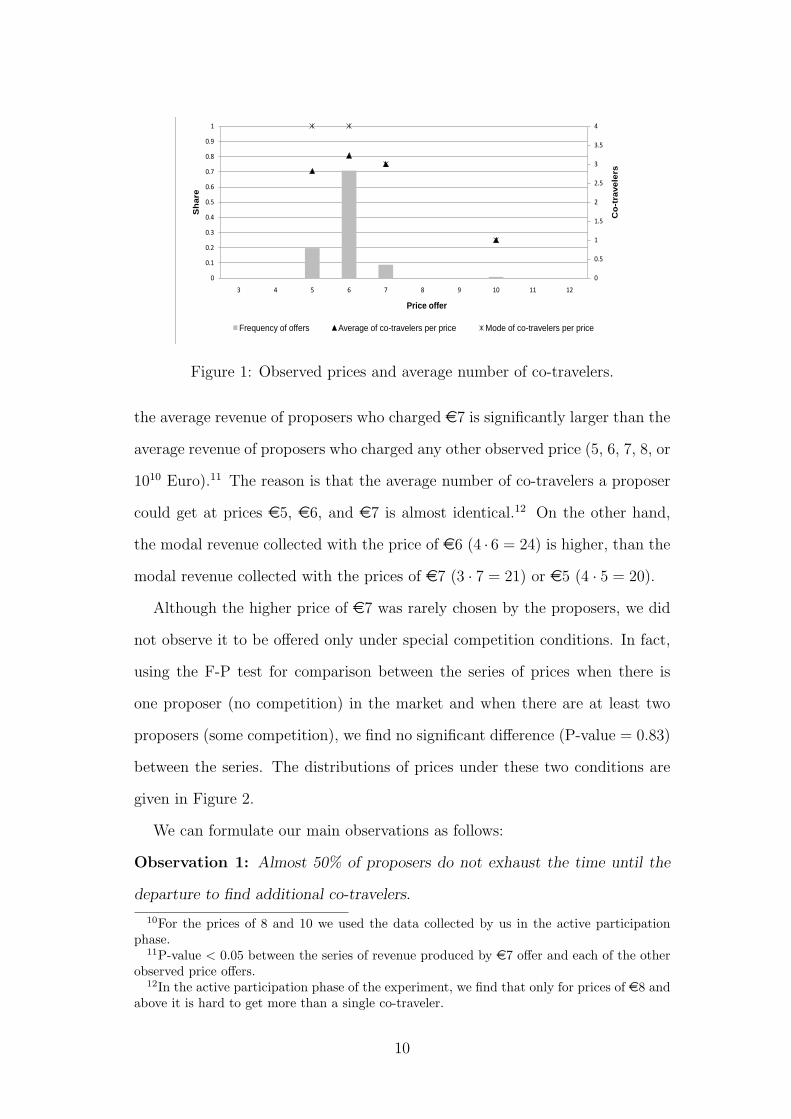
possible number (4 people). Two remarkable features regarding the price offers
(shown in Figure 1) are that all offers were of integer prices, and that most price
offers (124/137 = 91%) were either e5 or e6. An interesting fact is that an
average taken only across these two most frequent offers equals e5.80, which
corresponds to 15th of the SH-ticket price (e29).
Another remarkable feature following from our observations is that 47% of
the proposers who gather less than four co-travelers, leave the market more than
10 minutes before the train departure. This means that almost half of these
proposers do not act as pure revenue-maximizers by exhausting the time until
the departure. However, we have to take into account that staying longer in
the market may at least bring the cost of getting an uncomfortable seat in the
train.
Although not systematically documented, rejections of offers by potential co-
travelers were observed at all prices, except e5. Furthermore, a proposer could
not always ensure to get 4 co-travelers even with the lowest observed price of e5.
Table A.1 in the Appendix shows additional details about the market separately
for each train departure time.
Mode Mean Std. Dev. Min Max
Number of proposers per train 2 2.42 1.07 1 6Proposers’ price (e) 6 5.92 0.63 5 10Co-travelers per proposer 4 3.15 1.29 0 4Waiting time per proposer (min) 16 14 6 3 33Proposers’ revenue (e) 24 18.57 7.01 0 28
Table 2: Summary statistics of the Kiel market for group train travel
Taking the data from our observations as given, we can identify which price
offer brings the highest average revenue to the proposer. Using a Robust Rank
Order test (F-P test, according to Fligner and Policello, 1981), we find that
9
0
0.5
1
1.5
2
2.5
3
3.5
4
0
0.1
0.2
0.3
0.4
0.5
0.6
0.7
0.8
0.9
1
3 4 5 6 7 8 9 10 11 12
Sh
are
Price offer
Frequency of offers Average of co-travelers per price Mode of co-travelers per price
Co
-tra
ve
lers
Figure 1: Observed prices and average number of co-travelers.
the average revenue of proposers who charged e7 is significantly larger than the
average revenue of proposers who charged any other observed price (5, 6, 7, 8, or
1010 Euro).11 The reason is that the average number of co-travelers a proposer
could get at prices e5, e6, and e7 is almost identical.12 On the other hand,
the modal revenue collected with the price of e6 (4 · 6 = 24) is higher, than the
modal revenue collected with the prices of e7 (3 · 7 = 21) or e5 (4 · 5 = 20).
Although the higher price of e7 was rarely chosen by the proposers, we did
not observe it to be offered only under special competition conditions. In fact,
using the F-P test for comparison between the series of prices when there is
one proposer (no competition) in the market and when there are at least two
proposers (some competition), we find no significant difference (P-value = 0.83)
between the series. The distributions of prices under these two conditions are
given in Figure 2.
We can formulate our main observations as follows:
Observation 1: Almost 50% of proposers do not exhaust the time until the
departure to find additional co-travelers.
10For the prices of 8 and 10 we used the data collected by us in the active participationphase.
11P-value < 0.05 between the series of revenue produced by e7 offer and each of the otherobserved price offers.
12In the active participation phase of the experiment, we find that only for prices of e8 andabove it is hard to get more than a single co-traveler.
10

0
0.1
0.2
0.3
0.4
0.5
0.6
0.7
0.8
0.9
1
3 4 5 6 7 8 9 10 11 12
Sh
are
Price offer
(a) Offers without competition
0
0.1
0.2
0.3
0.4
0.5
0.6
0.7
0.8
0.9
1
3 4 5 6 7 8 9 10 11 12
Sh
are
Price offers
(b) Offers with competition
Figure 2: The distribution of price offers in the market with one (a) and several(b) proposers
Observation 2: The price of (e6), prevailing in the market, brings the highest
modal revenue, while e7 brings the highest average revenue.
Observation 3: Rejections of proposers’ offers are observed at all prices except
for the lowest observed price of e5.
Observation 4: The presence of additional proposers does not change the
distribution of price offers in the market and does not induce potential co-
travelers to bargain for a lower price.
In general, the distibution of the price offers is the most puzzling result of our
observations. As displayed in Fugure 1, three price offers (5, 6, and 7 Euros) are
11

chosen by a non-negligible share of proposers (however, due to moderate sample
size, we cannot exclude the possibility that also other price offers exist). As the
three offers produce (significantly) different average revenue levels, it seems that
either the observed distribution of demand for shared ride (the number of co-
travelers at these prices) does not convey the expectations of the proposers about
this distribution, or that the majority of proposers are not acting as revenue-
maximizers, or both. Unfortunately, since the action of gathering co-travelers
is perceived as illegal13, proposers are not willing to discuss the peculiarities of
price-setting with a curious researcher.
We claim that the key to understand the observed distribution of price offers
is to consider the alternatives that the one-way travelers assume to have. In fact,
sharing the SH-ticket with five other people is the cheapest option a traveler
by train from Kiel to Hamburg has. If the number of one-way travelers were
unlimited, they would always try to organize themselves in groups of five and pay
an average of e5.80 per trip. However, as clearly follows from our observations,
it is not always possible to form a group of the maximum size. In such a case,
a rational one-way traveler can no longer expect to have the option of paying
e5.80. Moreover, a rational proposer offering a shared ride for a fixed price
would also recognize that sometimes the one-way travelers do not have the
outside option of paying e5.80. In fact, in more than 50% of the observed train
departures, the mean number of co-travelers per proposer was less than 4, and
in 20% it was only 2 or lower, while the price offers remained at the level of e5
or e6. There were simply not enough one-way travelers to Hamburg around at
those occasions. Why didn’t the price offers go up then?
Our understanding is that additional, unobserved factors influence the per-
ception of the market situation by the proposers, which makes them reluctant
13A ticket should be used by one and the same group of co-travelers. However, becauseonly one person has to write his/her name on the ticket, the possibility for misconduct isleft open. In the afternoon, proposers in Kiel typically offer to share an SH-ticket that wasbought in Hamburg in the morning, which is illegal.
12

to choose higher price offers. The exact reason for such behavior is not possible
to reveal using the data we have. Possible explanations could include the fear of
competition with other proposers, some type of unwillingness to be considered
greedy, uncertainty (having little experience with this market), time pressure,
etc. We think that any of these factors or their combinations may be true for
any individual. However, as we explain later, a lot of such assumptions result
in the same market strategy.
One more puzzling finding is that some responders reject the price of e6. We
think that it is not only the pure sharing outcome of e5.80 that is seen as an
outside option by the responders in these cases. More important is that some
proposers offer a shared ride for e5 in the first place. Obviously, although the
difference between e5.80 and e6 is rather small, it could be a reason enough for
some reponders to reject the offer. However, we think that it is not likely that
the proposer would charge e5 just to prevent the rejection based on the e0.20
difference.14 It is however more plausible to assume that the proposer might
consider it fair to divide the ticket price by the number of uses of the ticket, and
might thus accept double charge on the own account. If many proposers behave
like this, the potential co-travelers would see a clear possibility to pay even less
than e5.80 on average and thus would have a reason to reject the price of e6.
In Section 4, we suggest a simple model of the market situation under study,
which allows for different expectations by the participants, as well as for differ-
ent attitudes towards fairness. We show that this simple model is capable of
reproducing the observed price distribution.
14In the situation with many travelers in the market, a proposer can reasonably assumethat at least some people will not be such extreme optimizers, and a complete group can beformed despite some rejections.
13

3.2 The active participation phase
Recall that our aim in this phase was to reveal the price where the demand is
equal to zero (i.e. no potential co-traveler is willing to come with us). Although
the prevailing price in the market is e6, it was only at the price of e18 that
we did not find a single person to join us. This indicates that at least some
potential co-travelers are willing to pay any price as long as it is lower than the
full cost of the ticket, as economic theory predicts.
Observation 5: Only at a price of e18 none of the potential co-travelers were
willing to share the ride to Hamburg.
Although the collected observations are not entirely comparable with each
other, it is still worthwhile to present some findings. Figure 3 illustrates that
when the price increases, the share of rejected offers increases monotonically.
Moreover, this figure also indicates that the higher the price offer, the lower the
average number of co-travelers willing to join the proposer.15
0
0.5
1
1.5
2
0
0.1
0.2
0.3
0.4
0.5
0.6
0.7
0.8
0.9
1
8 9 10 11 12 13 14 15 16 17 18 19 20
Sh
are
Price offersRejection rates Average of co-travelers per price
Co
-tra
ve
lers
Figure 3: Rejection rates and the average number of co-travelers per price offer.
Finally, we estimated a Logit model, to see if the price, time pressure, and
15We do not include the prices of e14 and e17 in Figure 3 since we had only 2 and 1observations of each price, respectively.
14
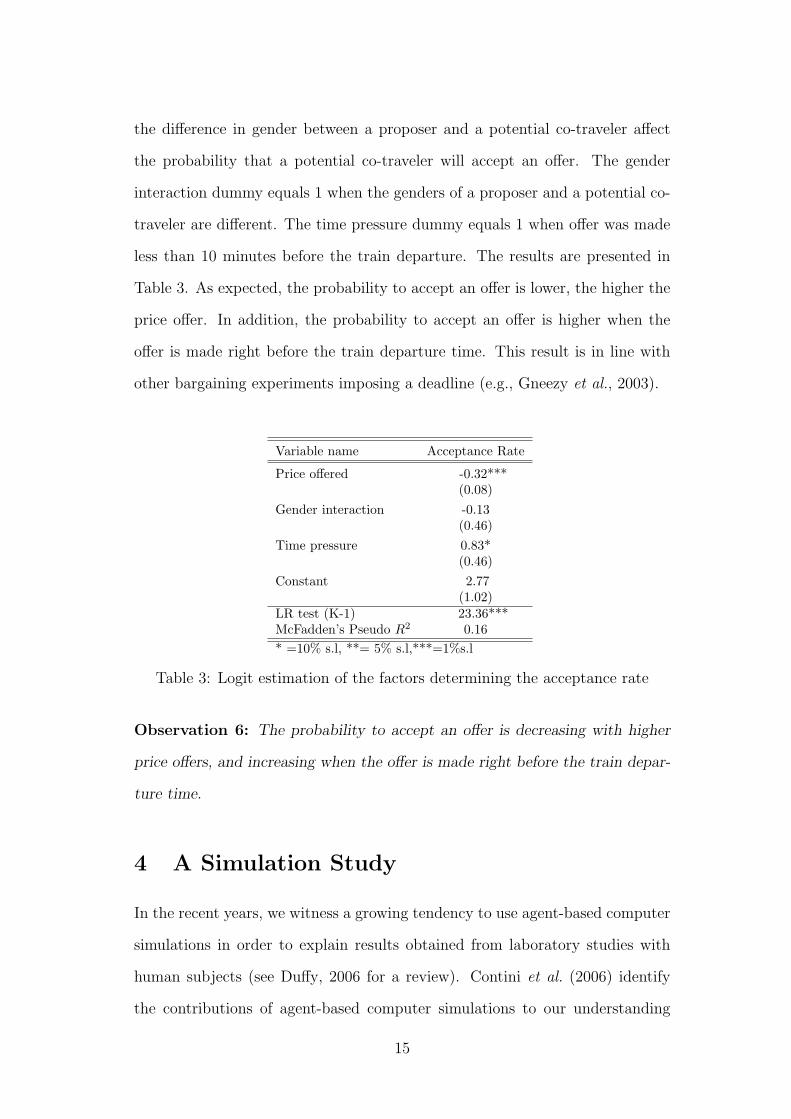
the difference in gender between a proposer and a potential co-traveler affect
the probability that a potential co-traveler will accept an offer. The gender
interaction dummy equals 1 when the genders of a proposer and a potential co-
traveler are different. The time pressure dummy equals 1 when offer was made
less than 10 minutes before the train departure. The results are presented in
Table 3. As expected, the probability to accept an offer is lower, the higher the
price offer. In addition, the probability to accept an offer is higher when the
offer is made right before the train departure time. This result is in line with
other bargaining experiments imposing a deadline (e.g., Gneezy et al., 2003).
Variable name Acceptance Rate
Price offered -0.32***(0.08)
Gender interaction -0.13(0.46)
Time pressure 0.83*(0.46)
Constant 2.77(1.02)
LR test (K-1) 23.36***McFadden’s Pseudo R2 0.16* =10% s.l, **= 5% s.l,***=1%s.l
Table 3: Logit estimation of the factors determining the acceptance rate
Observation 6: The probability to accept an offer is decreasing with higher
price offers, and increasing when the offer is made right before the train depar-
ture time.
4 A Simulation Study
In the recent years, we witness a growing tendency to use agent-based computer
simulations in order to explain results obtained from laboratory studies with
human subjects (see Duffy, 2006 for a review). Contini et al. (2006) identify
the contributions of agent-based computer simulations to our understanding
15

of human behavior. Two points are especially appealing for our study. The
first is that “agent-based models can be used to investigate sufficient conditions
for specific patterns of individual or aggregate behavior to emerge, given the
details of the interaction structures” (Contini et al., 2006, p.4). Second, they
“provide a benchmark against which to evaluate the actual results of the human
subject experiments” (ibid., p.4). These two points describe quite precisely the
motivation for the following analysis.
This section presents a simulation study based on a simple model (without
learning) that allows for different types of behavior. The agents in the market
are distinguished according to the level of expertise in the market, and according
to their attitude towards asymmetry. Using this simulation study, we are able
to show that if many travelers try to coordinate their expectations using the
equal split between the maximum number of group members as a focal point,
and if only few people have strong preference against the asymmetric use of the
ticket, the resulting distribution of prices is very similar to what we actually
observe in the central station of Kiel.
4.1 The model
To begin, imagine a situation with many (identical) one-way travelers from Kiel
to Hamburg coming to a small spot near the ticket-selling machines. The ticket
prices are as described in Section 2. Given the high prices for single tickets,
sharing a group ticket is a better choice for any traveler, if the ticket cost is
divided in a mutually acceptable way. In a symmetric setup, the most natural
way to split the cost would be the equal division. If the passenger flow is large, a
group of maximum size can always be formed. Thus, in this situation a one-way
traveler can expect to pay e5.80 per trip.
In reality, however, the intensity of passenger flow is not constantly large; it
varies depending on the time of the day and the day of the week. We assume
16

that any one-way traveler, r, would try to guess the number N r ≤ 4 of other one-
way travelers who would show up and want to share the ride with him/her. The
way this number is determined will be explained later. Thus, in this situation
a one-way traveler expects to pay
P r = 29/(N r + 1).
Let there be some share of two-way travelers in the market. A two-way
traveler has two basic options: to join a group of one-way travelers with an
expected contribution of P r (and to buy a single ticket for the way back), or to
buy an SH-ticket and become a proposer. The latter option is better if
29/(Np + 1) + T > 29−Np · P p, or
T > Np · (29/(Np + 1)− P p),
where T is the single ticket price, Np ≤ 4 is the number of co-travelers expected
by the proposer, and P p is the fixed price offer of the proposer. T can take only
two values: e14.40 or e19.20. Note that a proposer tries to ensure that other
people join his group, and has to compete with the sharing offers16, P p ≤ P r.
However, it is easy to show that if the proposer’s price offer is not unreasonably
lower than the expected equal split level17, buying an SH-ticket is always a
better choice. The two-way travelers thus always buy an SH-ticket and act as
proposers.
The one-way travelers may theoretically also enter the scene as proposers.
This would be reasonable if
16Possibly, one also keeps in mind the presence of other proposers. In this case, however, itis still most plausible to expect that also other proposers see pure sharing as the best outsideoption for the potential co-travelers and choose a price correspondingly.
17For example, charging e1 when expecting 4 people to join.
17

29/(Np + 1) > 29−Np · P p, or
29/(Np + 1) < P p.
The inequality holds if N r < Np for every co-traveler r that joins the group
of this proposer. It means that the proposer traveling one way must expect all
potential co-travelers to have a lower guess of the perspective size of the group.
This is a very brave assumption to make. Moreover, from our experience, the
proposers are indeed always traveling two ways. That is why we will not consider
the case of one-way travelers playing the role of proposers.
We are now ready to define the beliefs and strategies of different agents in the
model. As argued above, the equal split of the ticket price between the expected
number of members of the group is the relevant benchmark against which the
fixed price offers of the proposers must be evaluated. However, we can argue
that both the idea of the equal split and the base for expectations formation
can differ across the population.
In general, our choice of behavioral rules is determined by the focal point
theory. We assume that all agents base their strategies on a guess of the most
probable size of the group, which is an integer number. The outcomes charac-
terized by prominence or having the highest probability are very often used to
coordinate strategies in the situations without communication (Schelling, 1960,
Chapter 3). It is therefore plausible to assume that similar focal points are used
as coordination devices by the bargaining parties in our market situation.
In particular, we assume that there are two types of agents in the market,
optimists and realists. Optimistic agents (both one- and two-way travelers)
form their expectations based on the maximum possible size of the group (5
people).18 The optimistic proposers will thus choose prices close to the e5.80
18Implicitely, we assume here that the samples of one- and two-way travelers are not sys-tematically different. It is done to keep the number of model parameters small.
18

benchmark. Alternatively, one could assume that some proposers are especially
afraid of competition, or are unwilling to look gready, and thus choose prices
only at the lower end of distribution. One more possble explanation of the same
strategy would be the lack of experience, whereby the most frequently observed
number of co-travelers or the most frequently chosen price (as communicated
by some more experienced locals) is used as a base for expectations formation.
The corresponding pricing strategy would however stay the same, and thus we
have no way to distinguish between such alternative explanations.
Realists (again, both one- and two-way travelers), in turn, recognize that the
average and modal size of the group vary over time, determined by the state
of nature (intensity of the passenger flow), and expect this fact to be known
to (many) other travelers. We will define 4 states of nature, distinguished by
the expected modal number of co-travelers (4, 3, 2, and 1). For that, we will
use our data on group formation for 71 train departures (from the observation
phase), where only the prices of e5 and e6 where offered (to avoid the price
effect). For each departure, we can identify the average group size. Intervals
in the values of the mean group size are then defined, such that these intervals
have different modes. The results are given in Table 4.
State of nature (intensity) Above average Average Below average Sporadic
Mean number of co-travelers 4.0-3.5 3.5-2.5 2.5-1.5 1.5-1Modal number of co-travelers 4 3 2 1Frequency (%) 48 23 21 8
Table 4: Empirical distribution of the number of co-travelers for prices of e5and e6.
We will assume that realist agents can correctly recognize the current state of
nature. A realist agent would thus make a guess Np,r = 3 if the state of nature
is ’average’, etc, see Table 4. The realist proposers would then charge different
prices depending on the state of nature that they observe. Realist responders
will correspodingly revise the maximum fixed price offer they will agreee to. All
19

proposers would keep the outside option of the responders in mind.
Given the observed regularity that only integer prices were used in our mar-
ket, we have to incorporate this feature into the model. The focal point theory
can again be used to argue that in order to coordinate mutual expectations, the
proposers and responders would likely use the same rule and would round the
non-integer outcomes to the next closest integer.
The price offer of the proposer will thus be
P p = |29/(Np + 1)| .
The maximum price to which the responder will agree will be
P r = |29/(N r + 1)| .
Now we come to the possibility of different interpretations of the notion of
equal split. In reality, it is common knowledge that two-way travelers make
more use of the SH-ticket. Let us assume a type of fairness-loving (or ’fair’, for
short) travelers. These fair travelers assume that everyone should pay according
to the usage of the ticket. In other words, as a two-way traveler uses the ticket
(at least) twice, then he/she should pay the double. We will refer to the travelers
that do not care about such fair split as ’normal’.
The price offer of the fairness-loving proposer will thus be
P pf = |29/(Np + 2)| .
The maximum price to which the fairness-loving responder will agree will be
P rf = |29/(N r + 2)| .
In the next subsection, we will let the share of optimists and the share of
20

fairness-lovers be exogenous parameters, and will vary them. We will then try
to find whether some combination of parameters would be able to produce the
distribution of prices similar to what we actually observed in Kiel central station.
4.2 Simulation results
Let us assume that the empirical distribution of the modal number of co-
travelers that was observed in Kiel’s train station for low prices (5 and 6 Euros)
is the true distribution. The simulation procedure consists of the following steps:
1. The state of nature (expected number of co-travelers perceived by the
realists) is drawn from the distribution in Table 4.
2. A proposer is generated, characterized by type (optimist/realist, fair/normal).
3. A potential co-traveler (responder), also characterized by type, is gener-
ated.
4. The proposer and the responder meet and the outcome of bargaining is
determined according to the described strategies.
5. If the first offer is rejected, the next potential co-traveler is generated and
step (3) is repeated. After an offer is accepted, the price offer is saved.
6. Steps (1) until (5) are performed 10000 times.
The simulation results for different shares of optimists and fairness-lovers in
the population are displayed in Figures 4-7. Figures 4(a), 5(a), 6(a) and 7(a)
describe the distribution of prices in the case that all travelers in the market
recognize the true state of nature. The rest of the figures illustrate that with
higher share of optimists in the population of travelers, the distribution of prices
changes towards a distribution of only two prices, e5 and e6. Note that, as
21

we move from Figure 4 to Figure 7, we observe that higher share of “fairness-
lovers”, increases the number of offers of e5. Note that Figure 5(b) resembles
the empirical distribution of offers from the observation phase. In fact, for the
share of optimists equal to 60% and the share of fairness-lovers equal to 20%,
we get a distribution statistically indistinguishable from the observed one (F-P
test produces P-value equal to 0.3).
This simulation exercise allows us to identify sufficient conditions that bring
the observed distribution of prices. Under quite reasonable assumptions and
using the empirical distribution of travelers that was observed in Kiel’s train
station, we find that market interaction leads to the observed distribution of
prices if two conditions are met: First, the share of optimists is sufficiently
large (but also not too large); second, the share of fairness-lovers is sufficiently
small. The simulation exercise also provides us some benchmark results under
extreme conditions, that can be compared to the empirical distribution of prices.
For example, it provides a price distribution for the case where noone in the
population is willing to split equally due to asymmetry (Figure 7), or situations
where the “true” state of nature is known to all travelers (Figures 4(a), 5(a),
6(a), and 7(a)).
5 Concluding Remarks
This study describes the informal market for group train travel in the central
train station of Kiel, Germany. This market emerged with the introduction of
the small-group ticket, which allows a group of maximum five people to travel in
regional trains within the area of three neighboring federal states. The market
is mainly characterized by individual proposers in possession of the group ticket
who search for co-travelers shortly before the train departure. Proposers request
a fixed price for a shared ride, without surely knowing how many co-travelers
22

(a) Distribution of prices (0% optimists) (b) Distribution of prices (33% optimists)
(c) Distribution of prices (67% optimists) (d) Distribution of prices (100% optimists)
Figure 4: Distribution of prices for different shares of optimists and 0% fairness-lovers
(a) Distribution of prices (0% optimists) (b) Distribution of prices (33% optimists)
(c) Distribution of prices (67% optimists) (d) Distribution of prices (100% optimists)
Figure 5: Distribution of prices for different shares of optimists and 33% fairness-lovers
they will eventually find.
The observation of the market brings up some interesting findings: First,
almost half of the proposers, who find less than four co-travelers, do not ex-
23

(a) Distribution of prices (0% optimists) (b) Distribution of prices (33% optimists)
(c) Distribution of prices (67% optimists) (d) Distribution of prices (100% optimists)
Figure 6: Distribution of prices for different shares of optimists and 67% fairness-lovers
(a) Distribution of prices (0% optimists) (b) Distribution of prices (33% optimists)
(c) Distribution of prices (67% optimists) (d) Distribution of prices (100% optimists)
Figure 7: Distribution of prices for different shares of optimists and 100%fairness-lovers
haust the time until the departure to find additional co-travelers. Second, the
prevailing price in the market is not the price of e7, which brings the highest
average revenue, but the price of e6, which brings the highest modal revenue.
24

Third, despite the high prices of single tickets, rejections of such fixed offers
occur at all prices except e5. Fourth, the presence of additional proposers does
not change the distribution of price offers in the market and does not induce
potential co-travelers to bargain for a lower price. Fifth, by means of a natural
field experiment, we show that the probability to accept an unusually high offer
is decreasing with the price and is increasing when the offer is made right before
the train departure.
Our findings about the distribution of price offers can be best explained by
focal point theory, where the equal split of the ticket cost between the expected
number of the members of the group is used as a coordination device. Although
the focality of equal split was already observed in the lab (see, for example,
Green et al., 1967, and Gachter and Riedl, 2005), we are able to demonstrate
the strength of this behavioural rule in a completely natural environment. Our
findings are particularly interesting since there is a clear asymmetry between
the proposer and the co-travelers in terms of the use of the ticket.
Using a simple agent-based simulation model, we are able to reproduce the
key features of the observed price distribution. We show that two sufficient
conditions for such pattern to arise are, first, a large share of travelers basing
their expectations upon the maximum (and most frequently observed) size of the
group, and second, a small share of travelers having explicit preference against
equal split in this case of asymetric use of the ticket.
By the time this paper has been finalized, a quite remarkable development
occured in the market under study. We mentioned in Section 2 that some
share of the proposers in the market seem to do this on a professional basis,
traveling the whole day between Kiel and Hamburg. After two years, the market
seems to be dominated by such professional proposers, most of them being
unemployed immigrants. They also managed to establish an active market
for sharing the return trip in the central station of Hamburg, although the
25

meeting point is not so ideally located there. Several features of the market that
we described in this paper can provide an explanation for this development.
First, the rules of the ticket use are not very strict and open clear arbitrage
possibilities. Second, the demand for sharing offers is very large most of the
time. Finally, we have shown that many travelers are eager to pay prices much
higher than the usually observed ones. All this creates favorable conditions
for the described transformation of this informal market, which is worth an
additonal study. However, we will be surprised if Deutsche Bahn does not react
to this development in the nearest future.
References
Contini, B., Leombruni, R. and Richiardi, M. (2006). Exploring a new
expace: The complementarities between experimental economics and agent-
based computational economics. Journal of Social Complexity, 3 (1).
Duffy, J. (2006). Agent-based models and human subject experiments. In
L. Tesfatsion and K. L. Judd (eds.), Handbook of Computational Economics,
Handbook of Computational Economics, vol. 2, 19, Elsevier, pp. 949–1011.
Falk, A., Fehr, E. and Fischbacher, U. (2003). Reasons for conflict:
Lessons from bargaining experiments. Journal of Institutional and Theoretical
Economics (JITE), 159, 171–198.
Fligner, M. A. and Policello, G. E. (1981). Robust rank procedures for
the behrens-fisher problem. Journal of the American Statistical Association,
76, 162–168.
Gachter, S. and Riedl, A. (2005). Moral property rights in bargaining with
infeasible claims. Management Science, 51, 249–263.
26
Gneezy, U., Haruvy, E. and Roth, A. E. (2003). Bargaining under a
deadline: Evidence from the reverse ultimatum game. Games and Economic
Behavior, 45, 347–368.
Green, P. E., Gross, I. and Robinson, P. J. (1967). Behavioral experiment
in two-person bargaining. Journal of Marketing Research, 4, 374–379.
Guth, W., Huck, S. and Muller, W. (2001). The relevance of equal splits
in ultimatum games. Games and Economic Behavior, 37, 161–169.
—, Schmittberger, R. and Schwarze, B. (1982). An experimental analysis
of ultimatum bargaining. Journal of Economic Behavior and Organization,
3, 367–388.
Hoffman, E., McCabe, K., Shachat, K. and Smith, V. (1994). Pref-
erences, property rights, and anonymity in bargaining games. Games and
Economic Behavior, 7, 346 – 380.
Janssen, M. C. (2006). On the strategic use of focal points in bargaining
situations. Journal of Economic Psychology, 27, 622–634.
Pull, K. (2003). Ultimatum games and wages: Evidence of an implicit bargain.
Schmalenbach Business Review, 55, 161–171.
Schelling, T. (1960). The Strategy of Conflict. Cambridge, Massachusetts:
arvard University Press.
Selten, R. (2000). Thunenvorlesung: Eingeschrankte rationalitat und
okonomische motivation. Zeitschrift fur Wirtschafts- und Sozialwis-
senschaften, 9, 129157.
27

A Appendix
Train Proposers Co-travelers Average price Average price (offers of e5 and e6)16:21 2.44 3.05 5.88 5.7817:21 2.59 3.04 5.86 5.7818:21 2.00 2.89 6.11 5.7019:21 2.54 2.79 5.85 5.85
Table A.1: Average values according to the train’s departure times.
Platform 6
Platform 5
Platform 4
Platform 3
Platform 2
Platform 1
Shops
Shops
Information
Shops
Shops
Ticket Machines
Main Street and Bus Stations
Taxi
Entrance
Entrance
Entrance
North
The Market Place
Figure A.1: plan of Kiel’s central train station
28