linolnlaboratony figuration, equipment an'i technique. results obtained in the equivalency ......
TRANSCRIPT

0
Eorluation
Acouti cItCs,
4 October 19.76
Prepared for the Deless. Advanced ResesichProjects Agencyunder Electronic Systems Division Contract F19628-76-C-0002 by
LinolnLaboratonyMASSAC ~ijSTSjNSTI1'Ut.OF TECHNOLOGY7,..
LIEXINOIMtE UAS5AciUMtT
Approved for ptahlc totem;e distribion nlimaited. C
U Lt.LýL UB

4.
noe wo&k reported is this document was petformod at Lincolp. L.aboatocy,
caeate for research operated: by Masachuseftt Institute of Teduaolop.Itis work was spcpored by the Deftnse, A~vsced 'Roeserc4iProjectsAgency under Air Force Contract F10928-76..C-OOO ARPA Order 27Z2)
This report may be reproduced to satisfy needs of U.S. Government agencies.
Ihe views and conclusions contained ia this document are those of thecouttactor end should not be interpreted as necessarily representing, theofficial policies, either expressed atr implied, of the Defense AdvancedResearch Projects Agency of the United States.Governamet
This technical report has been reviewed and Is approved for publication. '
FOR THE COMMANDER
Raymond L. Laluelle, 14.ACot., USAFChief, ESD Lincols Laboratory Project Office

r I ~____
IAS.SA .('III;ET'I' lNSTITITE(I. OF TECIINOLOGY
LINCOLN LABORATORY
EVALUATION OF A MORTAR SUBSTJTUTE
FOR FIRING WEAPON ACOUSTIC STUDIES
G. W. AHLGREN
Group 45
AGCW.MIOI for
NTIS White U9106ODC But, SeWtONUNA?!•UUiCE9
PROJECT REPORT TT-12 NiOEDEPROJE T R E O RT T-12. ......l¢Tlt.............. ........................
4 OCTOBER 1976 BY ...........................................0i1iRUIT1'9,.-MkAAI LITY CODES
Approved for public release; distribution unlimited.
LEXINGTON MASSACHUSETTS

ABSTRACT
This report discusses the investigation of a sound source for studies
of acoustic array techniques for the determination of firing weapons. A
device which simulates the muzzle blast signals from 4.2 inch mortars was
considered. In this device, a modified 4.2 inch mortar, the shell is
replaced by a cardboard tube containing a weight of water equivalent to the
round weight. Use of this device relaxes the normally stringent safety
requirements associated with mortar firings and reduces per round cost to
roughly one-tenth that associated with mortar firings.
Recordings were made of the water mortar and a standard 4.2 inch mortar
sited side-by-side with microphones at ranges of 1.1 and 1.7 km. TheI
spectral content of the two signals was determined using Fast Fourier
Transforms. The results indicate great similarities between the signalsI
from the two sources.
iiiW

TABLE OF CONTENTS
ABSTRACT L
I. INTRODUCTION1
II. MORTAR PHYSICAL CHARACTERISTICS 4
A. Live Mortar Characteristics 4
B. Water Mortar Configuration 6
III. EXPERIMENT DETAILS 9
A. Experiment Configuration 9
B. Instrumentation Details 11IC. Shot Record 12
D. D)ata Reduction Methods 12
IV. VALIDITY RESULTS 19
A. Typical Results 19
B. Average Spectra Results 27
V. OTHER RESULTS 38
A. Microphone Type 38
B. Amplitude Variability 41
VI. CONCLUSIONS 43
A. Water Mortar Validity 43
6~. Microphone Choice 43
C. Recording Dynamic Range 43
D. Sample Rate 44
APPENDIX 45
ACKNOWLEDGMENTS 48
v
p piSC3flOPAGS BLM1C4NOT ?flI42

1. INTRODUCTION
one segment of the Army/ARPA HOW4LS Program involves the consideration of
acoustic techniques for the location of hostile firing weapons. Primary
* emphasis is being placed on the development of short base length acoustic
arrays to be used for moderate range (5 kmn) sensing. Arrays with sensor
spacings from one to 100 meters are being evaluated. Signals from such arrays
would be processed to derive acoustic signal arrival angle and time information
using sophisticated signal processing techniques. Data from two or more such
arrays at di~fering locations could then be used to determine weapon locations
by triangulation. Alternately, data from one such array could provide area-
of-activity cueing for other sensor systems or adjunct information to enhance
other sensor system performance.
Measurements to obtain data for an evaluation of short base length arrays
are underway within the program. Two goals have been established for the
measurements. First, the data will be used to ascertain the measurement
uncertainties introduced by moderate range atmospheric propagation. The
travel time uncertainties will be obtained through a measure of shot time to
array reception time variability. In addition, the relative arrival time
variability for the various sensors in the array will be analyzed to determine
sensor spacing dependencies. Data from a non-uniform spacing linear array
providing a range of sensor to sensor distances from one to 100 meters will
be utilized for these analyses. Second, this data will form the basis of an
investigation into signal processing techniques to derive angle and time of
1A

arrival information. For reasons discussed below, it was deemed desirable to
utilize a sound source other than live weapons for these measurements. This
report discusses the search for such a source.
L The roughly 5 km mission range postulated for the short base array led
to the choice of a mortar as the most likely weapon as the acoustic source
for the measurements. It is expected that the Soviet 120 mmn and 240 mm
mortars will be prevelant artillery threats in this regioni. It was felt that
the U.S. 4.2 inch (107 mm) mortar would provide the most realistic source
function for these initial measurements. The primary interest in the initial
work involves a measure of atmosphere induced variabilities. Since such
variabilities are not expected to be very strongly dependent on the source
characteristics, the choice of a single representative weapon such as theI
4.2 inch mortar would cover the important body of cases. The use of standard
4.2 inch mortars has two major drawbacks and this memo deals with a technique
that effectively simulates the standard 4.2" mortar. The two major drawbacksI* are:
1. The use of mortars (even those firing inert rounds) se',erelylimits the experimental configuration. The designed physicallayout called for five firing sites at 1 km spacings on a lineperpendicular to the array axis. Three such sites would beoccupied at the same time with weaponF at these sites firingwithin a short time period. The mortar safety fan precludesorienting the weapons along the firing line (and thus over theheads of other crews). Shots p~erpendicular to the firing linewould be allowed; this however requires a large range. Such acapability did not exist at the sites considered for the experi-ment.
2
J4

2. Approximately 200 rounds total will be rEquired for an adequatestatistical measure. If dedicated firings were used to providethese, the experiment cost would be high. Target of opportunityoperation would reduce the costs but would likely preclude anorderly, controlled experiment. Conclusive data reduction willrequire a good knowledge of shot conditions as well as a carefulcoordination of shots. These would be nearly impossible outs.ýdeof a controlled experiment.
The Environmental Research Institute of Michigan (ERIM) has developed a
mortar modification which replaces the round with an equivalent weight of
water. Use of this device would eliminate the safety restrictions and
significantly reduce the firing costs. It was felt that the acoustic charac-
teristics of such a device should be nearly the same as for a standard mortar.
[ In order to confirm this assumption, a short experiment was undertaken to
compare the acoustic signal produced by a standard 4.2 inch mortar and the
ERIM water mortar. Side-by-side firings of the two weapons were recorded tor
later analysis. This report presents the result of that analysis. In addition,
the measurements were used to ascertain other relevant experimental parameters
in preparation for the main measurements as discussed in a later section.
Some pertinent characteristics of the two mortars are presented in theI
following section. This :Ls follow~ed by a description of the experimental, con-
figuration, equipment an'I technique. Results obtained in the equivalency
examination analysis and in the determination of other parameters are discussed
in succeeding sections. Conclusions based on this effort are then presented.
Following the measurements reported in the body of this report, measure-
ments were made comparing the signals produced by the three water mortars used
in later work. The results of this comparison are reported in the Appendix.
3

II. MORTAR PHYSICAL Ct1ARACTERISTICS
The water mortar used in the experiment is shown on Figure 1. Except
for some minor external modifications which aid transportation of the tube,
the outward appearance is very similar to that of a standard 4.2 inch mortar.
Before describing the internal modifications and the operation of the water
mortar, some relevant data on the standard 4.2 inch mortar will be discussed.
A. Live Mortar Configuration
The 4.2 inch (107 mm) mortar round is approximately 26 inches long and
weighs 27 pounds. Propelling charge increments are placed on the tail section
of the round. The increments are in sheets; the total number may be varied
to adjust the shot range up to a maximum of 36 increments. In adaotion a
propellant bag containing flake propellant equal to 5 increments is also used.
A primer anu ignition cartridge similar in external appearance to a 12-gage
jhotgun cartridge is located in the tail section.
For firing, the round is released tail first into the mortar tube. It
slides down ,he tube until the percussion primer strikes the firing pin in the
base of the tube. The flash from the primer ignites the ignition cartridge
which, in turn, ignites the propelling charge. The gases produced exert
pressure on the pressure plate at the base of the round and expand the
rotating disc thus engaging it in the tube rifling. Thus the projectile is
spun up as it travels up the tube providing spin stabilization.
........

414.
-7o.
44

For the maximum charge available (41 increments) the maximum chamber
pressure of approximately 14,000 psi is achieved approximately 3 ms after
projectile motion begins. The projectile exists approximately 6 ms later
with a nominal 293 rn/sec velocity; the chamber pressure at exit is roughly
3600 psi. From the point of ignition to exit, the rotating disk travels
1.37 meters (54 inches) whereas the total bore length is approximately
1.5 meters (60 inches).
B. Water Mortar Configuration
Standard issue 4.2" mortars were modified by ERIM to accept a water
round. Modifications include boring to remove the tube rifling and removal
of the firing pin at the tube base. The round is then replaced by a cardboard
tube arrangement consisting of a large tube which fits tightly into the mortar
with a smaller tube at the bottom end for the placemuent of the propelling
rounds.
Standard issue propellant and black powder initiator charges are used for
the water mortar. These are placed on the small tube at the base end of the
larger tube and secured with masking tape. An electrical blasting cap is
imbedded next to the black powder bag. The leads from the cap are placed
through a small hole drilled in a cardboard eud cap and exit through the large
tube at the muzzle end of the weapon. The blasting cap leads are attached to
a firing box for weapon firing.
After the cardboard tube with propellant and blasting cap attached is
placed into the mortar tube, a long plastic bag is inserted into the cardboard
6

tube. This bag is then f i llud with water up to the neck of the tube. The
volume of water (roughly 3 gallons-) provides a weight equivalent to that of
the standard mortar round.
Since the propellant and black powder c'harges are very stable, the round
can be configured and fired without restrictive safety measures. During firing
the cardboard parts are essentially completely destroyed; small pieces of less
than 10 cm2 are usually found within 20 m of the weapon site. Occasional
misfires have been encountered where a slow burning of the propellant has
resulted in ejection of the cardboard tube from the mortar tube intact. These
have travelled distances of 30-50 meters. During normal operations the water
is observed to be ejected in a tube shape initially, spreading rapidly to a
mist cloud. The blasting cap leads permit the firing crew to be roughly 30
meters behind the weapon. The safety fan in front of the weapon is considered
to extend or.!-v approximately 100 m.
For this reason the water mortar presented an attractive alternate source
for the measurements of interest. In addition, the major round cost is
involved in the propelling and init.ating chaiges; the weapon can be fired
for roughly 1/10 the cost of a standard 4.2 round. The water device has been
used extensively as a source for seismic investigations in the past. These
efforts have observed that the device is a good analog for standard mortars
with regard to the seismic signature. In addition, it has been observed that
the seismic signature is highly repeatable (except for easily noted occasional
misfires) indicatiug another desirable experimental feature. The efforts
7-i '

reported herein were structured to deterinine the applicability of the water
- device as an aco,.istic analog for the standard~. 4.2 mortar.
* I
* I
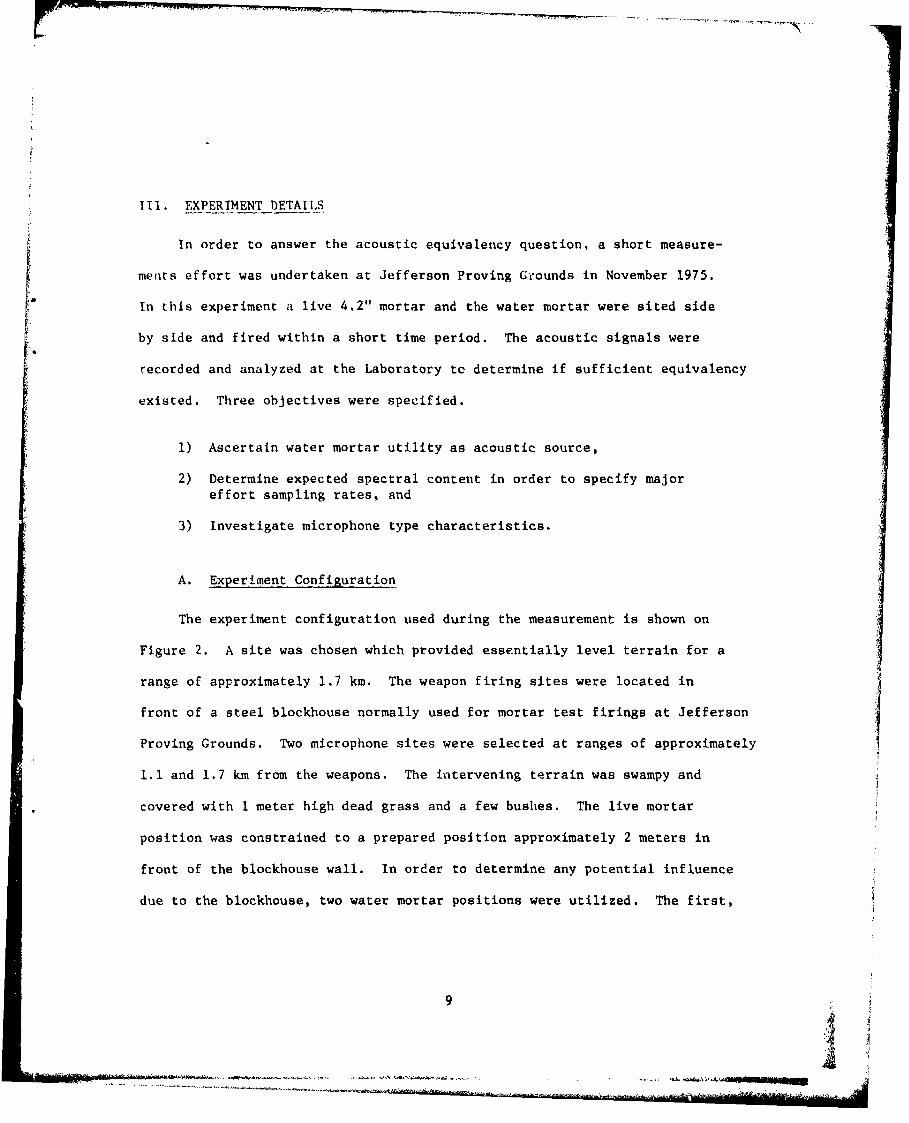
111. EXPERIMENT DETAILS
In order to answer the acoustic equivalency question, a short measure-
menits effort was undertaken at Jefferson Proving Grounds in November 1975.
in this experiment a live 4.2" mortar and the water mortar were sited side
by side and fired within a short time period. The acoustic signals were
recorded and analyzed at the Laboratory tc determine if sufficient equivalency
existed. Three objectives were specified.
1) Ascertain water mortar utility as acoustic source,
2) Determine expected spectral content in order to specify majoreffort sampling rates, and
3) Investigate microphone type characteristics.
A. Experiment Configuration
The experiment configuration used during the measurement is shown on
Figure 2. A site was chosen which provided essentially level terrain for a
range of approximately 1.7 km. The weapon firing sites were located in
front of a steel blockhouse normally used for mortar test firings at Jefferson
Proving Grounds. Two microphone sites were selected at ranges of approximately
1.1 and 1.7 km from the weapons. The intervening terrain was swampy and
covered with 1 meter high dead grass and a few bushes. The live mortar
position was constrained to a prepared position approximately 2 meters in
front of the blockhouse wall. In order to determine any potential influence
due to the blockhouse, two water mortar positions were utilized. The first,
9

I~::~.FIRING POINT GRAVEL AND TARSSTEEL BLOCKHOUSE ROAD
L W
DIRTROAD
LOW-MARSHY TERRAINFL AT
COVER WITH DEAD GRASSFEW BUSHES
NEARMICROPHONES
R 1.1 km
FAR RECORDINGFMICROPHONES 17mtLAVAN
FIG. 2. Experimental configuration, Jefferson Proving Grounds, 3-5 Nov. '75
10

indicated by W' on Figure 2, was approximately 30 meters ir~ front of the
bluckhouse; the second was located alongside the live mortar. Shots recordedF at the two water mortar positions were compared; no significant differences
could be detected.[B. Instrumentation DetailsTwo microphones were located at each recording site; they were sited
side-by-side separated by approximately one meter. They were placed approxi-
mately one meter off the ground. Output signals were transmitted via twisted
pair field wire to the recording van. A battery powered preampli ier was
utilized for each microphone to provide signkal and impedance levels sufficient
to drive the lines. The lines from the near microphones ran underneath a
power transmission line. Although some 60 Hz pickup was observed, the level
was well below the microphone signal levels.
Signals received at the recording van were then gain adjusted to provide
the required recording levels. The conditioned signals were then recorded
on a 7 track FM tape drive. During the experiment the record levels wereI
adjusted in an attempt to provide near peak levels in order to maximize
signal to tape noise conditions. Some data was over recorded (saturated on
recording) due to the variability in the atmospheric transmission. These
signals were not used in the analysis. A tape voice track was used for
commnentary information.
Two microphone types were utilized. A Bruel & Kjaer Model 4134 capacitor
microphone provided a frequency response essentially flat from 50 to 5000 Hz.
-- ---- 11

This microphone's low freq-Aency response (whi-2h is of priuary interest here)
is quite good; typically it is down 3.5 dl. at 20 Hz. An Electrovoice Model
RE-55 dynamic microphone was also utilized. This micro, hone is also 'airly
flat from 50 to 5000 Hz. However, the low frequency tail-off is sharper;
typically tLa response is down 15 dB at 20 Hz.
C. Shot Record
A total of 22 shots were fired on two days, 12 were water mortar shots
and 10 were live shots. On the first day of firing, 4 November, nine
water mortar shots and seven live mortar shots were recorded. The sequenne
for these shots is shown on Table 1. A- mentioned earlier, two positions were
used for the water murtar on this day. The first position, indicated as WI
on Table 1 and Figure 2, was located approximately 100 feet in front of the
firing bunker position used for the live shots. Three water shots were taken
from this position. The remaining wat-r shots and all live shots were taken
Erom positions (W and L) near the bunker.
As noted on the table, several shots were not available for analysis due
of shots were recorded on a second day (5 November). Three volleys of live
and water mortar shots within a short time span were successfully recorded.
D. Data Reduction Methods
The analog tape records were digitived post measurement for analysis on
the Laboratory's computing system. The signals were filtered through a low
12
4

- r. 0
0 U 4- 4000 " 0 00 0 U
*04 4)~U m~~p m4U( m :9 cO Cl) a; 4) 0)
*-.f-4 *4 *.
t 0 0 0 0
H
0 0 00
w000 4 000 000 0 0 W w
co Cd to
o0 to)U toC
'-4
m LMC %Q Y4 N C 1=:r LM4 00 '.D ON.
13

pass anti-aliasing filter with a 3 dB point of 1000 Hz and digitized at a
5000 Hz rate. The A-D converter provided an eight bit resolution. The A-D
gaini was adjusted to maximize signal to digitizing noise thus providing as
nearly as possible the 48 dB dynamic range available. An examination of the
signals recorded using a microphone calibrator (pistonphone) indicates that
the overall dynamic range was available for most of the recorded data. The
only exceptions were those early records from the near microphones which were
corrupted slightly by the presence of 60 Hz pickup.
The digitized records were analyzed using spectral analysis programs
generated for the task. These programs allowed plots of specified portions
of the time records as well as software data filtering. The time re,!ords
were then appropriately windowed and spectrally analyzed using Fast Fourier
Transforms (FFT). The spectral plots so obtained were compared to deduce
the similarity of the two mortars' signatures as discussed below.
Typical results obtained from the analysis are shown on Figures 3-5.
Figure 3 shows the digitized calibrator signal as plotted by the computer.
The vertical scale is in A-D counts; the average value has been removed in
order to eliminate a potentially large d.c. component on the spectral plots.
This d.c. is due to an offset setting on the A-D converter and is not present
on the original data. The total spectrum as derived from the FFT is shown on
Figure 4. The data has been weighted to maintain 40 dB frequency sidelobes.
The vertical scale is the power relative to the maximum power over the frequency
range. The horizontal scale encompasses the entire frequency range available
of 0-2500 Hz (the Nyquist frequency). The frequency resolution is 4.88 Hz.
14

...... •, .• • ....... ...... : • : • : . • . , , ,• . . . . . . ..
L-4--- 8 0 85I | I I I • I I | I I "'
400
200
- 0
0
u
-200 1
-400I I I I ,, I , I I ,
80 12U 160 200 240
TIME (msec)
FIG. 3. Pistonphone microphone calibrator signal
15

0 - " . . .'p ' I' ' .. . '4-18086]
-20
S-40
1/
JJw
-8 -6
1 1l 1' A I I I I I
0 500 1000 1500 2000 2500PREQUENCY (Hz)
FIG. 4. Calibrator spectral analysis from FFT
16
L.~~- ---. --I- -...

---20-20 60-Hz
t" M PiZ•KUP
HARMONICUw DISTORTION
0
M w -40
>
-J/..J= r
-60
"',/ l 1 |1I I I iI • I . , I I. i L
0 250 500 750 1000 1250
FREQUENCY (Hz)
FIG. 5. Expanded view of calibrator spectrum
1
• 17
~ .S~,L. SIS?

This figure is expinded to show the region of interest or Figure 5. The
microphone calibrator produces a 250 Hz sine wave at a Sound Pressure Level
(SPL) of 114 dB relative to .0002 microbar (2 x 10⁻⁵ newtons/r 2 ). This level
is within ±10 dB of the expected weapon SPL at the ranges used in the present
measurements and as such provides a good indication of the recording system -
digitizing system capabilities. The resultant spectrum from the FFT shows a
peak at 250 Hz (within the 4.88 Hz resolution cell). AlL shown are the first
two harmonics of the calibrator. These are greater than 40 dB below the main
signal. As mentioned earlier, the near microphone (as shown here) signal
suffered from a 60 Hz pickup problem due to power line induction into the
signal lines. This pickup signal is also indicated; for the gains used, this
signal is greater than 30 dB below the main signal peak and is therefore of
little consequence. For the early shots, the gains were not as optimum as
used here and the 60 Hz pickup is only 12-18 dB below the main signal.
I
18
._ ... • .......... . ..... .. -... .......... .• i•. :•,;: ....... •, •, • •,..;|•.,. ,o ..

IV. VALIDITY RESULTS
All the shots previously identified as providing good recordings were
analyzed. Each shot's time waveform was plotted and then appropriately
win~dowed in order to perform the FFT. The FFT plots were Lhen compared to
determine differences between shots and weapons. It is felt that such a
spect-'al comparison provides the most sensitive indication of any significant
differences.
A. Typical Results
A typical time waveform is shown on Figure 6 for live mortar shot #6 at
the far microphone. The plot format is the same as that for Figure 3. For
this shot (and most shots) the signal to background noise level is quite
high (>' 30 dB). The background noise which is seen before the arrival of the
signal is due in this case to wind noise at the microphone. Following the
large main signal can be seen a rather long train of signals arriving from
different paths. These multipath signals are quite typical; the signals may
continue for 200-300 milliseconds after the main signal.
The windowed waveform. tied in the FFT is shown on Figure 7. The first
250 Hz of the resultant spectrum i:r shown on Figure B. The major peak in the
frequency domain lies at 25 Hz; above 50-75 Hz there are few frequency
components within 30 dB of this peak. There is what appears to be a secondary
peak approximately 20 dB below the main peak at roughly 110 Hz.A
19 I

I.,
I 200 A-4-18088
20' 0
0
•v 0
z
-200
-400I I I I I I I _I J , i • I • i I i,
0 50 100 150 200 250 300 350 400
TIME (msec)
FIG. 6. Typical mortar time waveform (L-6, far microphone)
20
iI
1.,!

4')
i--
0
-200
-400
60 100 140 180 220 260
TIME (mseC)
FIG. 7. Typical mortar time waveform - windowed for FFT (L-6, far microphone)
21.

-20
0
-J
W -40
-600 50 100 150 200
FREQUENCY (Hz)
FIG. 8. Typical mortar spectrum (L-6, far microphone)
22

Figures 9-11 show the same analyses for this shot as recorded by the
near microphone. In this case the ,aoise is dominated by the 60 Hz pickup.
This level, however, is gre±ater than 20 dB below the signal level. For the
near microphone, the large multipath evident on the far microphone is not
present. Thus as one expects, the multipath is more severe at longer ranges.
J Also as expected, the spectrum shown on Figure 11 has higher frequency content
than that on Figure 8 at the longer range. The spectral peak is near 30 Hz
and shows a lower slope at the higher frequencies. The secondary peak has
moved to roughly 120 Hz and is roughly 12 dB below the main peak.
It has been conjectured that these secondary peaks are due to mortar tube
resonance phenomena. For a 1.5 meter tube one would expect that the fundamental
resonance frequency would be roughly 60 Hz (f - C/4L) for a nominal 348.6 m/sec
velocity of sound. Since the tube gasses are potentially hotter than 300*K,
this number may be low. To achieve the observed 110-120 Hz signal would
require a sonic velocity of roughly 700 m/sec. This would require a 1200*K
[ gas temperature. MacMillan* has estimated that the relative magnitude of
the tube resonance signal would be given by:
Relative Acoustic power (dB) - -20 loglO P(bars)
where P is the barrel gas pressure at the exit of the projectile. The 3600
psi exit pressure of the 4.2 inch mortar would, therefore, yield a -48 dB
signal relative to the main signal produced by the gasses exiting the tube.
Under these assumptions it seems unlikely that the observed secondary
spectral peak is caused by a tube resonance phenomenon.
*"Acoustic Weapons Location" (U), Final Technical Report, McMillan ScienceAssociates (31 March), SECRET.
23

[-4-180911300
200
100
200
L),
-200
-300i
L I I I I I I I I I I - I I -I -S I I I I
0 50 100 150 200 250 300 350 400
TIME (msec)
FIG. 9. Typical mortar time waveform (L-6, near microphone)
24

30 r-'-1 I ' I• I I Lz41892S~300
.5 I--
200
-100
0'0
S-20
-30
60 100 140 180 220 260
TIME (msec)
FIG. 10. Typical mortar time waveform- windowed for FFT (L-6, nearmicrophone)
1$
25
~~~~~~~~~~~~. -- .. .. .... ..... -.. '. . '..• , ,i" ,• ,.• ',- • .' .I • .w .r ..........

-s0
Q -153
0
w 2LU -20
I-0
-J
I 1 I I !_ I I 1 I tI I i I I ,• l 1 q I |,
0 25 50 75 too 125 15o 175 200 225FREQUENCY (Hz)
FIG. 11. Typical mortar spectrum (L-6, near microphone)
26
26 :

It should be pointed out that it is difficult to associate a "typ'cal"
label to any of the recorded waveforms. Shot to shot variabilities can be
noted on the signal structure. For example. the live shot following that
shown on Figure 6 is shown on Figure 12. Both records were made from signals
at the far microphone from live mortar shots within 20 minutes. The major
A spectral content is the same (the main signal periods are very similar).
However, the structure of what appears to be propagation induced effects
differs markedly. (Note that the vertical scales differ.) The relative
amplitudes of the positive and negative peaks are changed for example. The
latter shot also shows evidence of larger and longer multipath signals.
The consequences of these differences can be seen by comparing the
spectrum of this shot as shown on Figure 13 to that of the earlier shot on
Figure 8. Although the major peak at 25 Hz remains consistent, the higher
frequency character has changed. The main peak width is lower and the
spectrum is less smooth. As expected these shot-to-shot variations are moreI
evident on the far microphones and seem to give some indication of the
atmosphere dynamics. Accordingly, the comparison of spectra for an evaluation
of similarity will not be made on a shot-to-shot basis but rather will be
made by averaging a number os shots as described below.
B. Average Spectra Results
in order to compare spectra in a meaningful way, a number of individual
spectrum plots were averaged to provide an average response figure. These
27

SII I T I
300
200 1100
S0 P/
0
I- -100
z
-200
-300
-400
•I I I I I i I I I I I _ i I t t i I i I j , * , I • i '
0 50 100 150 200 250 300 350 400T TIME ( mec
FIG. 12. Typical mortar time waveform (L-7, far microphone)
28
28
-- .........-..... .... • ... .. .... . ., "•: .. . .- . .• ;i••,: • . . . .' ' -

-10
a -20
w
R-3uU
-40
0 25 50 75 100 125 150 175 200 225FREQUENCY (Hz)
FIG. 13. Typical mortar spectrum (L-7, far microphone)
22
I
29

are shown on succeeding figures under a variety of circumstances. In each
the shot numbers used in the averages are noted.
Water Mortar Position - As discussed earlier, the live mortar position
was constrained to be immediately in front of a steel blockhouse wall. in
order to encounter the same conditions, the water mortar was sited adjacent
to the live mortar and likewise in front of the wall for most of the shots.
However, three shots were recorded with the water mortar sited in the field
100 feet in front of the blockhouse (position W' on Fig. 2) to ascertain
whether the wall introduced any effects. A comparison of the average spectra
for the two water mortar positions as measured at the near and far microphones
is shown on Figures 14 and 15, respectively. No significant differences are
evident. The major differences are seen at the higher frequencies at the far
microphone and are most likely attributable to atmospheric propagation
variations.
Live vs. Water Comparison -Figures 16 and 17 illustrate the average
spectra results for the live and water mortars at the near and far microphones,
respectively. As before, the spectra are most similar at the near microphone.
The water mortar appears to have a somewhat higher peak frequency. In addition,
the secondary peak near 120 Hz is less distinct. However, the two spectra are
quite similar and deviate by less than 3 dB over most of the frequency range.
The frequency peak differences are somewhat more pronounced at the fai.
microphone. Again the farther range data show more variability than those
at the closer range. It is difficult to deduce a physical mechanism at the
30
Si4

0
//
WATER MORTAR IN FIELD (W')W -1,2,3,
-10 \\-/"WATER MORTAR NEAR BLOCKHOUSE (W)V 1 W -4,7,8,9
-20-
0
- -20•:
o ILL
WIS-30 V
-40
-501 I I 1 1 L0 50 100 15O 200
FREQUENCY (Hz)
FIG. 14. Average spectra comparison, water mortar position - 4 Nov. data(near microphone)
31
SA,

-~~ Er- 4.rw 0 9 -
/ WATER MORTAR IN FIELD,/W -1, 2,3
-10- WATER MORTAR NEAR BLOCKHOUSE
-20 / K•-.• 0
>. /
S-30
-401
-50 I I I 10 50 100 150 200
FREQUENCY (Hz)
FIG. 15. Average spectra comparison, water mortar position - 4 Nov. data(far microphone)
32.
32

- ,WATER MORTARW - 1,2,3,4,7,8,9
"-10 - . LIVE MORTAR-10 • • L-3, 4, 5, 6,7 t-
-0- -20
w
-30
-40
-50 I I I 1 t I0 so 100 10 200
FREQUENCY (Hz)
FIG. 16. Average spectra comparison, live Vs. water - 4 Nov. data (nearmicrophone)
33
S..... ...... .. .. . . . . . .. . ... . ... . .. ..* - ' • I I I I I I i'

/ - WATER MORTARW-1,2,3,7,8,9
LIVE MORTARN. L- 2,3.,4,5,6,7
-20
w;-\S-30
4 C.-40
0 100 150 200FREOUCNCY (Hz)
FIG. 17. Average spectra comparison, live vs. water - 4 Nov. data (farmicrophone)
34:.
34

source which would create similar signals at 1.1 km and different characteristics
at 1.7 km. Thus it is felt that any differences at the longer ranges are due
mainly to atmospheric effects which the averaging still fails tu remove.
Similar results are obtained from the data recorded on the second day of
shooting (5 Nov.). These are shown on Figures 18 and 19. The propagation
conditions were more favorable and tended to produce less high frequency
attenuation on this day. The near microphone used on this day was a dynamic
microphone with a higher low frequency cutoff. Thus, the data shown on
Figure 18 has a steeper roll off below 25 Hz. This will be discussed in more
detail below. As before, the signals are inore nearly alike at the near
microphone. The far microphone data show more variability than before due
to the ensemble sample size (3 shots vs. 6 previously) used for the average.
As before, the water mortar has a slightly higher frequency peak in both the
near and far signals.
35

WATER MORTARW-1, 2,3
-10 LIVE MORTARL L-1, 2, 3
l 0-20
-30
-40
50.0 50 100 150 200
FREQUENCY (Hz)
FIG. 18. Average spectra, comparison, live vs. water - 5 Nov. data (near"microphone)
I
36 ii3

I18-D1-18101W1 "
/_____-__\WATER MORTARW- 1, 2,3
-,0 /LIVE MORTAR
L - 1, 2,3
- "20
.~-30
"-40
0 50 100 150 200FREQUENCY (Hz )
FIG. 19. Average spectra comparison, live vs. water - 5 Nov. data (farmicrophone)
I
A
37 :•

V. OTHER RESULTS
Several experimental variants were analyzed in order to lay some ground-
work for the main measurements exercise. These are discussed below.
A. Microphone Type
Two microphone types were available for this experiment and for the main
exercise. The first was a dynamic microphone. This microphone is more
rugged and somewhat easier to use, but has a response curve which begins
rolling off at about 40 Hz. The second type avail.able was a laboratory grade
capacitor microphone with a flat response to roughly 20 Hz. The capacitor
microphone is more sensitive but is much less rugged and is sensitive to
moisture. In addition, the capacitor microphone requires a polarizing voltage
supply of 200 volts.
Both microphone types were fielded; during most of the measurements
signals from both were recorded at each position. Typical time waveformU
results are shown on Figure 20. The higher low frequency cutoff acting on
the signal whose major spectral component is near the cut-off produces an
approximate time differentiation of the signal. The FFT produced spectra for
these two microphones is shown on Figure 21. Above the roll off point (where
the responses are nearly identical) the results are very similar. The
differing low frequency response character is obvious. The corrections at
low frequency to the dynamic microphone results which are indicated were
derived from the manufacturer's nominal specification sheets for the two
microphones.
38

I I - CAPACITORI DYNAMIC
22
0/
TIMFIG 2. Mcrphoe ypecopaiso iewvfrm Lv ht6
I39

0I
- CAPACITOR
-I DYNAMIC
I WITH DYNAMIC CORRECTIONSI
CX -20 -
30 Vii Iw
ix,
'II
-40 -
-50 , J
0 50 100 150 200 250 300FREQUENCY (Hz)
FIG. 21. Microphone type comparison -spectral comparison (Live Shot 6)
40

B. Amplitude Variability
It was evident during the measurements that significant shot-to-shot
amplitude variations are observed during dynamic atmospheric conditions. On
the first day of firing it was necessary to change gains often in order to
obtain recordings with good dynamic range. At times signals were over recorded
in this process. In addition this process introduces uncertainties as to what
gain settings were used when many changes are made. The absolute SPL results
for the first day of shooting are unknown for some shots because of the
changes which were made.
During the second day the atmospheric conditions were more stable and
greater care was taken in recording gains. Thus the changes from shot-to-shot
can be determined. The SPL of the six shots on 5 Nov. are shown on Fig. 22.
It is interesting to note that over the roughly two hour period the intensity
as recorded at the near microphone increased while that at the far microphone
decreased. In addition, one would expect a roughly 5 dB difference due to
spherical spreading loss between the two ranges. While this is apnroximately
true at the outset of the day's shooting, the difference is more nearly 15 dB
at the end of the shots. The shots were all taken during late morning under a
warming trend. The conditions were favorable for the formation of a shadol,
zone and this may explain the intensity variations. A comparison of the live
and water mortar intensities shows little difference.
41

L1B-4-18 104
120
0 ~~ 0
0
0 . NEAR MICROPHONE0R R1.11km
-J 0
S110
z
"o - . -""
FAR MICROPHONER - 1.7km
100
w-1 L-1 w-2 L-2 W-3 L-3SHOT NUMBER
FIG. 22. Shot sound intensity - 5 Nov. data
42

VI. CONCLUSIONS
Several conclusions which have ramifications for the main measurements
program can be drawn from the analyses and experiences during this effort.
A. Water Mortar Validity
The water mortar produces a signal which is very similar to that of a
live 4.2 inch mortar. The observed acoustic power levels are nearly identical.
Although the water mortar spectra show a slightly greater high frequency
content this is not deemed a significant factor. The lower cost, greater
flexibility and ease of operation of the water mortar clearly indicate the
desirability of using the water mortar for the main measurements.
B. Microphone Choice
The spectral content observed during these measurements indicates that a
microphone response down to 20 Hz is needed in order to faithfully record theI
longer range data. The dynamic microphones are, therefore, not well matched
to the recording of this signal. Although the capacitor microphones are more
difficult to use, especially in a field operation, their good low frequency
response clearly dictates their use for the main exercise.
C. Recording Dynamic Range
The large variabilities encountered in atmospheric propagation and the
normal range induced variations in the signal levels require good dyanmic
range recording. It was found to be undesirable to change gains often since
43

this can cause questionable data. it would be good to use a wide dynamic
range (> 50 dB) digital technique to provide faithful recording and measure-
ment ease.
D. Sample Rate
A digital recording scheme with 4 kHz sampling was designed for the main
measurements effort. The spectral content of the signals recorded during this
work indicates that this rate provides a more than adequate representation of
the signals.
44

APPENDIX
Subsequent to the measurements described in the body of this report,I additional data was taken comparing the signatures of the three water mortarsto be used in the main measurements efforts. The three mortars were co-
located at a range of approximately 1 km from the recording iLte. The mortars
were fired in a volley mode using the digital recording system to be used in
the main recording effort. After firing and recording the first mortar, the
second was fired and recorded, etc. A total time span from first to third
mortar of approximately 2 minutes was achieved. Besides providing data for
a comparison of the three sources, the exercise allowed a validation of the
recording technique.
Five volleys of three shots each were fired during a two hour time span.
Two individual shots were not recorded due to recording system errors. The
remaining shots were analyzed as discussed earlier. Figure A-1 illustrates~
the resultant spectral averages for the five volleys. The spectral differences
are very slight. The sound pressure levels at 1 km from the sources are shown
on Figure A-2. For most of the shots, the levels from the three mortars arei
within 1-2 dB of each other.
Based on these results, it is evident that the three devices are very
similar and that no uncertainties will be encountered due to source differences.
in addition, the planned recording technique was found to function well and to
provide the requisite sampling rate and dynamic range. The two shots which
were not recorded were due to errors in setting up the recording parameters
and not due to recording system failures.
45

BLUE MORTAR (5shots)-10 YELLOW MORTAR (4shots)
GREEN MORTAR (4 shots)
41 w0.
-40
0 50 100 150 200 250 SooFREQUENCY (Hz)
FIG. A-i. Water mortar spectral comparison
I
46

I.I
B - BLUE MORTARY YELLOW MORTAR
G - - GREEN MORTAR
115y
MISSED Y 0- B
Y110 -
S105 MISSED G
z
0100 .
• I , . I I T1 2 4 5
VOLLEY NUMBER
FIG. A-2. Comparison of water mortar sound pressure levels
47
- U

ACKNOWLEDGMENTS
The measurements reported herein were performed by the Environmental
Research Institute of Michigan and the analysis of the data was done at
Lincoln Laboratory. The mortar substitute described in this report was
developed by ERIM for seismic work. Comments and suggestions on the use of
this device for acoustic studies by Dr. John Hemdal and Dr. Roger Turpenning
are appreciated. The assistance of Messrs. J. Adams, L. Leverault and F. Tanis
during these measurements is gratefully acknowledged.
48

UNCLASSIFIED
SECURITY CLASSIFICATION OF THIS PAGE (When I)Daa Enfeped/
R.EPERT . ...R. .. .O IZ O REND INSTRUCTAN DSA ARBEFORE COMPLETING FORM
TACCESSION NO, 3. rECIPIENT'S CATALOG NUMBER
4. TITL E and• ubs,,le) .. . . .. . _"S." yp C.OVEREi5
Le3ProjectNo 0
9I. CNERFOING OFFANICETION NAME AND ADDRESS .. .. R.R• 1 1't R
1400 Wihlso n 79ul evr d2
9. MPNITORMING AGEANCYAI NAME AN ADDRESS (i iJrn rmCnrilgOfclI.SCRT L
P.l0. oxi Sysem Prgivision N. 272
Lexington, MA 021731 Project No. (GI
11. CONTROLLING OFFICE NAME AND ADDRESS 12. RpPORT.oArt")-' "-Defense Advanced Research Projects Agency , 4 / ctabllm 176 r-
1400 Wilson Boulevard .. ... "-:....,-
Arlingvon, VA 22209 dr t uiNUMBERio.ibuioruni14 M• ONITORING'AGENCY NAME & ADDRESS (if different:. fr ;.om ,. Contrllin Ofl1. 'SECURITY CLAS%7M'f-- .R•-r•_
Electroni~c Systems Division UnclassifiedHanscom AFBB3edfor'd, MA 01731 IS& DECL ASSlI FCA TION DOWN'GRADING
rI SCEDUL E
16, DISTRIBUTION ,STATEMENT (of this Report) . . .
Approved for public release; distribution unlimited.
17, DISTRIBUTION STATEMENT (of the abstract entered in Block 20, if different from Report)
15. SUPPLEMENTARY NOTES
None
19. KEY WORDS (Continue on reverse side if necessary and identify by block number)
mortar substitute acoustic studiesSfiring weapon location HOWLS Program
70,', *STRACT (Continue on reverse side il necessary and iden~tif by block nu'mber),,, ,,
This report discusses the Investigation of a sound source for studies of acoustic array techniques for thedeterminamtion of firing weapons. A device which simulates the muzzle blast signals from 4.2 Inch mortars wasconsidered. In this device, a modified 4.2 inch mortar, the shell Is replaced by a cardboard tube containing
a weight of water equivalent to the round weight. Use of this device relaxes the normally stringent safety re-quirements associated with mortar firings and reduces per round cost to roughly one-tenth that associatedwith mortar firings.
Recordings were made of the water mortar and a standard 4.2 inch mortar sited side-by-side with micro-phones at ranges of 1.1 and 1.7 km. The spectral content of the two signals was determined using FastFourier Transforms. The results indicate great similarities between the signals from the two sourceas.
DD FORM 1473 EDITION OF I NOV 65 IS OBSOLETE UNCASSIFIEDI JAN73
SECURITY CLASSIFICA7•ION OF THIS PAGE (Whle Data E£ , d
/I62Ar